Embed Size (px)
Citation preview

The Trevira Turnaround Story
10th January 2014

Two German sites, two focused operations
Successful restructuring, ongoing performance enhancement
2
Bobingen 2013 Staple Fibres
Capacity 70,000 TPA
Typical lot sizes 20 to200 MT
RM Delta 81,833 $K
Guben 2013 Filament
Capacity 20,000 TPA
Spinning from 22 to 425 dtex, incl. spun-dyed;
Texturizing up to 4000 dtex
RM Delta 66,567 $K

Bottom-line growth powered by Specialtiesand sustainable productivity improvements
3
2010A 2013E
EBITDA in $ mn
12.5
PastUnprofitable product mixLow efficiencyInsolvency
PresentInnovationProductivity
4.0
TurnaroundTakeover by IVLSpecialty focusCost improvement
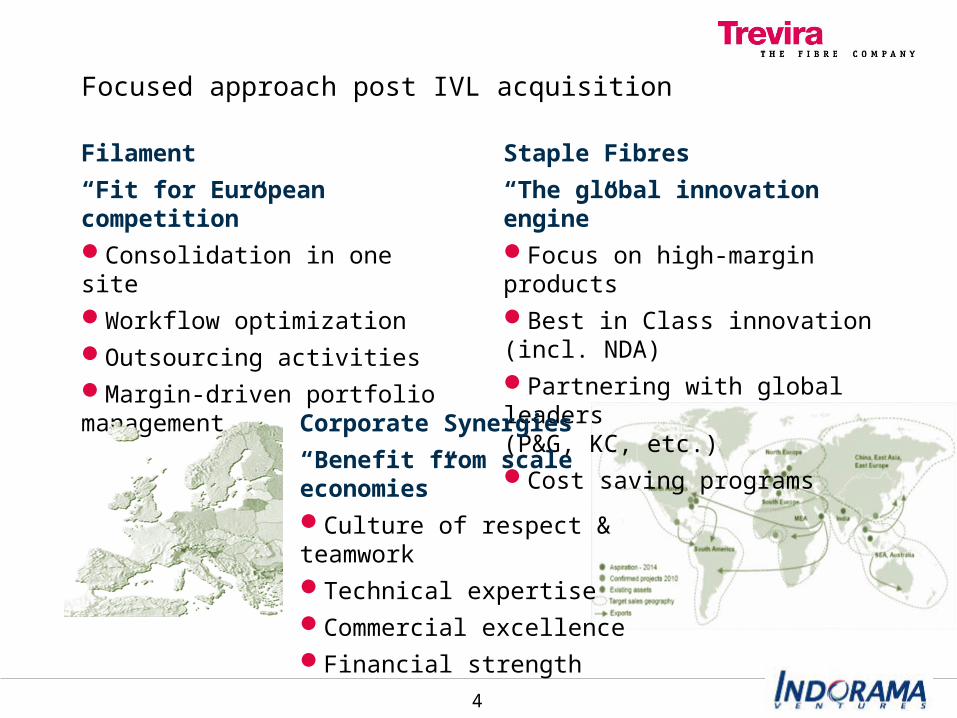
Focused approach post IVL acquisition
4
Staple Fibres
“The global innovation engine”Focus on high-margin productsBest in Class innovation (incl. NDA)Partnering with global leaders (P&G, KC, etc.)Cost saving programs
Filament
“Fit for European competition”Consolidation in one siteWorkflow optimizationOutsourcing activitiesMargin-driven portfolio management
Corporate Synergies
“Benefit from scale economies”Culture of respect & teamworkTechnical expertiseCommercial excellenceFinancial strength

Our position in strategic markets we serve
5
Automotive
“Tailored solutions”Predominantly in Europe,“Asian-proof” (grades, lot sizes)$ 13 mn identified projects (Asia, Latin America, European OEMs)
Hygiene
“Customized Bico Fibres”Specialist FemCare70% to global leaders$ 26 mn identified potential(East Europe, Latin America)
$ mn*
9898
*Net revenue 2013E
5353 4141
Industrial
“Unique customer solutions”Strong, global dynamics, customer projects, further growth in NA, Latin AmericaNew PLA segment app. $ 40 mn revenue
Trevira CS
“The leading FR brand”Specialized services,push and pull marketingNew markets in Asia, Mid-East, $ 20 mn with int’l key accountsInnovation (e.g UV stabilized)
6262

6
Raw Material Margin Delta($mn per year)
$/ton
VolumeKT per year
Growth mainly driven by innovation in Home and Industrial
2010A 2013E
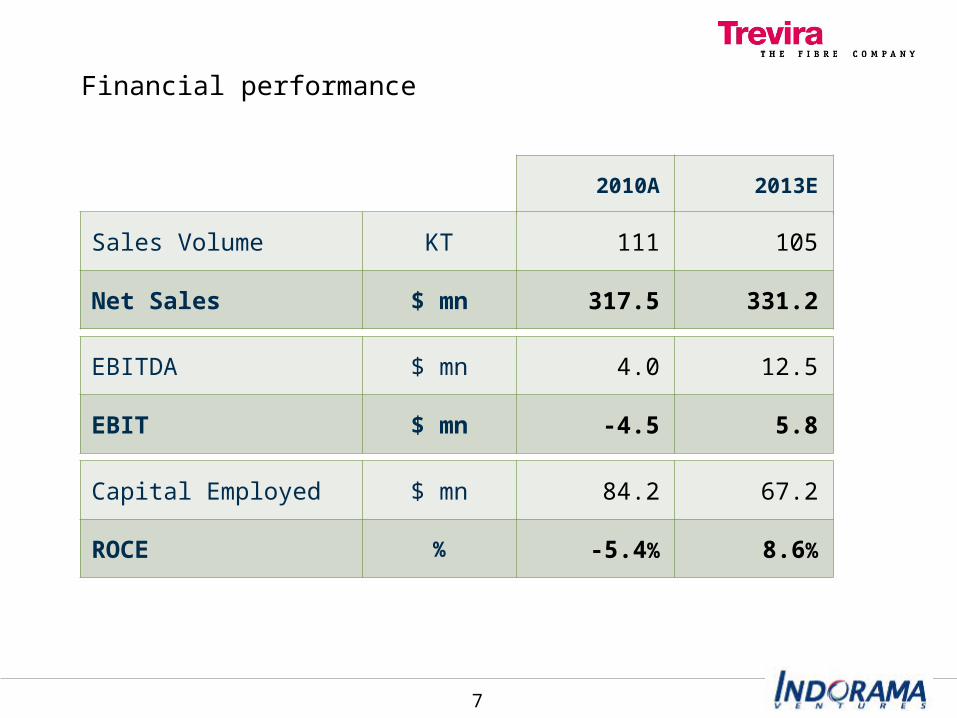
Financial performance
7
Sales Volume KT 111 105
Net Sales $ mn 317.5 331.2
EBITDA $ mn 4.0 12.5
EBIT $ mn -4.5 5.8
Capital Employed $ mn 84.2 67.2
ROCE % -5.4% 8.6%