Embed Size (px)
Citation preview
Travel & Tourism at a Tipping PointThe travel & tourism (T&T) industry plays a vital role in the global economy and community. In 2018, the industry helped generate 10.4% of world GDP and a similar share of employment, and has shown enormous resilience over the last decade. Fueling this expansion and relative resilience is the ongoing growth of the middle-class in Asia and other parts of the world. In the coming decade, industry contribution to GDP is expected to rise by nearly 50%.1 In light of this expansion, policy-makers, industry leaders and other stakeholders will have to pay closer attention to T&T competitiveness to capture this growing market. While government and business actors alike will need to consider what competitiveness levers they can activate to retain or gain market share, special consideration needs to be given to sustaining tourism infrastructure, services and assets. As numbers of business and leisure travelers increase the world over, improvements in competitiveness will need to be undertaken alongside careful planning for tourism management and carrying capacity of destinations. The results of the TTCI serve as a tool for policy-makers, T&T businesses and other stakeholders to understand and advance the necessary dialogues and actions that will ensure the longevity of this critical sector.
The 2019 Travel & Tourism Competitiveness Index (TTCI) assesses 140 economies for T&T competitiveness in four subindexes: Enabling Environment, T&T Policy and Enabling Conditions, Infrastructure, and Natural and Cultural Resources (see About the Travel & Tourism Competitiveness Index 2019 for more details). The economies covered by the index account for nearly 98% of global direct T&T GDP and a similar proportion of international tourist arrivals.2 In this section we discuss what it takes to be competitive in T&T and the implications for longer-term economic development and longevity of the industry. The second section, 2019 Results and Analysis, presents overall results for the 2019 TTCI, along with analysis of ranking quartile groups. While there is some country/economy and regional analysis in Part 1, more in-depth regional analyses, including data analysis and tables, are presented in Part 2. Further TTCI information can also be accessed by visiting the Travel & Tourism Competitiveness Report 2019 online (http://reports.weforum.org/ttcr).
The Travel & Tourism Competitiveness Index 2019
T&T competitiveness requires a holistic approachThe TTCI is deliberately designed to reflect and measure the diversity of factors that influence a country’s ability to compete globally in travel and tourism. Each of the 14 pillars that make up the index, if addressed with appropriate policy-making and sufficient investment, has the potential to drive competitiveness and returns in tourism arrivals and receipts.
What is explored to a lesser degree is the nuanced interdependence of the pillars and their combined impact on the longer-term sustainability of the industry. The results of this year’s report present an opportunity to explore this in more detail. At the outset, the data suggests that a holistic, systems-led approach to tourism strategy is required to truly perform successfully on the global rankings. In particular, economies need to achieve a strong performance on all of the pillars to rise to the top of the index. Typically, the highest-scoring economies tend to beat global averages on the majority of the pillars, while the opposite is true for the bottom-scoring economies. Only Mexico, Brazil and India have been able to rank among the top 25% of ranked economies on the TTCI by outperforming the global average in as little as seven of the 14 pillars. These economies have exceptional natural and cultural resources, which they combine effectively with relatively strong price competitiveness.
Yet even depending on a smaller number of pillars, such as Natural Resources, still requires a systems-led approach. The assets that this pillar measures cannot be bought or created, but if not managed well can be destroyed rapidly. The ability to generate demand and derive value from them relies heavily on the ability to set and enforce environmental policies (measured in the Environmental Sustainability pillar) , as well as the ability to effectively manage their “consumption”. If adequate focus is not given to preserving these assets, they will, as with any depleted resource, cease to contribute to the overall competitiveness performance of the country.
Other interdependencies are equally clear. Developed infrastructure and international openness are required to boost connectivity of destinations, which allows for a greater number of travellers to visit. A favourable business environment makes it easier for T&T businesses to operate in a country, while a skilled workforce leads to better customer service, productivity and capability to leverage increasingly vital communication and technology tools. Concerns over
Explore additional features of the report at http://reports.weforum.org/ttcr 3
Box 1: Global Health Security and T&T: A Case for Cross-Industry CollaborationThe number and kind of infectious disease outbreaks (e.g. influenza, Ebola, Zika, SARS, MERS-CoV, antibiotic resistant bacteria, etc.) have increased significantly over the past 30 years and, as global trade and travel increase, the international spread of disease is expected to grow. In today’s globalized world, a pathogen can travel from a remote village to major cities on all continents in under 36 hours, but unjustified or ineffective restrictions on travel or trade during outbreaks can have a massive economic impact on affected countries.
For example, efforts by countries to ban flights from nations with H1N1 outbreaks in 2009 were ultimately revealed to be ineffective in containing the virus; and the estimated loss associated with the H1N1 outbreak for the Mexican tourism industry was $5 billion. Similarly, between 2002 and 2004, as a result of Severe Acute Respiratory Syndrome (SARS), Hong Kong saw a 41% reduction in tourism GDP, Singapore 43% and China a 25% reduction as well as a loss of 2.8 million jobs.
The World Economic Forum convenes experts from international health organizations and travel and tourism business leaders to mitigate the impact of outbreaks on the industry and subsequently on national GDPs through its Epidemics Readiness Accelerator (ERA). Together, efforts are underway to improve decision-making, coordination and communications within and between both the public and private sectors, relating to risk, travel advisories and border measures.
Box 2: Protecting the Ocean Ecosystem: A Case for Public-Private CollaborationOnly 7% of the ocean is protected through Marine Protected Areas (MPAs). However, this figure varies based on the criteria used. Further, many MPAs are either only legally designated, poorly managed and enforced, or represent standalone efforts with little integration between them. Yet these ‘national parks in the sea’ should be seen as part of an economy’s infrastructure, helping to ensure a sustainable tourism industry and a supply of food from the sea. Addressing this, and increasing levels of protection, is key to restoring ocean ecosystems while generating and safeguarding the businesses, communities, jobs and livelihoods that rely on healthy seas.
The Friends of Ocean Action brings together leaders from government, business, civil society, international organizations, science and technology to fast-track solutions to the most pressing challenges facing the ocean. One way to advance the health of ocean ecosystems is to promote the achievement of ambitious marine protection targets by driving concerted, public-private cooperation across geographies and sectors on the establishment of MPAs. The Friends of Ocean Action’s efforts include: engaging in key relevant policy fora to support the international community in increasing global MPA coverage; partnering with key stakeholders to set-up and champion a game-changing new MPA platform and building a business case for MPAs that will mobilize a strong coalition of world business champions ready to contribute to reaching a new 30% MPA target by 2030.
healthcare, hygiene, safety and security conditions can also prove detrimental to generating T&T demand and investment, especially from abroad. Given the complexity and interconnectedness of these factors, it is impossible for industry corporations or tourism agencies to tackle these issues in isolation. They require cross-industry collaboration, public-private engagement and a better understanding of the global context beyond T&T. See Boxes 1 and 2 for real-world examples of such collaborations.
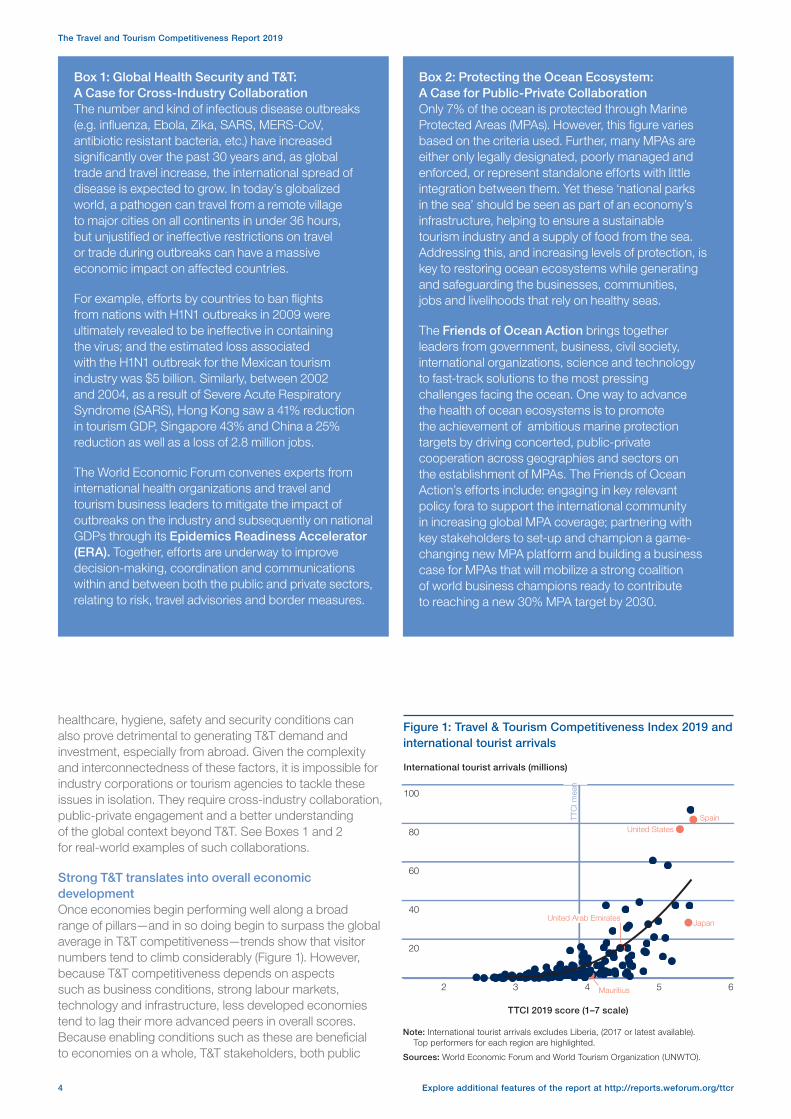
Strong T&T translates into overall economic developmentOnce economies begin performing well along a broad range of pillars—and in so doing begin to surpass the global average in T&T competitiveness—trends show that visitor numbers tend to climb considerably (Figure 1). However, because T&T competitiveness depends on aspects such as business conditions, strong labour markets, technology and infrastructure, less developed economies tend to lag their more advanced peers in overall scores. Because enabling conditions such as these are beneficial to economies on a whole, T&T stakeholders, both public
Note: International tourist arrivals excludes Liberia, (2017 or latest available). Top performers for each region are highlighted.
Sources: World Economic Forum and World Tourism Organization (UNWTO).
Figure 1: Travel & Tourism Competitiveness Index 2019 and international tourist arrivals
2 3 4 5 6
20
40
60
80
100
International tourist arrivals (millions)
TTCI 2019 score (1–7 scale)
Spain
Japan
Mauritius
United Arab Emirates
United States
TTC
I mea
n
Explore additional features of the report at http://reports.weforum.org/ttcr4
The Travel and Tourism Competitiveness Report 2019
and private, can use this to justify investment in the sector as it has reinforcing effects on the economy overall.
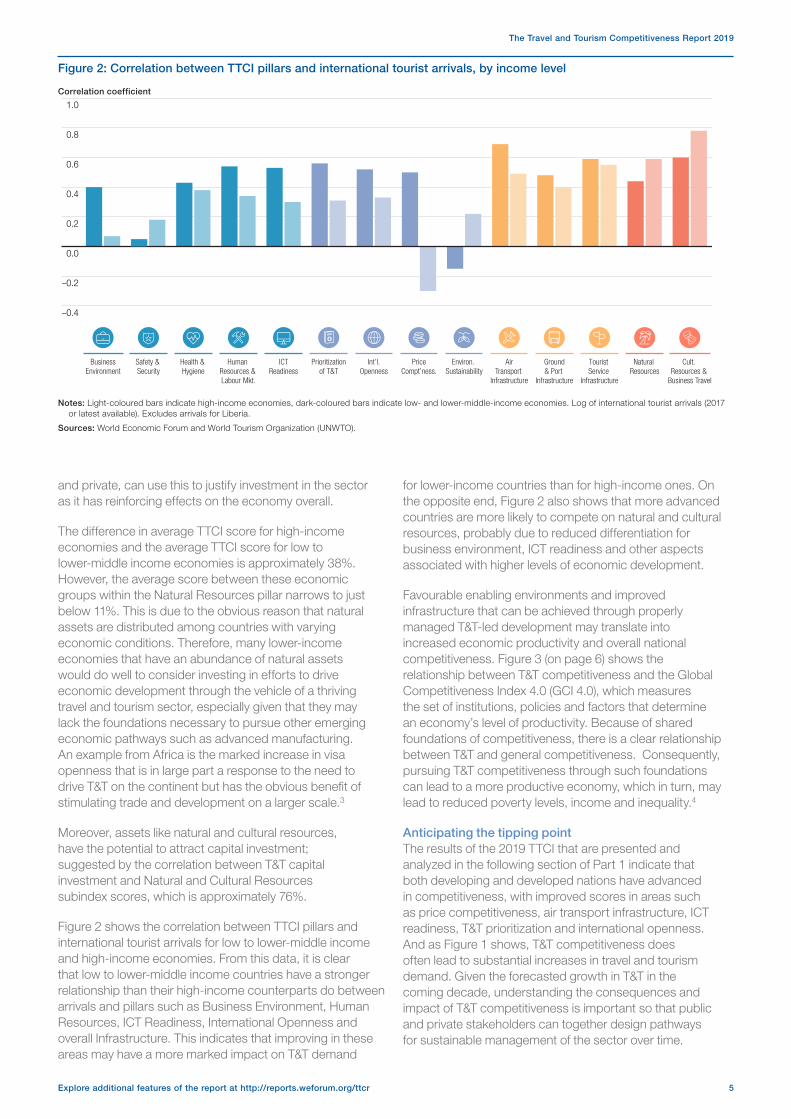
The difference in average TTCI score for high-income economies and the average TTCI score for low to lower-middle income economies is approximately 38%. However, the average score between these economic groups within the Natural Resources pillar narrows to just below 11%. This is due to the obvious reason that natural assets are distributed among countries with varying economic conditions. Therefore, many lower-income economies that have an abundance of natural assets would do well to consider investing in efforts to drive economic development through the vehicle of a thriving travel and tourism sector, especially given that they may lack the foundations necessary to pursue other emerging economic pathways such as advanced manufacturing. An example from Africa is the marked increase in visa openness that is in large part a response to the need to drive T&T on the continent but has the obvious benefit of stimulating trade and development on a larger scale.3
Moreover, assets like natural and cultural resources, have the potential to attract capital investment; suggested by the correlation between T&T capital investment and Natural and Cultural Resources subindex scores, which is approximately 76%.
Figure 2 shows the correlation between TTCI pillars and international tourist arrivals for low to lower-middle income and high-income economies. From this data, it is clear that low to lower-middle income countries have a stronger relationship than their high-income counterparts do between arrivals and pillars such as Business Environment, Human Resources, ICT Readiness, International Openness and overall Infrastructure. This indicates that improving in these areas may have a more marked impact on T&T demand
for lower-income countries than for high-income ones. On the opposite end, Figure 2 also shows that more advanced countries are more likely to compete on natural and cultural resources, probably due to reduced differentiation for business environment, ICT readiness and other aspects associated with higher levels of economic development.
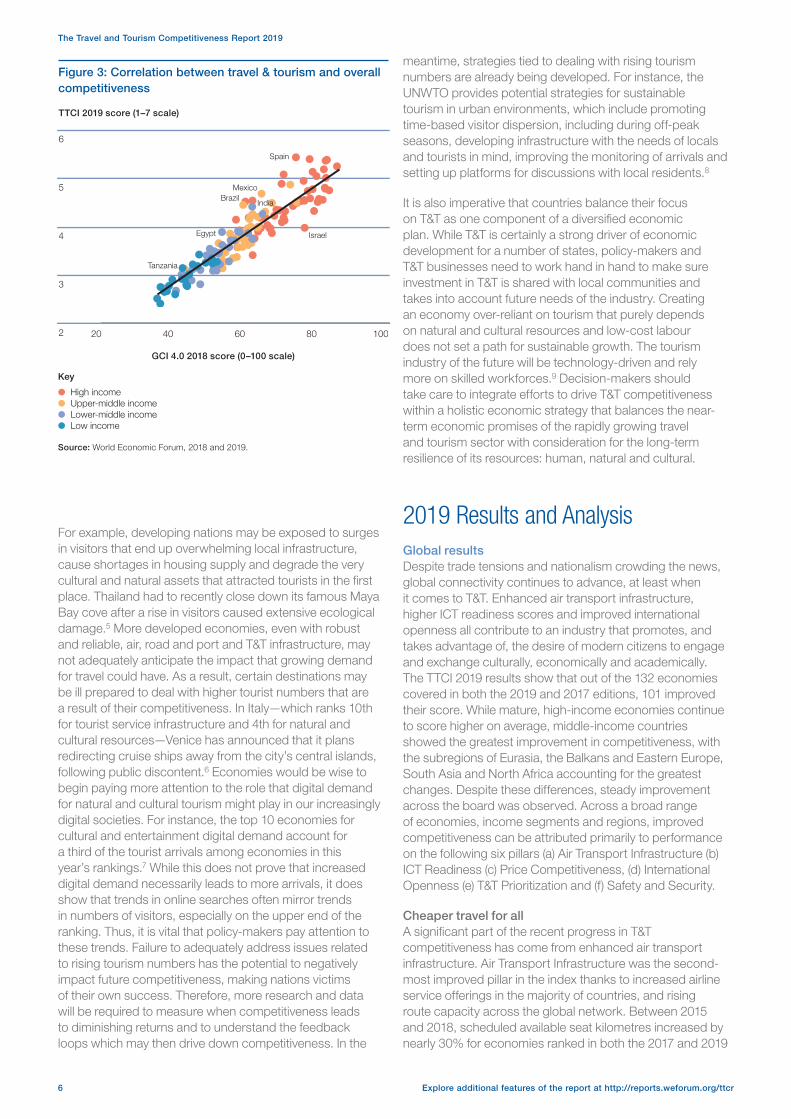
Favourable enabling environments and improved infrastructure that can be achieved through properly managed T&T-led development may translate into increased economic productivity and overall national competitiveness. Figure 3 (on page 6) shows the relationship between T&T competitiveness and the Global Competitiveness Index 4.0 (GCI 4.0), which measures the set of institutions, policies and factors that determine an economy’s level of productivity. Because of shared foundations of competitiveness, there is a clear relationship between T&T and general competitiveness. Consequently, pursuing T&T competitiveness through such foundations can lead to a more productive economy, which in turn, may lead to reduced poverty levels, income and inequality.4
Anticipating the tipping pointThe results of the 2019 TTCI that are presented and analyzed in the following section of Part 1 indicate that both developing and developed nations have advanced in competitiveness, with improved scores in areas such as price competitiveness, air transport infrastructure, ICT readiness, T&T prioritization and international openness. And as Figure 1 shows, T&T competitiveness does often lead to substantial increases in travel and tourism demand. Given the forecasted growth in T&T in the coming decade, understanding the consequences and impact of T&T competitiveness is important so that public and private stakeholders can together design pathways for sustainable management of the sector over time.
Figure 2: Correlation between TTCI pillars and international tourist arrivals, by income level
–0.4
–0.2
0.0
0.2
0.4
0.6
0.8
1.0
Business Environment
Safety & Security
Health & Hygiene
Human Resources & Labour Mkt.
ICT Readiness
Prioritization of T&T
Int’l. Openness
Price Compt’ness.
Environ. Sustainability
Air Transport
Infrastructure
Ground & Port
Infrastructure
Tourist Service
Infrastructure
Natural Resources
Cult. Resources &
Business Travel
Notes: Light-coloured bars indicate high-income economies, dark-coloured bars indicate low- and lower-middle-income economies. Log of international tourist arrivals (2017 or latest available). Excludes arrivals for Liberia.
Sources: World Economic Forum and World Tourism Organization (UNWTO).
Correlation coefficient
Explore additional features of the report at http://reports.weforum.org/ttcr 5
The Travel and Tourism Competitiveness Report 2019
For example, developing nations may be exposed to surges in visitors that end up overwhelming local infrastructure, cause shortages in housing supply and degrade the very cultural and natural assets that attracted tourists in the first place. Thailand had to recently close down its famous Maya Bay cove after a rise in visitors caused extensive ecological damage.5 More developed economies, even with robust and reliable, air, road and port and T&T infrastructure, may not adequately anticipate the impact that growing demand for travel could have. As a result, certain destinations may be ill prepared to deal with higher tourist numbers that are a result of their competitiveness. In Italy—which ranks 10th for tourist service infrastructure and 4th for natural and cultural resources—Venice has announced that it plans redirecting cruise ships away from the city’s central islands, following public discontent.6 Economies would be wise to begin paying more attention to the role that digital demand for natural and cultural tourism might play in our increasingly digital societies. For instance, the top 10 economies for cultural and entertainment digital demand account for a third of the tourist arrivals among economies in this year’s rankings.7 While this does not prove that increased digital demand necessarily leads to more arrivals, it does show that trends in online searches often mirror trends in numbers of visitors, especially on the upper end of the ranking. Thus, it is vital that policy-makers pay attention to these trends. Failure to adequately address issues related to rising tourism numbers has the potential to negatively impact future competitiveness, making nations victims of their own success. Therefore, more research and data will be required to measure when competitiveness leads to diminishing returns and to understand the feedback loops which may then drive down competitiveness. In the
meantime, strategies tied to dealing with rising tourism numbers are already being developed. For instance, the UNWTO provides potential strategies for sustainable tourism in urban environments, which include promoting time-based visitor dispersion, including during off-peak seasons, developing infrastructure with the needs of locals and tourists in mind, improving the monitoring of arrivals and setting up platforms for discussions with local residents.8
It is also imperative that countries balance their focus on T&T as one component of a diversified economic plan. While T&T is certainly a strong driver of economic development for a number of states, policy-makers and T&T businesses need to work hand in hand to make sure investment in T&T is shared with local communities and takes into account future needs of the industry. Creating an economy over-reliant on tourism that purely depends on natural and cultural resources and low-cost labour does not set a path for sustainable growth. The tourism industry of the future will be technology-driven and rely more on skilled workforces.9 Decision-makers should take care to integrate efforts to drive T&T competitiveness within a holistic economic strategy that balances the near-term economic promises of the rapidly growing travel and tourism sector with consideration for the long-term resilience of its resources: human, natural and cultural.
2019 Results and AnalysisGlobal resultsDespite trade tensions and nationalism crowding the news, global connectivity continues to advance, at least when it comes to T&T. Enhanced air transport infrastructure, higher ICT readiness scores and improved international openness all contribute to an industry that promotes, and takes advantage of, the desire of modern citizens to engage and exchange culturally, economically and academically. The TTCI 2019 results show that out of the 132 economies covered in both the 2019 and 2017 editions, 101 improved their score. While mature, high-income economies continue to score higher on average, middle-income countries showed the greatest improvement in competitiveness, with the subregions of Eurasia, the Balkans and Eastern Europe, South Asia and North Africa accounting for the greatest changes. Despite these differences, steady improvement across the board was observed. Across a broad range of economies, income segments and regions, improved competitiveness can be attributed primarily to performance on the following six pillars (a) Air Transport Infrastructure (b) ICT Readiness (c) Price Competitiveness, (d) International Openness (e) T&T Prioritization and (f) Safety and Security.
Cheaper travel for allA significant part of the recent progress in T&T competitiveness has come from enhanced air transport infrastructure. Air Transport Infrastructure was the second-most improved pillar in the index thanks to increased airline service offerings in the majority of countries, and rising route capacity across the global network. Between 2015 and 2018, scheduled available seat kilometres increased by nearly 30% for economies ranked in both the 2017 and 2019
Source: World Economic Forum, 2018 and 2019.
Figure 3: Correlation between travel & tourism and overall competitiveness
20 40 60 80 1002
3
4
5
6
TTCI 2019 score (1–7 scale)
GCI 4.0 2018 score (0–100 scale)
Spain
MexicoBrazil
Israel
India
Egypt
Tanzania
● High income● Upper-middle income● Lower-middle income● Low income
Key
Explore additional features of the report at http://reports.weforum.org/ttcr6
The Travel and Tourism Competitiveness Report 2019
report editions. Moreover, flying and travel in general has been made more affordable thanks to lower global fuel prices and reduced ticket taxes and airport charges. In line with these trends and the further democratization of travel, Price Competitiveness (pillar 8) has seen the most measurable improvement of all the pillars over the last two years.
Destinations going digitalHigher scores in ICT readiness indicate that technology-enabled connectivity continues to proliferate. ICT readiness results have been bolstered by the rising number of individuals using the internet and mobile internet subscriptions—a reminder of how important mobile service offerings will become for the T&T sector in the next few years. On average, the number of mobile broadband internet subscriptions per 100 people has climbed by more than one-quarter since the 2017 report. As a result, more nations are now better positioned to take advantage of the growing popularity of online T&T service offerings, platforms, information distribution and marketing opportunities.
Prioritizing the T&T sectorEconomies across the world are increasingly recognizing the importance of T&T, demonstrated by a steadfast rise in the Prioritization of T&T (pillar 6). This notable broad improvement in T&T prioritization has been characterized by more effective marketing and branding strategies, as competition—globally, regionally and even within subregions—for the growing number of tourists heats up. Moreover, perceptions of government prioritization of T&T rose as did government funding for the industry.
Opening doors to safe and secure tourismThe improvement in International Openness (pillar 7) was led by countries not classified as high-income, especially those economies that implemented policies related to the lowering of visa requirements. In particular, Middle East and North Africa, Sub-Sharan Africa and Eurasia—areas historically known for low levels of international openness—have come closer to narrowing their gap with the global mean. In subregions like Eurasia, South America, Western Africa and the Middle East, growth in air travel and international openness has coincided with enhanced safety and security conditions, indicating that recent stabilization may have reduced traveller safety concerns. North Africa experienced a similar phenomenon with increased air travel and safety and security conditions; however, reduced international openness could potentially dampen the impact.
Critical checkpoints for the industryDespite improvements across region, subregion and income level, a number of challenges remain for the T&T industry. First, given the forecasted growth in T&T in the coming decade, far more investment is required in infrastructure in order to build capacity to welcome more visitors while adequately serving the needs of citizens. For example, despite the growth in air travel and openness, global average perceptions of air transport infrastructure quality have improved at a far slower rate (at a global average 1.4% and 0.4% for high-income economies since the last report), and airport density statistics have fallen. In addition, while some progress has been made in improving ground and port infrastructure, especially in Asia-Pacific,
the overall growth trend for Ground and Port Infrastructure (pillar 11) has been slower. Furthermore, from a global perspective, perceptions of the quality and efficiency of ground transport infrastructure and services have on average remained near stagnant. Consequently, the risk of future air and ground transport bottlenecks is likely to rise, hurting both the industry and local economies.
Ensuring sustainable tourismThe preservation of natural and cultural resources is another challenge the industry must overcome. Results show that the number of UNESCO cultural and natural sites, as well as intangible cultural heritage listings, keeps growing, indicating greater commitment to preserving some of the key attractions driving people to visit destinations. Encouragingly, Environmental Sustainability (pillar 9) scores have been boosted by the increase in environmental treaty ratifications and improved perceptions that T&T is being developed in a sustainable manner, all of which bodes well for natural resources and nature-based tourism. While this is promising, the enforcement of treaties and protected lands might not be enough to preserve natural resources, given that air pollution, deforestation and species endangerment have continued to rise over the last two years. Since the last edition of the report, the global average score for perceptions of the stringency and enforcement of environmental regulations improved by just 0.4%. Sadly, these perceptions declined the most in Sub-Saharan Africa, a region that already struggles to better utilize its natural assets. As a result, it is vital that T&T stakeholders recognize their role in environmental protection, or they run the risk of losing out on future nature tourism.
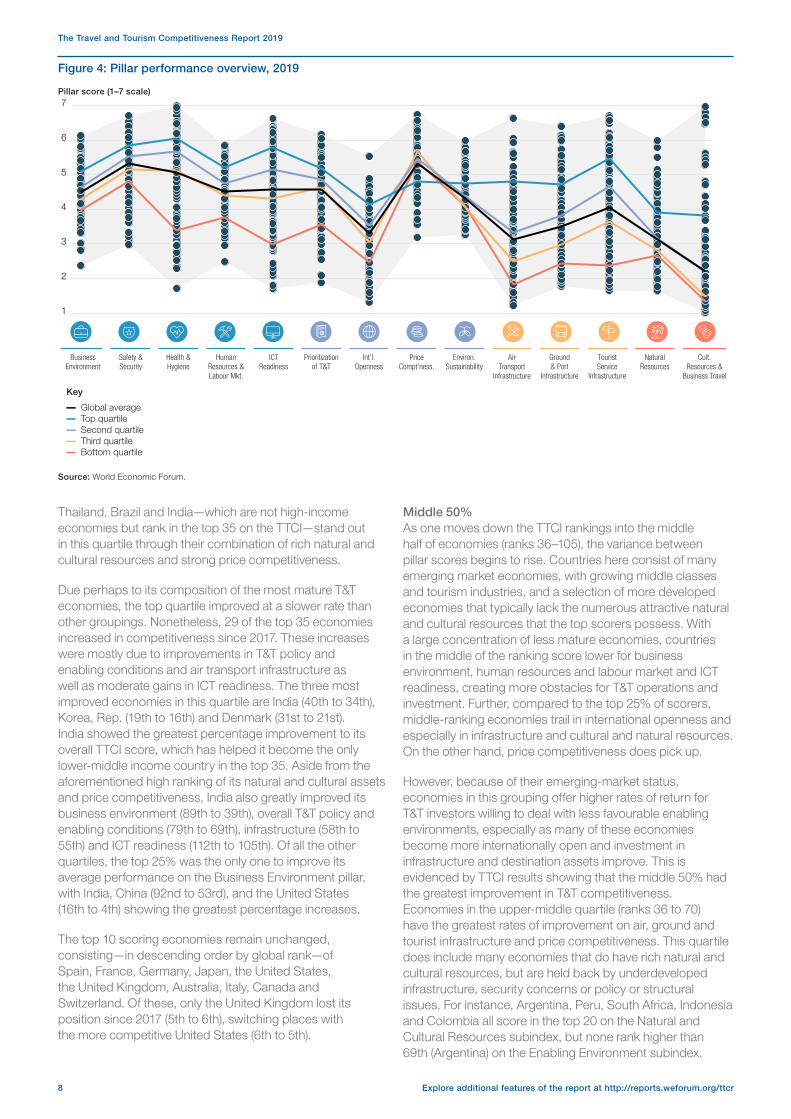
Performance by quartileTop 25%The top quartile (or top 35) of economies on the TTCI rankings dominate the industry, accounting for about 84% of global T&T GDP and nearly 70% of all international tourist arrivals.10 All but six of them are high-income economies, 20 are from Europe, 10 are from Asia-Pacific, four from the America’s and one (the United Arab Emirates) is from the Middle East and North Africa region. Typically, what separates this quartile from the others is how well many of its members do across all pillars. The top 25% tend to greatly outscore the global average on all pillars apart from Price Competitiveness. The high concentration of advanced economies in the top quartile means that this group is characterized by strong business environments, good safety and healthcare conditions and high ICT readiness. They are also comparatively more open to receiving international visitors than other countries. However, their greatest advantages come from well-developed infrastructure and natural and cultural resources.
The top 25% of scorers beat the global mean for air transport infrastructure by an average of 54.1%. However, the quartile has an even more impressive lead when it comes to cultural resources and business travel, at 73% above the global mean. Economies in this group have nearly 60% of the UNESCO World Cultural Heritage sites and host over 75% of international association meetings. The Cultural Resources and Business Travel pillar also exhibits the most variation in scores among the top 35 economies, making it a key point of competition. China, Mexico, Malaysia,
Explore additional features of the report at http://reports.weforum.org/ttcr 7
The Travel and Tourism Competitiveness Report 2019
Thailand, Brazil and India—which are not high-income economies but rank in the top 35 on the TTCI—stand out in this quartile through their combination of rich natural and cultural resources and strong price competitiveness.
Due perhaps to its composition of the most mature T&T economies, the top quartile improved at a slower rate than other groupings. Nonetheless, 29 of the top 35 economies increased in competitiveness since 2017. These increases were mostly due to improvements in T&T policy and enabling conditions and air transport infrastructure as well as moderate gains in ICT readiness. The three most improved economies in this quartile are India (40th to 34th), Korea, Rep. (19th to 16th) and Denmark (31st to 21st). India showed the greatest percentage improvement to its overall TTCI score, which has helped it become the only lower-middle income country in the top 35. Aside from the aforementioned high ranking of its natural and cultural assets and price competitiveness, India also greatly improved its business environment (89th to 39th), overall T&T policy and enabling conditions (79th to 69th), infrastructure (58th to 55th) and ICT readiness (112th to 105th). Of all the other quartiles, the top 25% was the only one to improve its average performance on the Business Environment pillar, with India, China (92nd to 53rd), and the United States (16th to 4th) showing the greatest percentage increases.
The top 10 scoring economies remain unchanged, consisting—in descending order by global rank—of Spain, France, Germany, Japan, the United States, the United Kingdom, Australia, Italy, Canada and Switzerland. Of these, only the United Kingdom lost its position since 2017 (5th to 6th), switching places with the more competitive United States (6th to 5th).
Figure 4: Pillar performance overview, 2019
1
2
3
4
5
6
7
— Global average— Top quartile— Second quartile— Third quartile— Bottom quartile
Key
Business Environment
Safety & Security
Health & Hygiene
Human Resources & Labour Mkt.
ICT Readiness
Prioritization of T&T
Int’l. Openness
Price Compt’ness.
Environ. Sustainability
Air Transport
Infrastructure
Ground & Port
Infrastructure
Tourist Service
Infrastructure
Natural Resources
Cult. Resources &
Business Travel
Pillar score (1–7 scale)
Middle 50%As one moves down the TTCI rankings into the middle half of economies (ranks 36–105), the variance between pillar scores begins to rise. Countries here consist of many emerging market economies, with growing middle classes and tourism industries, and a selection of more developed economies that typically lack the numerous attractive natural and cultural resources that the top scorers possess. With a large concentration of less mature economies, countries in the middle of the ranking score lower for business environment, human resources and labour market and ICT readiness, creating more obstacles for T&T operations and investment. Further, compared to the top 25% of scorers, middle-ranking economies trail in international openness and especially in infrastructure and cultural and natural resources. On the other hand, price competitiveness does pick up.
However, because of their emerging-market status, economies in this grouping offer higher rates of return for T&T investors willing to deal with less favourable enabling environments, especially as many of these economies become more internationally open and investment in infrastructure and destination assets improve. This is evidenced by TTCI results showing that the middle 50% had the greatest improvement in T&T competitiveness. Economies in the upper-middle quartile (ranks 36 to 70) have the greatest rates of improvement on air, ground and tourist infrastructure and price competitiveness. This quartile does include many economies that do have rich natural and cultural resources, but are held back by underdeveloped infrastructure, security concerns or policy or structural issues. For instance, Argentina, Peru, South Africa, Indonesia and Colombia all score in the top 20 on the Natural and Cultural Resources subindex, but none rank higher than 69th (Argentina) on the Enabling Environment subindex.
Source: World Economic Forum.
Explore additional features of the report at http://reports.weforum.org/ttcr8
The Travel and Tourism Competitiveness Report 2019
Of the 35 economies that rank between 36th and 70th, 29 increased their overall T&T competitiveness. Egypt (74th to 65th), Montenegro (72nd to 67th) and Romania (68th to 56th) had the strongest percentage increase in TTCI scores, improving on most pillars. As previously noted, it was this quartile that outpaced the rest of the world when it comes to enhancement of overall infrastructure. Poland improved the most on air transport infrastructure (70th to 56th), Cyprus had the best growth on ground and port infrastructure (51st to 32nd) and Georgia had the biggest percentage rise on tourist service infrastructure (70th to 41st). For those countries ranked 71st to 105th, Serbia (95th to 83th), Albania (98th to 86th) and Ukraine (88th to 78th) experienced the most significant improvement in TTCI scores.
Bottom 25%The bottom quartile consists mostly of low to lower-middle income economies, with 26 coming from Sub-Saharan Africa. Lower levels of economic development do translate into particularly poor competitive conditions for T&T. Even compared to the third-lowest quartile, the bottom 35 countries score significantly lower on most pillars—in particular, overall infrastructure, international openness, ICT readiness and health and hygiene. Also similar to the third-lowest quartile, nations in this group score below average for natural and cultural resources. As a result, the bottom 35 economies account for just 1.8% of T&T GDP and 2.5% of tourist arrivals of the economies ranked in this report.11
Though they’ve started from a low base, economies in this quartile did show improvement on T&T policy and enabling conditions, safety and security, ICT readiness, and air and ground infrastructure. They had the largest improvement on international openness, which is likely to lead to greater connectivity. Four of the 10 economies that showed the biggest reduction in visa requirements in the overall rankings are in Sub-Saharan Africa. Benin had the world’s largest drop in requirements (122nd to 7th), which contributed to the global TTCI’s greatest improvement on international openness in all 140 economies (133rd to 92nd). Bangladesh (125th to 120th), Pakistan (124th to 121st) and Lesotho (128th to 124th) led the quartile in overall growth in T&T competitiveness. However, all three still require substantial improvement in competitiveness to move up in rank and out of the bottom quartile.
Notes 1 World Travel & Tourism Council, Tourism Satellite Account Research,
2019.
2 World Travel & Tourism Council, Tourism Satellite Account Research, and World Tourism Organization 2018, UNWTO database, latest available data, UNWTO, Madrid.
3 Visa Openness Index, Africa Visa Openness Report 2018, 2018.
4 World Economic Forum, “In Depth: Are prosperity, people and planet compatible?”, in The Global Competitiveness Report 2018, 2018.
5 “Thailand: Tropical bay from ‘The Beach’ to close until 2021”, BBC, 9 May 2019, https://www.bbc.com/news/world-asia-48222627.
6 Mezzofiore, G. and R. Picheta, “Venice will stop letting huge cruise ships dock in its historic center”, CNN, 8 August 2019, https://www.cnn.com/travel/article/venice-cruise-ships-lagoon-scli-intl/index.html.
7 Bloom Consulting, Country Brand Ranking, Tourism Edition, https://www.bloom-consulting.com/en/country-brand-ranking, and World Tourism Organization 2018, UNWTO database, latest available data, UNWTO, Madrid.
8 World Tourism Organization (UNWTO), Overtourism’? Understanding and Managing Urban Tourism Growth beyond Perceptions Volume 2: Case Studies | Executive Summary, 2019.
9 World Economic Forum, “Industry Profile: Aviation, Travel & Tourism” in The Future of Jobs Report 2018, 2018.
10 World Travel & Tourism Council, Tourism Satellite Account Research, 2019, and World Tourism Organization 2018, UNWTO database, latest available data, UNWTO, Madrid.
11 Ibid.
ReferencesBloom Consulting, Country Brand Ranking, Tourism Edition, https://www.
bloom-consulting.com/en/country-brand-ranking, and World Tourism Organization 2018, UNWTO database, latest available data, UNWTO, Madrid.
Mezzofiore, G. and R. Picheta, “Venice will stop letting huge cruise ships dock in its historic center”, CNN, 8 August 2019, https://www.cnn.com/travel/article/venice-cruise-ships-lagoon-scli-intl/index.html.
“Thailand: Tropical bay from ‘The Beach’ to close until 2021”, BBC, 9 May 2019, https://www.bbc.com/news/world-asia-48222627.
Visa Openness Index, Africa Visa Openness Report 2018, 2018.
World Bank, World Bank Country and Lending Groups, https://datahelpdesk.worldbank.org/knowledgebase/articles/906519.
World Economic Forum, “In Depth: Are prosperity, people and planet compatible?”, in The Global Competitiveness Report 2018, 2018.
———, “Industry Profile: Aviation, Travel & Tourism” in The Future of Jobs Report 2018, 2018.
———, The Travel & Tourism Competitiveness Report 2017: Paving the way for a more sustainable and inclusive future, 2017.
World Tourism Organization (UNWTO), Overtourism’? Understanding and Managing Urban Tourism Growth beyond Perceptions Volume 2: Case Studies | Executive Summary, 2019.
———, Tourism Congestion Management at Natural and Cultural Sites, UNWTO, Madrid, 2004.
———, World Tourism Barometer Excerpt, vol.17, iss. 1, January 2019, http://cf.cdn.unwto.org/sites/all/files/pdf/unwto_barom19_01_january_excerpt.pdf.
World Travel & Tourism Council, Tourism Satellite Account Research, 2019.
World Travel & Tourism Council, Tourism Satellite Account Research, 2019 and World Tourism Organization 2018, UNWTO database, latest available data, UNWTO, Madrid.
Explore additional features of the report at http://reports.weforum.org/ttcr 9
The Travel and Tourism Competitiveness Report 2019