Embed Size (px)
Citation preview
8/4/2019 The Trauma of Post-Communism (PCEE 50, 1999) Piotr Sztompka.
http://slidepdf.com/reader/full/the-trauma-of-post-communism-pcee-50-1999-piotr-sztompka 1/74
Partisan Strategies and Supply-Side Policies'in Industrialized Nations, 1960-1990
by Carles BoixHarvard University
Working Paper Series #50
Different versions of this paper were presented at the Seminar on State and Capitalism since 1800 at the Centerfor European Studies, Harvard University, and at the 1994 Annual Meeting of the Midwest Political ScienceAssociation. I would like to thank the participants for their comments, especially Alberto Alesina, James E. Alt,Peter A. Hall, Roberto Perotti, and Duane Swank.
Abstract
Recent political economic models have concluded that several structural and institutional ar-
rangements place heavy limits on the capacity of parties to affect the conduct of macroeconomicpolicies according to their initial political preferences. Yet those same factors (mainly, rationalexpectations among economic agents, the organization of the domestic political economy, andthe international business cycle) hardly constrain the choice of economic strategies designed toshape the supply side of the economy-Le., the provision of input factors, capital, and labor.Consequently, we should expect supply-side economic policies to conform to the preferred objec-tives of the party in government. In order to maximize growth, the Right trusts to privateagents the determination of the optimal levels of savings and investment. The Left, instead,tends to rely on the public sector for that same purpose. This model is validated by looking atth e levels of public intervention in fixed and human capital formation as well as tax p o l i c y in
OEeD nations from 1960 to 1990.

8/4/2019 The Trauma of Post-Communism (PCEE 50, 1999) Piotr Sztompka.
http://slidepdf.com/reader/full/the-trauma-of-post-communism-pcee-50-1999-piotr-sztompka 2/74

8/4/2019 The Trauma of Post-Communism (PCEE 50, 1999) Piotr Sztompka.
http://slidepdf.com/reader/full/the-trauma-of-post-communism-pcee-50-1999-piotr-sztompka 3/74
8/4/2019 The Trauma of Post-Communism (PCEE 50, 1999) Piotr Sztompka.
http://slidepdf.com/reader/full/the-trauma-of-post-communism-pcee-50-1999-piotr-sztompka 4/74
2
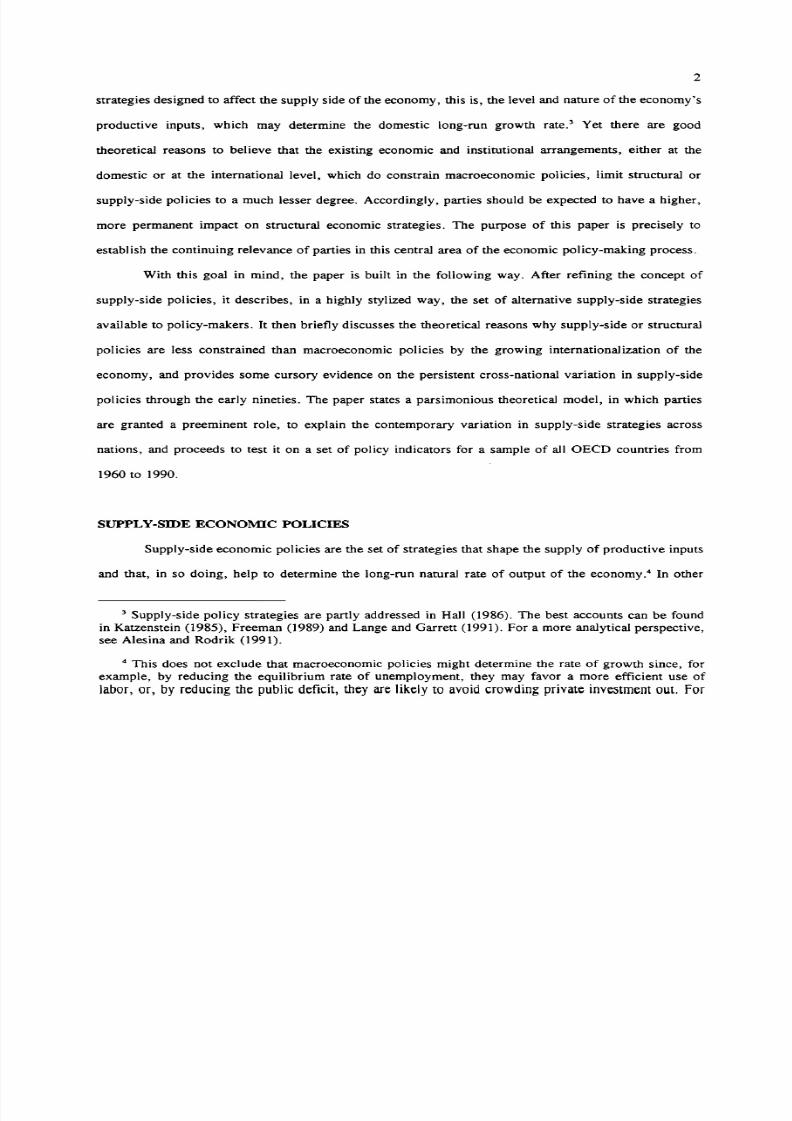
strategies designed to affect the supply side of the economy, this is, the level and nature of the economy's
productive inputs, which may determine the domestic long-run growth rate.' Yet there are good
theoretical reasons to believe that the existing economic and institutional arrangements, either at the
domestic or at the international level, which do constrain macroeconomic policies, limit structural or
supply-side policies to a much lesser degree. Accordingly, parties should be expected to have a higher,
more permanent impact on structural economic strategies. The purpose of this paper is precisely to
establish the continuing relevance of parties in this central area of the economic policy-making process.
With this goal in mind, the paper is built in the following way. After refining the concept of
supply-side policies, it describes, in a highly stylized way, the set of alternative supply-side strategies
available to policy-makers. It then briefly discusses the theoretical reasons why supply-side or structural
policies are less constrained than macroeconomic policies by the growing internationalization of the
economy, and provides some cursory evidence on the persistent cross-national variation in supply-side
policies through the early nineties. The paper states a parsimonious theoretical model, in which parties
are granted a preeminent role, to explain the contemporary variation in supply-side strategies across
nations, and proceeds to test it on a set of policy indicators for a sample of all OEeD countries from
1960 to 1990.
SUPPLY-SIDE ECONOMIC POLICIES
Supply-side economic policies are the set of strategies that shape the supply of productive inputs
and that, in so doing, help to determine the long-run natural rate of output of the economy." In other
3 Supply-side policy strategies are partly addressed in Hall (1986). The best accounts can be found
in Katzenstein (1985), Freeman (1989) and Lange and Garrett (1991). For a more analytical perspective,
see Alesina and Rodrik (1991).
4 This does not exclude that macroeconomic policies might determine the rate of growth since, for
example, by reducing the equilibrium rate of unemployment, they may favor a more efficient use of
labor, o r, by reduc ing the pub lic defic it, th ey are likely to avoid crow ding p riv a te investm en t ou t. for
8/4/2019 The Trauma of Post-Communism (PCEE 50, 1999) Piotr Sztompka.
http://slidepdf.com/reader/full/the-trauma-of-post-communism-pcee-50-1999-piotr-sztompka 5/74
3
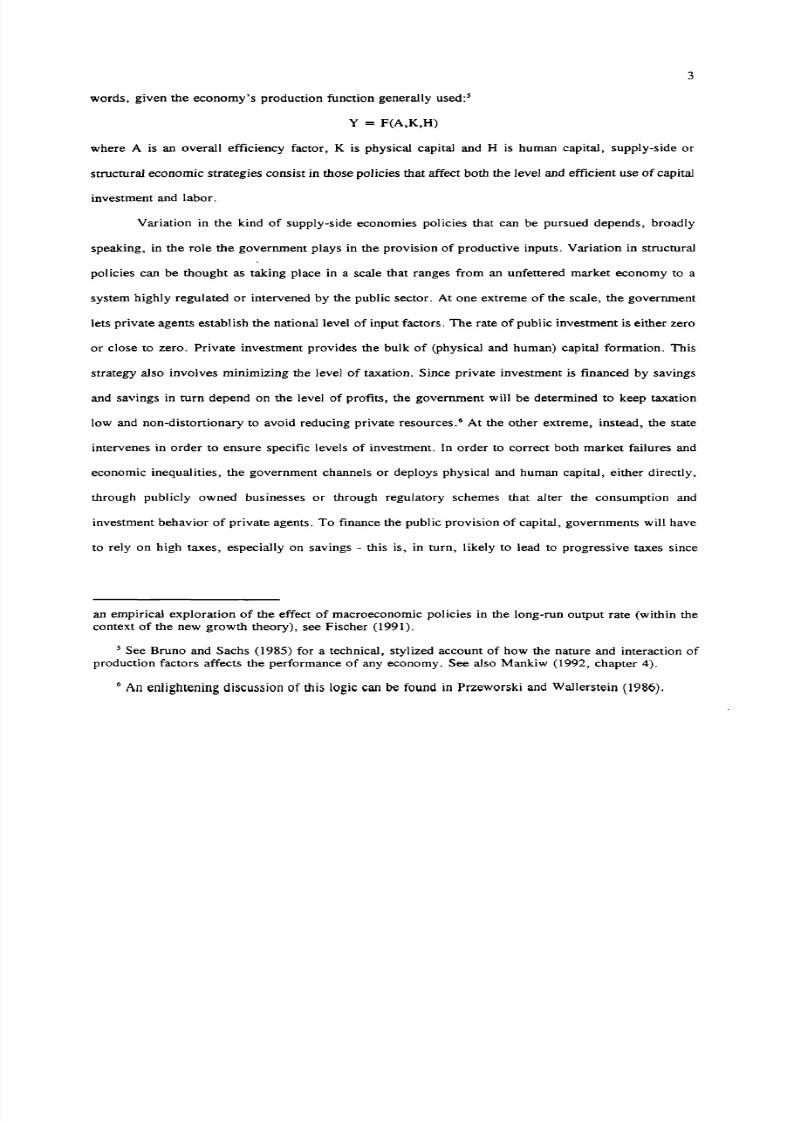
words, given the economy's production function generally used:'
Y = F(A,K,H)
where A is an overall efficiency factor, K is physical capital and H is human capital, supply-side or
structural economic strategies consist in those policies that affect both the level and efficient use of capital
investment and labor.
Variation in the kind of supply-side economies policies that can be pursued depends, broadly
speaking, in the role the government plays in the provision of productive inputs. Variation in structural
policies can be thought a s taking place in a scale that ranges from an unfettered market economy to a
system highly regulated or intervened by the public sector. At one extreme of the scale, the government
lets private agents establish the national level of input factors. The rate of public investment is either zero
or close to zero. Private investment provides the bulk of (Physical and human) capital formation. This
strategy also involves minimizing the level of taxation. Since private investment is financed by savings
and savings in turn depend on the level of profits, the government will be determined to keep taxation
low and non-distortionary to avoid reducing private resources." At the other extreme, instead, the state
intervenes in order to ensure specific levels of investment. In order to correct both market failures and
economic inequalities, the government channels or deploys physical and human capital, either directly,
through publicly owned businesses or through regulatory schemes that alter the consumption and
investment behavior of private agents. To finance the public provision of capital, governments will have
to rely on high taxes, especially on savings - this is, in r u m , likely to lead to progressive taxes since
an empirical exploration of the effect of macroeconomic policies in the long-run output rate (within the
context of the new growth theory), see Fischer (1991).
S See Bruno and Sachs (1985) for a technical, stylized account of how the nature and interaction of
production factors affects the performance of any economy. See also Mankiw (1992, chapter 4).
6 A n en ligh ten ing d iscu ss io n o f th is log ic can b e fo un d in P rz ew orsk i an d Wallerstein ( 1986 ) .
8/4/2019 The Trauma of Post-Communism (PCEE 50, 1999) Piotr Sztompka.
http://slidepdf.com/reader/full/the-trauma-of-post-communism-pcee-50-1999-piotr-sztompka 6/74
4
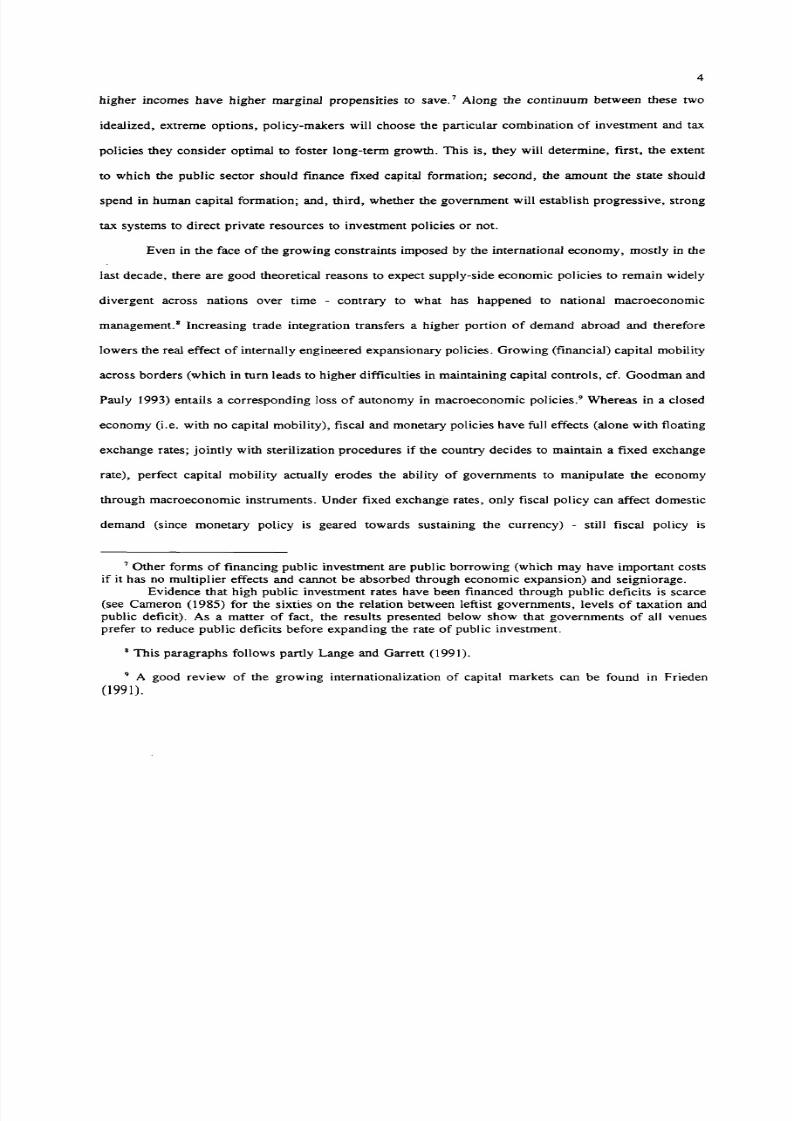
higher incomes have higher marginal propensities to save." Along the continuum between these two
idealized, extreme options, policy-makers will choose the particular combination of investment and tax
policies they consider optimal to foster long-term growth. This is, they will determine, first, the extent
to which the public sector should finance fixed capital formation; second, the amount the state should
spend in human capital formation; and, third, whether the government will establish progressive, strong
tax systems to direct private resources to investment policies or not.
Even in the face of the growing constraints imposed by the international economy, mostly in the
last decade, there are good theoretical reasons to expect supply-side economic policies to remain widely
divergent across nations over time - contrary to what has happened to national macroeconomic
management. 8 Increasing trade integration transfers a higher portion of demand abroad and therefore
lowers the real effect of internally engineered expansionary policies. Growing (financial) capital mobility
across borders (which in turn leads to higher difficulties in maintaining capital controls, cf. Goodman and
Pauly 1993) entails a corresponding loss of autonomy in macroeconomic policies." Whereas in a closed
economy (i.e. with no capital mobility), fiscal and monetary policies have full effects (alone with floating
exchange rates; jointly with sterilization procedures if the country decides to maintain a fixed exchange
rate), perfect capital mobility actually erodes the ability of governments to manipulate the economy
through macroeconomic instruments. Under fixed exchange rates, only fiscal policy can affect domestic
demand (since monetary policy is geared towards sustaining the currency) - still fiscal policy is
7 Other forms of financing public investment are public borrowing (which may have important costs
if it has no multiplier effects and cannot be absorbed through economic expansion) and seigniorage.
Evidence that high public investment rates have been financed through public deficits is scarce(see Cameron (1985) for the sixties on the relation between leftist governments, levels of taxation and
public deficit). As a matter of fact, the results presented below show that governments of all venues
prefer to reduce public deficits before expanding the rate of public investment.
8 This paragraphs follows partly Lange and Garrett (1991).
9 A good review of the growing internationalization of capital markets can be found in Frieden
(1991 ) .
8/4/2019 The Trauma of Post-Communism (PCEE 50, 1999) Piotr Sztompka.
http://slidepdf.com/reader/full/the-trauma-of-post-communism-pcee-50-1999-piotr-sztompka 7/74
5
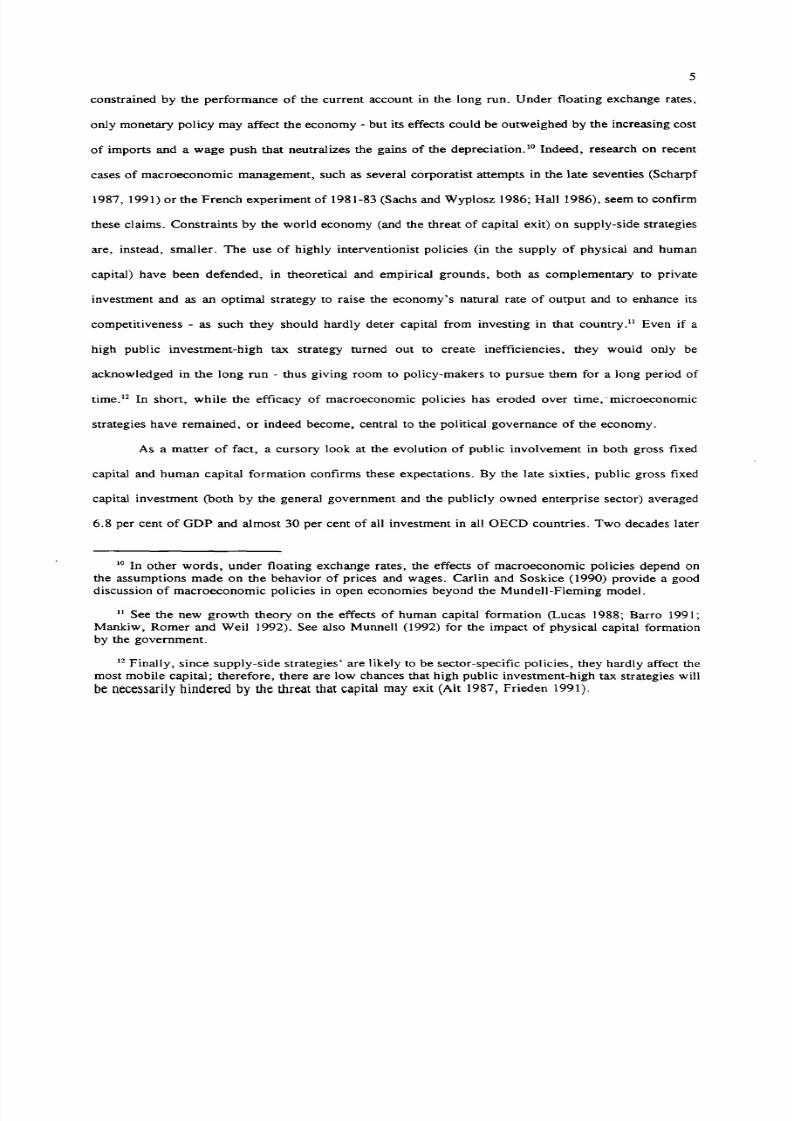
constrained by the performance of the current account in the long run. Under floating exchange rates,
only monetary policy may affect the economy - but its effects could be outweighed by the increasing cost
of imports and a wage push that neutralizes the gains of the depreciation." Indeed, research on recent
cases of macroeconomic management, such as several corporatist attempts in the late seventies (Scharpf
1987, 1991) or the French experiment of 1981-83 (Sachs and Wyplosz 1986; Hall 1986), seem to confirm
these claims. Constraints by the world economy (and the threat of capital exit) on supply-side strategies
are, instead, smaller. The use of highly interventionist policies (in the supply of physical and human
capital) have been defended, in theoretical and empirical grounds, both as complementary to private
investment and as an optimal strategy to raise the economy's natural rate of output and to enhance its
competitiveness - as such they should hardly deter capital from investing in that country." Even if a
high public investment-high tax strategy turned out to create inefficiencies, they would only be
acknowledged in the long run - thus giving room to policy-makers to pursue them for a long period of
time." In short, while the efficacy of macroeconomic policies has eroded over time.: microeconomic
strategies have remained, or indeed become, central to the political governance of the economy.
As a matter of fact, a cursory look at the evolution of public involvement in both gross fixed
capital and human capital formation confirms these expectations. By the late sixties, public gross fixed
capital investment (both by the general government and the publicly owned enterprise sector) averaged
6.8 per cent of GDP and almost 30 per cent of all investment in all OEeD countries. Two decades later
10 In other words, under floating exchange rates, the effects of macroeconomic policies depend on
the assumptions made on the behavior of prices and wages. Carlin and Soskice (1990) provide a good
discussion of macroeconomic policies in open economies beyond the Mundell-Fleming model.
11 See the new growth theory on the effects of human capital formation (Lucas 1988; Barro 1991;
Mankiw, Romer and Wei I 1992). See also Munnell (1992) for the impact of physical capital formation
by the government.
12 Finally, since supply-side strategies' are likely to be sector-specific policies, they hardly affect the
most mobile capital; therefore, there are low chances that high public investment-high tax strategies will
be n ecessarily h in dered b y th e th rea t tha t cap ita l m ay exit (Al t 1987, Frieden 1991).
8/4/2019 The Trauma of Post-Communism (PCEE 50, 1999) Piotr Sztompka.
http://slidepdf.com/reader/full/the-trauma-of-post-communism-pcee-50-1999-piotr-sztompka 8/74
6
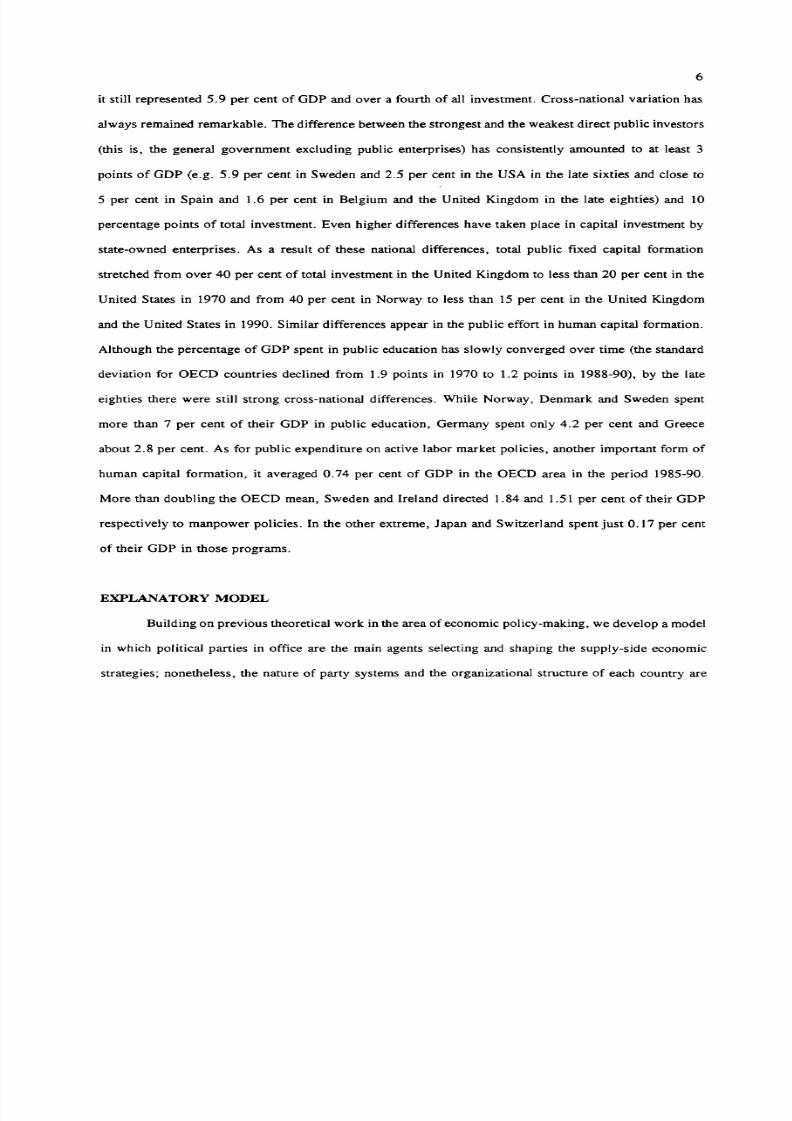
it still represented 5.9 per cent of GOP and over a fourth of all investment. Cross-national variation has
always remained remarkable. The difference between the strongest and the weakest direct public investors
(this is, the general government excluding public enterprises) has consistently amounted to at least 3
points of GOP (e.g. 5.9 per cent in Sweden and 2.5 per cent in the USA in the late sixties and close to
5 per cent in Spain and 1.6 per cent in Belgium and the United Kingdom in the late eighties) and 10
percentage points of total investment. Even higher differences have taken place in capital investment by
state-owned enterprises. As a result of these national differences, total public fixed capital formation
stretched from over 40 per cent of total investment in the United Kingdom to less than 20 per cent in the
United States in 1970 and from 40 per cent in Norway to less than 15 per cent in the United Kingdom
and the United States in 1990. Similar differences appear in the public effort in human capital formation.
Although the percentage of GOP spent in public education has slowly converged over time (the standard
deviation for OECD countries declined from 1.9 points in 1970 to 1.2 points in 1988-90), by the late
eighties there were still strong cross-national differences. While Norway, Denmark and Sweden spent
more than 7 per cent of their GOP in public education, Germany spent only 4.2 per cent and Greece
about 2.8 per cent. As for public expenditure on active labor market policies, another important form of
human capital formation, it averaged 0.74 per cent of GOP in the OECO area in the period 1985-90.
More than doubling the OECO mean, Sweden and Ireland directed 1.84 and 1.51 per cent of their GOP
respectively to manpower policies. In the other extreme, Japan and Switzerland spent just 0.17 per cent
of their GOP in those programs.
EXPLANATORY MODEL
Building on previous theoretical work in the area of economic policy-making, we develop a model
in which political parties in office are the main agents selecting and shaping the supply-side economic
strategies; nonetheless, the nature of party systems and the organizational structure of each country are

8/4/2019 The Trauma of Post-Communism (PCEE 50, 1999) Piotr Sztompka.
http://slidepdf.com/reader/full/the-trauma-of-post-communism-pcee-50-1999-piotr-sztompka 9/74
7
acknowledged to constrain partly the effects of government partisanship.
Political parties
Partisan strategies towards the economy vary along the classic (and in many Western nations most
decisive) political cleavage that pits Left against Right on the role the government should play in ensuring
economic growth and distributing it. Several empirical studies at both at the mass and elite level indeed
confirm its endurance and salience for all the postwar period. In the study gathered by Laver and Hunt
(1992) based on experts' judgments on party policy spatial positions, this socioeconomic dimension was
the most salient in nineteen out of twenty countries. Budge et al. (eds.) (1987) conclude the same for
fifteen out of twenty cases (out of eighteen after excluding non-Western nations) after examining party
manifestos during the last forty years. A survey analysis presented by Inglehart (1984) shows that, both
among political elites and the public opinion, there is a strong Left-Right divide on socioeconomic issues
built around the notions of the extent of government management of the economy, the degree of public
ownership of industry and the reduction of income inequality."
Hence, under a right-wing government, we should expect public fixed capital formation to be
low, education and vocational training to remain in the hands of the private sector, and taxes to be hardly
progressive. The reverse should be true under a leftist government: public investment will be high, public
schemes of education and manpower policies will be large, and the tax system will be sharply
progressive.
13 Differences in party positions are thus centrally connected to supply-side policies, and seem to
suggest that the latter are more central in the political and programmatic debates in contemporary political
economies than any alleged divide around macroeconomic outcomes and policy trade-offs.
It should be observed also that the personal self-placement along the spatial dimension on socio-
economic issues seems to perform as a better predictor of electoral behavior than class-based (or other
s o c i a l) f a c t o rs i n m a n y c o u n t r i e s .
8/4/2019 The Trauma of Post-Communism (PCEE 50, 1999) Piotr Sztompka.
http://slidepdf.com/reader/full/the-trauma-of-post-communism-pcee-50-1999-piotr-sztompka 10/74
8
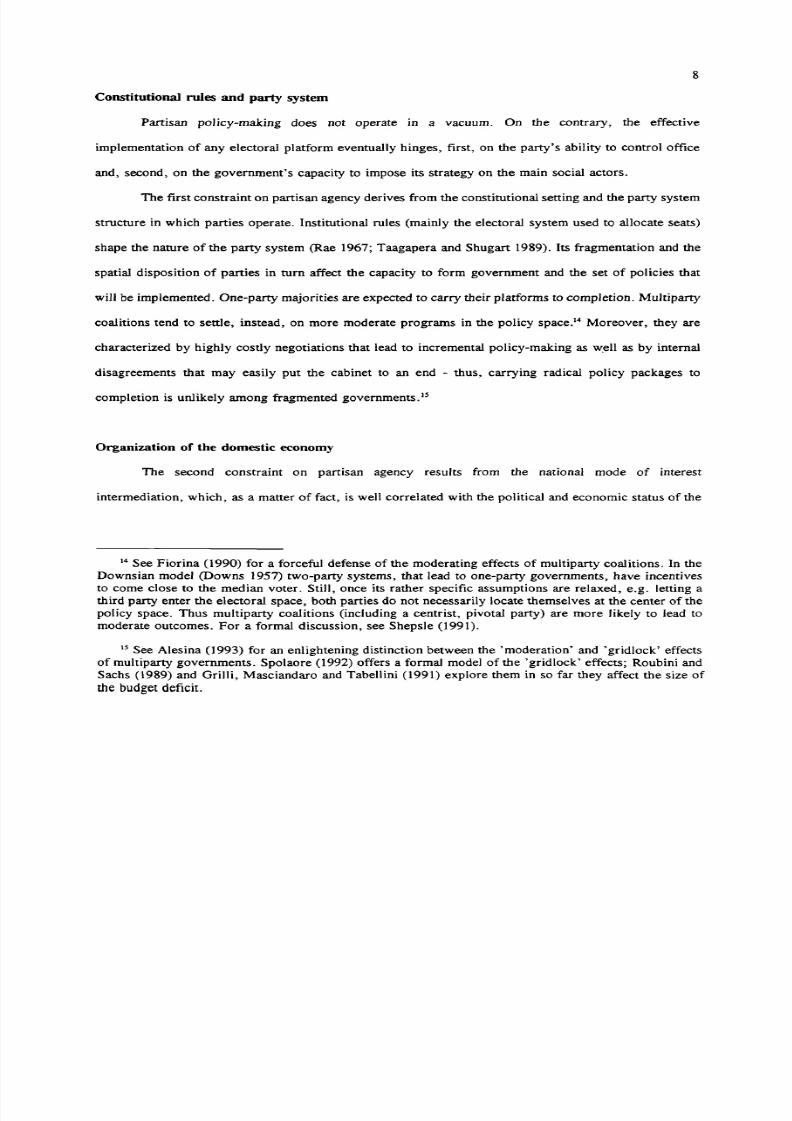
Constitutional rules and party system
Partisan policy-making does not operate in a vacuum. On the contrary, the effective
implementation of any electoral platform eventually hinges, first, on the party's ability to control office
and, second, on the government's capacity to impose its strategy on the main social actors.
The first constraint on partisan agency derives from the constitutional setting and the party system
structure in which parties operate. Institutional rules (mainly the electoral system used to allocate seats)
shape the nature of the party system (Rae 1967; Taagapera and Shugart 1989). Its fragmentation and the
spatial disposition of parties in turn affect the capacity to form government and the set of policies that
will be implemented. One-party majorities are expected to carry their platforms to completion. Multiparty
coalitions tend to settle, instead, on more moderate programs in the policy space." Moreover, they are
characterized by highly costly negotiations that lead to incremental policy-making as well as by internal
disagreements that may easily put the cabinet to an end - thus, carrying radical policy packages to
completion is unlikely among fragmented governments. IS
Organization of the domestic economy
The second constraint on partisan agency results from the national mode of interest
intermediation, which, as a matter of fact, is well correlated with the political and economic status of the
14 See Fiorina (1990) for a forceful defense of the moderating effects of multiparty coalitions. In the
Downsian model (Downs 1957) two-party systems, that lead to one-party governments, have incentives
to come close to the median voter. Still, once its rather specific assumptions are relaxed, e.g. letting athird party enter the electoral space, both parties do not necessarily locate themselves at the center of the
policy space. Thus multiparty coalitions (including a centrist, pivotal party) are more likely to lead to
moderate outcomes. For a formal discussion, see Shepsle (1991).
IS See Alesina (1993) for an enlightening distinction between the 'moderation' and 'gridlock' effects
of multiparty governments. Spolaore (1992) offers a formal model of the 'gridlock' effects; Roubini and
Sachs (1989) and Grilli, Masciandaro and Tabellini (1991) explore them in so far they affect the size of
th e b u dg et d e fic it .
8/4/2019 The Trauma of Post-Communism (PCEE 50, 1999) Piotr Sztompka.
http://slidepdf.com/reader/full/the-trauma-of-post-communism-pcee-50-1999-piotr-sztompka 11/74
9
country in the international arena." Open, small economies have generally yielded strong, highly
organized social actors (either labor or capital or both), which are capable of sustaining nation-wide,
coordinated schemes of wage bargaining and which playa predominant role in policy-making. Parties are
here partially constrained by the pressures and behavior of organized labor and capital. As the literature
on 'socialdemocratic corporatist regimes' has already revealed, socialist governments have the incentive,
when they are backed by a powerful, encompassing union movement, to sustain highly interventionist
supply-side policies in exchange for wage restraint.'? Once these schemes have been devised, and even
if the left loses complete control over the cabinet, right-wing parties will encounter harsh political and
social resistance to dismantle them and to devolve power to market forces." Moreover, since open
economies are strongly dependent on world markets, the supply of 'correct' productive inputs by the state
(e.g. strong educational policies to create a skilled labor force) might make sense from a pure economic
point of view (e.g. if high returns are to be obtained from investing in goods that private agents are
unable or unwilling to supply)." In countries with strong labor movements, the level of public
intervention should be high - even if right-wing parties control the cabinet they only reduce it marginally
16 On the relation between openness and the organization of the domestic political economy, see
Cameron (1978), Stephens (1991).
17 Notice, however, in theoretical terms, that union assent is not a necessary condition to realize
interventionist policies. Labor cooperation is only needed to ensure the success of expansionary
macroeconomic policies without incurring into accelerating inflation. In other words, full interventionist
microeconomic policies can be developed even in countries with no organized labor - indeed the case of
Southern European nations ruled by socialist parties.
18 As a matter of fact, the left seldom loses control at allover in small corporatist countries, which
tend to have proportional representation systems and a fragmented constellation of right-wing parties.
19 Notice that this also entails that most of the change in supply-side policies in small, highly
dependent countries takes place imposed by the needs of a domestic economy challenged by new trends
in the international economy - independently of the party in office and the corporatist structure of the
country. Some proof of this is given in discussing the new tax reforms of the eighties at the end of the
paper.
8/4/2019 The Trauma of Post-Communism (PCEE 50, 1999) Piotr Sztompka.
http://slidepdf.com/reader/full/the-trauma-of-post-communism-pcee-50-1999-piotr-sztompka 12/74
10
or at least very slowly. 20
Due to the size of their domestic market, medium-size economies enjoy, instead, a higher degree
of autonomy and therefore more policy leverage. Besides, their political structure generally presents a
pluralist mode of intermediation in which social agents are weakly organized - for example, wage
bargaining develops in a decentralized setting. Furthermore, as a result of its political development, the
state tends to be more centralized and more separated from society (Tilly 1992). Hence, parties are less
constrained by social demands and the world economy. Given the capacity of the state, the control of the
cabinet enables them to shape policy more readily than in corporatist polities. In short, parties should
have a significant effect in policy. As political office changes hands, we should expect clear-cut U-turns
in economic strategies. 21
EMPIRICAL FINDINGS
In order to test the model that we have just laid down, we identify and develop a set of three
indicators: (1) the public provision of capital investment; (2) the role of the state in the supply of human
capital; (3) the progressivity of taxation (which operates as a proxy for the level of transfers of private
20 On the contrary, ineconomies in which capital coordinates the economy (e.g. Switzerland; possibly
Japan, cf. Soskice 1990), we should expect a strong resistance towards a large public sector. Even if the
left controls the government, public capital formation will increase marginally. The same argument was
laid down by Katzenstein (1985) when he distinguished between private and public forms of domestic
compensation to economic adjustment in corporatist countries. Still, it is difficult to test empirically thishypothesis because in economies in which business is well organized, but labor is not, the left is generally
small.
21 As a matter of fact, constitutional settings and domestic structures seem to overlap considerably.
Besides a strong corporatist network, all open economies have proportional representation systems (and
in most cases multi-party systems). Medium-size (or relatively closed) economies tend to have plurality
systems or corrected proportional systems (and therefore less fragmented part systems) (Rogowski 1987).
8/4/2019 The Trauma of Post-Communism (PCEE 50, 1999) Piotr Sztompka.
http://slidepdf.com/reader/full/the-trauma-of-post-communism-pcee-50-1999-piotr-sztompka 13/74
1 1
savings to the public sector).
We test the model with data from all OECD countries over one million inhabitants," mostly for
the period that extends from 1960 to 1990.23
Public Provision of Physical Capital
Cross-national analysis
In order to assess the relation between partisan control and gross fixed capital formation by the
public sector we proceed in two steps." First we engage in a cross-national analysis of the levels of
public capital formation for each of the last three decades. Each of them broadly corresponds to a
particular business cycle with specific economic traits -the sixties (through 1973) and the eighties (1982-
1990) were expansionary cycles, the seventies were mostly a period of stagflation- as well as political
conditions -the seventies as a period of leftist hegemony and the eighties as decade in which socialist
electoral triumphs have taken place in Southern European nations. A cross-national analysis of this sort
appears to be particular appropriate to isolate the matrix of incentives parties face in each period and to
control for medium-term institutional factors (such as economic openness or corporatist frameworks).
Afterwards we move into a panel data analysis of all the countries of the sample from 1960 to 1990. The
panel data procedure completes the analysis by examining partisan effects in a more dynamic, short-term
way, and by exploring how budgetary constraints and concerns about the annual economic performance
interact with the partisan preferences in the policy-making process.
In the cross-national analysis we have estimated the level of public investment at the end of each
22 Iceland and Luxembourg are thus excluded. Turkey is also excluded for lack of reliable data.
23The historical period varies somewhat, however, depending on the availability of data.
1,4 Notice that in this section we use the expressions 'public investment' and 'public gross fixed capital
formation' interchangeably. Both denote the investment in fixed capital made by the general government,
a s defined b y the OECD, which excludes capital formation by public enterprises.
8/4/2019 The Trauma of Post-Communism (PCEE 50, 1999) Piotr Sztompka.
http://slidepdf.com/reader/full/the-trauma-of-post-communism-pcee-50-1999-piotr-sztompka 14/74
12
economic period." For the decade of the sixties we have averaged the percentage of public gross fixed
capital formation over GDP (and over total investment) between 1969 and 1972 - this is, those years just
before the first oil shock. For the seventies, we have taken the mean of 1979-1980. For the eighties we
have calculated the average of the percentage of public gross fixed capital formation over GOP (and over
total investment) from 1988 to 1990.2627
The dependent variable (public investment effort) is measured in two ways (as a proportion of
GOP and as a proportion of total investment) to control for the behavior of the Japanese public sector,
whose level of investment clearly deviates from all other countries when it is measured as a proportion
of GOP. Although broadly in line with the public investment effort made by other countries in the sixties,
public gross fixed capital formation in Japan reached 6.1 per cent of GOP in 1979-80 (twice the OECO
average) and 5.0 per cent of GOP in 1988-90 (again almost doubling the OECO mean). However, when
Japanese public investment is measured as a proportion of total investment, its values (19.7 per cent in
1979-80 and 16.3 per cent in 1988-90) hardly deviate from the OECD mean (14.1 per cent and 13.0 per
cent respectively). As a matter of fact, the deviation of Japan in the first measure is due to a sizable
difference in total gross fixed capital formation (as well as total savings) between that country and the
rest of the OECO. From 1960 to 1990, total investment has averaged 31.3 per cent of GOP in Japan but
only 21.7 per cent of GDP in the OECO. Thus, a public effort (in relation to the investment pool of the
2S Governments are assumed to deal with supply-side issues through medium-term strategies -
contrarily to the short-term character of most demand-side policies. Consequently, it seems plausible to
think that results at the end of each political and economic cycle reflect most accurately the preferences
of the political coalition in office during that period. The panel data analysis tends to confirm this
assumption - public investment decisions have hardly had a counter-cyclical nature.
26 Note that no data are available for New Zealand ever and for Switzerland since the early seventies.
27 Publ ic investment has varied notably over time and across nations. From a statistical point of view,
the levels of investment across decades are poorly correlated. Investment in the sixties explains only 22
per cent of the variation of investment rates ten years later. Public investment in 1979-80 explains none
of the variance in public investment in 1988-90.
8/4/2019 The Trauma of Post-Communism (PCEE 50, 1999) Piotr Sztompka.
http://slidepdf.com/reader/full/the-trauma-of-post-communism-pcee-50-1999-piotr-sztompka 15/74
1 3
country) similar to the OECD average translates in Japan into a level of public investment (over GOP)
much higher than all other industrialized nations.
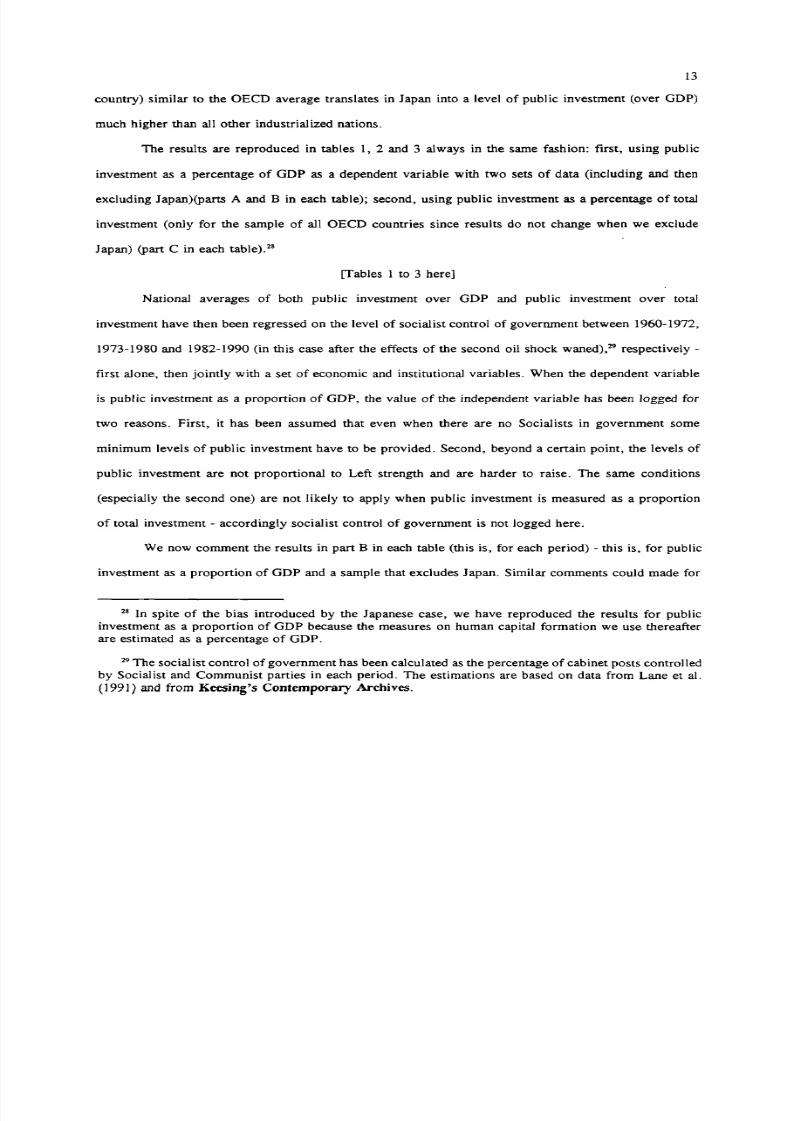
The results are reproduced in tables 1, 2 and 3 always in the same fashion: first, using public
investment as a percentage of GOP as a dependent variable with two sets of data (including and then
excluding Japan)(parts A and B in each table); second, using public investment as a percentage of total
investment (only for the sample of all OECD countries since results do not change when we exclude
Japan) (part C in each table)."
[Tables 1 to 3 here]
National averages of both public investment over GOP and public investment over total
investment have then been regressed on the level of socialist control of government between 1960-1972,
1973-1980 and 1982-1990 (in this case after the effects of the second oil shock waned)," respectively-
first alone, then jointly with a set of economic and institutional variables. When the dependent variable
is public investment as a proportion of GOP, the value of the independent variable has been logged for
two reasons. First, it has been assumed that even when there are no Socialists in government some
minimum levels of public investment have to be provided. Second, beyond a certain point, the levels of
public investment are not proportional to Left strength and are harder to raise. The same conditions
(especially the second one) are not likely to apply when public investment is measured as a proportion
of total investment - accordingly socialist control of government is not logged here.
We now comment the results in part B in each table (this is, for each period) - this is, for public
investment as a proportion of GOP and a sample that excludes Japan. Similar comments could made for
28 In spite of the bias introduced by the Japanese case, we have reproduced the results for public
investment as a proportion of GOP because the measures on human capital formation we use thereafter
are estimated as a percentage of GOP.
29 The socialist control of government has been calculated as the percentage of cabinet posts controlled
by Socialist and Communist parties in each period. The estimations are based on data from Lane et al.
( 1 99 1) a n d f ro m Keesing's Contemporary A r c h i v e s .
8/4/2019 The Trauma of Post-Communism (PCEE 50, 1999) Piotr Sztompka.
http://slidepdf.com/reader/full/the-trauma-of-post-communism-pcee-50-1999-piotr-sztompka 16/74
14
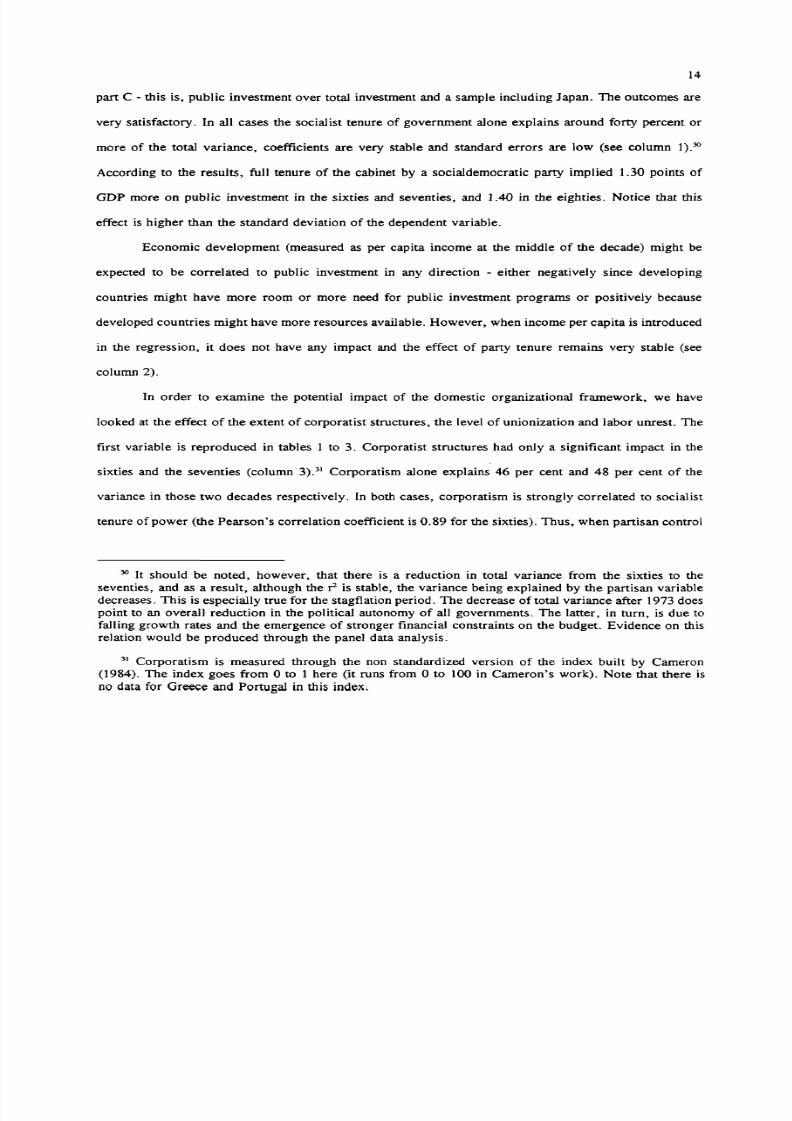
part C - this is, public investment over total investment and a sample including Japan. The outcomes are
very satisfactory. In all cases the socialist tenure of government alone explains around forty percent or
more of the total variance, coefficients are very stable and standard errors are low (see column 1 ) . 3 0
According to the results, full tenure of the cabinet by a socialdemocratic party implied 1.30 points of
GDP more on public investment in the sixties and seventies, and 1.40 in the eighties. Notice that this
effect is higher than the standard deviation of the dependent variable.
Economic development (measured as per capita income at the middle of the decade) might be
expected to be correlated to public investment in any direction - either negatively since developing
countries might have more room or more need for public investment programs or positively because
developed countries might have more resources available. However, when income per capita is introduced
in the regression, it does not have any impact and the effect of party tenure remains very stable (see
column 2).
In order to examine the potential impact of the domestic organizational framework, we have
looked at the effect of the extent of corporatist structures, the level of unionization and labor unrest. The
first variable is reproduced in tables 1 to 3. Corporatist structures had only a significant impact in the
sixties and the seventies (column 3).31 Corporatism alone explains 46 per cent and 48 per cent of the
variance in those two decades respectively. In both cases, corporatism is strongly correlated to socialist
tenure of power (the Pearson's correlation coefficient is 0.89 for the sixties). Thus, when partisan control
3 0 It should be noted, however, that there is a reduction in total variance from the sixties to the
seventies, and as a result, although ther 2is stable, the variance being explained by the partisan variable
decreases. This is especially true for the stagflation period. The decrease of total variance after 1973 does
point to an overall reduction in the political autonomy of all governments. The latter, in tum, is due to
falling growth rates and the emergence of stronger financial constraints on the budget. Evidence on this
relation would be produced through the panel data analysis.
31 Corporatism is measured through the non standardized version of the index built by Cameron
(1984). The index goes from 0 to 1 here (it runs from 0 to 100 in Cameron's work). Note that there is
no data for Greece and Portugal in this index.
8/4/2019 The Trauma of Post-Communism (PCEE 50, 1999) Piotr Sztompka.
http://slidepdf.com/reader/full/the-trauma-of-post-communism-pcee-50-1999-piotr-sztompka 17/74
15
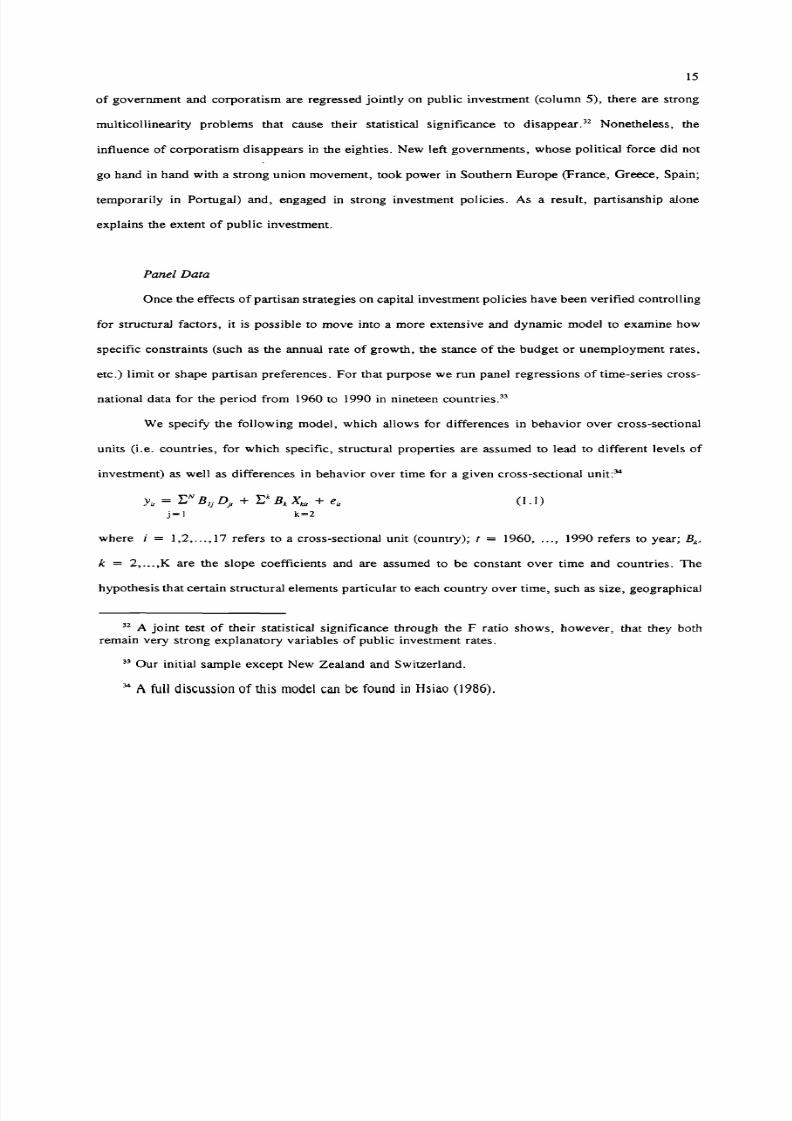
of government and corporatism are regressed jointly on public investment (column 5), there are strong
multicollinearity problems that cause their statistical significance to disappear. 32 Nonetheless, the
influence of corporatism disappears in the eighties. New left governments, whose political force did not
go hand in hand with a strong union movement, took power in Southern Europe (France, Greece, Spain;
temporarily in Portugal) and, engaged in strong investment policies. As a result, partisanship alone
explains the extent of public investment.
Panel Data
Once the effects of partisan strategies on capital investment pol ides have been verified contra IIing
for structural factors, it is possible to move into a more extensive and dynamic model to examine how
specific constraints (such as the annual rate of growth, the stance of the budget or unemployment rates,
etc.) limit or shape partisan preferences. For that purpose we run panel regressions of time-series cross-
national data for the period from 1960 to 1990 in nineteen countries."
We specify the following model, which allows for differences in behavior over cross-sectional
units (i.e. countries, for which specific, structural properties are assumed to lead to different levels of
investment) as well as differences in behavior over time for a given cross-sectional unit:"
Y u = l:N B1jo, + E k s, x; + e;
j=l k=2
(1.1)
where t = 1,2, ... ,17 refers to a cross-sectional unit (country); t = 1960, ... , 1990 refers to year; Bk,
k = 2, ... ,K are the slope coefficients and are assumed to be constant over time and countries. The
hypothesis that certain structural elements particular to each country over time, such as size, geographical
32 A joint test of their statistical significance through the F ratio shows, however, that they both
remain very strong explanatory variables of public investment rates.
33 Our initial sample except New Zealand and Switzerland.
34 A fu ll d iscu s s io n o f th is m ode l c an b e fo u nd in Hs iao (1 986 ).
8/4/2019 The Trauma of Post-Communism (PCEE 50, 1999) Piotr Sztompka.
http://slidepdf.com/reader/full/the-trauma-of-post-communism-pcee-50-1999-piotr-sztompka 18/74
16
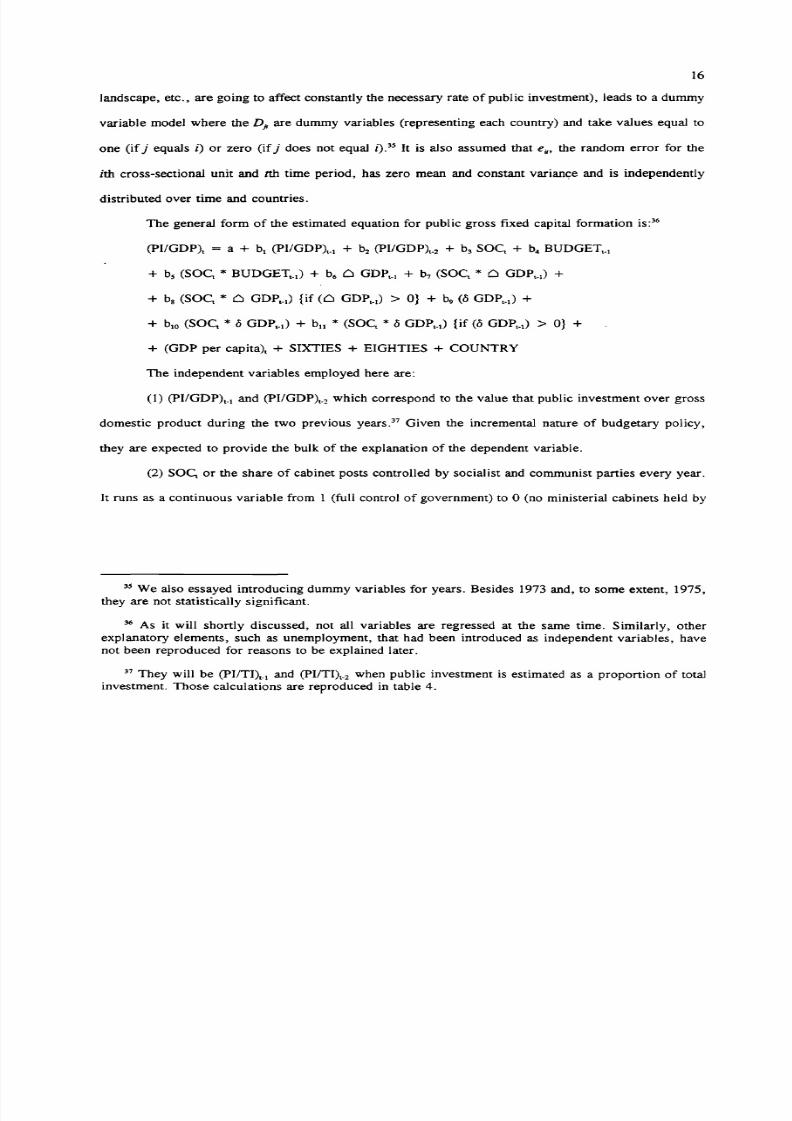
landscape, etc., are going to affect constantly the necessary rate of public investment), leads to a dummy
variable model where the D jt are dummy variables (representing each country) and take values equal to
one (if j equals i) or zero (if j does not equal i).35 It is also assumed that e., the random error for the
ith cross-sectional unit and tth time period, has zero mean and constant variance and is independently
distributed over time and countries.
The general form of the estimated equation for public gross fixed capital formation is:"
+ (GOP per capita), + SIXTIES + EIGHTIES + COUNTRY
The independent variables employed here are:
(1) (pIIGDP)H and (pIIGOP)'.2 which correspond to the value that public investment over gross
domestic product during the two previous years." Given the incremental nature of budgetary policy,
they are expected to provide the bulk of the explanation of the dependent variable.
(2) SOc, or the share of cabinet posts controlled by socialist and communist parties every year.
It runs as a continuous variable from 1 (full control of government) to 0 (no ministerial cabinets held by
35 We also essayed introducing dummy variables for years. Besides 1973 and, to some extent, 1975,they are not statistically significant.
36 As it will shortly discussed, not all variables are regressed at the same time. Similarly, other
explanatory elements, such as unemployment, that had been introduced as independent variables, have
not been reproduced for reasons to be explained later.
37 They will be (PIITI)H and (PIITI)'_2 when public investment is estimated as a proportion of total
investment. Those calculations are reproduced in table 4.
8/4/2019 The Trauma of Post-Communism (PCEE 50, 1999) Piotr Sztompka.
http://slidepdf.com/reader/full/the-trauma-of-post-communism-pcee-50-1999-piotr-sztompka 19/74
1 7
those parties in that given year). 38
(3) BUDGETt~ l (or net lending) is the stance of the budget as a percentage of GDP in the previous
year since any government will be naturally constrained by the financial position of the budget in shaping
the following annual budget. Generally speaking, we should expect that the healthier the budget, the less
constrained the government will be to increase spend ing (and publ ic spending). On the contrary, if there
is a deficit, the government will be likely to reduce expenditure and cut public investment. 39
(4) Since it is possible that, as budget surpluses grow larger, socialists may be tempted to increase
public investment at rates higher than what they would if the fiscal stance were tight (this is, at rates
higher than what is shown by the slope coefficient of the independent variable that measures Social lst
control of government), we have introduced an interactive term that multiplies socialist control of
government by the stance of the budget in the previous year: SO~ * . BUDGETt - 1 . Notice that, given the
operationalization of the variable of governmental control, different sizes in the budget stance have no
different effect when there is a conservative government (SO~ = 0).
(5) 0 GDP t.1 or the rate of change in real GDP in the previous year is likely to shape the
governmental short-term response on the adequate levels of investment in two alternative ways. On the
one hand, if the government follows a p r o - c y c l i c a l economic policy, whenever there is an economic boom
(economic crisis), it might boost (or cut) revenues and thus increase (reduce) the room for investment.
In this case, the coefficient of the parameter will be positive. On the other hand, the government may
systematically adopt a counter-cyclical stance towards the economy - whenever there are weak growth
38 It has been reduced to this interval in order to facilitate its use in building several interactive
variables.
39 As a matter of fact, public investment is likely to be that area of public expenditure that can be
more easily cut whenever public deficits arise. On the contrary, public consumption and social transfers
operate in the budget mostly as entitlements and will only be modified marginally because the strength
of the social consensus that grounds the welfare state imposes extraordinary political costs on any
g ov er nm e n t a tte m p tin g to alter them in a subs tan tia l w ay .
8/4/2019 The Trauma of Post-Communism (PCEE 50, 1999) Piotr Sztompka.
http://slidepdf.com/reader/full/the-trauma-of-post-communism-pcee-50-1999-piotr-sztompka 20/74
18
rates, the government responds by boosting public capital formation; as the economy recovers, the
governments cuts its investment rate to restore a long-term equilibrium rate of public capital formation.
If that were true, the coefficient should be negative.
(6) The governmental response to the business cycle may be mediated by the ideological
alignment of the party in power. In other words, the decision to boost or reduce public investment does
not eventually depend on the situation of the economy but on the response that, according to its partisan
preferences, each government understands to be better. Therefore, for example, and contrary to the
previous hypothesis (paragraph (5», in a situation of economic depression, conservative parties may
decide to curtail public investment (or at least increase them minimally) both to avoid crowding out
private investment and to balance the budget. The left, instead, might decide to incur in higher capital
spending to overcome the economic downturn. To model different political responses, we have adopted
two strategies:
(a) First, we have created an interactive term combining socialist control of power and growth
rates (SO~ * Cl GDPt•1). Here, a positive coefficient would imply that whenever growth rates are
positive (negative), a socialist government expands (reduces) public capital formation at a pace faster than
any conservative government. Were the coefficient negative, the relation would be precisely the inverse
(although the Left still would outpace the Right in its response): a socialist cabinet would increase
(reduce) capital spending to respond to worsening (improving) economic conditions. In all cases, this
interactive terms tends to assign to non-socialist governments a neutral, passive position; the level of
public investment depends solely on the performance of the economy (or in past levels of public
investment) but not in governmental decisions depending on the economic cycle. To understand how
conservative governments behave we should look at the size and statistical significance of the coefficients
of other parameters and how they compared to our interactive terms.
(b) A second interactive term multiplies socialist tenure of government by growth rate if and only
8/4/2019 The Trauma of Post-Communism (PCEE 50, 1999) Piotr Sztompka.
http://slidepdf.com/reader/full/the-trauma-of-post-communism-pcee-50-1999-piotr-sztompka 21/74
19
if the latter is positive «SO~ * 0 GOPt_l) {if (0 GOPt_l) > O D - In this case, we assume that a socialist
cabinet only responds to positive growth rates. Therefore, if the coefficient of the parameter is positive,
this result should be interpreted in the following way: with high growth rates, a socialist cabinet spends
more than a conservative government; confronted, however, with an economic crisis, the former does
not reduce capital spending more than the latter.
(7) The level of public investment is also regressed on the change experienced by the growth rate
between the year t-2 and the year t-1 (this is, the growth rate at t-I minus the growth rate at t-2) (this
variable was represented by 0 GOPt_I). This indicator is assumed to reproduce the most reliable
information policy-makers have on the potential growth trend in the future which they may use to shape
the budget for the following year (year t). A negative coefficient implies that all governments act in a
counter-cyclical pattern, boosting capital spending when the economy has slowed down, and cutting it
otherwise. If the coefficient is positive, governments follow pro-cyclical policies always.
(8) (0 GOPt_l) is also modified through an interactive terms to identify different political response
to similar economic differences:
(a) (SO~ * 0 GOPt-I) should be interpreted in the following fashion. A negative coefficient would
mean that socialists behave as Keynesian policy-makers and engage in counter-cyclical policies; this is,
as the economy slows down, they decide to boost public investment. If it were positive instead, we should
conclude that leftist cabinets adopt a pro-cyclical stance. Again, this interactive terms does not capture
the specific response of conservative governments.
(b) «SOCt * 0 GOPt_l) {if (0 GOPt_l) > O}) . This interactive term is built under the assumption
that the socialist response (in relation to public investment) only differs from the conservative one when
the economy accelerates (i.e. GOPt_2 < GOPt_I). Otherwise (this is, whenever the growth rate either
remains equal or falls), it is assumed that both kinds of government behave identically (in the way
determined by the coefficients of other variables). Now, we should interpret the sign of the interactive
8/4/2019 The Trauma of Post-Communism (PCEE 50, 1999) Piotr Sztompka.
http://slidepdf.com/reader/full/the-trauma-of-post-communism-pcee-50-1999-piotr-sztompka 22/74
20
term in the following fashion: if it is positive, it means that the socialist government takes advantage of
better economic conditions (and a reduced structural public deficit), to invest; if it is negative, it shows
that socialist government are behaving in a counter-cyclical fashion, i.e. reducing the level of public
investment that was probably expanded to compensate for a past economic downturn.
(9) We introduce gross domestic product per capita as a proxy to control for levels of
development and the structural need to deploy infrastructures.
(10) Variation in economic policies has taken place not only across nations but over time as well.
Two oil shocks (in 1973 and 1979) divide what the standard literature calls the Golden Age of postwar
consensus (until 1973) from the next period of economic expansion (1982-1992). Many consider each
period to be characterized by a particular set of problems and policies that have uniformly affected the
role of the state as a coordinator of the economy and a supplier of fixed capital across nations. This is,
the sixties are portrayed as a period of light demand management and strong public intervention to
accelerate growth whereas the eighties are taken to be a time of deflationary policies and retreating
governments. In order to control for such 'period effects' we introduce two dummies: one for the period
1960-1973 and the other for 1982-1990.
Results are showed in tables 4 and 5. In table 4 we report a panel data analysis on public
investment as a proportion of gross domestic product. In table 5 we reproduce the results of the panel
data regressed on public investment as a proportion of total investment.
[fables 4 and 5 here]
In tables 4 and 5 we show five possible explanatory models of public investment levels. In all of
them we introduce control variables for economic development and period effects because, although
variation in public investment has remained sizable across nations and governments, there has been a
general fall in average levels of public investment across all nations. Except for column 4, results are
very similar in tables 4 and 5. Here we will discuss table 4.
8/4/2019 The Trauma of Post-Communism (PCEE 50, 1999) Piotr Sztompka.
http://slidepdf.com/reader/full/the-trauma-of-post-communism-pcee-50-1999-piotr-sztompka 23/74
21
In all cases, economic development actually reduces the investment effort. The effect is, however,
mild. Adding $ 1,000 to every per capita income shrinks public capital formation by 0.06 points of GOP.
Controlling for all other variables, any given country with per capita income of $ 5,000 and public
investment equal to 4 per cent of GOP (or $ 200 per capita), that doubles its per capita income to $
10,000 should see its public rate investment rate drop to 3.75 per cent ($ 375 per capita, still much higher
than before in absolute terms).
In column (1) we display a model in which public investment is explained by lagged public
investment and socialist tenure of power. Lagged investment explains the bulk of the variation.
Nonetheless, socialist control of power is significant. Full control of government by the left during one
year adds over 0.1 points of GOP to public investment."
Column (2) controls partisan effects for the stance of the budget, alone and in the interactive
term. Partisan tenure has a somewhat stronger effect. No matter which party is in office, a balance
surplus (deficit) contributes to boost (shrink) the level of public investment - each point of the budget
stance changes public investment by 0.025 points of GOP. Thus we should expect public investment to
be a whole point of GOP lower in a country with a public deficit of 4 per cent of GOP. A surplus of the
same size, instead, adds 1 point of GOP to the level of public investment.
Columns (3), (4) and (5) control, instead, for the performance of the economy on public
investment rates." As shown in column (3), the rate of growth partially affects the level of public
investment. While the impact of partisanship remains unaltered, each percentage point of the growth rate
adds 0.18 points to the level of public investment. Thus, other things being equal, the proportion of
40 The result is in fact rather consistent with the results obtained in the cross-national analysis in tables
I to 3, which show that for periods of a decade, full socialist control increases public investment over
I point of GOP.
41 When net lending and growth rates are regressed jointly, their t-statistics drop showing a
multicollinearity problem. I do not reproduce these results.
8/4/2019 The Trauma of Post-Communism (PCEE 50, 1999) Piotr Sztompka.
http://slidepdf.com/reader/full/the-trauma-of-post-communism-pcee-50-1999-piotr-sztompka 24/74
22
public investment (over GOP) in a country enjoying a real growth rate of 5 per cent should be almost 0.1
points of GOP higher than in a country with no real growth at all. Similarly, column 3 shows that all
governments are slightly 'counter-cyclical' in their reactions: as soon as the rate of growth seems to decay
(i.e GOPt-I < GOPt_2), the level of public investment is increased (0.013 points of GOP for each point
the growth rate changes).
Columns (4) and (5) introduce interactive terms to measure the extent to which the response to
different economic situations is determined by the nature of the party in office. In both cases, the variable
SOCr loses all significance. The effect of partisanship reappears, however, in the interactive terms. The
first interactive parameters (whose theoretical grounding is explained above, in paragraph (6)), (socialist
control * real change in GOP) and (socialist control * real positive change in GOP), give way to very
similar coefficients: 0.038 in column (4) and 0.040 in column (5). This should be expected given the few
number of cases in which the gross domestic product has actually shrunk in real terms. At the same time,
once they are introduced, the statistical significance of the variable controlling for growth rate alone
wanes. The result shows that, although subject to the constraint imposed by the performance of the
economy, the public investment effort continues to depend notoriously on the party in power. Thus, with
the economy growing at 3 per cent, a socialist government increases the level of public gross fixed capital
formation by 0.120 points of GOP (or 0.141 if we include the coefficient for real change in GOP
alone);" however, if, for example, the rate growth is only 1 per cent, the investment effort only
increases 0.047 points of GOP.
The second couple of interactive terms (explained in paragraph (7) above), (socialist control *
difference in growth rates) and (socialist control * positive difference in growth rates) are -0.026 and -
0.047 respectively. Their negative sign implies that, in general terms, a socialist cabinet responds to
42 Notice that this rate growth is the average one in OECO countries and that the corresponding
in ve stm e nt e ffo rt is s im ila r to th e o ne in c olu m ns (1 ) to ( 3) in ta ble 4 fo r th e v ar ia ble 's oc ia lis t c on tr ol'.
8/4/2019 The Trauma of Post-Communism (PCEE 50, 1999) Piotr Sztompka.
http://slidepdf.com/reader/full/the-trauma-of-post-communism-pcee-50-1999-piotr-sztompka 25/74
23
accelerating growth by cutting public investment. According to the first parameter (in column 4) the
inverse is also true: as growth rates decline, socialist governments boost public investment. Nonetheless,
it should be noticed that the second coefficient (-0.047) is stronger than the first from a statistical point
of view. This means that, as the economy improves (let us say from growing 1 per cent to growing 3 per
cent), a socialist cabinet tends to cut public investment slightly (in this hypothetical case by almost 0.1
points of GDP). As the economy worsens, however, the coefficient in column (5) implies that the socialist
cabinet abstains from taking any measure to expand public investment. Thus, there is no evidence that,
generally speaking, leftist governments employ public investment as a demand management device to
stabilize economic downturns.
According to the models developed in table 4, public investment decisions appear determined by
a complex web of factors that include the past history of public investment, the level of development of
each country, the strength of the economy and the direction in which it is moving and, eventually, the
partisan preferences of the government in office. In order to disentangle which factor has the strongest
impact on public investment, we proceed to simulate several scenarios - all displayed in graphs 1A to 1C.
All estimates are based on the equation reproduced in column 5 in table 4.43
[Graphs lA to 1C here]
Each graph shows a different GDP growth rate at time t-2 (i.e. two years before the budget year
in which specific public investment allocations are made): 5 per cent in graph lA, 3 per cent in graph
43Notice, however, that in these simulations we have only used part of the variables regressed on
public investment. We have excluded the lagged behavior of public investment, per capita income, the
period effects and all dummies. As a result, all the simulated results on public investment decisions are
positive. Those positive results are, in fact, countered by a historical trend towards less public investment
- a trend captured by the coefficients of lagged public investment (pIIGDPt.! and PIIGDPt_~ and by the
coefficient of the variable 'per capita income'. For example, a country with public investment initially
at 3 per cent and an average per capita income of $ 10,000, and no new public investment decided by
the government (i.e. in case the variables of partisanship and economic performance lead to no increase
in public investment), would experience an absolute fall in its level of public investment around 0.1-0.2
percentage points of GDP (from 3 to 2.9-2.8 per cent).
8/4/2019 The Trauma of Post-Communism (PCEE 50, 1999) Piotr Sztompka.
http://slidepdf.com/reader/full/the-trauma-of-post-communism-pcee-50-1999-piotr-sztompka 26/74
24
1B, 1 per cent in graph lC. In the horizontal axis, the graph shows the GDP growth rate at time t-l , The
vertical measures the increase in public investment in points of GDP. As it is readily clear, partisanship
has the strongest effect on the evolution of investment. Conservative governments hardly change the
levels of public investment (even under the most favorable conditions, public investmentdoes not increase
beyond 0.04 points of GDP). Over time, given the effect of lagged investment and the negative impact
of increasing per capita income, public investment quickly declines in real terms under a prolonged
conservative administration. The control of government by the Left implies, instead, growing levels of
public fixed capital formation. After the economy grows at 5 per cent for two years, a socialist
government increases public investment by 0.25 points of GDP (the conservative administration less than
0.05 points); if, for example, the same pace of economic growth persists during four years, a socialist
government will increase public capital formation by a whole point of GDP - whereas a conservative
administration would increase public investment barely 0.15 points of GDP. Now, if the economy has
grown at 3 per cent, the increase under a socialist government equals over 0.15 points of GDP; with
growth at 1 per cent, the increase is only of 0.07 points. In short, the performance of the economy
behaves as a powerful constraint on the investment policies of the Left. These simulations also make
possible to ascertain the effect of accelerating (or decelerating) rates of growth. In a situation of continued
improvement in the economy, a socialist cabinet tends to cut public investment and a conservative
government to increase it - but, in both cases, only marginally. More importantly, in cases in which the
economybegins to falter, the governmental effort in investment declines steeply - there are hardly signs
that any administration wishes to run any debt to maintain public investment. In other words, all
governments end up adjusting to the performance of the economy. Although public investment might be
used for demand management goals, the actual level of public investment mainly reflects a fundamental
choice on the supply-side role of governments and markets.
Our inquiry through both a simple cross-national analysis for different historical periods and panel
8/4/2019 The Trauma of Post-Communism (PCEE 50, 1999) Piotr Sztompka.
http://slidepdf.com/reader/full/the-trauma-of-post-communism-pcee-50-1999-piotr-sztompka 27/74
25
regressions leads to two main conclusions. First, partisan tenure of power plays a key role on the size
of public capital spending. A decade of socialist government means more than a whole point of GDP in
public investment. Before the stagflation period, and corresponding to the hegemony of socialist parties
mainly in Scandinavian countries, high state investment appeared under corporatist arrangements - there
social democratic government acted according to their partisan preferences and employed these schemes
to lure unions into wage restraint. After the seventies, however, as several socialist governments were
established in the Mediterranean area, they too engaged in strong investment policies, without any
pressure from organized labor."
Second, the decision to engage the state in the supply of gross fixed capital is mostly done based
on supply-side policy considerations. This is, even though the level of public investment may be boosted
by the left in response to an economic crisis (our evidence is less than convincing), in the medium run
public investment is conditional on balanced budgets and reasonable growth rates. The left seems to prefer
sacrificing counter-cyclical policies to a longer-term objective of increasing the state intervention in
investment. A leftist strategy based on 'spending its way out of the crisis' may occasionally happen (as
it indeed took place in several countries, mildly in the sixties, more dramatically in the late seventies, cf.
Hall 1986, Scharpf 1991) - still, its appears to be exceptional. More public investment should be actually
expected from social democratic governments after the finances of the state have been balanced (either
through higher taxes or as a consequence of an improved business cycle). Otherwise, the left seems to
risk higher deficits in exchange for an uncertain temporary boost in consumption without actually being
capable of achieving its goal of transforming the domestic political economy. In short, long-term
44 Higher public investment rates do not take place merely as a result of a generalized strategy of
higher spending pursued by socialist governments. When we regress government outlays (as a percentage
of GDP) on public investment (as a percentage of GDP), to check the extent to which they are correlated,
the r-squared is less than 0.10 for all three decades. This points, in the first place to the fact that socialist
parties consciously target public investment to develop their most preferred economic strategy. It also
accords well, in the second place, with the current theoretical literature not finding a clear relationship
b etw een o vera ll siz e o f g ov ern m en t a nd so cia lis t p artie s.
8/4/2019 The Trauma of Post-Communism (PCEE 50, 1999) Piotr Sztompka.
http://slidepdf.com/reader/full/the-trauma-of-post-communism-pcee-50-1999-piotr-sztompka 28/74
26
economic growth, allocated in a redistributive manner, goes prior to short-term ~emand management.
Human Capital Formation
In order to examine the role of the state in supplying human capital, we develop two indicators:
(1) public current expenditure on education as a percentage of GOP, controlling for the demographic
structure of each country; (2) the volume of public expenditure directed to active labor market policies.
P u blic expen ditu re on edu ca tion
Like in the cross-national analysis of public gross fixed capital formation, we examine current
public expenditure on education as a proportion of GOP at the end of each of three economic periods or
business cycles we have distinguished." Hence, we present and analyze estimates for 1970, 1979-80 and
1988-89. A lack of complete and consistent data series on public expenditure on education makes it
impossible to reproduce the cross-temporal cross-national analysis presented above for public gross fixed
cap ital formation. 46
To control for the demographic structure of each country, which has a fundamental impact on
the level of expenses, we estimate the 'public effort' in education as a proportion of the population under
twenty years. Thus, for example, in 1980 Ireland spent 6.3 per cent and Italy 5.1 per cent of their GDP
in education respectively. However, given that the Irish population under twenty was 40.7 per cent of
all population while the Italian proportion was 31.2 per cent, the index employed turns out to be almost
the same for both cases. Both countries spent around 0.15 points of GOP in education in 1980 for each
45 Capital spending is excluded because it already appears in the estimates of fixed capital formation.
46 Data are taken from the Statistical Yearbooks published by UNESCO. Except for the last years,
the data reproduced by UNESCO correspond to specific years (1950, 1955, 1960, 1970, 1975, etc.). Data
series published by the OECO (1988) are not complete across countries, do not report the late eighties,
and are unclear, in some cases, about the distinction between private, public, capital and current
expenditure.
8/4/2019 The Trauma of Post-Communism (PCEE 50, 1999) Piotr Sztompka.
http://slidepdf.com/reader/full/the-trauma-of-post-communism-pcee-50-1999-piotr-sztompka 29/74
27
I per cent of the population under twenty years.
National averages of public effort in education have been regressed on the levels of socialist
control of government in the corresponding previous decade." Results are reproduced in tables 6 to 8.
[fables 6 to 8 here]
Partisan control performs particularly well for the sixties. More than 40 per cent of the variation
of the public effort in education in 1970 is explained by the partisan nature of the government. According
to our results, full control of the cabinet by the socialist party implies 0.135 points of GOP spent in
education for each point of population under 20 years (column 1, table 6). Thus, for example, two
countries with a similar proportion of young population (30 per cent) but governed by distinct partisan
coalitions, would differ strikingly in education effort: the first country, under a non-socialist
administration, would spend 3.66 per cent of GOP (the constant term * 30 per cent of the population) -
approximately the German case in 1970; the other nation, governed by socialdemocrats, would spend 7.71
per cent of its GOP -Sweden in 1970. The impact of partisanship remains stable when we introduce a
measure of the proportion of active population employed in agriculture in 1965 (column 2). This variable,
which controls for the level of economic development, seems particularly appropriate here to control for
the level of demand of education: the population engaged in agricultural tasks seems less prone to both
need and participate in the educational system." Like in the case of fixed investment, the presence of
corporatist structures (strongly correlated with socialist tenure of power in the sixties and seventies) is
a strong predictor of the level of public effort in education in 1970 (columns 2 to 4, table 6). Again,
47 The period of socialist government differs only slightly from the periods used in the past section
on fixed investment. All differences are due to small changes in the year of the dependent variable (1970
v. 1969-72, 1988-89 v. 1988-90). Using the same periods of time (to estimate socialist tenure of
government) as in the section on physical capital does not affect the statistical results.
48 We have not used here per capita income to control for economic development because its level
appears to be in turn strongly affected by the volume of the expenditure in education (cf. all endogenous
g ro w th m o d e ls ) .
8/4/2019 The Trauma of Post-Communism (PCEE 50, 1999) Piotr Sztompka.
http://slidepdf.com/reader/full/the-trauma-of-post-communism-pcee-50-1999-piotr-sztompka 30/74
28
when partisan control of government and corporatism are regressed jointly, they lose their statistical
significance (column 5, table 6).
The success of partisanship in explaining the level of public effort in education diminishes over
time - both in size and in statistical significance. Partisanship alone explains only 22 per cent of the
variance in the public education effort in 1979-80. Moreover, compared with the sixties, the impact of
the left was less important - around 0.09 points in the seventies. Corporatism instead plays a much
stronger role. Corporatism alone explains 40 per cent of the variation in 1979-80 (column 3, table 7).
The difference between a fully corporatist country and a non-corporatist country amounts to 0.102 points
of 'public effort' or, for countries with 30 per cent of their population under 20, over 3 points of GOP.
In the eighties, partisan tenure of power does not explain, at least alone, any of the variance in
the 'public effort' in education (column 1, table 8 (A)). When we control for the size of the primary
sector, socialist tenure of power gets to playa stronger, though still minor, role: the coefficient is almost
0.07 and it is statistically significant at p > .10 (column 2, table 8 (A)). On the contrary, corporatist
institutions keep explaining strongly the level of public education effort. Like in previous decades, they
add close to 0.1 points orGO}> in public expenditure in education for each percentage point of population
under twenty (columns 3 to 5, table 8 (A)). The lasting impact of corporatism goes actually hand in hand
with the fact that the average public effort in education has been very stable within each country in the
last decades. The public effort indexes for 1970, 1979-80 and 1988-89 are all strongly correlated (the
Pearson's correlation coefficient is over .80 in all cases).
Still, although partisanship has a minor or no explanatory power when it is regressed on the level
of public expenditure in education in the late eighties, it performs as a key variable to understand the
change in the public effort in education after the stagflation period." In table 8 (B), we show several
49 Regressions on the relative change of public effort in education during the seventies show no effect
o f p artisan sh ip . Th e resu lts h av e n ot b een rep ro du ced h ere.
8/4/2019 The Trauma of Post-Communism (PCEE 50, 1999) Piotr Sztompka.
http://slidepdf.com/reader/full/the-trauma-of-post-communism-pcee-50-1999-piotr-sztompka 31/74
29
equations regressed on the relative change in the 'public effort in education' from 1979-80 to 1988-89.
In all cases, the socialist control of government is a significant variable from a statistical point of view.
In the simplest equation (column 1), full control of the government by a socialist party leads to the
expansion of the level of 'public effort' in education by a 40 or 50 per cent in less than ten years. In
other words, a public effort of 0.10 points in 1980 should reach 0.15 point in 1989 under a continuous
socialist administration, all other things being equal. The effect of partisanship remains constant after we
extend the first model to include regressors measuring the initial level of public effort in education (in
1980), the proportion of population employed in the primary sector and the presence of corporatist
institutions (columns 2 to 4). It should be noticed that the initial level of expenditure and the partisan sign
of government jointly explain close to 50 per cent of the variance. Now, very simple calculations based
on the model presented in column 2 leave no doubt about the sizable impact of partisanship. Depending
on the party in government, three different countries with an initial level (in 1980) of public effort in
education of 0.10, 0.20 and 0.30 respectively perform in rather disparate ways. Ten years later, and
under a socialist government, their corresponding levels would be 0.17, 0.28 and 0.33. Under a non-
socialist government, they would be 0.13, 0.20 and 0.21 instead. Even though the initial level of
expenditure has a substantial impact on its subsequent evolution, partisanship operates as a key factor in
the composition of public expenditure in education - in the same way it did in the sixties.
All these results can be reconciled with the estimates for the eighties in table 8 (A) in the
following way. Which party controls office does affect the dynamics of public expenditure on human
capital. Partisanship, however, is, in the first place, mediated by the initial amount directed towards
public education, and, in the second place, requires a sustained control of government to be visible.
Public expenditure in education is mainly guided by domestic needs of a structural kind, which are
captured in the equations by the constant term and the parameter of public effort in education in 1980.
Both under socialist and conservative governments, the proportion of public money employed in education
8/4/2019 The Trauma of Post-Communism (PCEE 50, 1999) Piotr Sztompka.
http://slidepdf.com/reader/full/the-trauma-of-post-communism-pcee-50-1999-piotr-sztompka 32/74
30
increased whenever the index 'public effort' was below 0.20 points effort' in 1980 - in fact, the lower
the initial level, the faster it rose. Still, under a socialist government, it tended to rise more swiftly. Now,
when the initial expenditure in education (in 1980) was approximately over the OECD mean, the public
effort in education tended to remain stable or even to decline (in the eighties) when the socialist party had
control over the cabinet less than half the time (or controlled less than 50 per cent of its posts). Since the
lack of durable one-party cabinets is the most common condition in contemporary industrial democracies,
the level of public expenditure in education could not but rise slowly in most cases. To sum up, deep
structural traits seem to affect decisively the sources of human capital formation, but, again, there are
good reasons to bel ieve that, in the long run, parties still appear capable of transforming the conditions
of departure.
Active manpower policies
Moving beyond traditional income maintenance programs for jobless people, industrialized
countries have progressively introduced active manpower policies to retrain directly the unemployed or
to subsidize apprenticeship and other vocational schemes. Systematic measures on manpower policies have
been gathered only lately. The OECD provides an almost complete battery of data since 1985 including
strict labor market training measures, subsidized employment and measures for the disabled."
We have regressed the battery of independent variables on two sets of data: first, on public
expenditure in manpower policies as a proportion of GDP in the mid eighties;" second, on the relative
change in public expenditure in manpower policies from 1985 to 1990. The results are reproduced in
tables 9 and to.
[fables 9 and 10]
s o Data are taken from OECD Employment Outlook (several numbers).
51 Th e da ta co rre sp on d to 1 985 • excep t fo r Ita ly , fo r w h ich 1 986 is th e f irs t y e ar rep or ted .

8/4/2019 The Trauma of Post-Communism (PCEE 50, 1999) Piotr Sztompka.
http://slidepdf.com/reader/full/the-trauma-of-post-communism-pcee-50-1999-piotr-sztompka 33/74
8/4/2019 The Trauma of Post-Communism (PCEE 50, 1999) Piotr Sztompka.
http://slidepdf.com/reader/full/the-trauma-of-post-communism-pcee-50-1999-piotr-sztompka 34/74
32
1.60 and 2.07 per cent under a socialist government. Under a non-socialist cabinet, the outcomes would
have been 0.50, 0.97, 1.41 and 1.81 per cent. The effect of partisanship is sizable and only tends to be
countered by the initial level of expenditure when the latter is higher than 2 per cent of GDP -only the
Swedish case is close to this situation.
The examination of human capital formation tends to confirm the results we reached above on
fixed capital formation. The existence of corporatist settings jointly with leftist cabinets seems to provide
for the bulk of the explanation of the levels of public supply of human capital, at least through the late
seventies. There the government engaged in strong education and manpower policies to achieve full
employment and induce wage restraint among the labor movement. Partisan agency counted - it did,
though, embedded in the particular political and economic regime that ensued from small, open
economies. Nevertheless, in the eighties, as new leftist governments emerged in Southern European
medium-size economies, they actively expanded public education and vocational training schemes. Still,
corporatist frameworks seemed to maintain previous levels of human capital formation even in those
countries in which the hegemony of socialist parties started to erode.
Tax Policy
Accord ing to the main purpose of the paper, we focus on those elements of the tax structure that
may have an impact on the behavior of economic agents, particularly in their saving (and investing)
decisions. S3 54 To this end, we examine the evolution of personal income taxation. Low tax rates should
53 In other words, we are primarily concerned with the economic effects that the design of differenttax systems may have in the allocation of input factors - e.g. how substituting a flat tax rate system for
a progressive tax structure may be an appropriate strategy to free high levels of private savings and thus
boost private investment. The choice of the tax systems also involves resolving questions about its equity
dimension - i.e to what extent policy-makers choose to redistribute income. As a matter of fact, both the
efficiency and equity dimensions cannot be easily extricated one from the other - so that, for example,
highly progressive systems are likely to channel savings into the public purse and have strong
redistributive effects at the same time. Still, our analysis is only subsidiarily concerned with taxes as
instruments of income redistribution. As the specialized literature has generally stressed, the extent to
8/4/2019 The Trauma of Post-Communism (PCEE 50, 1999) Piotr Sztompka.
http://slidepdf.com/reader/full/the-trauma-of-post-communism-pcee-50-1999-piotr-sztompka 35/74
3 3
be expected from conservative governments, which that claim that a better economic performance would
take place by leaving all allocation decisions to private agents and minimizing any distortion on the
working of markets - in particular, they will introduce low tax rates on higher incomes in order to reduce
adverse effects on labor supply, savings and investment. Leftist governments, instead, will impose high
taxes (especially on higher incomes) to finance their interventionist policies."
To determine the nature of (personal income) taxation policy we have conducted, for each of the
twenty-one countries in our sample, first in the late seventies, and then in the late eighties, the following
estimations. For each case we have calculated the effective amount that had to be paid (after all
allowances are deducted and the corresponding tax rate is applied) at two different income levels: first,
for an income equal to five times the wage of the 'average production worker' (APW) (as defined by the
OECD); second, for anyone earning ten times the APW wage."
In order to test the model, we first regress the effective tax rates for incomes five times and ten
which the state affects the redistribution of income depends on social transfers and public expenditure
rather than on the structure of taxes.
54 See Peters (1991) and Steinmo (1993) for reviews of the models offered to explain cross-national
differences in the size of tax revenues as well as in its characteristics.
5S Another reason, chiefly historical, also justifies examining personal income taxation. During the
postwar period, personal income taxation turned out to be the fastest rising tax throughout the stagflation
period. In all OECD countries, revenues from income taxation went up from 9 per cent of GDP in 1960
to 14 per cent in 1980. Social security contributions, driven by climbing social transfers, rose from 4 to
8 per cent of GDP in the same period. Instead, taxes on goods and services hardly changed: they
amounted to 9 per cent of GDP in 1960 and 10.3 per cent in 1980. After the economic turmoil of the
seventies, the personal income tax has been the tax to endure the most significant changes - it has been
formally indexed to prevent fiscal drag, tax rates have been reduced in most countries, the number of taxbrackets has been cut and there have been substantial efforts to broaden the tax base. Historical and
analytical reviews of the process of tax reform in OECD countries since the late eighties can be found
in Cnossen and Bird (eds.) (1990), Hageman, Jones and Montador (1988), OECD (1989, 1990), Pechman
(ed.) (1987).
56 Since the late seventies, the OECD reports the income of the 'average production worker' and the
effective tax to be paid for a single worker and for a worker with two children. We have just estimated
t h e c a s e o f a s i n g l e w o rk er .
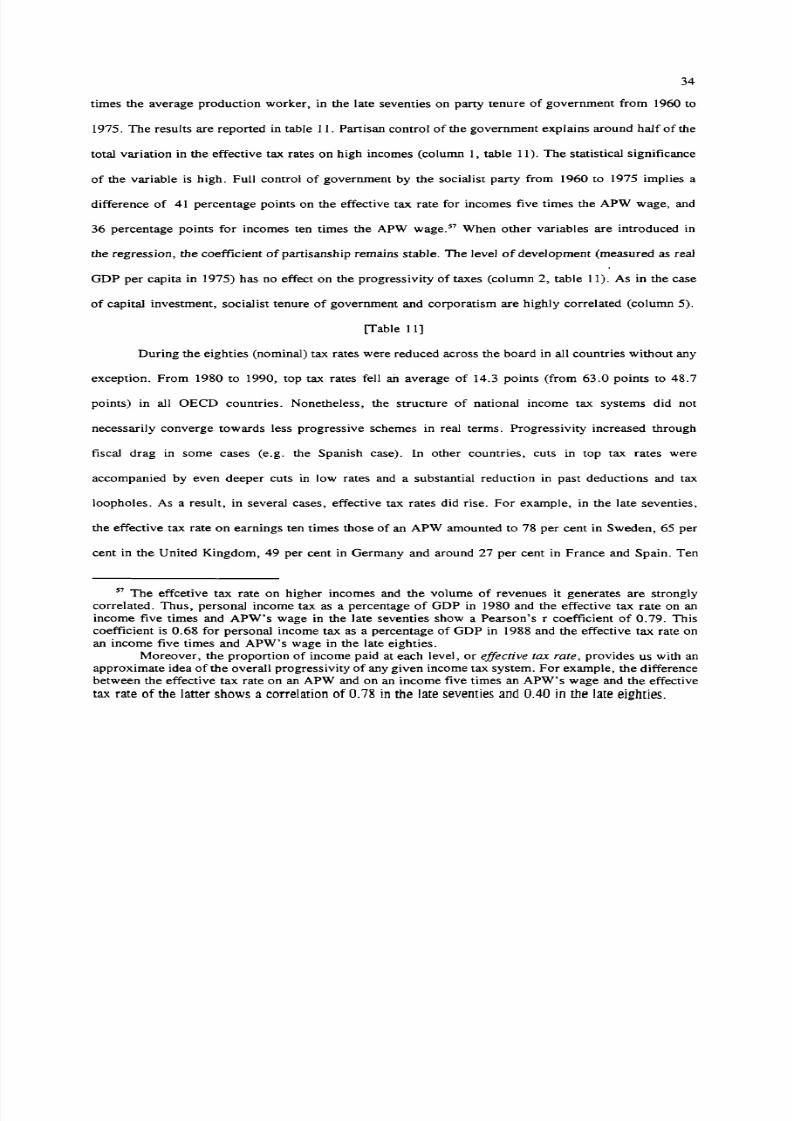
8/4/2019 The Trauma of Post-Communism (PCEE 50, 1999) Piotr Sztompka.
http://slidepdf.com/reader/full/the-trauma-of-post-communism-pcee-50-1999-piotr-sztompka 36/74
34
times the average production worker, in the late seventies on party tenure of government from 1960 to
1975. The results are reported in table 11. Partisan control of the government explains around half of the
total variation in the effective tax rates on high incomes (column 1, table 11). The statistical significance
of the variable is high. Full control of government by the socialist party from 1960 to 1975 implies a
difference of 41 percentage points on the effective tax. rate for incomes five times the APW wage, and
36 percentage points for incomes ten times the APW wage." When other variables are introduced in
the regression, the coefficient of partisanship remains stable. The level of development (measured as real
GDP per capita in 1975) has no effect on the progressivity of taxes (column 2, table 11). As in the case
of capital investment, socialist tenure of government and corporatism are highly correlated (column 5).
[fable 11]
During the eighties (nominal) tax rates were reduced across the board in all countries without any
exception. From 1980 to 1990, top tax rates fell a n average of 14.3 points (from 63.0 points to 48.7
points) in all OECD countries. Nonetheless, the structure of national income tax systems did not
necessarily converge towards less progressive schemes in real terms. Progressivity increased through
fiscal drag in some cases (e.g. the Spanish case). In other countries, cuts in top tax rates were
accompanied by even deeper cuts in low rates and a substantial reduction in past deductions and tax
loopholes. As a result, in several cases, effective tax rates did rise. For example, in the late seventies,
the effective tax rate on earnings ten times those of an APW amounted to 78 per cent in Sweden, 65 per
cent in the United Kingdom, 49 per cent in Germany and around 27 per cent in France and Spain. Ten
57 The effcetive tax. rate on higher incomes and the volume of revenues it generates are stronglycorrelated. Thus, personal income tax as a percentage of GDP in 1980 and the effective tax rate on an
income five times and APW's wage in the late seventies show a Pearson's r coefficient of 0.79. This
coefficient is 0.68 for personal income tax as a percentage of GDP in 1988 and the effective tax rate on
an income five times and APW's wage in the late eighties.
Moreover, the proportion of income paid at each level, or effective tax rate, provides us with an
approximate idea of the overall progressivity of any given income tax system. For example, the difference
between the effective tax rate on an APW and on an income five times an APW's wage and the effective
tax ra te o f th e la tte r sh ow s a co rre la tio n o f 0 .78 in th e la te sev en tie s and 0 .4 0 in th e la te e ig h tie s .
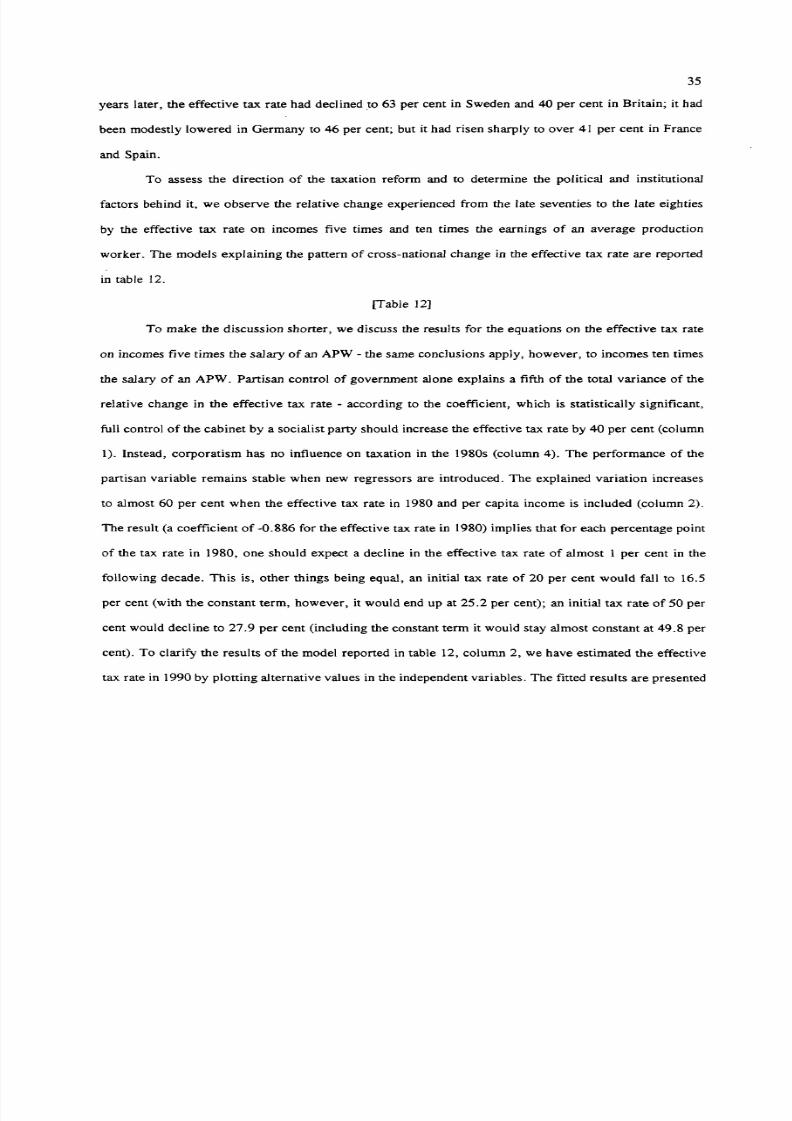
8/4/2019 The Trauma of Post-Communism (PCEE 50, 1999) Piotr Sztompka.
http://slidepdf.com/reader/full/the-trauma-of-post-communism-pcee-50-1999-piotr-sztompka 37/74
35
years later, the effective tax rate had decl ined to 63 per cent in Sweden and 40 per cent in Britain; it had
been modestly lowered in Germany to 46 per cent; but it had risen sharply to over 41 per cent in France
and Spain.
To assess the direction of the taxation reform and to determine the political and institutional
factors behind it, we observe the relative change experienced from the late seventies to the late eighties
by the effective tax rate on incomes five times and ten times the earnings of an average production
worker. The models explaining the pattern of cross-national change in the effective tax rate are reported
in table 12.
[Table 12]
To make the discussion shorter, we discuss the results for the equations on the effective tax rate
on incomes five times the salary of an APW - the same conclusions apply, however, to incomes ten times
the salary of an APW. Partisan control of government alone explains a fifth of the total variance of the
relative change in the effective tax rate - according to the coefficient, which is statistically significant,
full control of the cabinet by a socialist party should increase the effective tax rate by 40 per cent (column
1). Instead, corporatism has no influence on taxation in the 1980s (column 4). The performance of the
partisan variable remains stable when new regressors are introduced. The explained variation increases
to almost 60 per cent when the effective tax rate in 1980 and per capita income is included (column 2).
The result (a coefficient of -0.886 for the effective tax rate in 1980) implies that for each percentage point
of the tax rate in 1980, one should expect a decline in the effective tax rate of almost 1 per cent in the
following decade. This is, other things being equal, an initial tax rate of 20 per cent would fall to 16.5
per cent (with the constant term, however, it would end up at 25.2 per cent); an initial tax rate of 50 per
cent would decline to 27.9 per cent (including the constant term it would stay almost constant at 49.8 per
cent). To clarify the results of the model reported in table 12, column 2, we have estimated the effective
tax rate in 1990 by plotting alternative values in the independent variables. The fitted results are presented
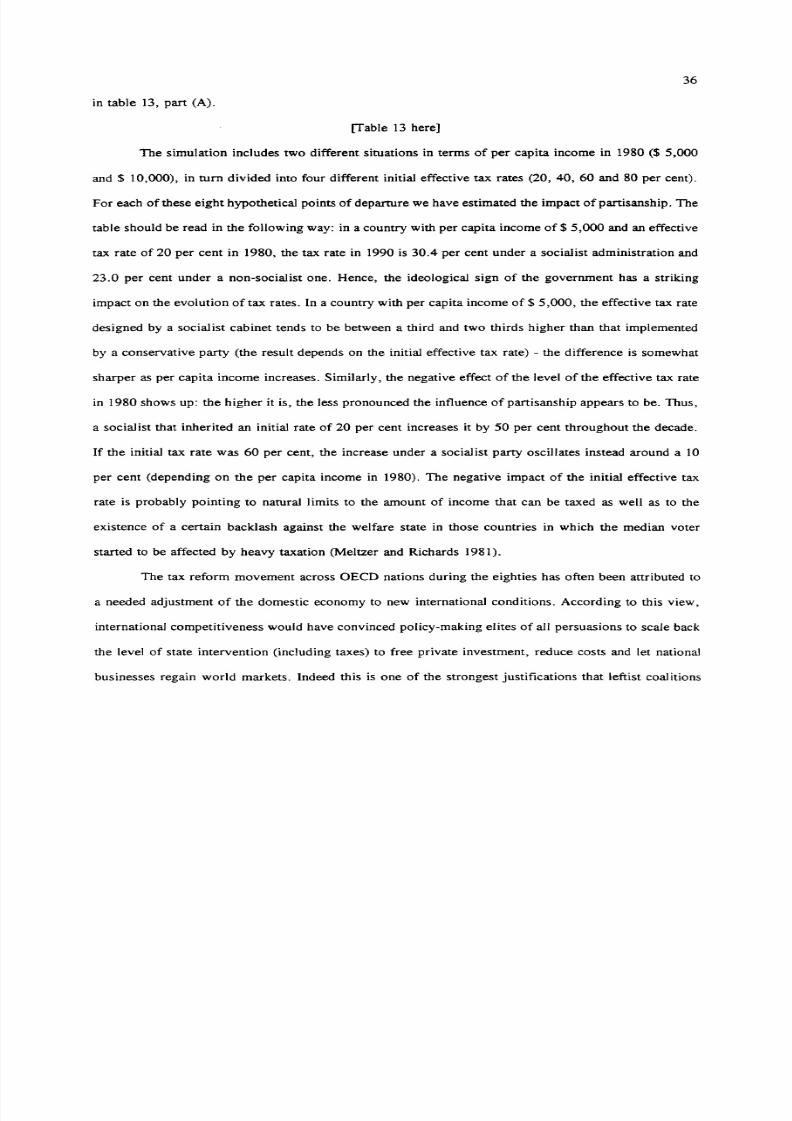
8/4/2019 The Trauma of Post-Communism (PCEE 50, 1999) Piotr Sztompka.
http://slidepdf.com/reader/full/the-trauma-of-post-communism-pcee-50-1999-piotr-sztompka 38/74
36
in table 13, part (A).
[fable 13 here]
The simulation includes two different situations in terms of per capita income in 1980 ($ 5,000
and $ 10,000), in turn divided into four different initial effective tax rates (20, 40, 60 and 80 per cent).
For each of these eight hypothetical points of departure we have estimated the impact of partisanship. The
table should be read in the following way: in a country with per capita income of $ 5,000 and an effective
tax rate of 20 per cent in 1980, the tax rate in 1990 is 30.4 per cent under a socialist administration and
23.0 per cent under a non-socialist one. Hence, the ideological sign of the government has a striking
impact on the evolution of tax rates. In a country with per capita income of $ 5,000, the effective tax rate
designed by a socialist cabinet tends to be between a third and two thirds higher than that implemented
by a conservative party (the result depends on the initial effective tax rate) - the difference is somewhat
sharper as per capita income increases. Similarly, the negative effect of the level of the effective tax rate
in 1980 shows up: the higher it is, the less pronounced the influence of partisanship appears to be. Thus,
a socialist that inherited an initial rate of 20 per cent increases it by 50 per cent throughout the decade.
If the initial tax rate was 60 per cent, the increase under a social ist party oscillates instead around a 10
per cent (depending on the per capita income in 1980). The negative impact of the initial effective tax
rate is probably pointing to natural limits to the amount of income that can be taxed as well as to the
existence of a certain backlash against the welfare state in those countries in which the median voter
started to be affected by heavy taxation (Meltzer and Richards 1981).
The tax reform movement across OEeD nations during the eighties has often been attributed to
a needed adjustment of the domestic economy to new international conditions. According to this view,
international competitiveness would have convinced policy-making elites of all persuasions to scale back
the level of state intervention (including taxes) to free private investment, reduce costs and let national
businesses regain world markets. Indeed this is one of the strongest justifications that leftist coalitions
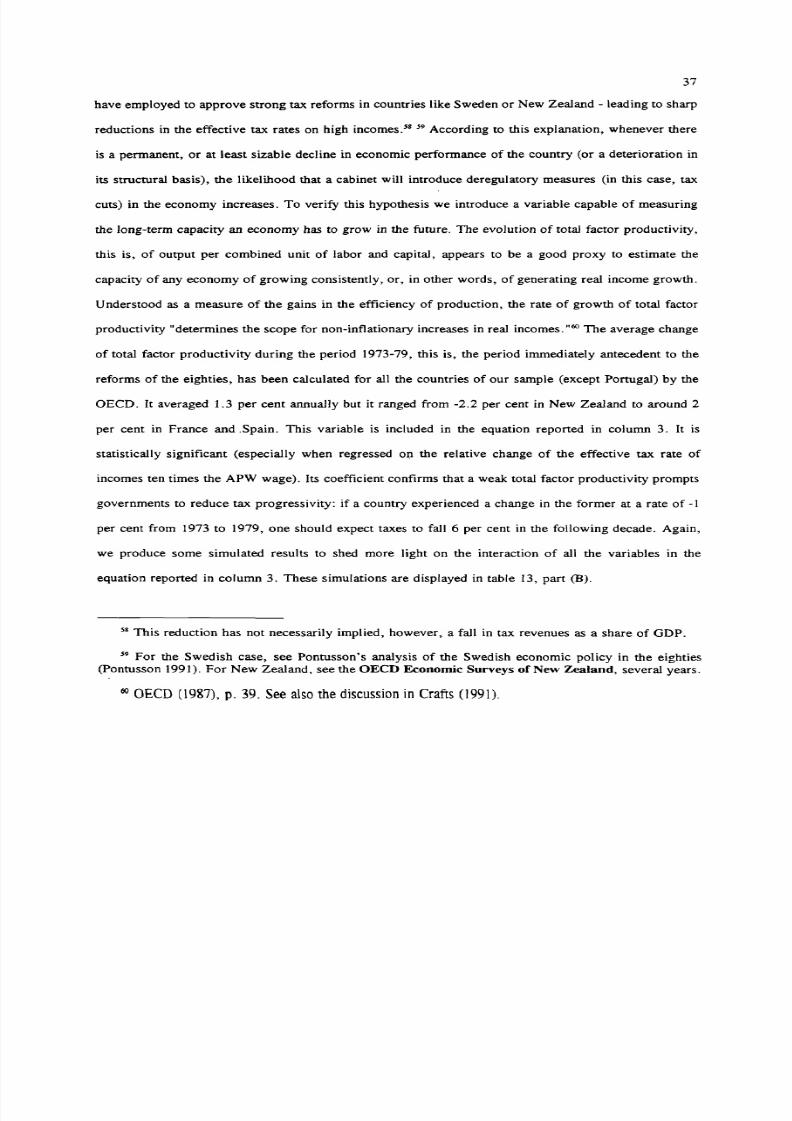
8/4/2019 The Trauma of Post-Communism (PCEE 50, 1999) Piotr Sztompka.
http://slidepdf.com/reader/full/the-trauma-of-post-communism-pcee-50-1999-piotr-sztompka 39/74
37
have employed to approve strong tax reforms in countries like Sweden or New Zealand - leading to sharp
reductions in the effective tax rates on high incomes." 59 According to this explanation, whenever there
is a permanent, or at least sizable decline in economic performance of the country (or a deterioration in
its structural basis), the likelihood that a cabinet will introduce deregulatory measures (in this case, tax
cuts) in the economy increases. To verify this hypothesis we introduce a variable capable of measuring
the long-term capacity an economy has to grow in the future. The evolution of total factor productivity,
this is, of output per combined unit of labor and capital, appears to be a good proxy to estimate the
capacity of any economy of growing consistently, or, in other words, of generating real income growth.
Understood as a measure of the gains in the efficiency of production, the rate of growth of total factor
productivity "determines the scope for non-inflationary increases in real incomes. "60 The average change
of total factor productivity during the period 1973-79, this is, the period immediately antecedent to the
reforms of the eighties, has been calculated for all the countries of our sample (except Portugal) by the
OEeD. It averaged 1.3 per cent annually but it ranged from -2.2 per cent in New Zealand to around 2
per cent in France and .Spain. This variable is included in the equation reported in column 3. It is
statistically significant (especially when regressed on the relative change of the effective tax rate of
incomes ten times the APW wage). Its coefficient confirms that a weak total factor productivity prompts
governments to reduce tax progressivity: if a country experienced a change in the former at a rate of -1
per cent from 1973 to 1979, one should expect taxes to fall 6 per cent in the following decade. Again,
we produce some simulated results to shed more light on the interaction of all the variables in the
equation reported in column 3. These simulations are displayed in table 13, part (B).
58 This reduction has not necessarily implied, however, a fall in tax revenues as a share of GOP.
59 For the Swedish case, see Pontusson's analysis of the Swedish economic policy in the eighties
(pontusson 1991). For New Zealand, see the OECD Economic Surveys of New Zealand, several years.
c o GECD (1 98 7), p. 39 . S ee a lso th e d iscu ss ion in C ra fts (19 91 ).
8/4/2019 The Trauma of Post-Communism (PCEE 50, 1999) Piotr Sztompka.
http://slidepdf.com/reader/full/the-trauma-of-post-communism-pcee-50-1999-piotr-sztompka 40/74
38
Partisanship keeps playing a strong role in the evolution of the progressivity of personal income
taxation since 1980. Under a conservative government, the effective tax rate declines in all cases but one
(when the effective tax rate in 1980 was 20 per cent and total factor productivity grew at 2 per cent every
year). Under a socialist cabinet, instead, the tax rate rises in eight out of twelve cases. As a consequence,
the simulation shows that starting from the same point, and all other things being equal, the tax rate under
a socialist government turns out to be, in general, a fifty per cent higher than the tax rate chosen by a
conservative government - in several cases the former actually doubles the latter. Notice that the initial
level of the tax rate behaves in the same way it does in the model in column 2 (it could not be other way
since the coefficient is very similar). Finally, the past performance of the economy, measured through
the change in total factor productivity, which seems to explain the real potential for growth, has a sizable
impact on partisan strategies. Under a situation of strong economic decline (total factor productivity
falling 2 per cent every year - as a matter of fact, what happened to New Zealand in the seventies), the
likelihood that any government will reduce the extent of tax progressivity is high. With an initial tax rate
of 60 per cent, a socialist cabinet will bring it down to 55 per cent; a conservative cabinet to 29 per cent.
The severity of the tax reduction decreases as total factor productivity improves: with the latter growing
at 2 per cent, for example, conservative governments seem content to reduce the effective tax rate to 40
per cent in average.
CONCLUSIONS
Recent research on the political economy of modern democracies has shown that partisan control
of office has only a limited, short-term impact on macroeconomic policies and aggregates. Rational
expectations among economic agents eventually force governments to implement stabilizing, credible
policies. Similarly, the internationalization of the economy constrains any prolonged attempt to put the
economy into an expansionary path. These theoretical insights have been confirmed by the historical
8/4/2019 The Trauma of Post-Communism (PCEE 50, 1999) Piotr Sztompka.
http://slidepdf.com/reader/full/the-trauma-of-post-communism-pcee-50-1999-piotr-sztompka 41/74
39
experience of the last decade - attempts to establish Keynesian policies in one country alone failed loudly
in France, corporatist experiments have waned in many cases and many socialdemocratic cabinets have
prudently abandoned their past reliance on demand-management policies.
In the course of our inquiry, however, we have found that partisan platforms were strong
predictors of supply-side economic policies before the stagflation period and that they still are afterwards.
Although governments of all ideological signs are equally committed to economic growth, they end up
relying upon different instruments to promote it. The left encourages particular forms of public
intervention in the economy: boosting taxes to finance public intervention, claiming for the state an
important role in the provision of physical and human capital. Our results also fit well the historical
experience of the last forty years. The interventionism preached by the left first came hand in hand with
the demand-management practices (or at least paradigms) of the postwar period (Hall, ed. 1989). When
Keynesianism became under intense fire, mainly as failed attempts in demand management heaped up in
the late seventies, microeconomic interventionism was gradually left as the main area in which socialist
cabinets differed from conservative governments. Hence, even under alleged periods of monetary and
fiscal discipline, the left has viewed the state as a central agent to overcome market failures, sustain
national competitiveness abroad, equalize conditions and sober the social effects of competitive markets.
In turn, it has been possible to show that conservative parties trust on the capacity of private
agents to supply the levels of savings and investments optimal to sustain growth. Mirroring the experience
of the left, supply-side issues have also remained or indeed grown relevant among the right in the last
fifteen years. In response to the stagflation crisis and to strong social changes that have progressively
altered the electoral composition of contemporary democracies, the conservative agenda has experience
an intense rejuvenation in most countries and a period of relative hegemony since the last oil shock - the
tax reform movement of the eighties is but one example. Massive privatization programs are just another
8/4/2019 The Trauma of Post-Communism (PCEE 50, 1999) Piotr Sztompka.
http://slidepdf.com/reader/full/the-trauma-of-post-communism-pcee-50-1999-piotr-sztompka 42/74
40
one."
Partisan strategies interact with the institutional systems in which they are implemented. On the
one hand, fragmented party systems tend to produce centrist coalitions that adopt middle-of-the-road
economic pol icies - publ ic investment rates tend to pivot around the OECD average, human capital
formation is provided jointly by the public and the private sector, tax schemes are equidistant from both
highly progressive and flat tax systems.
On the other hand, the position of each country in the international economy and the
corresponding mode of interest intermediation have a significant impact on the nature of the supply-side
economic strategy pursued by the government. In medium-size countries, states tend to concentrate more
power, to be more isolated from society, to act closer to the preferences of their top officials and policy-
makers than in small, corporatist countries, in which a dense network of social interests and organizations
has invaded the arena of public policy-making.f In statist nations, parties have more room to implement
their policies; the state will be employed, by both left and right, as a decisive instrument to shape society.
Hence, parties alone explain here much of the evolution of economic policy. In countries characterized
by strong corporatist networks, instead, parties may count on organized capital and labor to sustain a
particular economic strategy. For the period previous to the stagflation crisis, the literature has already
shed light on a system of 'socialdemocratic corporatism' in which strong leftist governments developed
a strong welfare state and extensive supply-side policies in exchange for wage moderation by
encompassing trade unions. Such a model has been traced out in our empirical analysis. Still, there are
61 For evidence on the impact of conservative governments on privatization strategies, see my paper
"Privatizing the State Business Sector in the Eighties: Partisan Strategies, Constitutional Rules and
Economic Concerns," mimeo.
62 On the capacity of states to act independently from socially determined interests and actors, see
Skocpol (1985). On the logic of policy-making in corporatist countries, see Lijphart (1977) and
Katzenstein (1985). For an attempt to explain the historical birth of these two different ideal types of
p olity (th e s ta tis t, s ha pe d th ro ug h c oe rc io n, a nd th e c orp ora tis t, su sta in ed b y c a p it al ), s e e T i l l y (1992) .
8/4/2019 The Trauma of Post-Communism (PCEE 50, 1999) Piotr Sztompka.
http://slidepdf.com/reader/full/the-trauma-of-post-communism-pcee-50-1999-piotr-sztompka 43/74
8/4/2019 The Trauma of Post-Communism (PCEE 50, 1999) Piotr Sztompka.
http://slidepdf.com/reader/full/the-trauma-of-post-communism-pcee-50-1999-piotr-sztompka 44/74
8/4/2019 The Trauma of Post-Communism (PCEE 50, 1999) Piotr Sztompka.
http://slidepdf.com/reader/full/the-trauma-of-post-communism-pcee-50-1999-piotr-sztompka 45/74
8/4/2019 The Trauma of Post-Communism (PCEE 50, 1999) Piotr Sztompka.
http://slidepdf.com/reader/full/the-trauma-of-post-communism-pcee-50-1999-piotr-sztompka 46/74
44
Bibliography
Alberto Alesina. 1987. "Macroeconomic Policy in a Two-Party System as a Repeated Game," Quarterly Journal
of Economics, 101, pp. 651-678.
Alberto Alesina. 1989. "Politics and Business Cycles in Industrial Democracies," Economic Policy, 8, pp. 57-98.
Alberto Alesina. 1993. "Elections, Party Structure and the Economy," unpublished paper.
Alberto Alesina, Gerald Cohen and Nouriel Roubini. 1992. "Macroeconomic Policy and Elections in OECD
Economies", Economics and Politics, 4, pp. 1-30.
Alberto Alesina and Dani Rodrik. 1991. "Distributive Politics and Economic Growth," NBER Working Paper
Series, no. 3668.
Alberto Alesina and Nouriel Roubini, 1992. "Political Cycles: Evidence from OECD Economies", Review of
Economic Studies, pp. 663-688.
James E. Alt. 1985. "Political Parties, World Demand, and Unemployment: Domestic and International Sources
of Economic Activity," American Political Science Review, 79, pp. 1016-1040.
James E. Alt. 1987. "Crude Politics: Oil and the Political Economy of Unemployment in Britain and Norway,"
British Journal of Political Science, 17, pp. 149-199.
R.M. Alvarez, G. Garrett and P. Lange. 1991. "Government Partisanship, Labor Organization and Macroeconomic
Performance, 1967-1984," American Political Science Review, 85, pp. 539-556.
Robert J. Barro. 1991. "Economic Growth in a Cross Section of Countries," Quarterly Journal of Economics,
105, pp. 407-443.
Ian Budge, David Robertson and Derek Hearl, eds. 1987. Ideology, Strategy, and party Change: Spatial
Analyses of Post-War Election Programmes in 19 Democracies. New York: Cambridge University Press.
M. Bruno and J. Sachs. 1985. Economics of Worldwide Stagflation. Cambridge, Mass.: Harvard University Press.
David Cameron. 1978. "The Expansion of the Public Economy: A Comparative Analysis," American Political
Science Review, 72, pp. 1243-1261.
David Cameron. 1984. "Social Democracy, Corporatism, Labor Quiescence and the Representation of Economic
Interest in Advanced Capitalist Society," in John H. Goldthorpe, ed. 1984. Chapter 7, pp. 143-178.
David Cameron. 1985. "Does Government Cause Inflation? Taxes, Spending, and Deficits," in Leon N. Lindberg
and Charles Maier, eds. The Politics of Inflation and Economic Stagnation. Washington, D.C .: Brookins
Institution. Chapter 9, pp. 224-279.
Wendy Carlin and David Soskice. 1990. Macroeconomics and the Wage Bargain. A Modern Approach to
Employment, Inflation and the Exchange Rate. Oxford: Oxford University Press.
S. Cnossen and R. M. Bird, eds. 1990 The Personal Income Tax. Phoenix from the Ashes? Amsterdam: North-
Holland.
8/4/2019 The Trauma of Post-Communism (PCEE 50, 1999) Piotr Sztompka.
http://slidepdf.com/reader/full/the-trauma-of-post-communism-pcee-50-1999-piotr-sztompka 47/74
45
Nick Crafts. 1991. "Reversing Relative Economic Decline? The 1980s in Historical Perspective," Oxford Review
of Economic Perspectives. 7, pp. 81-98.
Anthony Downs. 1957. An Economic Theory of Democracy. New York: Harper and Row.
Morris Fiorina. 1990. Divided Government. New York: MacMillan.
Stanley Fischer. 1991. "Growth, Macroeconomics, and Development," NBER Macroeconomics Annual 1991, pp.
329-379.
John R. Freeman. 1989. Democracy and Markets: The Politics of Mixed Economies. Ithaca: Cornell University
Press.
Jeffry A. Frieden. 1991. "Invested Interested: The Politics of National Economic Policies in a World of Global
Finance," International Organization, 45, pp. 425-451.
Geoffrey Garrett and Peter Lange. 1991. "Political Responses to Interdependence: What's "Left" for the Left?,"
International Organization, 45, pp. 539-564.
John Goldthorpe, ed. 1984. Order and Conflict in Contemporary Capitalism. Oxford: Clarendon Press.
John B. Goodman and Louwis W. Pauly. 1993. "The Obsolescence of Capita! Controls? Economic Management
in an Age of Global Markets," World Politics, 46, pp. 50-82.
Vittorio Grilli, Donato Masciandaro and Guido Tabellini. 1991. "Political and Monetary Institutions and Public
Financial Policies in the Industrial Countries", Economic Policy, 13, pp. 341-392.
R. P. Hageman, B. R. Jones and R. B. Montador. 1988. "Tax Reform in OECD Countries: Motives, Constraints
and Practice," OECD Economic Studies, 10, pp. 185-226.
Peter A. Hall. 1986. Governing the Economy. The Politics of State Intervention in Britain and France. Oxford:
Oxford University Press.
Peter A. Hall, ed. 1989. The Political Power of Economic Ideas. Keynesianism across Nations. Princeton, N.J.:
Princeton University Press.
Peter A. Hall. 1993. "Policy Paradigms, Social Learning, and the State. The Case of Economic Policymaking in
Britain", Comparative Politics, 25, pp. 275-296.
Douglas A. Hibbs. 1977. "Political Parties and Macroeconomic Policy," American Political Science Review, 71,
pp. 1467-87.
Douglas A. Hibbs. 1987a. The Political Economy of Industrial Democracies. Cambridge, Mass.: Harvard
University Press.
Douglas A. Hibbs. 1987b. The American Political Economy. Macroeconomics and Electoral Politics.
Cambridge, Mass.: Harvard University Press.
Douglas A. Hibbs. 1992. "Partisan Theory after Fifteen Years", European Journal of Political Economy, 8, pp.
361-373.

8/4/2019 The Trauma of Post-Communism (PCEE 50, 1999) Piotr Sztompka.
http://slidepdf.com/reader/full/the-trauma-of-post-communism-pcee-50-1999-piotr-sztompka 48/74
46
Cheng Hsiao. 1986. Analysis of Panel Data. Cambridge: Cambridge University Press.
Ronald Inglehart. 1984. "The Changing Structure of Political Cleavages inWestern Society," in R. J. Dalton et al.,
eds., Electoral Change in Advanced Industrial Democracies. Princeton, N.J.: Princeton University Press. Chapter
2, pp. 25-69.
Peter Katzenstein. 1985. Small States in World Markets. Industrial Policy in Europe. Ithaca: Cornell University
Press.
Jan-Erik Lane, David McKay and Kenneth Newton. 1991. Political Data Handbook: OECD Countries. New
York: Oxford University Press.
Peter Lange and G. Garrett. 1985. "The Politics of Growth: Strategic Interaction and Economic Performance in the
Advanced Industrial Democracies, 1974-1980," Journal of Politics, 47, pp.792-827.
Peter Lange and G. Garrett. 1987. "The Politics of Growth Reconsidered," Journal of Politics, 49, pp. 257-274.
Michael J. Laver and W. Bent Hunt. 1992. Policy and Party Competition. New York: Routledge.
Arend Lijphart. 1977. Democracy in Plural Societies. A Comparative Exploration. New Haven: Yale UniversityPress.
Robert E. Lucas, Jr. 1988. "On the Mechanics of Economic Development," Journal of Monetary Economics, 22,
pp.3-42.
N. Gregory Mankiw. 1992. Macroeconomics. New York: Worth Publishers.
N. Gregory Mankiw, David Romer and D. N. Weil. 1992. "A Contribution to the Economics of Growth,"
Quarterly Journal of Economics.
A. Meltzer and S. Richards. 1981. "ARational Theory of the Size of Government, " Journal of Political Economy,89, pp. 914-927.
AliciaH. Munnell. 1992. "Policy Watch: Infrastructure Investment and Economic Growth," Journal of Economic
Perspectives, 6, pp. 189-198.
OECD. 1987. Economic Outlook. Volume 42. Paris: OECD.
OECD. 1988. Education at OECD countries. Paris: OECD.
OECD. 1989. Economies in Transition. Structural Adjustment in OECn Countries. Paris: OECD.
OECD. 1990. The Personal Income Tax Base. A Comparative Survey. Paris: OECD.
OECD. Several years. OECD Employment Outlook. Paris: OECD.
Joseph A. Pechman, ed. 1987. World Tax Reform. A Progress Report. Washington, D.C.: The Brookings
Institution.
B.Guy Peters. 1991. The Politics of Taxation: A Comparative Perspective. Cambridge, Mass.: Basil Blackwell.

8/4/2019 The Trauma of Post-Communism (PCEE 50, 1999) Piotr Sztompka.
http://slidepdf.com/reader/full/the-trauma-of-post-communism-pcee-50-1999-piotr-sztompka 49/74
47
Jonas Pontusson. 1991. "The Crisis of Swedish Social Democracy," mimeo. March. 1991.
Samuel Popkin. 1991. The Reasoning Voter: Communication and Persuasion in Presidential Campaigns.
Chicago: University of Chicago.
Adam Przeworski and Michael Wallerstein. 1986. "Democratic Capitalism at the Crossroads," in A. Przeworski,
Capitalism and Social Democracy. Cambridge: Cambridge University Press. Chapter 6, pp. 205-221.
Douglas W. Rae. 1967. The Political Consequences of Electoral Laws. New Haven: Yale University Press.
Ronald Rogowski. 1987. "Trade and Democratic Institutions," International Organization,
Nouriel Roubini and Jeffrey Sachs. 1989. "Political and Economic Determinants of Budget Deficits in the Industrial
Democracies," European Economic Review, 33, pp. 903-938.
Jeffrey Sachs and Charles Wyplosz. 1986. "The Economic Consequences of President Mitterrand," Economic
Policy, 2, pp. 262-322.
Fritz W. Scharpf. 1984. "Economic and Institutional Constraints of Full-Employment Strategies: Sweden, Austria,
and Western Germany, 1973-1982," in John H. Goldthorpe, ed., pp. 257-290.
Fritz W. Scharpf. 1987 .• A Game-Theoretical Interpretation of Inflation and Unemployment in Western Europe,"
Journal of Public Policy, 7, pp. 227-57.
Fritz W. Scharpf. 1991. Crisis and Choice in European Social Democracy. Ithaca: Cornell University Press.
Kenneth Shepsle. 1991. Models of Multiparty Electoral Competition. Chur , Switzerland: Harwood Academic
Publishers.
Theda Skocpol. 1985. "Bringing the State Back In: Strategies of Analysis in Current Research," in Peter Evans,Dietrich Rueschenmeyer, and Theda Skocpol, eds. Bringing the State Back In (Cambridge: Cambridge UNiversity
Press), pp. 3-43.
David Soskice. 1990. "Wage Determination: The Changing Role of Institutions in Advanced Industrial Countries,"
Oxford Review of Economic Policy, 6, pp. 36-61.
E. Spolaore. 1992. "Policy making systems and economic efficiency: coalition governments versus majority
governments," mimeo unpublished.
Sven Steinmo. 1993. Taxation and Democracy. Swedish, British and American Approaches to Financing the
Modern State. New Haven: Yale University Press.
John D. Stephens. 1991. "Industrial Concentration, Country Size, and Trade Union Membership," AmericanPolitical Science Review, 85, pp. 941-949.
Peter Swenson. 1991. "Bringing Capital Back In, or Social Democracy Reconsidered: Employer Power, Cross-Class
Alliances, and Centralization of Industrial Relations in Denmark and Sweden", World Politics, 43, pp. 513-545.
Rein Taagapera and Matthew S. Shugart. 1989. Seats and Votes: The Effects and Determinants of Electoral
Systems. New Haven: Yale University Press.
8/4/2019 The Trauma of Post-Communism (PCEE 50, 1999) Piotr Sztompka.
http://slidepdf.com/reader/full/the-trauma-of-post-communism-pcee-50-1999-piotr-sztompka 50/74
48
Charles Tilly. 1992. Coercion, Capital, and European States, AD 990-1992. Cambridge, Mass.: Blackwell.
Revised paperback edition.
UNESCO. Several years. Statistical Yearbook.
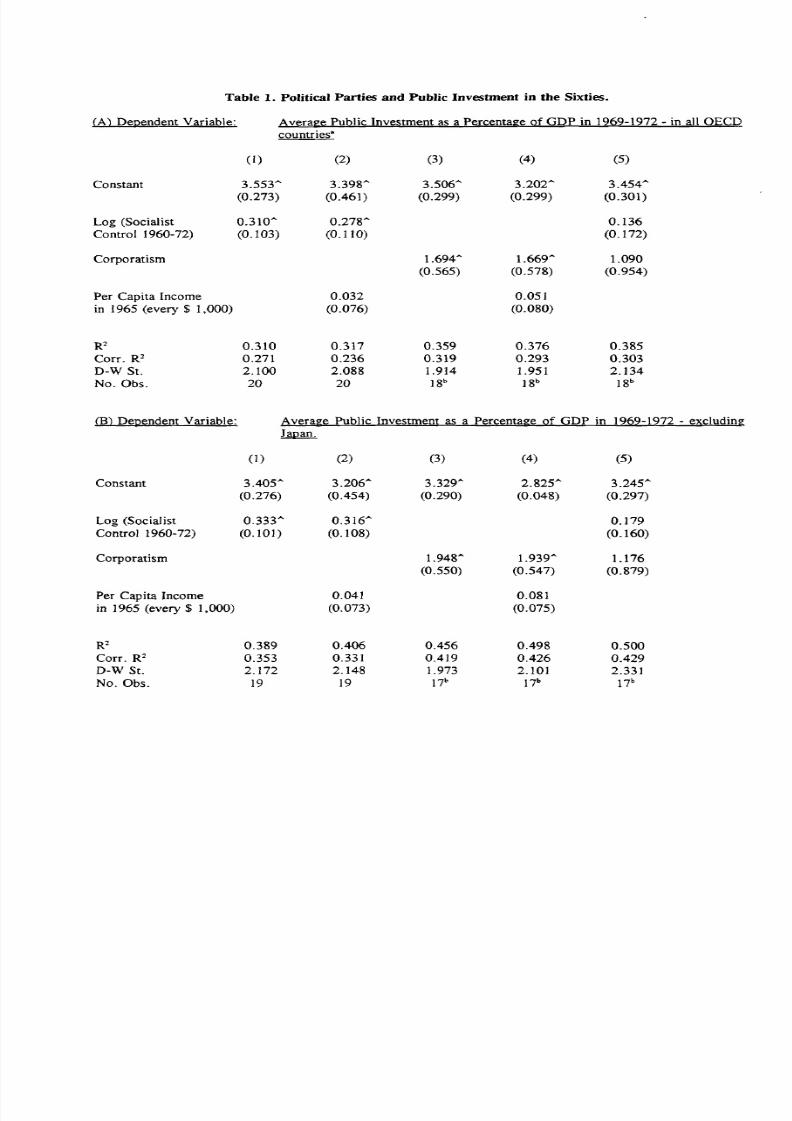
8/4/2019 The Trauma of Post-Communism (PCEE 50, 1999) Piotr Sztompka.
http://slidepdf.com/reader/full/the-trauma-of-post-communism-pcee-50-1999-piotr-sztompka 51/74
Table 1. Political Parties and Public Investment in the Sixties.
(A) DeQendent Variable: Average Public Inve~tment as a Percentage of GDP in 1969-1972 - in a1lOECD
countries"
(I) (2) (3) (4) (5)
Constant 3.553'" 3.398'" 3.506'" 3.202'" 3.454'"
(0.273) (0.461 ) (0.299) (0.299) (0.301)
Log (Socialist 0.310'" 0.278'" 0.136
Control 1960-72) (0.103) (0.110) (0.172)
Corporatism 1.694'" 1.669" 1.090
(0.565) (0.578) (0.954)
Per Capita Income 0.032 0.051in 1965 (every $ 1,000) (0.076) (0.080)
R 2 0.310 0.317 0.359 0.376 0.385
Corr. R 2 0.271 0.236 0.319 0.293 0.303
O-W St. 2.100 2.088 1.914 1.951 2.134
No.Obs. 20 20 18b 18b 18b
(B) Detlendent Variable: Average Public Investment as a Percentage of GOP in 1969-1972 - excluding
Jatlan.
(1) (2) (3) (4) (5)
Constant 3.405" 3.206" 3.329" 2.825" 3.245'"
(0.276) (0.454) (0.290) (0.048) (0.297)
Log (Socialist 0.333'" 0.316'" 0.179
Control 1960-72) (0.101) (0.108) (0.160)
Corporatism 1.948'" 1.939'" 1.176
(0.550) (0.547) (0.879)
Per Capita Income 0.041 0.081
in 1965 (every $ 1,000) (0.073) (0.075)
R 2 0.389 0.406 0.456 0.498 0.500
Corr. R 2 0.353 0.331 0.419 0.426 0.429
D-W St. 2.172 2.148 1.973 2.101 2.331
No.Obs. 19 19 l7b l7b 17b
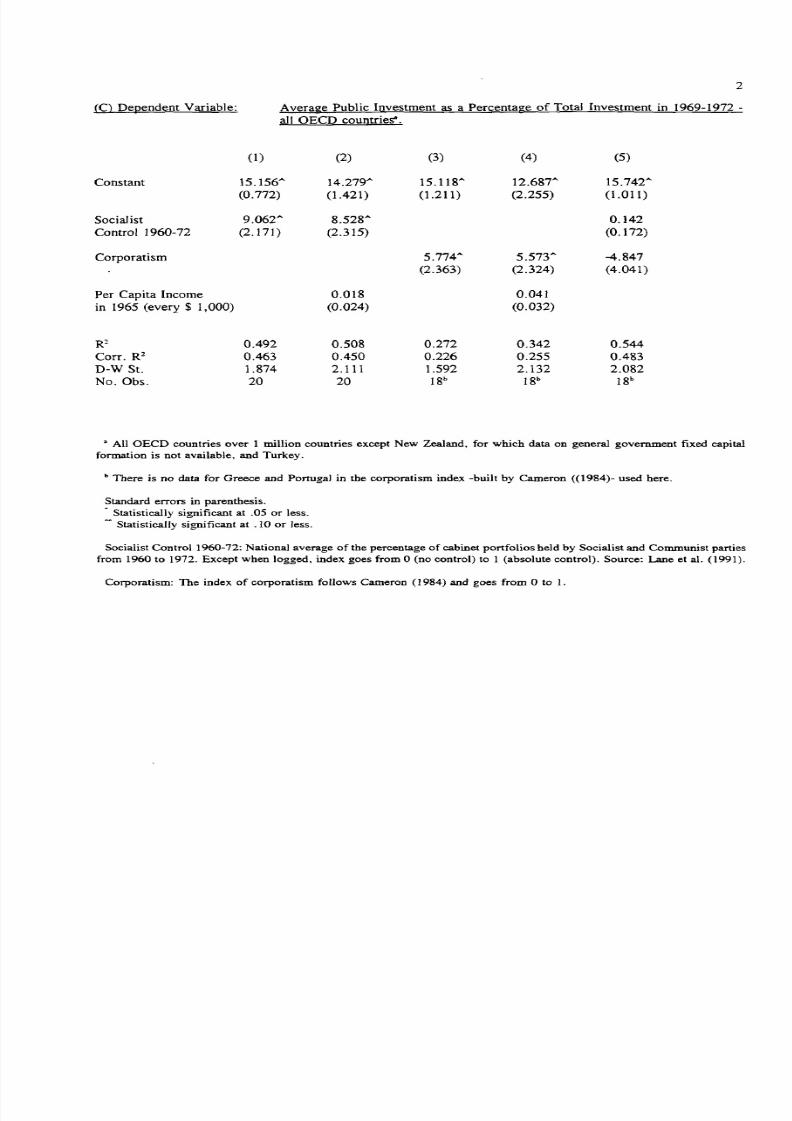
8/4/2019 The Trauma of Post-Communism (PCEE 50, 1999) Piotr Sztompka.
http://slidepdf.com/reader/full/the-trauma-of-post-communism-pcee-50-1999-piotr-sztompka 52/74
2
(C) Degendent Variable: Average Public Investment as a Percentage of Total Investment in 1969-1972 -
all OECD countries".
(1) (2) (3) (4) (5)
Constant 15.156'" 14.279'" 15.118'" 12.681" 15.742'"
(0.772) (1.421) (1.211) (2.255) (1.011)
Socialist 9.062'" 8.528'" 0.142
Control 1960-72 (2.171) (2.315) (0.172)
Corporatism 5.774'" 5.573'" -4.847
(2.363) (2.324) (4.041)
Per Capita Income 0.018 0.041in 1965 (every $ 1,000) (0.024) (0.032)
R 2 0.492 0.508 0.272 0.342 0.544
Corr. R 2 0.463 0.450 0.226 0.255 0.483
D-W St. 1.874 2.111 1.592 2.132 2.082
No.Obs. 20 20 18b 18b 18b
• All OECD countries over 1 million countries except New Zealand, for which data on general government fixed capitalformation is not available, and Turkey.
b There is no data for Greece and Portugal in the corporatism index -built by Cameron «1984)- used here.
Standard errors in parenthesis .
. Statistically significant at .05 or less .
.• Statistically significant at .10 or less.
Socialist Control 1960-72: National average of the percentage of cabinet portfolios held by Socialist and Communist parties
from 1960 to 1972. Except when logged, index goes from 0 (no control) to 1 (absolute control). Source: Lane et al. (1991).
Corporatism: The index of corporatism follows Cameron (1984) and goes from 0 to 1.
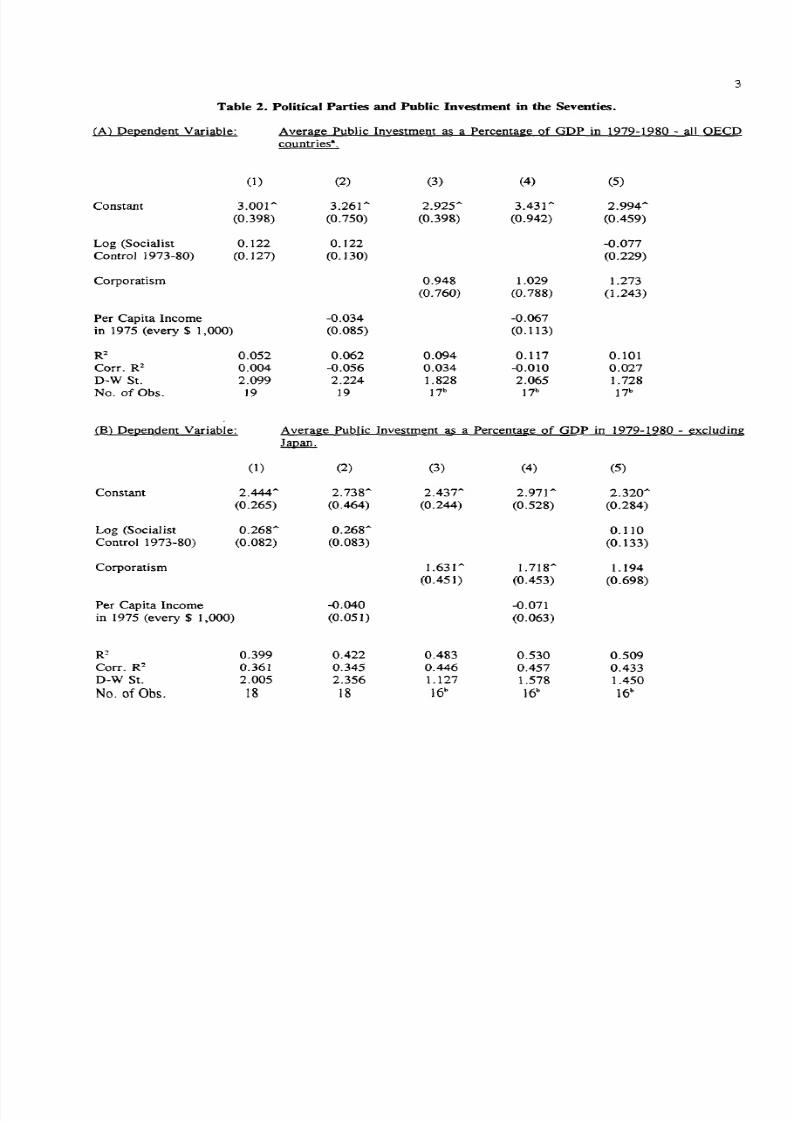
8/4/2019 The Trauma of Post-Communism (PCEE 50, 1999) Piotr Sztompka.
http://slidepdf.com/reader/full/the-trauma-of-post-communism-pcee-50-1999-piotr-sztompka 53/74
3
Table 2. Political Parties and Public Investment in the Seventies.
C A l Oel2endent Variable: Average Public Investment as a Percentage of goP in 1979-1980 - all OECO
countries".
(1) (2) (3) (4) (5)
Constant 3.001 A 3.261 A 2.925'" 3.431'" 2.994A
(0.398) (0.750) (0.398) (0.942) (0.459)
Log (Socialist 0.122 0.]22 -0.077
Control 1973-80) (0. ]27) (0. ]30) (0.229)
Corporatism 0.948 1.029 1.273
(0.760) (0.788) (1.243)
Per Capita Income -0.034 -0.067
in 1975 (every $ 1,000) (0.085) (0.113)
R2 0.052 0.062 0.094 0.117 0.101
Corr. R2 0.004 -0.056 0.034 -0.010 0.027
D-W St. 2.099 2.224 1.828 2.065 1.728
No.ofObs. 19 19 17b ]7b 17b
C B l Oel2endent Variable: Average Public Investment as a Percentage of GDP in 1979-1980 - excluding
Jal2an.
(1) (2) (3) (4) (5)
Constant 2.444A 2.738A
2.437A 2.971A 2.320A
(0.265) (0.464) (0.244) (0.528) (0.284)
Log (Socialist 0.268A 0.268'" 0.110
Control 1973-80) (0.082) (0.083) (0.133)
Corporatism 1.631A 1.718'" 1.194
(0.451) (0.453) (0.698)
Per Capita Income -0.040 -0.071
in 1975 (every $ 1,000) (0.051) (0.063)
R2 0.399 0.422 0.483 0.530 0.509Corr. R2 0.361 0.345 0.446 0.457 0.433
D-W St. 2.005 2.356 1.127 1.578 1.450
No . o f Ob s. 1 8 1 8 16b16b 1 6 b
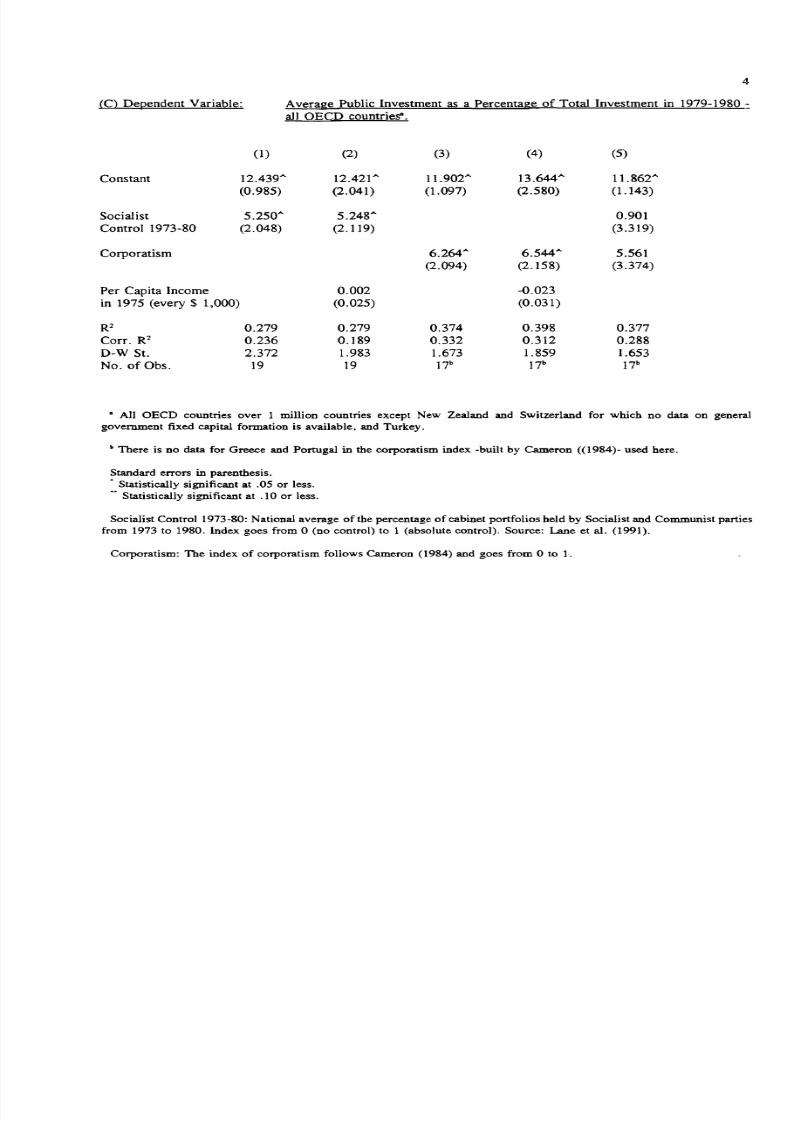
8/4/2019 The Trauma of Post-Communism (PCEE 50, 1999) Piotr Sztompka.
http://slidepdf.com/reader/full/the-trauma-of-post-communism-pcee-50-1999-piotr-sztompka 54/74

8/4/2019 The Trauma of Post-Communism (PCEE 50, 1999) Piotr Sztompka.
http://slidepdf.com/reader/full/the-trauma-of-post-communism-pcee-50-1999-piotr-sztompka 55/74
S
Table 3. Political Parties and Public Investment in the Eighties.
(A) Oe('lendem Variable: Average Pyblic Inve~tment as 1 ! . Percentage of GOP in 1988-1990 - all OECO
countries",
(1) (2) (3) (4) (S)
Constant 2.411" 2.744"- 2.900"- 3.273"- 2.S23"
(0.403) (0.843) (0.382) (0.878) (0.455)
Log (Social ist 0.168 0.144 0.222
Control 1982-90) (0.128) (0.142) (0.156)
Corporatism -0.206 -0.134 -0.690
(0.729) (0.763) (0.783)
Per Capita Income -0.028 -0.040
in 1985 (every $ 1,000) (0.064) (0.08S)
R 2 0.092 0.103 0.005 0.002 0.131
Corr. R 2 0.038 -0.009 0.060 -0.118 0.007
O-W St. 1.741 1.846 I.S02 1.646 1.726
No.Obs. 19 19 17b 17B 17h
ill) Dependent Variable: Average Public Investment as a Percentage of GDP in 1988-1990 - except Japan.
(1) (2) (3) (4) (S)
Constant 1.777"- 2.015" 2.S64"- 3.186" 1.824"
(0.289) (0.562) (0.339) (0.710) (0.321)
Log (Socialist 0.342"- 0.324"- 0.374"
Control 1982-90) (0.089) (0.098) (0.103)
Corporatism 0.264 0.411 -0.405
(0.628) (0.645) (0.495)
Per Capita Income -0.020 -0.069
in 1985 (every $ 1,000) (0.041) (0.069)
R 2 0.478 0.487 0.013 0.083 0.510
Corr. R 2 0.446 0.418 -0.058 -0.059 0.435
D-W St. 1.900 1.972 1.563 1.780 1.912
No.Obs. 18 18 16b 16b 16b
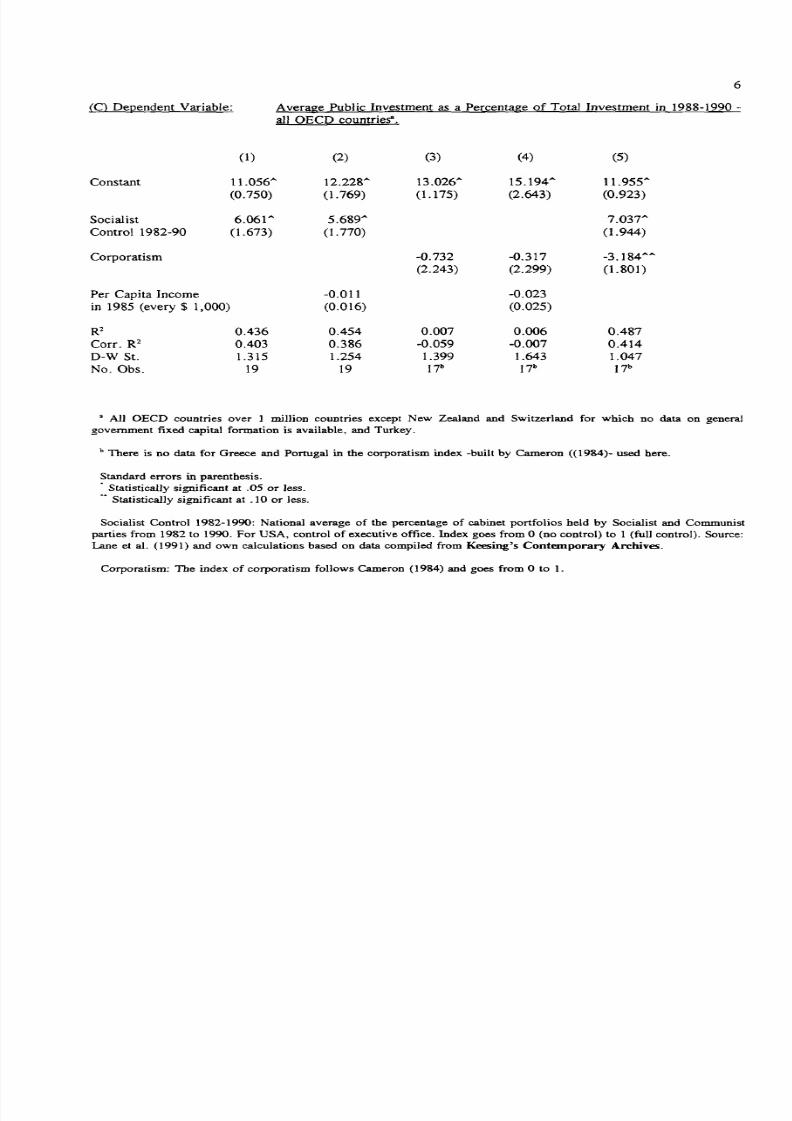
8/4/2019 The Trauma of Post-Communism (PCEE 50, 1999) Piotr Sztompka.
http://slidepdf.com/reader/full/the-trauma-of-post-communism-pcee-50-1999-piotr-sztompka 56/74
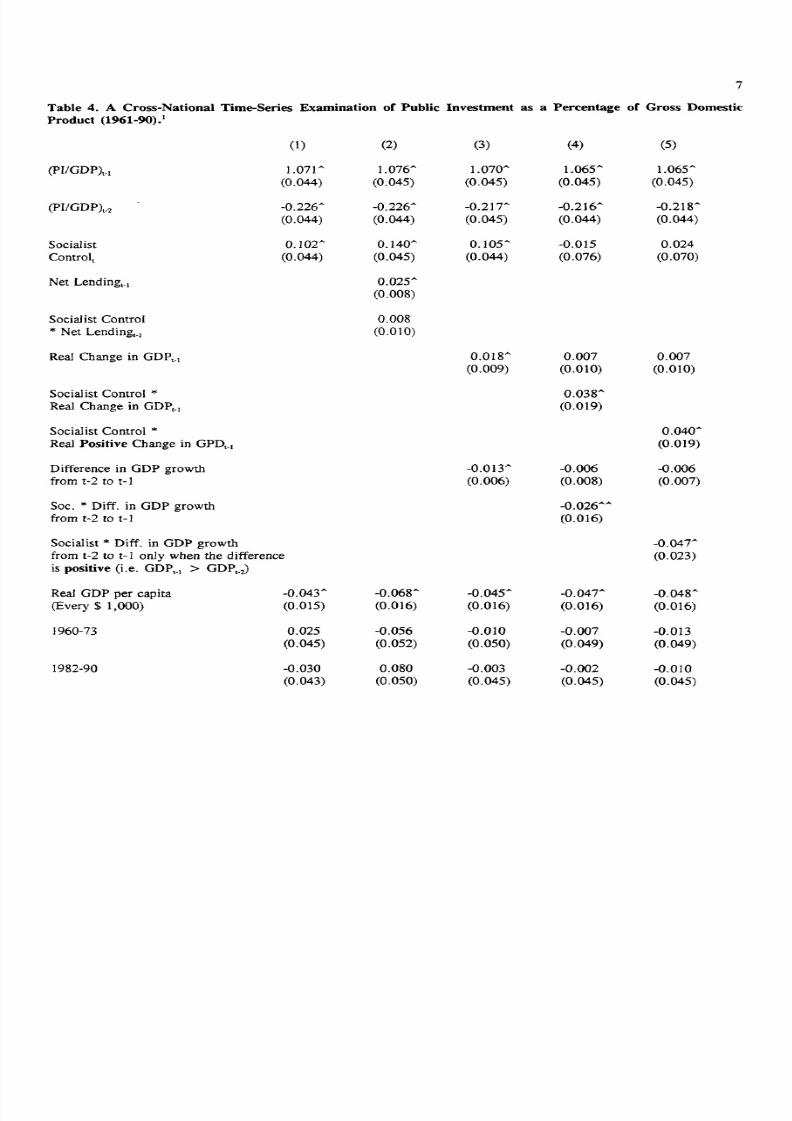
8/4/2019 The Trauma of Post-Communism (PCEE 50, 1999) Piotr Sztompka.
http://slidepdf.com/reader/full/the-trauma-of-post-communism-pcee-50-1999-piotr-sztompka 57/74
7
Table 4. A Cross-National Time-Series Examination of Public Investment as a Percentage of Gross Domestic
Product (1961-90V
(1) (2) (3) (4) (5)
(pIIGOP)t-1 1.071 '" 1.076'" 1.070'" 1.065'" 1.065'"
(0.044) (0.045) (0.045) (0.045) (0.045)
(pIIGDP)I_2 -0.226'" -0.226'" -0.217'" -0.216'" -0.218'"
(0.044) (0.044) (0.045) (0.044) (0.044)
Socialist 0.102'" 0.140'" 0.105'" -0.015 0.024
Control, (0.044) (0_045) (0.044) (0.076) (0.070)
Net Lending., 0.025'"
(0.008)
Socialist Control 0.008
'" Net Lending., (0.010)
Real Change in GOPt.! 0.018'" 0.007 0.007
(0.009) (0.010) (0.010)
Socialist Control > I< 0.038'"
Real Change in GOPt_] (0.019)
Socialist Control '" 0.040'"
Real Positive Change in GPOt_! (0.019)
Difference in GDP growth -0.013'" -0.006 -0.006
from t-2 to t-1 (0.006) (0.008) (0.007)
Soc. '" Diff. in GOP growth -0.026"""
from t-2 to t-1 (0_016)
Socialist * Diff. in GOP growth -0.047'"'
from t-2 to t-l only when the difference (0.023)
is positive (i.e. GOPt_! > GOPt_J
Real GOP per capita -0.043'" -0.068'" -0_045'" -0.047'" -0.048'"(Every $ 1,000) (0.015) (0.016) (0.016) (0.016) (0.016)
1960-73 0.025 -0.056 -0.010 -0.007 -0.013
(0.045) (0.052) (0.050) (0.049) (0.049)
1982-90 -0.030 0.080 -0.003 -0.002 -0.010
(0.043) (0.050) (0.045) (0.045) (0.045)
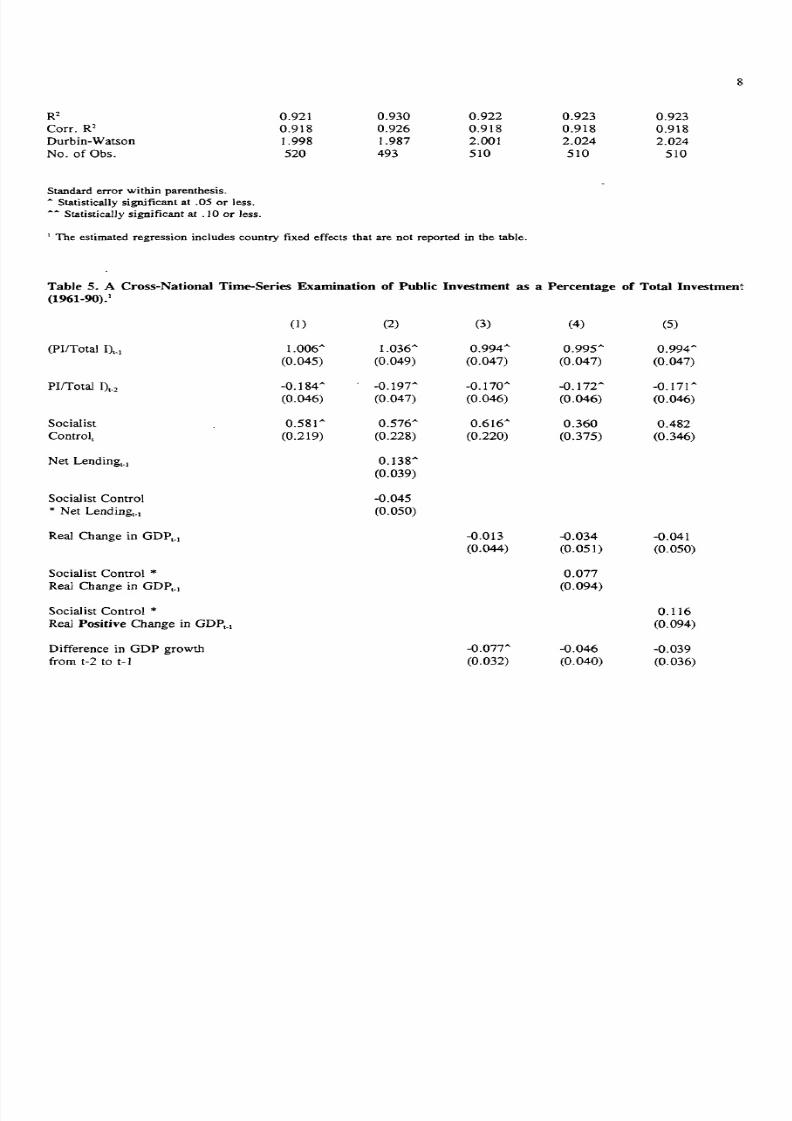
8/4/2019 The Trauma of Post-Communism (PCEE 50, 1999) Piotr Sztompka.
http://slidepdf.com/reader/full/the-trauma-of-post-communism-pcee-50-1999-piotr-sztompka 58/74
8
R 2
Corr. R 2
Durbin-Watson
No. of Obs.
0.921
0.918
1.998
520
0.930
0.926
1.987
493
0.922
0.918
2.001
510
0.923
0.918
2.024
510
0.923
0.918
2.024
510
Standard error within parenthesis.
AStatistically significant at .05 or less.
AA Statistically significant at .10 or less.
IThe estimated regression includes country fixed effects that are not reported in the table.
Table 5. A Cross-National Time-Series Examination of Public Investment as a Percentage of Total Investment
(1961-90V
(1) (2) (3) (4) (5)
(PI/Total 1 ) 1 . ) 1.006" 1.036" 0.994" 0.995" 0.994'"
(0.045) (0.049) (0.047) (0.047) (0.047)
PIlTotal 1 ) 1 . 2 -0.184" -0.191" -0.170'" -0.172" -0.171"
(0.046) (0.047) (0.046) (0.046) (0.046)
Socialist 0.581 " 0.576'" 0.616" 0.360 0.482
Control, (0.219) (0.228) (0.220) (0.375) (0.346)
Net Lending., 0.138"
(0.039)
Socialist Control -0.045
* Net Lending.. (0.050)
Real Change in GDP •.) -0.013 -0.034 -0.041
(0.044) (0.05]) (0.050)
Socialist Control * 0.077
Real Change in GDP •.) (0.094)
Socialist Control * 0.116
Real Positive Change in GDP t-) (0.094)
Difference in GOP growth -0.077" -0.046 -0.039
from t-2 to t-l (0.032) (0.040) (0.036)
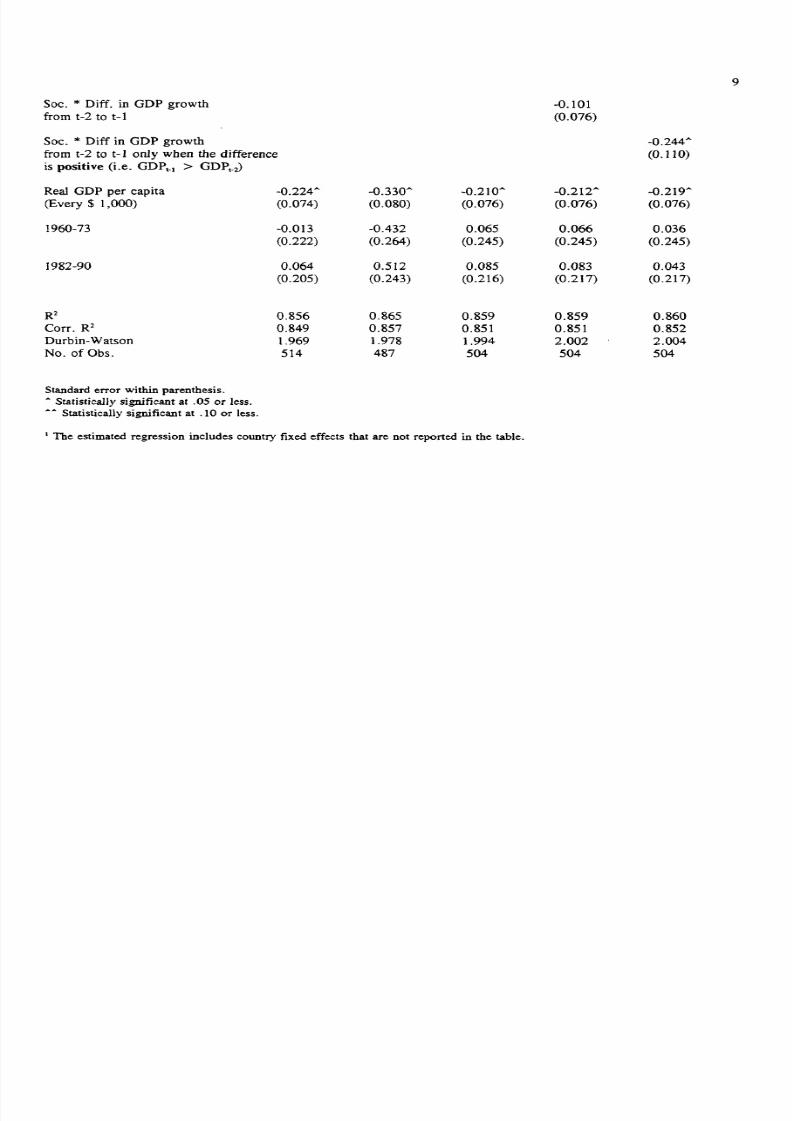
8/4/2019 The Trauma of Post-Communism (PCEE 50, 1999) Piotr Sztompka.
http://slidepdf.com/reader/full/the-trauma-of-post-communism-pcee-50-1999-piotr-sztompka 59/74
Soc. * Diff. in GOP growth
from t-2 to t-l
Soc. * Diff in GOP growth
from t-2 to t-l only when the difference
is positive (i.e. GOPt-) > GOPd
Real GOP per capita
(Every $ 1,000)
1960-73
1982-90
R 2
Corr. R 2
Durbin- Watson
No. of Obs.
Standard error within parenthesis .
.. Statistically significant at .05 or less .
.... Statistically significant at .10 or less.
-0.224" -0.330"
(0.074) (0.080)
-0.013 -0.432
(0.222) (0.264)
0.064 0.512
(0.205) (0.243)
0.856 0.865
0.849 0.857
1.969 1.978
514 487
9
-0.101
(0.076)
-0.244"
(0.110)
-0.210" -0.212A -0.219'"
(0.076) (0.076) (0.076)
0.065 0.066 0.036
(0.245) (0.245) (0.245)
0.085 0.083 0.043
(0.216) (0.217) (0.217)
0.859 0.859 0.860
0.851 0.851 0.852
1.994 2.002 2.004
504 504 504
1 The estimated regression includes country fixed effects that are not reported in the table.
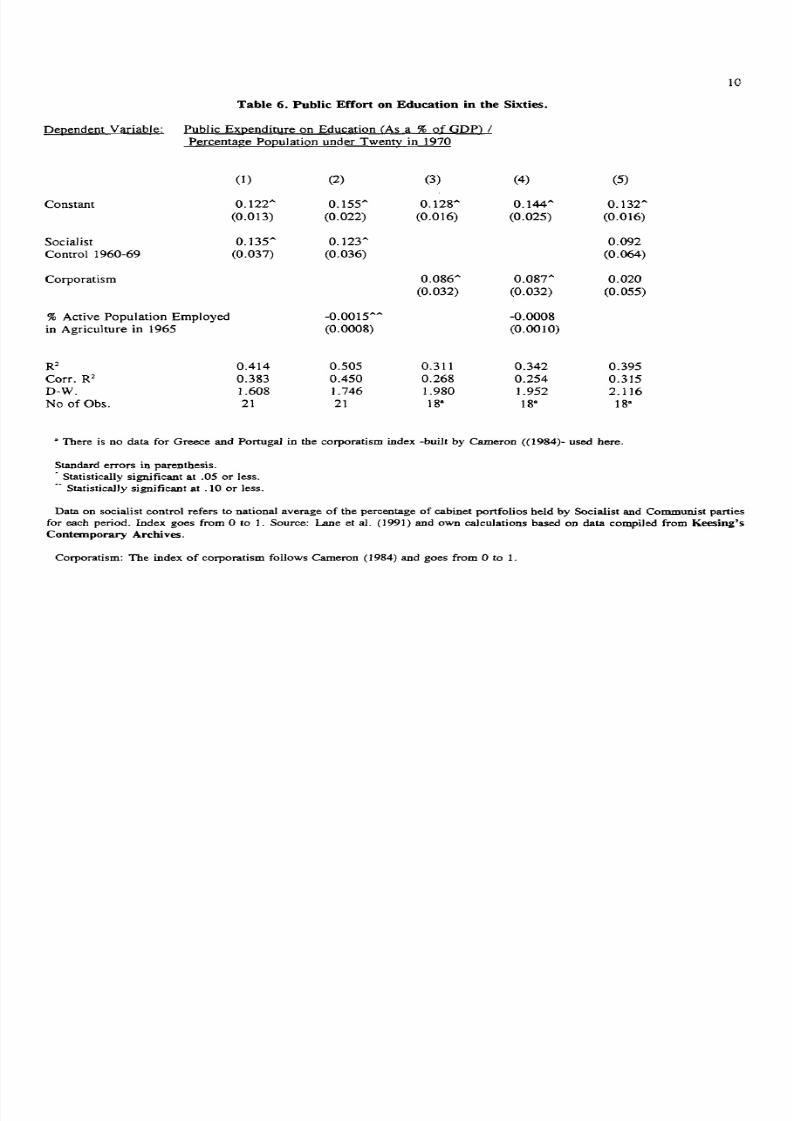
8/4/2019 The Trauma of Post-Communism (PCEE 50, 1999) Piotr Sztompka.
http://slidepdf.com/reader/full/the-trauma-of-post-communism-pcee-50-1999-piotr-sztompka 60/74
10
Table 6. Public Effort on Education in the Sixties.
De12endent Variable: Public EX12enditure on Education (As a % of GDP) /
Percentage P012ulation under Twenty in 1970
(1) (2) (3) (4) (5)
Constant 0.122'" 0.155'" 0.128'" 0.144'" 0.132"
(0.013) (0.022) (0.016) (0.025) (0.016)
Socialist 0.135" 0.123" 0.092
Control 1960-69 (0.037) (0.036) (0.064)
Corporatism 0.086" 0.087" 0.020
(0.032) (0.032) (0.055)
% Active Population Employed -0.0015"'" -0.0008
in Agriculture in 1965 (0.0008) (0.0010)
R 2 0.414 0.505 0.311 0.342 0.395
Corr. R 2 0.383 0.450 0.268 0.254 0.315
D-W. 1.608 1.746 1.980 1.952 2.116
No of Obs. 21 21 1 8 8 18" 1 8 8
• There is no data for Greece and Portugal in the corporatism index -built by Cameron ((1984)- used here.
Standard errors in parenthesis .
. Statistically significant at .05 or less .
.. Statistically significant at .10 or less.
Data on socialist control refers to national average of the percentage of cabinet portfolios held by Socialist and Communist parties
for each period. Index goes from 0 to 1. Source: Lane et a1. (1991) and own calculations based on data compiled from Keesing's
Contemporary Archives.
Corporatism: The index of corporatism follows Cameron (1984) and goes from 0 to 1.
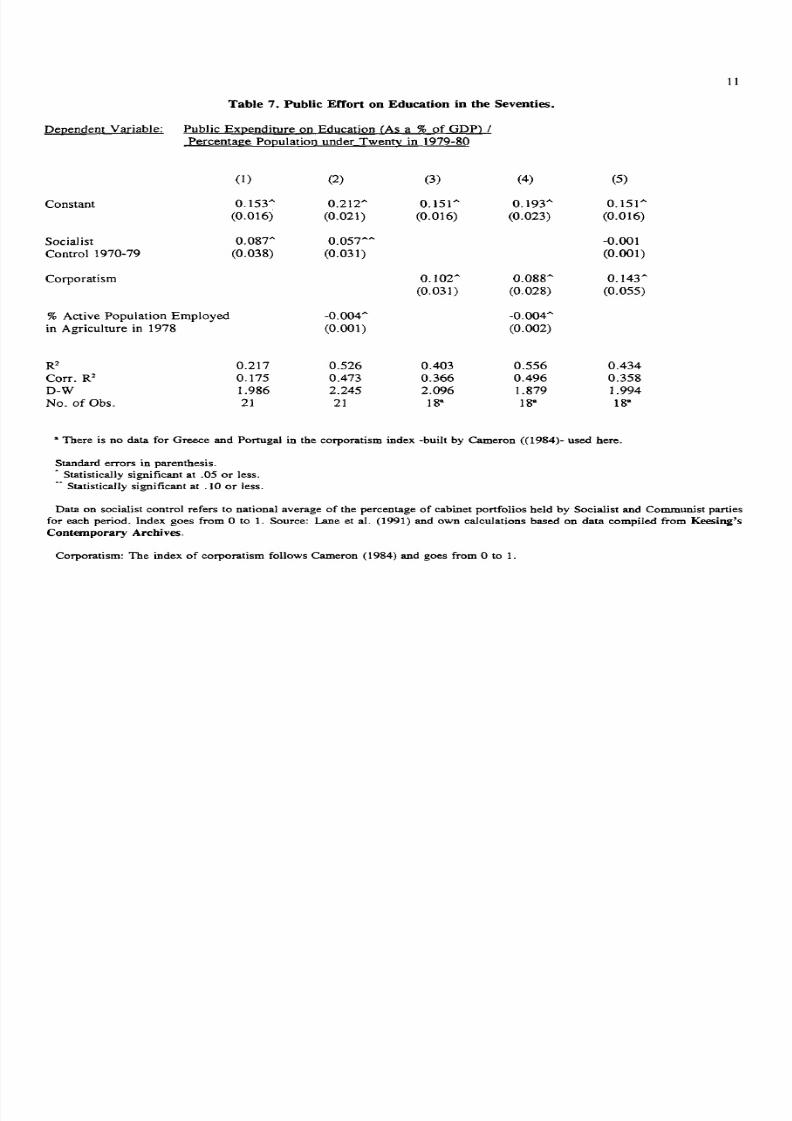
8/4/2019 The Trauma of Post-Communism (PCEE 50, 1999) Piotr Sztompka.
http://slidepdf.com/reader/full/the-trauma-of-post-communism-pcee-50-1999-piotr-sztompka 61/74
Table 7. Public Effort on Education in the Seventies.
Del2endent Variable: Public EXl2enditure on Education (As a % of GDP) /
Percentage Population under Twenty in 1979-80
(1) (2) (3) (4)
Constant 0.153" 0.212" 0.151.... 0.193"(0.016) (0.021) (0.016) (0.023)
Socialist 0.087" 0.057""
Control 1970-79 (0.038) (0.031)
Corporatism 0.102.... 0.088"
(0.031) (0.028)
% Active Population Employed -0.004.... -0.004"
in Agriculture in 1978 (0.001) (0.002)
R2 0.217 0.526 0.403 0.556Corr. R2 0.175 0.473 0.366 0.496D-W 1.986 2.245 2.096 1.879No. of Obs. 21 21 18· 188
11
(5)
0.151A
(0.016)
-0.001(0.001)
0.143 ....
(0.055)
0.4340.3581.994
188
a
There is no data for Greece and Portugal in the corporatism index -built by Cameron «(1984)- used here.
Standard errors in parenthesis .
. Statistically significant at .05 or less .
.. Statistically significant at . IO or less.
Data on socialist control refers to national average of the percentage of cabinet portfolios held by Socialist and Communist parties
for each period. Index goes from 0 to 1. Source: Lane et al. (1991) and own calculations based on data compiled from Keesing's
Contemporary Archives.
Corporatism: The index of corporatism follows Cameron (1984) and goes from 0 to 1.
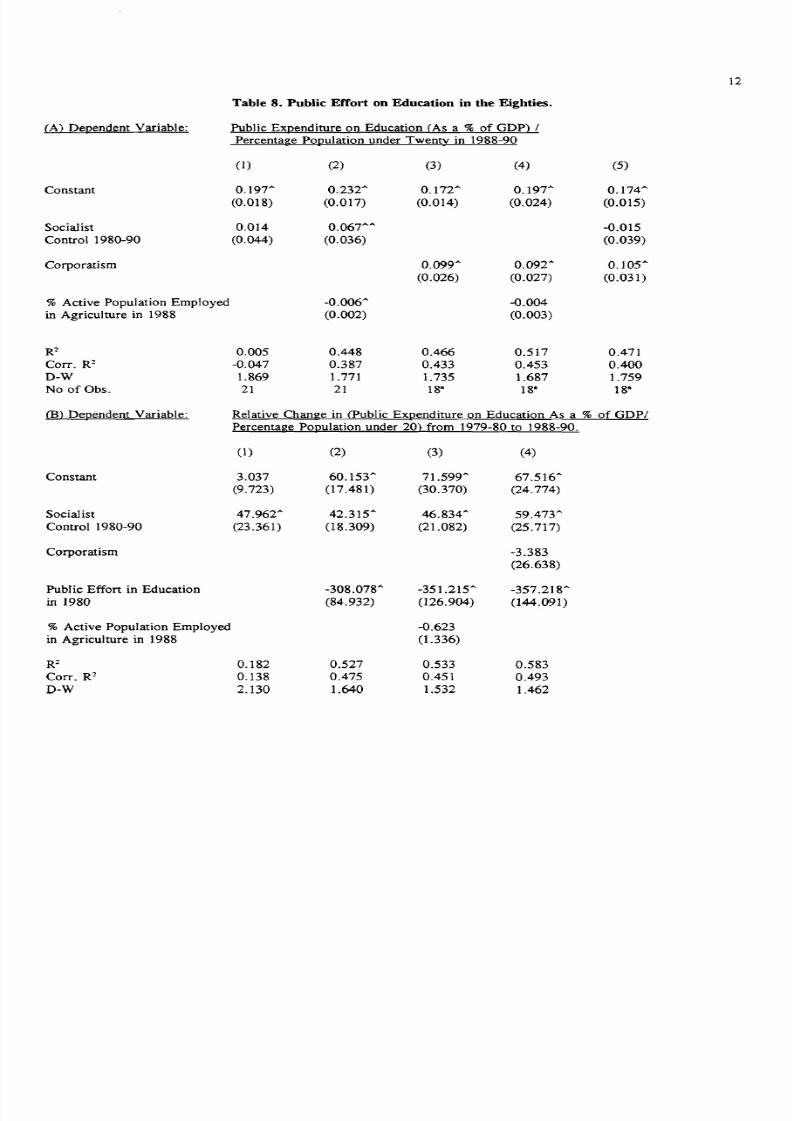
8/4/2019 The Trauma of Post-Communism (PCEE 50, 1999) Piotr Sztompka.
http://slidepdf.com/reader/full/the-trauma-of-post-communism-pcee-50-1999-piotr-sztompka 62/74
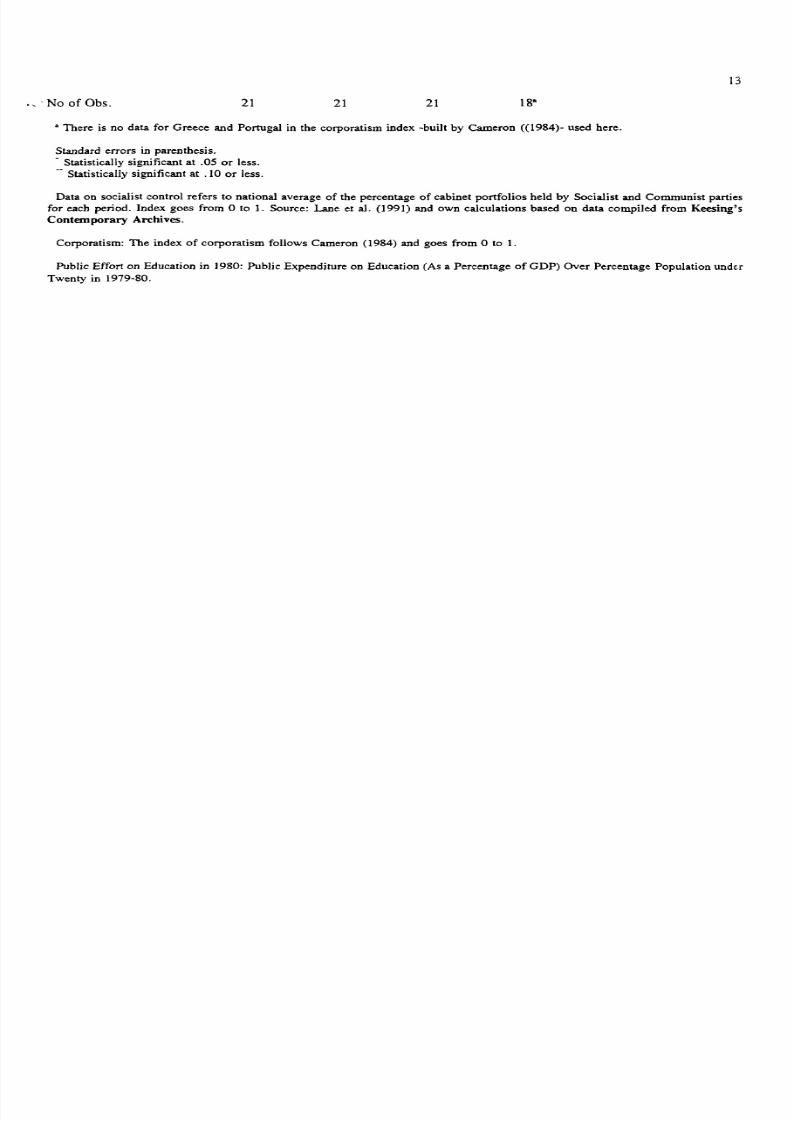
8/4/2019 The Trauma of Post-Communism (PCEE 50, 1999) Piotr Sztompka.
http://slidepdf.com/reader/full/the-trauma-of-post-communism-pcee-50-1999-piotr-sztompka 63/74
1 3
., . No of Obs. 21 21 21
• There is no data for Greece and Portugal in the corporatism index -built by Cameron «1984)- used here.
Standard errors in parenthesis .• Statistically significant at .05 or less .
.• Statistically significant at .10 or less.
Data on socialist control refers to national average of the percentage of cabinet portfolios held by Socialist and Communist parties
for each period. Index goes from 0 to 1. Source: Lane et al. (1991) and own calculations based on data compiled from Keesing's
Contemporary Archives.
Corporatism: The index of corporatism follows Cameron (1984) and goes from 0 to 1.
Public Effort on Education in 1980; Public Expenditure on Education (As a Percentage of GDP) Over Percentage Population under
Twenty in 1979-80.
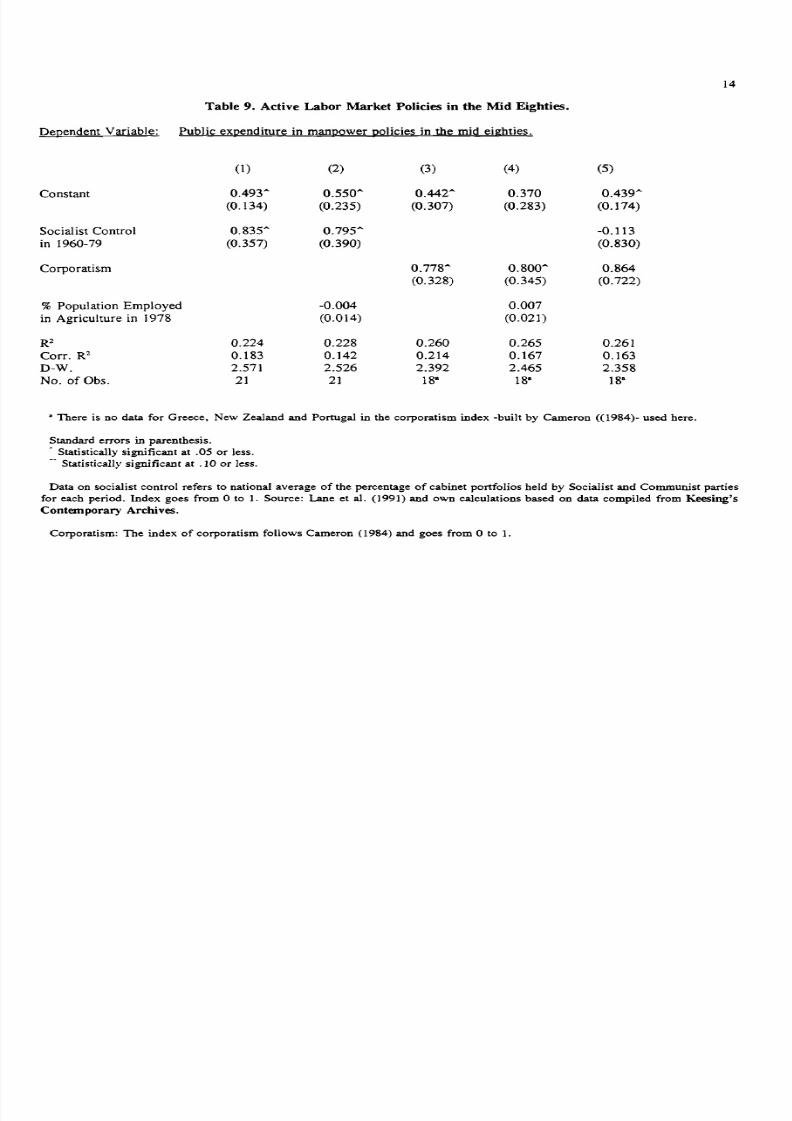
8/4/2019 The Trauma of Post-Communism (PCEE 50, 1999) Piotr Sztompka.
http://slidepdf.com/reader/full/the-trauma-of-post-communism-pcee-50-1999-piotr-sztompka 64/74
14
Table 9. Active Labor Market Policies in the Mid Eighties.
Dependent Variable: Public expenditure in manpower policies in the mid eighties.
(1) (2) (3) (4) (5)
Constant 0.493" 0.550'" 0.442" 0.370 0.439"
(0.134) (0.235) (0.307) (0.283) (0.174)
Socialist Control 0.835'" 0.795'" -0.113
in 1960-79 (0.357) (0.390) (0.830)
Corporatism 0.778'" 0.800'" 0.864
(0.328) (0.345) (0.722)
% Population Employed -0.004 0.007
in Agriculture in 1978 (0.014) (0.021)
R 2 0.224 0.228 0.260 0.265 0.261
Corr. R2 0.183 0.142 0.214 0.167 0.163
D-W. 2.571 2.526 2.392 2.465 2.358
No. of Obs. 21 21 18B 18B 18a
a There is no data for Greece, New Zealand and Portugal in the corporatism index -built by Cameron «(1984)- used here.
Standard errors in parenthesis.- Statistically significant at .05 or less.
-- Statistically significant at .10 or less.
Data on socialist control refers to national average of the percentage of cabinet portfolios held by Socialist and Communist parties
for each period. Index goes from 0 to 1. Source: Lane et al. (1991) and own calculations based on data compiled from Keesing's
Contemporary Archives.
Corporatism: The index of corporatism follows Cameron (1984) and goes from 0 to 1.
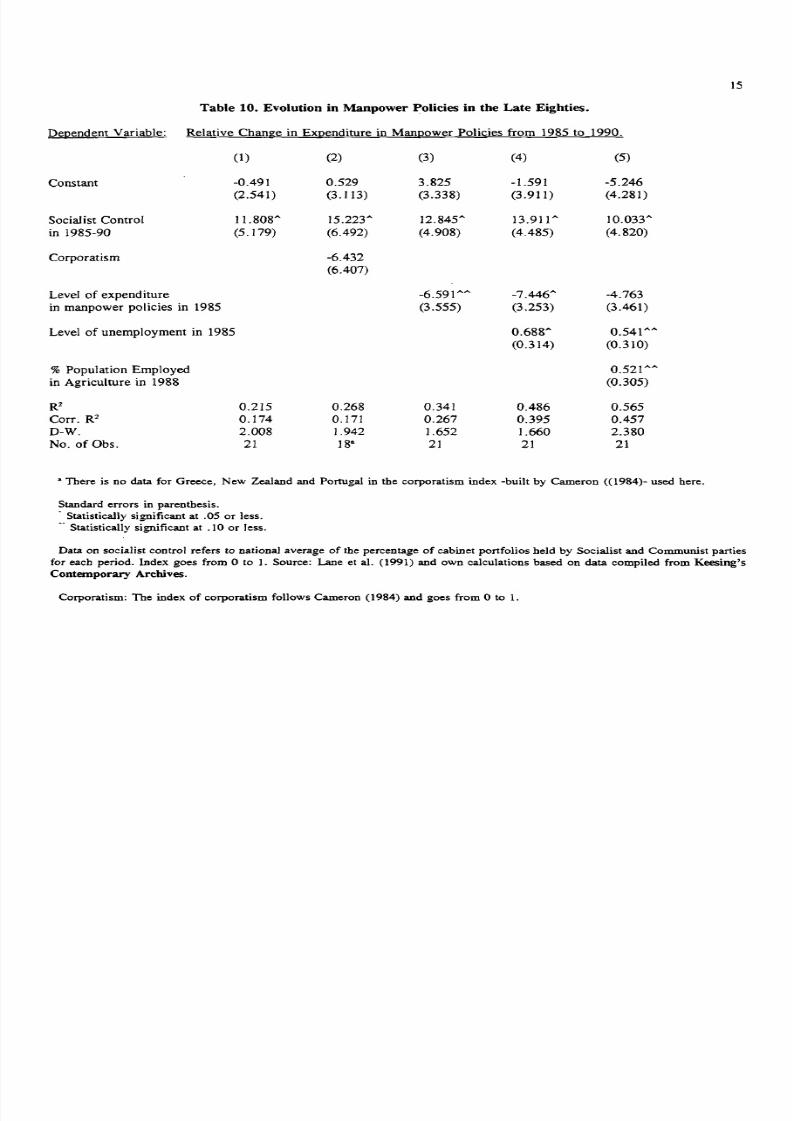
8/4/2019 The Trauma of Post-Communism (PCEE 50, 1999) Piotr Sztompka.
http://slidepdf.com/reader/full/the-trauma-of-post-communism-pcee-50-1999-piotr-sztompka 65/74
15
Table 10. Evolution in Manpower Policies in the Late Eighties.
Dependent Variable: Relative Change in Expenditure in Manpower Policies from 1985 to 1990.
(1) (2) (3) (4) (5)
Constant -0.491 0.529 3.825 -1.591 -5.246
(2.541) (3.113) (3.338) (3.911) (4.281)
Socialist Control 11.808 ..... 15.223 ..... 12.845 ..... 13.911 ..... 10.033 .....
in 1985-90 (5.179) (6.492) (4.908) (4.485) (4.820)
Corporatism -6.432
(6.407)
Level of expenditure -6.591 .......... -7.446 ..... -4.763in manpower policies in 1985 (3.555) (3.253) (3.461)
Level of unemployment in 1985 0.688 ..... 0.541 ..........
(0.314) (0.310)
% Population Employed 0.521 A.A
in Agriculture in 1988 (0.305)
R2 0.215 0.268 0.341 0.486 0.565
Corr. R2 0.174 0.171 0.267 0.395 0.457
D-W. 2.008 1.942 1.652 1.660 2.380
No. of Obs. 21 18a 21 21 21
a There is no data for Greece, New Zealand and Portugal in the corporatism index -built by Cameron «1984)- used here.
Standard errors in parenthesis .
. Statistically significant at .05 or less .
.. Statistically significant at .10 or less.
Data on socialist control refers to national average of the percentage of cabinet portfolios held by Socialist and Communist parties
for each period. Index goes from 0 to 1. Source: Lane et al. (1991) and own calculations based on data compiled from Keesing's
Contemporary Archives.
Corporatism: The index of corporatism follows Cameron (1984) and goes from 0 to 1.
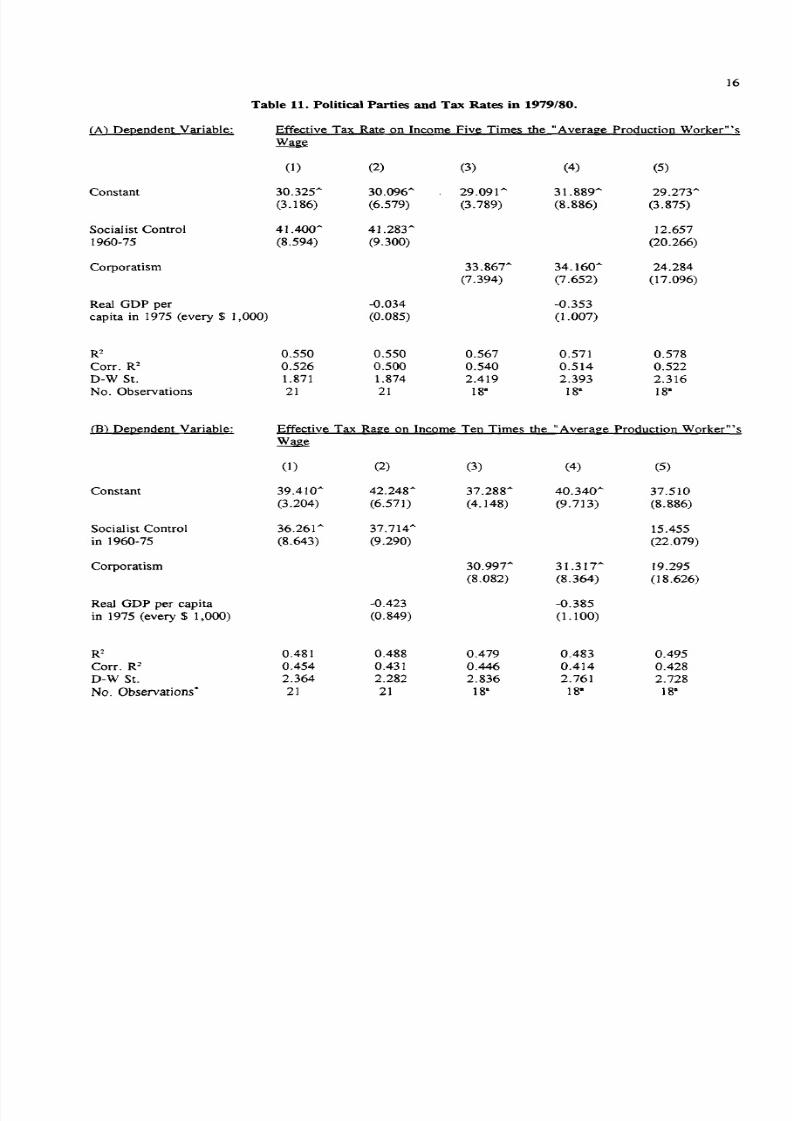
8/4/2019 The Trauma of Post-Communism (PCEE 50, 1999) Piotr Sztompka.
http://slidepdf.com/reader/full/the-trauma-of-post-communism-pcee-50-1999-piotr-sztompka 66/74
]6
Table 11. Political Parties and Tax Rates in 1979/80.
(A) OeQenden! Variable: Effective Tax Rate on Income Five Time~ the "Average Production Worker"'s
Wage
(1) (2) (3) (4) (5)
Constant 30.325'" 30.096'" 29.091'" 31.889" 29.273"
(3.186) (6.579) (3.789) (8.886) (3.875)
Socialist Control 41.400" 41.283'" 12.657
1960-75 (8.594) (9.300) (20.266)
Corporatism 33.867'" 34.160'" 24.284
(7.394) (7.652) (17.096)
Real GOP per -0.034 -0.353
capita in 1975 (every $ 1,000) (0.085) (1.007)
R2 0.550 0.550 0.567 0.571 0.578
Corr. R2 0.526 0.500 0.540 0.514 0.522
O-W St. 1.871 1.874 2.419 2.393 2.316
No. Observations 21 21 18B 18B 18B
(B) OeQendent Variable: Effective Tax Rage on Income Ten Times the "Average Produ~tion Worker'''s
Wage
(1) (2) (3) (4) (5)
Constant 39.410'" 42.248" 37.288" 40.340'" 37.510
(3.204) (6.571) (4.148) (9.713) (8.886)
Socialist Control 36.261 ,.. 37.714" 15.455
in 1960-75 (8.643) (9.290) (22.079)
Corporatism 30.997'" 31.317'" 19.295
(8.082) (8.364) (18.626)
Real GDP per capita -0.423 -0.385
in 1975 (every $ 1,0(0) (0.849) (1.100)
R2 0.481 0.488 0.479 0.483 0.495
Corr. RZ 0.454 0.431 0.446 0.414 0.428
D-W St. 2.364 2.282 2.836 2.761 2.728
N o . O b se rv a tio n s.
21 21 18" 18- 18B
8/4/2019 The Trauma of Post-Communism (PCEE 50, 1999) Piotr Sztompka.
http://slidepdf.com/reader/full/the-trauma-of-post-communism-pcee-50-1999-piotr-sztompka 67/74
17
a Greece, New Zealand and Portugal are here excluded from the sample because they are not included in index of
corporatism -built by Cameron «1984)- used here.
Standard errors in parenthesis .
. Statistically significant at .05 or less.
Socialist Control: Proportion of cabinet portfolios held by Socialist and Communist parties from 1960 to 1975. Index goes
from 0 to 1. Own calculations based on Lane et al. (1991).
Corporatism: The index of corporatism follows Cameron (1984) and goes from 0 to 1.
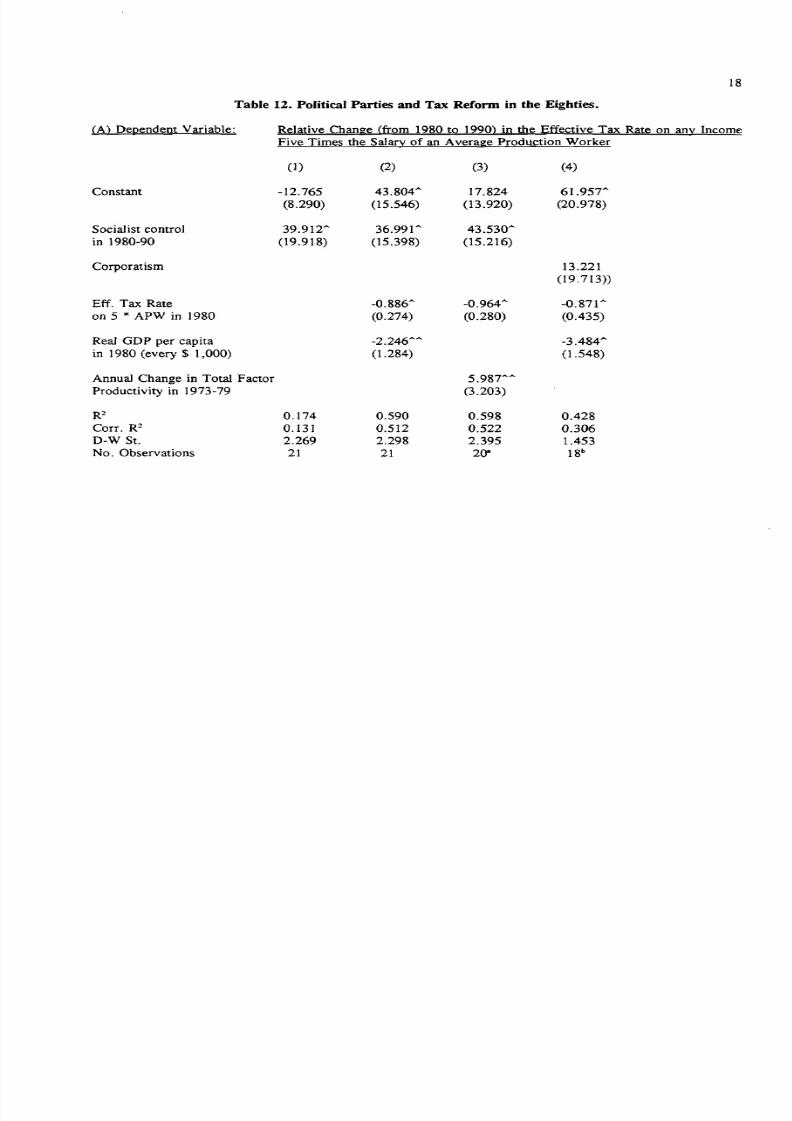
8/4/2019 The Trauma of Post-Communism (PCEE 50, 1999) Piotr Sztompka.
http://slidepdf.com/reader/full/the-trauma-of-post-communism-pcee-50-1999-piotr-sztompka 68/74
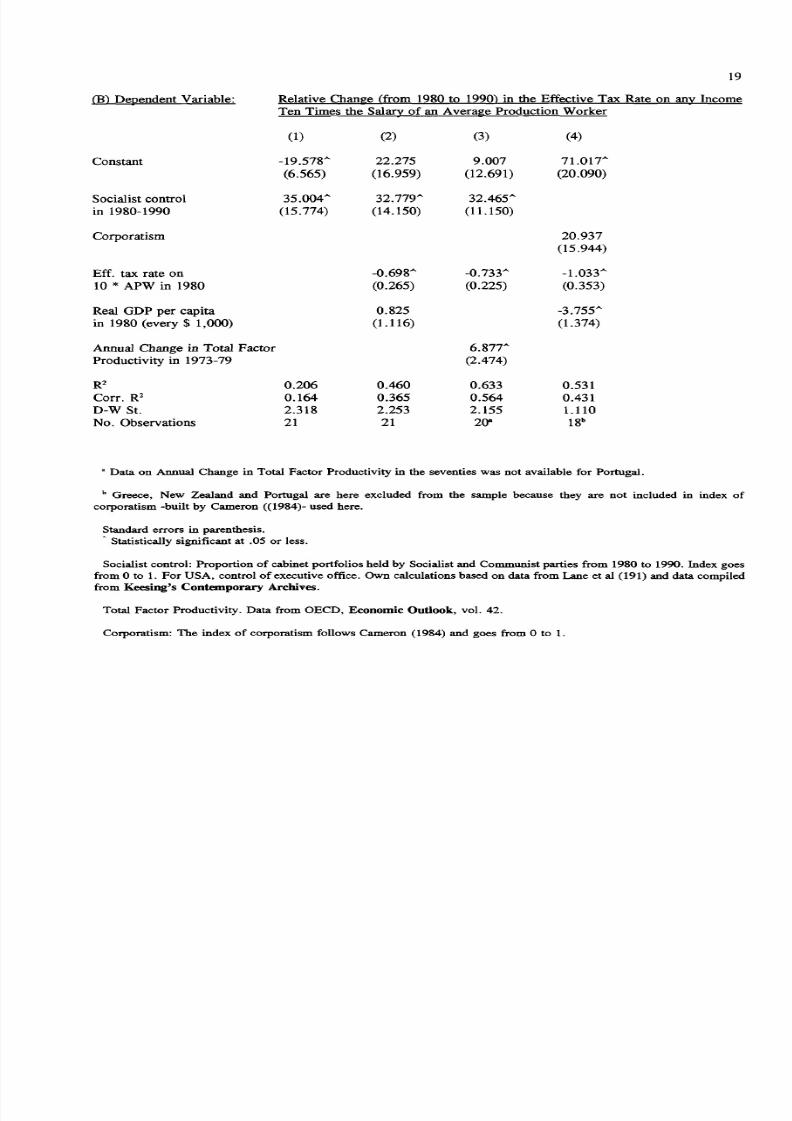
8/4/2019 The Trauma of Post-Communism (PCEE 50, 1999) Piotr Sztompka.
http://slidepdf.com/reader/full/the-trauma-of-post-communism-pcee-50-1999-piotr-sztompka 69/74
19
(B) De12endent Variable: Relative Change (from 1980 to 1990) in the Effective Tax Rate on an~ Income
Ten Times the Salary of an Average Production Worker
(1) (2) (3) (4)
Constant -19.578A
22.275 9.007 71.017A
(6.565) (16.959) (12.691) (20.090)
Socialist control 35.004A 32.779A
32.465A
in 1980-1990 (15.774) (14.150) (11.150)
Corporatism 20.937
(15.944)
Eff. tax rate on -0.698" -0.733" -1.033"
10 * APW in 1980 (0.265) (0.225) (0.353)
Real GDP per capita 0.825 -3.755"
in 1980 (every $ 1,000) (1.116) (1.374)
Annual Change in Total Factor 6.877"
Productivity in 1973-79 (2.474)
R2 0.206 0.460 0.633 0.531
Corr. R2 0.164 0.365 0.564 0.431
D-W St. 2.318 2.253 2.155 1.110
No. Observations 21 21 20" 18b
a Data on Annual Change in Total Factor Productivity in the seventies was not available for Portugal.
b Greece, New Zealand and Portugal are here excluded from the sample because they are not included in index of
corporatism -built by Cameron ((1984)- used here.
Standard errors in parenthesis .
• Statistically significant at .05 or less.
Socialist control: Proportion of cabinet portfolios held by Socialist and Communist parties from 1980 to 1990. Index goes
from 0 to 1. For USA, control of executive office. Own calculations based on data from Lane et al (191) and data compiled
from Keesing's Contemporary Archives.
Total Factor Productivity. Data from OBCD, Economic Outlook, vol. 42.
Corporatism: The index of corporatism follows Cameron (1984) and goes from 0 to 1.
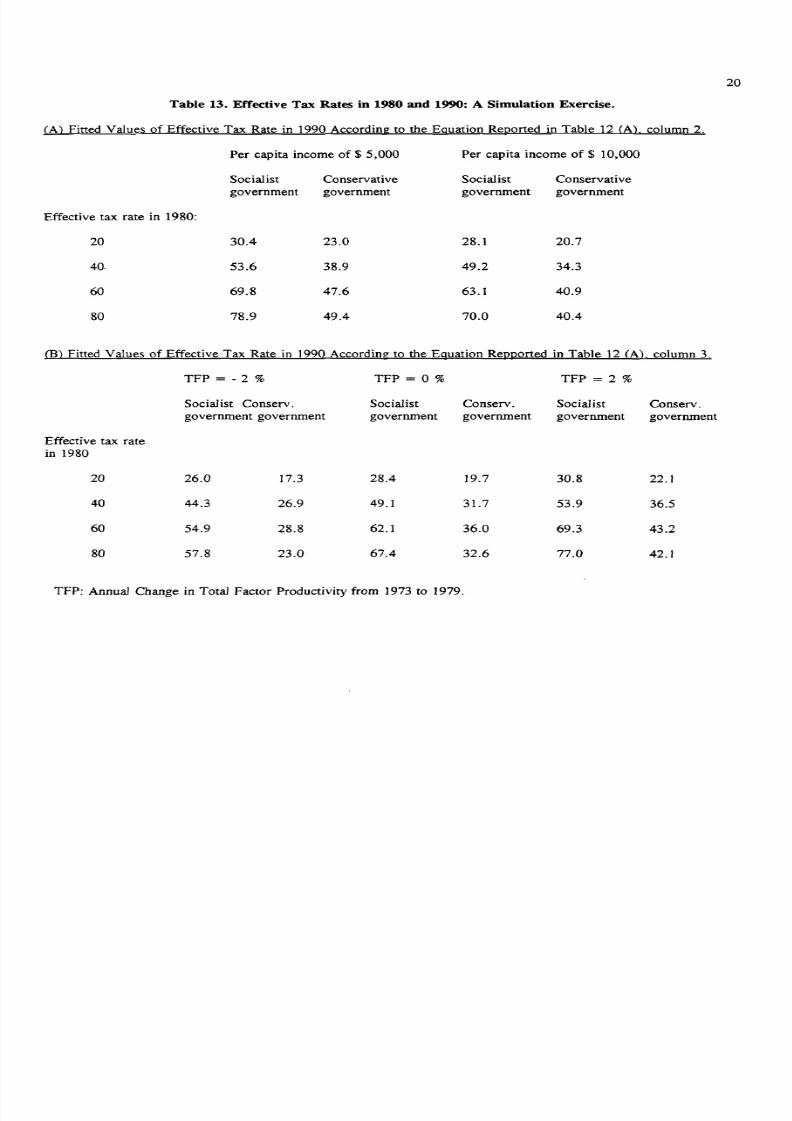
8/4/2019 The Trauma of Post-Communism (PCEE 50, 1999) Piotr Sztompka.
http://slidepdf.com/reader/full/the-trauma-of-post-communism-pcee-50-1999-piotr-sztompka 70/74
20
Table 13. Effective Tax Rates in 1980 and 1990: A Simulation Exercise.
(A) Fitted Values of Effective Tax Rate in 1990 According to the Equation Reported in Table 12 CA). column 2.
Per capita income of $ 5,000 Per capita income of $ 10,000
Socialist Conservative Socialist Conservative
government government government government
Effective tax rate in 1980:
20 30.4 23.0 28.1 20.7
40. 53.6 38.9 49.2 34.3
60 69.8 47.6 63.1 40.9
80 78.9 49.4 70.0 40.4
(B) Fitted Values of Effective Tax Rate in 1990 According to the Equation RepR0rted in Table 12 (A). column 3.
TFP=-2% TFP=O% TFP = 2 %
Socialist Conserv. Socialist Conserv. Socialist Conserv.
government government government government government government
Effective tax ratein 1980
20 26.0 17.3 28.4 19.7 30.8 22.1
40 44.3 26.9 49.1 31.7 53.9 36.5
60 54.9 28.8 62.1 36.0 69.3 43.2
80 57.8 23.0 67.4 32.6 77.0 42.1
TFP: Annual Change in Total Factor Productivity from 1973 to 1979.
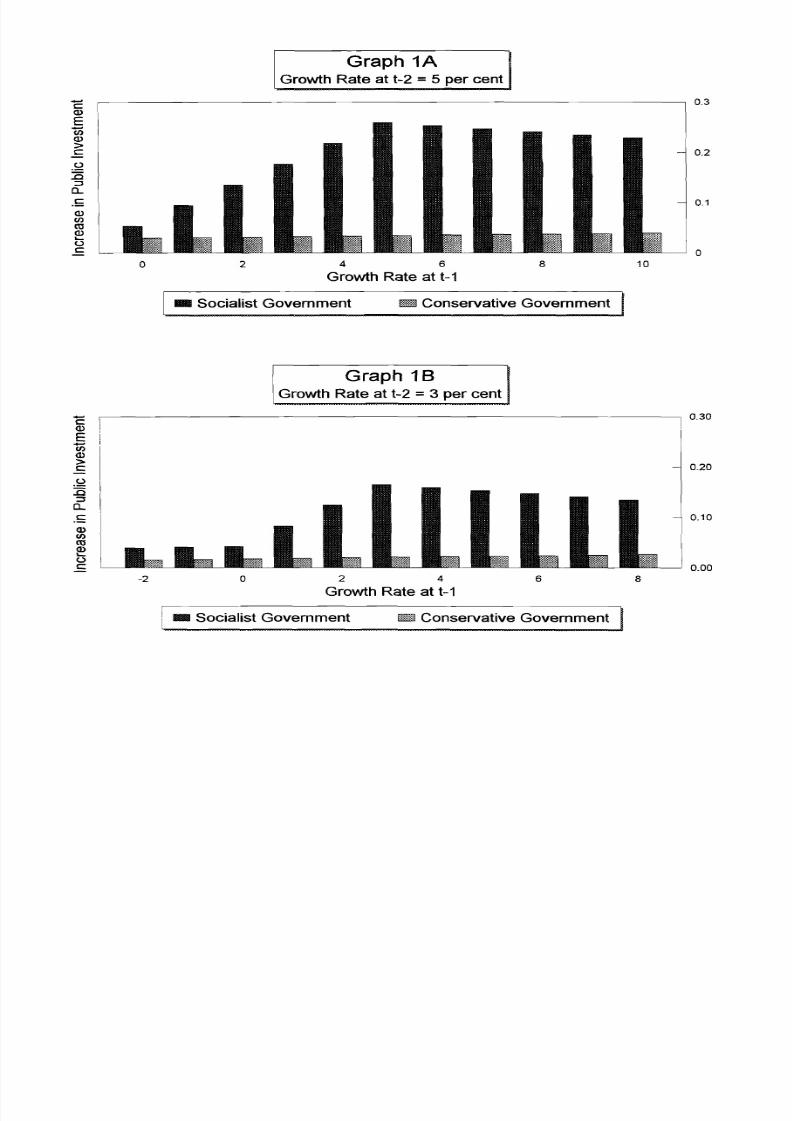
8/4/2019 The Trauma of Post-Communism (PCEE 50, 1999) Piotr Sztompka.
http://slidepdf.com/reader/full/the-trauma-of-post-communism-pcee-50-1999-piotr-sztompka 71/74
Graph 1AGrowth Rate at t-2 = 5 per cent
-:Q)
E-nQ)
>c
. S 2
::0::l
Q ..
.£:Q)
e nc oQ)r . . . .Uc:
0 4 6
Growth Rate at t-18 10
_ Socialist Government Ii l l l i l Conservative Government
Graph 18Growth Rate at t-2 = 3 per cent
-cQ)
E
-f;)
(].)
>c : :
. S 2
.0::lQ ..
.5(].)(f;)
c oQ)r . . . .Uc ::
-2 o 2 4
Growth Rate at t-1
8
I I I I I I I I Socialist Government Ii l l l i l Conservative Government
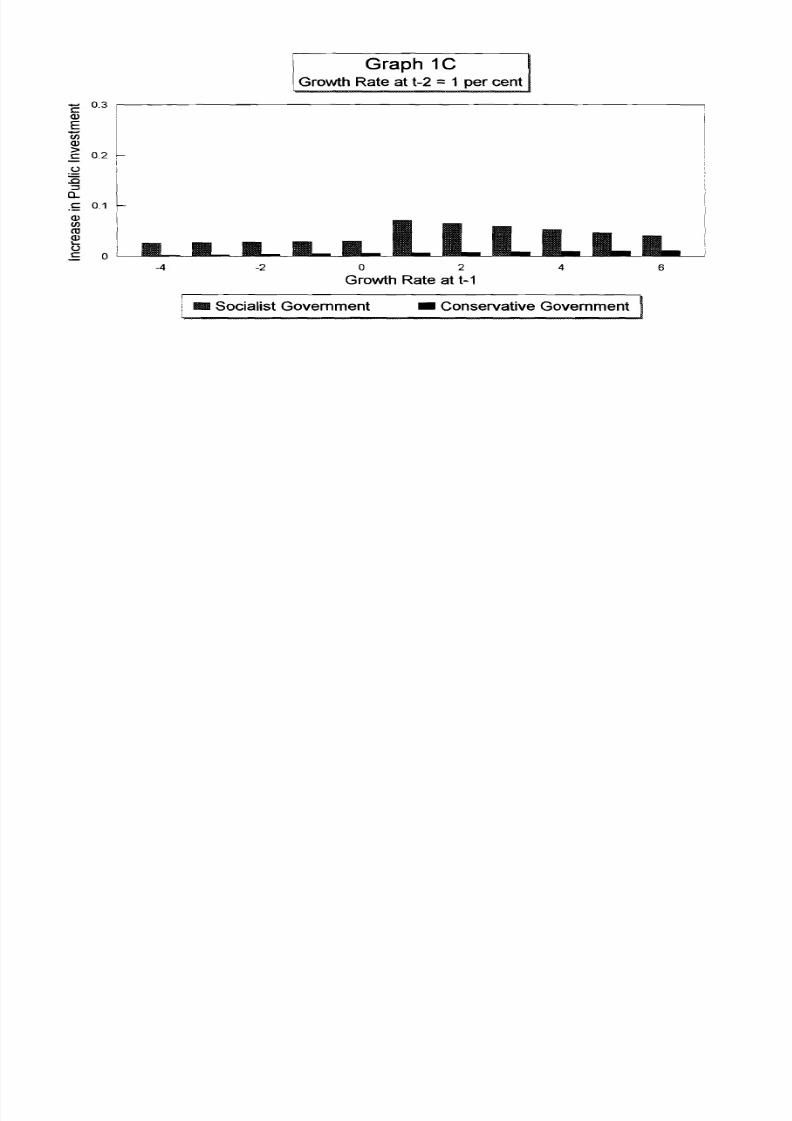
8/4/2019 The Trauma of Post-Communism (PCEE 50, 1999) Piotr Sztompka.
http://slidepdf.com/reader/full/the-trauma-of-post-communism-pcee-50-1999-piotr-sztompka 72/74
Graph 1CG row th Rate at t-2 = 1 per cent
_.. 0.3 r----------------------------------,c
t o J.~ 0.1
-4 -2 o 2G rowth Rate at t-1
4 6
_ S ocialis t G ov ernment - Conservative G overnm ent

8/4/2019 The Trauma of Post-Communism (PCEE 50, 1999) Piotr Sztompka.
http://slidepdf.com/reader/full/the-trauma-of-post-communism-pcee-50-1999-piotr-sztompka 73/74
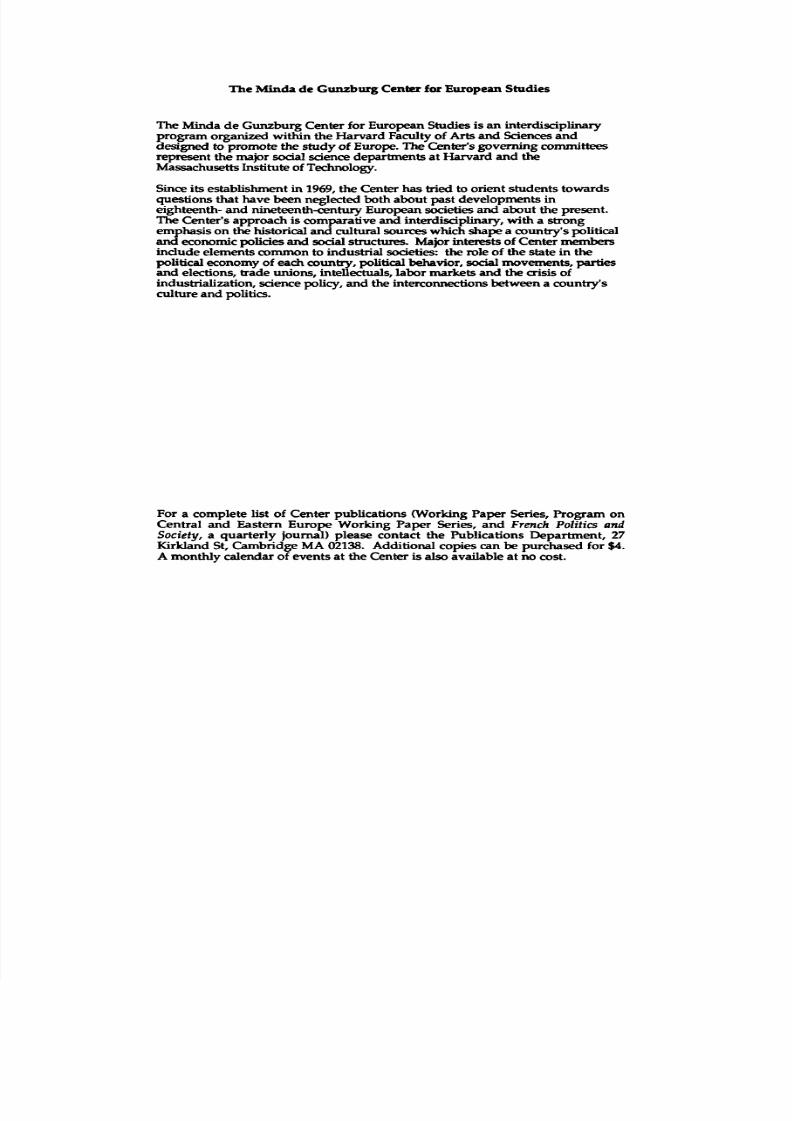
8/4/2019 The Trauma of Post-Communism (PCEE 50, 1999) Piotr Sztompka.
http://slidepdf.com/reader/full/the-trauma-of-post-communism-pcee-50-1999-piotr-sztompka 74/74
The Minda de Gunzburg Center for European Studies
The Minda de Gunzburg Center for European Studies is an interdisciplinaryprogram organized within the Harvard Faculty of Arts and Sciences and
designed to promote the study of Europe. The Center's governing committeesrepresent the major social science departments at Harvard and theMassachusetts Institute of Technology.
Since its establishment in 1969, the Center ha s tried to orient students towardsquestions that have been neglected both about past developments ineighteenth- and nineteenth-centwy European societies and about the present.The Center's approach is comparative and interdisciplinary, with a strongemphasis on the historical and cultural sources which shape a country's politicaland economic policies and social structures. Major interests of Center membersinclude elements common to industrial societies: the role of the state in thepolitical economy of each country, political behavior, social movements, partiesand elections, trade unions, intellectuals, labor markets and the crisis ofindustrialization, science policy, and the interconnections between a country's
culture and politics.
For a complete list of Center publications <Working Paper Series, Program onCentral and Eastern Europe Working Paper Series, and F r en ch P o li ti cs Ilnd
Society, a quarterly journal) please contact the Publications Department, 27Kirkland St, Cambridge MA 02138. Additional copies can be purchased for $4.A monthly calendar of events at the Center is also available at no cost.