Embed Size (px)
Citation preview

Ohanian, White, and Santini-Bell 1
1
For submission to the Transportation Research Board
Benefit Analysis of In-Place Load Testing for Bridges
Eric Ohanian1, Daniel White2 and Erin S. Bell3*
1 Bridge Engineer, DuBois & King, Inc., Laconia, NH 03246;
2Bridge Engineer, McFarland Johnson, Inc., Concord, NH
03301; 3Associate Professor and Chair, Department of Civil and Environmental Engineering, University of New
Hampshire, Durham, NH 03824 Telephone: (603) 862-1428, [email protected];
*Corresponding author
Word Count
Number of words in the abstract, text, and references
3509
Number of figures and tables 15
Total: 3509+ 15 × 250 = 7259 Max 7500
Abstract
With America’s aging bridges in desperate need of repair and replacement, careful safety monitoring procedures exist to distinguish between those in need of rehabilitation and those with remaining useable service life. The primary methods engineers use to monitor the condition of bridges is through bridge inspections and load ratings. Load rating is the analysis of the ability for structural components of a bridge to support the passage of live loads. Typical load ratings are calculated using the codified approximate analysis methods defined by AASHTO. It is the goal of this study to demonstrate that the load ratings calculated using AASHTO equations are overly conservative. This report identifies the shortfalls of traditional load ratings for bridges and discusses the benefits of in-place load testing. It demonstrates that code provisions are conservative and do not accurately reflect bridge behavior. This is shown using case studies of two (2) different bridges by comparing calculated distribution factors through traditional load rating techniques and distribution factors obtained using a calibrated model generated from in-place load tests. The results of this study show that performing in-place load tests and creating calibrated bridge models provide valuable information about the true system behavior of a bridge. This information, mainly in the form of updated live load distribution factors, can be used to calculate a more realistic load rating, which in turn can extend the service life of a bridge and allow the allocation of funds to a different project in need.
Introduction
The state of the nation’s infrastructure is a growing concern in the United States. While this has been a growing concern for many, the media has recently been given awareness to the general public that the nation’s bridges are in a state of disrepair. According to a 2015 tally of America’s bridges, 144,621 out of the nation’s 608,445 bridges (23.8%) are considered structurally deficient or functionally obsolete by the Federal Highway Association (Ingraham, 2015). Even though the bridges are not considered safe, many are still open to the public. Engineering Analysis is performed to determine the available capacities of the different bridges. The analysis enables bridges with structural deficiencies to remain open to the

Ohanian, White, and Santini-Bell 2
2
public, but with load restrictions. While posting bridges with load restrictions is better than closing them all together, postings inhibit a certain portion of the travelling public from crossing them, typically by weight. Weight restrictions for bridges have large economic and environmental impacts. Though many passenger vehicles can still cross most posted bridges, many large trucks carrying heavy cargo are forced to take detours. This induces a cost for the driver’s time as well as the time value of the cargo (Federal Highway Administration, 2015). The added travel times also results in additional pollution. The American Association of State Highway and Transportation Officials (AASHTO) sets the national standards for bridge design and analysis (AASHTO LRFD, 2014). Using the AASHTO code for determining bridge postings is the traditional method of load rating a bridge. However, advanced analysis is permitted to more accurately determine the load limitations of bridges if they have failed to meet the necessary requirements under the codified approximate analysis. Using broad brush codes does not accurately depict the true capacity of bridges. In-place load testing is an example of an advanced method of analysis to determine load ratings. Load ratings determined from traditional techniques can often be more-conservative than in-place load testing. Using conservative load rating techniques is a safe, but theoretical approach compared to in-place load tests, as demonstrated by a study at the University of Iowa (University, 2010). Traditional load rating results are a conservative representation of the capacity of bridges because field inspections are subjective, material properties are assumed, and code provisions are elemental. Load ratings are often determined based on field data including material properties and structural condition. Field inspections are limited in accuracy because bridge inspectors are typically only able to inspect limited portions of bridges due to limited access. Though resources are available for conducting reliable bridge inspection practices, field inspections remain subjective and qualitative (National Cooperative Highway Research Program, NCHRP, 2014). In addition, many bridge components are buried underground or in contact with other components, making it impossible to inspect without performing destructive testing or using advanced equipment which may be cost prohibitive to obtain. As a result, certain deficiencies may remain unidentified. For example, an inspector might not identify the following deficiencies:
Spalled or severely cracked concrete footings or the back-side of a buried abutment
Scoured away material replaced with poor quality material under the footings
Deterioration (rot or rust) at the interfaces between members
Deterioration (rot or delamination) internal to members (timbers, bridge decks, etc.) The Federal Highway Association performed a study in 2001 that investigated the reliability of visual inspections for highway bridges. By having multiple state bridge inspectors perform the same inspection tasks for different bridges, the FHWA determined there was a “significant variability” between inspection ratings (Federal Highway Administration, 2001). Visual inspections are a crucial part of evaluating a bridge, but the load ratings are only as reliable as the information collected in the field. Since this 2001 study, guidelines have been proposed for reliability-based bridge inspection practices from the NCHRP (National Cooperative Highway Research Program, NCHRP, 2014). Variability and inherent qualitative nature of visual inspections still persist spawning research in the application of machine learning and computer vision to visual inspection (Khaloo & Lattanzi, 2015).

Ohanian, White, and Santini-Bell 3
3
Material properties are often assumed when conducting engineering analysis. Historically, bridge documents were not well-kept or saved for future use. When engineers perform load ratings, they often have difficulties with identifying material properties for the different bridge components. They are often uncertain of concrete strength, timber species, or steel strength. It is possible for samples to be sent to laboratories for analysis, but it is less-costly and easier for the engineer to conservatively assume material properties. For example, a concrete bridge deck may have been constructed with 5,000psi concrete, but an engineer without as-built record may analyze the deck by conservatively assuming 4,000psi concrete. Alternatively, an engineer with insufficient bridge documentation may conservatively assume a timber species as Spruce-Pine-Fir (Fb=1,250psi) over Southern Pine (Fb=1,600psi) (American Wood Council, 2012). Though this is the safe approach, this inherently results in a conservative load rating and inaccurate bridge posting. Bridge codes cover all types of bridges, which has both positive and negative effects. It is positive in the sense that it creates uniformity and it draws lines for what is acceptable and what is not. It is negative in the sense that bridges are unique and behave differently from one another. Since the codes are broad in content, they tend to have provisions which are conservative. While being conservative is a safe approach, advanced analysis can provide a more accurate result. Traditional load ratings may result in a load posting while the bridge may potentially have additional load capacity present. Advanced analysis is more costly than traditional analysis, but reserve capacity may be identified and eliminate a need for a bridge posting, which can save money in the long run. Advanced three-dimensional analysis is only as good as assumptions used to create the model. Calibrating a structural model with collected structural response data increases the confidence level of bridge owner and managers in the model results. A calibrated model can be included in the traditional load rating process to provide appropriately conservative load rating factors for increased efficiency and safety of critical bridge structures.
Proposed Methodology
It is the goal of this study to show that distribution factors calculated from AASHTO equations do not accurately depict how loads are transferred through bridges, and are overly conservative for use in load rating. Distribution factors represent the percentage of live load acting on the main load carrying members of a bridge structure. They are significant because the live load applied to a bridge member is directly proportional to the distribution factor used in calculation. Similarly, as shown in Equation 1 below, the rating factor (RF) of a bridge is inversely proportional to the applied live load (AASHTO MBE, 2011).
Equation 1: LRFR equation for calculating the load rating factor (AASHTO MBE, 2011)
𝑅𝐹 = 𝐶 − (𝛾𝐷𝐶)(𝐷𝐶) − (𝛾𝐷𝑊)(𝐷𝑊) ± (𝛾𝑃)(𝑃)
(𝛾𝐿𝐿)(𝐿𝐿 + 𝐼𝑀)
What this shows is that if there are methods of accurately and confidently reducing the distribution factor used in load rating calculations, then these methods may result in significant increases in rating factors, and possibly reduce the need for closures or repairs. The AASHTO Manual for Bridge Evaluation (MBE) lays out the procedure to follow for load rating a bridge in a convenient flow chart, which is provided below in Figure 1. The bridge is evaluated at several confidence levels using the codified analysis method set forth by AASHTO. As seen in the chart, bridges that fail to meet the proper strength requirements (have rating factors less than 1.0) for design and legal loads either have the option to initiate load posting or repairs,

Ohanian, White, and Santini-Bell 4
4
or to undergo a method of higher level evaluation. It is at this stage that in-place load testing and structural modeling can be employed in an attempt to demonstrate that the bridge still has reserve capacity. By performing in-place load tests on bridges, engineers can develop and calibrate an accurate model of a bridge and compare the results to those of traditional load ratings. The primary goal for load testing a bridge is to physically measure the actual distribution factors of the main structural components by applying a vehicular load of known size and location and measuring the structural response of the bridge members in the forms of strains or deflections.

Ohanian, White, and Santini-Bell 5
5
Figure 1: Load and Resistance Factor Rating Flow Chart (AASHTO MBE, 2011)

Ohanian, White, and Santini-Bell 6
6
This study shows that distribution factors calculated using AASHTO’s codified equations are conservatively high, and that load testing is a reliable and cost effective way to reduce the number of postings and repairs without jeopardizing public safety. This will be accomplished by presenting two case studies in which distribution factors were calculated three ways: 1) traditional AASHTO equations, 2) uncalibrated computer models based only on design plans, and 3) computer models created from design plans and calibrated with load testing data. The structural models were created using CSiBridge 2015. Distribution factors calculated using models were found by applying an HS-20 truck loading to a single lane across the bridge. The distribution factors were then calculated using Equation 2 below.
Equation 2: Calculation of Model-based Distribution Factors
𝐷𝐹𝑖 =𝑀𝑖
∑ 𝑀𝑖𝑛𝑖=1
Where DFi is the distribution factor and Mi is the measured moment of the ith girder and n is the number of girders on the bridge. The same general equation was used in calculating the distribution factors for shear.
Case Studies
The Rollins Road Bridge The first case study was the Rollins Road Bridge in Rollinsford, NH. The Rollins Road Bridge is a simply supported precast concrete bridge and was newly constructed in the year 2000. It consists of five NE1400 bulb tee girders with a span of 110’-0” from center-center of bearing and out-to-out width of 34’-6” supporting two lanes of traffic. The bridge deck is an 8-inch cast-in-place deck that is reinforced with carbon fiber reinforcement polymers (CFRP). Figure 2 below shows a photograph of the bridge in elevation view and Figure 3 shows the typical section of the bridge.
Figure 2: Rollins Road Bridge in Elevation View (Sipple, 2008)
Ohanian, White, and Santini-Bell 7
7
This bridge was chosen for use in this study because of the large amount of data readily available. The bridge was constructed through funding by the Innovative Bridge Research and Construction (IBRC) program. This program required the bridge be constructed with innovative materials and for it to be instrumented to monitor the performance of those materials. This made the Rollins Road Bridge a prime candidate for use in studies involving load testing, as strain and temperature gauges were actively incorporated into the bridge’s construction.
Figure 3: Rollins Road Bridge Typical Section (NHDOT, 1999)
In Sipple’s Master of Science Thesis titled “Structural Modeling and Monitoring of the Rollins Road Bridge for Condition Assessment”, Sipple used the bridge’s instrumentation and load testing data to develop a calibrated computer model of this bridge (Sipple, 2008), which was used for this study. The general idea of how the model was calibrated was by systematically updating the individual structural properties and parameters of the major components until the calculated strains of the model matched the measured strains of the load test when the same vehicular loads were applied. The main structural components that were modified during the calibration process were the CFRP reinforced deck, the NEBT concrete girders, the circular steel-reinforced elastomeric bearing pads, and the concrete bridge rail. Although typically not treated as a structural component, the concrete bridge rail in reality does provide some structural capacity, and therefore was important to include in the model. Figure 4 is a isometric view of the structural model as created in SAP2000®. Table 1 show the model calibration parameters adjusted for the bearing pad stiffness values and the inclusion of deck and railing parameters in the model. Figure 5 shows the analytical strain response due to truck loading as compared to the collected strain data during the field load test.

Ohanian, White, and Santini-Bell 8
8
Table 1 Model Parameter Cases for the Rollins Road Bridge
Figure 4: General View of the Rollins Road Bridge Calibrated Model
Vertical
Stiffness
Rotational
Stiffness
Horizontal
StiffnessModification
(kips/in) (kips/rad) (kips/in)
Case 1a 46833 224651.5 10000
Case 2a 46833 224651.5 10000 No CFRP
Case 3a 46833 224651.5 10000 No Prestress
Case 4a 46833 224651.5 10000 No Bridge Rail

Ohanian, White, and Santini-Bell 9
9
Figure 5 Model Calibration for the Rollins Road Bridge (Sipple, 2008)
Rollins Road Bridge Case Study Results The results of the moment distribution factors are identified in Table 1 and the results of the shear distribution factors are identified in Table 2. The calculated percent differences are between the calibrated model and AASHTO values.
Table 2: Live Load Distribution Factors for Moment, Rollins Road Bridge
Girder Exterior 1st Interior 2nd Interior
Uncalibrated Model DF 0.233 0.227 0.220
Calibrated Model DF 0.254 0.238 0.248
AASHTO DF 0.580 0.642 0.642
Calibrated DF vs Uncalibrated DF 9% 5% 13%
Calibrated DF vs AASHTO DF 129% 170% 159%
Total Change in Rating Factor 229% 270% 259%

Ohanian, White, and Santini-Bell 10
10
Table 3: Live Load Distribution Factors for Shear, Rollins Road Bridge
The results show that standard moment distribution factors calculated by AASHTO are 130-170% higher than those predicted by a calibrated model. Since moment capacity typically controls the rating factor of a bridge, this correlates to the rating factor of the Rollins Road Bridge more than doubling. This is a great example to demonstrate the benefit of load testing a bridge. The Bagdad Road Bridge The second case study was performed on the Baghdad Road Bridge in Durham, NH. The Baghdad Road Bridge, built in 1966, is a symmetrical four span bridge with two interior spans of 60’-0” and two exterior spans of 45’-0”. It is constructed of six W36x135 steel girders on rocker bearings, and has a cast-in-place deck with an out-to-out width of 42’-0” that carries two lanes of traffic over US Route 4. Figure 6 shows an elevation view of the bridge, and Figure 7 shows the typical section from the design plans.
Figure 6: Bagdad Road Bridge as seen from US Route 4 Westbound (Google Maps, 2015)
Figure 7: Bagdad Road Bridge Typical Section (Wright & Pierce, 1965)
Girder Exterior 1st Interior 2nd Interior
Uncalibrated Model DF 0.264 0.288 0.328
Calibrated Model DF 0.277 0.295 0.364
AASHTO DF 0.580 0.773 0.773
Calibrated DF vs Uncalibrated DF 5% 3% 11%
Calibrated DF vs AASHTO DF 109% 162% 112%
Total Change in Rating Factor 209% 262% 212%
Ohanian, White, and Santini-Bell 11
11
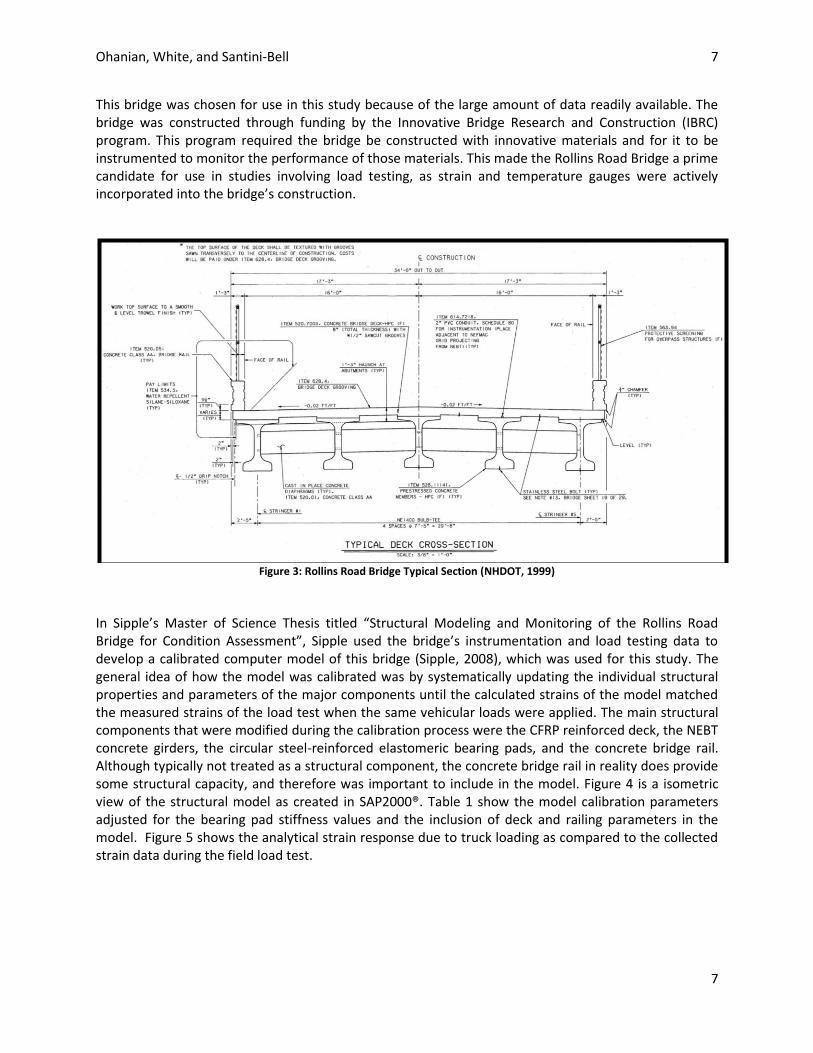
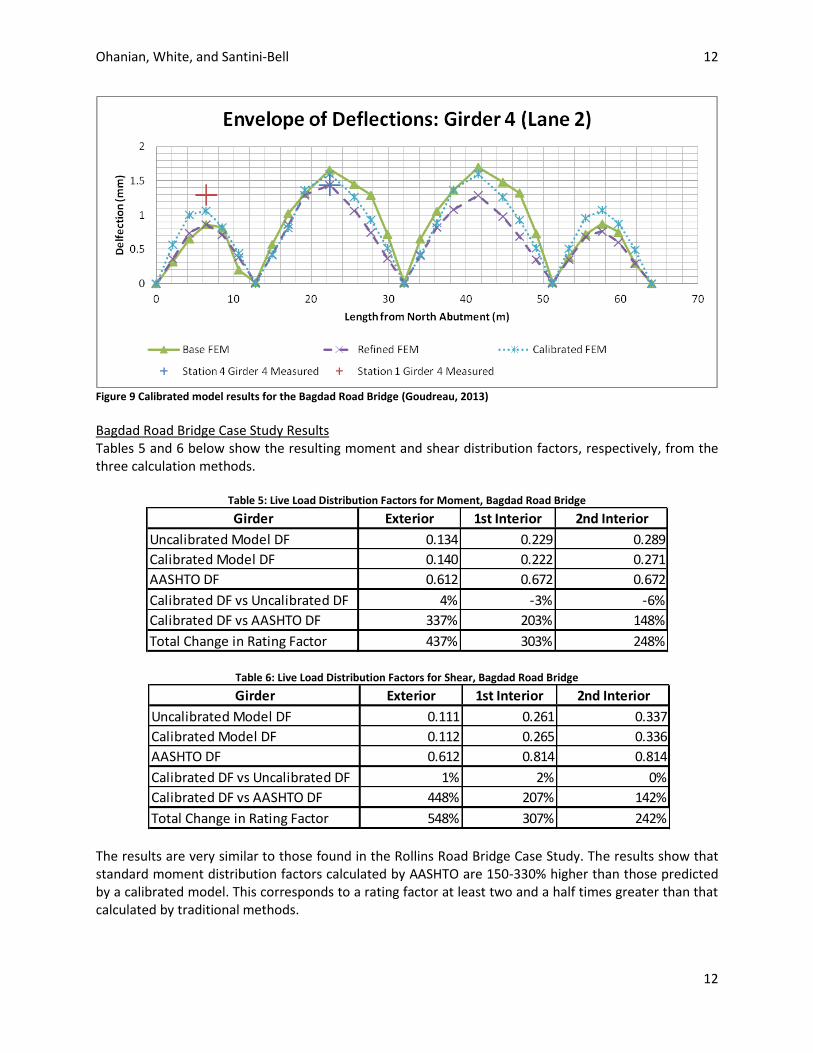
The Bagdad Road Bridge was chosen for use during this study for several reasons. Its close proximity to the UNH Durham campus was ideal as it made planning and deploying field tests very easy. Its symmetrical design and the fact that two spans were not over traffic (note the right side of the bridge in Figure 5) allowed for easy installation of instrumentation without impacting the flow of traffic. Lastly, the bridge is of unique construction. The beams were field welded at pier locations after the application of the deck, making the beams behave as simply supported for dead loads but continuous under live loads. The calibrated bridge model used in this study was created by Adam Goudreau for use in his Master Thesis titled: “Digital Image Correlation as an Inspection Tool for Assessing Bridge Health” (Goudreau, 2013). The main focus for calibrating the model was by adjusting the rotational stiffness of the rocker bearings until deflections measured during a load test matched those produced by the model. A similar calibration process was used to refine the structural model for inclusion of the model data in the load rating protocol. As shown in Figure 7, there is significant camber in the bridge. This characteristics was measured using survey equipment and included in the model refinements, see Table 4. Figure 9 show the calibrated model with respect the deflection measurements capture using digital image correlation.
Figure 8: Calibrated Model for the Bagdad Road Bridge
Table 4 Structural Parameters for Model Calibration for the Bagdad Road Bridge (Goudreau, 2013)
Model Description
Base FEM Based on Available Bridge Plans
Refined FEM Include camber and cover plates
Calibrated FEM Include Rotational Spring for Bearing Pads
Ohanian, White, and Santini-Bell 12
12
Figure 9 Calibrated model results for the Bagdad Road Bridge (Goudreau, 2013)
Bagdad Road Bridge Case Study Results Tables 5 and 6 below show the resulting moment and shear distribution factors, respectively, from the three calculation methods.
Table 5: Live Load Distribution Factors for Moment, Bagdad Road Bridge
Table 6: Live Load Distribution Factors for Shear, Bagdad Road Bridge
The results are very similar to those found in the Rollins Road Bridge Case Study. The results show that standard moment distribution factors calculated by AASHTO are 150-330% higher than those predicted by a calibrated model. This corresponds to a rating factor at least two and a half times greater than that calculated by traditional methods.
Girder Exterior 1st Interior 2nd Interior
Uncalibrated Model DF 0.134 0.229 0.289
Calibrated Model DF 0.140 0.222 0.271
AASHTO DF 0.612 0.672 0.672
Calibrated DF vs Uncalibrated DF 4% -3% -6%
Calibrated DF vs AASHTO DF 337% 203% 148%
Total Change in Rating Factor 437% 303% 248%
Girder Exterior 1st Interior 2nd Interior
Uncalibrated Model DF 0.111 0.261 0.337
Calibrated Model DF 0.112 0.265 0.336
AASHTO DF 0.612 0.814 0.814
Calibrated DF vs Uncalibrated DF 1% 2% 0%
Calibrated DF vs AASHTO DF 448% 207% 142%
Total Change in Rating Factor 548% 307% 242%

Ohanian, White, and Santini-Bell 13
13
Conclusions
By comparing the results between the distribution factors determined using calibrated models to those calculated using AASHTO, it can be seen that AASHTO values are far more conservative in the amount of live load distributed to the girders than that predicted by the model. AASHTO predicts that the structural response of the individual girders will be two to four times greater than those predicted by the model. This study shows the benefits of performing an in-place load test creating a calibrated model. If a bridge fails to meet the minimum safety requirements of a load rating by following the approximate analysis methods presented by AASHTO, then it is possible that in-place load testing and creation of a calibrated model can prove the structure has reserve capacities and is in fact safe for large truck loads. However, it should be fully understood that the accuracy of the results produced by the model are directly related to the accuracy of the data collected during the load test, and that the AASHTO distribution factors have been created to meet a certain level of reliability. With improvements in the available technologies for conducting load testing as well as the improvements in the computing power of structural analysis software, load testing and model validation should soon become regular, reliable tools used in the evaluation of load restrictions and rehabilitation decision making process.

Ohanian, White, and Santini-Bell 14
14
Acknowledgements
This research was supported by the Research Advisory Council of the New Hampshire Department of Transportation, the CAREER program at the NSF (0644683) and Dividsion of Civil, Mechanical and Manufacturing Innovation at the NSF (1334160). The authors would like to acknowledge the technical input of Jesse Sipple at Bridge Diagnostics and Adam Goudreau at VHB.
Bibliography
AASHTO LRFD. (2014). LRFD Bridge Design Specifications. American Association of State Highway and Transportation Officials.
AASHTO MBE. (2011). The Manual for Bridge Evaluation, Second Edition. American Association of State Highway and Transportation Officals.
American Wood Council. (2012). 2012 National Design Specification, Supplement, Design Values for Wood Construction.
Federal Highway Administration. (2001). Reliability of Visual Inspection for Highway Bridges, Publication Number: FHWA-RD-01-020. United States Department of Transportation - Federal Highway Administration.
Federal Highway Administration, D. o. (2015, June 18). Presentation of Study Technical Results, Public Meeting #4. USDOT / MAP-21 Comprehensive Truck Size and Weight Limits Study.
Google Maps. (2015, Decemeber). Google Maps. Retrieved from Google: https://www.google.com/maps/@43.1425244,-70.9164717,3a,75y,336.26h,88.05t/data=!3m6!1e1!3m4!1sd2uKeK1uRALWPvknDPto2Q!2e0!7i13312!8i6656
Goudreau, A. (2013). Digital Image Correlation as an Inspection Tool for Assessing Bridge Health. Durham, NH: University of New Hampshire.
Ingraham, C. (2015, February 4). Mapping America’s most dangerous bridges. Retrieved March 21, 2015, from The Washington Post: http://www.washingtonpost.com/blogs/wonkblog/wp/2015/02/04/mapping-americas-most-dangerous-bridges/
Khaloo, A., & Lattanzi, D. (2015). Hierarchical Computer Vision Approach to Infrastructure Inspection. Computing in Civil Engineering, 540-547.
National Cooperative Highway Research Program, NCHRP. (2014). Proposed Guideline for Reliability-Based Bridge Inspection Practices. Washington D.C.: Transportation Research Board of the National Academies.
NHDOT. (1999). Deck Section. Rollins Road Over B & M Railroad and Main Street. State of New Hampshire, Department of Transportation, Bureau of Bridge Design.
Sipple, J. D. (2008). Structural Modeling and Monitoring of the Rollins Road Bridge for Condition Assessment. Durham, NH: University of New Hampshire.
University, I. S. (2010). Diagnostic Load Testing May Reduce Embargoes. Bridge Engineering Center. Wright & Pierce. (1965). Structural Steel. Bagdad Road over U.S. Rte #4. State of New Hampshire,
Department of Public Works and Highways, Bridge Design Division.