Embed Size (px)
Citation preview

THE TRANSPORT SYSTEM IS UNDER PRESSURE
Asset Management and Maintenance in Volatile Demand
1
© MobLab 2020

© MobLab 2020
Transport System - General
Demand Offer Assetsadaptation Operation

© MobLab 2020
Mild-Hybrid Diesel: 500’000 USD
Electric with Battery: 800’000 USD
Narrow-body: 100’000’000 USD
Widebody: 250’000’000 USD Locomotive: 4’500’000 USD
Train composition: 25’000’000 USD
InternationalRegulationand Laws
NationalCertifications
International RegulationNational Laws
Vehicles
Life:10-15 y
Life:1.5m km
Life: 40 y

© MobLab 2020
5
Why maintenance?In general context:● To maintain operational stability● To protect the asset (value)● To protect the company (safety)
In a volatile demand (drop):● To minimize the risk● To protect the asset (value)● To reduce costs (operation)● To protect the company (safety)

© MobLab 2020
Public Transport System in CHE (Switzerland)
Demand Offer Assetsadaptation Operation
MARKETDEMAND
GOVERNMENT REQUESTS

© MobLab 2020
Public Transport System in CHE (Switzerland)
Demand Offer Assetsadaptation Operation
MARKETDEMAND
GOVERNMENT REQUESTS
SERVICES
SCHEDULING

© MobLab 2020
Public Transport System in CHE (Switzerland)
Demand Offer Assetsadaptation Operation
MARKETDEMAND
GOVERNMENT REQUESTS
SERVICES
SCHEDULING
CAPEX
FLEET
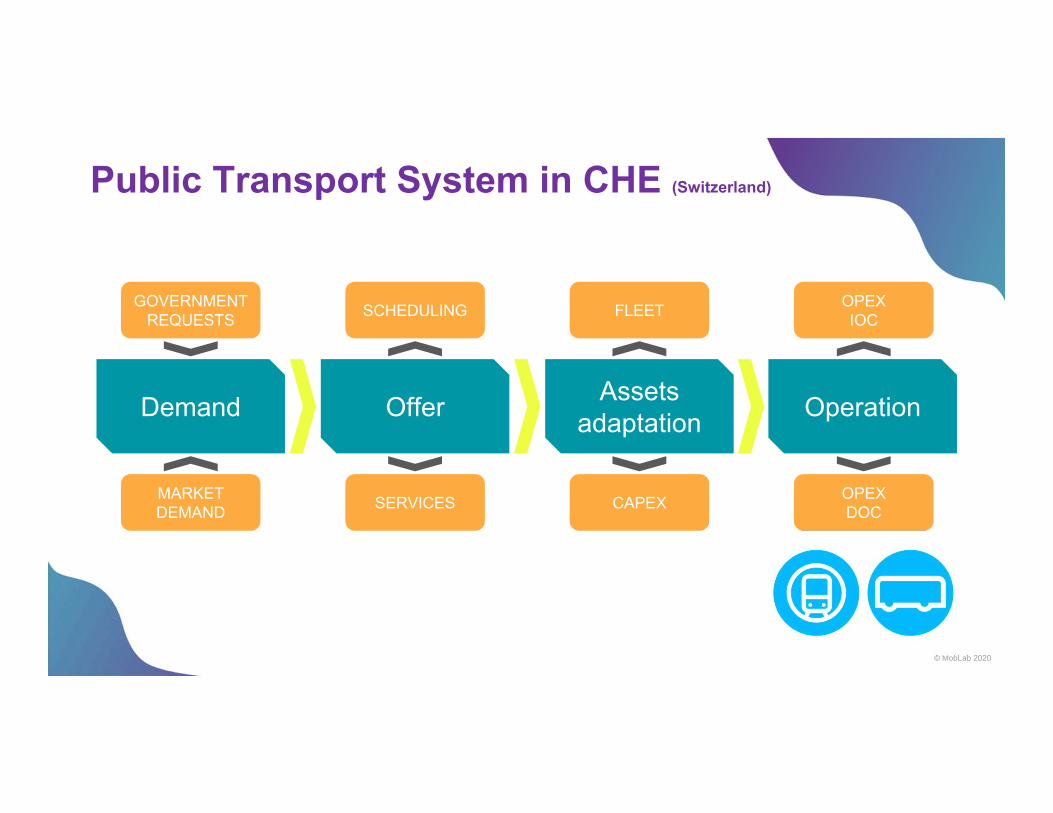
© MobLab 2020
Public Transport System in CHE (Switzerland)
Demand Offer Assetsadaptation Operation
MARKETDEMAND
GOVERNMENT REQUESTS
SERVICES
SCHEDULING
CAPEX
FLEET
OPEXDOC
OPEXIOC

© MobLab 2020
Transport System - Aviation
Demand Offer Assetsadaptation Operation
MARKETDEMAND SERVICES
SCHEDULING
CAPEX
FLEET
OPEXDOC
OPEXIOC
Entry requirements
International agreements
Traffic Rights, e.g. passengers limitations, days of operations, overflights, etc.…
Visa, Medical conditions, etc.…
GOVERNMENT REQUESTS

© MobLab 2020
Transport System - Aviation
Demand Offer Assetsadaptation Operation
MARKETDEMAND SERVICES
SCHEDULING
CAPEX
FLEET
OPEXDOC
OPEXIOC
Entry requirements
International agreements
Traffic Rights, e.g. passengers limitations, days of operations, overflights, etc…
Visa, Medical conditions, etc…

© MobLab 2020
Demand
Demand 2019 +1.8%
Baseline 2018 / 2019
+5.6% Demand 2019

© MobLab 2020
Aviation: # of Passenger in Switzerland
13
0 2
7
1215
20 2425
272932
34 32
2928
2931
3336
38
3739
4344 4647 4952
55
58
0
5
10
15
20
25
30
35
40
45
50
55
60
1950
1952
1954
1956
1958
1960
1962
1964
1966
1968
1970
1972
1974
1976
1978
1980
1982
1984
1986
1988
1990
1992
1994
1996
1998
2000
2002
2004
2006
2008
2010
2012
2014
2016
2018
Milli
ons
Swissair Bankruptcy
Financial Crisis

© MobLab 2020
Aviation: # of Passenger in Switzerland – Fx
14
0 2
7
1215
20 2425
272932
34 32
2928
2931
3336
38
3739
4344 4647 4952
55
5859
17
0
5
10
15
20
25
30
35
40
45
50
55
60
1950
1952
1954
1956
1958
1960
1962
1964
1966
1968
1970
1972
1974
1976
1978
1980
1982
1984
1986
1988
1990
1992
1994
1996
1998
2000
2002
2004
2006
2008
2010
2012
2014
2016
2018
2020
Milli
ons
Swissair Bankruptcy
Financial Crisis
1733 Years: back to 1987

© MobLab 2020
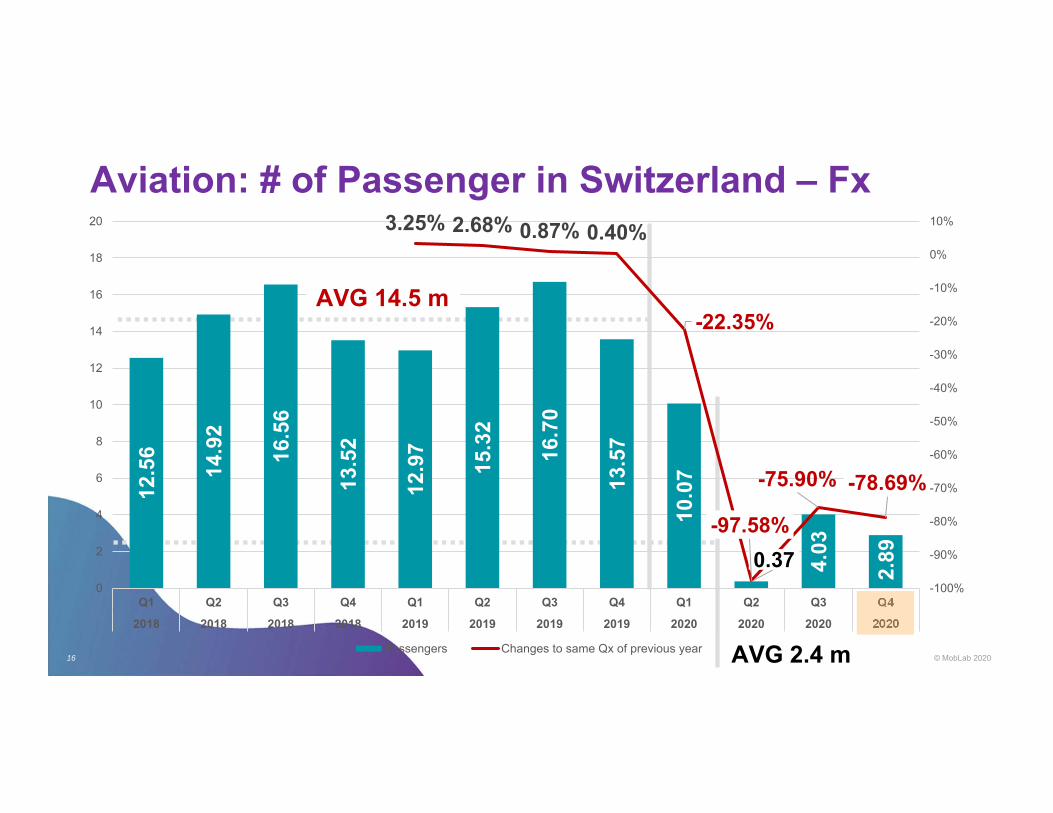
Aviation: # of Passenger in Switzerland – Fx
15
12.5
6
14.9
2
16.5
6
13.5
2
12.9
7
15.3
2
16.7
0
13.5
7
10.0
7
0.37 4.03
2.89
3.25% 2.68% 0.87% 0.40%
-22.35%
-97.58%
-75.90% -78.69%
-100%
-90%
-80%
-70%
-60%
-50%
-40%
-30%
-20%
-10%
0%
10%
0
2
4
6
8
10
12
14
16
18
20
Q1 Q2 Q3 Q4 Q1 Q2 Q3 Q4 Q1 Q2 Q3 Q4
2018 2018 2018 2018 2019 2019 2019 2019 2020 2020 2020 2020
Passengers Changes to same Qx of previous year
© MobLab 2020
Aviation: # of Passenger in Switzerland – Fx
16
12.5
6
14.9
2
16.5
6
13.5
2
12.9
7
15.3
2
16.7
0
13.5
7
10.0
7
0.37 4.03
2.89
3.25% 2.68% 0.87% 0.40%
-22.35%
-97.58%
-75.90% -78.69%
-100%
-90%
-80%
-70%
-60%
-50%
-40%
-30%
-20%
-10%
0%
10%
0
2
4
6
8
10
12
14
16
18
20
Q1 Q2 Q3 Q4 Q1 Q2 Q3 Q4 Q1 Q2 Q3 Q4
2018 2018 2018 2018 2019 2019 2019 2019 2020 2020 2020 2020
Passengers Changes to same Qx of previous year
AVG 14.5 m
AVG 2.4 m

© MobLab 2020
Rail: Billion-Passenger-km in Switzerland – Fx
17
4.84 5.08
5.11 5.24
5.12 5.33 5.49
5.47
4.61
1.94
3.82
3.11
5.79%4.92% 7.44% 4.39%
-9.96%
-63.60%
-30.42%
-43.14%
-100%
-90%
-80%
-70%
-60%
-50%
-40%
-30%
-20%
-10%
0%
10%
0
1
2
3
4
5
6
Q1 Q2 Q3 Q4 Q1 Q2 Q3 Q4 Q1 Q2 Q3 Q4
2018 2018 2018 2018 2019 2019 2019 2019 2020 2020 2020 2020
Billion Person-Kilometer Changes to same Qx of previous year

© MobLab 2020
Demand
Demand 2019 +1.8%
Baseline 2018 / 2019
+5.6% Demand 2019

© MobLab 2020
Demand
Demand 2019 +1.8%
Baseline 2018 / 2019
Demand 2020 (Q1-Q3) -68%
+5.6%
-35%Demand (Forecast)
2020 (Q1-Q4) -70% -37%
Demand 2019
Demand 2020 (Q1-Q3)
Demand (Forecast)
2020 (Q1-Q4)

© MobLab 2020
20
Cross-industry impact
Air TrafficControl
CargoServices
AirportServices
GroundOperations
F&BServices
Catering
CleaningServices
PublicTransport
AircraftMaintenance
PassengerServices
AirlineOperations
RetailServices
RealEstate
AirlineOverhead
TrafficControl
CargoServices
HubServices
OtherOperations
F&BServices
Catering
CleaningServices
RailTransport
Maintenance
PassengerServices
BusOperations
RetailServices
RealEstate
PT companyOverhead

© MobLab 2020
21
DemandAnalysis
AssetSolution
Non-AssetSolution
Needs Definition
ManufacturersAnalysis
ConceptValidation
DetailedSpecifications
Supply Chain
ConceptDraft
Interior Designand Livery
ManufacturersTender(s)
Process & Analysis
IT HW & SW
Tools & Equipment
Data Management
Training
Spares
Employees
OperationsPlan
MaintenancePlan
OperationsManagement
MaintenanceManagement
Increase or Upgrade?
CustomerNeeds
What we do?
Adapted from Prof. Claudio Rolandi, RSM Master of Advance Sciences, SUPSI

0% 25% 50% 100%75%
Origin of costsInfrastructure Vehicle
Accidents Environment & Health
Railway
Road Private motorized
Pass
enge
r tra
nspo
rt
Road Public Transport
Aviation
Railway Freight
Frei
ght
trans
port Light-duty vehicles
(Road)
Heavy-duty vehicles (Road)
51.0
9.7
10.2
4.0
9.02.4
6.7
2017, Federal Office of Statistics
12.00% 55.50% 18.10% 14.40%
12.40% 75.10% 5.00% 7.50%
50.40% 42.90% 6.70%
18.20% 61.70% 20.10%
4.00% 80.00% 7.90%. 8.10%
16.50% 60.30% 4.30% 18.90%
33.40% 45.50% 21.10%
1’000m CHF

Final costs bearer
0% 25% 50% 100%75%
Railway
Road Private motorized
Pass
enge
r tra
nspo
rt
Road Public Transport
Aviation
Railway Freight
Frei
ght
trans
port Light-duty vehicles
(Road)
Heavy-duty vehicles (Road)
51.0
9.7
10.2
4.0
9.02.4
6.7
Passenger / user Carrier
Public sector Community
2017, Federal Office of Statistics
85.60% 14.40%
43.60% 48.80% 7.60%
45.00% 48.40% 6.60%
79.40% 1.30% 19.30%
91.80% 0.50% 7.70%
92.10% 7.90%
41.40% 12.70 25.10% 20.80%
1’000m CHF

© MobLab 2020
Airline Fleet 100 aircrafts → 200 Seats/aircraft, SLF 87%, 5 legs/day
24
Simple example

© MobLab 2020
Airline Fleet 100 aircrafts → in average 87’000 Seats are taken
25
© MobLab 2020
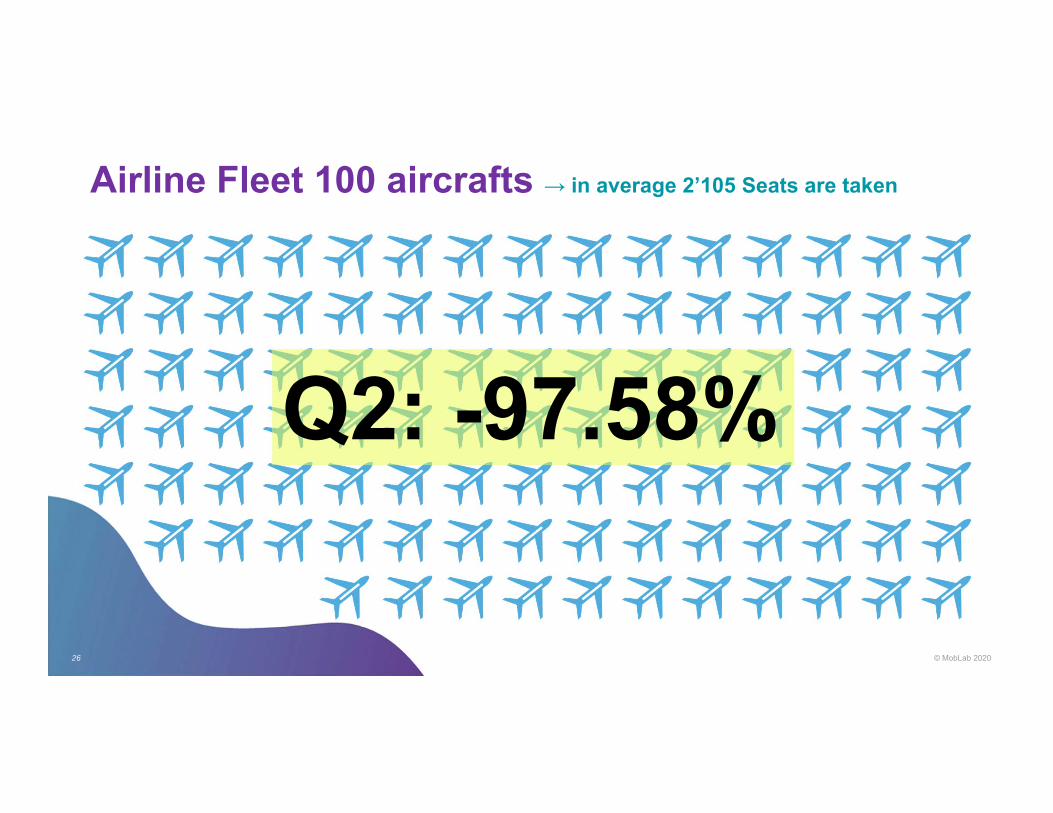
Airline Fleet 100 aircrafts → in average 2’105 Seats are taken
26
Q2: -97.58%

© MobLab 2020
50% of Aircrafts Owned
27
Q2: -97.58%
© MobLab 2020
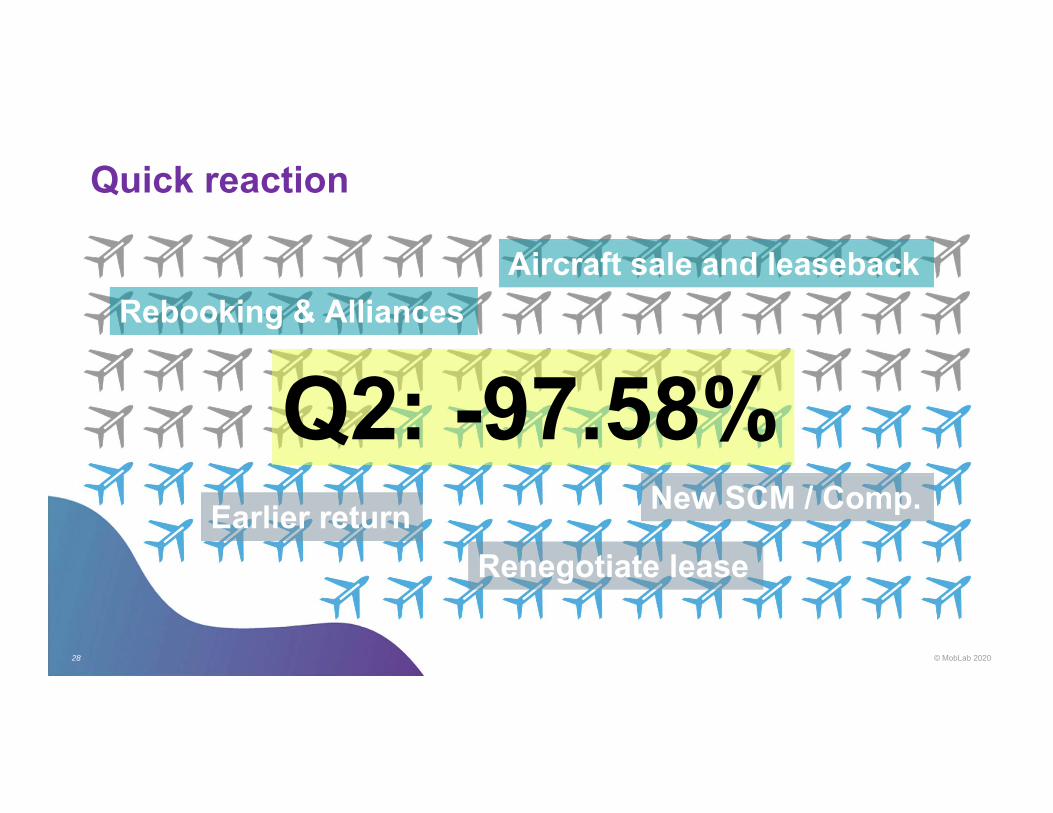
Quick reaction
28
Aircraft sale and leasebackRebooking & Alliances
Renegotiate leaseEarlier return
Q2: -97.58%New SCM / Comp.

© MobLab 2020
29
DemandAnalysis
AssetSolution
Non-AssetSolution
Needs Definition
ManufacturersAnalysis
ConceptValidation
DetailedSpecifications
Supply Chain
ConceptDraft
Interior Designand Livery
ManufacturersTender(s)
Process & Analysis
IT HW & SW
Tools & Equipment
Data Management
Training
Spares
Employees
OperationsPlan
MaintenancePlan
OperationsManagement
MaintenanceManagement
Increase or Upgrade?
CustomerNeeds
What we do?
Adapted from Prof. Claudio Rolandi, RSM Master of Advance Sciences, SUPSI

© MobLab 2020
30
Asset Upgrade
Short-termParking
Return tolessor
SaleLease-back
Supply Chain
Possible actions for PT companies
IT HW & SW
Tools & Equipment
Data Management
Training
Spares
Employees
OperationsPlan
MaintenancePlan
OperationsManagement
MaintenanceManagement
Storage(Long-term P.)
In-serviceOPS reserve
ScheduledMaintenance
Sale
?
Return to normal
expected soon?
Liquidity
Long Crisis:return to normal
expected in years
Reduced to legal /
operational minimum
?
What we do?
IMMEDIATE ACTIONS SHORT-TERM ACTIONS

© MobLab 2020
31
Upgrade
Short-termParking
Return tolessor
SaleLease-back
Supply Chain
Possible actions for PT companies
IT HW & SW
Tools & Equipment
Data Management
Training
Spares
Employees
OperationsPlan
MaintenancePlan
Storage(Long-term P.)
What we do?
In-serviceOPS reserve
ScheduledMaintenance
Sale
?
Return to normal exp.?
Liquidity
Long CrisisReturn to
normal ex. In years
Reduced to legal /
operational minimum
?
IMMEDIATE ACTIONS SHORT-TERM ACTIONS
EBIT neutral OPS
Concentrate locallyReduce inventory
Eliminate any unnecessary change
Maximize rentalReduce inventory
Scenarios & AI
Recurrence and licenses
Use parked aircrafts serviceable component
Cross over industry demand / Reduce!
Adapt & use slot

© MobLab 2020
32
Main Differences Aviation - PT Aviation Public Transportation• Dynamic industry, heavy administration• Scheduling derived by demand• No subsidies• Specific skills required for employees• Relies in international market and growth• Extremely high Capital Investments• Very complex and expensive maintenance• Losses covered by shareholder• Key sector for economic development• Very high competition
• Stagnat industry, relies on the known• Scheduling derived by demand & governments• Partially heavy subsidies• Specific skills required for employees• Relies in national/local market and growth• Very high Capital Investments• Complex and costly maitenance• Losses covered partially by different states entity• Key sector for economic development• System does not allow a real competition
© MobLab 2020
33
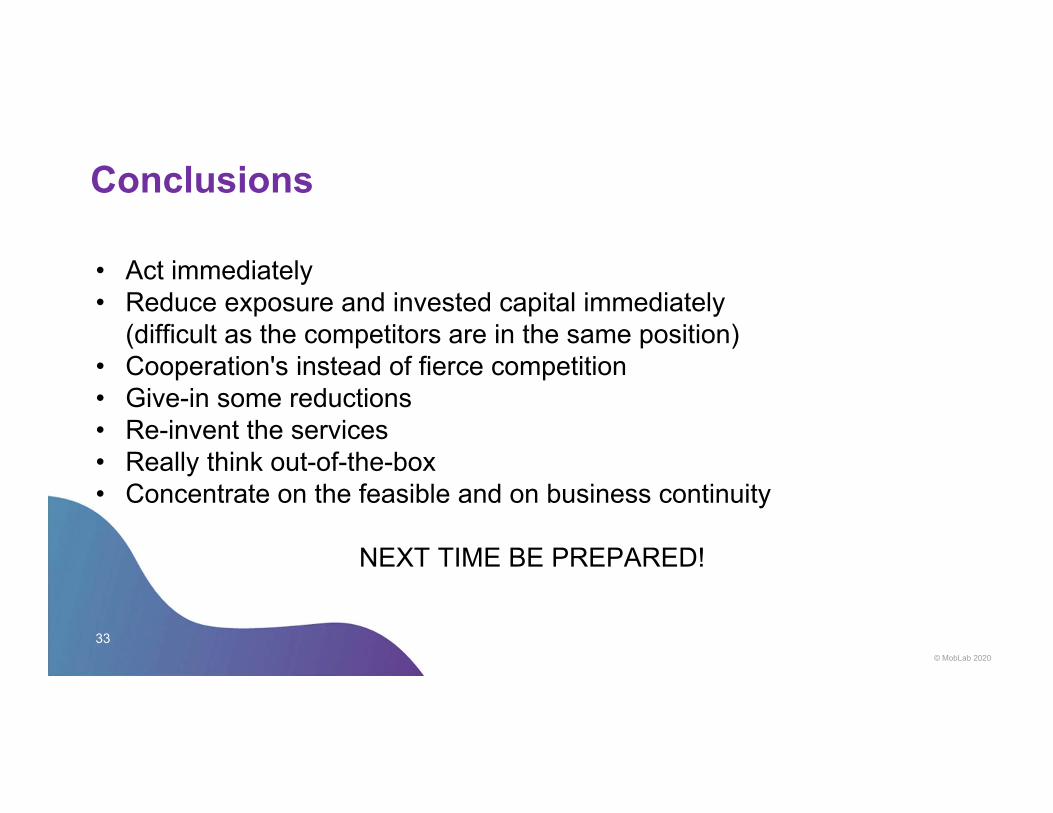
Conclusions
• Act immediately• Reduce exposure and invested capital immediately
(difficult as the competitors are in the same position)• Cooperation's instead of fierce competition• Give-in some reductions• Re-invent the services• Really think out-of-the-box• Concentrate on the feasible and on business continuity
NEXT TIME BE PREPARED!

© MobLab 2020
34
Contacts
Simone BernasconiManaging Director MobLabViale Officina 18CH-6500 BellinzonaSwitzerland
[email protected]+41 79 559 29 29

© MobLab 2020


![Under Pressure [UP]](https://img.pdfslide.us/doc/110x75/56813a1d550346895da1f791/under-pressure-up.jpg)