Embed Size (px)
Citation preview

The Transition to High School as a Developmental Process Among
Multiethnic Urban Youth
Aprile D. BennerUniversity of Texas at Austin
Sandra GrahamUniversity of California, Los Angeles
The high school transition was examined in an ethnically diverse, urban sample of 1,979 adolescents, followedfrom 7th to 10th grade (Mage = 14.6, SD = .37 in 7th grade). Twice annually, data were gathered on adoles-cents’ perceptions of school climate, psychological functioning, and academic behaviors. Piecewise growthmodeling results indicate that adolescents were doing well before the transition but experienced transitiondisruptions in psychological functioning and grades, and many continued to struggle across high school. Theimmediate experience of the transition appeared to be particularly challenging for African American andLatino students when the numerical representation of their ethnic groups declined significantly from middleto high school. Findings highlight the value of examining the transition in a larger developmental context andthe importance of implementing transition support.
For most American youth, school transitions arenormative experiences typically occurring whenstudents enter elementary school, middle or juniorhigh school, and high school. Although frequentand predictable, school transitions can be disrup-tive for students across developmental domains.The vulnerabilities students experience duringschool transitions may result from the potentialmismatch between the youth’s stage of develop-ment and the demands of the school environment(e.g., Eccles, Lord, & Midgley, 1991). As such,understanding how the transition unfolds requiresnot only an examination of developmental trajecto-ries across time, but also an exploration of howchanges differ as a function of both individual char-acteristics and changing school contexts.
To date, most school transition research hasfocused on the move from elementary to middleschool, due to both its concurrent timing with the
onset of adolescence and the changes in schoolenvironments that occur as students shift fromsmaller, more personal elementary schools to lar-ger, more impersonal, and often more academicallyrigorous middle schools (Aikins, Bierman, & Par-ker, 2005; Rudolph, Lambert, Clark, & Kurlakow-sky, 2001; Simmons & Blyth, 1987; Simmons,Burgeson, Carlton-Ford, & Blyth, 1987). Researchon the transition to high school is more limited,although studies have documented similar aca-demic challenges to those experienced across themiddle school transition (Barber & Olsen, 2004;Reyes, Gillock, & Kobus, 1994; Roeser, Eccles, &Freedman-Doan, 1999). For many students, entryinto ninth grade is their first exposure to a com-pletely departmentalized curriculum, extensive aca-demic tracking, ordering of ability via classrankings, and recurrent reminders of graduationrequirements. Those practices define students’academic identity and their opportunities afterhigh school at a developmental stage when they arestill exploring multiple identities and weighingoptions about who they are and who they hope tobecome.
Relatively little is known about the high schooltransition of adolescents of color despite the factthat they face particular kinds of vulnerabilitiesbeyond the normative challenges described above.Ethnic minority youth do more poorly in high
This article is adapted from a doctoral dissertation by AprileD. Benner submitted to the Graduate School of Education andInformation Studies at the University of California, Los Angeles.This research was supported by dissertation grants from theSpencer Foundation and the John Randolph Haynes and DoraHaynes Foundation awarded to Aprile D. Benner and grantsfrom the W. T. Grant Foundation, the National Science Founda-tion, and the Linguistic Minority Research Institute awarded toSandra Graham. The first author would like to thank BengtMuthen, Rashmita Mistry, and Jaana Juvonen, members of herdissertation committee, and Robert Crosnoe for their helpfulsuggestions.
Correspondence concerning this article should be addressed toAprile D. Benner, Population Research Center, University ofTexas at Austin, 1 University Station G1800, Austin, TX 78712.Electronic mail may be sent to [email protected].
Child Development, March/April 2009, Volume 80, Number 2, Pages 356–376
� 2009, Copyright the Author(s)
Journal Compilation � 2009, Society for Research in Child Development, Inc.
All rights reserved. 0009-3920/2009/8002-0005
school on virtually every indicator, and they are atgreater risk of school drop out (Orfield & Lee,2005). Failure to navigate the high school transitionsuccessfully has high stakes, and the waters can beespecially turbulent for ethnic minority youth.
Placing the High School Transition in a LargerDevelopmental Context
In the research reported here, we examine thetransition to high school in an ethnically diversesample. We conceptualize the high school transi-tion as a developmental process that unfolds overtime, a notion derived from the life course per-spective (Elder, 1998; George, 1993). The life courseperspective is one of the dominant developmentaltheories in the sociological tradition and an oftenused theory in both educational research generally(Crosnoe & Huston, 2007) and school transitionresearch specifically (Entwisle & Alexander, 2002).According to this perspective, the life courseencompasses multiple trajectories (interconnectedpathways across social domains) and life transi-tions embedded within these trajectories. Transi-tions, both normative and nonnormative, incombination with the skills and experiences indi-viduals have and the adaptations they choose inthe face of transitions, can serve as ‘‘turningpoints’’ and change life course trajectories (Elder,1985; Rutter, 1996). In the United States, the highschool transition is both normative and predictable(i.e., moving from eighth to ninth grade); however,each student brings a unique set of past experi-ences, personal resources, and expectations, andtheir transitions occur within distinct environ-ments, all of which affect the adaptations theymake when moving to high school and their sub-sequent life course trajectories.
Guided by the life course perspective, this studysought to examine the high school transition experi-ences of adolescents from different racial ⁄ ethnicgroups, specifically exploring their perceptions ofschool climate, psychological functioning, and aca-demic behaviors in middle school, how these out-comes change across the transition, and howexperiences of the school transition affect trajecto-ries during the first 2 years of high school. The lifecourse perspective acknowledges the interrelatednature of individuals’ development across multipledomains (e.g., socioemotional, academic; see Alex-ander, Entwisle, Blyth, & McAdoo, 1988), and ourselection of variables was guided by this principle.In particular, we were interested in whether paral-
lel trajectories and similar changes across the highschool transition would emerge for different devel-opmental domains.
The Influence of Social Ties
The life course perspective posits that social tiesboth influence and are influenced by life transitions(Elder, 1998). In the current study, perceptions ofschool climate (feelings of belonging and school lik-ing) reflect students’ ties to their academic institu-tions. School ties may be particularly challengedduring periods of transition inasmuch as pretransi-tion friendships and social supports are often dis-rupted, yet how the high school transition altersadolescents’ perceptions of these social ties hasreceived scant attention in the extant literature.Moreover, results have revealed rather inconsistentfindings. For example, Barber and Olsen (2004)reported declining school liking across the transi-tion from eighth to ninth grade, whereas Bennerand Graham (2007) identified improvements inschool liking over the same period. It could be thatthe novelty of high school fosters a short-term‘‘honeymoon period’’ that dissipates with time.
The life course perspective’s attention to socialties is also relevant to explorations of psychologicalfunctioning. For example, feelings of social anxietyand loneliness at school, constructs explored in thecurrent study, reflect adolescents’ ties to their peersand school personnel. However, less is knownabout changes in students’ psychosocial adjustmentacross the high school transition. A retrospectiveethnographic study found that students developedmore positive self-perceptions from middle to highschool (Kinney, 1993), yet two studies found no sig-nificant changes across the transition in students’self-esteem (Seidman, Aber, Allen, & French, 1996)or general psychological functioning (Roeser et al.,1999), and another found declining self-esteem andincreasing depression across the high school transi-tion (Barber & Olsen, 2004). Evidence does suggestthat girls may be experiencing more psychologicaldistress across the high school transition than boys(Finn & Rock, 1997).
Cumulative Disadvantage and Academic Achievement
A particular strength of the life course perspec-tive is its ability to link developmental processes tocumulative disadvantage (Elder, 1998). Throughoutthe life course, transitions and the ease withwhich individuals navigate transitions influence
The Transition to High School 357
developmental outcomes in a cumulative fashion.Although early success can promote cumulatingadvantages for youth, early challenges may havedire consequences for life course trajectories. This isparticularly pertinent to academic performance. Inthe U.S. educational system, research has consis-tently documented the achievement divide thatseparates White and Asian students from their Afri-can American, Latino, and Native American peers;this divide is observed as early as preschool andonly widens across elementary and secondaryschool (KewalRamani, Gilbertson, Fox, & Provas-nik, 2007). The current study examined the possibil-ity of cumulative academic disadvantage withindifferent racial ⁄ ethnic groups by investigating mid-dle school academic trajectories, changes across thetransition, and academic trajectories across the first2 years of high school.
Extensive study of students’ academic perfor-mance across the high school transition consistentlyshows that from middle to high school, studentsexperience declines in grades (Barber & Olsen,2004; Roderick, 2003; Seidman et al., 1996) andschool engagement (Isakson & Jarvis, 1999; Reyeset al., 1994; Roeser et al., 1999). However, explora-tions of racial ⁄ ethnic differences in high schooltransition effects often yield inconsistent findings.For example, Murdock, Anderman, and Hodge(2000) found that African American students weremore likely to be in the lowest achieving group inninth grade when compared to their White peers,whereas Seidman et al. (1996) found no transitiondifferences in grades by student race ⁄ ethnicity. Inaddition to the moderating effects of race ⁄ ethnicity,some evidence suggests that boys may be strug-gling more academically across the high schooltransition than their female peers (Finn & Rock,1997; Lee & Smith, 1995; Roderick, 2003; Russell,Elder, & Conger, 1997).
Sociocultural Context
The life course perspective recognizes the impor-tance of sociocultural context for developmentaltransitions and the influence of transitions oncumulating disadvantage (Alexander et al., 1988;Elder, 1998; Schulenberg & Maggs, 2002), and ourexamination of how transition experiences mightvary as a function of individual social-structuralcharacteristics (e.g., gender, race ⁄ ethnicity) wasguided by this tenet. In recognition of the perspec-tive’s emphasis on the ecological context in whichlife transitions unfold (Elder, 1998), our study
incorporated a number of school characteristics,including school size, socioeconomic status (SES),and ethnic diversity. All were measured bothbefore and after the transition in recognition of thepossible influence of changing ecologies on adoles-cents’ outcomes. Prior high school transitionresearch integrating ecological contexts has focusedalmost exclusively on school size and feeder pat-terns. Findings suggest that students in smallerhigh schools have stronger achievement than theirpeers enrolled in larger schools (Lee & Smith, 1995;Russell et al., 1997) and that students transitioningin a more traditional feeder pattern (i.e., middleschool to high school) experience greater declinesin grades (Russell et al., 1997) and are more likelyto later drop out of school (Alspaugh, 1999) thanstudents enrolled in schools serving 7th to 12thgrades.
Research more peripheral to the high schooltransition literature suggests that school ethniccomposition may be associated with student out-comes. For example, previous research has foundthat 11th-grade students in racially balanced highschools (i.e., schools with relatively equal propor-tions of African American and White students)have higher academic achievement levels than theirpeers in racially unbalanced schools (Gray-Little &Carels, 1997). Existing research, however, has notexamined how differences in the ethnic composi-tion of students’ middle and high schools mightinfluence their experiences of the transition andtheir developmental trajectories across high school.For example, given Gray-Little and Carels’s (1997)findings, if students transition to high schools thatare more ethnically diverse (i.e., more racially bal-anced) than their middle schools, might this pro-mote students’ academic behaviors in terms ofattendance or grades in school?
Person–Context Interactions
Person–context interactions also influence devel-opmental outcomes according to the life course per-spective (Schiller, 1999; Schulenberg & Maggs,2002). In the current study, we explored a veryspecific person–context interaction—how theadolescent’s race ⁄ ethnicity intersected with theracial ⁄ ethnic composition of his or her school (i.e.,ethnic incongruence)—and how changes in thismatch between individual race ⁄ ethnicity and schoolcomposition from middle to high school influencedtransition experiences and subsequent high schooltrajectories. Note that we make a distinction
358 Benner and Graham
between ethnic diversity as a school characteristicand ethnic incongruence as an individual character-istic that captures the interaction between partici-pants’ ethnicity and the ethnic composition of theirmiddle and high schools. We believe that these areimportant distinctions because school ethnic diver-sity and ethnic incongruence could be related todifferent adjustment outcomes across the transition.
Our earlier research on ethnic incongru-ence—decreasing numerical representation of anadolescent’s ethnic group from middle school tohigh school—posited that ethnic incongruencewould be associated with poorer adjustmentbecause there is more of a mismatch between theethnic context of the departing and receivingschool. Consistent with that hypothesis, we foundthat when ethnic incongruence increased (i.e., stu-dents moved from a middle to a high school withfewer students who were ethnically similar tothem), students reported diminished feelings ofbelonging and connectedness to their schools (Ben-ner & Graham, 2007). Whether incongruence influ-ences other developmental domains, such asacademic performance, remains unexamined, asdoes the persistent effects that incongruence mayexert across high school.
Methodological Issues
With the life course perspective as the concep-tual framework for the current study, we alsosought to address methodological limitations inher-ent in most research on students’ experiences of thetransition to high school. Some of those limitations
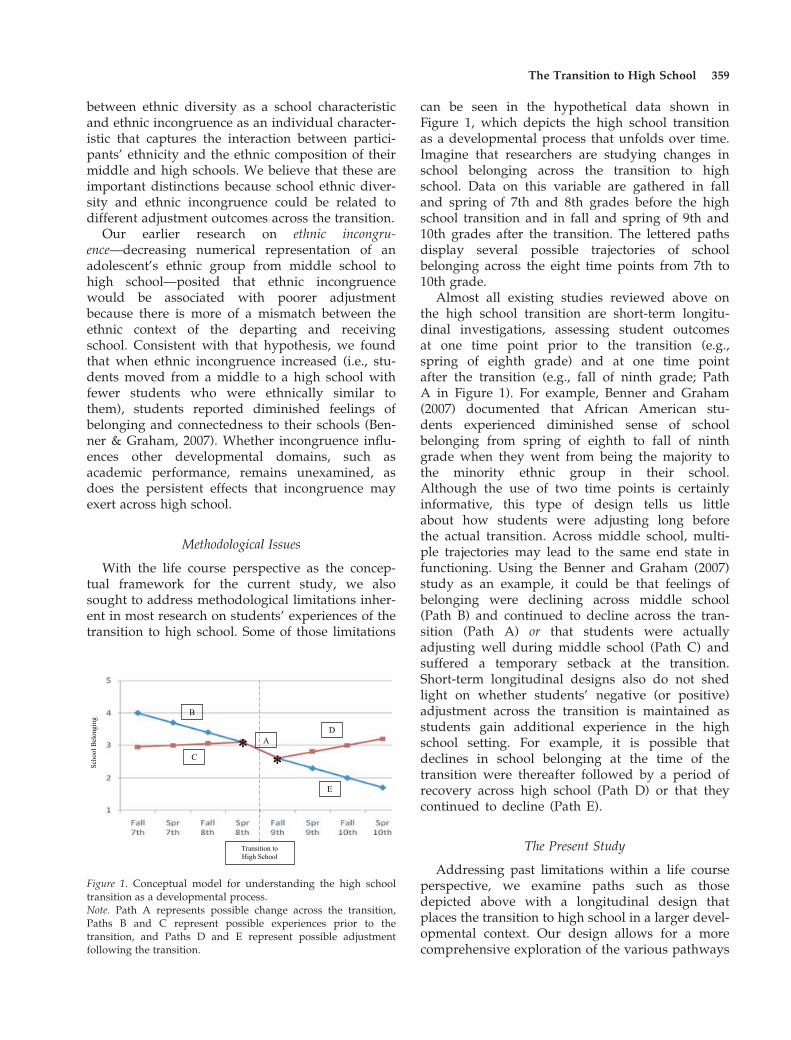
can be seen in the hypothetical data shown inFigure 1, which depicts the high school transitionas a developmental process that unfolds over time.Imagine that researchers are studying changes inschool belonging across the transition to highschool. Data on this variable are gathered in falland spring of 7th and 8th grades before the highschool transition and in fall and spring of 9th and10th grades after the transition. The lettered pathsdisplay several possible trajectories of schoolbelonging across the eight time points from 7th to10th grade.
Almost all existing studies reviewed above onthe high school transition are short-term longitu-dinal investigations, assessing student outcomesat one time point prior to the transition (e.g.,spring of eighth grade) and at one time pointafter the transition (e.g., fall of ninth grade; PathA in Figure 1). For example, Benner and Graham(2007) documented that African American stu-dents experienced diminished sense of schoolbelonging from spring of eighth to fall of ninthgrade when they went from being the majority tothe minority ethnic group in their school.Although the use of two time points is certainlyinformative, this type of design tells us littleabout how students were adjusting long beforethe actual transition. Across middle school, multi-ple trajectories may lead to the same end state infunctioning. Using the Benner and Graham (2007)study as an example, it could be that feelings ofbelonging were declining across middle school(Path B) and continued to decline across the tran-sition (Path A) or that students were actuallyadjusting well during middle school (Path C) andsuffered a temporary setback at the transition.Short-term longitudinal designs also do not shedlight on whether students’ negative (or positive)adjustment across the transition is maintained asstudents gain additional experience in the highschool setting. For example, it is possible thatdeclines in school belonging at the time of thetransition were thereafter followed by a period ofrecovery across high school (Path D) or that theycontinued to decline (Path E).
The Present Study
Addressing past limitations within a life courseperspective, we examine paths such as thosedepicted above with a longitudinal design thatplaces the transition to high school in a larger devel-opmental context. Our design allows for a morecomprehensive exploration of the various pathways
Figure 1. Conceptual model for understanding the high schooltransition as a developmental process.Note. Path A represents possible change across the transition,Paths B and C represent possible experiences prior to thetransition, and Paths D and E represent possible adjustmentfollowing the transition.
The Transition to High School 359

during middle school leading up to the transition aswell as during the first 2 years of high school thatfollow the transition. We recruited a large and mul-tiethnic urban sample who attended 1 of 11 middleschools and then transitioned to over 100 highschools in 9th grade. Twice annually from 7th to10th grade, data were gathered on participants’ per-ceptions of school climate (i.e., school liking, belong-ing), psychological functioning (i.e., loneliness,social anxiety), and academic behaviors (i.e., grades,attendance). Student outcomes were exploredlongitudinally across eight waves of data (fall andspring of 7th to 10th grade) in order to assesspretransition functioning across middle school,immediate experiences of the transition to highschool, and posttransition functioning across thefirst 2 years of high school. We also examined theeffects of individual-level covariates (i.e., gender,race ⁄ ethnicity), person–context interactions (i.e.,ethnic incongruence), and school-level covariates(i.e., school size, SES, ethnic diversity) on transitionexperiences.
We were reluctant to pose many specific studyhypotheses for two reasons. First, our studyexplored constructs not well examined in the extanttransition literature, such as perceived school cli-mate and psychological functioning, as well as con-structs for which consistent high school transitioneffects have not been established (e.g., race ⁄ ethnic-ity). Second, the existing transition literature hasgenerally focused solely on the immediate transi-tion experience and has ignored the larger lifecourse trajectories in which the high school transi-tion is embedded. We did expect declines in gradesacross the transition, as previous research has con-sistently documented that the high school transitionis stressful academically. We did not, however,form hypotheses regarding students’ possible aca-demic recovery across high school. Similarly, wepredicted that ethnic incongruence would result inlower feelings of belonging across the immediatetransition, replicating Benner and Graham (2007),but we had no specific hypotheses about the effectsof ethnic incongruence on belongingness or othervariables examined here across the first 2 years ofhigh school.
Method
Participants
Participants were 1,979 students taking part in alarger longitudinal study of peer relations in school.The students were initially recruited in two cohorts
from 11 middle schools in metropolitan Los Ange-les, with schools chosen from among those ofcomparable size in demographically similar low-income ⁄ working class neighborhoods. All schoolswere eligible for Title I compensatory funding andwere carefully selected to represent a continuum ofethnic diversity (e.g., from primarily Latino or Afri-can American to ethnically diverse). Given the lon-gitudinal nature of the current study and its focuson school transitions, students were excluded fromour analyses if they (a) attended the same schoolfrom middle school to high school (n = 24), (b)were home schooled in ninth grade (n = 3), (c) com-pleted high school early and were attending college(n = 2), or (d) attended a private school in highschool (n = 17) inasmuch as school demographicdata were not readily available for private schoolsin California. The final sample size of 1,979 stu-dents (Mage = 14.6, SD = .37 in the fall of seventhgrade) included 46% boys and 54% girls as well asa high proportion of ethnic minority students—46%Latino (primarily Mexican and Central American),21% African American, 11% Asian (primarily EastAsian), 9% White, and 13% biracial ⁄ multiethnic.More than 90% of Latino and Asian youth were atleast second generation (U.S. born children ofimmigrants), and all were sufficiently proficient inEnglish to complete written questionnaires (i.e., allwere in mainstream, non-English language learnerEnglish classes at the time of recruitment; only 20%reported speaking no English at home, and morethan 97% primarily spoke English at school withtheir friends).
Issues of Attrition
The larger longitudinal study from which thesedata were drawn initially recruited approximately2,300 sixth-grade students. In the spring of eighthgrade, 75% of the initial sample (n = 1,704)remained in the study. Because the average studentmobility rate for the 11 participating schools wasquite high (41%), this 75% retention rate is satisfac-tory. This rate is also comparable to other longitudi-nal studies with similar urban youth samples (seeGutman & Eccles, 2007; Seidman, Allen, Aber,Mitchell, & Feinman, 1994). The retention rate fromeighth to ninth grade was greater than 80%. Inde-pendent-sample t tests for students in the currentstudy confirmed that, with the exception of gradepoint average, the attrited and retained studentsacross the high school transition did not differ atspring of eighth grade on the dependent variablesunder study.
360 Benner and Graham
Measures
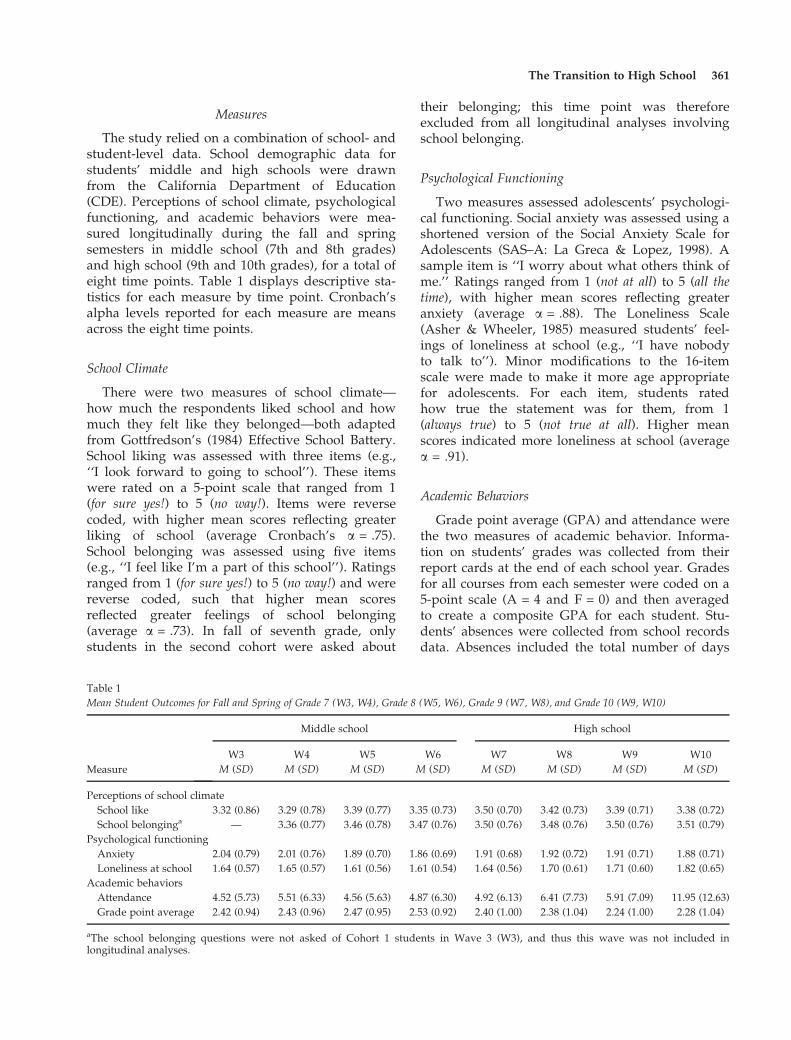
The study relied on a combination of school- andstudent-level data. School demographic data forstudents’ middle and high schools were drawnfrom the California Department of Education(CDE). Perceptions of school climate, psychologicalfunctioning, and academic behaviors were mea-sured longitudinally during the fall and springsemesters in middle school (7th and 8th grades)and high school (9th and 10th grades), for a total ofeight time points. Table 1 displays descriptive sta-tistics for each measure by time point. Cronbach’salpha levels reported for each measure are meansacross the eight time points.
School Climate
There were two measures of school climate—how much the respondents liked school and howmuch they felt like they belonged—both adaptedfrom Gottfredson’s (1984) Effective School Battery.School liking was assessed with three items (e.g.,‘‘I look forward to going to school’’). These itemswere rated on a 5-point scale that ranged from 1(for sure yes!) to 5 (no way!). Items were reversecoded, with higher mean scores reflecting greaterliking of school (average Cronbach’s a = .75).School belonging was assessed using five items(e.g., ‘‘I feel like I’m a part of this school’’). Ratingsranged from 1 (for sure yes!) to 5 (no way!) and werereverse coded, such that higher mean scoresreflected greater feelings of school belonging(average a = .73). In fall of seventh grade, onlystudents in the second cohort were asked about
their belonging; this time point was thereforeexcluded from all longitudinal analyses involvingschool belonging.
Psychological Functioning
Two measures assessed adolescents’ psychologi-cal functioning. Social anxiety was assessed using ashortened version of the Social Anxiety Scale forAdolescents (SAS–A: La Greca & Lopez, 1998). Asample item is ‘‘I worry about what others think ofme.’’ Ratings ranged from 1 (not at all) to 5 (all thetime), with higher mean scores reflecting greateranxiety (average a = .88). The Loneliness Scale(Asher & Wheeler, 1985) measured students’ feel-ings of loneliness at school (e.g., ‘‘I have nobodyto talk to’’). Minor modifications to the 16-itemscale were made to make it more age appropriatefor adolescents. For each item, students ratedhow true the statement was for them, from 1(always true) to 5 (not true at all). Higher meanscores indicated more loneliness at school (averagea = .91).
Academic Behaviors
Grade point average (GPA) and attendance werethe two measures of academic behavior. Informa-tion on students’ grades was collected from theirreport cards at the end of each school year. Gradesfor all courses from each semester were coded on a5-point scale (A = 4 and F = 0) and then averagedto create a composite GPA for each student. Stu-dents’ absences were collected from school recordsdata. Absences included the total number of days
Table 1
Mean Student Outcomes for Fall and Spring of Grade 7 (W3, W4), Grade 8 (W5, W6), Grade 9 (W7, W8), and Grade 10 (W9, W10)
Measure
Middle school High school
W3
M (SD)
W4
M (SD)
W5
M (SD)
W6
M (SD)
W7
M (SD)
W8
M (SD)
W9
M (SD)
W10
M (SD)
Perceptions of school climate
School like 3.32 (0.86) 3.29 (0.78) 3.39 (0.77) 3.35 (0.73) 3.50 (0.70) 3.42 (0.73) 3.39 (0.71) 3.38 (0.72)
School belonginga — 3.36 (0.77) 3.46 (0.78) 3.47 (0.76) 3.50 (0.76) 3.48 (0.76) 3.50 (0.76) 3.51 (0.79)
Psychological functioning
Anxiety 2.04 (0.79) 2.01 (0.76) 1.89 (0.70) 1.86 (0.69) 1.91 (0.68) 1.92 (0.72) 1.91 (0.71) 1.88 (0.71)
Loneliness at school 1.64 (0.57) 1.65 (0.57) 1.61 (0.56) 1.61 (0.54) 1.64 (0.56) 1.70 (0.61) 1.71 (0.60) 1.82 (0.65)
Academic behaviors
Attendance 4.52 (5.73) 5.51 (6.33) 4.56 (5.63) 4.87 (6.30) 4.92 (6.13) 6.41 (7.73) 5.91 (7.09) 11.95 (12.63)
Grade point average 2.42 (0.94) 2.43 (0.96) 2.47 (0.95) 2.53 (0.92) 2.40 (1.00) 2.38 (1.04) 2.24 (1.00) 2.28 (1.04)
aThe school belonging questions were not asked of Cohort 1 students in Wave 3 (W3), and thus this wave was not included inlongitudinal analyses.
The Transition to High School 361
absent from school. When students were absent foronly part of the school day, if they missed morethan half of their classes in a given day, they wereidentified as absent for that day.
Individual Characteristics
Social-structural characteristics. We included twoindividual social-structural characteristics in thestudy—adolescent gender and race ⁄ ethnicity. Stu-dents self-reported their gender and their race ⁄ eth-nicity. For race ⁄ ethnicity, students could choosefrom among 10 ethnic categories or provide anopen-ended description of their race ⁄ ethnicity(e.g., biracial ⁄ multiethnic respondents). Studentresponses were aggregated into five primaryracial ⁄ ethnic categories—Latina ⁄ o, African American,Asian ⁄ Pacific Islander, White, and biracial ⁄ multi-ethnic. For those students reporting biracial ⁄multiethnic (n = 250), one third were multira-cial, providing three or more race ⁄ ethnicities(e.g., Filipino ⁄ Japanese ⁄ Black ⁄ German, Black ⁄ NativeAmerican ⁄ Korean, White ⁄ Mexican ⁄ Pacific Islander).Of the biracial ⁄ multiethnic youth providing writ-ten descriptions of their racial ⁄ ethnic back-grounds, the two largest groups were Latino ⁄ White(36 students) and Latino ⁄ African American (30students).
In preliminary analyses, it was discovered that27% of students changed their race ⁄ ethnicity iden-tification at least once in their self-report middleschool surveys. Of these students, 94% changedbetween biracial ⁄ multiethnic and another ethniccategory. For students whose self-reported ethnic-ity changed across time points, categorization intoone of the five aggregate racial ⁄ ethnic groups wasdetermined by identifying which racial ⁄ ethnicgroup the student identified in the majority of thesurvey waves (6th through 10th grades). We con-ducted independent-sample t tests to examinewhether students who changed race ⁄ ethnicityreports differed from those who were consistent intheir reports of race ⁄ ethnicity in the variablesunder study; no systematic differences wereobserved.
Person–context interaction. We included one mea-sure of person–context interaction—ethnic congru-ence ⁄ incongruence. To determine students’ ethniccongruence scores, we relied on a combination ofschool and student data. School-level race ⁄ ethnicitydata were drawn from the CDE for schools that thestudents attended in middle school and highschool; data were aggregated into four primaryracial ⁄ ethnic categories—Latino, African American,
Asian (including Pacific Islander and Filipino), andWhite. Congruence could not be determined forbiracial ⁄ multiethnic students because the CDE com-bines biracial ⁄ multiethnic and missing ethnicitydata into a single variable.
For middle and high school separately, congru-ence scores were created by matching CDErace ⁄ ethnicity school data with students’ self-reported race ⁄ ethnicity. A student’s congruencescore reflected the proportion of students in theschool that matched the student’s self-reported eth-nicity. For example, if a Latino student attended amiddle school that was 50% Latino and 50% Afri-can American, the student’s middle school congru-ence score would be 0.5. If this student thentransitioned to a high school that included 25%Latino and 75% African American students, thestudent’s high school congruence score would be0.25. Congruence scores for middle school andhigh school were then transformed using aninverse logit transformation (y = 1 ⁄ (1 + exp()b ·(x ) 0.5)))). This transformation results in weightingcongruence scores in the middle of the distributionmore than congruence scores at the high and lowextremes. Congruence change scores were com-puted by subtracting the transformed middleschool congruence score from the transformedhigh school congruence score. Thus, for a studentwith a transformed middle school congruencescore of 0.5 and a transformed high school congru-ence score of 0.25, the congruence change scorewould be )0.25. This transformation acknowledgesthat students may experience identical shifts innumerical representation of their ethnic group butthat this shift will be meaningfully different forthose who remain in the majority ethnic group attheir schools from middle to high school as com-pared to those whose ethnic group representationin the school actually change (e.g., from majority tominority).
A dichotomous congruence variable was createdbased on congruence change scores. Scores thatwere 1 SD below the mean were coded as 1 andlabeled as ‘‘incongruent’’; these students experi-enced substantial declines in their ethnic congru-ence over the transition. All other congruencechange scores were coded as 0 and labeled as ‘‘con-gruent.’’ These congruent students did not experi-ence a large, negative shift in their ethniccongruence as they transitioned from middle tohigh school. This method for creating two congru-ence groups was similar to that employed byFrench, Seidman, Allen, and Aber (2000) andBenner and Graham (2007).
362 Benner and Graham
School Structural Characteristics
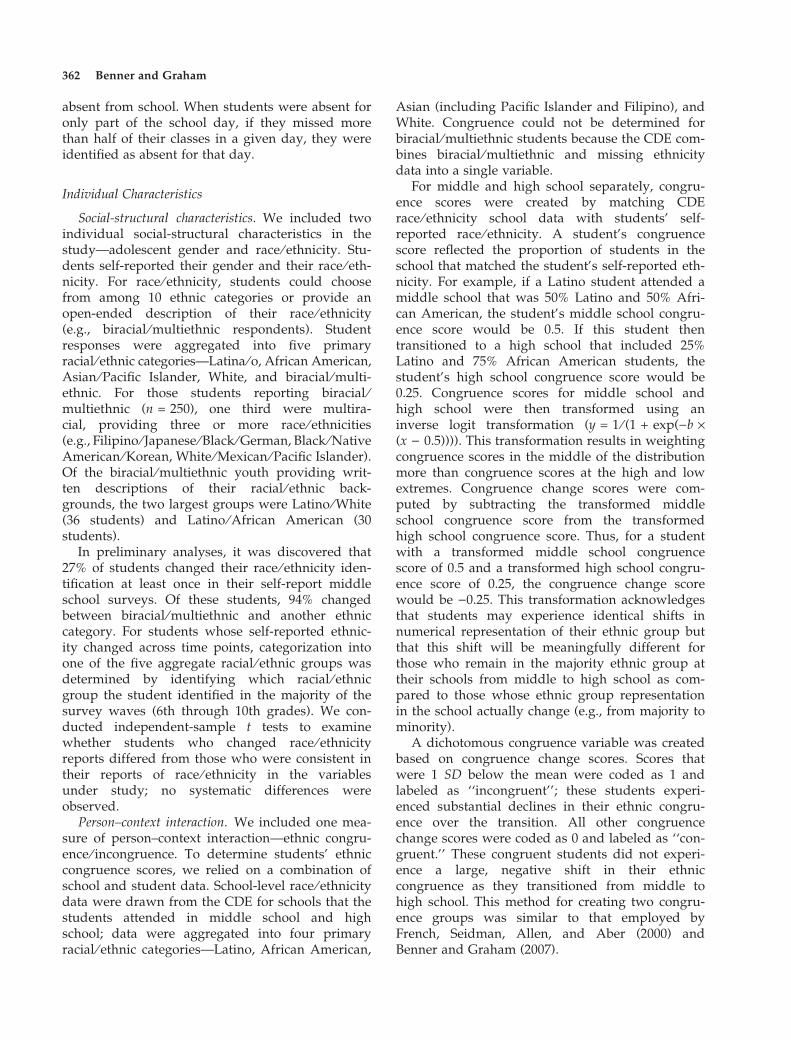
Three middle school and high school structuralvariables, drawn from databases available annuallyfrom the CDE, were included as covariates in theanalyses (see Table 2 for descriptive statistics).These variables were the schools’ size, the SES ofthe student population (i.e., percent of students notreceiving free or reduced-price lunch), and theschool’s ethnic diversity. Based on school-levelrace ⁄ ethnicity data drawn from the CDE (propor-tion of Latino, African American, Asian American,and White students), school-level ethnic diversitywas computed using Simpson’s (1949) index ofdiversity:
Dc ¼ 1�Xg
i¼1
p2i :
In this formula, a school’s ethnic diversity (Dc)depends on the proportion (p) of students in theschool who are in each ethnic group (i). The pro-portions are squared and summed across the totalnumber of ethnic groups in the school (g). Theindex of diversity accounts for both the relativeproportion of each ethnic group and the number ofethnic groups represented within the school, pro-viding the probability (ranging from 0 to approxi-mately 1) that two students randomly selected fromthe same school will belong to different ethnicgroups. Higher scores on the diversity index reflectgreater ethnic diversity within the school.
Procedures
Each school year, students with both parentalconsent and student assent completed confidentialquestionnaires during the middle of both the falland the spring semesters. This study specificallydrew upon student data from the fall and spring
semesters of Grades 7 to 10 (eight waves of data).During survey administration, trained researchassistants (graduate and undergraduate students)read all items aloud as small groups of adolescentsprovided individual responses on their question-naires. During each questionnaire administration,students were generally pulled from elective clas-ses; administration typically occurred in emptyrooms on the school campus (e.g., library, cafeteria,classroom). Questionnaires took approximately40 min to complete, and students received smallmonetary compensation for their participation.School record data (i.e., grades, absences) werecollected for all participating students eachsemester. School demographic data were down-loaded from the CDE Web site (http://www.cde.ca.gov) for each student’s middle and highschool.
Results
Analysis Plan
The data were analyzed using piecewise growthmodeling, an analytical tool that can be used to rep-resent trajectories across different phases of indi-viduals’ development (i.e., middle school and highschool). All analyses were conducted using Mplus4.12 (Muthen & Muthen, 1998–2006). The currentdata set included some missing data, and theMplus estimation procedure handles missing datathrough full-information maximum likelihood(FIML) imputation, enabling us to include all avail-able data in the analyses. Missing data are a poten-tial source of concern for all longitudinal studies,and FIML is one of the preferred methods to allowgeneralization of results to the population (e.g.,Arbuckle, 1996) and the use of all available data.FIML does not estimate the missing data, as is thecase with mean- or regression-based imputation
Table 2
Descriptive Statistics for School Structure Covariates for Middle Schools and High Schools
Measure
Middle school High school
M SD Range M SD Range
CDE state-level dataa
Total school enrollment 1,998 689 1,274–3,742 2,930 1,303 120–5,213
School SES (% not receiving FRPL) 31.4 17.7 7.1–65.5 46.7 23.2 7.3–100.0
School ethnic diversity 0.53 0.19 0.05–0.98 52.5 18.8 4.6–97.7
Note. FRPL = free or reduced-priced lunch.aMiddle school means based on data for school year 2002–2003. High school means based on data for school year 2004–2005.
The Transition to High School 363
techniques. Rather, it fits the covariance structuremodel directly to the observed (and available) rawdata for each participant (Enders, 2001). FIMLassumes that the missing data are either missingcompletely at random or missing at random(MAR). For data MAR, missingness is a function ofthe observed variables in the model, and weaddressed the assumptions of MAR through ourinclusion of covariates, some of which were relatedto missing data for our study constructs (McCart-ney, Bub, & Burchinal, 2006).
Another issue relevant to missing data is thetreatment of students nested in schools. With apiecewise growth modeling framework, the bestway to account for students nested in middle andhigh schools across the transition is to cluster byschool feeder pattern, so that the analysis takes intoaccount the particular middle school and highschool that students attend. When using the CLUS-TER function in Mplus, which accounts for cluster-ing and produces correctly adjusted standarderrors in the model estimations, students withoutidentified feeder patterns are excluded, which maylead to the missing data problems that FIML isdesigned to address. Because we did not have validfeeder patterns for approximately 20% (n = 446) ofthe sample and because an additional 25%(n = 492) did not attend their designated feederhigh school (resulting in a large number of feederpatterns with n < 5), we did not cluster the data byschool feeder pattern in order to retain a largersample size. However, when running models withthe CLUSTER function on the reduced sample,
results are consistent with those reported here(results available from the first author uponrequest).
In the results to follow, we first describe resultsfor the unconditional piecewise growth models forthe six outcome variables. Within-wave correlationsacross our variables of interest were negligible tomoderate (r range = .00–.56). However, becausemodels were run separately for each construct ofinterest, issues of collinearity were not germane forthese analyses. In the second section of the results,we detail the effects of the individual- and school-level covariates.
Unconditional Models of Transition Outcomes
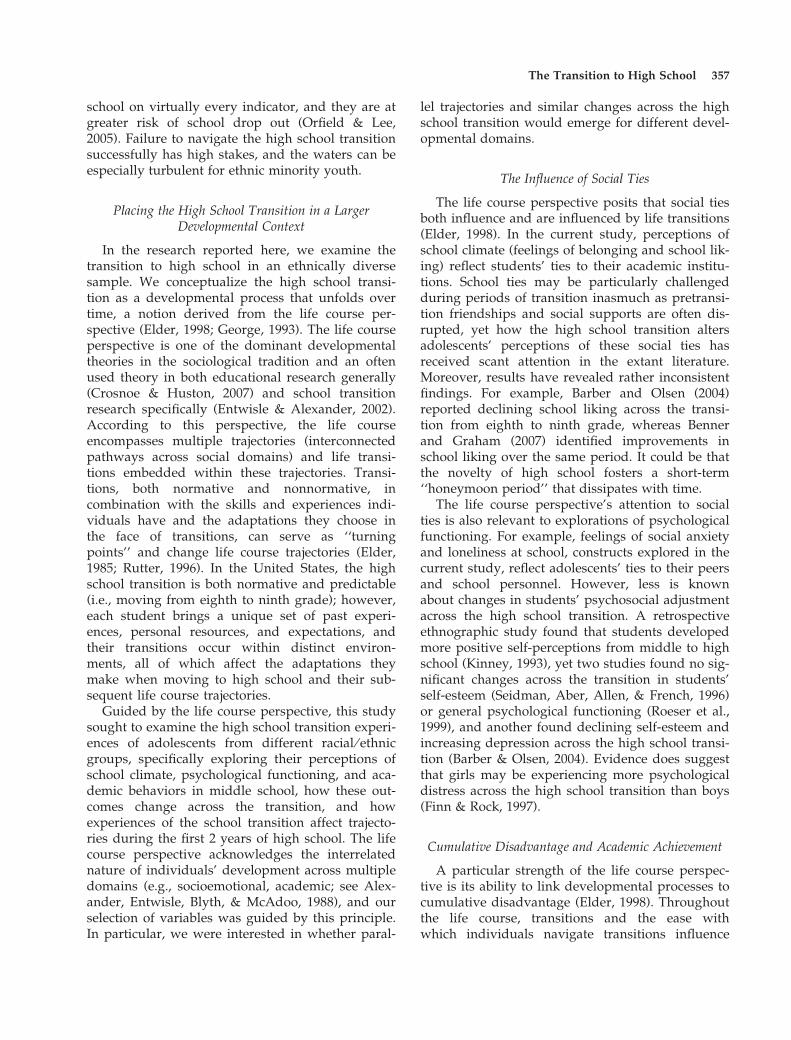
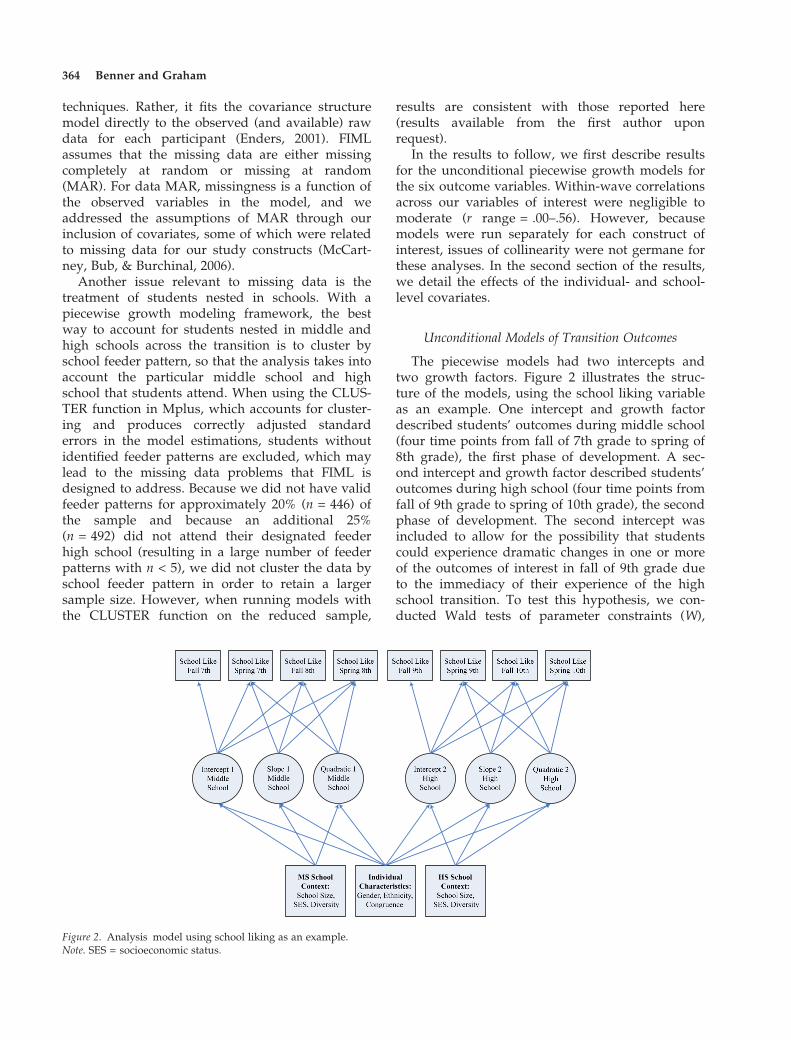
The piecewise models had two intercepts andtwo growth factors. Figure 2 illustrates the struc-ture of the models, using the school liking variableas an example. One intercept and growth factordescribed students’ outcomes during middle school(four time points from fall of 7th grade to spring of8th grade), the first phase of development. A sec-ond intercept and growth factor described students’outcomes during high school (four time points fromfall of 9th grade to spring of 10th grade), the secondphase of development. The second intercept wasincluded to allow for the possibility that studentscould experience dramatic changes in one or moreof the outcomes of interest in fall of 9th grade dueto the immediacy of their experience of the highschool transition. To test this hypothesis, we con-ducted Wald tests of parameter constraints (W),
Figure 2. Analysis model using school liking as an example.Note. SES = socioeconomic status.
364 Benner and Graham
which determined whether the difference betweenthe middle school intercept (spring of 8th grade)and the high school intercept (fall of 9th grade) wassignificantly different from 0. We also calculatedeffect sizes to determine the magnitude of the dif-ference (Cohen, 1988). An additional benefit ofpiecewise growth modeling is its ability to capturenonlinear growth. Thus, we were able to examinewhether students’ perceptions of school climate,psychological functioning, and academic behaviorschanged in nonlinear ways over time (delineated inthe models by the inclusion of quadratic terms inboth pieces). For one variable (total absences), wealso included a cubic factor in the middle schoolphase to capture the S-shaped growth observed instudents’ raw data. Model fit statistics and resultsfor the unconditional models are presented inTable 3.
Perceptions of School Climate
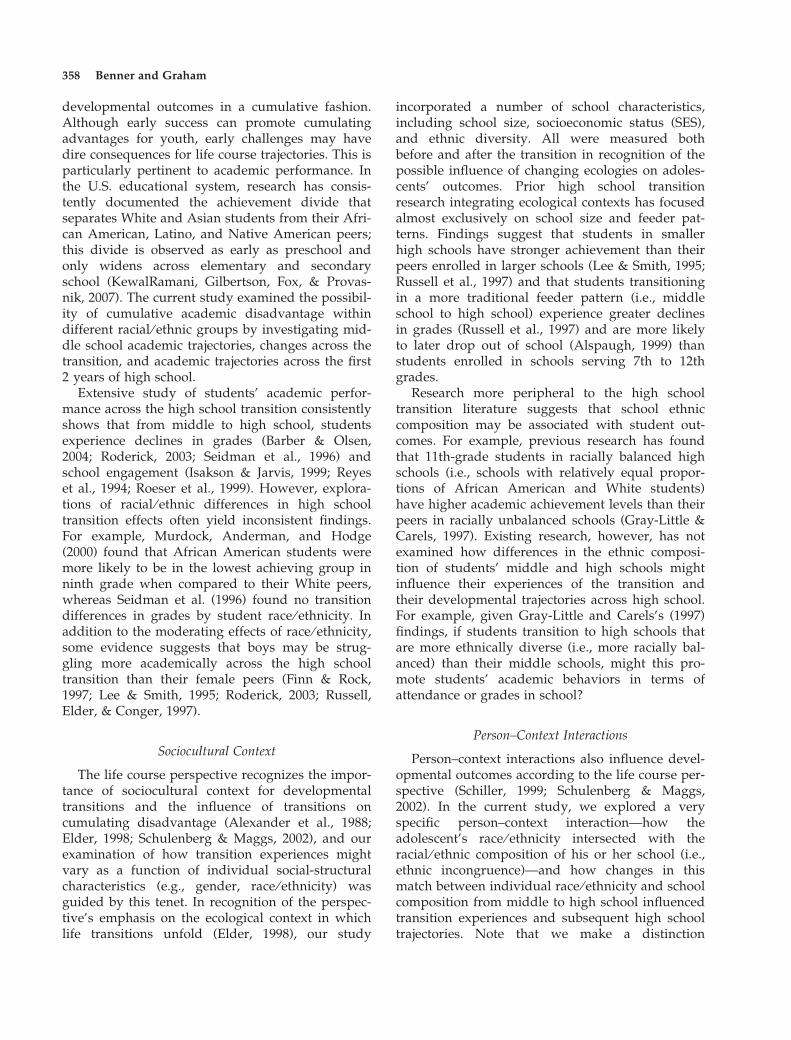
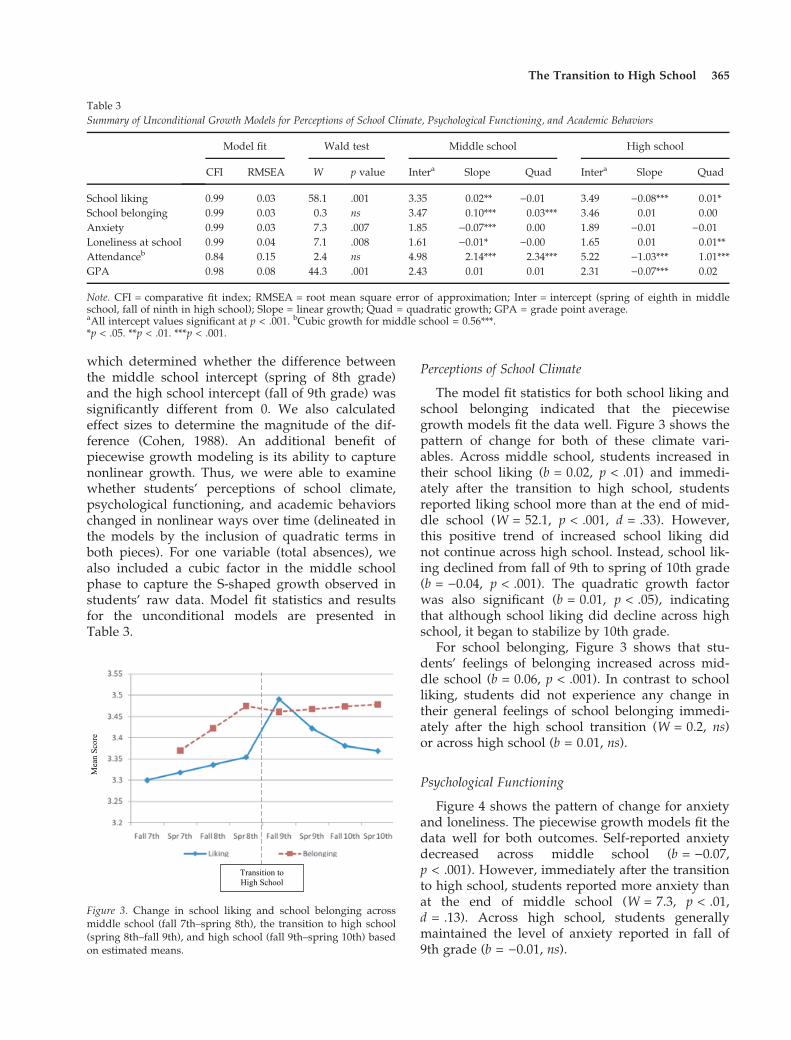
The model fit statistics for both school liking andschool belonging indicated that the piecewisegrowth models fit the data well. Figure 3 shows thepattern of change for both of these climate vari-ables. Across middle school, students increased intheir school liking (b = 0.02, p < .01) and immedi-ately after the transition to high school, studentsreported liking school more than at the end of mid-dle school (W = 52.1, p < .001, d = .33). However,this positive trend of increased school liking didnot continue across high school. Instead, school lik-ing declined from fall of 9th to spring of 10th grade(b = )0.04, p < .001). The quadratic growth factorwas also significant (b = 0.01, p < .05), indicatingthat although school liking did decline across highschool, it began to stabilize by 10th grade.
For school belonging, Figure 3 shows that stu-dents’ feelings of belonging increased across mid-dle school (b = 0.06, p < .001). In contrast to schoolliking, students did not experience any change intheir general feelings of school belonging immedi-ately after the high school transition (W = 0.2, ns)or across high school (b = 0.01, ns).
Psychological Functioning
Figure 4 shows the pattern of change for anxietyand loneliness. The piecewise growth models fit thedata well for both outcomes. Self-reported anxietydecreased across middle school (b = )0.07,p < .001). However, immediately after the transitionto high school, students reported more anxiety thanat the end of middle school (W = 7.3, p < .01,d = .13). Across high school, students generallymaintained the level of anxiety reported in fall of9th grade (b = )0.01, ns).
Table 3
Summary of Unconditional Growth Models for Perceptions of School Climate, Psychological Functioning, and Academic Behaviors
Model fit Wald test Middle school High school
CFI RMSEA W p value Intera Slope Quad Intera Slope Quad
School liking 0.99 0.03 58.1 .001 3.35 0.02** )0.01 3.49 )0.08*** 0.01*
School belonging 0.99 0.03 0.3 ns 3.47 0.10*** 0.03*** 3.46 0.01 0.00
Anxiety 0.99 0.03 7.3 .007 1.85 )0.07*** 0.00 1.89 )0.01 )0.01
Loneliness at school 0.99 0.04 7.1 .008 1.61 )0.01* )0.00 1.65 0.01 0.01**
Attendanceb 0.84 0.15 2.4 ns 4.98 2.14*** 2.34*** 5.22 )1.03*** 1.01***
GPA 0.98 0.08 44.3 .001 2.43 0.01 0.01 2.31 )0.07*** 0.02
Note. CFI = comparative fit index; RMSEA = root mean square error of approximation; Inter = intercept (spring of eighth in middleschool, fall of ninth in high school); Slope = linear growth; Quad = quadratic growth; GPA = grade point average.aAll intercept values significant at p < .001. bCubic growth for middle school = 0.56***.*p < .05. **p < .01. ***p < .001.
Figure 3. Change in school liking and school belonging acrossmiddle school (fall 7th–spring 8th), the transition to high school(spring 8th–fall 9th), and high school (fall 9th–spring 10th) basedon estimated means.
The Transition to High School 365

Figure 4 shows that self-reported loneliness, sim-ilarly to anxiety, decreased across middle school(b = )0.01, p < .05) but increased immediately afterthe transition to high school (W = 4.5, p < .05,d = .13). Unlike anxiety, however, feelings of loneli-ness only intensified from fall of 9th to spring of10th grade, with the significant quadratic term indi-cating accelerated growth over high school(b = 0.01, p < .01).
Academic Behaviors
For both academic behaviors, the piecewisegrowth models fit the data adequately. RegardingGPA, as seen in the left panel of Figure 5, acrossmiddle school, students’ grades remained relativelystable (b = 0.01, ns). Consistent with other transitionstudies, immediately after transitioning to highschool, students’ grades declined significantly
(W = 84.0, p < .001, d = .21), and they continued todecline across 9th and 10th grades (b = )0.07,p < .001).
For absences, as shown in the right panel of Fig-ure 5, change in students’ total absences acrossmiddle school was observed to be cubic, withhigher absences in the spring semesters than in thefall semesters of 7th and 8th grades (b = 0.56,p < .001). Absences did not change significantlyacross the transition to high school (W = 2.35, ns),but in high school, there was a substantial increasein total absences, with quadratic growth indicatingaccelerated increase by spring of 10th grade(b = 1.01, p < .001).
To summarize, the analyses of unconditionalmodels revealed different trajectories for the schoolclimate, psychological adjustment, and academicoutcomes across the transition to high school, withmost trajectories underscoring the challenges of thehigh school transition in comparison to middleschool experiences. For school climate, studentsliked school more over middle school and acrossthe transition; however, with more experience in9th and 10th grades, reported school likingdeclined significantly. Feelings of loneliness alsoincreased across the first 2 years of high school. Atthe same time, students’ grades were decliningacross those years and their school absences wereincreasing. In the next set of analyses, we examinehow these average trajectories were affected byindividual and school structural characteristics.
Effects of Individual and School StructuralCharacteristics
The second set of piecewise growth modelsincluded covariates that were phase independent(i.e., participant gender, ethnicity) and phase spe-cific (i.e., school structure variables; see Figure 2).
Figure 4. Change in anxiety and loneliness at school acrossmiddle school (fall 7th–spring 8th), the transition to high school(spring 8th–fall 9th), and high school (fall 9th–spring 10th) basedon estimated means.
Grade PointAverage
Total Absences
Figure 5. Change in grade point average and total absences across middle school (fall 7th–spring 8th), the transition to high school(spring 8th–fall 9th), and high school (fall 9th–spring 10th) based on estimated means.
366 Benner and Graham
For the first phase, school structural covariates (i.e.,values for size, SES, ethnic diversity) were specificto students’ middle schools; in the second phase ofthe model, school structure covariates were specificto students’ high schools. The piecewise modelswith covariates yielded coefficients that docu-mented the effects of each covariate on the inter-cept, slope, and quadratic factors. We alsoexamined whether the covariates influenced stu-dents’ immediate experiences of the transition, firsttesting a model where the covariate influences werefree to vary across the two intercepts for a givenoutcome and then testing a model in which the co-variate influences on the two intercepts were heldconstant. A chi-square difference test was com-puted to determine whether this constraint causeda significant decline in model fit. Covariate influ-ences were constrained for a single covariate at atime in order to determine exactly which covari-ates influenced students’ immediate transitionexperiences.
Results of covariate influences on the six out-comes are presented first for individual-level cova-riates and then for school-level covariates. Allresults are net the influence of all other relation-ships in the model. All growth models with indi-vidual- and school-level covariates fit the data well.Model fit statistics are presented in Table 4. A sum-mary of results appears in the Appendix.
Individual-Level Covariates
Gender. Girls liked school significantly morethan boys at the end of middle school (b = 0.23,p < .001) and the beginning of high school (b = 0.13,p < .001), and they expressed stronger feelings ofschool belonging than boys both at the end of mid-dle school (b = 0.16, p < .001) and at the beginningof high school (b = 0.08, p < .05). Whereas both girlsand boys increased in their liking of school fromspring of eighth grade to fall of ninth grade, boysincreased at a faster rate, Dv2(1) = 9.1, p < .01.Although girls generally expressed more positivefeelings than boys about school climate, theytended to experience more difficulties in their psy-chological adjustment. Girls reported more anxietythan boys both at the end of middle school(b = 0.10, p < .01) and the beginning of high school(b = 0.13, p < .001). Similar findings emerged forloneliness. As students transitioned from middle tohigh school, boys maintained relatively low levelsof loneliness, whereas girls increased in lonelinessfrom spring of eighth to fall of ninth grade,Dv2(1) = 6.4, p < .05. Relatedly, girls’ feelings ofloneliness were higher than boys at the beginningof high school (b = 0.06, p < .05).
Gender differences also emerged in adolescents’academic behaviors, with girls performing betteracademically overall but experiencing more difficul-ties across the transition. Specifically, girls earnedhigher grades at the end of middle school (b = 0.37,p < .001) and the beginning of high school (b = 0.29,p < .001). However, across the immediate transitionto high school, girls experienced greater declines inGPAs than their male peers, Dv2(1) = 5.5, p < .05.Moreover, results for high school indicate thatalthough both girls and boys had declining GPAsacross high school, girls declined at a faster ratethan their male peers (b = )0.05, p < .01). No genderdifferences emerged for total absences.
Race ⁄ ethnicity. For all ethnicity analyses, thereference group was White adolescents. All racial ⁄ethnic groups were sufficiently large to detectgroup differences (see Muthen & Curran, 1997, fordiscussion of power in growth models). In ratingtheir school climates, African American and Asianstudents reported liking school more in the springof eighth grade than White students (bs = 1.03 and1.01, p < .05 for African American and Asian stu-dents, respectively). For school belonging, in thefall of ninth grade, African American studentsexpressed less school belonging than White stu-dents (b = )0.90, p < .05). No other racial ⁄ ethnicdifferences emerged for either school liking
Table 4
Summary of Growth Models With Individual- and School-Level Cova-
riates for Perceptions of School Climate, Psychological Functioning,
and Academic Behaviors
Chi-square
CFI RMSEA
Chi-square
value (df) p value
Perceptions of school climate
School liking 207.7 (130) .001 .985 .017
School belonging 182.1 (119) .001 .985 .016
Psychological functioning
Anxiety 212.8 (150) .001 .990 .015
Loneliness at school 195.9 (130) .001 .988 .016
Academic behaviors
Attendance 1,094.0 (69) .001 .832 .087
GPA 611.9 (150) .001 .961 .039
Note. CFI = comparative fit index; RMSEA = root mean squareerror of approximation; GPA = Grade point average. Degrees offreedom vary due to whether the model includes quadraticgrowth (i.e., school liking, loneliness at school, absences) orcubic growth (absences), whether variance of quadratic andcubic growth factors were set to 0 (absences), and the number oftime points included in the growth model (i.e., school belongingincludes only three time points across middle school).
The Transition to High School 367

or belonging. For psychological functioning,racial ⁄ ethnic differences emerged in the trajectoryof loneliness across the high school transition.Whereas White students remained relatively stablein their feelings of loneliness from spring of eighthto fall of ninth grade, both African American,Dv2(1) = 4.6, p < .05, and Asian students,Dv2(1) = 6.8, p < .01, reported more lonelinessimmediately following the transition to high school.
For academic behaviors, racial ⁄ ethnic differencesacross the transition are consistent with the moregeneral literature on the achievement gap. AfricanAmerican (b = )1.53, p < .01), Latino (b = )1.36,p < .05), and biracial ⁄ multiethnic students(b = )1.19, p < .001) earned lower GPAs than Whitestudents in spring of eighth grade. Whereas Whitestudents maintained their high grades in schoolfrom spring of eighth grade to fall of ninth grade,African American, Dv2(1) = 6.4, p < .05, and Latinostudents, Dv2(1) = 6.9, p < .01 experienced signifi-cant declines over the transition.
In relation to school absences and compared totheir White peers, African American students hadmore absences (b = 1.79, p < .01) and Asian stu-dents had fewer absences (b = )1.43, p < .05) inspring of eighth grade. Across the transition, Latinostudents’ absences increased whereas White stu-dents’ absences declined, Dv2(1) = 4.6, p < .05. Atthe beginning of high school, African American(b = 3.29, p < .001), Latino (b = 1.52, p < .01), andbiracial ⁄ multiethnic students (b = 1.70, p < .05) hadmore absences than White students. Finally, duringhigh school, although all students experienced sub-stantial increases in their total absences, AfricanAmerican and biracial ⁄ multiethnic students’increases were significantly higher than White stu-dents (b = 0.90, p < .01 and b = 0.67, p < .05 forAfrican American and biracial ⁄ multiethnic stu-dents, respectively).
Ethnic incongruence. As previously described,students were classified as incongruent if their
congruence change scores were 1 SD below themean; these students experienced substantialdeclines in the percentage of same-ethnicity peersover the transition. Students whose change scoresdid not exceed 1 SD below the mean were classi-fied as congruent; these congruent students didnot experience a large, negative shift in same-ethnicity peers as they transitioned from middleto high school. Preliminary analyses revealed thatonly African American and Latino students var-ied on the incongruence variable (i.e., no Whiteor Asian students were incongruent, and congru-ence scores could not be calculated for bira-cial ⁄ multiethnic students). Further analysesincluding ethnic incongruence as a covariate wereconducted separately for African American andLatino students.
Ethnic incongruence exerted a strong influenceon adolescents’ school liking and belonging acrossthe immediate experience of the transition andacross the first 2 years of high school. As shown inthe left panel of Figure 6, from spring of 8th gradeto fall of 9th grade, incongruent African Americanstudents experienced substantial declines in theirfeelings of school belonging, whereas congruentAfrican American students’ school belongingremained relatively stable across the transition,Dv2(1) = 13.5, p < .001. Similar findings emerged indifferences between congruent and incongruentLatino students, Dv2(1) = 5.3, p < .05 (see the rightpanel of Figure 6). Relatedly, incongruent studentsreported less school belonging in the fall of 9thgrade than congruent students (b = )0.41, p < .001and b = )0.35, p < .01 for African American andLatino students, respectively). Consistent with thistrend, incongruent African American studentsexpressed less school liking in the fall of 9th gradethan congruent African American students(b = )0.28, p < .01). However, the advantages ofcongruency appeared to dissipate over time in thatcongruent African American students experienced
Figure 6. Change in school belonging across the transition to high school (spring 8th–fall 9th) by incongruence for African Americanand Latino students based on estimated means.
368 Benner and Graham
a steeper decline in school liking across 9th and10th grades than did their incongruent peers(b = 0.32, p < .01).
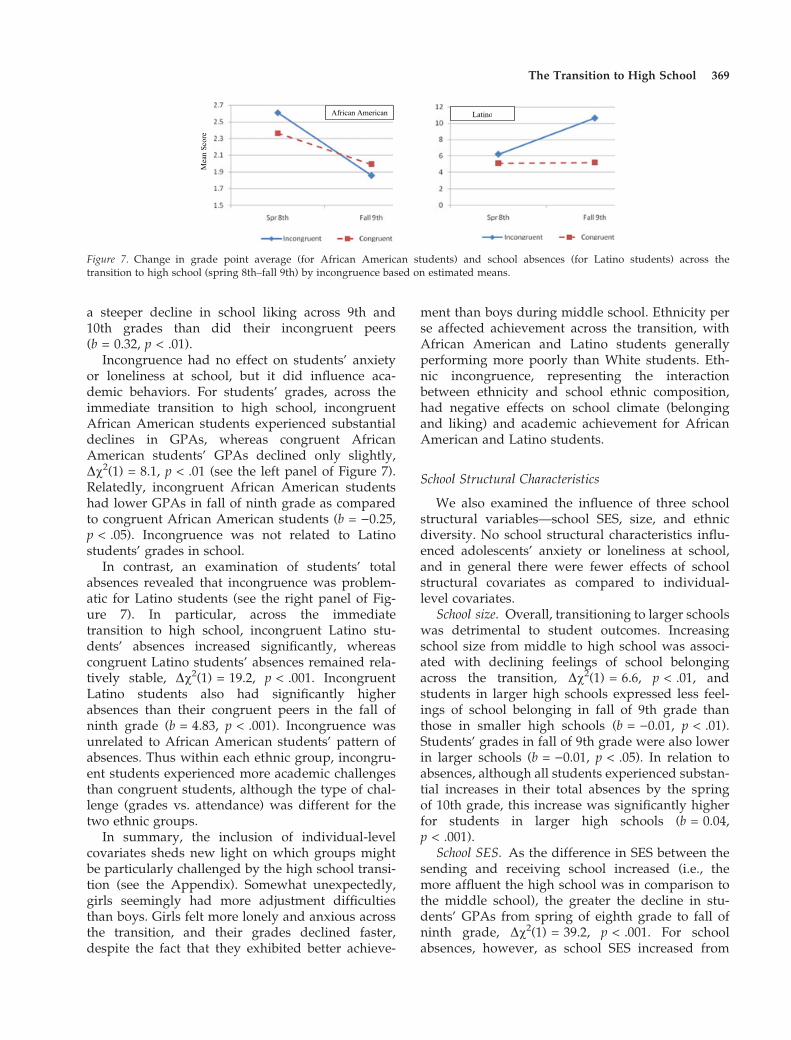
Incongruence had no effect on students’ anxietyor loneliness at school, but it did influence aca-demic behaviors. For students’ grades, across theimmediate transition to high school, incongruentAfrican American students experienced substantialdeclines in GPAs, whereas congruent AfricanAmerican students’ GPAs declined only slightly,Dv2(1) = 8.1, p < .01 (see the left panel of Figure 7).Relatedly, incongruent African American studentshad lower GPAs in fall of ninth grade as comparedto congruent African American students (b = )0.25,p < .05). Incongruence was not related to Latinostudents’ grades in school.
In contrast, an examination of students’ totalabsences revealed that incongruence was problem-atic for Latino students (see the right panel of Fig-ure 7). In particular, across the immediatetransition to high school, incongruent Latino stu-dents’ absences increased significantly, whereascongruent Latino students’ absences remained rela-tively stable, Dv2(1) = 19.2, p < .001. IncongruentLatino students also had significantly higherabsences than their congruent peers in the fall ofninth grade (b = 4.83, p < .001). Incongruence wasunrelated to African American students’ pattern ofabsences. Thus within each ethnic group, incongru-ent students experienced more academic challengesthan congruent students, although the type of chal-lenge (grades vs. attendance) was different for thetwo ethnic groups.
In summary, the inclusion of individual-levelcovariates sheds new light on which groups mightbe particularly challenged by the high school transi-tion (see the Appendix). Somewhat unexpectedly,girls seemingly had more adjustment difficultiesthan boys. Girls felt more lonely and anxious acrossthe transition, and their grades declined faster,despite the fact that they exhibited better achieve-
ment than boys during middle school. Ethnicity perse affected achievement across the transition, withAfrican American and Latino students generallyperforming more poorly than White students. Eth-nic incongruence, representing the interactionbetween ethnicity and school ethnic composition,had negative effects on school climate (belongingand liking) and academic achievement for AfricanAmerican and Latino students.
School Structural Characteristics
We also examined the influence of three schoolstructural variables—school SES, size, and ethnicdiversity. No school structural characteristics influ-enced adolescents’ anxiety or loneliness at school,and in general there were fewer effects of schoolstructural covariates as compared to individual-level covariates.
School size. Overall, transitioning to larger schoolswas detrimental to student outcomes. Increasingschool size from middle to high school was associ-ated with declining feelings of school belongingacross the transition, Dv2(1) = 6.6, p < .01, andstudents in larger high schools expressed less feel-ings of school belonging in fall of 9th grade thanthose in smaller high schools (b = )0.01, p < .01).Students’ grades in fall of 9th grade were also lowerin larger schools (b = )0.01, p < .05). In relation toabsences, although all students experienced substan-tial increases in their total absences by the springof 10th grade, this increase was significantly higherfor students in larger high schools (b = 0.04,p < .001).
School SES. As the difference in SES between thesending and receiving school increased (i.e., themore affluent the high school was in comparison tothe middle school), the greater the decline in stu-dents’ GPAs from spring of eighth grade to fall ofninth grade, Dv2(1) = 39.2, p < .001. For schoolabsences, however, as school SES increased from
Figure 7. Change in grade point average (for African American students) and school absences (for Latino students) across thetransition to high school (spring 8th–fall 9th) by incongruence based on estimated means.
The Transition to High School 369
middle to high school, the greater the decline inabsences across the transition, Dv2(1) = 7.1, p < .01.Students in higher SES schools also had fewerabsences in the fall of ninth grade than students inlower SES schools (b = )0.45, p < .001) and hadlower and more stable absences across high school(b = )0.18, p < .001).
School ethnic diversity. As students transitioned tohigh schools that were increasingly more diversethan their middle schools, students’ school belong-ing across the transition increased, Dv2(1) = 4.0,p < .05. Yet, increasing school ethnic diversityacross the transition was associated with greaterdeclines in grades from spring of 8th grade to fallof 9th grade, Dv2(1) = 10.6, p < .01. For schoolabsences, however, as school diversity increased,the substantial increase observed in studentabsences by spring of 10th grade was attenuated(b = 0.19, p < .05).
In summary, as school-level SES and ethnicdiversity increased across the transition, students’grades declined, but their absences also decreased.Growth in school size, however, was associatedwith lower grades and increased absences. Smallerand more ethnically diverse schools also promotedmore feelings of belonging.
Discussion
This study places the transition to high school in alarger developmental context, an important addi-tion to existing transition research that typicallyonly documents short-term transition effects. Ado-lescents in the current study were doing well intheir middle schools, and it is within this positivedevelopmental context that the transition to highschool occurred. Perhaps due to the novelty ofthe new school context, immediately after thetransition adolescents liked their high schoolsmore than their middle schools. Yet entry into thisnew school setting was not wholly positive. Theadolescents in this study transitioned to largeurban schools, unfamiliar settings that were quitepossibly more turbulent and less supportive thantheir smaller and more intimate middle schools(Baker et al., 2001; Weiss, 2001). Perhaps reflectiveof these differences, adolescents were both lone-lier and more anxious immediately following thetransition. They also struggled more academically,consistent with the shifting academic demandsassociated with moving to high school (Baker et al.,2001).
Navigating the urban high school settings didnot get particularly easier with time. Students felt
increasingly lonely across the first 2 years of highschool, and the higher levels of anxiety they experi-enced across the transition did not diminish withtime. Academically, grades continued to decline,and absences increased. And the honeymoon withliking high school more than middle school quicklydisappeared, as adolescents’ reports of school likingdecreased steadily across 9th and 10th grades. As awhole, these results suggest that the high schooltransition experience negatively altered the positiveacademic and psychosocial life course trajectoriesobserved in middle school.
Modeling the individual- and school-level cova-riates enriched our understanding of these generaldevelopmental patterns. In some respects, girlsappeared to have more difficulty with the transitionthan boys. Girls felt lonelier and more anxiousacross the transition than did boys, and eventhough they were doing better academically over-all, their GPAs in 9th and 10th grades declinedmore rapidly than did those of their male peers.This is consistent with previous high school transi-tion studies that documented greater psychologicaldistress for girls (Finn & Rock, 1997; Lee & Smith,1995; Russell et al., 1997). Cross-sectional researchon middle and high school students using datafrom the National Study of Adolescent Health alsoreports that girls experience more emotional strug-gles than boys in high school as compared to mid-dle school (Johnson, Crosnoe, & Elder, 2001). Wesuspect that girls’ mean-level achievement advanta-ges over boys may mask the mental health chal-lenges brought on by worrying about both theacademic demands of high school and the socialpressure to establish a new peer group. The piece-wise modeling of life course trajectories both pre-and posttransition provides a richer picture of theebbs and flows of the transition process for the twogender groups than do mean comparisons betweengirls and boys at specific pre- and posttransitiontime points.
Ethnicity and Person–Context Interactions
The most compelling findings regarding ethnic-ity in this study had less to do with ethnic differ-ences per se in transition experiences than withperson–context interactions, where context wasdefined by changes in the numerical representationof one’s ethnic group from middle school to highschool. Our results indicate that the transition wasmore stressful when African American and Latinostudents transitioned to high schools where therewere significantly fewer same-ethnicity peers.
370 Benner and Graham

These incongruent African American and Latinostudents, on average, experienced a 36% decline inthe representation of their group across the highschool transition (range = )22% to )66%). Thetransformation that we used in calculating incon-gruence also placed more weight on congruencechange scores at the middle of the distribution (e.g.,percent same-ethnicity peers declining from 55% to35%) than at either extreme (e.g., declines from 95%to 75% or from 35% to 15%). This transformation,we argue, is more contextually sensitive, recogniz-ing the particular challenge of moving from thenumerical majority to the numerical minority ascompared to, for example, declining but remainingin the numerical majority.
Both African American and Latino students inthe incongruent group experienced decreased feel-ings of belonging after the transition compared totheir congruent same-ethnicity peers, and AfricanAmerican incongruent students also liked schoolless. The academic challenges of the transition alsowere exacerbated in both incongruent groups:grades declined more steeply for African Americanincongruents, and absences increased more steeplyfor Latino incongruents. It is noteworthy that thesocial ties impacted by ethnic incongruence relatemore to perceived school climate (i.e., belonging,liking) than to intrapersonal adjustment (i.e.,loneliness, anxiety). Feelings of belonging in partic-ular, more so than general mental health, capturesocial adaptation at school and establishment ofpositive social ties (finding one’s niche and fittingin), a process that is more likely to be influenced byethnic incongruence.
Because ethnic incongruence signals a mismatchbetween the social context of the departing andreceiving school, the transition disruptions thatincongruent students experienced are consistentwith the larger school transition literature on devel-opmental mismatch (see Eccles, 2004). However,declining ethnic representation, or moving frombeing a majority to minority group member, alsounderscores the importance of a ‘‘critical mass’’ ofsame-ethnicity peers in any school context to easethe challenges of finding one’s niche and fitting in.What that critical mass might be was of interest todevelopmental researchers in the early schooldesegregation literature (e.g., Schofield & Sagar,1983; St. John, 1975), and it continues to be part ofthe public discourse on both affirmative action inhigher education and race-conscious policies in theassignment of K–12 students to schools (NationalResearch Council, 2007). For example, it has beensuggested that any ethnic group should be at least
15% of the school population to mitigate the isola-tion and vulnerability to out-group hostility thatsometimes accompanies minority status (e.g.,National Research Council, 2007). Our findings sug-gest that it is not only absolute levels of ethnicgroup representation that need to be considered,but also changes in those levels across critical schooltransitions.
The negative transition experiences of AfricanAmerican and Latino incongruent students docu-mented in the current study may serve as a precur-sor to later educational challenges. The life courseperspective suggests that transition experienceshave the potential to alter life course trajectories,particularly in relation to cumulating disadvantage(Elder, 1998). It may be that the disruptions acrossthe transition due to ethnic incongruence are a riskfactor for well-documented challenges in highschool that African American and Latino studentsencounter, including higher dropout and lowergraduation rates (Laird, DeBell, & Chapman, 2006;Orfield, Losen, Wald, & Swanson, 2004). Futureresearch should explore whether transition disrup-tions experienced by these student populations doindeed exert effects on more distal educationaloutcomes.
School Characteristics and Transition Experiences
In addition to examining person–context interac-tions through ethnic incongruence, we used a com-plimentary method to examine ethnicity in context,namely, schools’ ethnic diversity, which takes intoaccount both the number of ethnic groups repre-sented and the relative proportions of each ethnicgroup. Whereas ethnic incongruence examines thematch between the person and the environment,school diversity focuses solely on the structuralcharacteristics of the environments in which stu-dents are embedded. The effects of school ethnicdiversity and other school-level covariates wereonly modest once we accounted for the individual-level covariates. School size, SES, and ethnic diver-sity related primarily to academic outcomes ratherthan social ties, and the relations were not surpris-ing. For example, the negative association betweenincreases in school diversity from middle school tohigh school and GPA may be, in part, attributableto higher academic standards in these more diverseschools; in the current sample, school diversity washighly correlated with school-level performance onthe Academic Performance Index (API), a school-wide aggregate of performance on California’sstatewide assessment program (r = .63 and .70 for
The Transition to High School 371
the middle and high school levels, respectively).School SES and API were also highly correlated(r = .81 and .67 for the middle and high schoollevels, respectively), which may partly explainwhy increases in school SES were associated withboth higher grades and lower absences across thetransition.
Although the school-level covariates did a rea-sonable job of differentiating students’ immediateexperiences of the transition, they provided almostno illumination of students’ trajectories across highschool. Other studies of high school outcomes thatinclude both individual- and school-level covariatesalso find relatively little impact of between-schooldifferences (e.g., Johnson et al., 2001). It may be thatthe critical variables for understanding adolescents’high school trajectories are not specific to the schoolecology, the primary context examined in the cur-rent study. Instead, out-of-school factors such asinvolvement in romantic relationships, after-schoolemployment, contact with the juvenile justice sys-tem, or other relevant factors not assessed heremay be more critical for understanding adolescents’outcomes across high school. As such, the linkbetween adolescents’ out-of-school experiencesand their in-school adaptation—in other words, themultiple and interrelated contexts in which theyfunction—is an important topic for future research(for examples, see Benner, Graham, & Mistry, 2008;Cook, Herman, Phillips, & Settersten, 2002).
Strengths, Caveats, and Limitations
Several design features contributed to thestrength of the current study. Whereas previousstudies of the high school transition typically usedonly two time points and studied primarily aca-demic adjustment, we utilized eight time points,four in middle school and four in high school, andwe included previously understudied constructs(i.e., school climate, psychological functioning), allof which were affected by the high school transi-tion. Piecewise growth modeling for both middleand high school allowed us to explore whether anyobserved changes across time were linear or nonlin-ear and to determine how time-varying and time-invariant individual- and school-level covariatesinfluenced students’ transitions.
Although we believe that the current studymakes a significant contribution to the high schooltransition literature, some limitations and caveatsshould be noted. First, these findings are specific tothe urban sample from which the data were drawn.
The sample is not nationally representative, and itmust be acknowledged that adolescents in subur-ban or rural areas may have different high schooltransition experiences. Also, there were no incon-gruent White and Asian students in our sample, sowe do not know whether decreases in the numeri-cal representation of one’s ethnic group from oneschool context to another have the same disruptiveeffects on racial ⁄ ethnic groups that enjoy highersocietal status and that achieve better educationaloutcomes. Additionally, the current study does nottake into account the transition supports that dis-tricts or schools may be implementing. Althoughprevious studies have found some evidence of thesuccess of high school transition programming (Fel-ner, Ginter, & Primavera, 1982; Smith, 1997), schooland district data regarding transition interventionswere not readily available for the current sample.Finally, we modeled trajectories of school climate,psychological adjustment, and academic achieve-ment in separate analyses. We did this because wewere primarily interested in the effects of individ-ual and school covariates on these specific out-comes and because we were introducing arelatively new method for examining change acrossan important transition. We conducted a total of 12analyses (2 per variable of interest), and weacknowledge the possibility that multiple modelscan lead to observing noneffects (i.e., Type I errors).However, to the extent that the changes weobserved across the transition and in the largerdevelopmental context were consistent with the lifecourse perspective and our theoretical expectations,our confidence in our findings is strengthened. Wealso recognize that changes in perceived schoolclimate, psychological adjustment, and academicoutcomes are interrelated in complex ways, and webelieve that the analyses presented here are neededfirst steps for unraveling that complexity.
Directions for Future Research
Much of adolescents’ high school transition expe-riences remain to be explored. Future researchshould confirm that the trajectories observed in thecurrent study are attributable to school transitionsrather than a normative developmental pattern oflate adolescence. Simmons and Blyth (1987) useddifferences in students’ school feeder patternstructures to verify that the negative developmentaloutcomes they observed across the middle schooltransition were attributable to students’ transitionexperiences rather than to normative adolescent
372 Benner and Graham
development. We suggest a similar strategy forfuture exploration of the high school transition.In addition to verifying the transition effect,exploration of the social timing of the high schooltransition should also be explored. Whether off-time students, for example, those who experienceearlier retention in grade and are thus above agefor the transition to high school, exhibit moretransition challenges than those making an on-timetransition remains a question for future study.
The study of school processes, in addition toschool structural variables, that may ease disrup-tions is also a ripe area for future inquiry. The lifecourse perspective posits that individuals sharelinked lives, an interdependence that influenceshow individuals adjust to life transitions (Elder,1998). One operationalization of linked lives maybe in the relationships between teachers and stu-dents across the transition. For example, we knowthat the high school transition is accompanied byless personal student–teacher relationships (Reyeset al., 1994; Seidman et al., 1996). However, if stu-dents are able to form close relationships with ateacher early in ninth grade, this might buffer someof the negative effects and bolster some of the posi-tive effects of the transition. In addition, schoolorganizational features, such as academic detrack-ing, and extracurricular activities that increase themixing opportunities of students from different eth-nic groups are likely to enhance intergroup rela-tions and improve feelings of belonging of allstudents (see Moody, 2001).
Although we adopted the life course perspectiveas the theoretical framework for our research, weacknowledge that other life-span approaches todevelopment in ethnically diverse youth are alsopresent in the developmental literature. The phe-nomenological variant of ecological systems theory(PVEST) developed by Spencer and colleaguesoffers a particularly rich analysis of context, culture,and how ethnic minority youth negotiate bothnormative and nonnormative developmental chal-lenges (for review, see Spencer, 2006). Studies ofthe high school transition that focus on the devel-opmental processes most central to PVEST wouldbe a welcome addition to the transition literature.
Finally, and perhaps most importantly, futureresearch should explore how adolescents’ experi-ences of the transition to high school affect theirlater outcomes. Life-span approaches suggest thatthe ways in which individuals negotiate transitionscan affect their subsequent life course trajectories.As such, it is critical to determine how students’transition experiences influence more distal educa-
tional outcomes, including performance on highschool exit exams and other markers of successfulhigh school completion.
References
Aikins, J. W., Bierman, K. L., & Parker, J. G. (2005).Navigating the transition to junior high school: Theinfluence of pre-transition friendship and self-systemcharacteristics. Social Development, 14, 42–60.
Alexander, K. L., Entwisle, D. R., Blyth, D. A., &McAdoo, H. P. (1988). Achievement in the first twoyears of school: Patterns and processes. Monographs ofthe Society for Research in Child Development, 53, 1–157.
Alspaugh, J. W. (1999). The interaction effect of transitiongrade to high school with gender and grade level upon drop-out rates. Paper presented at the American EducationalResearch Association. Montreal, Canada.
Arbuckle, J. L. (1996). Full information estimation in thepresence of incomplete data. In G. A. Marcoulides & R.E. Schumacker (Eds.), Advanced structural equationmodeling: Issues and techniques (pp. 243–277). Mahwah,NJ: Erlbaum.
Asher, S. R., & Wheeler, V. A. (1985). Children’s loneliness:A comparison of rejected and neglected peer status.Journal of Consulting and Clinical Psychology, 53, 500–505.
Baker, J. A., Derrer, R. D., Davis, S. M., Dinklage-Travis,H. E., Linder, D. S., & Nicholson, M. D. (2001). The flipside of the coin: Understanding the school’s contribu-tion to dropout and completion. School Psychology Quar-terly, 16, 406–426.
Barber, B. K., & Olsen, J. A. (2004). Assessing the transi-tions to middle and high school. Journal of AdolescentResearch, 19, 3–30.
Benner, A. D., & Graham, S. (2007). Navigating the transi-tion to multi-ethnic urban high schools: Changing eth-nic congruence and adolescents’ school related affect.Journal of Research on Adolescence, 17, 207–220.
Benner, A. D., Graham, S., & Mistry, R. S. (2008). Discern-ing direct and mediated effects of ecological structuresand processes on adolescents’ educational outcomes.Developmental Psychology, 44, 840–854.
Cohen, J. (1988). Statistical power analysis for the behavioralsciences (2nd ed.). Hillsdale, NJ: Erlbaum.
Cook, T., Herman, M., Phillips, M., & Settersten, R.(2002). Some ways in which neighborhoods, nuclearfamilies, friendship groups, and schools jointly affectchanges in early adolescent development. Child Devel-opment, 73, 1283–1309.
Crosnoe, R., & Huston, A. C. (2007). Socioeconomic sta-tus, schooling, and the developmental trajectories ofadolescents. Developmental Psychology, 43, 1097–1110.
Eccles, J. S. (2004). Schools, academic motivation, andstage-environment fit. In R. M. Lerner & L. Steinberg(Eds.), Handbook of adolescent psychology (pp. 125–153).Hoboken, NJ: Wiley.
Eccles, J. S., Lord, S., & Midgley, C. (1991). What are wedoing to early adolescents? The impact of educational
The Transition to High School 373
contexts on early adolescents. American Journal of Educa-tion, 99, 521–542.
Elder, G. H. (1985). Perspectives on the life course. In G.H. Elder (Ed.), Life course dynamics: Trajectories andtransitions, 1968–1980 (pp. 23–49). Ithaca, NY: CornellUniversity Press.
Elder, G. H. (1998). The life course as developmental the-ory. Child Development, 69, 1–12.
Enders, C. K. (2001). The performance of the full informa-tion maximum likelihood estimator in multiple regres-sion models with missing data. Educational andPsychological Measurement, 61, 713–740.
Entwisle, D. R., & Alexander, K. L. (2002). The first gradetransition in life course perspective. In J. Mortimer &M. Shanahan (Eds.), Handbook of the life course (pp. 229–250). New York: Kluwer Academic ⁄ Plenum.
Felner, R. D., Ginter, M., & Primavera, J. (1982). Primaryprevention during school transitions: Social supportand environmental structure. American Journal ofCommunity Psychology, 10, 277–290.
Finn, J. D., & Rock, D. A. (1997). Academic successamong students at risk for school failure. Journal ofApplied Psychology, 82, 221–234.
French, S. E., Seidman, E., Allen, L., & Aber, J. L. (2000).Racial ⁄ ethnic identity, congruence with the social con-text, and the transition to high school. Journal of Adoles-cent Research, 15, 587–602.
George, L. K. (1993). Sociological perspectives on lifetransitions. Annual Review of Sociology, 19, 353–373.
Gottfredson, G. (1984). Effective School Battery. Odessa, FL:Psychological Assessment Resources.
Gray-Little, B., & Carels, R. (1997). The effect of racial dis-sonance on academic self-esteem and achievement inelementary, junior high, and high school students.Journal of Research on Adolescence, 7, 109–131.
Gutman, L. M., & Eccles, J. S. (2007). Stage-environmentfit during adolescence: Trajectories of family relationsand adolescent outcomes. Developmental Psychology, 43,522–537.
Isakson, K., & Jarvis, P. (1999). The adjustment of adolescentsduring the transition into high school: A short term longi-tudinal study. Journal of Youth and Adolescence, 28, 1–26.
Johnson, M., Crosnoe, R., & Elder, G. (2001). Students’attachment and academic engagement: The role of raceand ethnicity. Sociology of Education, 74, 318–340.
KewalRamani, A., Gilbertson, L., Fox, M., & Provasnik, S.(2007). Status and trends in the education of racial andethnic minorities (NCES 2007-039). Washington, DC:National Center for Education Statistics.
Kinney, D. A. (1993). From nerds to normals: The recov-ery of identity among adolescents from middle schoolto high school. Sociology of Education, 66(1), 21–40.
La Greca, A. M., & Lopez, N. (1998). Social anxiety amongadolescents: Linkages with peer relations and friend-ships. Journal of Abnormal Child Psychology, 26, 83–94.
Laird, J., DeBell, M., & Chapman, C. (2006). Dropout ratesin the United States: 2004 (NCES 2007-024). Washington,DC: National Center for Education Statistics.
Lee, V. E., & Smith, J. B. (1995). Effects of high schoolrestructuring and size on early gains in achievementand engagement. Sociology of Education, 68, 241–270.
McCartney, K., Bub, K. L., & Burchinal, M. (2006). VI.Selection, detection, and reflection. Monographs of theSociety for Research in Child Development, 71, 105–126.
Moody, J. (2001). Race, school integration, and friendshipsegregation in America. American Journal of Sociology,107, 679–716.
Murdock, T. B., Anderman, L. H., & Hodge, S. A. (2000).Middle-grade predictors of students’ motivation andbehavior in high school. Journal of Adolescent Research,15, 327–351.
Muthen, B. O., & Curran, P. J. (1997). General longitudi-nal modeling of individual differences in experimentaldesigns: A latent variable framework for analysis andpower estimation. Psychological Methods, 2, 371–402.
Muthen, L. K., & Muthen, B. O. (1998–2006). Mplus user’sguide (4th ed.). Los Angeles: Muthen & Muthen.
National Research Council. (2007). Race conscious policiesfor assigning students to schools: Social science research andthe Supreme Court cases. Washington, DC: NationalAcademy Press.
Orfield, G., & Lee, C. (2005). Why segregation matters:Poverty and educational inequality. Cambridge, MA: TheCivil Rights Project at Harvard University.
Orfield, G., Losen, D., Wald, J., & Swanson, C. B. (2004).Losing our future: How minority youth are being left behindby the graduation rate crisis. Cambridge, MA: The CivilRights Project at Harvard University.
Reyes, O., Gillock, K. L., & Kobus, K. (1994). A longitudi-nal study of school adjustment in urban, minority ado-lescents: Effects of a high school transition program.American Journal of Community Psychology, 22, 341–369.
Roderick, M. (2003). What’s happening to the boys? Earlyhigh school experiences and school outcomes amongAfrican American male adolescents in Chicago UrbanEducation, 38, 538–607.
Roeser, R. W., Eccles, J. S., & Freedman-Doan, C. (1999).Academic functioning and mental health in adoles-cence: Patterns, progressions, and routes from child-hood. Journal of Adolescent Research, 14, 135–174.
Rudolph, K. D., Lambert, S. F., Clark, A. G., & Kurlakow-sky, K. D. (2001). Negotiating the transition to middleschool: The role of self-regulatory processes. ChildDevelopment, 72, 929–946.
Russell, S. T., Elder, G. H., & Conger, R. D. (1997). Schooltransitions and academic achievement. Paper presented atthe American Sociological Association. Toronto, Canada.
Rutter, M. (1996). Transitions and turning points in devel-opmental psychopathology: As applied to the age spanbetween childhood and mid-adulthood. InternationalJournal of Behavioral Development, 19, 603–626.
Schiller, K. S. (1999). Effects of feeder patterns on stu-dents’ transition to high school. Sociology of Education,72, 216–233.
Schofield, J., & Sagar, H. (1983). Desegregation, schoolpractices, and student race relations. In C. Rossell &
374 Benner and Graham
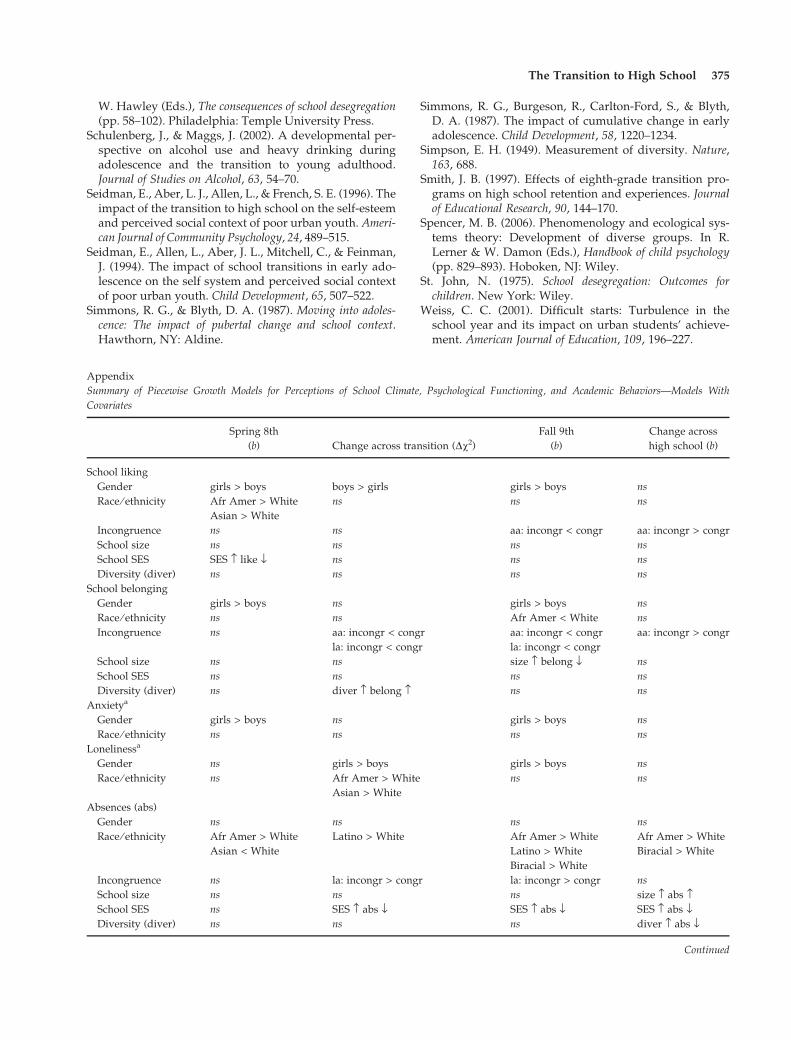
W. Hawley (Eds.), The consequences of school desegregation(pp. 58–102). Philadelphia: Temple University Press.
Schulenberg, J., & Maggs, J. (2002). A developmental per-spective on alcohol use and heavy drinking duringadolescence and the transition to young adulthood.Journal of Studies on Alcohol, 63, 54–70.
Seidman, E., Aber, L. J., Allen, L., & French, S. E. (1996). Theimpact of the transition to high school on the self-esteemand perceived social context of poor urban youth. Ameri-can Journal of Community Psychology, 24, 489–515.
Seidman, E., Allen, L., Aber, J. L., Mitchell, C., & Feinman,J. (1994). The impact of school transitions in early ado-lescence on the self system and perceived social contextof poor urban youth. Child Development, 65, 507–522.
Simmons, R. G., & Blyth, D. A. (1987). Moving into adoles-cence: The impact of pubertal change and school context.Hawthorn, NY: Aldine.
Simmons, R. G., Burgeson, R., Carlton-Ford, S., & Blyth,D. A. (1987). The impact of cumulative change in earlyadolescence. Child Development, 58, 1220–1234.
Simpson, E. H. (1949). Measurement of diversity. Nature,163, 688.
Smith, J. B. (1997). Effects of eighth-grade transition pro-grams on high school retention and experiences. Journalof Educational Research, 90, 144–170.
Spencer, M. B. (2006). Phenomenology and ecological sys-tems theory: Development of diverse groups. In R.Lerner & W. Damon (Eds.), Handbook of child psychology(pp. 829–893). Hoboken, NJ: Wiley.
St. John, N. (1975). School desegregation: Outcomes forchildren. New York: Wiley.
Weiss, C. C. (2001). Difficult starts: Turbulence in theschool year and its impact on urban students’ achieve-ment. American Journal of Education, 109, 196–227.
Appendix
Summary of Piecewise Growth Models for Perceptions of School Climate, Psychological Functioning, and Academic Behaviors—Models With
Covariates
Spring 8th
(b) Change across transition (Dv2)
Fall 9th
(b)
Change across
high school (b)
School liking
Gender girls > boys boys > girls girls > boys ns
Race ⁄ ethnicity Afr Amer > White
Asian > White
ns ns ns
Incongruence ns ns aa: incongr < congr aa: incongr > congr
School size ns ns ns ns
School SES SES › like fl ns ns ns
Diversity (diver) ns ns ns ns
School belonging
Gender girls > boys ns girls > boys ns
Race ⁄ ethnicity ns ns Afr Amer < White ns
Incongruence ns aa: incongr < congr
la: incongr < congr
aa: incongr < congr
la: incongr < congr
aa: incongr > congr
School size ns ns size › belong fl ns
School SES ns ns ns ns
Diversity (diver) ns diver › belong › ns ns
Anxietya
Gender girls > boys ns girls > boys ns
Race ⁄ ethnicity ns ns ns ns
Lonelinessa
Gender ns girls > boys girls > boys ns
Race ⁄ ethnicity ns Afr Amer > White
Asian > White
ns ns
Absences (abs)
Gender ns ns ns ns
Race ⁄ ethnicity Afr Amer > White
Asian < White
Latino > White Afr Amer > White
Latino > White
Biracial > White
Afr Amer > White
Biracial > White
Incongruence ns la: incongr > congr la: incongr > congr ns
School size ns ns ns size › abs ›School SES ns SES › abs fl SES › abs fl SES › abs flDiversity (diver) ns ns ns diver › abs fl
Continued
The Transition to High School 375
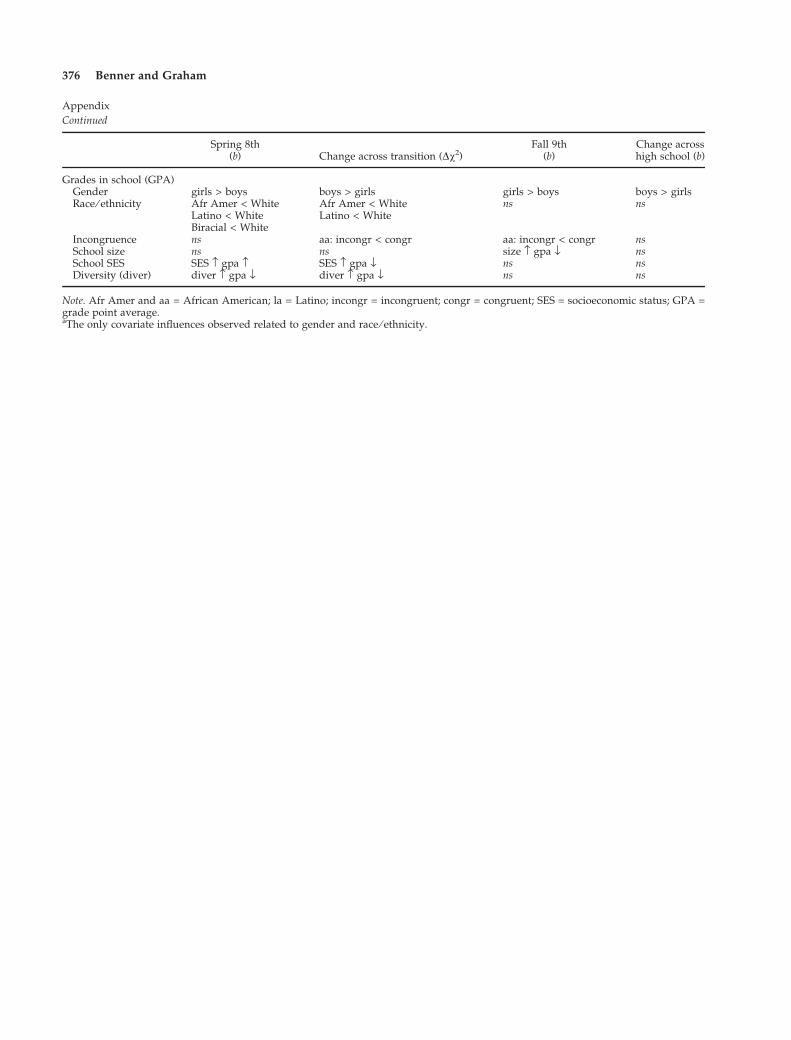
Appendix
Continued
Spring 8th(b) Change across transition (Dv2)
Fall 9th(b)
Change acrosshigh school (b)
Grades in school (GPA)Gender girls > boys boys > girls girls > boys boys > girlsRace ⁄ ethnicity Afr Amer < White
Latino < WhiteBiracial < White
Afr Amer < WhiteLatino < White
ns ns
Incongruence ns aa: incongr < congr aa: incongr < congr nsSchool size ns ns size › gpa fl nsSchool SES SES › gpa › SES › gpa fl ns nsDiversity (diver) diver › gpa fl diver › gpa fl ns ns
Note. Afr Amer and aa = African American; la = Latino; incongr = incongruent; congr = congruent; SES = socioeconomic status; GPA =grade point average.aThe only covariate influences observed related to gender and race ⁄ ethnicity.
376 Benner and Graham