Embed Size (px)
Citation preview

The Transition to ESSA: State and District Approaches to Implementing Title I and Title II-A in 2017–18
Evaluation Report
NCEE 2021-002 U.S. DEPARTMENT OF EDUCATION
A Publication of the National Center for Education Evaluation and Regional Assistance
U.S. Department of Education Betsy DeVos Secretary
Institute of Education Sciences Mark Schneider Director
Matthew Soldner Commissioner, National Center for Education Evaluation and Regional Assistance
Erica Johnson Project Officer
The Institute of Education Sciences (IES) is the independent, non-partisan statistics, research, and evaluation arm of the U.S. Department of Education. The IES mission is to provide scientific evidence on which to ground education practice and policy and to share this information in formats that are useful and accessible to educators, parents, policymakers, researchers, and the public.
We strive to make our products available in a variety of formats and in language that is appropriate to a variety of audiences. You, as our customer, are the best judge of our success in communicating information effectively. If you have any comments or suggestions about this or any other IES product or report, we would like to hear from you. Please direct your comments to [email protected].
This report was prepared for the Institute of Education Sciences under Contract No. ED-IES-11-C-0063 by Westat and Mathematica. The content of the publication does not necessarily reflect the views or policies of IES or the U.S. Department of Education nor does mention of trade names, commercial products, or organizations imply endorsement by the U.S. Government.
December 2020
This report is in the public domain. While permission to reprint this publication is not necessary, it should be cited as:
Troppe, P., Isenberg, E., Milanowski, A., Garrison-Mogren, R., Rizzo, L., Gill, B.P., Ross, C., Dillon, E., & Li, A. (2020). The transition to ESSA: State and district approaches to implementing Title I and Title II-A in 2017–18 (NCEE 2021-002). Washington, DC: U.S. Department of Education, Institute of Education Sciences, National Center for Education Evaluation and Regional Assistance. Retrieved from http://ies.ed.gov/ncee.
This report also is available on the IES website at http://ies.ed.gov/ncee.

The Transition to ESSA: State and District Approaches to Implementing Title I and Title II-A in 2017–18
December 2020
Patricia Troppe Eric Isenberg Anthony Milanowski Roberta Garrison-Mogren Louis Rizzo Westat
Brian P. Gill Christine Ross Erin Dillon Ann Li Mathematica
NCEE 2021-002
U.S. DEPARTMENT OF EDUCATION

1
In 2017–18, states and districts began to implement the Every Student Succeeds Act (ESSA), the current authorization of the federal Elementary and Secondary Education Act (ESEA). ESSA continues to call for states to set academic content standards, assess student achievement, identify and support low-performing schools, and improve educator effectiveness. ESSA departs from prior law, however, in giving states more discretion about how they accomplish these objectives. This report provides a brief look at the transition toward ESSA, as the foundation for an ongoing assessment of how the law is being carried out. The report uses survey data to examine how key policies and initiatives related to two large ESEA programs were implemented in 2017–18, and contrasts that with four years earlier. Key findings indicate that:
• Most states had not significantly changed their content standards by 2017–18, and districts increasingly provided supports, such as standards-aligned instructional materials, to implement them.
• States broadened the measures they used to identify struggling schools, while more districts reported that these schools implemented activities to support improvement, particularly teacher professional development.
• States and districts increasingly used performance data as a means to support effective teaching.
The Elementary and Secondary Education Act (ESEA), originally passed in 1965, is the primary federal law related to K–12 schooling. Accounting for over $19 billion of nearly $26 billion in fiscal year 2020, Title I and Title II-A are core ESEA programs.1 These programs intend to help provide all students with equal access to education by providing financial assistance to schools and districts with a high percentage of students from low-income families (Title I) and by improving teacher and principal quality (Title II-A).
ESEA’s latest reauthorization as the Every Student Succeeds Act (ESSA) in 2015 changed a number of policies related to Title I and Title II-A. In particular, ESSA shifts authority over many education decisions and rules from the U.S. Department of Education (the Department) to states and districts. The new law also retains some federal requirements from prior versions of ESEA to help ensure that states focus on providing a high-quality education to disadvantaged students. For example, under ESSA, states must continue to set challenging content standards, assess student performance in select grades and subjects, identify and support low-performing schools, and promote the development of effective educators. How states and districts respond to this combination of flexibility and requirements will determine whether ESSA stimulates educational improvement as intended.

2
This national portrait of Title I and Title II-A implementation is the second of four reports in a series. The first report, which focused on the 2013–14 school year, details state and local policy and practice under ESSA’s predecessor, the No Child Left Behind (NCLB) Act. By 2013–14, the Department had begun to provide states with waivers from key NCLB requirements in exchange for commitments to specific reform principles, colloquially known as “ESEA Flexibility.” ESSA’s passage in 2015 codified some of the flexibilities allowed under ESEA Flexibility. It also provided states a transition period, running through the 2017–18 school year, to implement ESSA’s core components.
This second report focuses on the 2017–18 school year. As a result, it captures a period of transition: early ESSA implementation in some states, but not in others. The third report, based on a targeted data collection in spring-summer 2021, will focus on the effects of the coronavirus pandemic on the implementation of ESSA during the 2020–21 school year. The final report in this series will focus on full ESSA implementation in the 2021–22 school year. See Exhibit 1 for more information on the study timeline and the ESEA policy timeline.
Exhibit 1. Study timeline compared with ESEA policy timeline: 2013–14 to 2021–22
Spring–summer 2014:
Initial data collection
Spring–summer 2018: Follow-up data collection
Spring–summer 2021: Coronavirus-focused data collection
Spring–summer 2022: Final data collection
December 2015: ESSA enacted
August 2016: ESEA Flexibility ends
September 2018: The Department approves final state ESSA plan
2013–14 2014–15 2016–17 2015–16 2017–18 2018–19 2019–20 2020–21 2021–22
ESEA policy timeline
Study timeline
3
SUMMARY OF STUDY DESIGN
What data were collected? Surveys on policies and practices related to Title I and Title II-A of ESEA were administered in spring/summer of 2014 and 2018 to all states and a nationally representative sample of local education agencies (LEAs, typically school districts). The sample of 570 districts was supplemented in 2018 with a sample of 152 charter school LEAs to ensure better representation of these LEAs. All states (including the District of Columbia) and nearly all districts (99 percent in 2014 and 96 percent in 2018) responded to the surveys.
The study also incorporates other information submitted to the Department, such as state ESSA plans and school performance designations from data provided by states through the EDFacts collection process. In addition, the study incorporates information from external sources on states’ adoption of the Common Core State Standards and states’ summative assessments to add more detail to the study’s survey results. More detail on the sample and data collection is included in Chapter 1 of the Supplemental Volume. The Supplemental Volume also provides many additional data tables (e.g., survey data reported by district poverty status) organized topically in Chapter 2, and the surveys used to collect the data in Chapter 3.
How were the data analyzed? Responses to survey questions were tabulated into descriptive statistics (such as percentages) and simple statistical tests (such as tests for differences between percentages). These tabulations provide a snapshot of state and district implementation at each time point, as well as aggregate changes over time. District figures for 2017–18 are based on the total LEA sample (the original 570 districts plus the supplemental sample of 152 charter school LEAs). The study is descriptive and not designed to estimate the impact of federal policies on state and district actions. More information on the study design, sample selection and characteristics, and analysis is in Chapter 1 of the Supplemental Volume.
LITTLE CHANGE IN STATE CONTENT STANDARDS BY 2018, DISTRICTS INCREASED SUPPORT TO IMPLEMENT THEM
State content standards play a central role in setting learning expectations for students, defining what they should know and be able to do. ESSA continues to require that states adopt “challenging” standards and annually assess student performance against the standards in select grades and subjects.
However, ESSA also contains new language that expressly prohibits federal policy from influencing state adoption of specific standards and assessments. This prohibition is in response to prior Department policies that encouraged the adoption of the Common Core State Standards (the Common Core), such as the Race to the Top grant competition and ESEA Flexibility granted to requesting states by the Department. State leaders and education stakeholders led the effort to

4
develop these standards to reflect college- and career-ready expectations for use across states. Two multistate consortia, supported with federal funds, developed assessments—the Smarter Balanced Assessment Consortium and the Partnership for Assessment of Readiness for College and Careers (PARCC)—aligned to the Common Core. Race to the Top and ESEA Flexibility did not require the adoption of the Common Core or their companion assessments. However, adopting the Common Core was a clear way for states to improve their chances of winning a grant or getting flexibility because the federal policies signaled that the Common Core met the threshold for challenging college- and career-ready standards and aligned assessments.
Although ESSA was passed in 2015, many states’ laws and regulations set timelines for reviewing content standards that may not have coincided with the new law.2 Thus, survey information collected in 2018 related to content standards and assessment policy may not fully capture states’ responses to ESSA. Similarly, state and district supports to implement their standards in the classroom may have been in flux during this period.3
Most states reported making no substantial changes to their content standards leading up to 2018, though many withdrew from the Smarter Balanced and PARCC assessment consortia.
The Common Core and associated assessments were the predominant state approach to meet ESEA’s content standards and assessments requirements in the years leading up to ESSA. All but four states had adopted the Common Core by 2013, and a majority of the Common Core states were participating in one of the two associated assessment consortia.4 However, by September 2014, more than 25 states that had adopted the Common Core renamed the standards.5 By 2015, 3 states had replaced the Common Core; 7 states were reviewing the standards; and 21 states were considering bills to stop implementing the standards.6 Nevertheless, what is of most interest is whether these changes represented a substantive departure from the Common Core standards, and whether the choice of assessments followed a similar path.
5
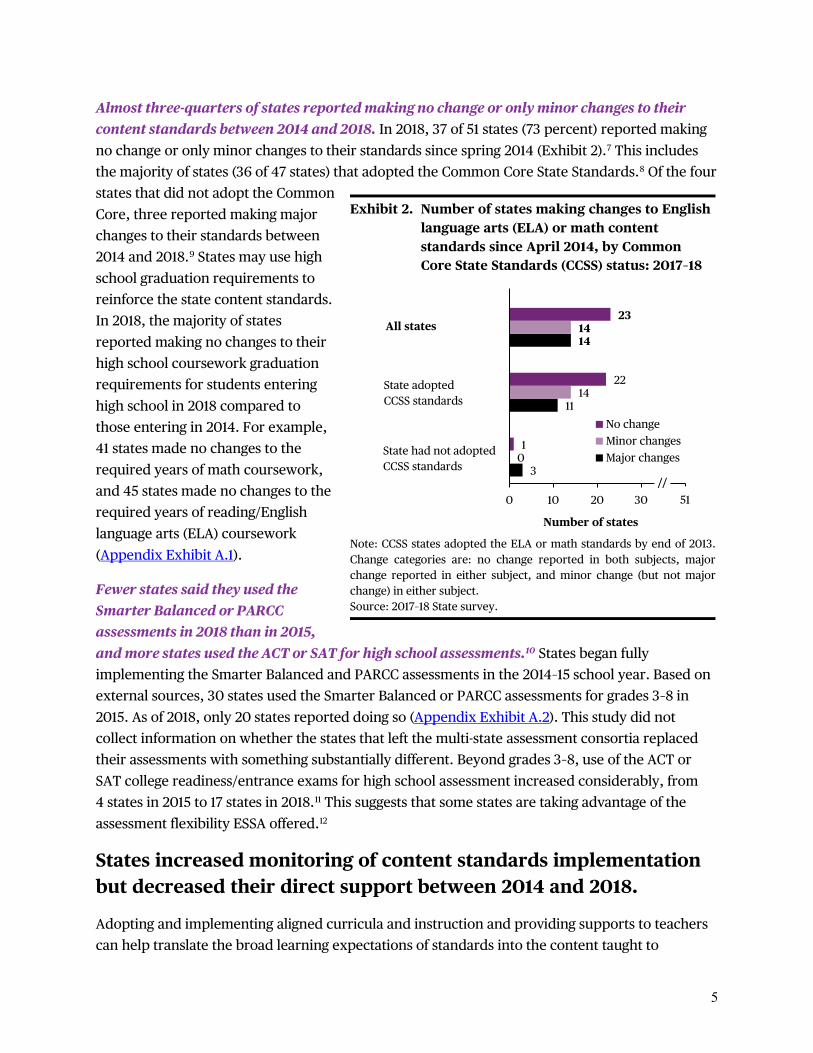
Almost three-quarters of states reported making no change or only minor changes to their content standards between 2014 and 2018. In 2018, 37 of 51 states (73 percent) reported making no change or only minor changes to their standards since spring 2014 (Exhibit 2).7 This includes the majority of states (36 of 47 states) that adopted the Common Core State Standards.8 Of the four states that did not adopt the Common Core, three reported making major changes to their standards between 2014 and 2018.9 States may use high school graduation requirements to reinforce the state content standards. In 2018, the majority of states reported making no changes to their high school coursework graduation requirements for students entering high school in 2018 compared to those entering in 2014. For example, 41 states made no changes to the required years of math coursework, and 45 states made no changes to the required years of reading/English language arts (ELA) coursework (Appendix Exhibit A.1).
Exhibit 2. Number of states making changes to English language arts (ELA) or math content standards since April 2014, by Common Core State Standards (CCSS) status: 2017–18
3
11
14
0
14
14
1
22
23
State had not adopted CCSS standards
State adopted CCSS standards
All states
0 10 20 30 40
Number of states
No changeMinor changesMajor changes
51//
Note: CCSS states adopted the ELA or math standards by end of 2013. Change categories are: no change reported in both subjects, major change reported in either subject, and minor change (but not major change) in either subject. Source: 2017–18 State survey.
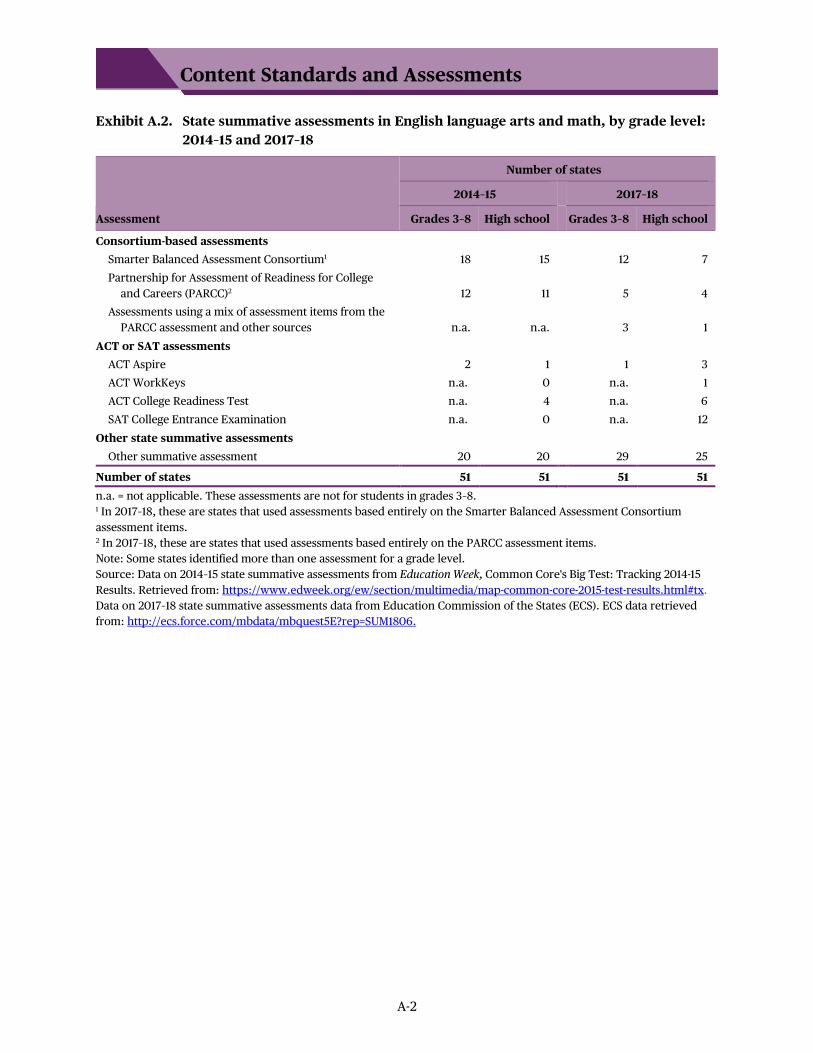
Fewer states said they used the Smarter Balanced or PARCC assessments in 2018 than in 2015, and more states used the ACT or SAT for high school assessments.10 States began fully implementing the Smarter Balanced and PARCC assessments in the 2014–15 school year. Based on external sources, 30 states used the Smarter Balanced or PARCC assessments for grades 3–8 in 2015. As of 2018, only 20 states reported doing so (Appendix Exhibit A.2). This study did not collect information on whether the states that left the multi-state assessment consortia replaced their assessments with something substantially different. Beyond grades 3–8, use of the ACT or SAT college readiness/entrance exams for high school assessment increased considerably, from 4 states in 2015 to 17 states in 2018.11 This suggests that some states are taking advantage of the assessment flexibility ESSA offered.12
States increased monitoring of content standards implementation but decreased their direct support between 2014 and 2018.
Adopting and implementing aligned curricula and instruction and providing supports to teachers can help translate the broad learning expectations of standards into the content taught to

6
students.13 States can support districts and educators in a variety of ways, such as with resources, professional development, and monitoring activities to encourage full implementation of the standards.14 Direct support, including providing or funding resources or professional development, is more typically provided during the early stages of implementation while monitoring is more typically provided during later stages of implementation.15
More states reported certain monitoring efforts. In 2018, more states indicated that when monitoring the implementation of content standards, they reviewed assessment results (42 states in 2018 versus 27 states in 2014) and required principal (29 states in 2018 versus 16 states in 2014) and teacher (31 states in 2018 versus 19 in 2014) evaluations to include evidence of alignment with content standards (Appendix Exhibit A.3). Similar numbers of states engaged in other types of monitoring activities in both 2014 and 2018 (e.g., in both years, one state required the use of a state model).
Fewer states reported funding or providing professional development on the current content standards and related instructional strategies. In both 2014 and 2018, the majority of states reported funding or providing professional development to help align curriculum and instruction with standards, although fewer did so in 2018 compared to 2014 (Appendix Exhibit A.4). Such efforts could include helping educators understand the content that standards cover at each grade level and the changes in instruction required. However, the number of states funding or providing this type of direct support declined to 44 in 2018 from all states and the District of Columbia in 2014.
A larger share of districts provided support for implementing content standards during the transition to ESSA.
Districts typically play a key role in developing and providing instructional supports to help implement standards.
Larger percentages of districts used materials to help educators understand and implement the state content standards. By 2018, a larger share of districts reported using standards-aligned instructional materials and working with schools to help implement them than had been the case in 2014. For example, large majorities of districts reported using tools or guidance such as curriculum maps (96 percent), textbooks (94 percent), and sample performance tasks for formative assessment purposes including rubrics or scoring guides (86 percent). Most districts also reported requiring school leaders to monitor alignment of instruction to the standards (88 percent), or having district staff visit schools to monitor such alignment (84 percent) (Exhibit 3). In addition, large percentages of districts reported requiring school staff evaluations to include evidence of the implementation of content standards (90 percent for teachers and 82 percent for school leaders). As with support materials, all of these activities were reported by a larger percentage of districts in 2018 than in 2014. The largest increases across all materials and

7
Exhibit 3. Percentage of districts that used materials or engaged in activities to align curriculum or instruction to ELA or math state content standards: 2013–14 and 2017–18
88
80
75
65
63
63
74
65
74
54
96*
94*
86*
83*
81*
90*
88*
84*
82*
82*
Tools or guidance on providing instruction aligned with the current state content standards such as scope and sequence, curriculum maps, or frameworks
Textbooks or other instructional materials aligned with the current state content standards
Sample performance tasks for formative assessment purposes including rubrics or scoring guides
Documents showing alignment between required state summative assessments and the current state content standards
Walk-through or observation protocols to aid in monitoring alignment of instruction with the current state content standards
Performance evaluation for teachers in your district include evidence of teaching approaches consistent with the current state content standards
School leaders are required to monitor alignment of instruction to the current state content standards
District staff have used walk-throughs or school visits to monitor alignment of instruction with the current state content standards
Staff developed district curriculum to align with the current state content standards
Performance evaluation for school leaders included evidence that current state content standards have been implemented
0 25 50 75 100Percent of districts2013–14 2017–18
Materials used
Activities engaged in
* Percentage is statistically different from percentage for 2013–14 (p < .05). Source: 2013–14 and 2017–18 District surveys.

8
activities were those related to evaluating teachers and school leaders on the extent to which instruction was aligned with standards.
Some of the increase in district support efforts was directed at subgroups of students highlighted in ESSA. For example, a larger percentage of districts in 2018 provided materials and professional development to help English learners and students with disabilities meet state content standards (68 to 88 percent of districts in 2018 versus 44 to 70 percent of districts in 2014, depending on the specific support) (Appendix Exhibit A.5).
STATES BROADENED MEASURES THAT IDENTIFY STRUGGLING SCHOOLS, DISTRICTS INCREASED IMPROVEMENT ACTIVITIES AT THOSE SCHOOLS
ESSA, like prior policy, seeks to promote educational excellence and equity by requiring each state to have an accountability system for school performance. For example, states must still establish ambitious long-term goals for core subjects such as reading and math proficiency. States must also still track school performance against these goals. Schools that fall far short of meeting these performance goals for students overall—or for students in key subgroups—must still be designated as low performing, and states must have a plan to improve these schools.
While ESSA maintains NCLB’s cornerstone accountability requirements, it also gives states more discretion over how to design and implement them. For example, ESSA places less emphasis on math and reading test scores and allows states to set their own performance goals by eliminating the NCLB requirement to achieve 100 percent student proficiency in reading and math within 12 years. ESSA also allows states to fully determine how they will intervene in their struggling schools, as long as those interventions are evidence-based. In contrast, NCLB required all schools not making “adequate yearly progress” to take a specified sequence of actions, from offering tutoring and transfers to other schools to restructuring, takeover, and closure.
The U.S. Secretary of Education approved states’ ESSA plans between August 2017 and September 2018. For most states, the first full year of implementing ESSA accountability systems was 2018–19. As states worked to finalize their ESSA plans, the Department allowed them to “freeze” the status of their previously identified low-performing schools for the 2016–17 and 2017–18 school years.16 States that took this option were not required to identify new schools during those two transition years, and schools identified earlier kept their status regardless of any changes in performance. Just 11 states identified low-performing schools for 2017–18 using rules in their approved ESSA plans.17 Thus, at the time of the survey in spring 2018, states’ accountability systems were in flux, transitioning from NCLB—or, for the 43 states that had received ESEA Flexibility from the Department, a more flexible version of NCLB—to ESSA, and, in most states and districts, the schools identified as low performing were identified prior to ESSA implementation. Examining

9
those systems and state and district supports for low-performing schools sets the stage for understanding later implementation.18
States expanded how they measure school performance between 2014 and 2018.
NCLB required states to publicly report the school-level performance of all students and subgroups of students who might otherwise be overlooked. ESSA continues that focus and enhances it in some ways, for example by requiring states to report on additional subgroups.19
However, NCLB’s emphasis on holding schools accountable for the percentage of students proficient in reading and math raised concerns about possible negative consequences: that states might be encouraged to set a low threshold for “proficiency” on state assessments, that curriculum would concentrate on reading and math to the exclusion of other key subjects, and that local educators would focus on certain students at the expense of others.20 In response to these concerns, ESSA strongly encourages states to include improvement in student achievement (“growth”) alongside attainment of a certain proficiency level in their accountability systems, potentially providing better information on each school’s contribution to student achievement. ESSA also requires states to go beyond proficiency in reading and math by adopting at least one measure of “school quality or student success,” such as student and educator engagement, student access to and completion of advanced coursework, postsecondary readiness, or school climate and safety.21 In addition to requiring states to publicly report on the performance of subgroups included in their accountability system, ESSA requires public reporting on schools to include migrant students, homeless students, students in foster care, students with parents on active military duty, and students by gender.
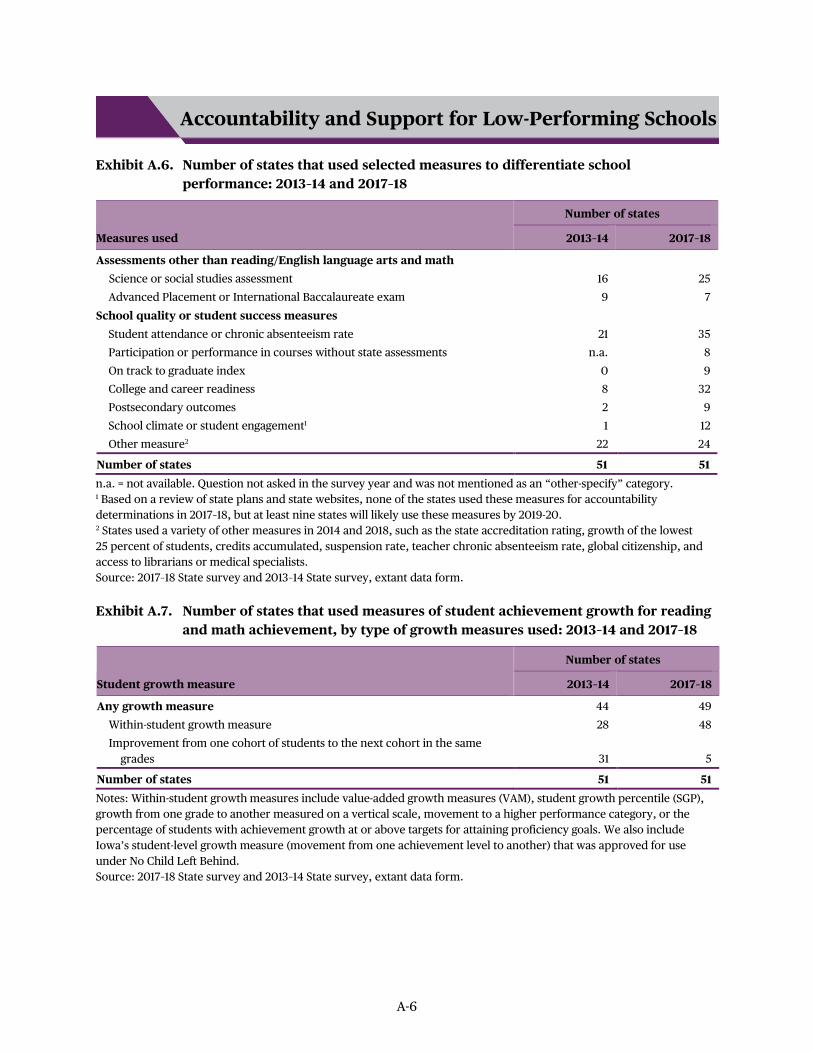
By 2018, many more states reported holding schools accountable for students’ attendance and their readiness for college and careers. In 2018, 32 states reported using college- and career-readiness to differentiate school performance compared to only 8 states in 2014, and 35 states examined student attendance in 2018 compared to 21 states in 2014 (Exhibit 4).
In addition to using nontest score measures to differentiate school performance, states also increasingly held schools accountable for student growth and for test scores in subjects beyond reading and math. For example, more states (48 in 2018 versus 28 in 2014) held schools accountable for individual students’ achievement growth, rather than only the percent proficient. And 9 more states (25 in 2018 versus 16 in 2014) reported using science or social studies test scores to differentiate school performance.

10
Exhibit 4. Number of states that reported using selected measures to differentiate school performance: 2013–14 and 2017–18
2
0
1
21
8
9
9
12
35
32
Postsecondary outcomes
On track to graduate index
School climate or student engagement
Student attendance or chronic absenteeism rate
College and career readiness
School quality or student success measures
28 48Individual student growth
Student achievement growth in ELA and Math
16
9
25
7
Science or social studies assessment
Advanced Placement or International Baccalaureate exam
0 10 20 30 40 50
Number of states
Assessments other than reading/ELA and math
2013–14 2017–1851
Source: 2013–14 and 2017–18 State surveys. For details, see Appendix Exhibits A.6 and A.7.
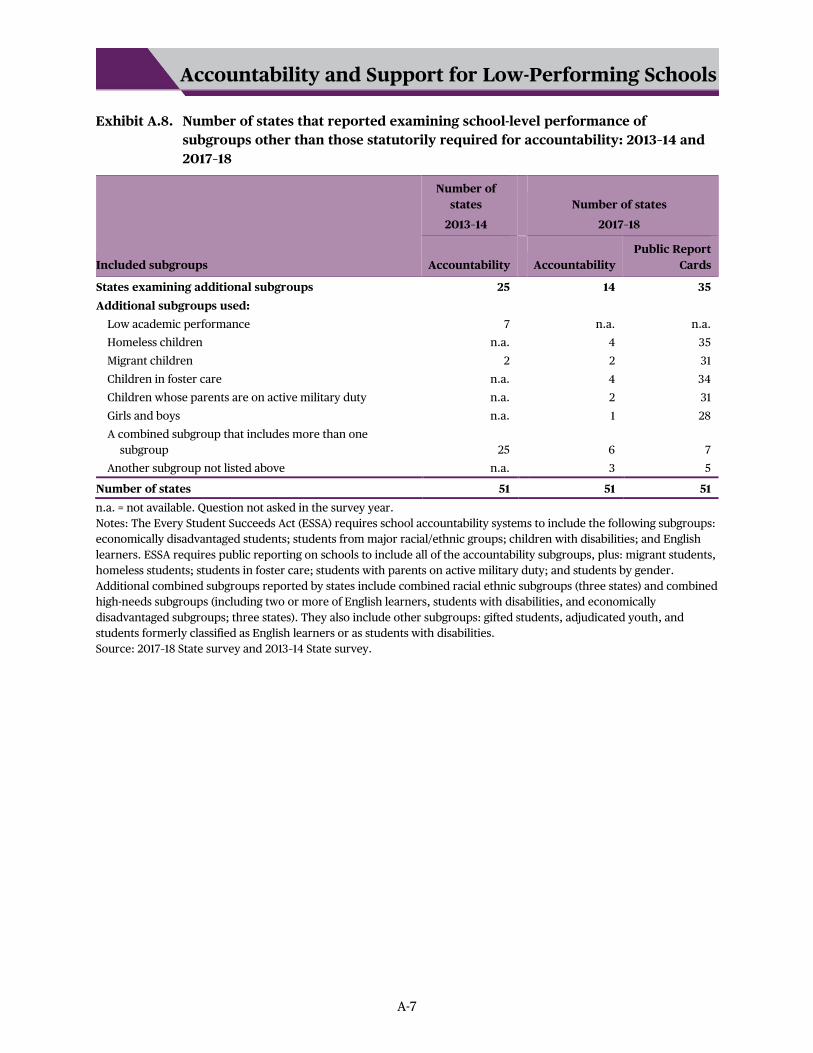
Most states tracked a wide range of student subgroups in 2018, and many made subgroup performance more visible by requiring reporting on smaller subgroups. About two-thirds of states required schools to report outcomes for subgroups of children who were homeless (35 states), in foster care (34 states), with parents on active military duty (31 states), or migrant (31 states), and about half reported outcomes by students’ gender (28 states) (Appendix Exhibit A.8). Meanwhile, the minimum number of students in a subgroup needed to trigger school reporting on their performance fell from 27.5 to 20 in the median state between 2014 and 2018 (Appendix Exhibit A.9).

11
In 2018, states had widely varying long-term goals for school performance.
Beginning with ESEA Flexibility in 2012 and continuing with the passage of ESSA in 2015, states became responsible for setting targets for how much and by when schools must improve their students’ achievement and attainment. ESSA requires only that state goals be “ambitious” and included in each state’s ESSA plan, approved by the U.S. Secretary of Education.
States differed in both the amount of reading and math improvement expected over the long run and the time to attain those goals. States reported long-term goals for proficiency in the core subjects ranging from 47 to 100 percent of students (starting from baselines ranging from 20 to 79 percent), with 1 state retaining NCLB’s 100 percent proficiency target (Appendix Exhibit A.10). Depending on the state’s starting level of proficiency, which ranged from 20 to 79 percent, these goals imply states’ intentions to increase proficiency by between 2 and 63 percentage points. The time states allowed to reach those goals ranged from 5 to 24 years. States that intended to increase proficiency by larger amounts also generally allowed more time to reach that goal (Appendix Exhibit A.11). Combining expected improvement amounts and periods into annualized rates also indicates substantial variation: they range from a less than 1 percentage point increase in proficiency expected per year in some states to a nearly 9 percentage point increase per year in other states (Exhibit 5).
Compared to reading and math, states’ long-term goals for graduation varied less. Targeted increases for graduation rates range from 0 to 33 percentage points, with the time states allow to reach their goals ranging from 5 to 24 years (Appendix Exhibit A.10). Annualized graduation rate goals range from 0 to 2.6 percentage points (Exhibit 5). The comparatively lower variation is likely because graduation rates are already closer to 100 percent (55 to 91 depending on the state), while starting achievement proficiency rates are lower (20 to 79 percent).22, 23

12
Exhibit 5. Annual percentage-point increase in achievement and attainment required to meet long-term goals, by state
0
1
2
3
4
5
6
7
8
9
10
ELA/Reading
0
1
2
3
4
5
6
7
8
9
10
Math Graduation rate
Ann
ual p
erce
ntag
e-po
int i
ncre
ase
requ
ired
to
mee
t lon
g-te
rm g
oal
Note: Each bar represents the annual percentage growth that the state must achieve to meet its long-term goal. Source: 2017–18 State survey and approved state ESSA plans. For related information, see Appendix Exhibit A.10.
Fewer states reported requiring or supporting school improvement activities at low-performing schools in 2018 compared to 2014, but more districts reported that specific improvement activities occurred at these schools.
States are responsible for defining not just school performance measures and long-term goals under ESSA, but also the rules for identifying and intervening in schools that are not meeting interim targets. However, efforts to promote better outcomes in low-performing schools also rely to a great extent on school districts. Since districts are more closely involved in the day-to-day operation of schools, they are typically aware of and influence the strategies that are actually implemented in their low-performing schools.24
Fewer states reported requiring specific improvement activities for these schools or engaging in particular monitoring and support activities. For example, 6 fewer states (35 in 2018 versus 41 in 2014) required schools to implement and monitor an instructional program that supports students not showing sufficient growth; 11 fewer states (25 in 2018 versus 36 in 2014) required

13
schools to provide professional development to staff that supports interventions for subgroups not showing sufficient growth; and 7 fewer states (9 in 2018 versus 16 in 2014) provided additional resources to these schools for reducing or maintaining low class sizes (Appendix Exhibits A.13 and A.14).
However, between 2014 and 2018, a larger percentage of districts reported that several improvement activities were used in their low-performing schools, particularly teacher professional development. The vast majority of districts reported that low-performing schools in 2018 provided intensive intervention for struggling students (99 percent); implemented programs to address students’ social, emotional, or health needs (99 percent); or had school improvement plans (98 percent) (Exhibit 6). While these activities were also common in 2014, more districts reported that schools implemented these activities in 2018. By 2018, increasing shares of districts reported teacher professional development on focused topics such as using data to improve instruction (93 percent in 2018 versus 68 percent in 2014), working effectively in teacher teams (93 percent in 2018 versus 61 percent in 2014), and addressing needs of students with disabilities (87 percent in 2018 versus 57 percent in 2014).
Exhibit 6. Percentage of districts reporting that selected improvement activities occurred in their low-performing Title I schools: 2013–14 and 2017–18
10
17
46
58*
87*
93*
93*
98
99*
99
20
16
39
30
57
61
68
97
82
85
Operate by school management organization
Replace the principal
Extended day, week, or year
Reduce class sizes
Teacher PD on strategies for students with disabilities
Teacher PD on working in teams
Teacher PD on using student data
Prepare a school improvement plan
Implement programs to address social, emotional, or health needs
Provide intensive intervention to struggling students
0 20 40 60 80 100
Percent of districts2013–14 2017–18
* Percentage is statistically different from the percentage for 2013–14 (p < .05). PD = Professional development. Source: 2013–14 and 2017–18 State surveys. For details, see Appendix Exhibit A.15.
14
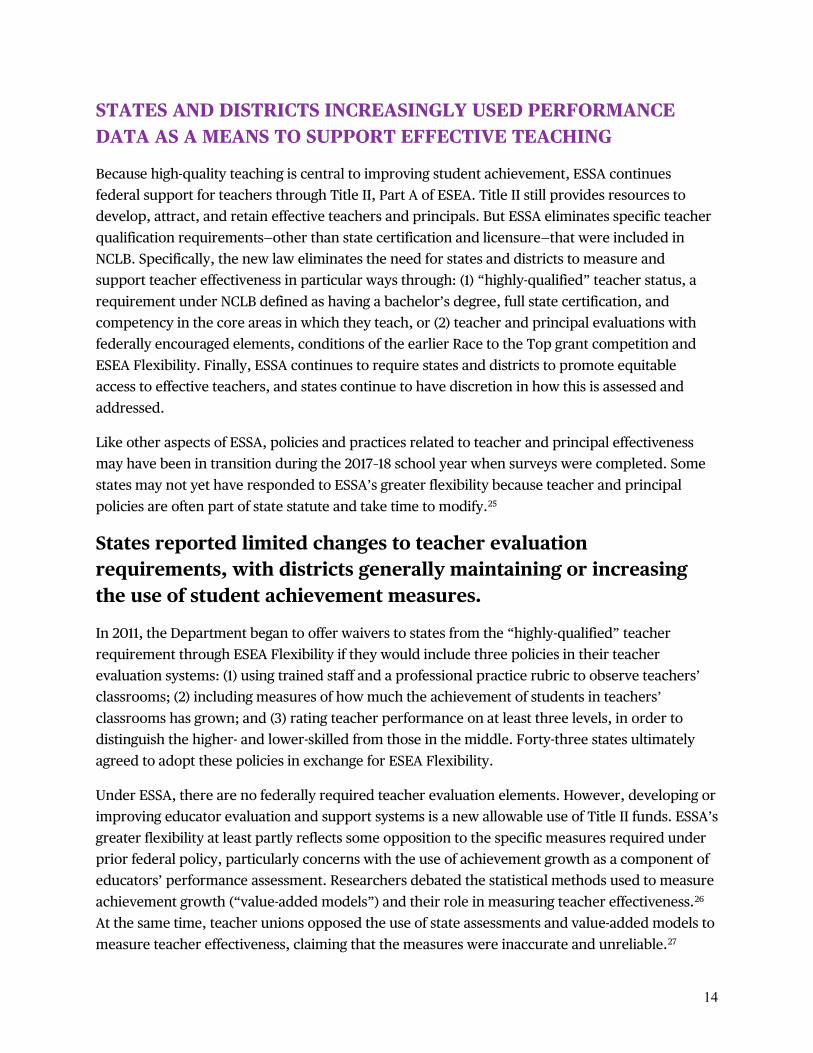
STATES AND DISTRICTS INCREASINGLY USED PERFORMANCE DATA AS A MEANS TO SUPPORT EFFECTIVE TEACHING
Because high-quality teaching is central to improving student achievement, ESSA continues federal support for teachers through Title II, Part A of ESEA. Title II still provides resources to develop, attract, and retain effective teachers and principals. But ESSA eliminates specific teacher qualification requirements—other than state certification and licensure—that were included in NCLB. Specifically, the new law eliminates the need for states and districts to measure and support teacher effectiveness in particular ways through: (1) “highly-qualified” teacher status, a requirement under NCLB defined as having a bachelor’s degree, full state certification, and competency in the core areas in which they teach, or (2) teacher and principal evaluations with federally encouraged elements, conditions of the earlier Race to the Top grant competition and ESEA Flexibility. Finally, ESSA continues to require states and districts to promote equitable access to effective teachers, and states continue to have discretion in how this is assessed and addressed.
Like other aspects of ESSA, policies and practices related to teacher and principal effectiveness may have been in transition during the 2017–18 school year when surveys were completed. Some states may not yet have responded to ESSA’s greater flexibility because teacher and principal policies are often part of state statute and take time to modify.25
States reported limited changes to teacher evaluation requirements, with districts generally maintaining or increasing
the use of student achievement measures.
In 2011, the Department began to offer waivers to states from the “highly-qualified” teacher requirement through ESEA Flexibility if they would include three policies in their teacher evaluation systems: (1) using trained staff and a professional practice rubric to observe teachers’ classrooms; (2) including measures of how much the achievement of students in teachers’ classrooms has grown; and (3) rating teacher performance on at least three levels, in order to distinguish the higher- and lower-skilled from those in the middle. Forty-three states ultimately agreed to adopt these policies in exchange for ESEA Flexibility.
Under ESSA, there are no federally required teacher evaluation elements. However, developing or improving educator evaluation and support systems is a new allowable use of Title II funds. ESSA’s greater flexibility at least partly reflects some opposition to the specific measures required under prior federal policy, particularly concerns with the use of achievement growth as a component of educators’ performance assessment. Researchers debated the statistical methods used to measure achievement growth (“value-added models”) and their role in measuring teacher effectiveness.26 At the same time, teacher unions opposed the use of state assessments and value-added models to measure teacher effectiveness, claiming that the measures were inaccurate and unreliable.27
15
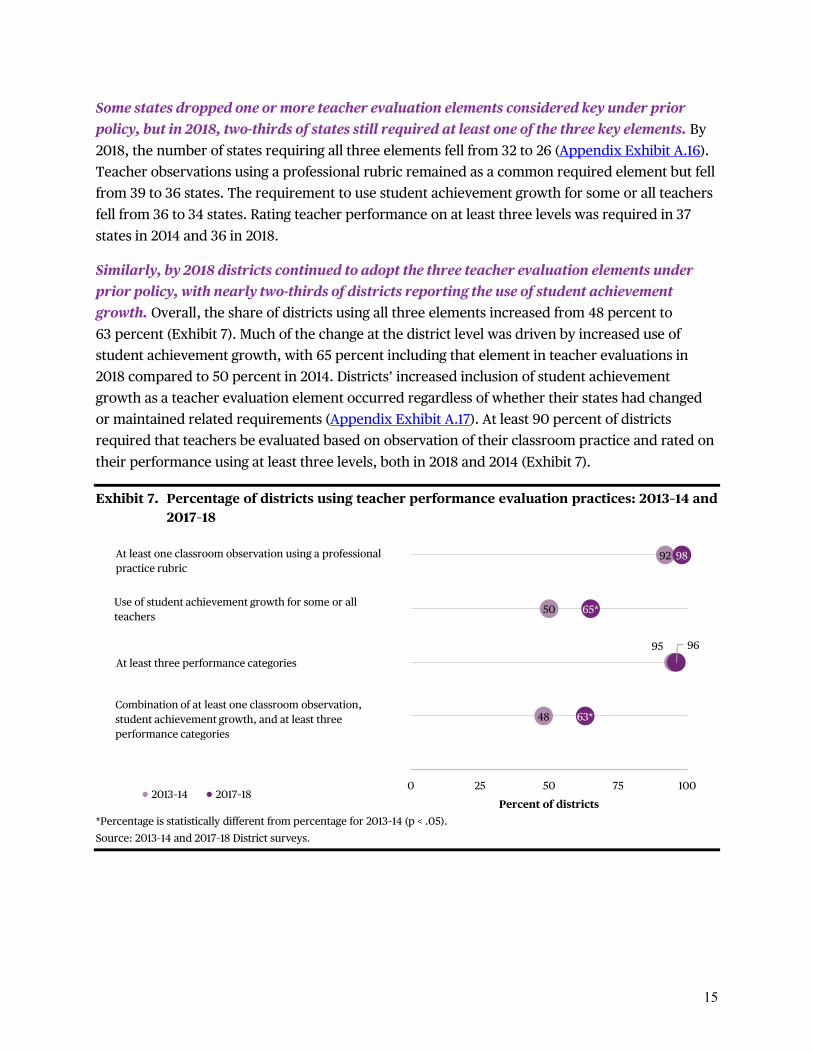
Some states dropped one or more teacher evaluation elements considered key under prior policy, but in 2018, two-thirds of states still required at least one of the three key elements. By 2018, the number of states requiring all three elements fell from 32 to 26 (Appendix Exhibit A.16). Teacher observations using a professional rubric remained as a common required element but fell from 39 to 36 states. The requirement to use student achievement growth for some or all teachers fell from 36 to 34 states. Rating teacher performance on at least three levels was required in 37 states in 2014 and 36 in 2018.
Similarly, by 2018 districts continued to adopt the three teacher evaluation elements under prior policy, with nearly two-thirds of districts reporting the use of student achievement growth. Overall, the share of districts using all three elements increased from 48 percent to 63 percent (Exhibit 7). Much of the change at the district level was driven by increased use of student achievement growth, with 65 percent including that element in teacher evaluations in 2018 compared to 50 percent in 2014. Districts’ increased inclusion of student achievement growth as a teacher evaluation element occurred regardless of whether their states had changed or maintained related requirements (Appendix Exhibit A.17). At least 90 percent of districts required that teachers be evaluated based on observation of their classroom practice and rated on their performance using at least three levels, both in 2018 and 2014 (Exhibit 7).
Exhibit 7. Percentage of districts using teacher performance evaluation practices: 2013–14 and 2017–18
92
50
95
48
98
65*
96
63*
At least one classroom observation using a professional practice rubric
Use of student achievement growth for some or all teachers
At least three performance categories
Combination of at least one classroom observation, student achievement growth, and at least three performance categories
0 25 50 75 100
Percent of districts2013–14 2017–18
*Percentage is statistically different from percentage for 2013–14 (p < .05). Source: 2013–14 and 2017–18 District surveys.

16
By 2018, more states and a larger share of districts focused on equitable access to high-quality teachers.
Since NCLB, ESEA has emphasized high-quality teaching and whether students have equitable access to it. NCLB required all teachers to be “highly qualified” by the 2005–06 school year. This requirement sought to ensure that all students are taught by effective teachers, thus meeting the law’s equity goal. ESSA continues NCLB’s emphasis on high-quality teaching, but stipulates that states decide how to define high-quality teaching and how to assess it.
More states and districts reported examining the distribution of teacher quality in 2018 than in 2014. The number of states that examined the distribution of teacher quality grew from 30 to 37, and the share of districts increased from 35 percent to 56 percent (Appendix Exhibits A.18 and A.19). This growth was accompanied by a shift in how states and districts assessed teacher quality. Compared to 2014, states and districts in 2018 used more measures and more frequently combined performance and nonperformance measures. Performance measures include evaluation ratings and other means of assessing teacher effectiveness, like a value-added model or student learning objectives. Nonperformance measures include credentials, like a teacher’s certification status or level of experience.28 In 2014, 17 of 30 states used performance measures and 19 states used nonperformance measures. This included six states that used both types of measures. In 2018, the number of states using performance measures increased to 26 (of 37 states in total), the number using nonperformance measures increased to 36, and the number using both types of measures increased to 25. Similarly, a greater share of districts used both types of measures in 2018 than in 2014. Of the districts that examined teacher quality, the share that used performance-based measures increased from 76 percent in 2014 to 88 percent in 2018. The share that used nonperformance measures increased from 90 percent to 95 percent, and the share combining both types of measures increased from 69 percent to 84 percent.
More states indicated they reported findings on the distribution of teacher quality and took steps to address inequities by supporting professional development, recruitment, and retention strategies. In particular, 31 of the 34 states that found inequities in the distribution of teachers reported those findings to school districts or the public. This was an increase from the 12 out of 21 states who reported on and found inequities in 2014 (Appendix Exhibit A.20). In addition, 33 states said they took one or more actions to address inequities, up from 18 states in 2014. In 2018, state actions most commonly included providing districts with resources such as professional development or coaching to improve the effectiveness of less-qualified teachers (27 states), encouraging the development of teacher career ladders or teacher leadership roles (27 states), providing support to districts on recruiting teachers (23 states), or providing support to districts to encourage improvements in teaching and learning environments (23 states).

17
Districts used the same strategies as states in working with their schools to address teacher quality inequities leading up to ESSA implementation—professional development, recruitment, and retention. Similar to states, the vast majority of districts that found inequities in teacher quality reported helping schools with lower teacher quality or effectiveness (91 percent of districts in 2018 and 92 percent in 2014) (Appendix Exhibit A.21). In both years, these districts offered more professional development (69 percent in 2018 and 73 percent in 2014) and about half said they worked to improve teacher learning environments in schools with lower levels of teacher quality (52 percent in 2018 and 47 percent in 2014)—for example, by lowering teacher loads, adding resources, or improving facilities. But in 2018 compared to 2014, more districts reported they began their hiring process earlier (63 percent versus 45 percent) and increased recruitment activities such as hosting open houses or job fairs (59 percent versus 40 percent).
Other increased efforts to promote effective teaching included state evaluations of teacher preparation programs and district-provided individualized support and coaching for teachers.
ESSA includes new emphasis on reforming and improving teacher and principal preparation programs. For the first time, states are allowed to use Title II funds to implement teacher residency programs and support preparation program reform activities. ESSA also continues to provide flexibility for states and districts to fund activities that support improving teacher effectiveness.
To promote improved teacher preparation, more states measured and reported on the effectiveness of teacher preparation programs. The number of states that reported examining the effectiveness of their teacher preparation programs increased from 29 in 2014 to 35 in 2018 (Appendix Exhibit A.22). In particular, an increasing number of states (18 in 2018 versus 11 in 2014) examined the effectiveness of teacher preparation programs using teacher performance measures such as evaluation ratings, value-added models, student growth percentiles, or classroom observations for teachers who were graduates of the programs. The number of states that reported these findings about effectiveness to their schools of education increased from 17 to 24 (Appendix Exhibit A.23). Nineteen states also reported this information to the public in 2018. The number of states reporting similar information to providers of alternative preparation programs increased from 11 to 17 between 2014 and 2018, with 15 states reporting this publicly by 2018.
Districts emphasized individualized support and coaching for low-performing teachers. In 2018, most districts (88 percent) that received Title II-A funds reported providing teacher professional development and support, with almost half of these funds (49 percent) spent for this purpose (Appendix Exhibit A.24). Almost all districts in 2018 (94 to 97 percent) used evaluation results to identify low-performing teachers; develop a performance improvement plan for these teachers; and plan individual professional development, including coaching, mentoring, or peer assistance (Appendix Exhibit A.25). A significantly larger share of districts reported using two of
18
these practices in 2018 compared to 2014: using evaluation results to identify low-performing teachers for coaching, mentoring, or peer assistance (95 percent versus 84 percent), and using evaluation results to develop improvement plans for low-performing teachers (97 percent versus 86 percent).
LOOKING AHEAD
ESSA’s passage in 2015 formally provided states with flexibility to implement Titles I and II-A. This report described the transition in education policy and practice in the few years before and after passage. Where states and districts go as they fully implement ESSA in future years is an open question that the study will turn to in its final data collection on the 2021–22 school year. Particularly since state changes may take time to make their way to the local levels, the final round of surveys will not only continue to track policy and practice at the state and district levels, but also learn how they are playing out in schools and classrooms around the country.
19
ENDNOTES 1 Appropriations for Title I, Part A, Grants to Local Educational Agencies, account for the majority of these funds with over $16.3 billion in FY 2020 appropriations. Appropriations for Title II, Part A, Supporting Effective Instruction, account for the next largest portion with approximately $2.1 billion. The remainder includes FY 2020 appropriations for Title I, Part B (State Assessment Grants), Title I, Part C (Migrant Education), and Title I, Part D (Programs for Children and Youth who are Neglected, Delinquent, or At-risk). See U.S. Department of Education, 2020. 2 The timing of required reviews of state content standards can vary by state. For example, Thomsen’s (2014) review of standards-setting processes for eight states found that North Carolina had a staggered 5-year review cycle, while Virginia reviews its standards every 2 years. 3 Additional data on related topics not covered in this report can be found in Chapter 2 of the Supplemental Volume. Topics include high school coursework and exam requirements, materials and support available and used to aid in the implementation in content standards, challenges to implementing content standards, availability and use of instructional choice options, summative assessments and activities for preparing students, assessment question response formats, assessment burden, limits on testing time, extent of opt outs, availability and use of statewide longitudinal data systems, testing accommodations and alternate assessments for English learners and students with disabilities, and use of assessment flexibilities allowed in ESSA. 4 For example, by 2011–12, 46 states reported that they had adopted the Common Core State Standards in English language arts and mathematics (Troppe et al., 2015). Thirty-one states reported piloting the PARCC or Smarter Balanced assessments in spring 2014 (Troppe et al., 2017). 5 Salazar & Christie, 2014. 6 The Center on Standards, Alignment, Instruction, and Learning, 2016. 7 This finding is consistent with Norton, Ballinger, & Ash (2016), who analyzed nine states that revised rather than replaced the Common Core and found that these states focused on refinements by adding clarity or a new skill to the standards. Other work, however, suggests that some changes were more substantial. For example, Griffith et al. (2018) reviewed the content, rigor, clarity, and specificity of the Common Core State Standards and standards from states that “significantly moved away” from the Common Core or never adopted them. They gave the Common Core math and ELA standards an overall rating of strong. However, none of the modified standards for the states that significantly moved away from the Common Core had this overall rating. The modified standards for these states had a lower overall rating—some were rated as good, but others were rated as weak or inadequate. 8 The number of the Common Core states reporting major changes is similar to the number of states identified as making major changes by Griffith et al. (2018) and Education Week (2017). 9 In this report, specifically Exhibit 2, the Common Core adoption reflects states' official adoption status as of December 30, 2013. This status comes from the Common Core State Standards Initiative website on that date, as well as from Minnesota, which adopted only the ELA standards. During the 2013–14 school year, some states were already revisiting their decision to adopt and by March 2014 states began to officially repeal them. Other states rebranded or partially implemented the standards. As a result, it is possible that Exhibit 2 does not capture the full extent of change to state ELA and math content standards.
20
10 The examination of change in state assessments focuses on change from 2014–15 to 2017–18 since 2013–14 was a transitional year for implementation of the new Smarter Balanced and PARCC assessments. This examination relied on extant data on state assessments from Education Week for 2014–15 and from Education Commission of the States for 2017–18. 11 One state identified the ACT and SAT exams for high school assessments. 12 ESSA includes a number of assessment flexibility provisions. It allows districts, with state approval, to use a nationally recognized high school assessment in lieu of the state-required high school assessment for federal accountability. Nationally recognized assessments must be peer reviewed and can include college admissions tests that are administered in multiple states. States can develop and administer computer-adaptive tests. They also can administer multiple, statewide interim assessments instead of a single summative assessment, although the interim scores must be combined into a single summative score for accountability. Measures of student achievement may include measures of student academic growth and may be partially delivered in the form of portfolios, projects, or extended performance tasks. Eighth- grade students maybe be exempt from the mathematics assessments for their grade if they take an advanced mathematics course in middle school and its end-of-course assessment. ESSA allows state-specified limits on the amount of time students should spend on all summative assessments given by the state and by local districts and schools. In addition, states granted flexibility as part of the Innovative Assessment Demonstration Authority have additional flexibilities in assessment format and are exempted from some requirements such as using the same assessment for all students in the same grade and subject. 13 Prior reviews of rigorous research suggest that curriculum has large effects on student learning (Chingos & Whitehurst, 2012; Whitehurst, 2009). However, Polikoff (2015) cautions about the lack of quality instructional materials such as textbooks aligned with content standards. 14 For example, Grossman, Reyna, and Shipton (2011) identified a number of ways states can support local development and acquisition of new curricula and materials to support the implementation of the Common Core. 15 Shin, 2014. 16 Chism, 2017; U.S. Department of Education, 2016. 17 The 11 states reported that they had, in total, identified 1,168 low-performing schools under ESSA for the 2017–18 school year (Appendix Exhibit A.12). 18 Additional data on related topics not covered in this report can be found in Chapter 2 of the Supplemental Volume. Topics include approaches to monitoring, supporting, and improving schools with low-performing subgroups, long-term performance goals for student subgroups, challenges to improving low-performing schools, and approaches to selecting improvement activities in low-performing schools. 19 Elementary and Secondary Education Act of 1965, as amended through the Every Student Succeeds Act (ESSA); P.L. 114-95, enacted December 10, 2015; P.L. 115-224, enacted July 31, 2018. 20 Ladd, 2017; McMurrer & Yoshioka, 2013. 21 This type of measure was allowable but not required prior to ESSA.

21
22 Starting graduation and achievement proficiency rates are taken from state ESSA plans. Two states are not included because they did not provide the graduation rate, and one state did not provide the timeline. Ten states are not included because they did not provide the proficiency rate or timeline for ELA or math, or they did not include baseline proficiency rates for all students in their state plans. 23 “Public High School Graduation Rates” for school year 2016–17 (McFarland et al., 2019). 24 Low-performing schools include schools identified as lowest performing under Title I of ESEA or under a state accountability system. Related information on schools that have low-performing subgroups or large subgroup achievement gaps can be found in Chapter 2 of the Supplemental Volume. 25 Additional data on related topics not covered in this report can be found in Chapter 2 of the Supplemental Volume. Teacher and leader topics include: additional detail on teacher evaluation practices, information on principal evaluation practices, approaches to assessing and addressing teacher quality inequity, approaches to supporting teacher and principal preparation, and approaches to professional development and support to improve teacher quality. 26 Researchers using natural experiments in teacher mobility to measure the accuracy of value-added measures have debated whether value added provides unbiased measures of teacher effectiveness (Chetty, Friedman, & Rockoff, 2014, 2016, 2017; Rothstein, 2017a, 2017b). Other researchers have debated the role of value added in teacher evaluation systems, with some researchers less favorable to the use of value added (American Educational Research Association, 2015; Baker et al., 2010) and others endorsing their use in a multimeasure teacher evaluation system (Bill & Melinda Gates Foundation, 2013; Glazerman et al., 2010). 27 For example, some teachers complained that value-added measures were inaccurate, claiming that student background characteristics included in the value-added model did not adequately account for student poverty levels or some other factor. They also objected to “schoolwide value-added” when an average score for teachers of math and ELA in grades 4-8 was applied to others in the school. Another common complaint was that the value-added estimates for individual teachers exhibited too much year-to-year variability to be trusted. See Rich, 2015; Sawchuck, 2015.
28 The full list of performance measures asked about in the surveys includes evaluation ratings; effectiveness as measured by a value-added model or student growth percentile; and effectiveness as measured by student learning objectives or student growth objectives. Nonperformance measures include certification status, experience, assignment to grades or classes outside a teacher’s field of certification, education (for example, the proportion of teachers with master’s degrees), and (in 2014 only) highly qualified status based on definitions of NCLB. A small number of states and share of districts reported using nonperformance measures not on this list.

22
REFERENCES
American Educational Research Association. (2015). AERA Statement on use of value-added models (VAM) for the evaluation of educators and educator preparation programs. Educational Researcher, 44, 448–452. Retrieved from https://journals.sagepub.com/doi/10.3102/0013189X15618385
Baker, E.L., Barton, P.E., Darling-Hammond, L., Haertel, E., Ladd, H.F., Linn, R.L., Ravitch, D., Rothstein, R., Shavelson, R.J., & Shepard, L.A. (2010). Problems with the use of student test scores to evaluate teachers. EPI Briefing Paper #278. Economic Policy Institute. Retrieved from https://files.epi.org/page/-/pdf/bp278.pdf
Bill & Melina Gates Foundation. (2013). Ensuring fair and reliable measures of effective teaching: Culminating findings from the MET project’s three-year study. Bill & Melinda Gates Foundation. Retrieved from http://www.metproject.org/downloads/MET_Ensuring_Fair_and_Reliable_Measures_Practitioner_Brief.pdf
Chetty, R., Friedman, J.N., & Rockoff, J.E. (2014). Measuring the impacts of teachers I: Evaluating bias in teacher value-added estimates. American Economic Review, 104(9), 2593–2632. Retrieved from https://www.aeaweb.org/articles?id=10.1257/aer.104.9.2593
Chetty, R., Friedman, J.N., & Rockoff, J.E. (2016). Using lagged outcomes to evaluate bias in value-added models. American Economic Review, 106(5), 393–399. Retrieved from https://www.aeaweb.org/articles?id=10.1257/aer.p20161081
Chetty, R., Friedman, J.N., & Rockoff, J.E. (2017). Measuring the impacts of teachers: Reply. American Economic Review, 107(6), 1685-1717. Retrieved from https://www.aeaweb.org/articles?id=10.1257/aer.20170108
Chingos, M.M., & Whitehurst, G.J. (2012). Choosing blindly: Instructional materials, teacher effectiveness, and the Common Core. Washington, DC: The Brookings Institution. Retrieved from https://www.brookings.edu/wp-content/uploads/2016/06/0410_curriculum_chingos_whitehurst.pdf
Chism, M.M. (2017, April 10). ESSA dear colleague letter on school support and improvement activities and consultation. Washington, DC: U.S. Department of Education, Office of Elementary and Secondary Education. Retrieved from https://www2.ed.gov/policy/elsec/leg/essa/dcltr410207.pdf
Education Week. (2017, September 18). Map: Tracking the Common Core State Standards. Retrieved from https://www.edweek.org/ew/section/multimedia/map-states-academic-standards-common-core-or.html

23
Glazerman, S., Loeb, S., Goldhaber, D., Raudenbush, D., Staiger, D., & Whitehurst, G.J. (2010). Evaluating teachers: The important role of value-added. The Brookings Brown Center. Retrieved from https://www.brookings.edu/research/evaluating-teachers-the-important-role-of-value-added/
Griffith, D., McDougald, V., Friedberg, S., Barone, D., Belding, J., Chen, A., Dixon, L., Fennell, F., Fisher, D., Frey, N., Howe, R., & Shanahan, T. (2018). The state of state standards-post Common Core. Washington, DC: The Thomas B. Fordham Institute. Retrieved from https://fordhaminstitute.org/national/research/state-state-standards-post-common-core
Grossman, T., Reyna, R., & Shipton, S. (2011). Realizing the potential: How governors can lead effective implementation of the Common Core State Standards. Washington, DC: National Governors Association.
Ladd, H.F. (2017). No Child Left Behind: A deeply flawed federal policy. Journal of Policy Analysis and Management, 36(2), 461-469.
McFarland, J., Hussar, B., Zhang, J., Wang, X., Wang, K., Hein, S., Diliberti, M., Forrest Cataldi, E., Bullock Mann, F., & Barmer, A. (2019). The Condition of Education 2019. Washington, DC: U.S. Department of Education, Institute of Education Sciences, National Center for Educational Statistics. Retrieved from https://nces.ed.gov/pubsearch/pubsinfo.asp?pubid=2019144
McMurrer, J., & Yoshioka, N. (2013). States’ perspectives on waivers: Relief from NCLB, concern about long-term solutions. Washington, DC: Center on Education Policy. Retrieved from https://files.eric.ed.gov/fulltext/ED555343.pdf
Norton, J., Ballinger, S., & Ash, J. (2016). Massachusetts English language arts/literacy and mathematics curriculum frameworks review. Abt Associates: Cambridge, MA. Retrieved from https://www.abtassociates.com/sites/default/files/migrated_files/22e6ae70-423e-43d2-ad2b-c113458d1edd.pdf
Polikoff, M. (2015). How well aligned are textbooks to the Common Core Standards in mathematics? American Educational Research Journal, 52(6), 1185-1211.
Rich, M. (2015, November 19). Negotiators come to agreement on revising No Child Left Behind Law. New York Times. Retrieved from https://www.nytimes.com/2015/11/20/us/negotiators-come-to-agreement-on-revising-no-child-left-behind-law.html
Rothstein, J. (2017a). Revisiting the impacts of teachers. IRLE Working Paper No. 101-17. Retrieved from https://irle.berkeley.edu/files/2017/Revisiting-the-Impacts-of-Teachers.pdf
Rothstein, J. (2017b). Measuring the impacts of teachers: Comment. American Economic Review, 107(6), 1656–1684. Retrieved from https://www.aeaweb.org/articles?id=10.1257/aer.20141440

24
Salazar, T., & Christie, K. (2014). States and the (not so) new standards—Where are they now? Denver, CO: Education Commission of the States. Retrieved from http://www.ecs.org/clearinghouse/01/14/21/11421.pdf
Sawchuk, S. (2015, October 6). Teacher evaluation heads to the Courts. Education Week. Retrieved from https://www.edweek.org/ew/section/multimedia/teacher-evaluation-heads-to-the-courts.html
Shin, S. (2014). Standards implementation framework, Version 1.0 overview. Retrieved from https://csaa.wested.org/resource/standards-implementation-framework/
The Center on Standards, Alignment, Instruction, and Learning. (2016). State activity around adoption and replacement of CCR standards and aligned assessments, 2011–2015. Philadelphia, PA: Author.
Thomsen, J. (2014). State academic standards: Standard-setting process in brief. Denver, CO: Education Commission of the States.
Troppe, P., Milanowski, A., Garrison-Mogren, R., Webber, A., Gutmann, B., Reisner, E., & Goertz, M. (2015). State, district, and school implementation of reforms promoted under the Recovery Act: 2009-10 through 2011–12 (NCEE 2015-4016). Washington, DC: U.S. Department of Education, Institute of Education Sciences, National Center for Education Evaluation and Regional Assistance. Retrieved from http://ies.ed.gov/pubsearch/pubsinfo.asp?pubid=NCEE20154016
Troppe, P., Milanowski, A.T., Heid, C., Gill, B., & Ross, C. (2017). Implementation of Title I and Title II-A program initiatives: Results from 2013–14 (NCEE 2017–4014). Washington, DC: U.S. Department of Education, Institute of Education Sciences, National Center for Education Evaluation and Regional Assistance.
U.S. Department of Education. (2016, June 29). Transitioning to the Every Student Succeeds Act (ESSA): Frequently Asked Questions. Retrieved from https://www2.ed.gov/policy/elsec/leg/essa/essafaqstransition62916.pdf
U.S. Department of Education. (2020). Department of Education Fiscal Year 2020 Congressional Action. Retrieved from https://www2.ed.gov/about/overview/budget/budget20/20action.pdf
Whitehurst, G.J. (2009). Don’t forget curriculum. Washington, DC: The Brookings Institution. Retrieved from https://www.brookings.edu/research/dont-forget-curriculum/

25
ACKNOWLEDGEMENTS
We very gratefully acknowledge the cooperation of the participants in this study. We appreciate the time that state and local education agency staff spent participating in survey pretests and completing the 2017–18 surveys about Title I and Title II-A program initiatives.
In addition to the authors, many others played important roles in survey development, data collection, analysis, and report and data files preparation. At Westat, Laurie Lewis also provided key contributions to the survey instruments. The school district data collection was co-led Sylvia Segovia, Debbie Alexander, and Laurie Lewis with considerable support from Christina Fetzko, Stephany Bell-Caldwell, Dixie Morgan, Beatrice Morgan, and Prathibha Anandaraj. Olga Leytush, Stephanie Huang, and Mei Dong provided excellent programming support for sampling, weighting, data cleaning, and analysis. Ed Mann oversaw the development of the web survey, with Yevgeniy Kalmanovich leading the programming for the survey and the survey management system. Lou Rizzo led the statistical efforts, with support from Shaohua Dong. Sylvie Warren provided survey instrument and report production support. Valerie Orellana, Kerri Wills, and Rachel Korelitz provided strong support to numerous activities.
At Mathematica, many individuals made important contributions to the study. Lisa Dragoset provided thoughtful, critical reviews of report drafts and of the study instruments, and Ruth Neild provided helpful feedback to improve the clarity of the report. Sheila Heaviside, Survey Director, led a team of dedicated survey professionals who developed the study instruments and pretested and administered the state surveys, including Brian Roff, Kester St. Kitts, Ava Madoff, and Alex Hollister. Rob Sheaff led the team of survey programmers and Jim Tully and Gavin Fugere programmed the state instruments. Juha Sohlberg, Jeffrey Harrington, and Maria Bartlett provided excellent programming assistance, creating the state data files for analysis and cleaning and analyzing state and district data.
The report was informed by a Technical Working Group (TWG) meeting. We thank these experts for their thoughtful participation and input: Jessica Baghian, Raymond Hart, Frederick Hess, Sara Heyburn Morrison, Scott Norton, Morgan Polikoff, Martin West, and Tonya Wolford.
DISCLOSURE OF POTENTIAL CONFLICTS OF INTEREST
The study team for this project consists of a prime contractor, Westat and a subcontractor, Mathematica. Neither of these organizations or their key staff has financial interests that could be affected by findings from this study, Implementation of Title I and Title II-A Program Initiatives.

Appendix
Supporting Tables Referenced in the Report

A-1
Content Standards and Assessments
Exhibit A.1. Number of states by extent of change to high school graduation requirements for a standard diploma for students entering in fall 2018 (class of 2022) compared to students who entered in fall 2014 (class of 2018)
Requirement
Number of states that
Number of states
Increased requirements
Decreased requirements
Made no change
Required years of reading/English language arts 2 0 45 47
Required years of math 6 0 41 47 Required years of science 6 1 40 47 Required years of social studies/history 4 1 42 47 Specific required math courses 2 0 42 44 Specific required science courses 3 0 41 44 Specific academic domains or subjects with
proficiency- or competency-based requirements 5 1 34 40
Other required courses 7 2 21 30
Any increased course requirements1 14 n.a. n.a. 37 n.a. = not applicable. 1 Comments from one state indicate that it changed high school graduation requirements recently, but not for the students entering in fall 2018, rather a later cohort. That state is not included in this count. Note: For each requirement, the number of states includes only those states that identified the extent of change (i.e., it excludes states that did not respond or identified the requirement as not applicable). Source: 2017–18 State survey.
Content Standards and Assessments
A-2
Exhibit A.2. State summative assessments in English language arts and math, by grade level: 2014–15 and 2017–18
Assessment
Number of states
2014–15 2017–18
Grades 3–8 High school Grades 3–8 High school
Consortium-based assessments Smarter Balanced Assessment Consortium1 18 15 12 7 Partnership for Assessment of Readiness for College
and Careers (PARCC)2 12 11 5 4 Assessments using a mix of assessment items from the
PARCC assessment and other sources n.a. n.a. 3 1 ACT or SAT assessments
ACT Aspire 2 1 1 3 ACT WorkKeys n.a. 0 n.a. 1 ACT College Readiness Test n.a. 4 n.a. 6 SAT College Entrance Examination n.a. 0 n.a. 12
Other state summative assessments Other summative assessment 20 20 29 25
Number of states 51 51 51 51 n.a. = not applicable. These assessments are not for students in grades 3–8. 1 In 2017–18, these are states that used assessments based entirely on the Smarter Balanced Assessment Consortium assessment items. 2 In 2017–18, these are states that used assessments based entirely on the PARCC assessment items. Note: Some states identified more than one assessment for a grade level. Source: Data on 2014–15 state summative assessments from Education Week, Common Core's Big Test: Tracking 2014-15 Results. Retrieved from: https://www.edweek.org/ew/section/multimedia/map-common-core-2015-test-results.html#tx. Data on 2017–18 state summative assessments data from Education Commission of the States (ECS). ECS data retrieved from: http://ecs.force.com/mbdata/mbquest5E?rep=SUM1806.

Content Standards and Assessments
A-3
Exhibit A.3. Number of states that monitored the implementation of current state content standards for English language arts or math: 2013–14 and 2017–18
Activity
Number of states
2013–14 2017–18
State requires districts to provide evidence of curriculum revisions 4 6 State requires districts to use a state model curriculum 1 1 State staff conduct visits or observations in districts 21 20 State reviews the district and school results of statewide student assessments that are
aligned with the current state content standards 27 42 State requires teacher evaluations to include evidence of teaching approaches consistent
with the current state content standards 19 31 State requires principal evaluations to include evidence that the current state content
standards have been implemented in their schools 16 29
Number of states 51 51 Source: 2017–18 State survey and 2013–14 State survey.

Content Standards and Assessments
A-4
Exhibit A.4. Number of states that provided supports to help the understanding and implementation of current English language arts (ELA) or math state content standards: 2013–14 and 2017–18
Type of support
Number of states
2013–14 2017–18
Materials to help align curriculum and instruction with content standards Documents showing alignment between the previous state content standards
and the current state content standards 36 31 Documents showing alignment between required state summative
assessments and the current state content standards such as blueprints 35 46 Tools or guidance on providing instruction aligned with the current state
content standards such as scope and sequence, curriculum maps, or frameworks 35 41
A state-developed model curriculum for ELA or math instruction for each grade level or course 15 10
Sample lesson plans consistent with the current state content standards 35 29 Examples or videos of instruction consistent with the current state content
standards 39 24 Sample student work 28 19 Banks of diagnostic assessment items aligned with the current state content
standards 23 22 Textbooks or other instructional materials aligned with the current state
content standards 24 21 Other materials
Walk-through or observation protocols to aid in monitoring alignment of instruction with the current state content standards 35 24
Funded or provided professional development on: Information about the current state content standards, such as content
covered at each grade level and instructional changes or shifts required 51 44 Instructional strategies consistent with the current state content standards,
such as model lessons or designing student work 45 43 Monitoring alignment of instruction with the state content standards, such as
the use of observation protocols 33 26
Number of states 51 51 Note: For professional development, the survey asked states if they funded or provided professional development during the school year or the previous summer. Source: 2017–18 State survey and 2013–14 State survey.

Content Standards and Assessments
A-5
Exhibit A.5. Percentage of districts that used supports to help English learners and students with disabilities meet state content standards: 2013–14 and 2017–18
Type of support
Percent of districts
2013–14 2017–18
Material Documents showing alignment between the current state content standards and
the state’s English Language Proficiency standards 53 70* Materials for understanding how to adapt instruction to help English learners
meet the current state content standards 54 68* Materials for understanding how to adapt instruction to help students with
disabilities meet the current state content standards 70 85* Professional development included topics on:
Adapting instruction to help English learners meet the current state content standards 44 69*
Adapting instruction to help students with disabilities meet the current state content standards 61 88*
Number of districts 15,762 17,031
Number of districts (unweighted) 562 683 * Percentage is statistically different from percentage for 2013–14 (p < .05). Note: For professional development, the survey asked districts if the topic was covered in professional development offered to school leaders and/or teachers in the district during the school year or the previous summer. Source: 2017–18 District survey and 2013–14 District survey.
A-6
Accountability and Support for Low-Performing Schools
Exhibit A.6. Number of states that used selected measures to differentiate school performance: 2013–14 and 2017–18
Measures used
Number of states
2013–14 2017–18
Assessments other than reading/English language arts and math Science or social studies assessment 16 25 Advanced Placement or International Baccalaureate exam 9 7
School quality or student success measures Student attendance or chronic absenteeism rate 21 35 Participation or performance in courses without state assessments n.a. 8 On track to graduate index 0 9 College and career readiness 8 32 Postsecondary outcomes 2 9 School climate or student engagement1 1 12 Other measure2 22 24
Number of states 51 51 n.a. = not available. Question not asked in the survey year and was not mentioned as an “other-specify” category. 1 Based on a review of state plans and state websites, none of the states used these measures for accountability determinations in 2017–18, but at least nine states will likely use these measures by 2019-20. 2 States used a variety of other measures in 2014 and 2018, such as the state accreditation rating, growth of the lowest 25 percent of students, credits accumulated, suspension rate, teacher chronic absenteeism rate, global citizenship, and access to librarians or medical specialists. Source: 2017–18 State survey and 2013–14 State survey, extant data form.
Exhibit A.7. Number of states that used measures of student achievement growth for reading and math achievement, by type of growth measures used: 2013–14 and 2017–18
Student growth measure
Number of states
2013–14 2017–18
Any growth measure 44 49 Within-student growth measure 28 48 Improvement from one cohort of students to the next cohort in the same
grades 31 5
Number of states 51 51 Notes: Within-student growth measures include value-added growth measures (VAM), student growth percentile (SGP), growth from one grade to another measured on a vertical scale, movement to a higher performance category, or the percentage of students with achievement growth at or above targets for attaining proficiency goals. We also include Iowa’s student-level growth measure (movement from one achievement level to another) that was approved for use under No Child Left Behind. Source: 2017–18 State survey and 2013–14 State survey, extant data form.
Accountability and Support for Low-Performing Schools
A-7
Exhibit A.8. Number of states that reported examining school-level performance of subgroups other than those statutorily required for accountability: 2013–14 and 2017–18
Included subgroups
Number of states
2013–14
Number of states
2017–18
Accountability
Accountability Public Report
Cards
States examining additional subgroups 25 14 35 Additional subgroups used:
Low academic performance 7 n.a. n.a. Homeless children n.a. 4 35 Migrant children 2 2 31 Children in foster care n.a. 4 34 Children whose parents are on active military duty n.a. 2 31 Girls and boys n.a. 1 28 A combined subgroup that includes more than one
subgroup 25 6 7 Another subgroup not listed above n.a. 3 5
Number of states 51 51 51 n.a. = not available. Question not asked in the survey year. Notes: The Every Student Succeeds Act (ESSA) requires school accountability systems to include the following subgroups: economically disadvantaged students; students from major racial/ethnic groups; children with disabilities; and English learners. ESSA requires public reporting on schools to include all of the accountability subgroups, plus: migrant students, homeless students; students in foster care; students with parents on active military duty; and students by gender. Additional combined subgroups reported by states include combined racial ethnic subgroups (three states) and combined high-needs subgroups (including two or more of English learners, students with disabilities, and economically disadvantaged subgroups; three states). They also include other subgroups: gifted students, adjudicated youth, and students formerly classified as English learners or as students with disabilities. Source: 2017–18 State survey and 2013–14 State survey.

Accountability and Support for Low-Performing Schools
A-8
Exhibit A.9. Median minimum subgroup sizes and number of states by minimum subgroup sizes for reporting student achievement in 2017–18 compared to 2013–14
Minimum subgroup sizes for reporting student achievement
Number of states
2013–14 2017–18
Change from 2013–14 to
2017–18
Median 27.5 20.0 -7.5 Number of states with minimum subgroup size:1
0–9 2 0 -2 10–19 10 23 +13 20–29 13 20 +7 30–39 19 8 -11 40 or more 6 0 -6
Number of states 50 51 51 1 One state did not report the minimum subgroup size in 2013–14. Note: The 2013–14 form asked states for the minimum number of students in a school that can constitute a subgroup whose achievement is monitored against annual measurable objectives. Source: 2017–18 State survey and 2013–14 State survey, extant data form.

Accountability and Support for Low-Performing Schools
A-9
Exhibit A.10. Long-term goals for academic achievement and graduation rates relative to baseline rates and timelines: 2017–18
Long-term goals
Median baseline rate
(range)
Median long-term goal rate
(range)
Median long-term goal rate
relative to baseline rate
(range)
Median number of
years to reach
long-term goal
(range)
Median annual
improvement required to meet long- term goal
(range)
Academic achievement Proficiency goal rate for academic
achievement in English language arts (ELA)1
50.7 (24.8, 79.0)
75.0 (48.0, 100)
24.7 (2.0, 60.2)
10 (5, 24)
2.1 (0.2, 6.2)
Proficiency goal rate for academic achievement in math1
43.0 (20.1, 78.2)
71.5 (47.0, 100)
29.3 (5.8, 63.3)
10 (5, 24)
2.6 (0.4, 8.8)
Graduation rate 4-year adjusted cohort graduation
goal2
83.4 (55.0, 91.3)
90.0 (83.0, 100)
7.1 (0.0, 33.0)
10 (5, 24)
0.7 (0.0, 2.6)
Number of states 51 51 51 51 51 1 Ten states are not included because they did not provide the proficiency rate or timeline for ELA or math, or they did not include baseline proficiency rates for all students in their state plans. 2 Two states did not provide the graduation rate. One state did not provide the timeline. Note: The goal rates relative to baseline rates are the difference between the state’s long-term goal rate and the baseline proficiency rate (provided in the Every Student Succeeds Act plan). Source: 2017–18 State survey and approved state plans.

Accountability and Support for Low-Performing Schools
A-10
Exhibit A.11. Increase in proficiency rates required to meet states’ long-term goals and target years for achieving proficiency goals: 2017–18
Notes: The increase in proficiency rates required to meet the long-term goal is the difference between the state’s long-term goal rate and the baseline proficiency rate (provided in the Every Student Succeeds Act [ESSA] plan). Ten states are not included in the English language arts (ELA) and math proficiency charts because the state set long-term goals using indexes without a proficiency rate, or because the state’s ESSA plan did not include baseline proficiency rates for all students. Source: 2017–18 State survey and approved state ESSA plans.
0
10
20
30
40
50
60
70
0 10 20 30
ELA
gro
wth
in p
rofi
cien
cy fr
om b
asel
ine
Number of years to reach proficiency goal rate from baseline
0
10
20
30
40
50
60
70
80
0 10 20 30
Mat
h gr
owth
in p
rofi
cien
cy fr
om b
asel
ine
Number of years to reach proficiency goal rate from baseline

Accountability and Support for Low-Performing Schools
A-11
Exhibit A.12. Number of states that identified Title I Comprehensive Support and Improvement (CSI) schools and number of schools identified: 2017–18
Type of CSI schools identified Number of states
Number of Title I schools identified
CSI schools in 2017–18 11 1,168 Lowest 5 percent of Title I schools 10 729 High schools with graduation rates below 67 percent 8 215 Chronically low-performing Targeted Support and Improvement (or
former Focus) schools 1 36 Identified by other method 2 266
Number of states requiring CSI schools to implement interventions in 2017–18 2 95
Number of states and number of Title I schools 51 51,690 Notes: Other methods of identifying CSI schools included those that earned low ratings on the state’s accountability rating system that does not correspond with any of the methods in the table. Some states may have identified the same schools using more than one method of identification. Source: 2017–18 State survey.
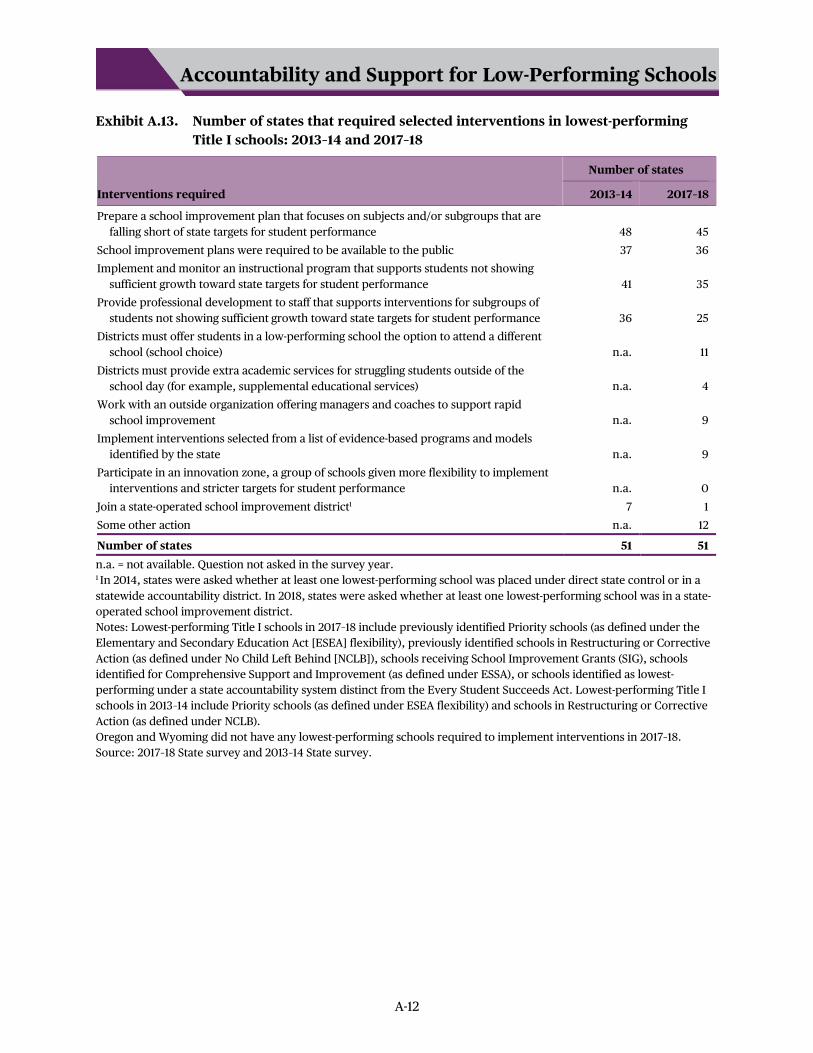
Accountability and Support for Low-Performing Schools
A-12
Exhibit A.13. Number of states that required selected interventions in lowest-performing Title I schools: 2013–14 and 2017–18
Interventions required
Number of states
2013–14 2017–18
Prepare a school improvement plan that focuses on subjects and/or subgroups that are falling short of state targets for student performance 48 45
School improvement plans were required to be available to the public 37 36 Implement and monitor an instructional program that supports students not showing
sufficient growth toward state targets for student performance 41 35 Provide professional development to staff that supports interventions for subgroups of
students not showing sufficient growth toward state targets for student performance 36 25 Districts must offer students in a low-performing school the option to attend a different
school (school choice) n.a. 11 Districts must provide extra academic services for struggling students outside of the
school day (for example, supplemental educational services) n.a. 4 Work with an outside organization offering managers and coaches to support rapid
school improvement n.a. 9 Implement interventions selected from a list of evidence-based programs and models
identified by the state n.a. 9 Participate in an innovation zone, a group of schools given more flexibility to implement
interventions and stricter targets for student performance n.a. 0 Join a state-operated school improvement district1 7 1 Some other action n.a. 12
Number of states 51 51 n.a. = not available. Question not asked in the survey year. 1 In 2014, states were asked whether at least one lowest-performing school was placed under direct state control or in a statewide accountability district. In 2018, states were asked whether at least one lowest-performing school was in a state-operated school improvement district. Notes: Lowest-performing Title I schools in 2017–18 include previously identified Priority schools (as defined under the Elementary and Secondary Education Act [ESEA] flexibility), previously identified schools in Restructuring or Corrective Action (as defined under No Child Left Behind [NCLB]), schools receiving School Improvement Grants (SIG), schools identified for Comprehensive Support and Improvement (as defined under ESSA), or schools identified as lowest-performing under a state accountability system distinct from the Every Student Succeeds Act. Lowest-performing Title I schools in 2013–14 include Priority schools (as defined under ESEA flexibility) and schools in Restructuring or Corrective Action (as defined under NCLB). Oregon and Wyoming did not have any lowest-performing schools required to implement interventions in 2017–18. Source: 2017–18 State survey and 2013–14 State survey.

Accountability and Support for Low-Performing Schools
A-13
Exhibit A.14. Number of states that provided additional resources to lowest-performing Title I schools: 2013–14 and 2017–18
Additional resources for
Number of states
2013–14 2017–18
Any additional resources 45 46 Purposes specified in the school improvement plan 40 44 Reduction in class sizes or to maintain low class sizes 16 9 Additional instructional time or to maintain extended day or extended school
year schedules 31 28 Another purpose not listed above1 18 10
Number of states 51 51 1 Other purposes include resources to support continuous improvement, develop school improvement goals, professional development, socioeconomic integration efforts, and use of school support training. Notes: Lowest-performing Title I schools in 2017–18 include previously identified Priority schools (as defined under the Elementary and Secondary Education Act [ESEA] flexibility), previously identified schools in Restructuring or Corrective Action (as defined under No Child Left Behind [NCLB]), schools receiving School Improvement Grants (SIG), schools identified for Comprehensive Support and Improvement (as defined under the Every Student Succeeds Act [ESSA]), or schools identified as lowest-performing under a state accountability system distinct from ESSA. Lowest-performing Title I schools in 2013–14 include Priority schools (as defined under ESEA flexibility) and schools in Restructuring or Corrective Action (as defined under NCLB). Oregon and Wyoming did not have any lowest-performing schools required to implement interventions in 2017–18. Source: 2017–18 State survey and 2013–14 State survey.

Accountability and Support for Low-Performing Schools
A-14
Exhibit A.15. Percentage of districts that reported selected interventions and changes were implemented in lowest-performing Title I schools and Title I schools with low-performing subgroups: 2017–18
Intervention or change
Percent of districts that implemented in:
Lowest-performing Title I schools
Title I schools with low-performing
subgroups
2013–14 2017–18 2013–14 2017–18
Interventions Prepare a school improvement plan that focuses on subjects
and/or subgroups that are falling short of state targets for student performance 97 98
99 97 School improvement plans are made available to the public 91 92 89 90 Implement and monitor an instructional program that
supports students not showing sufficient growth toward state targets for school performance 97 100
93 97 Provide professional development to staff that supports
interventions for subgroups of students not showing sufficient growth toward state targets for student performance 95 100
99 97 Work with an outside organization offering managers and
coaches to support rapid school improvement n.a. 70
n.a. n.a. Implement interventions selected from a list of evidence-based
programs and models identified by the state n.a. 94
n.a. 91 Participate in an innovation zone, a group of schools given
more flexibility to implement interventions and stricter targets for student performance n.a. 17
n.a. n.a. Join a state-operated school improvement district n.a. 10 n.a. n.a.
Academic and structural changes Implement a comprehensive schoolwide reform model 60 41* 47 56 Provide intensive intervention to struggling students during
the school day (for example, Response to Intervention) 85 99
91 99 Adjust the school schedule without changing the overall
number of school hours 59 52
56 62 Operate an extended school day, week, or year 39 46 48 50 Make class sizes smaller than typical in other schools 30 58* 43 56 Provide extra academic services for struggling students
outside of the school day (for example, supplemental education services) 74 89
73 76 Offer students in a low-performing school the option to attend
a different school (school choice) 58 46
37 35 Alternative management
Operate under direct state control or statewide accountability district 6 20
n.a. n.a.
Converted to charter school 8 4 n.a. n.a. Operate under management by a school management
organization, for-profit or nonprofit 21 10
n.a. n.a. Staffing changes
Principal replaced 16 17 n.a. n.a. Half or more of the teaching staff replaced 6 11 n.a. n.a.
See notes at end of table.

Accountability and Support for Low-Performing Schools
A-15
Exhibit A.15. Percentage of districts that reported selected interventions and changes were implemented in lowest-performing Title I schools and Title I schools with low-performing subgroups: 2017–18—continued
Intervention or change
Percent of districts that implemented in:
Lowest-performing Title I schools
Title I schools with low-performing
subgroups
2013–14 2017–18 2013–14 2017–18
Implement programs To provide ongoing mechanisms for family and community
engagement 87 96
89 97 To address students’ social, emotional, or health needs 82 99* 90 97* To improve student behavior, discipline, or safety 90 98 96 99
Principal professional development Any topics below 67 94* 82 92* On school improvement planning, identifying interventions,
or budgeting effectively 61 78
77 86 On acting as instructional leaders 59 87* 71 79 On recruiting, retaining, and developing more effective
teachers 48 65
57 68 Teacher professional development
Any topics below 72 96* 80 93* On analyzing student assessment data to improve instruction 68 93* 76 90* On working effectively in teacher teams to improve instruction 61 93* 73 87* On identifying and implementing strategies to address the
needs of English learners 54 65
50 59 On identifying and implementing strategies to address the
needs of students with disabilities 57 87*
72 86* Number of districts with lowest-performing Title I schools
or Title I schools with low-performing subgroups 2,046 3,261
2,307 4,198 Number of districts with lowest-performing Title I schools
or Title I schools with low-performing subgroups (unweighted) 153 184
186 230 * Percentage is statistically different from percentage for 2013–14 (p < .05). n.a. = not available. Question not asked in the survey year for the category of schools. Notes: District percentage is of districts with lowest-performing Title I schools or of districts with Title I schools with low-performing subgroups. Lowest-performing Title I schools in 2017–18 include previously identified Priority schools (as defined under the Elementary and Secondary Education Act [ESEA] flexibility), previously identified schools in Restructuring or Corrective Action (as defined under No Child Left Behind [NCLB]), schools receiving School Improvement Grants (SIG), schools identified for Comprehensive Support and Improvement (as defined under the Every Student Succeeds Act [ESSA]), or schools identified as lowest-performing under a state accountability system distinct from ESSA. Lowest-performing Title I schools in 2013–14 include Priority schools (as defined under ESEA flexibility) and previously identified schools in Restructuring or Corrective Action (as defined under NCLB). Title I schools with low-performing subgroups are schools that are not the state’s lowest-performing schools, but have been identified because of low-performing subgroups or large subgroup achievement gaps. In 2017–18, these schools include Targeted Support and Improvement and/or Additional Targeted Support and Improvement schools identified under ESSA or previously identified Focus schools (as defined under ESEA flexibility) or schools identified as having a low-performing subgroup under another state accountability system. In 2013–14, these schools include Focus schools (as defined under ESEA flexibility). Source: 2017–18 District survey and 2013–14 District survey.

A-16
Educator Effectiveness and Equity
Exhibit A.16. Number of states requiring teacher performance evaluation practices: 2013–14 and 2017–18
Teacher evaluation practices required by states
Number of states
2013–14 2017–18
At least one classroom observation using a professional practice rubric 39 36 Use of student achievement growth for some or all teachers 36 34 At least three performance categories 37 36 Combination of at least one classroom observation, student achievement
growth, and at least three performance categories. 32 26
Number of states 51 51 Source: 2017–18 State survey and 2013–14 State survey.

Educator Effectiveness and Equity
A-17
Exhibit A.17. Number of states and percentage of districts requiring classroom observations with a professional practice rubric, student achievement growth, and at least three performance categories for teacher evaluation, by status of the state requirement for their use: 2013–14 and 2017–18
49
63
0
20
40
60
80
100
2013–14 2017–18
Stat
e re
quir
ed in
20
13–1
4Pe
rcen
t of d
istr
icts
requ
irin
g th
ree
key
elem
ents
of t
each
er ev
alua
tions
10 states decreased requirements
68
91*
0
20
40
60
80
100
2013–14 2017–18
22 states maintained requirements
3237
0
20
40
60
80
100
2013–14 2017–18
Stat
e di
d no
t req
uire
in 2
013
–14
Perc
ent o
f dis
tric
tsre
quir
ing
thre
e ke
y el
emen
ts o
f tea
cher
eval
uatio
ns
State did not require in 2017–18
15 states never had requirements
16
49*
0
20
40
60
80
100
2013–14 2017–18
State required in 2017–18
4 states increased requirements
*Percentage is significantly different from the percentage from 2013–14 (p < .05). Exhibit reads: Ten states required a combination of professional practice rubric, student achievement growth for some or all teachers, and at least three performance categories in 2014 but not in 2018. In those 10 states, 49 percent of districts used this combination of practices in 2014 and 63 percent did so in 2018. Source: 2013–14 and 2017–18 State surveys and 2013–14 and 2017–18 District surveys.

Educator Effectiveness and Equity
A-18
Exhibit A.18. Number of states that examined the distribution of teacher quality/ effectiveness within the past 12 months and the measures used: 2013–14 and 2017–18
Teacher measures used to examine distribution of teacher quality/effectiveness
Number of states
2013–14 2017–18
Measured the distribution of teacher qualify/effectiveness 30 37 Types of measures used
Only performance measures 11 1 Only nonperformance measures 13 11 Both performance and nonperformance measures 6 25
Performance measures 17 26 Evaluation ratings 15 25 Effectiveness as measured by teacher’s value added measures (VAMs) or
student growth percentiles (SGPs) 11 13 Effectiveness as measured by student learning objectives (SLOs) or student
growth objectives (SGOs) n.a. 9 Nonperformance measures 19 36
Certification 14 32 Experience 12 33 Assignment to grades or classes outside of their field of certification 9 34 Education (e.g., the proportion of teachers with master’s degrees) 5 12 Highly qualified status based on definitions of No Child Left Behind 13 n.a. Other 2 2
Number of states 51 51 n.a. = not available. Question not asked in the survey year. Notes: VAMs or SGPs apply complex statistical methods to calculate achievement growth for a teacher’s own students based on state summative assessments or other standardized assessments. VAMs and SGPs can also be calculated for teacher teams, for grades, or for schools. SLOs or SGOs are student achievement targets for a teacher’s own students, determined by each individual teacher at the beginning of the school year (often in consultation with the school principal) based on the teacher’s assessment of the students’ starting achievement levels. SLOs/SGOs may relate to students’ scores on standardized assessments, or to teacher-developed tests, performance tasks, or other customized assessments of student learning. Source: 2017–18 State survey and 2013–14 State survey.

Educator Effectiveness and Equity
A-19
Exhibit A.19. Percentage of districts that examined the distribution of teacher quality/ effectiveness within the past 12 months and the measures used: 2013–14 and 2017–18
Whether and how districts examined distribution within past 12 months
Percent of districts
2013–14 2017–18
Examined distribution 35 56* Teacher measures used to examine distribution
Use performance measures 76 88* Use nonperformance measures 90 95* Use only performance measures 7 4
Evaluation ratings 6 3 Effectiveness as measured by teacher’s value added measures (VAMs) or
student growth percentiles (SGPs) 6 3 Effectiveness as measured by student learning objective (SLOs) or student
growth objectives (SGOs) n.a. 1 Use only nonperformance measures 21 11*
Certification 20 11* Experience 15 8 Assignment of grades or classes outside of their field of certification 12 8 Education (e.g., the proportion of teachers with master’s degrees) 17 4* Highly qualified status based on definitions of No Child Left Behind 20 n.a. Other n.a. 1
Use both performance and nonperformance measures 69 84* Evaluation ratings 63 78* Effectiveness as measured by teacher’s VAMs or SGPs 49 51 Effectiveness as measured by SLOs or SGOs n.a. 50 Certification 58 76* Experience 53 64* Assignment of grades or classes outside of their field of certification 37 48* Education (e.g., the proportion of teachers with master’s degrees) 46 47 Highly qualified status based on definitions of No Child Left Behind 63 n.a. Other n.a. 7
Number of districts with more than one school 11,697 11,847
Number of districts (unweighted) 540 551 *Percentage is significantly different from the percentages for 2013–14 (p < .05). n.a. = not available. Question not asked in the survey year. Notes: VAMs or SGPs apply complex statistical methods to calculate achievement growth for a teacher’s own students based on state summative assessments or other standardized assessments. VAMs and SGPs can also be calculated for teacher teams, for grades, or for schools. SLOs or SGOs are student achievement targets for a teacher’s own students, determined by each individual teacher at the beginning of the school year (often in consultation with the school principal) based on the teacher’s assessment of the students’ starting achievement levels. SLOs/SGOs may relate to students’ scores on standardized assessments, or to teacher-developed tests, performance tasks, or other customized assessments of student learning. Exhibit limited to districts that operated more than one school. In 2013–14, 3 percent of districts did not select any of the measures listed. Source: 2017–18 District survey, 2013–14 District survey, and 2013–14 Common Core of Data for school count.

Educator Effectiveness and Equity
A-20
Exhibit A.20. Number of states that found substantial inequities in the distribution of teacher quality/effectiveness and took actions to address inequities: 2013–14 and 2017–18
Action taken
Number of states
2013–14 2017–18
States examining the distribution of teacher quality or effectiveness 30 37 States reporting inequities 21 34 State action to address inequities
Took at least one action to address inequities 18 33 Provided resources (e.g., professional development, coaching) to improve
the effectiveness of less-effective teachers 16 27 Provided findings about inequities to school districts and/or the public 12 31 Required school districts to develop a plan for addressing inequities 10 15 Established financial incentives to encourage qualified or effective teachers
to move to or stay in schools with lower levels of teacher quality or effectiveness compared to other schools 6 8
Encouraged the development of career ladders or teacher leadership roles to attract and retain teachers in schools with lower quality/less effective teachers n.a. 27
Provided assistance or support (other than financial incentives) to districts on ways to recruit higher quality/more effective teachers to the schools with lower quality/less effective teachers n.a. 23
State has provided assistance or support to improve teaching and learning environments at schools with lower levels of teacher quality or effectiveness n.a. 23
Other1 5 0
Number of states that found substantial inequities 21 34 n.a. = not available. Question not asked in the survey year. 1The most common "Other" action was providing training or technical assistance to districts about attracting and retaining high-quality/effective teachers. Notes: Exhibit limited to states that examined information about the distribution of teacher quality or effectiveness across schools or districts serving different populations within the past 12 months. For 2017–18, one state planned to take action, but had not yet done so at the time of the data collection. Source: 2017–18 State survey and 2013–14 State survey.

Educator Effectiveness and Equity
A-21
Exhibit A.21. Percentage of districts that found substantial inequities in the distribution of teacher quality/effectiveness and took actions to address inequities: 2013–14 and 2017–18
Action taken
Percent of all districts
2013–14 2017–18
Examined distribution of teacher quality or effectiveness 35 56*
Action taken Percent of districts that examined distribution
Reported inequities 48 56
District action taken when inequities found Percent of districts
that found inequities Took at least one action to address inequities in access to effective teachers 92 91 Offered more compensation for qualified or effective teachers who move to or
stay in schools with lower levels of teacher quality or effectiveness compared to other schools 14 15
Provided loan repayment assistance or tuition reimbursement to teachers working in schools with lower levels of teacher quality or effectiveness compared to other schools 15 23*
Developed career ladders or teacher leadership roles to attract and retain teachers in schools with lower quality/less effective teachers n.a. 38
Began the hiring process earlier for vacancies at schools with lower levels of teacher quality or effectiveness compared to other schools 45 63*
Increased external recruitment activities such as hosting open houses and job fairs 40 59*
Improved teacher learning environments (e.g., lower teaching loads, more resources, or improved facility quality) at schools with lower levels of teacher quality compared to others 47 52
Offered more professional development for teachers in schools with lower levels of teacher quality or effectiveness compared to other schools 73 69
Limited the ability of teachers who are inexperienced or low performing to transfer to or be placed in schools with lower levels of teacher quality or effectiveness compared to other schools 23 20
Made exceptions in contracts or regulations to protect the most qualified or effective teachers from layoff in schools with lower levels of teacher quality or effectiveness compared to other schools 12 8
Used external providers to prepare, recruit, or supply more qualified or effective teachers to schools with lower levels of teacher quality or effectiveness compared to other schools 18 20
Number of districts that found substantial inequities 1,992 3,748
Number of districts that found substantial inequities (unweighted) 152 235 * Percentage is significantly different from the percentage for 2013–14 (p < .05). n.a. = not available. Question not asked in the survey year. Note: Exhibit limited to districts that examined information about the distribution of teacher quality or effectiveness across schools or districts serving different populations within the past 12 months, operated more than one school, and found substantial inequities. Source: 2017–18 District survey, 2013–14 District survey, and 2013–14 Common Core of Data for school count.

Educator Effectiveness and Equity
A-22
Exhibit A.22. Number of states examining the effectiveness of teacher preparation programs within the past 12 months, by factors used for this assessment: 2013–14 and 2017–18
Whether and how state examined effectiveness within the past 12 months
Number of states
2013–14 2017–18
Examined any program 29 35 Examined any program using teacher evaluation ratings, value added measures (VAMs)/ student growth percentiles (SGPs), or classroom observations 11 18
Using teacher evaluation ratings, VAMs/SGPs, or classroom observations only 2 0 Using teacher evaluation ratings, VAMs/SGPs, or classroom observations and other
factors 9 18 Examined any program using other factors but not teacher evaluation ratings,
VAMs/SGPS, or classroom observations 18 17 Did not examine any programs in the last 12 months 22 16
Number of states 51 51 Note: In the interest of space, this table combines information on states’ practices to assess the effectiveness of traditional and alternative teacher preparation programs. Source: 2017–18 State survey and 2-17 and 2013–14 State survey.
Exhibit A.23. Number of states that reported on the effectiveness of their teacher preparation programs within the past 12 months: 2013–14 and 2017–18
Practice for reporting effectiveness
Number of states
2013–14 2017–18
State reported information about effectiveness to schools of education 17 24 State reported information about effectiveness of schools of education to the public n.a. 19 State reported information about effectiveness to alternative preparation programs 11 17 State reported information about effectiveness of alternative preparation programs to the
public n.a. 15
Number of states 51 51 n.a. = not available. Question not asked in the survey year. Notes: States that did not assess the effectiveness of their teacher preparation programs were not asked questions about reporting information about the effectiveness of these programs. Not all states have alternative preparation programs. Source: 2017–18 State survey and 2013–14 State survey.

Educator Effectiveness and Equity
A-23
Exhibit A.24. Percentage of districts that received Title II, Part A funds that reported funding activities and the average percentage of supporting funds from Title II, Part A, by activity: 2017–18
Activity
Percent of districts engaged in the activity
Average percent of
Title II, Part A funds used
Reducing class size 62 22.5 Supporting/improving principal effectiveness (including principal
preparation, hiring, and placement, evaluation, professional development, and/or compensation) 64 6.2
Supporting/improving teacher effectiveness Developing or administering programs to recruit, hire, place, or retain
teachers including differentiated or performance-based compensation systems or strategies to improve equitable access to effective teachers 60 8.4
Providing teacher professional development and support (including coaching, professional learning communities) 88 48.5
Developing or administering teacher evaluation systems 57 1.5 All other activities funded with the district’s Title II, Part A funds 41 12.9
Number of districts that received Title II, Part A funds 16,163 14,772
Number of districts that received Title II, Part A funds (unweighted) 660 608 Notes: Five percent of districts did not receive Title II, Part A funds. Some districts did not respond to all or part of the question. Average percentages include districts that responded to the question and accounted for all of their Title II, Part A funds. The average percentages are district-weighted not dollar-weighted. Source: 2017–18 District survey.

Educator Effectiveness and Equity
A-24
Exhibit A.25. Number of required in-service days for teachers and percentage of districts using specific professional development and support practices: 2013–14 and 2017–18
Practice 2013–14 2017–18
Average number of required in-service days for teachers 6.8 days 7.6 days* Median number of required in-service days for teachers 6.0 days 7.0 days Percentage of districts using professional development and support
practices Use evaluation results to plan professional development for individual teachers 91 94 Use evaluation results to identify low-performing teachers for coaching,
mentoring, or peer assistance 84 95* Use evaluation results to develop performance improvement plans for low-
performing teachers 86 97* Use evaluation results to design professional development programs offered by
the district 90 87 Use student-level data system to plan district-wide professional development
such as identifying specific content or skills where teachers need assistance or support 77 80
Assign coaches, mentors, or professional development specialists to all schools n.a. 79 Assign coaches, mentors, or professional development specialists only to low-
performing, high-need, or hard-to-staff schools n.a. 3
Number of districts 559 683 * Value is significantly different from the value for 2013–14 (p < .05). n.a. = not available. Question not asked in the survey year. Note: Medians were not tested for significant differences over time. Source: 2017–18 District survey and 2013–14 District survey.