Embed Size (px)
Citation preview

WORKING PAPERS IN ECONOMICS AND FINANCE
School of Economics and Finance | Victoria Business School | www.victoria.ac.nz/sef
The trade impacts of a food scare: The fonterra contamination incident
Katarina Stojkov, Ilan Noy and
Yiğit Sağlam
SEF WORKING PAPER 06/2016
The Working Paper series is published by the School of Economics and Finance to provide staff and research students the opportunity to expose their research to a wider audience. The opinions and views expressed in these papers are not necessarily reflective of views held by the school. Comments and feedback from readers would be welcomed by the author(s).
Further enquiries to:
The Administrator School of Economics and Finance
Victoria University of Wellington P O Box 600 Wellington 6140 New Zealand Phone: +64 4 463 5353 Email: [email protected]
Working Paper 06/2016
ISSN 2230-259X (Print)
ISSN 2230-2603 (Online)

1
The Trade Impacts of a Food Scare: The Fonterra Contamination Incident
Katarina Stojkov, Ministry of Social Development, New Zealand
Ilan Noy, Victoria University of Wellington
Yiğit Sağlam, Victoria University of Wellington
Abstract: This paper presents the results of an investigation into the economic implications for New Zealand of the 2013 Whey Protein Concentrate contamination incident. It assesses the impact of this incident on dairy exports using synthetic control methods. A synthetic counterfactual scenario where the incident did not occur is developed using weighted information from other countries unaffected by the scare. We find that there was an initial negative shock to the exports of products that were thought to have been contaminated, but that there were no significant sustained impacts on other dairy products. The affected products made up only a small proportion of New Zealand dairy exports, with the vast majority of dairy exports being unaffected. Infant formula exports appear to have recovered somewhat in the more than a year after the scare, however whey product exports (the contaminated product) remain lower than they otherwise would have been.
Acknowledgements: This paper originated from the first author’s Masters thesis submitted
in 2015. We wish to thank Valeria Zingaretti for her technical assistance, and for the
beautiful maps.
Keywords: contamination, food scare, trade, synthetic control
JEL: Q17, Q18
*Corresponding author: [email protected]
2
1. Introduction
On the 3rd of August 2013, Fonterra – the largest global milk products exporter - released a
statement stating it was concerned that three batches of its “WPC80” (80% whey protein
concentrate) had been contaminated with a botulism causing bacterium, Clostridium
Botulinum. The company announced it was initiating a precautionary recall. 25 days later on
August 28th, after some further testing, Fonterra was able to confirm that the scare had been
a false alarm. Our aim in this paper is to identify and quantify the impact of this
‘contamination’ incident on milk exports from New Zealand, Fonterra’s headquarters and the
location of most of its production.
There were several complicating factors that could potentially have exacerbated the impact
of this contamination. One primary problem was that Fonterra was unsure about the exact
location of the affected product. The second was that WPC80 is used as an ingredient in
several consumption goods, and as Fonterra was only supplying the ingredient, it did not
know what goods it was being used in. Third, it was known that a common use of WPC powder
is in the production of infant formula. This fact increased concern and scrutiny around the
incident because, historically, quality issues regarding infant formula were known to have had
horrific consequences. Past crises included the Israeli thiamine deficiency crisis of 2003 and
the 2008 melamine contamination incident in China. 1 Fourth, Botulism, the suspected
contaminant in this case, is a paralysis inducing illness that can potentially be fatal. Fifth, any
competitive advantage held by the New Zealand dairy industry is based on the perceived
quality of its products (Woods & Coleman, 2012). It is therefore sensible to conclude that a
1 In the Israeli incident, 15 babies were hospitalised and two died (World Health Organisation, 2003). In China, 126,000 babies became ill, 53,000 were hospitalised, and at least four died (BBC News, 2010).
3
scare such as the WPC contamination incident could have significantly impacted New
Zealand’s exports, had the scare damaged this reputation.
Given the severity of the issue and the compounding factors, Sri Lanka, Russia, and China
introduced total bans on the import of certain New Zealand Dairy products. Throughout this
month-long saga, it was repeatedly suggested by the media that the incident would have a
devastating long-run impact on the reputation of the New Zealand dairy industry. After the
Chinese melamine incident of 2008, and a more minor contamination incident in New Zealand
in 20122, news media in New Zealand had become more sensitive to food safety issues. The
news was also reported elsewhere, with headlines such as “Is New Zealand Milk safe to drink?”
(Wall Street Journal Video, 2013) and “ Chinese still think New Zealand dairy less safe” (Adams,
2014).
Despite the media attention surrounding the event, this is the first piece of research that
attempts to empirically quantify the event’s impact on New Zealand exports, and on any other
element of the New Zealand economy. More importantly, as far as we have been able to find,
it is the first attempt to quantify the impact of a food-scare on trade more generally, especially
when such a heavily traded commodity is involved. The well defined time-frame in which this
event took place, also allows us to differentiate between impacts that were caused by a loss
in confidence (brand value) vs. a decline that is associated with exposure to the contamination
itself.
2 Traces of Dicyandiamide (DCD), a fertiliser, were found in New Zealand milk products between late 2012 and early 2013. The New Zealand Ministry of Primary industries announced that the DCD posed no risk to human health, and was cited as saying that the main reason for suspension of the use of the product was due to the potential for negative public perception of the contamination.

4
The impact on exports is analysed through the development of a synthetic counterfactual: a
scenario where the scare did not occur is modelled and then compared to actual export values.
The synthetic counterfactual makes it possible to quantify the impact in terms of reduced
sales. It also makes it possible to identify any potential longer-run reputational damage.
The next section sets the scene, describing the role of the dairy industry in the New Zealand
economy, the role of Fonterra, and briefly the nature of the global dairy market. The following
section discusses modern contamination incidents as investigated by past literature. The
literature that is examined is drawn from economics and marketing, in order to analyse how
consumers view food safety and what factors influence the way in which they react to food
safety concerns.
Section 4 describes the data we collected. It includes a range of summary statistics to help
the reader better understand the context in which this event occurred. Section 5 presents the
synthetic control methodology that was used to construct the counterfactual, and section 6
presents the results of the study as well as drawing conclusions about their causes and
implications. A detailed timeline of the crisis and additional empirical analysis can be found in
the online appendix.3
2. Fonterra and the dairy industry in New Zealand and Globally
Globally, New Zealand is the world’s largest exporter of dairy goods, exporting 51% of total
exported Whole Milk Powder (WMP) and around a third of total dairy exports (OECD/ FAO,
3 The online appendix is available at: https://sites.google.com/site/noyeconomics/research/natural-disasters.

5
2015; Fonterra, 2011). Dairy exports account for 26% of total New Zealand exports, and
directly account for 2.8% of New Zealand GDP (NZIER, 2010).
Fonterra is the world’s largest dairy company, and is far larger than any other dairy company
in New Zealand. It was formed in 2001 through the unification of Kiwi Co-operatives Dairy
Limited, New Zealand Co-operative Dairy Company Limited, and the New Zealand Dairy Board
(Ministry For Primary Industries, 2014), authorised by the Dairy Industry Restructuring Act
(2001). Like its predecessors, Fonterra is a co-operative that is owned by the farmers who
supply it. Each farmer must own a number of Fonterra Co-operative Group (FCG) shares that
is proportionate to the quantity of milk solids they supply to the company. These shares are
called ‘wet shares’. Farmers can also own shares in excess of the share standard, which are
known as ‘dry shares’. It is not possible for investors who are not farmers to own Fonterra
Co-Operative Group shares. However, investors can, along with farmers, own Fonterra
Shareholders’ Fund (FSF) shares which entitle them to the same economic returns as FCG
shares, but carry no voting or ownership rights.
Fonterra’s size means that its performance can have a tangible effect on the New Zealand
economy – through effects on employment, farmers’ wealth, and the performance of the
rural economy. In mid-2015, 87% of farmers were represented by Fonterra, and it was still
exporting almost all of the product it collects (Brettkelly, 2015).
Unfortunately, it is not possible to use Fonterra share prices to quantify the impact of the
WPC contamination incident on the New Zealand economy, or even on Fonterra itself. This is
partly because the share standard limits how many shares farmers can sell. The reasons as to
why it is not possible to assess changes to the share price for this project are discussed in
depth in Stojkov (2016).

6
Fonterra also has a number of international partnerships, including partnerships with Nestlé
and Dairy Farmers of America. It supplies international companies with ingredients and
specialty products, and also owns a range of brands that are sold directly to consumers. The
large number of business-to-business customers and brands supplied by Fonterra complicate
any potential recalls. Fonterra’s reputational standing has allowed it to expand globally and
is the result of New Zealand’s overall ‘clean green’ image and internationally recognised
institutional frameworks.
Demand for dairy goods has been increasing along with standards of living in developing
countries, with the upsurge in recent years stemming from a small group of mainly Asian
countries. Typically, New Zealand and Australia have dominated exports of dairy powders,
while the European Union has focused on the export of high quality cheese (Moore, 2009).
While New Zealand is the leading world exporter of many dairy products, most dairy goods
are not traded internationally, so it is not a comparatively very large producer.4
It has also been widely acknowledged that as international trade continues to expand, so will
the frequency of international food scare incidents, and the need for mechanisms through
which to tackle them (Knowles, Moody, & McEachern, 2007). This prediction illustrates the
significance of this research for future food safety policy at the firm, industry and national
levels.
4 India has been investing in local milk production to meet increases in demand, and is expected to continue to developing this, while “the development of Chinese self-sufficiency in milk and dairy products is a main determinant of future price development on world dairy markets” (OECD/FAO, 2014).

7
One more important observation from our perspective is that dairy prices are very volatile;
dairy is one of the most volatile commodities globally, and has been particularly volatile since
2007. This volatility is aptly exhibited by the time series of dairy prices in Figure 1.
Figure 1: Global Dairy Trade Total Price Index, (accounting for the prices of all goods sold on Global Dairy Trade)
3. The literature on Product Scares
Research that investigates food scares identifies subjective consumer beliefs regarding
reputation and trust as key determinants of consumer decision-making following a
contamination announcement. As is true for risk assessments in other spheres, subjective
perceptions of risk have been found to be very different from the objective, statistically
observed, levels of risks of harm or fatality (Boker & Hanf, 2000).
Richards and Patterson (1999) find that the economic costs of food scares are immediate and
that reputation is difficult to restore in the wake of such an incident. Their study is on a
contamination incident that occurred in 1996, in which Californian strawberries were falsely
8
announced to be the source of an outbreak of Hepatitis A. They found that even when only
one brand is implicated, “all growers are made to suffer” (Richards & Patterson, 1999). It is
both interesting, and significant to this research, that Richards and Patterson (1999) find both
immediate impacts on sales and long lasting impacts on reputation.5
The literature also overwhelmingly finds that consumers respond disproportionately to
negative information, as compared to positive information (Mazzocchi, 2006; Richards &
Patterson, 1999; Smith, van Ravensway, & Thompson, 1988). In the case of the WPC80
contamination incident, the substitution would likely be away from New Zealand goods, as
opposed to away from dairy, as there are several other exporting countries with a similar
‘clean’ image.
We have however found that consumers from different international markets may respond
differently to information. The differences are determined by the specific characteristics of
countries and industries (Holtbrugge & Baron, 2013; Folkes, 1991). The think-tank ‘Civil-China’,
for example, tallied the number of positive, neutral, and negative social media posts over the
progression of the WPC contamination incident (Civil China, 2013). It found that after the
announcement, negative posts increased, but positive posts increased also, as a response to
Fonterra initiating a precautionary recall. There was a perceived difference between
Fonterra’s transparency and Chinese producers’ obfuscation during the 2008 melamine
contamination incident.
5 In the Californian strawberry case, (Richards & Patterson, 1999) conclude that sales were affected for two years even after the source of the contamination was found to be Guatemalan raspberries.
9
The literature identifies three key methods by which the market effects of food scares are
quantified. They are: a comparison of average prices, event studies, and comparisons of
observed to predicted prices (Carter & Smith, 2007). The comparison of predicted prices to
observed prices is done through various methods of modelling demand for the good, or an
analysis of changes in price relative to the price of a substitute good.
It is not possible to use these methods in the instance of the WPC contamination scare
because the global dairy price did not respond in this incident, as developments in New
Zealand do not generally affect the global dairy price (Kamber, McDonald, & Price, 2013).6
4. Methodology
We estimate the economic impact of the WPC contamination incident on New Zealand dairy
exports. The estimation is done using a comparative case study approach. The synthetic
control method we use was formalised in a paper which analysed the effects of changes in
tobacco regulation in California (Abadie, Diamond, & Hainmueller, 2010). This method can be
used to assess the impacts of any exogenous economic shock, though panel data from similar
but unaffected locations is required as a control group to construct a counterfactual. This
method has been used to analyse the impact of exogenous shocks in a variety of contexts.
Examples include the analysis of affirmative action bans on college enrolment (Hinrichs, 2012),
the effects of terrorist attacks in Spain on electoral behaviour (Montalvo, 2011), and the
impacts of earthquakes in Italy (Barone & Mocetti, 2014) and Japan (duPont et al., 2015).
6 It is expected that any supply shock from this incident would not have been sustained enough to cause a shift in the price. If there was a long run impact from the scare, it is expected to have been on demand, as buyers would have no longer wanted to purchase New Zealand product.

10
In the synthetic control method, a weighted average of selected control countries’ exports is
used as a counterfactual of New Zealand exports. The weights are allocated such that the
counterfactual imitates New Zealand exports and other predictors in the period before the
shock. These same weights are then used in the months after the shock, as a prediction of
what New Zealand exports would have been had the scare not occurred. The ‘optimal’
counterfactual will be the one that minimizes the root mean square error from observed New
Zealand exports in the pre-treatment period. The counterfactual is compared to observed
exports in the post-treatment period to quantify the effects of the scare.
The other predictors that are included in the averaging process are exchange rates, the GDMI
drought index, and monthly (seasonal) dummies. These additional predictors are
hypothesised to be drivers of dairy exports. Implicitly, choosing a weighted average of
controls that also imitates these variables will help to construct a more accurate
counterfactual. Their inclusion decreases the chances that the relationship that is found
between New Zealand and the control group is spurious, because both the outcome variable
and other important drivers of dairy exports are imitated by the synthetic counterfactual.
Using a data driven approach can be preferable to allowing the researcher to choose a
counterfactual or a group of counterfactuals based on ad-hoc criteria. This approach
eliminates the subjectivity bias that a researcher might inadvertently insert (Abadie, Diamond,
& Hainmueller, 2010). As an example of the difficulty a researcher would be faced choosing a
counterfactual, New Zealand whey exports are graphed against the exports of countries
exporting similar quantities in Figure 2. It is clear that none of them are a particularly good
predictor of the evolution of whey exports from New Zealand, and it is not immediately clear
which country would make a better control than another.

11
Figure 2: New Zealand whey product exports against possible control countries’ whey exports
The synthetic control method, described formally below, enables the construction of the most
efficient synthetic New Zealand for each dairy product included in the data set. The
description and notation below follow closely the formalization in Abadie et al. (2010). For
each product, the export values (𝑌𝑖𝑡) that are observed are assumed to be:
𝑌𝑖𝑡 = 𝑌𝑖𝑡𝑁 + 𝛼𝑖𝑡𝐷𝑖𝑡 (1)
where 𝑌𝑖𝑡𝑁 is what exports would have been had the contamination incident not occurred.
The interacted term 𝛼𝑖𝑡𝐷𝑖𝑡 is the effect of the contamination on country i at time t. The size
of the effect is quantified in 𝛼𝑖𝑡.The term 𝐷𝑖𝑡 is a dummy variable that takes the value of one
if country i faces the contamination incident and t ≥ 𝑇0 . 𝑇0 is the period in which the
contamination incident occurred. In all other time periods, and for all other countries, 𝐷𝑖𝑡 is
zero. In this dataset, 𝐷𝑖𝑡 = 1 when 𝑖 = 1 (New Zealand) and t ≥ 44 (August 2013). The task is

12
to estimate 𝛼1𝑡 (impact on New Zealand). To do this, 𝑌1𝑡𝑁 are estimated and subtracted from
the observed 𝑌1𝑡.
Exports, when there is no contamination incident, 𝑌𝑖𝑡𝑁 , are hypothesized in the following way:
𝑌𝑖𝑡𝑁 = 𝛿𝑡 + 𝛾𝐸𝑖𝑡 + θ𝑍𝑖𝑡 + 𝜈𝑆𝑖𝑡
𝑃 + 𝛽𝑖𝑌𝑖(𝑡−𝑛)𝑁 + 𝜆𝑡𝜇𝑖 + 휀𝑖𝑡 (2)
Here, 𝛿𝑡 is an unobserved time variant factor. It does not vary between countries and
essentially sets an ‘intercept’ level of dairy exports in each time period. It can be thought of
as the effect of global factors that influence a global level of demand and supply for dairy
exports in a given period (for example, feed costs or demand of very large importers).
𝐸𝑖𝑡 , 𝑍𝑖𝑡, and 𝑆𝑖𝑡𝑃 are the observed predictors of exports included in the model. They are
exchange rates, drought data, and selected seasonal dummies, respectively. The values of the
predictors vary across countries and over time. The terms 𝛾, 𝜃, and 𝜈 are the coefficients on
these observed predictors that influence the dairy industry. The 𝑌𝑖(𝑡−𝑛)𝑁 are lagged exports
which are included to deal with autoregressive components of the data. The 휀𝑖𝑡 are assumed
to be random iid shocks with a mean of zero.
The vector 𝜆𝑡 represents unobserved time variant factors that influence dairy exports. Their
factor loadings vary across countries, and this variance is depicted in the vector of coefficients
𝜇𝑖. The actual factors are not observed; they are latent variables. It is not necessary to specify
what these unknown factors are, though an example could be the trend over time in the
demand for each country’s exports. Therefore 𝜆𝑡𝜇𝑖 is a matrix of interactions between
unknown factors which vary over time, and their unknown factor loadings, which vary across
countries. Their structure is hypothesised such that they explain the maximum amount of
variance and correlation between variables observed in the model.
13
The inclusion of these unobserved factors can be considered by rearranging the model to:
𝑌𝑖𝑡𝑁 = 𝛿𝑡 + 𝛾𝐸𝑖𝑡 + θ𝑍𝑖𝑡 + 𝜈𝑆𝑖𝑡
𝑃 + 𝛽𝑖𝑌𝑖(𝑡−𝑛)𝑁 + 𝑢𝑖𝑡 such that λtμi + εit = 𝑢𝑖𝑡 (3)
The theory is that the variance of each variable in the model will have two parts. The first
part will be the traditionally conceptualised random variance that is unique to each variable.
The other part will be due to underlying factors that are not observed. Without the λtμi
term, which represents unobserved factors that influence dairy exports, there is bound to
be omitted variable bias. The variance from the latent variables would be incorrectly
grouped with the 휀𝑖𝑡 term as it would appear that 𝑢𝑖𝑡 = 휀𝑖𝑡. This would be an issue because
𝑢𝑖𝑡 is correlated with both the outcome and the predictor variables. Setting 𝑢𝑖𝑡 = 휀𝑖𝑡 could
also lead to collinearity between the predictor variables if they are influenced by the same
underlying factors. The factors are assumed to be uncorrelated themselves.
The observed data in the model described above are weighted to construct a synthetic
counterfactual of New Zealand exports. This is done by choosing a vector of weights, W. Each
element of the vector is the weight placed on country 𝑖 to create the synthetic control so that
𝑊(𝑉) = (𝑤2 , … , 𝑤𝐼)′ . The following two constrains are placed on the elements of W:
∑ 𝑤𝑖 = 1𝐼𝑖=2 and 0 ≤ 𝑤𝑖 ≤ 1 ∀ 𝑖 .
Abadie, Diamond, and Hainmueller (2010) suggest finding the optimal W(V), denoted by
W*(V), by minimising √(𝑋1 − 𝑋0𝑊)′𝑉(𝑋1 − 𝑋0𝑊). Here, 𝑋1 is a vector that includesthe
observed predictors and a collection of simple and weighted averages of the export outcomes
in the pre-intervention periods for New Zealand. Similarly, 𝑋0 is a matrix of the equivalent for
all of the control countries. V is a diagonal weighting matrix which looks at the different
elements of the predictor matrices 𝑋1 and 𝑋0 , weighing their significance such that the

14
synthetic control estimator’s mean squared error is minimized. The algorithm for choosing V
also indirectly determines which countries will be used as controls, as W* will be a function
of V.
After the minimisation, ∑ 𝑤𝑖∗𝐸𝑖𝑡
𝐼𝑖=2 ≈ 𝐸1𝑡; ∑ 𝑤𝑖
∗𝑍𝑖𝑡𝐼𝑖=2 ≈ 𝑍1𝑡 ; and∑ 𝑤𝑖
∗𝑆𝑖𝑡𝑃𝐼
𝑖=2 ≈ 𝑆1𝑡𝑃 will hold
∀ 𝑡 = 1, , , , , 𝑇0 . As 𝜇𝑖 are unobserved, it is not possible to directly choose W such that
∑ 𝑤∗𝑖
𝐼𝑖=2 𝜇𝑖 = 𝜇1 . However, Abadie et. al (2010) prove that, if the synthetic control method
is able to construct a counterfactual where the observed predictors are matched, then
∑ 𝑤𝑖∗𝐼
𝑖=2 𝜇𝑖 = 𝜇1 will hold as well. In that case,
∑ 𝑤𝑖∗𝑌𝑖𝑡
𝐼𝑖=2 = �̂�1𝑡
𝑁 ≈ 𝑌1𝑡𝑁 ∀𝑡 = 1, , , , , 𝑇0 (4)
From here, it follows that the impact of the contamination that we wish to estimate for every
export value series is the observed series minus the counterfactual:
�̂�1𝑡 = 𝑌1𝑡 − �̂�1𝑡𝑁 (5)
There is, naturally, uncertainty regarding the ability of a counterfactual series ( �̂�1𝑡𝑁) to predict
what exports would have been had the contamination not occurred. This would be the case
even if the fit in the pre-treatment period were exceptional, because it will never be possible
to directly observe the counterfactual scenario. Abadie et al. (2010) propose permutation
(placebo) tests for determining the robustness of the result obtained through the synthetic
control method.
The permutation tests are done by using the synthetic control method to estimate a
counterfactual for placebos ─ all countries that did not experience the shock. The placebo
tests are carried out using all of the control countries in the data set by estimating:

15
�̂�𝑖𝑡 = 𝑌𝑖𝑡 − Σ𝑗=2𝐼 𝑤𝑗
∗𝑌𝑗𝑡 ∀ 𝑖 ≠ 1; 𝑗 ≠ 𝑖 (6)
The synthetic control method should not predict any gap in the post-intervention period in
the placebo cases because the control countries were not embroiled in the botulism scare.
When the �̂�𝑖𝑡 are estimated for placebos, the counterfactual will not match true exports
perfectly in the post-intervention period as the weights are not perfectly estimated. These
discrepancies are then deemed to be the margin of error that allows us to examine whether
the actual/counterfactual gap we identified for New Zealand is ‘statistically signficant’.7 We
examine the six main categories of New Zealand dairy exports.8 The methodology is the same
in all cases.
In previous works, the synthetic control method has been used with annual data. 9 In a
monthly series it is more difficult to develop an accurate control as higher frequency series
are often more volatile. This volatility can only be accounted for if other countries had
matching patterns of seasonal/monthly volatility.
As the countries observed do not all have matching patterns of volatility, it is difficult to match
the monthly variation of some New Zealand exports. However, it is equally difficult to match
the patterns of volatility in the synthetic placebo results to the actual observations for these
countries. This means that the permutation tests are still applicable, because they are
7 Strictly speaking, this cannot be a test for statistical significance without making some assumptions about the way the �̂�𝑖𝑡 are distributed. Without such assumptions, we graph the gaps for New Zealand and the placebos, and discuss the differences between them. 8 Value of exports were simulated for cheese, infant formula, and whey products. For WMP, SMP, and AMF/butter, the year on year growth rate was simulated because New Zealand exports such large quantities of these goods relative to most countries and the synthetic control method does not allow country weightings to exceed one to prevent extrapolation bias (Abadie, Diamond, & Hainmueller, 2010). 9 Examples include Hinrichs (2012), Cavallo et al. (2013), Barone & Mocetti (2014), Coffman & Noy (2012), duPont & Noy (2015), and duPont et al. (2015).

16
assessing the quality of New Zealand’s counterfactual relative to those of the control
countries. The fit of the counterfactual should be of reasonable quality in order for the
synthetic control method to be used, but it does not have to be perfect. Only if the fit is
exceptionally poor do Abadie et. al. caution against the use of the synthetic control method
(Abadie, Diamond, & Hainmueller, 2010).
It is not plausible to conduct the synthetic control methodology using annualised data, moving
averages, or a seasonally adjusted time series in the case of the WPC contamination incident.
Annualising data would not be suitable because it would reduce the number of observations
to five, with only one post-treatment observation. Similarly, using moving averages would be
problematic because the intervention period would be difficult to pinpoint; both its start and
its duration would be difficult to discern. Seasonal adjustment requires strong and consistent
seasonal patterns over a minimum of three, but optimally at least seven years of data
(Australian Bureau of Statistics, 2008). Such seasonal patterns are not a feature of the
monthly dairy export data.
A second caveat to the model is the assumption that in the time periods prior to the
announcement of the incident, 𝑌𝑖𝑡𝑁 = 𝑌𝑖𝑡; this means that the contamination incident did not
have an effect on exports prior to its public announcement (i.e., Fonterra did not change their
exporting before they were told of the contaminant by the lab in August).
It is, however, known that Fonterra was aware that there was some issue prior to the
announcement of the scare, even though they did not understand its severity (Norris, et al.,
2013). If there had indeed been a leakage of information, or if other disruptions from the
event had led to a negative impact on exports, this could lead to a sub-optimal group of

17
control weights being chosen for the counterfactual. The total estimated impact of the scare
would then be biased downward, because some of the downward trend prior to 𝑇0 would be
assumed to be normal. However, an incorrect 𝑇0 would bias the counterfactual significantly
only if the impact before 𝑇0 is very large or the real onset was much before 𝑇0. Neither of
these are likely.10
5. The Data: Source, Description, and Summary Statistics
The data collected for this project can be categorised into export data for New Zealand and a
control group of countries, and other predictors of dairy exports for New Zealand and the
control group. Other predictors of dairy exports used are exchange rates and climate variables.
Dairy price data from the Global Dairy Trade (GDT) auction platform include a time series of
the Global Dairy Trade Price Index (Figure 1 above).11 This price information was not used to
construct the synthetic controls, as we already include time fixed-effects. Prices were
approaching historical highs at the time of the scare. This was partly due to significant supply
constraints resulting from a drought that affected Oceania in 2013 (Kamber, McDonald, &
Price, 2013). No remarkable price change is observed during or soon after the scare.
The lack of a price response in the case of the WPC contamination incident in August 2013
can be contrasted with the turning point visible in all price series in March 2014. There was a
positive supply response from the high prices the previous season, a large surplus of
10 In the following section, we observe that the only instance where this is a possible concern is for whey exports. To account for this possibility, we re-estimated the counterfactual with an earlier treatment date. This does not change the estimated impact by much (though the estimated impact does increase). 11 Prices for the three main export products: WMP, SMP, and AMF, are presented in the appendix. The series are across contract lengths of 2-6 months. There is also a total price index for each product. From July 2008 to August 2010, there was one auction per month and from September 2010 onward, there have been two. In the months where there were two auctions, a simple average was taken to create the series.

18
European products that could no longer be exported to Russia due to sanctions, as well as a
slowdown in Chinese imports (OECD/ FAO, 2015).
Dairy export data was collected for New Zealand and the control group. The New Zealand
export data was collected from Statistics New Zealand, while the export data for the control
group was obtained from the UN Comtrade database. Including New Zealand, the dataset
covers 32 countries and accounts for 70-75% of global dairy exports. The time series is
monthly, covering the period from January 2010 to November 2014. January 2010 is the
earliest data point available in the monthly Comtrade time series. November 2014 was the
most recent data point available as of May 2015.12
While New Zealand data was available for all of the products that Statistics New Zealand
identifies as containing dairy, many countries in the control group were missing most
observations for minor export goods. It is for this reason that we focus on the directly
implicated products and dominant dairy export items, for which there were a sufficient
number of observations. These items are Whole Milk Powder (WMP), Skim Milk Powder
(SMP), and Anhydrous Milk Fat/ Butter (AMF).13 Cheese products are also included as they
are New Zealand’s next largest dairy export. Around 84% of New Zealand dairy exports over
the time period are captured in this product group.14 It is noteworthy that whey products,
which include the contaminated WPC80, make up only around 0.5% of total New Zealand
12 It was not possible to use quantity data, as the Comtrade database only records export values. Nevertheless, it is applicable to use export values because, as we observed, there was no impact from the WPC contamination incident on dairy prices. 13 AMF is a major New Zealand dairy export but could not be assessed separately from butter because the Comtrade Harmonised System tariff codes were not specific enough to isolate it. 14 The exact product classifications and the amounts involved are described in the appendix.

19
dairy exports.15 Infant formula, the other potentially affected product, makes up between 2-
3% of exports.
Aggregated New Zealand dairy exports are graphed in Figure 3. The vertical black line denotes
August 2013, the month in which the scare occurred. There is a large downward spike in
August 2013 coinciding with the time of the incident, though the data is clearly very seasonal.
This is because the dairy season runs from August to April with May-July being the ‘dry off’
period.
Figure 3: Time series of Total New Zealand Dairy Exports (value)
15 The data in the Comtrade database is recorded at the six digit level using the Harmonised System. It is for this reason that ‘the affected product’ in this study is taken to be all whey products, rather than whey protein concentrates.

20
When we examine only consecutive months of August, a potential shock to dairy exports is
visible in 2013, but appears very small. Furthermore, there appear to have been larger year
to year declines in 2009 and 2007. In the online appendix, we present a comparison of the
mean growth rates of exports in the three months before and after the contamination for all
the countries included. For all three of the dominant products, WMP, SMP, and AMF/butter,
New Zealand exports grew more rapidly in the three months following the contamination
incident than in the three months leading up to it. In fact, in the cases of WMP and SMP, the
New Zealand export growth rate differences are also in the top third of positive differences
relative to the other countries in the control group. For AMF/butter, New Zealand’s change
in growth rate is roughly the median of the control group. This is preliminary evidence against
a very large impact from the contamination incident for these main products.
In the cases of the affected products, whey products and infant powders, New Zealand’s
difference in growth rate is negative. New Zealand values are some of the most negative when
compared to the control countries. Of the countries that have more negative differences in
growth rates, all bar Chile export only very small amounts of whey products and infant
formula. This makes it more plausible that the negative values for New Zealand are a result
of the contamination incident.
This analysis, however, does not necessarily indicate than there was no impact on goods that
were not implicated directly in the scare. Exports maybe would have grown even faster had
the incident not occurred. To determine this, it is necessary to use the synthetic control
method to predict what exports would have been had the incident not occurred. Exchange
rate data between the domestic currencies of the countries in the data set and the US dollar
was included as a control variable in the model, as dairy commodities are predominantly
21
traded in USD. The monthly exchange rate changes were sourced from the IMF’s International
Financial Statistics database.
Climate data was hence introduced into the model, but only for New Zealand and Australia.
Kamber et al. (2013) show that droughts in the austral summer months have negative impacts
on dairy production, with an increase in price observable in the third quarter. The effects of
the 2012-2013 summer drought needed to be accounted for in order to construct an accurate
counterfactual using the synthetic control method. Climate data was only included for New
Zealand and Australia because these are the only two countries in the dataset that use
predominantly pasture based methods of dairy production. It is expected that the seasonal
changes in climate would have a much greater effect on exports when this is the dominant
form of feed. Indirect time variant effects for the other countries, such as those caused by
higher feed costs in winter, would be captured in the time fixed effects included in the model.
We use the Global Drought Monitor Index (GDMI), accumulated at the six month level
(Vicente-Serrano & Begueria, 2015). The GDMI takes into account precipitation levels and
temperature, as well as potential evapotranspiration.16 The severity and persistence of the
drought would suggest that it accounts for at least some of the lower exports observed in
2013.17 As the GDMI values are available regionally, we weighted the observation for each
region by the percentage of dairy production that came from that region in each country. This
16 Evapotranspiration is the rate at which water evaporates from the soil. Taking this into account as well as rainfall is very important when analysing the effects of drought on agricultural production. It is also in line with the methods of both NIWA (2013) and Kamber, McDonald, & Price (2013). More details about this index and its construction are available in Stojkov (2016). 17 The drought was officially declared to be over in October 2013 (New Zealand Veterinary Association, 2013).

22
weighting was particularly necessary in the case of Australia, where only a small proportion
of the land is used for dairy farming. This resulted in national GDMI time series.
Dummy variables denoting the month were also added to the model. They were included to
account for seasonality as southern hemisphere countries experience opposite seasons to
Northern Hemisphere countries in any given month. The months were labelled in opposite
patterns. That is, February in the southern hemisphere was labelled as February, but February
in the northern hemisphere was labelled the same as August in the southern hemisphere.
Not all countries exported all types of dairy product in all periods, even for the six main
categories. In cases where one or two data points were missing, but in the surrounding
months exports were recorded, a simple linear interpolation was done to balance the panel.
In all cases, except for the two described below, countries were excluded from the control
group for the products for which sufficient data was not available. The last few data points
for Argentina and Singapore were missing, so we used the Holt-Winters forecasting method
to forecast these.
6. Results: The Impact on Dairy Exports
The following figures plot the actual values of the export series for New Zealand, the
estimated counterfactual series (i.e., the synthetic New Zealand exports without the
contamination), and the estimated impacts for NZ and for the placebos (the gaps between
the actual and counterfactual), for each of the six dairy product groups . The weights that
were assigned to the control countries in each case are recorded in the online appendix. This

23
is also where a list of the placebos used for the permutation tests can be found. 18 The fit of
the synthetic counterfactual to the true series in the pre-treatment period is significantly
better for all of the estimates that involve growth rates.
First, we analyse the directly implicated products: whey products and infant powders. We
follow that with the analysis for WMP, by far New Zealand’s largest export product, and then
the remaining products: SMP, AMF/butter, and cheese.
Figure 4: Actual and counterfactual New Zealand whey product exports
Figure 4 compares the estimated counterfactual whey exports to the actual exports of whey
products, the contaminated product. Perhaps unsurprisingly, there appears to be a significant
unexpected (unpredicted) drop in exports after August 2013. The gap between the true series
and the counterfactual is persistent throughout the post treatment period. The synthetic
18 The online appendix is available at: https://sites.google.com/site/noyeconomics/research/natural-disasters.
24
counterfactual predicts a much higher average level of exports than the actual values of
exports after the contamination incident. This is in contrast to the pre-intervention period,
where the synthetic prediction is close to the average level of exports, though the actual
series is much more volatile. An initial shock to exports is to be expected as WPC was the
contaminated product. Not only did buyers reject the product at the time, New Zealand’s
Ministry of Primary Industries was also actively withholding product from export due to the
perceived serious nature of the safety threat (Ministry for Primary Industries, 2015). The fact
that lower exports persisted for over a year, well after the all-clear, suggests that New
Zealand’s reputation as a provider of quality whey goods may have been tarnished. Another
possible reason for the persistently lower levels of exports is that New Zealand exporters lost
market share during the time of uncertainty. Russia and China, both major importers,
maintained bans on some New Zealand whey products even after the scare was found to have
been a false alarm. China’s complete ban was lifted in October 2013, but Russia’s bans were
only lifted in August 2015, and even then only partially (Reuters, 2015).
25
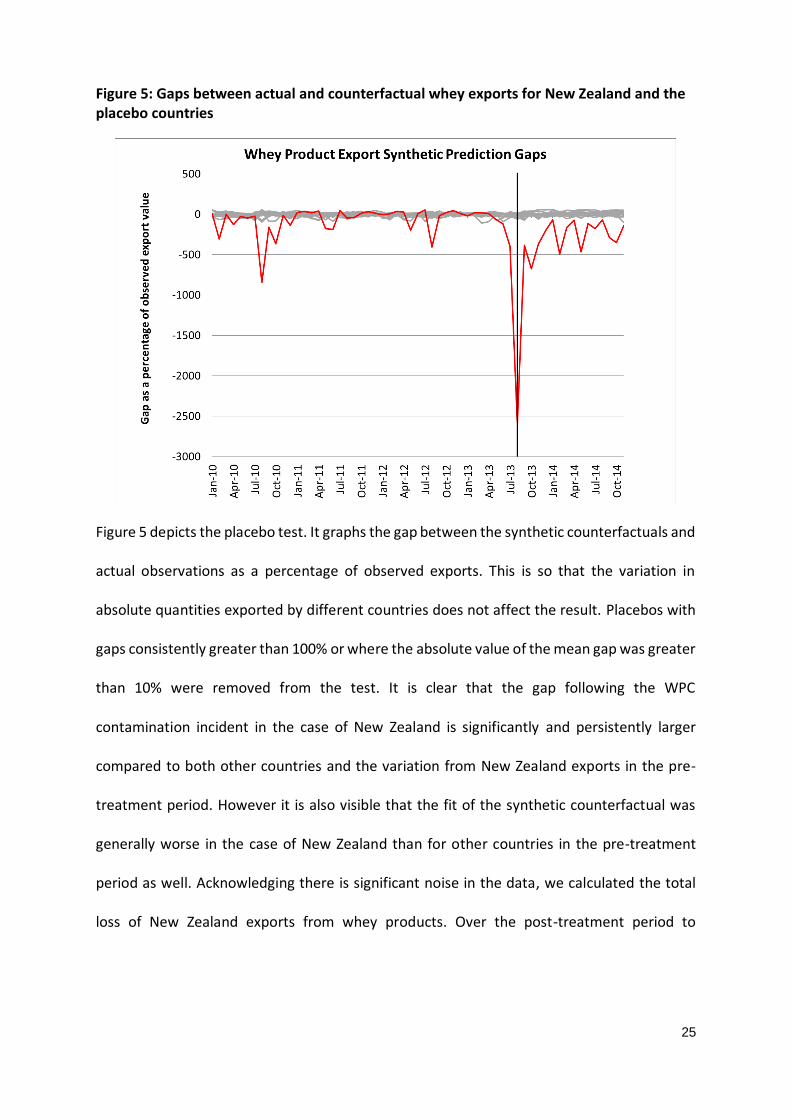
Figure 5: Gaps between actual and counterfactual whey exports for New Zealand and the placebo countries
Figure 5 depicts the placebo test. It graphs the gap between the synthetic counterfactuals and
actual observations as a percentage of observed exports. This is so that the variation in
absolute quantities exported by different countries does not affect the result. Placebos with
gaps consistently greater than 100% or where the absolute value of the mean gap was greater
than 10% were removed from the test. It is clear that the gap following the WPC
contamination incident in the case of New Zealand is significantly and persistently larger
compared to both other countries and the variation from New Zealand exports in the pre-
treatment period. However it is also visible that the fit of the synthetic counterfactual was
generally worse in the case of New Zealand than for other countries in the pre-treatment
period as well. Acknowledging there is significant noise in the data, we calculated the total
loss of New Zealand exports from whey products. Over the post-treatment period to

26
November 2014, New Zealand exports were $71 million USD lower than the synthetic
counterfactual suggest they would have been had the scare not occurred.
Another interesting feature of Figure 4 is that between April 2011 and May 2013, there
appears to be a fairly clear pattern of peaks and troughs in whey exports, which subsequently
breaks down. After May 2013, a persistent downward trend is observed. There could be
multiple reasons for this change: First, the original pattern may be a statistical anomaly; it
features less than three years of data. It could also be the result of the drought, although the
drop is much larger when compared to the drop in WMP, at over 50% in the first month alone
and 87% by July.
In the online appendix, a synthetic control is constructed where the treatment period is
assumed to be May 2013 (instead of August). The significance of the result does not change,
but the predicted impact of the scare doubles to $140 million USD. Furthermore, it appears
that the fit of the counterfactual in the pre-treatment period is improved when the treatment
date is set to May 2013.
To check the robustness of these results, given that the fit of the synthetic counterfactual is
relatively poor in the pre-treatment period, year on year growth rates of whey products are
also analysed. Figure 6 shows the growth rate gap of New Zealand whey exports and the
corresponding placebo countries.
Again it is visible that from May 2013, there is a prolonged period of decline in exports which
is not predicted by the synthetic counterfactual. After May 2013, there is a level shift
downward in the growth rate, after which the growth rate continues to be lower. This would

27
suggest that the drop in the growth rate – the lower exports observed between May 2013
and early 2014 – is not seasonal, but rather due to the shock.
In August 2014, we see a significantly larger than expected positive growth rate in the actual
series. This suggests a rebound from the previous year’s August. It is a reflection of how low
exports were in August 2013, but does not necessarily indicate a full recovery of exports. A
spike is predicted by the synthetic control around this time so it is necessary to analyse the
results of the placebo, to see if these observed results are within the margin of error.
Figure 6: Gaps between actual and counterfactual whey product export growth rates for New Zealand and the placebo countries
From Figure 6 it is visible that between May 2013 and early 2014, the gap between the New
Zealand counterfactual growth rate of whey exports and actual exports is significantly greater
(and negative) relative to the gaps for the placebos. All this suggests that the WPC
contamination incident has had a significant and persistent impact on both the level and

28
growth rate of New Zealand whey exports. It is important to emphasise, however, that
although whey products and protein powders are high value products, their total export value
makes up only 0.5% of New Zealand dairy exports.
Another product that was directly entangled in the scare was infant formula (WPC is an
ingredient in infant formula). As in the case with whey products, Figure 7 shows that that the
contamination incident had a significant impact on New Zealand exports of infant powders in
August 2013 that has persisted over time. It is likely that the effect was large because infant
formula is a consumer product where safety concerns are of paramount importance.
It is noteworthy that infant formula exports appear to rebound in December 2013, and then
fell below the counterfactual prediction once more. This would suggest that while New
Zealand’s reputation was not permanently damaged, New Zealand suppliers have potentially
lost their market share in infant formula.
29
Figure 7: Actual and counterfactual New Zealand infant formula exports
Figure 8: Gaps between actual and counterfactual infant formula exports for New Zealand and the placebo countries

30
The placebo significance tests are presented in Figure 8. The discrepancy in the New Zealand
case between actual infant formula exports and the predictions of the synthetic control is
roughly average relative to those of the placebo countries in the pre intervention period.
However, in August 2013, a significant negative gap is recorded, which is much larger than in
any of the placebo cases. However the placebo test would suggest that infant formula exports
initially recovered as early as September 2013; though the recurrence of the negative gaps
after December 2013 again suggests that it was not expected that New Zealand infant formula
exports would plateau at a level as low as they did. The total calculated loss in exports
between August 2013 and the rebound in September 2013 is $22 million US dollars. Over the
whole period to November 2014, the loss is $207 million US dollars.19
Figure 9: Actual and counterfactual growth rates of New Zealand WMP exports
19 The infant formula industry was one of New Zealand’s fastest growing industries prior to the contamination incident and was expanding globally (Fonterra, 2014). Fonterra staff we consulted were sceptical about whether the high exports seen in early 2013 represented such a drastic increase in the long term trend of infant formula exports (Fonterra, 2015). In the appendix, the results are repeated with the months between March and July 2013 treated as outliers. This did not change the outcome of the analysis; the incident had a significant impact on infant formula exports.

31
The synthetic counterfactual does not predict the decline in WMP exports that was seen in
the months from May 2013 (figure 9). This could be because the effects of the drought which
peaked around this time have not been fully accounted for, and therefore the controls were
not able to accurately emulate New Zealand conditions. It is also notable that while they are
negative, the growth rate declines were at their lowest in July, and already began a recovery
in August when the contamination was identified.
Given that the counterfactual was unable to predict the size and timing of this trough before
the contamination incident, it is unclear whether the positive growth rate expected but not
achieved in August 2013 can be attributed to the contamination incident, or if the discrepancy
is merely within the margin of error. The synthetic control closely matches the actual growth
rate trend of WMP exports from September 2013 onwards. This would suggest that
irrespective of whether the lower exports in August are significant, the effects of the scare on

32
WMP was very short lived; New Zealand’s reputation or share in the market of WMP was not
affected.
Figure 10: Gaps between actual and counterfactual WMP export growth rates for New Zealand and the placebo countries
Figure 10 shows that the magnitude of the gap in the prediction for New Zealand WMP growth
rates is roughly in the middle of the distribution of the gaps in the control countries for the
duration of the series. This indicates that the discrepancy between the actual growth in WMP
exports in August 2013 and the synthetically predicted growth rate is not significant. It
appears sensible to conclude that the WPC contamination incident did not affect WMP, which
alone accounts for around 40% of New Zealand dairy exports.
We finish by presenting similar analysis for the last three groups of dairy products - SMP,
butter, and cheese – in Figures 11-13, respectively. For all three products, we only present
the factual-counterfactual gaps (the impact) as calculated for New Zealand and the placebos.

33
When we examine the growth rate of SMP exports, in Figure 11, it is not possible to conclude
that there was any change to the growth rate that can be attributed to the WPC
contamination incident. We do observe a dip in growth that started in early 2014 (long after
the contamination fear was found out to be unfounded) – but this dip is identified within a
large volatility observed also for the placebos.
Figure 11: Gaps between actual SMP export growth rates and the synthetic counterfactual predictions for New Zealand and the control group
For AMF/butter (Figure 12), it appears that there was a large unexpected drop in the growth
rate of exports in August 2013 relative to the previous year. The drop was not predicted by
the synthetic counterfactual, which otherwise maps export growth rates quite well in the pre-
treatment period. Still, the placebo trials depicted in the figure are inconclusive. The gap
between true New Zealand growth rates and counterfactual growth rates is certainly among

34
the largest following the incident, but it is not as overwhelmingly greater as it is in the cases
of whey products and infant powders. Given the good fit of the model in the pre-treatment
period, it is possible but not certain that there may have been a small, transient negative
impact from the WPC contamination incident on to the growth rate of New Zealand AMF and
butter exports. It is interesting that there may have been a very short-term effect on
AMF/butter exports, but not on WMP and SMP exports. 20
Figure 12: Gaps between actual AMF/butter export growth rates and the synthetic
counterfactual predictions for New Zealand and the control group
Figure 13 presents actual New Zealand cheese exports and the counterfactual of New Zealand
cheese exports had the contamination not occurred. Cheese exports are New Zealand’s next
20 It is possible that the smaller market for AMF/butter gives buyers relatively more bargaining power and ability to affect market-clearing prices and quantities. Fonterra staff support this hypothesis, stating that markets for fats are more limited; there are not as many buyers of AMF/ butter as there are for WMP and SMP (Fonterra, 2015).

35
largest dairy export after WMP, SMP, and AMF; in value, they are greater than the values of
both infant powders and whey products combined. For cheese, a very large dip is observed
in September 2012, followed by a sharp recovery, almost a year before the incident. Private
discussions with the Ministry for Primary Industries revealed that these observations were
outliers: delays in a series of negotiations resulted in very low exports in September 2012,
and the resolution that followed resulted in very high exports between November 2012 and
January 2013.21
As in the case of AMF/butter, the placebo tests shown in Figure 13 are inconclusive. In
August 2013 the New Zealand gap (decline in Cheese exports) is the second largest, and in
September and October it is the largest. It could be argued that from August to October
2013, the value of New Zealand cheese exports was affected by the scare. There is further
evidence of this if the gaps for other Augusts are also analysed. The seasonal dips in 2010
and 2011 are not as large, and they only last one month. Only the 2012 and 2013
observations appear to be at the lower bound of the placebo country gaps in multiple
months. It has already been noted that the 2012 observation is indeed an outlier. In 2013,
the the decline may be attributed to the WPC contamination incident.
The possible impact is short-lived. Given there is no sharp drop in August, again it is possible
that cheese exports were more sensitive to the scare because globally as there are many
21 As these observations are outliers, when the synthetic counterfactual was constructed for Figure 13, these outliers were omitted from the averaging process. The synthetic control method is less effective if the outliers are not removed, because the fit is significantly poorer relative to the control countries. The consequence of the poorer fit is that usual volatility associated with New Zealand’s cheese exports appears as though there were multiple shocks lasting one month when the placebo test is done. Following discussions with both the Ministry for Primary Industries and Fonterra, there is no reason to believe that there were multiple short-lived shocks. The results of the analysis of cheese exports when the outliers were not removed can be found in the online appendix.

36
substitues to New Zealand cheese, and buyers are less dependent on New Zealand for
cheese products. Given that the gap is largest in September and October, it is unlikely that
disruptions to cheese are due to safety concerns around the product. The fact that after a
few months cheese exports return to what they would have been had the scare not
occurred supports this hypothesis. As in the case of all the other products that were not
directly implicated in the scare, we observe no long run impact.
Figure 13: Gaps between actual cheese exports and the synthetic counterfactual predictions for New Zealand and the control group
In private discussions, Fonterra employees have suggested that cheese exports were lower
in the months immediately following the scare because delivery of cheese products had
slowed as it was not perceived as a priority at the time of mounting needs to deal with other
products (Fonterra, 2015). The contamination fears apparently created a backlog of

37
operational and logistic challenges even after it had been confirmed that the contamination
was a false alarm.
7. Conclusion: The Good, the Bad, and the Dairy
In early August 2013, it was announced that there was concern of a botulism causing
contaminant in WPC80 that had been exported by Fonterra. On the 28th of August, the
contamination was confirmed to have been benign. We set out to evaluate whether the
contamination incident, which implicated the world’s largest dairy exporter, could have
affected the New Zealand’s dairy exports.
Analyses of export patterns, which would have been the most direct impact of the scare, show
that the incident had no long term significant impact on the total value of most dairy exports.
Comparisons with a synthetic counterfactual showed that there was no impact at all to WMP
and SMP, which together make up over 50% of dairy exports. The results for AMF/butter and
cheese export values were inconclusive, with the possibility of a small short term (2-3 months)
decline in export values, but nothing beyond that.
However, there has been a large, statistically significant, and persistent negative impact on
whey products and infant formula. Exports of these products have not returned to levels from
before the scare, as of the most recent data available in June 2015.
Given an initial recovery of infant formula exports, and the absence of any substantial impact
on other dairy products, it is likely that the relatively weak performance of these products is
the result of missed business opportunities and lost market share, rather than remaining fears
regarding the safety of New Zealand dairy goods. On the other hand, these results also

38
indicate that though New Zealand’s reputation may be less robust than before the scare, New
Zealand is still viewed as a safe source of dairy goods.
This research has estimated that the impact of the Whey Protein Concentrate contamination
incident on New Zealand dairy exports was a reduction of between $105 million and $347
million from the start of the scare to November 2014.22 It is $105 million if it is assumed that
Fonterra did not change their whey product export patterns prior to the public announcement
of the scare, and if only the immediate impact to infant formula is associated with the scare.
Conversely, $347 million corresponds to the case where both the true treatment date for
whey products is May 2013 (when Fonterrra became initially aware of a possible problem)
and the entire impact to infant formula is considered, including lower exports after the
temporary recovery in December 2013. These figures can be put in the context of $15.5 billion
in New Zealand dairy exports between August 2013 and November 2014, or $17.5 billion
between May 2013 and November 2014. Based on the scenarios above, this would mean that
total dairy exports were between 0.6 and 1.9% lower than they would have been had the
scare not occurred. Dairy exports make up 26% of total New Zealand exports annually.
This investigation considered the impact of a false alarm. Overall, our interpretation of the
evidence that the majority of the impact from this scandal that we observe has likely stemmed
from lost market share as well as import and export bans in whey and infant formula markets.
It is highly unlikely that the WPC contamination incident has had a long run impact on New
Zealand’s reputation as a provider of safe dairy goods. It is undoubtedly true, however, that
22 The figures are in United States dollars.
39
the impacts of this incident and the implications for Fonterra’s reputation would have been
much greater had the contaminant been confirmed as Clostridium Botulinum.

40
References
Abadie, Diamond, & Hainmueller. (2010). Synthetic Control Methods for Comparative Case Studies: Estimating the Effect of California's Tobacco Control Programme. Journal of the American Statistical Association , 493-505.
Adams, C. (2014, March 20th). Chinese Consumers Still think New Zealand Milk is Less Safe. From The New Zealand Herald: http://www.nzherald.co.nz/business/news/article.cfm?c_id=3&objectid=11222692
Alhabeeb, M. (2006). Consumer Attitude and Attribution. Allied Academies International Conference (pp. 1-5). New Orleans, Louisiana: Academy of Marketing Studies.
Anuranga, B. (2014). DCD, a Potential Shield to Uplift Local Milk. Scientific Reseach Journal , 20-25.
ANZ. (2015, July 3). Private Conversations with ANZ staff. Wellington, New Zealand.
Australian Bureau of Statistics. (2008, July 25). Time Series Analysis: The Process of Seasonal Adjustment. From Australian Bureau of Statistics: http://www.abs.gov.au/websitedbs/d3310114.nsf/51c9a3d36edfd0dfca256acb00118404/5fc845406def2c3dca256ce100188f8e!OpenDocument
Bagrie, C., & Williams, C. (2014, September 3). New Zealand Economics: Dairy and RBNZ Update. ANZ Research , pp. 1-6.
Barone, G., & Mocetti, S. (2014). Natural disasters, growth and institutions: A tale of two earthquakes. Journal of Urban Economics , 52-66.
BBC News. (2010, January 25). Timeline: China Milk Scandal. From BBC News: http://news.bbc.co.uk/2/hi/7720404.stm
Boker, A., & Hanf, C. (2000). Confidence lost and- partially- regained: consumer response to food scares. Journal of Economic Behaviour and Organisation , 471-485.
Brav, A. (2000). Inference in Long Horizon Event Studies: A Bayesian Approach with Application to Initial Public Offerings. The Journal of Finance , 1979-2014.
Brettkelly, S. (2015, June 9). Farmers sign up with Chinese milk processors. From Raido NZ: http://www.radionz.co.nz/news/rural/275738/farmers-leave-fonterra-for-rivals
Carter, C., & Smith, A. (2007). Estimating the market effect of a food scare: the case of genetically modified starlink corn. The Review of Economics and Statistics , 522-533.
China, C. (2013, December 2nd). Fonterra: Rewarding Honesty. From Civil China: http://www.civilchina.org/2013/12/fonterra-rewarding-honesty/
Coffman, M., & Noy, I. (2012). Hurricane Iniki: measuring the long-term economic impact of a natural disaster using synthetic control. Environment and Development Economics , 187-205.
Commerce Commission New Zealand. (2014, November 24). The Dairy Industry Restructuring Act. From Commerce Commission New Zealand: http://www.comcom.govt.nz/regulated-industries/dairy-industry/the-dairy-industry-restructuring-act/
Dairy Australia. (2013). About the Industry. From Dairy Australia: http://www.dairyaustralia.com.au/Industry-information/About-the-industry.aspx

41
DairyNZ. (2014). New Zealand Dairy Statistics 2013-14. From DairyNZ: http://www.dairynz.co.nz/media/2255784/nz-dairy-stats-2013-2014.pdf
Danone. (2014). Nutricia. From Danone: http://www.danone.co.uk/AboutUs/History/Nutricia.html
Davidson III, W., & Worrel, D. (1992). Research Notes and Communitcations: The effect of product recall announcements on shareholder wealth. Strategic Management Journal , 467-473.
Dean, & Nowell, A. &. (2013). Report on New Zealand's Dairy Food Safety Regulatory System. Wellington, New Zealand.
Dean, Astin, & Nowell. (2013). Report on New Zealand's Dairy Food Safety Regulatory System: Government Inquiry into the Whey Protein Concentrate Contamination Incident. Available online:http://www.dia.govt.nz/vwluResources/Government_Whey_Inquiry_Interim_Report_2_Dec_2013/$file/Government_Whey_Inquiry_Interim_Report_2_Dec_2013.pdf.
Fattal-Valevski, Kelser, Sela, Nitzan-Kaluski, Rotstein, Stolovich, et al. (2004). Outbreak of Life-Threatening Thiamine Deficiency in Infants in Israel Caused by a Defective Soy-Based Formula. Official Journal of the American Academy of Pediatrics , 234-238.
Folkes, V. (1991). Recent Attribution Research in Consumer Behaviour: A review and new directions. In H. Kassarjian, & T. Robertson, Perspectives in Consumer Behaviour (4th ed). Engelwood Cliffs: NJ: Prentice Hall.
Fonterra. (2012, June 25). Fonterra Special Meeting: Notice of Special Meeting of Shareholders. From Fonterra: https://www.fonterra.com/wps/wcm/connect/438045804b712606a6d8ae28499bab7b/Notice+of+Special+Meeting+of+Shareholders+May+2012.pdf?MOD=AJPERES
Fonterra. (2013, June). Fonterra: Global Dairy Updates (April- June 2013). From Fonterra- Shareholder Updates: https://www.fonterra.com/nz/en/Financial/Global+Dairy+Update
Fonterra. (2015, July 15). Private discussions with Fonterra staff. Wellington.
Fonterra. (2011). The New Zealand Dairy Industry. From Fonterra: http://www.fonterra.com/global/en/financial/global+dairy+industry/new+zealand+dairy+industry
Fonterra. (2014). Various pages. List of pages available on request. From Fonterra: http://www.fonterra.com
Fowler, P., Birch, I., Deva, S., Fanjul, G., Fokker, R., Fried, M., et al. (2002). Oxfam Briefing Paper 34. Available online: http://www.oxfam.org.nz/sites/default/files/reports/DairyPaper.pdf: Oxfam International.
GDT. (2014). How does it work? From Global Dairy Trade: http://www.globaldairytrade.info/en/about-gdt/how-does-it-work/
Global Tariff. (2014). The Harmonized System- A breif history. From Global Tariff: http://www.globaltariff.com/HSHistory.cfm
Grunert, K. (2005). Food Quality and Safety: Consumer perceptions and demand. European Review of Agricultural Economics , 369-391.
Hinrichs, P. (2012). The Effects of Affirmative Action Bans on College Enrollment, Educational Attainment, and the Demographic Composition of Universities. The Review of Economics and Statistics , 712-722.
Holtbrugge, D., & Baron, A. (2013). Market entry Strategies in Emerging Markets: An Institutional Study in the BRIC Countries. Thunderbird International Business Review .

42
Kamber, G., McDonald, C., & Price, G. (2013). Drying out: Investigating the economic effects of drought in New Zealand. Reserve Bank of New Zealand.
Knowles, T., Moody, R., & McEachern, M. (2007). European food scares and their impact on EU food policy. British Food Journal , 43-67.
Leong, T. (2014, September 22). Global Dairy Players- New Zealand. From AgriHQ (NZX Agri): http://academy.agrihq.co.nz/Courses/Dairy/Global-dairy-players/Global-dairy-players-New-Zealand
MacKinlay, A. (1997). Event Studies in Economics and Finance. Journal of Economic Literature , 13-39.
Mazzocchi, M. (2006). No News is Good News: Stochastic Parameters versus Media Coverage Indicies in Demand Models after Food Scares. American Journal of Agricultural Economics , 727-741.
Meyer, E. (2013, October). HighGround Dairy Fonterra GDT Volume Forecast Analysis. Dairy Trader , p. online.
Ministry For Primary Industries. (2014). Frequently Asked Questions: Proposals to amend DIRA and Raw Milk Regulations. From Ministry For Primary Industries: http://www.mpi.govt.nz/news-resources/faqs/proposals-to-amend-dira-and-raw-milk-regulations
Ministry for Primary Industries. (2015, May 27). Private Discussions with staff from the Ministry of Primary Industries. Wellington, New Zealand.
Montalvo, J. G. (2011). Voting after the Bombings: A Natural Experiment on the Effect of Terrorist Attacks on Democratic Elections. The Review of Economics and Statistics , 1146-1154.
Moore, S. J. (2009). Global Trends in milk quality: implications for the Irish dairy industry. Irish Veterinary Journal , 5-14.
National Institute for Water and Atmospheric Research Ltd. (2013). The 2012-13 drought: an assessment and historical perspective. Published Online: Ministry for Primary Industries.
New Zealand Inc. (2015, July 16). Fonterra’s 2015/16 payout cut now expected to below latest season’s. From New Zealand Inc.: http://newzealandinc.com/weak-dairy-prices-prompt-pull-back-in-expectations-for-payout-to-nz-dairy-farmers-this-season/
New Zealand Veterinary Association. (2013, October 3). 2013 Drought Update. From New Zealand Veterinary Association (NZVA): http://www.nzva.org.nz/newsstory/2013-drought-update?destination=node%2F3436
Norris, R., Israel, S., Read, B., Waller, J., Potter, J., McCutcheon, S., et al. (2013). Report of WPC80 Independent Inquiry for Fonterra Board. Available online: http://wpc80-inde-report.fonterra.com.
NZIER. (2010). Dairy's Role in Sustaining New Zealand: The sectors contribution to the economy. Available online:http://www.fedfarm.org.nz/files/2010---Dairy-Economic-Impact.pdf: NZIER.
NZX. (2013, December). Agrifax Dairy Report. From NZX: https://nzx.com/files/static/cms-documents/Agrifax%20Dairy%20Report%202013%2012%20(1).pdf
NZX Company Research. (2015, October 4). Fonterra Co-operative Group Limited - FCG (Co-operative Shares) . From NZX Company Research: http://companyresearch.nzx.com/deep_ar/newpage.php?pageid=price&default=FCG
NZX Company Research. (2015, October 4). NZX Company Research. From Fonterra Shareholders' Fund - FSF (Ordinary Units) : http://companyresearch.nzx.com/deep_ar/newpage.php?pageid=price&default=FSF

43
NZX. (2013). Guide to Dairy Futures: NZX Derivatives Market. NZX Limited.
OECD/ FAO. (2015). Dairy. OECD-FAO Agricultural Outlook 2015 . OECD Publishing.
OECD/FAO. (2014). Dairy. OECD-FAO Agricultural Outlook 2014 . OECD Publishing.
PwC Australia. (2011). The Australian Dairy Industry: The Basics. Available online: http://www.pwc.com.au/industry/agribusiness/assets/Australian-Dairy-Industry-Nov11.pdf.
RBNZ. (2014, May 7th). Significance of the dairy industry to the New Zealand Economy: A speech delivered by Graeme Wheeler, Governor. From Reserve Bank of New Zealand: http://www.rbnz.govt.nz/research_and_publications/speeches/2014/5721703.pdf
Reuters. (2015, August 18). Russia lifts ban on some New Zealand dairy products. From Reuters: http://www.reuters.com/article/2015/08/19/newzealand-dairy-russia-idUSL3N10U1JF20150819
Richards, T., & Patterson, P. (1999). The Economic Value of Public Relations Expenditures: Food Safety and the Strawberry Case. Journal of Agricultural and Resource Economics , 440-462.
Salin, V., & Hooker, N. (2001). Stock market reaction to food recalls. Review of Agricultural Economics , 33-46.
Smith, Ravensway, v., & Thompson. (1988). Sales Loss Determination in Food Contamination Incidents: An Application to Milk Bans in Hawaii. American Journal of Agricultural Economics , 513-520.
Statistics New Zealand. (2014, July 11). Private email correspondence with Statistics New Zealand staff.
Sugiyama, H. (1980). Clostridium Botulinum Neurotoxin. Microbiological Review , 419-448.
Thomsen, M., & McKenzie, A. (2001). Market Incentives for Safe Foods: An Examination of Shareholder Losses from Meat and Poultry. American Journal of Agricultural Economics , 526-538.
Underhill, J. (2008, September 24). Fonterra's farmers sour on payments, San Lu fallout. From ShareChat: http://www.sharechat.co.nz/article/7ca181d2/fonterra-s-farmers-sour-on-payments-san-lu-fallout.html
Vicente-Serrano, S. M., & Begueria, S. (2015, April 06). SPEI Global Drought Monitor. From SPEI: http://sac.csic.es/spei/map/maps.html
Vicente-Serrano, S., Begueria, S., & Lopez-Moreno, J. (2010). A Multiscalar Drought Index Sensitive to Global Warming: The Standardized Precipitation Evapotranspiration Index. Journal of Climate , 1696-1718.
Wall Street Journal Video. (2013, January 25). Is New Zealand Milk Safe to Drink? From Wall Street Journal: http://www.wsj.com/video/is-new-zealand-milk-safe-to-drink/126C7E65-E72D-444F-A0DA-44A8A19A9B1D.html
Woods, D., & Coleman, A. (2012). Price, Quality and International Agriculture Trade. Available online: http://www.motu.org.nz/publications/detail/price_quality_and_international_agricultural_trade: Motu Economic & Public Policy Research (working paper).
World Health Organisation. (2003, November 21). Thiamine Deficient Infant Formula. From World Health Organisation: http://www.who.int/mediacentre/news/releases/2003/pr88/en/
Zhang, C., Bai, J., & Wahl, T. (2012). Consumers' willingness to pay for traceable pork, milk, and cooking oil in Nanjing, China. Food Control , 21-28.
Zhao, X., Li, Y., & Flynn, B. (2013). The Financial Impact of Product Recalls in China. International Journal of Production Economics , 115-123.

44

WORKING PAPERS IN ECONOMICS AND FINANCE
School of Economics and Finance | Victoria Business School | www.victoria.ac.nz/sef