Embed Size (px)
Citation preview
THE TRADE EFFECTS OF EUROPEAN ANTIDUMPING POLICYArastou Khatibi Arastou Khatibi ([email protected]) is a Research Associate at ECIPE.
ABSTRACT
This paper empirically studies the effects of European antidumping actions on import diversion from import-ers named in an antidumping investigation, and potentially subject to protectionist measures, to countries not named in the investigation and European domestic suppliers. For this purpose, a unique data set is used at the 8-digit product level. The amount of import diversion from named countries to the EU domestic market can be read as how well antidumping policy benefits EU producers. This paper shows that although antidumping protection predominantly benefits the EU domestic market rather than non-named countries, it is not strong enough to offset the decrease in imports from named countries. In addition, using a measure based on Balassa’s index of revealed comparative advantage, trade effects where EU suppliers have a comparative advantage versus a disadvantage are also examined. When EU members reveal a comparative disadvantage, antidumping becomes more restrictive for named countries, and there is no evidence of trade diversion to non-named countries. Conse-quently, the overall trade depressing effect is stronger. On the other hand, the analysis provides some evidence that intra-EU trade activity becomes more intensive, suggesting that antidumping protection is good for disad-vantaged products.
ECIPE WORKING PAPER • No. 07/2009
www.ecipe.org
[email protected] Rue Belliard 4-6, 1040 Brussels, Belgium Phone +32 (0)2 289 1350
JEL Code: F13, L5, L13
Keywords: Antidumping measures, Trade Diversion, Revealed Comparative Advantage.
2
ECIPE WORKING PAPER
No. 07/2009
1. INTRODUCTION
Antidumping actions have emerged as one of the most widespread policies used by countries to relieve their import competing industries. The World Trade Organization has recently reported that during the period of January to June 2008 the number of initiations of new antidumping in-vestigations has sharply increased by 39%, compared to the same period in 2007. The number of new measures applied has also increased, although to a lesser extent, by 6% compared to 2007. In terms of numbers, 85 new investigations were reported to the WTO, compared to 61 initiations in 2007 and 54 new final antidumping measures were applied, compared to 51 reported in 2007.1 The rise in antidumping action comes at a time where negotiations within the WTO are moving towards a considerable liberalization of tariff barriers. However, antidumping protection allows considerable discretion over when and how to implement this policy. This typically gives rise to a more complex and less transparent tool than traditional tariff protection, creating trade effects that are difficult to understand.
Antidumping protection can only be imposed on products with an 8-digit Harmonized System Code coming from countries that are named by the import competing industry in an affirmative antidumping case and it has the effect of reducing their imports. The main question that arises is whether it is the domestic market that benefits from antidumping, or are imports from named countries simply being replaced by imports from non-named countries that are not subject to investigations? The aim of this paper is to provide new insights into this question for the case of European antidumping policy.
By now there is a large body of empirical work (Prusa 1997; Lasagni 2000; Brenton 2001; Kon-ings et al 2001; Niels 2003; Ganguli 2008, Malhorta et al 2008a, 2008b) that examines the trade effects of antidumping policy. All of these works conclude that antidumping measures on named countries cause a considerable drop in their exports. But the extent to which trade is diverted from named to non-named countries is still an empirical issue and depends very much on the country imposing the law and on the sector receiving the benefit. For the US, Prusa (1997) shows that antidumping measures cause substantial trade diversion from named to non-named countries making antidumping policy ineffective in protecting its domestic producers. A more recent study by Malhorta, Rus and Kassam (2008) uses data on US agricultural commodities to show that for this particular sector trade diversion is low, thus making the point that antidumping policy is rather an effective protectionist tool. For Europe, Lasagni (2000) and Konings, Springael and Vandenbussche (2001) provide evidence that trade diversion in general is low and that antidump-ing is good at protecting the EU market. Nevertheless, Konings, Springael and Vandenbussche (2001) provide evidence of significant trade diversion in highly concentrated sectors, but show that the effect is not strong enough to offset protection. Other studies on Mexico (Niels 2003), Canada (Malhorta and Rus 2007) and India (Ganguli 2008) reveal that trade diversion is low, mak-ing antidumping policy effective as a protectionist measure.
Although the empirical work has provided excellent analysis and measurement of trade diversion from named to non-named, the trade effects of antidumping on domestic producers is still an ongoing and open empirical question. The only study to date is by Konings and Vandenbussche (2008) who use EU firm-level data to estimate the effect of antidumping protection on the
* The ECIPE Working Paper series presents ongoing research and work in progress. These Working Papers might therefore present preliminary results that have not been subject to the usual review process for ECIPE publications. We welcome feedback and recommend you to send comments directly to the author(s).
3
ECIPE WORKING PAPER
No. 07/2009
productivity of EU protected firms. They provide evidence that the productivity of the average domestic firm improves during the antidumping protection period but remains below that of firms never involved in antidumping cases. This is an important result for policymakers aiming to protect their domestic firms but at present very little is known and further analysis is required.
The major focus of this paper is to estimate the trade effects of antidumping policy on the Euro-pean market. Special attention goes to intra-European imports because they provide a good proxy for analyzing the effects of antidumping measures upon European domestic suppliers. The results that emerge from this paper show that antidumping protection does in general cause trade diver-sion, and it predominantly favours intra-EU trade over non-named countries’ imports. In spite of this, trade diversion is never sufficient to offset the decrease in imports from named countries. Furthermore, by examining the trade effects for products in which EU producers have a compara-tive advantage versus a comparative disadvantage another result emerges. For products which the EU producers reveal a comparative disadvantage, antidumping is not effective in protecting the EU market. It is shown that named countries experience a strong and significant reduction of imports into the EU and that trade diversion to the EU market and non-named countries is non-existent, implying that antidumping has strong trade depressing effects.
This paper is not the first to study the effects of antidumping policy on intra-European trade. Brenton (2001) has previously studied to what extent antidumping cases by the European Union divert trade towards non-named foreign countries versus EU suppliers. His results reveal that trade is diverted to non-named countries only but the study remains rather inconclusive. His study is in sharp contrast to this present paper and other studies carried out for the EU by Lasagni (2000) and Konings, Springael and Vandenbussche (2001).
2. THE DATA
To examine the trade effects that result from European antidumping investigations, a time-series trade data was constructed for all cases initiated between 1997 and 2002. The antidumping cases identified were collected from Chad Bown’s Global Antidumping Database version 3.0. After dropping cases for which no complete time series could be constructed, the final dataset used consists of 194 antidumping initiations of which 96 ended in the imposition of duties (49%), 30 in price-undertaking (16%) and 68 investigations were terminated (35%). For each antidumping initiation, the annual trade data was collected from EUROSTAT by using the 8-digit Harmonized System (HS) Code for each product mentioned in the investigations. At product (HS code) level, 514 products were reviewed in antidumping petitions during the period 1997-2002. For each product, import values by country of origin were collected for eight consecutive years, including one year prior to the initiation, the year of initiation, the period of investigation following the initiation (which is on average twelve months), and the period of protection (which is five years if the investigation is concluded affirmative). In order to compare imports over time, the time series were deflated using GDP-price deflators.
Note that for the antidumping investigation period mentioned above, the actual data collected runs from 1996 to 2007. During this period, the European Union has increased from 15 members to 27 member countries in 2007. This potentially causes some problems, because the market size is not constant throughout the analysis. In order to avoid dealing with increases in market size, the EU domestic market considered is the EU-15 member countries. The extra and intra trade values for the EU-15 are provided by EUROSTAT and therefore facilitate the analysis significantly.
The set of countries subject to the EU antidumping investigations between 1997 and 2002 con-
4
ECIPE WORKING PAPER
No. 07/2009
sists of a total of 45 countries. Table 1 details the countries most frequently involved in anti-dumping petitions by the European Union. The top three most frequently targeted countries are China, which leads the tally by being named 26 times over the sample, followed by India with 18 and South Korea with 16. It is interesting to note the predominance of developing countries in antidumping investigations as opposed to industrialized countries. Notably, this pattern does not seem to be as true when considering antidumping actions by developing countries. Recent stud-ies on the trade effects of antidumping policy in Mexico (Niels 2003) and India (Ganguli 2008) indicate that industrialized nations such as the US and EU are frequently named in investigations. Whatever the motivation, such behaviour might suggest that antidumping is being employed inappropriately worldwide.
TABLE 1. COUNTRIES MOST FREQUENTLY NAMED, 1997–2002
EXPORTING COUNTRY NUMBER OF CASES % OF CASES
China 26 13India 18 9South Korea 16 8Taiwan 11 6Russia 10 5Malaysia 7 4Poland 7 4Thailand 7 4Turkey 7 4Ukraine 7 4USA 7 4
Table 2 gives an overview of the European sectors (NACE 2 digit classification) covered by the antidumping investigations. Chemical products, the manufacture of basic metals and fabricated metal products together account for almost 70% of the antidumping cases.
TABLE 2. SECTORS MOST FREQUENTLY INVOLVED IN AD CASES BETWEEN 1997-2002
SECTOR (NACE 2) % OF CASES
Chemicals and chemical products 31Basic metals 28Radio, television and communication equipment and apparatus 10Fabricated metal products, except machinery and equipment 9Textiles 7Rubber and plastic products 5Wood and products of wood and cork, articles of straw and plaiting materials 4Furniture; manufacturing 2Machinery and equipment 2Non-metallic mineral products 1Food products and beverages 1Coke, refined petroleum products and nuclear fuel 1Electrical machinery and apparatus 1Transport equipment 1
3. THE ECONOMETRIC MODEL
The main objective of econometric analysis is to determine the effect of antidumping duties, price undertakings and the investigations alone on how imports are shifted from named countries to non-named countries and the EU-15 domestic market. The dataset for the econometric analysis
5
ECIPE WORKING PAPER
No. 07/2009
is a pool of 514 products reviewed in antidumping investigations during the period 1997-2002. The basic specification used for the estimation is the one proposed by Konings, Vandenbussche and Springael (2001) and takes the following general form,
The variable lnimportsit denotes the value of the natural log of imports for product i (i=1,..,514)
at time t (t = t0,.., t
6). Time zero, denoted by t
0, corresponds to the year of antidumping initiation.
The period of investigation lasts on average one year, and is denoted by period t1 during which
the outcome of the investigation is still not determined. If the investigation is concluded affirma-tively, the antidumping measure lasts for five years and therefore corresponds to the period t
2 to t
6.
However, during the period of investigation, provisional duties are imposed; hence the protection period runs from t
1 to t
6. Separate equations are estimated for named, non-named and the EU-15
market as well as for different cases in which the EU petitioners asking for protection reveal a comparative advantage versus a comparative disadvantage.
The first explanatory variable, lnimportsi t0-1
, denotes the imports in the year prior to initiation. This variable is included as a control for the initial import size effects and for the evolution of imports prior to the antidumping investigation. The other explanatory variables include a dummy D equal to 1 if a duty is imposed for the product under review, a dummy U equal to 1 if there is a price undertaking and a dummy T if the antidumping case is terminated by the commission.
To complete the estimation, year and industry sector dummies (not represented in the above equation) are also included as a control for unobserved fixed effects. Calendar year dummies are included as a control for macroeconomic influences, such as business cycles and also for the EU enlargement effects. As for industry unobserved fixed effects, 3-digit NACE sector dummies are used as a control for sector heterogeneity, which takes into account for example any technological changes or seasonal impacts on a particular product.
The main estimation method of model (1) is an OLS with heteroskedastic consistent standard errors. The reason for this lies in the nature of the data. Observations within a case are not in-dependent over time, while observations across different antidumping cases are; hence, when estimating model (1), each case is considered as one cluster. Moreover, Konings, Vandenbussche and Springael (2001) illustrate the presence of a significant number of outliers in terms of import growth. Outliers are extreme values that are very far from the mean of the estimation, which are perhaps due to newcomers in the EU market that have high import growth rates. Following Kon-ings, Vandenbussche and Springael (2001), the technique used to control for outliers is to use a robust regression technique (Hamilton 1991) where outliers are given smaller weighting relative to normal observations which are closer to the mean. This estimation technique is essentially used in this paper as a robustness check for the OLS estimation.
4. THE RESULTS
Table 3 shows the result of the OLS with heteroskedastic consistent standard errors for named and non-named countries, the EU-15 market, and overall trade, i.e. total imports of the named, non-named and EU countries. The reason for considering all the groups together is to illustrate whether or not antidumping measures have overall trade depressing effects. Table 4 shows the results with the robust regression, which is used as a robustness check for table 3.
6
Table 2. Sectors most frequently involved in AD cases between 1997-2002
Sector (Nace 2) % of cases
Chemicals and chemical products 31
Basic metals 28
Radio, television and communication equipment and apparatus 10
Fabricated metal products, except machinery and equipment 9
Textiles 7
Rubber and plastic products 5
Wood and products of wood and cork, articles of straw and plaiting materials 4
Furniture; manufacturing 2
Machinery and equipment 2
Non-metallic mineral products 1
Food products and beverages 1
Coke, refined petroleum products and nuclear fuel 1
Electrical machinery and apparatus 1
Transport equipment 1
3. The Econometric Model
The main objective of econometric analysis is to determine the effect of antidumping
duties, price undertakings and the investigations alone on how imports are shifted
from named countries to non-named countries and the EU-15 domestic market. The
dataset for the econometric analysis is a pool of 514 products reviewed in
antidumping investigations during the period 1997-2002. The basic specification used
for the estimation is the one proposed by Konings, Vandenbussche and Springael
(2001) and takes the following general form,
)1(.
lnln
432
10 10
titititi
titi
TUD
importsimports
++++
+=
The variable lnimportsit denotes the value of the natural log of imports for
product i (i=1,..,514) at time t (t = t0,.., t6). Time zero, denoted by t0, corresponds to
the year of antidumping initiation. The period of investigation lasts on average one
year, and is denoted by period t1 during which the outcome of the investigation is still
not determined. If the investigation is concluded affirmatively, the antidumping
measure lasts for five years and therefore corresponds to the period t2 to t6. However,
during the period of investigation, provisional duties are imposed; hence the
protection period runs from t1 to t6. Separate equations are estimated for named, non-
named and the EU-15 market as well as for different cases in which the EU
petitioners asking for protection reveal a comparative advantage versus a comparative
disadvantage.
6
ECIPE WORKING PAPER
No. 07/2009
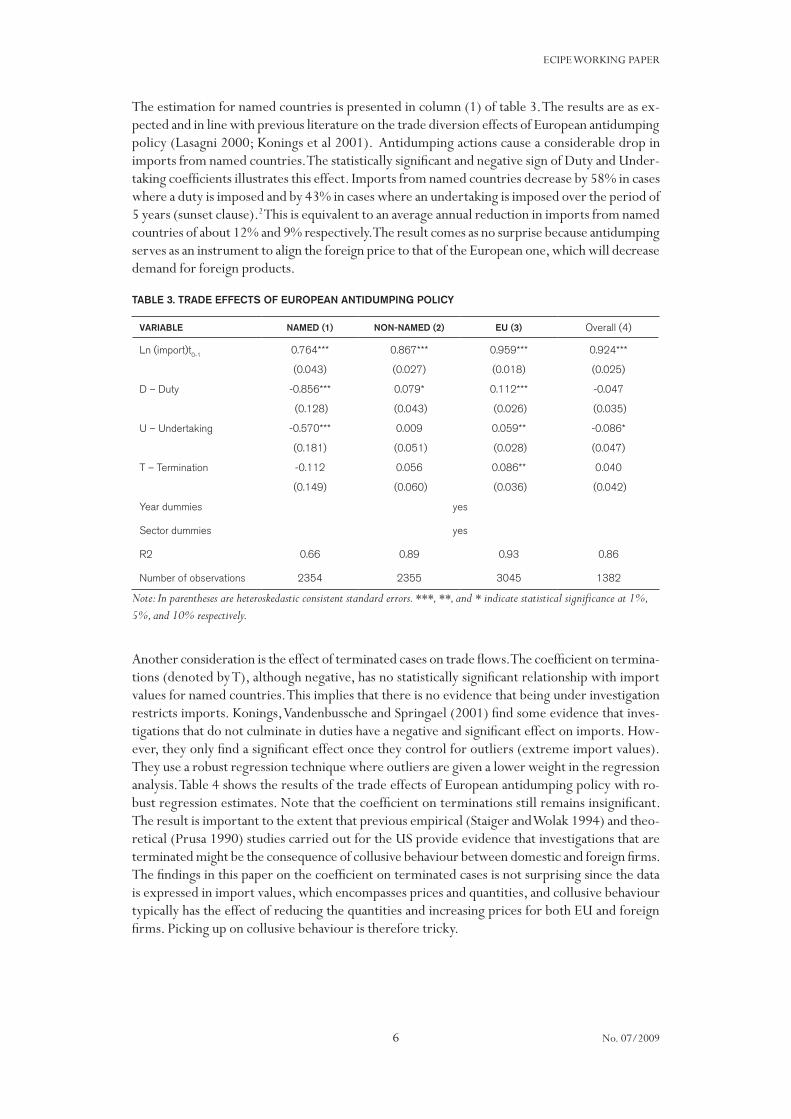
The estimation for named countries is presented in column (1) of table 3. The results are as ex-pected and in line with previous literature on the trade diversion effects of European antidumping policy (Lasagni 2000; Konings et al 2001). Antidumping actions cause a considerable drop in imports from named countries. The statistically significant and negative sign of Duty and Under-taking coefficients illustrates this effect. Imports from named countries decrease by 58% in cases where a duty is imposed and by 43% in cases where an undertaking is imposed over the period of 5 years (sunset clause).2 This is equivalent to an average annual reduction in imports from named countries of about 12% and 9% respectively. The result comes as no surprise because antidumping serves as an instrument to align the foreign price to that of the European one, which will decrease demand for foreign products.
TABLE 3. TRADE EFFECTS OF EUROPEAN ANTIDUMPING POLICY
VARIABLE NAMED (1) NON-NAMED (2) EU (3) Overall (4)
Ln (import)t0-1 0.764*** 0.867*** 0.959*** 0.924***
(0.043) (0.027) (0.018) (0.025)
D – Duty -0.856*** 0.079* 0.112*** -0.047
(0.128) (0.043) (0.026) (0.035)
U – Undertaking -0.570*** 0.009 0.059** -0.086*
(0.181) (0.051) (0.028) (0.047)
T – Termination -0.112 0.056 0.086** 0.040
(0.149) (0.060) (0.036) (0.042)
Year dummies yes
Sector dummies yes
R2 0.66 0.89 0.93 0.86
Number of observations 2354 2355 3045 1382
Note: In parentheses are heteroskedastic consistent standard errors. ***, **, and * indicate statistical significance at 1%, 5%, and 10% respectively.
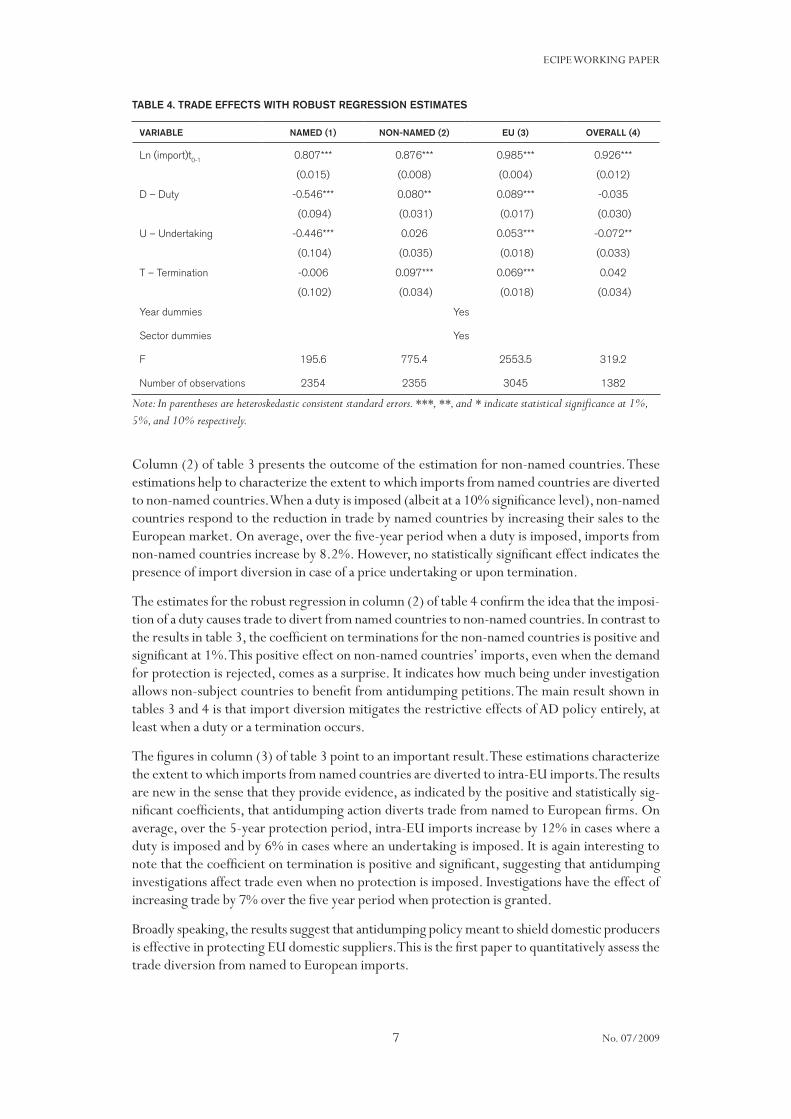
Another consideration is the effect of terminated cases on trade flows. The coefficient on termina-tions (denoted by T), although negative, has no statistically significant relationship with import values for named countries. This implies that there is no evidence that being under investigation restricts imports. Konings, Vandenbussche and Springael (2001) find some evidence that inves-tigations that do not culminate in duties have a negative and significant effect on imports. How-ever, they only find a significant effect once they control for outliers (extreme import values). They use a robust regression technique where outliers are given a lower weight in the regression analysis. Table 4 shows the results of the trade effects of European antidumping policy with ro-bust regression estimates. Note that the coefficient on terminations still remains insignificant. The result is important to the extent that previous empirical (Staiger and Wolak 1994) and theo-retical (Prusa 1990) studies carried out for the US provide evidence that investigations that are terminated might be the consequence of collusive behaviour between domestic and foreign firms. The findings in this paper on the coefficient on terminated cases is not surprising since the data is expressed in import values, which encompasses prices and quantities, and collusive behaviour typically has the effect of reducing the quantities and increasing prices for both EU and foreign firms. Picking up on collusive behaviour is therefore tricky.
7
ECIPE WORKING PAPER
No. 07/2009
TABLE 4. TRADE EFFECTS WITH ROBUST REGRESSION ESTIMATES
VARIABLE NAMED (1) NON-NAMED (2) EU (3) OVERALL (4)
Ln (import)t0-1 0.807*** 0.876*** 0.985*** 0.926***
(0.015) (0.008) (0.004) (0.012)
D – Duty -0.546*** 0.080** 0.089*** -0.035
(0.094) (0.031) (0.017) (0.030)
U – Undertaking -0.446*** 0.026 0.053*** -0.072**
(0.104) (0.035) (0.018) (0.033)
T – Termination -0.006 0.097*** 0.069*** 0.042
(0.102) (0.034) (0.018) (0.034)
Year dummies Yes
Sector dummies Yes
F 195.6 775.4 2553.5 319.2
Number of observations 2354 2355 3045 1382
Note: In parentheses are heteroskedastic consistent standard errors. ***, **, and * indicate statistical significance at 1%, 5%, and 10% respectively.
Column (2) of table 3 presents the outcome of the estimation for non-named countries. These estimations help to characterize the extent to which imports from named countries are diverted to non-named countries. When a duty is imposed (albeit at a 10% significance level), non-named countries respond to the reduction in trade by named countries by increasing their sales to the European market. On average, over the five-year period when a duty is imposed, imports from non-named countries increase by 8.2%. However, no statistically significant effect indicates the presence of import diversion in case of a price undertaking or upon termination.
The estimates for the robust regression in column (2) of table 4 confirm the idea that the imposi-tion of a duty causes trade to divert from named countries to non-named countries. In contrast to the results in table 3, the coefficient on terminations for the non-named countries is positive and significant at 1%. This positive effect on non-named countries’ imports, even when the demand for protection is rejected, comes as a surprise. It indicates how much being under investigation allows non-subject countries to benefit from antidumping petitions. The main result shown in tables 3 and 4 is that import diversion mitigates the restrictive effects of AD policy entirely, at least when a duty or a termination occurs.
The figures in column (3) of table 3 point to an important result. These estimations characterize the extent to which imports from named countries are diverted to intra-EU imports. The results are new in the sense that they provide evidence, as indicated by the positive and statistically sig-nificant coefficients, that antidumping action diverts trade from named to European firms. On average, over the 5-year protection period, intra-EU imports increase by 12% in cases where a duty is imposed and by 6% in cases where an undertaking is imposed. It is again interesting to note that the coefficient on termination is positive and significant, suggesting that antidumping investigations affect trade even when no protection is imposed. Investigations have the effect of increasing trade by 7% over the five year period when protection is granted.
Broadly speaking, the results suggest that antidumping policy meant to shield domestic producers is effective in protecting EU domestic suppliers. This is the first paper to quantitatively assess the trade diversion from named to European imports.
8
ECIPE WORKING PAPER
No. 07/2009
A final consideration worth studying is how total imports from named, non-named and European countries are affected by antidumping policy. The imposition of a duty reduces imports by 58% from named countries and increases imports by 8.2% from non-named countries and by 12% from EU-15 member countries. Whereas the imposition of a price undertaking reduces imports by 43% from named countries and increases trade from EU-15 countries by 6%. A price under-taking does not have a significant effect on the imports from non-named countries. Column (4) of table 3 shows the estimation of total import values. The results reveal that in cases where a duty is imposed, antidumping policy does not affect overall trade significantly, but when a price undertaking is imposed, albeit at a 10% significance level, overall trade is depressed by -8% over the protection period. Note that this decrease in overall trade flows is affected by the low trade diversion from named to non-named countries.
5. THE ROLE OF REVEALED COMPARATIVE ADVANTAGE VERSUS DISADVANTAGE
This section provides estimations of trade effects of antidumping policy for cases in which European producers reveal a comparative advantage versus a comparative disadvantage against imports from all foreign countries. The role of competitiveness in trade diversion is tested for in tables 5 and 6, where estimates are provided for products for which the EU reveals a comparative advantage (table 5) versus a comparative disadvantage (table 6). The measure of competitiveness is based on Balassa’s (1965) revealed comparative advantage (RCA) index.
Balassa argued that comparative advantage is revealed through the examination of trade patterns. Balassa’s index of revealed comparative advantage is obtained by dividing a country’s share of export for a given commodity by that of the world’s share of exports in that commodity. The index reveals a comparative disadvantage if 0 < index < 1, and a comparative advantage if index > 1. In the unfortunate case that the index is equal to one, not much can be revealed. The notion of competitiveness used in this section is somewhat different. Since the database consists of imports, import values are used to reveal the competitiveness of European producers with respect to for-eign producers. More specifically, the index used is expressed as follows:
where
�
RCAEUi denotes the revealed comparative advantage index of the EU-15 producers for
product i (i=1,..,514) with respect to named and non-named countries.
11
shows the estimation of total import values. The results reveal that in cases where a
duty is imposed, antidumping policy does not affect overall trade significantly, but
when a price undertaking is imposed, albeit at a 10% significance level, overall trade
is depressed by -8% over the protection period. Note that this decrease in overall trade
flows is affected by the low trade diversion from named to non-named countries.
5. The Role of Revealed Comparative Advantage versus Disadvantage
This section provides estimations of trade effects of antidumping policy for cases in
which European producers reveal a comparative advantage versus a comparative
disadvantage against imports from all foreign countries. The role of competitiveness
in trade diversion is tested for in tables 5 and 6, where estimates are provided for
products for which the EU reveals a comparative advantage (table 5) versus a
comparative disadvantage (table 6). The measure of competitiveness is based on
Balassa’s (1965) revealed comparative advantage (RCA) index.
Balassa argued that comparative advantage is revealed through the
examination of trade patterns. Balassa’s index of revealed comparative advantage is
obtained by dividing a country’s share of export for a given commodity by that of the
world’s share of exports in that commodity. The index reveals a comparative
disadvantage if 0 < index < 1, and a comparative advantage if index > 1. In the
unfortunate case that the index is equal to one, not much can be revealed. The notion
of competitiveness used in this section is somewhat different. Since the database
consists of imports, import values are used to reveal the competitiveness of European
producers with respect to foreign producers. More specifically, the index used is
expressed as follows:
RCAEU
i=M
EU 15
i
MEU 15
(MEU 15
i+ M
Named
i+ M
Non named
i)
(MEU 15 + MNamed
+ MNon named
)
where RCAEU
i denotes the revealed comparative advantage index of the EU-15
producers for product i (i=1,..,514) with respect to named and non-named countries.
MEU 15
i , MNamed
i and MNon named
i are respectively the intra-EU, named and non-named
countries’ imports for product i . Import values without the superscript i indicate total
imports, i.e. across all products. The reasoning behind the measure is simple. The
,
�
MNamedi and
11
shows the estimation of total import values. The results reveal that in cases where a
duty is imposed, antidumping policy does not affect overall trade significantly, but
when a price undertaking is imposed, albeit at a 10% significance level, overall trade
is depressed by -8% over the protection period. Note that this decrease in overall trade
flows is affected by the low trade diversion from named to non-named countries.
5. The Role of Revealed Comparative Advantage versus Disadvantage
This section provides estimations of trade effects of antidumping policy for cases in
which European producers reveal a comparative advantage versus a comparative
disadvantage against imports from all foreign countries. The role of competitiveness
in trade diversion is tested for in tables 5 and 6, where estimates are provided for
products for which the EU reveals a comparative advantage (table 5) versus a
comparative disadvantage (table 6). The measure of competitiveness is based on
Balassa’s (1965) revealed comparative advantage (RCA) index.
Balassa argued that comparative advantage is revealed through the
examination of trade patterns. Balassa’s index of revealed comparative advantage is
obtained by dividing a country’s share of export for a given commodity by that of the
world’s share of exports in that commodity. The index reveals a comparative
disadvantage if 0 < index < 1, and a comparative advantage if index > 1. In the
unfortunate case that the index is equal to one, not much can be revealed. The notion
of competitiveness used in this section is somewhat different. Since the database
consists of imports, import values are used to reveal the competitiveness of European
producers with respect to foreign producers. More specifically, the index used is
expressed as follows:
RCAEU
i=M
EU 15
i
MEU 15
(MEU 15
i+ M
Named
i+ M
Non named
i)
(MEU 15 + MNamed
+ MNon named
)
where RCAEU
i denotes the revealed comparative advantage index of the EU-15
producers for product i (i=1,..,514) with respect to named and non-named countries.
MEU 15
i , MNamed
i and MNon named
i are respectively the intra-EU, named and non-named
countries’ imports for product i . Import values without the superscript i indicate total
imports, i.e. across all products. The reasoning behind the measure is simple. The
are respectively the intra-EU, named and non-named countries’ imports for product i . Import values without the superscript i indicate total imports, i.e. across all products. The reasoning behind the measure is simple. The index compares the share of intra-EU imports for product i with the world’s share of imports in the EU market. So the index reveals a comparative disadvantage in product
�
i with respect to named and non-named countries if
�
0 < RCAEUi <1,
while it reveals a comparative advantage in product
�
i if
�
RCAEUi >1.
The index is used to cut off the sample between two groups – products for which EU producers have a competitive advantage and others for which they have a comparative disadvantage. Tables 5 and 6 below show the results of estimations to test whether antidumping actions have different impacts depending on whether the petitioning firms have a comparative advantage or not.
At this point, a technical consideration needs to be made. The index of comparative advantage
11
shows the estimation of total import values. The results reveal that in cases where a
duty is imposed, antidumping policy does not affect overall trade significantly, but
when a price undertaking is imposed, albeit at a 10% significance level, overall trade
is depressed by -8% over the protection period. Note that this decrease in overall trade
flows is affected by the low trade diversion from named to non-named countries.
5. The Role of Revealed Comparative Advantage versus Disadvantage
This section provides estimations of trade effects of antidumping policy for cases in
which European producers reveal a comparative advantage versus a comparative
disadvantage against imports from all foreign countries. The role of competitiveness
in trade diversion is tested for in tables 5 and 6, where estimates are provided for
products for which the EU reveals a comparative advantage (table 5) versus a
comparative disadvantage (table 6). The measure of competitiveness is based on
Balassa’s (1965) revealed comparative advantage (RCA) index.
Balassa argued that comparative advantage is revealed through the
examination of trade patterns. Balassa’s index of revealed comparative advantage is
obtained by dividing a country’s share of export for a given commodity by that of the
world’s share of exports in that commodity. The index reveals a comparative
disadvantage if 0 < index < 1, and a comparative advantage if index > 1. In the
unfortunate case that the index is equal to one, not much can be revealed. The notion
of competitiveness used in this section is somewhat different. Since the database
consists of imports, import values are used to reveal the competitiveness of European
producers with respect to foreign producers. More specifically, the index used is
expressed as follows:
RCAEU
i=M
EU 15
i
MEU 15
(MEU 15
i+ M
Named
i+ M
Non named
i)
(MEU 15 + MNamed
+ MNon named
)
where RCAEU
i denotes the revealed comparative advantage index of the EU-15
producers for product i (i=1,..,514) with respect to named and non-named countries.
MEU 15
i , MNamed
i and MNon named
i are respectively the intra-EU, named and non-named
countries’ imports for product i . Import values without the superscript i indicate total
imports, i.e. across all products. The reasoning behind the measure is simple. The
9
ECIPE WORKING PAPER
No. 07/2009
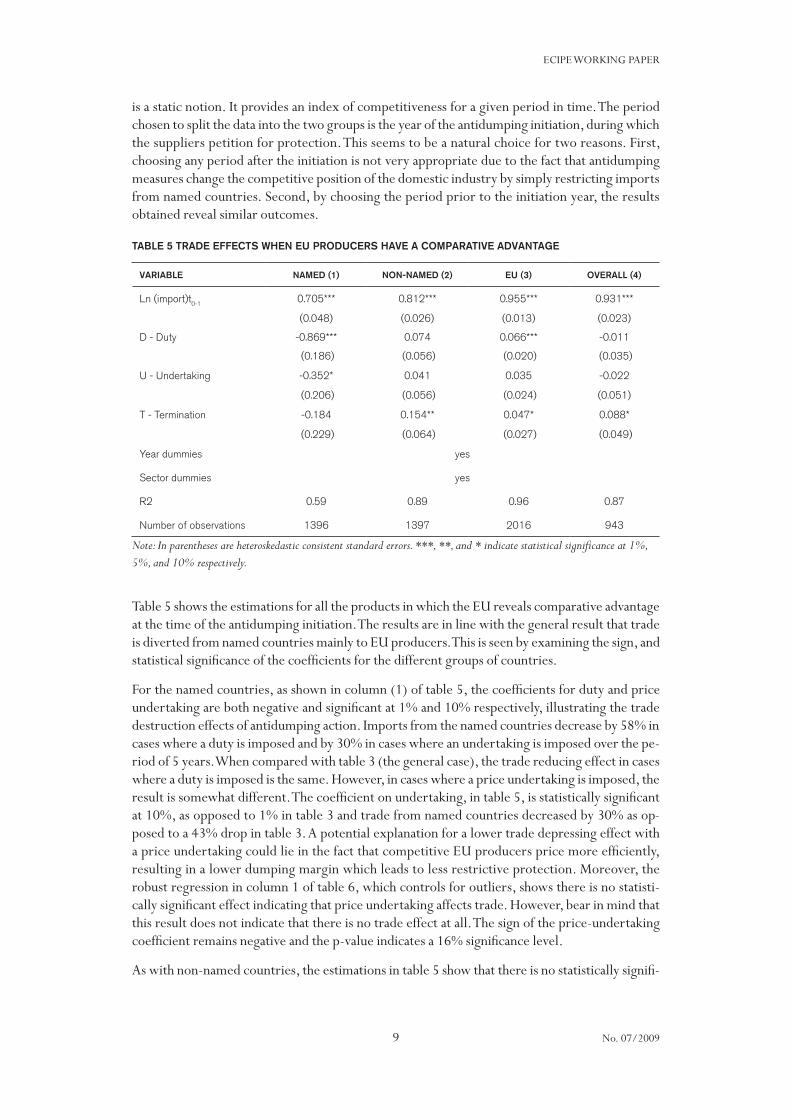
is a static notion. It provides an index of competitiveness for a given period in time. The period chosen to split the data into the two groups is the year of the antidumping initiation, during which the suppliers petition for protection. This seems to be a natural choice for two reasons. First, choosing any period after the initiation is not very appropriate due to the fact that antidumping measures change the competitive position of the domestic industry by simply restricting imports from named countries. Second, by choosing the period prior to the initiation year, the results obtained reveal similar outcomes.
TABLE 5 TRADE EFFECTS WHEN EU PRODUCERS HAVE A COMPARATIVE ADVANTAGE
VARIABLE NAMED (1) NON-NAMED (2) EU (3) OVERALL (4)
Ln (import)t0-1 0.705*** 0.812*** 0.955*** 0.931***
(0.048) (0.026) (0.013) (0.023)
D - Duty -0.869*** 0.074 0.066*** -0.011
(0.186) (0.056) (0.020) (0.035)
U - Undertaking -0.352* 0.041 0.035 -0.022
(0.206) (0.056) (0.024) (0.051)
T - Termination -0.184 0.154** 0.047* 0.088*
(0.229) (0.064) (0.027) (0.049)
Year dummies yes
Sector dummies yes
R2 0.59 0.89 0.96 0.87
Number of observations 1396 1397 2016 943
Note: In parentheses are heteroskedastic consistent standard errors. ***, **, and * indicate statistical significance at 1%, 5%, and 10% respectively.
Table 5 shows the estimations for all the products in which the EU reveals comparative advantage at the time of the antidumping initiation. The results are in line with the general result that trade is diverted from named countries mainly to EU producers. This is seen by examining the sign, and statistical significance of the coefficients for the different groups of countries.
For the named countries, as shown in column (1) of table 5, the coefficients for duty and price undertaking are both negative and significant at 1% and 10% respectively, illustrating the trade destruction effects of antidumping action. Imports from the named countries decrease by 58% in cases where a duty is imposed and by 30% in cases where an undertaking is imposed over the pe-riod of 5 years. When compared with table 3 (the general case), the trade reducing effect in cases where a duty is imposed is the same. However, in cases where a price undertaking is imposed, the result is somewhat different. The coefficient on undertaking, in table 5, is statistically significant at 10%, as opposed to 1% in table 3 and trade from named countries decreased by 30% as op-posed to a 43% drop in table 3. A potential explanation for a lower trade depressing effect with a price undertaking could lie in the fact that competitive EU producers price more efficiently, resulting in a lower dumping margin which leads to less restrictive protection. Moreover, the robust regression in column 1 of table 6, which controls for outliers, shows there is no statisti-cally significant effect indicating that price undertaking affects trade. However, bear in mind that this result does not indicate that there is no trade effect at all. The sign of the price-undertaking coefficient remains negative and the p-value indicates a 16% significance level.
As with non-named countries, the estimations in table 5 show that there is no statistically signifi-
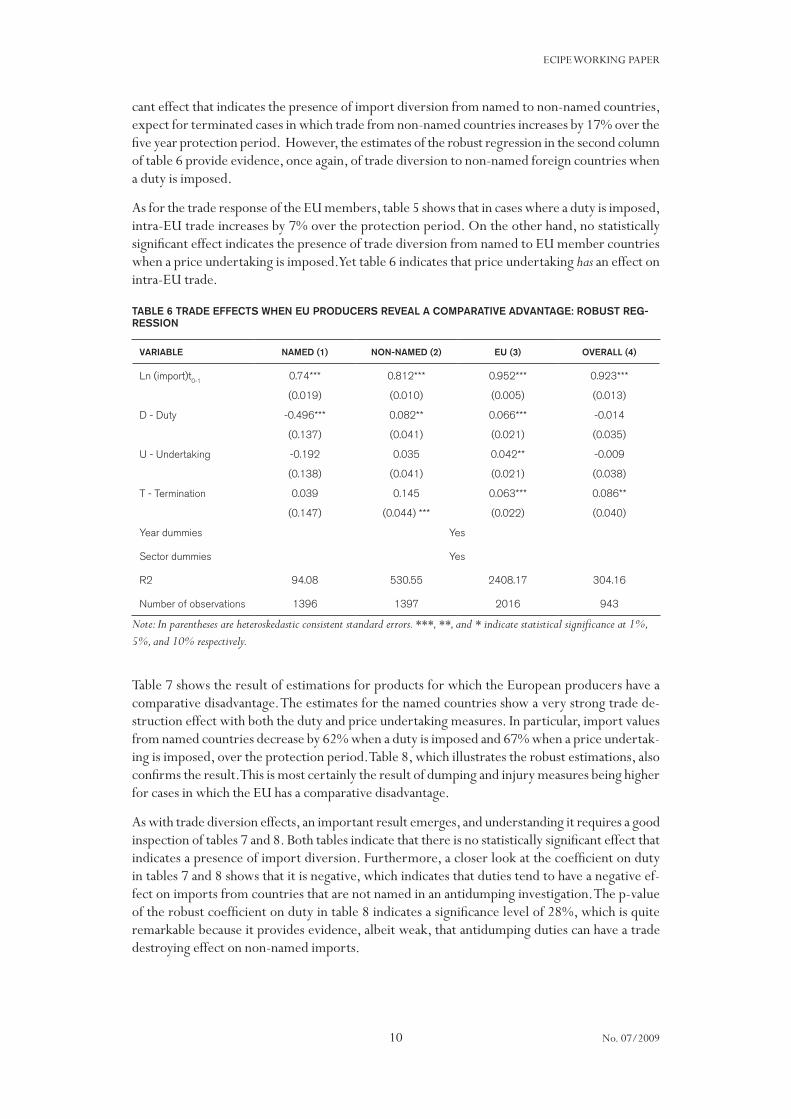
10
ECIPE WORKING PAPER
No. 07/2009
cant effect that indicates the presence of import diversion from named to non-named countries, expect for terminated cases in which trade from non-named countries increases by 17% over the five year protection period. However, the estimates of the robust regression in the second column of table 6 provide evidence, once again, of trade diversion to non-named foreign countries when a duty is imposed.
As for the trade response of the EU members, table 5 shows that in cases where a duty is imposed, intra-EU trade increases by 7% over the protection period. On the other hand, no statistically significant effect indicates the presence of trade diversion from named to EU member countries when a price undertaking is imposed. Yet table 6 indicates that price undertaking has an effect on intra-EU trade.
TABLE 6 TRADE EFFECTS WHEN EU PRODUCERS REVEAL A COMPARATIVE ADVANTAGE: ROBUST REG-RESSION
VARIABLE NAMED (1) NON-NAMED (2) EU (3) OVERALL (4)
Ln (import)t0-1 0.74*** 0.812*** 0.952*** 0.923***
(0.019) (0.010) (0.005) (0.013)
D - Duty -0.496*** 0.082** 0.066*** -0.014
(0.137) (0.041) (0.021) (0.035)
U - Undertaking -0.192 0.035 0.042** -0.009
(0.138) (0.041) (0.021) (0.038)
T - Termination 0.039 0.145 0.063*** 0.086**
(0.147) (0.044) *** (0.022) (0.040)
Year dummies Yes
Sector dummies Yes
R2 94.08 530.55 2408.17 304.16
Number of observations 1396 1397 2016 943
Note: In parentheses are heteroskedastic consistent standard errors. ***, **, and * indicate statistical significance at 1%, 5%, and 10% respectively.
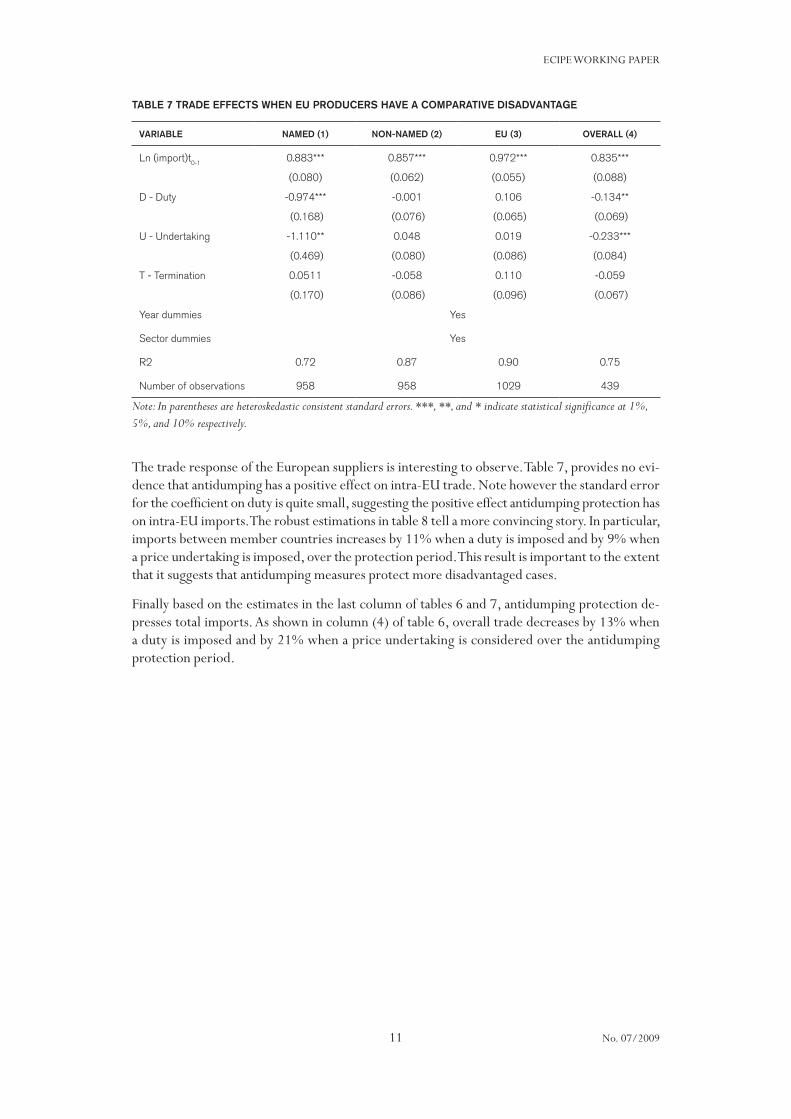
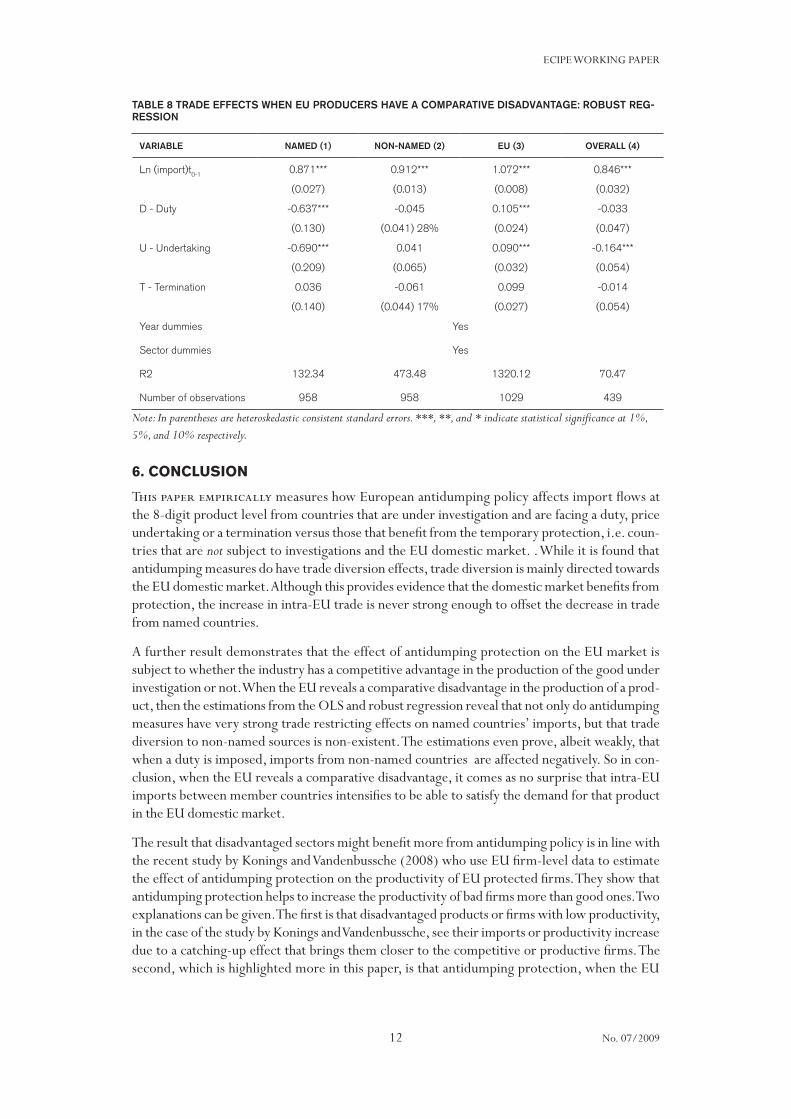
Table 7 shows the result of estimations for products for which the European producers have a comparative disadvantage. The estimates for the named countries show a very strong trade de-struction effect with both the duty and price undertaking measures. In particular, import values from named countries decrease by 62% when a duty is imposed and 67% when a price undertak-ing is imposed, over the protection period. Table 8, which illustrates the robust estimations, also confirms the result. This is most certainly the result of dumping and injury measures being higher for cases in which the EU has a comparative disadvantage.
As with trade diversion effects, an important result emerges, and understanding it requires a good inspection of tables 7 and 8. Both tables indicate that there is no statistically significant effect that indicates a presence of import diversion. Furthermore, a closer look at the coefficient on duty in tables 7 and 8 shows that it is negative, which indicates that duties tend to have a negative ef-fect on imports from countries that are not named in an antidumping investigation. The p-value of the robust coefficient on duty in table 8 indicates a significance level of 28%, which is quite remarkable because it provides evidence, albeit weak, that antidumping duties can have a trade destroying effect on non-named imports.
11
ECIPE WORKING PAPER
No. 07/2009
TABLE 7 TRADE EFFECTS WHEN EU PRODUCERS HAVE A COMPARATIVE DISADVANTAGE
VARIABLE NAMED (1) NON-NAMED (2) EU (3) OVERALL (4)
Ln (import)t0-1 0.883*** 0.857*** 0.972*** 0.835***
(0.080) (0.062) (0.055) (0.088)
D - Duty -0.974*** -0.001 0.106 -0.134**
(0.168) (0.076) (0.065) (0.069)
U - Undertaking -1.110** 0.048 0.019 -0.233***
(0.469) (0.080) (0.086) (0.084)
T - Termination 0.0511 -0.058 0.110 -0.059
(0.170) (0.086) (0.096) (0.067)
Year dummies Yes
Sector dummies Yes
R2 0.72 0.87 0.90 0.75
Number of observations 958 958 1029 439
Note: In parentheses are heteroskedastic consistent standard errors. ***, **, and * indicate statistical significance at 1%, 5%, and 10% respectively.
The trade response of the European suppliers is interesting to observe. Table 7, provides no evi-dence that antidumping has a positive effect on intra-EU trade. Note however the standard error for the coefficient on duty is quite small, suggesting the positive effect antidumping protection has on intra-EU imports. The robust estimations in table 8 tell a more convincing story. In particular, imports between member countries increases by 11% when a duty is imposed and by 9% when a price undertaking is imposed, over the protection period. This result is important to the extent that it suggests that antidumping measures protect more disadvantaged cases.
Finally based on the estimates in the last column of tables 6 and 7, antidumping protection de-presses total imports. As shown in column (4) of table 6, overall trade decreases by 13% when a duty is imposed and by 21% when a price undertaking is considered over the antidumping protection period.
12
ECIPE WORKING PAPER
No. 07/2009
TABLE 8 TRADE EFFECTS WHEN EU PRODUCERS HAVE A COMPARATIVE DISADVANTAGE: ROBUST REG-RESSION
VARIABLE NAMED (1) NON-NAMED (2) EU (3) OVERALL (4)
Ln (import)t0-1 0.871*** 0.912*** 1.072*** 0.846***
(0.027) (0.013) (0.008) (0.032)
D - Duty -0.637*** -0.045 0.105*** -0.033
(0.130) (0.041) 28% (0.024) (0.047)
U - Undertaking -0.690*** 0.041 0.090*** -0.164***
(0.209) (0.065) (0.032) (0.054)
T - Termination 0.036 -0.061 0.099 -0.014
(0.140) (0.044) 17% (0.027) (0.054)
Year dummies Yes
Sector dummies Yes
R2 132.34 473.48 1320.12 70.47
Number of observations 958 958 1029 439
Note: In parentheses are heteroskedastic consistent standard errors. ***, **, and * indicate statistical significance at 1%, 5%, and 10% respectively.
6. CONCLUSION
This paper empirically measures how European antidumping policy affects import flows at the 8-digit product level from countries that are under investigation and are facing a duty, price undertaking or a termination versus those that benefit from the temporary protection, i.e. coun-tries that are not subject to investigations and the EU domestic market. . While it is found that antidumping measures do have trade diversion effects, trade diversion is mainly directed towards the EU domestic market. Although this provides evidence that the domestic market benefits from protection, the increase in intra-EU trade is never strong enough to offset the decrease in trade from named countries.
A further result demonstrates that the effect of antidumping protection on the EU market is subject to whether the industry has a competitive advantage in the production of the good under investigation or not. When the EU reveals a comparative disadvantage in the production of a prod-uct, then the estimations from the OLS and robust regression reveal that not only do antidumping measures have very strong trade restricting effects on named countries’ imports, but that trade diversion to non-named sources is non-existent. The estimations even prove, albeit weakly, that when a duty is imposed, imports from non-named countries are affected negatively. So in con-clusion, when the EU reveals a comparative disadvantage, it comes as no surprise that intra-EU imports between member countries intensifies to be able to satisfy the demand for that product in the EU domestic market.
The result that disadvantaged sectors might benefit more from antidumping policy is in line with the recent study by Konings and Vandenbussche (2008) who use EU firm-level data to estimate the effect of antidumping protection on the productivity of EU protected firms. They show that antidumping protection helps to increase the productivity of bad firms more than good ones. Two explanations can be given. The first is that disadvantaged products or firms with low productivity, in the case of the study by Konings and Vandenbussche, see their imports or productivity increase due to a catching-up effect that brings them closer to the competitive or productive firms. The second, which is highlighted more in this paper, is that antidumping protection, when the EU
13
ECIPE WORKING PAPER
No. 07/2009
reveals a comparative disadvantage, restricts trade a lot more from named countries without di-verting it to non-named sources, and this could potentially explain why trade between member countries can be more intensive.
FOOTNOTES1. www.wto.org
2. Throughout the paper, the percentage values are calculated as [exp(Value of Coefficient)-1]. So for example, in table 3, the coefficient of Duty is -0.856 and therefore the trade effect is calculated as [exp(-0.856)-1 = 57 %].
REFERENCES
Balassa, B. 1965. Trade Liberalization and ‘Revealed’ Comparative Advantage. Manchester School of Economics and Social Studies. 33 pp. 99-123.
Brenton, P. 2001. Anti-dumping Policies in the EU and Trade Diversion. European Journal of Political Economy. 17 pp. 593-607.
Ganguli B. 2008. The Trade Effects of Indian Antidumping Actions. Review of International Economics. 16(5) pp. 930-941.
Hamilton, L.C. 1991. How robust is Robust Regression? Stata Technical Bulletin. 2 pp. 21-26.
Hillman, A. L. 1982. Declining Industries and Political-Support Protectionist Motives. American Economic Review. 72(5) pp. 1180-1187.
Konings J. and Vandenbussche H. 2008. Heterogeneous Responses of Firms to Trade Protection. Journal of International Economics. 76 pp. 371-383.
Konings, J., Vandenbussche, H., and Springael, L. 2001. Import Diversion under European An-tidumping Policy. Journal of Industry, Competition and Trade. 1(3) pp. 283-299.
Lasagni, A. 2000. Does Country-targeted Anti-dumping Policy by the EU Create Trade Diversion. Journal of World Trade. 34(4) pp. 137-159.
Magee, C. 2002. Declining Industries and Persistent Tariff Protection. Review of International Eco-nomics. 10(4) pp. 749-762.
Malhotra, N., Kassam, S. and Rus, H. 2008a. Effectiveness of the Canadian Antidumping Regime. forthcoming Canadian Public Policy.
Malhotra, N., Kassam, S. and Rus, H. 2008b. Antidumping Duties in the Agriculture Sector: Trade Restricting or Trade Deflecting? Global Economy Journal, Trade and Finance Association. 8(2).
Niels, G. 2003. Trade Diversion and Destruction Effects of Antidumping Policy: Empirical Evidence from Mexico. Work in Progress, European Trade Study Group
Prusa, T. 1992. Why are so many antidumping petitions withdrawn? Journal of International Eco-nomics. 33 pp. 1-20.
Prusa, T. 1997. The Trade effects of US Antidumping Actions. In Robert Feenstra (ed.), The effects of US trade protection and promotion policies. University of Chicago Press: Chicago.