Embed Size (px)
Citation preview
Tournament Records 82Tournament History Rankings 94Tournament Scoring Leaders 96Seeds History 103Yearly Totals 115Conference Won-Lost Records 119Tournament Field by State 130Televised College Basketball Games 132Tournament Facts 133Team-By-Team Won-Lost Records 140
THE TOURNAMENT
Tournament Records 82
TOURNAMENT RECORDSA national championship game is indi-cated by (CH), national semifinal game by (NSF), national third-place game by (N3d), regional final game by (RF), regional semifinal game by (RSF), regional third-place game by (R3d), second-round game by (2d R), first-round game by (1st R), opening-round/First Four game by (OR/FF), and later vacated by (*).
INDIVIDUAL GAMEPoints
61, Austin Carr, Notre Dame vs. Ohio, 1st R, 3-7-1970
58, Bill Bradley, Princeton vs. Wichita St., N3d, 3-20-1965
56, Oscar Robertson, Cincinnati vs. Arkansas, R3d, 3-15-1958
52, Austin Carr, Notre Dame vs. Kentucky, RSF, 3-12-1970
52, Austin Carr, Notre Dame vs. TCU, 1st R, 3-13-1971
50, David Robinson, Navy vs. Michigan, 1st R, 3-12-1987
49, Elvin Hayes, Houston vs. Loyola Chicago, 1st R, 3-9-1968
48, Hal Lear, Temple vs. SMU, N3d, 3-23-195647, Austin Carr, Notre Dame vs. Houston, R3d,
3-20-197146, Dave Corzine, DePaul vs. Louisville, RSF,
3-17-1978 (2 OT)45, Bob Houbregs, Washington vs. Seattle U.,
RSF, 3-13-195345, Austin Carr, Notre Dame vs. Iowa, R3d,
3-14-197045, Bo Kimble, Loyola Marymount vs. New
Mexico St., 1st R, 3-16-199044, Clyde Lovellette, Kansas vs. Saint Louis, RF,
3-22-195244, Rod Thorn, West Virginia vs. Saint Joseph’s,
RSF, 3-15-196344, Dan Issel, Kentucky vs. Notre Dame, RSF,
3-12-197044, Bill Walton, UCLA vs. Memphis, CH, 3-26-
197344, Hersey Hawkins, Bradley vs. Auburn, 1st R,
3-17-198844, Travis Mays, Texas vs. Georgia, 1st R, 3-17-
199044, Glenn Robinson, Purdue vs. Kansas, RSF,
3-24-1994
Points by Two Teammates85, Austin Carr (61) and Collis Jones (24), Notre
Dame vs. Ohio, 1st R, 3-7-197078, Austin Carr (52) and Collis Jones (26), Notre
Dame vs. TCU, 1st R, 3-13-197178, Jeff Fryer (41) and Bo Kimble (37), Loyola
Marymount vs. Michigan, 2d R, 3-18-199074, Bill Bradley (58) and Don Rodenbach (16),
Princeton vs. Wichita St., N3d, 3-20-196574, Austin Carr (52) and Collis Jones (22), Notre
Dame vs. Kentucky, RSF, 3-12-1970
Points by Two Opposing Players
96, Austin Carr (52), Notre Dame, and Dan Issel (44), Kentucky, RSF, 3-12-1970
85, Austin Carr (61), Notre Dame, and John Canine (24), Ohio, 1st R, 3-7-1970
85, Austin Carr (47), Notre Dame, and Poo Welch (38), Houston, R3d, 3-20-1971
83, David Robinson (50), Navy, and Garde Thompson (33), Michigan, 1st R, 3-12-1987
80, Hersey Hawkins (44), Bradley, and Chris Morris (36), Auburn, 1st R, 3-17-1988
Field Goals25, Austin Carr, Notre Dame vs. Ohio, 1st R,
3-7-197022, Bill Bradley, Princeton vs. Wichita St., N3d,
3-20-196522, Austin Carr, Notre Dame vs. Kentucky, RSF,
3-12-197022, David Robinson, Navy vs. Michigan, 1st R,
3-12-198721, Oscar Robertson, Cincinnati vs. Arkansas,
R3d, 3-15-195821, Austin Carr, Notre Dame vs. Iowa, R3d,
3-14-197021, Bill Walton, UCLA vs. Memphis, CH, 3-26-
197320, Bob Houbregs, Washington vs. Seattle U.,
RSF, 3-13-195320, Elvin Hayes, Houston vs. Loyola Chicago, 1st
R, 3-9-196820, Austin Carr, Notre Dame vs. TCU, 1st R,
3-13-1971
Field Goals Attempted44, Austin Carr, Notre Dame vs. Ohio, 1st R,
3-7-197042, Lennie Rosenbluth, North Carolina vs.
Michigan St., NSF, 3-22-1957 (3 OT)40, Austin Carr, Notre Dame vs. Houston, R3d,
3-20-197139, Austin Carr, Notre Dame vs. Iowa, R3d,
3-14-197038, Bob Cousy, Holy Cross vs. North Carolina
St., RF, 3-25-195037, David Robinson, Navy vs. Michigan, 1st R,
3-12-198737, Charles Jones, LIU Brooklyn vs. Villanova,
1st R, 3-13-199736, Oscar Robertson, Cincinnati vs. Arkansas,
R3d, 3-15-195836, Rick Mount, Purdue vs. UCLA, CH, 3-22-
196936, Ernie DiGregorio, Providence vs. Memphis,
NSF, 3-26-197336, Popeye Jones, Murray St. vs. Michigan St.,
1st R, 3-15-1990 (OT)*Record later vacated
42, *Bo Lamar, Louisiana vs. Louisville, RSF, 3-16-1972
Field-Goal Percentage(Minimum 10 FGM)
100% (11-11), Kenny Walker, Kentucky vs. Western Ky., 2d R, 3-16-1986
100% (10-10), Marvin Barnes, Providence vs. Penn, RSF, 3-15-1973
100% (10-10), Christian Laettner, Duke vs. Kentucky, RF, 3-28-1992 (OT)
100% (10-10), Taj Gibson, Southern California vs. Boston College, 1st R, 3-20-2009
95.5% (21-22), Bill Walton, UCLA vs. Memphis, CH, 3-26-1973
92.3% (12-13), Dennis Holman, SMU vs. Cincinnati, R3d, 3-12-1966
92.3% (12-13), Quadre Lollis, Montana St. vs. Syracuse, 1st R, 3-14-1996
91.7% (11-12), Pembrook Burrows, Jacksonville vs. Iowa, RSF, 3-12-1970
91.7% (11-12), Kenny Gregory, Kansas vs. DePaul, 1st R, 3-17-2000
91.7% (11-12), Blake Griffin, Oklahoma vs. Morgan St., 1st R, 3-19-2009
Three-Point Field Goals11, Jeff Fryer, Loyola Marymount vs. Michigan,
2d R, 3-18-199010, Freddie Banks, UNLV vs. Indiana, NSF,
3-28-198710, Roburt Sallie, Memphis vs. Cal St. Northridge,
1st R, 3-19-20099, Garde Thompson, Michigan vs. Navy, 1st R,
3-12-19879, Johnny Miller, Temple vs. Cincinnati, 1st R,
3-16-19959, Johnny Hemsley, Miami (FL) vs. Lafayette, 1st
R, 3-12-19999, Ricky Paulding, Missouri vs. Marquette, 2d R,
3-22-2003 (OT)9, Gerry McNamara, Syracuse vs. BYU, 1st R,
3-18-20049, Brady Heslip, Baylor vs. Colorado, 3d R,
3-17-20129, Bryce Alford, UCLA vs. SMU, 2d-R, 3-19-20158, 24 tied (most recent: Bronson Koenig,
Wisconsin vs. Virginia Tech, 1st R, 3-16-2017)
Three-Point Field Goals Attempted
22, Jeff Fryer, Loyola Marymount vs. Arkansas, 1st R, 3-16-1989
20, Chris Walker, Villanova vs. LSU, 1st R, 3-15-1990
19, Freddie Banks, UNLV vs. Indiana, NSF, 3-28-1987
19, Gerald Paddio, UNLV vs. Iowa, 2d R, 3-20-1988
19, Phillip Allen, N.C. A&T vs. Arkansas, 1st R, 3-18-1994
18, Bobby Hurley, Duke vs. California, 2d R, 3-20-1993
18, Jeff Boschee, Kansas vs. Kentucky, 2d R, 3-14-1999
18, Darius Lane, Seton Hall vs. Oklahoma St., RSF, 3-24-2000
Tournament Records 83
18, Chris Lofton, Tennessee vs. Wichita St., 2d R, 3-18-2006
17, Damin Lopez, Pepperdine vs. Michigan, 1st R, 3-17-1994
17, Johnny Miller, Temple vs. Cincinnati, 1st R, 3-16-1995
17, Shawn Respert, Michigan St. vs. Weber St., 1st R, 3-17-1995
17, Dedric Willoughby, Iowa St. vs. UCLA, RSF, 3-20-1997 (OT)
17, Kirk Hinrich, Kansas vs. Arizona, RF, 3-29-2003
17, Taquan Dean, Louisville vs. West Virginia, RF, 3-26-2005
17, Drew Neitzel, Michigan St. vs. North Carolina, 2d R, 3-17-2007
17, Bronson Koenig, Wisconsin vs. Virginia Tech, 1st R, 3-16-2017
Three-Point Field-Goal Percentage(Minimum Five 3FGM)
100% (8-8), John Goldsberry, UNCW vs. Maryland, 1st R, 3-21-2003
100% (7-7), Sam Cassell, Florida St. vs. Tulane, 2d R, 3-20-1993
100% (7-7), David Lighty, Ohio St. vs. George Mason, 3d R, 3-20-2011
100% (6-6), Mike Buck, Middle Tenn. vs. Florida St., 1st R, 3-16-1989
100% (6-6), Migjen Bakalli, North Carolina St. vs. Southern Miss., 1st R, 3-14-1991
100% (6-6), Rex Walters, Kansas vs. Ball St., 1st R, 3-18-1993
100% (6-6), Tay Fisher, Siena vs. Vanderbilt, 1st R, 3-21-2008
100% (6-6), Nik Stauskas, Michigan vs. Florida, RF, 3-31-2013
100% (5-5), Mitch Richmond, Kansas St. vs. Georgia, 1st R, 3-12-1987 (OT)
100% (5-5), Hubert Davis, North Carolina vs. Eastern Mich., RSF, 3-22-1991
100% (5-5), Kwame Evans, George Washington vs. New Mexico, 1st R, 3-19-1993
100% (5-5), Jamal Mashburn, Kentucky vs. Wake Forest, RSF, 3-25-1993
100% (5-5), Dwayne Morton, Louisville vs. Minnesota, 2d R, 3-20-1994
100% (5-5), Darren Brooks, Southern Ill. vs. Alabama, 1st R, 3-18-2004
*Record later vacated
100% (5-5), *Luke Hancock, Louisville vs. Michigan, CH, 4-8-2013
Three-Point Field-Goal Percentage(Minimum Seven 3FGM)
100% (8-8), John Goldsberry, UNCW vs. Maryland, 1st R, 3-21-2003
100% (7-7), Sam Cassell, Florida St. vs. Tulane, 2d R, 3-20-1993
100% (7-7), David Lighty, Ohio St. vs. George Mason, 3d R, 3-20-2011
88.9% (8-9), Darnell Archey, Butler vs. Louisville, 2d R, 3-23-2003
88.9% (8-9), Eric Bledsoe, Kentucky vs. ETSU, 1st R, 3-18-2010
87.5% (7-8), William Scott, Kansas St. vs. DePaul, 2d R, 3-19-1988
87.5% (7-8), Shane Hawkins, Southern Ill. vs. Syracuse, 1st R, 3-17-1995
87.5% (7-8), Phil Cullen, Utah vs. Indiana, 1st R, 3-14-2002
Free Throws Made23, Bob Carney, Bradley vs. Colorado, RSF,
3-12-195423, Travis Mays, Texas vs. Georgia, 1st R, 3-17-
199021, David Robinson, Navy vs. Syracuse, 2d R,
3-16-198619, Tom Hammonds, Georgia Tech vs. Iowa St.,
1st R, 3-18-198819, Thomas Walkup, SFA vs. West Virginia, 1st
R, 3-18-201618, John O’Brien, Seattle U. vs. Wyoming, R3d,
3-14-195318, Jon Rose, UConn vs. Boston U., 1st R,
3-10-195918, Gail Goodrich, UCLA vs. Michigan, CH,
3-20-196518, Wayne Simien, Kansas vs. UAB, RSF, 3-26-
200418, Jared Dudley, Boston College vs. Milwaukee,
2d R, 3-19-200517, Roger Newman, Kentucky vs. Ohio St., RF,
3-18-196117, Barry Kramer, NYU vs. West Virginia, R3d,
3-16-196317, Tyrone Hill, Xavier vs. Kansas St., 1st R,
3-16-199017, Steve Nash, Santa Clara vs. Maryland, 1st
R, 3-15-199617, Adreian Payne, Michigan St. vs. Delaware.
2nd R, 3-20-2014
Free Throws Attempted27, David Robinson, Navy vs. Syracuse, 2d R,
3-16-198627, Travis Mays, Texas vs. Georgia, 1st R, 3-17-
199026, Bob Carney, Bradley vs. Colorado, RSF,
3-12-195424, Donnie Gaunce, Morehead St. vs. Iowa, RSF,
3-16-195622, John O’Brien, Seattle U. vs. Wyoming, R3d,
3-14-195322, Wilt Chamberlain, Kansas vs. Oklahoma City,
RF, 3-16-195722, Roger Newman, Kentucky vs. Ohio St., RF,
3-18-196122, Ronny Turiaf, Gonzaga vs. Cincinnati, 1st R,
3-20-200321, Adrian Dantley, Notre Dame vs. Kansas, 1st
R, 3-15-197521, John Bagley, Boston College vs. Wake
Forest, 2d R, 3-15-198121, Tom Hammonds, Georgia Tech vs. Iowa St.,
1st R, 3-18-198821, Brad Miller, Purdue vs. Rhode Island, 1st R,
3-13-199721, Jared Dudley, Boston College vs. Milwaukee,
2d R, 3-19-2005*Record later vacated
21, *Vernon Maxwell, Florida vs. North Carolina St., 1st R, 3-13-1987
Free-Throw Percentage(Minimum 12 FTM)
100% (17-17), Adreian Payne, Michigan St. vs. Delaware. 2nd R, 3-20-2014
100% (16-16), Bill Bradley, Princeton vs. Saint Joseph’s, 1st R, 3-11-1963
100% (16-16), Fennis Dembo, Wyoming vs. UCLA, 2d R, 3-14-1987
100% (15-15), Austin Croshere, Providence vs. Marquette, 1st R, 3-14-1997
100% (14-14), Kemba Walker, UConn vs. Cincinnati, 3d R, 3-19-2011
100% (13-13), Bill Bradley, Princeton vs. Providence, RF, 3-13-1965
100% (13-13), Mike Maloy, Davidson vs. St. John’s (NY), RSF, 3-13-1969
100% (13-13), Al Gooden, Ball St. vs. Boston College, 1st R, 3-13-1981
100% (13-13), J’Covan Brown, Texas vs. Arizona, 3d R, 3-20-2011
100% (12-12), Tyler Dorsey, Oregon vs. North Carolina, NSF, 4-1-2017
*Record later vacated
100% (12-12), *Wayne Blackshear, Louisville vs. Michigan St., RF, 3-29-2015
Rebounds34, Fred Cohen, Temple vs. UConn, RSF, 3-16-
195631, Nate Thurmond, Bowling Green vs.
Mississippi St., R3d, 3-16-196330, Jerry Lucas, Ohio St. vs. Kentucky, RF,
3-18-196129, Toby Kimball, UConn vs. Saint Joseph’s, 1st
R, 3-8-196528, Elvin Hayes, Houston vs. Pacific, R3d, 3-12-
196627, Bill Russell, San Francisco vs. Iowa, CH,
3-19-195627, John Green, Michigan St. vs. Notre Dame,
RSF, 3-15-195727, Paul Silas, Creighton vs. Oklahoma City, 1st
R, 3-9-196427, Elvin Hayes, Houston vs. Loyola Chicago, 1st
R, 3-9-196826, Howard Jolliff, Ohio vs. Georgia Tech, RSF,
3-11-196026, Tom Gola, La Salle vs. North Carolina St.,
RSF, 3-12-195426, Phil Hubbard, Michigan vs. Detroit Mercy,
RSF, 3-17-197725, Tom Gola, La Salle vs. Canisius, RF, 3-12-
195525, Jerry Lucas, Ohio St. vs. Western Ky., RSF,
3-11-196025, Elvin Hayes, Houston vs. TCU, RF, 3-16-
196824, Bob Pettit, LSU vs. Penn St., RSF, 3-12-195424, Tom Gola, La Salle vs. Navy, RF, 3-13-195424, Tom Gola, La Salle vs. Princeton, RSF, 3-11-
195524, Jerry Bird, Kentucky vs. Iowa, RF, 3-17-195624, Don Boldebuck, Houston vs. Kansas St.,
R3d, 3-17-195624, K.E. Kirchner, TCU vs. DePaul, R3d, 3-14-
195924, Paul Silas, Creighton vs. Memphis, 1st R,
3-12-1962
Tournament Records 84
24, Eddie Jackson, Oklahoma City vs. Creighton, 1st R, 3-9-1964
24, Elvin Hayes, Houston vs. UCLA, NSF, 3-24-1967
24, Elvin Hayes, Houston vs. Louisville, RSF, 3-15-1968
24, Sam Lacey, New Mexico St. vs. Drake, RF, 3-14-1970
24, Tom Burleson, North Carolina St. vs. Providence, RSF, 3-14-1974
Rebounds Since 197326, Phil Hubbard, Michigan vs. Detroit Mercy,
RSF, 3-17-197724, Tom Burleson, North Carolina St. vs.
Providence, RSF, 3-14-197423, Kent Benson, Indiana vs. Kentucky, RSF,
3-22-197522, Larry Kenon, Memphis vs. Providence, NSF,
3-26-197322, Akeem Olajuwon, Houston vs. Louisville,
NSF, 4-2-198322, Tim Duncan, Wake Forest vs. Oklahoma St.,
RSF, 3-24-199522, Tim Duncan, Wake Forest vs. Saint Mary’s
(CA), 1st R, 3-14-199722, Luke Harangody, Notre Dame vs. Washington
St., 2d R, 3-22-200822, Tyler Zeller, North Carolina vs. Ohio, RSF,
3-23-2012 (OT)21, Marvin Barnes, Providence vs. Furman, R3d,
3-16-197421, Leon Douglas, Alabama vs. Arizona St., 1st
R, 3-15-197521, Ralph Sampson, Virginia vs. UAB, RSF,
3-18-198221, Loy Vaught, Michigan vs. Illinois St., 1st R,
3-16-199021, Joe Smith, Maryland vs. Texas, 2d R, 3-18-
199521, Nick Collison, Kansas vs. Syracuse, CH,
4-7-200321, Kenneth Faried, Morehead St. vs. Alabama
St., OR/FF, 3-17-200920, Larry Kenon, Memphis vs. South Carolina,
RSF, 3-15-197320, Mike Franklin, Cincinnati vs. Texas A&M, 1st
R, 3-15-197520, Tom Roy, Maryland vs. Louisville, RF, 3-22-
197520, George Johnson, St. John’s (NY) vs.
Louisville, 1st R, 3-12-197820, Jerome Lane, Pittsburgh vs. Vanderbilt, 2d
R, 3-20-198820, Tim Duncan, Wake Forest vs. Stanford, 2d
R, 3-16-199720, Drew Gooden, Kansas vs. Oregon, RF,
3-24-200220, Jared Homan, Iowa St. vs. North Carolina, 2d
R, 3-20-200520, Cole Aldrich, Kansas vs. Dayton, 2d R, 3-22-
2009
Assists18, Mark Wade, UNLV vs. Indiana, NSF, 3-28-
198716, Earl Watson, UCLA vs. Maryland, 2d R,
3-18-200016, Mitch Johnson, Stanford vs. Marquette, 2d
R, 3-22-2008
15, Kenny Patterson, DePaul vs. Syracuse, 1st R, 3-15-1985
15, Keith Smart, Indiana vs. Auburn, 2d R, 3-14-1987
15, Pepe Sanchez, Temple vs. Lafayette, 1st R, 3-17-2000
15, Aaron Craft, Ohio St. vs. George Mason, 3d R, 3-20-2011
14, Carl Wright, SMU vs. Miami (OH), 1st R, 3-16-1984
14, Dickey Beal, Kentucky vs. BYU, 2d R, 3-17-1984
14, Pooh Richardson, UCLA vs. Iowa St., 1st R, 3-17-1989
14, John Crotty, Virginia vs. Middle Tenn., 2d R, 3-18-1989
14, Jason Kidd, California vs. Duke, 2d R, 3-20-1993
14, Mike Lloyd, Syracuse vs. Southern Ill., 1st R, 3-17-1995
14, Tezale Archie, Pepperdine vs. Oklahoma St., 2d R, 3-19-2000
14, Adam Emmenecker, Drake vs. Western Ky., 1st R, 3-21-2008
14, Kendall Marshall, North Carolina vs. Washington, 3d R, 3-20-2011
14, Brett Comer, FGCU vs. San Diego St.., 3d R, 3-24-2013
*Record later vacated
16, *Sam Crawford, New Mexico St. vs. Nebraska, 1st R, 3-19-1993
Blocked Shots11, Shaquille O’Neal, LSU vs. BYU, 1st R, 3-19-
199210, Shawn Bradley, BYU vs. Virginia, 1st R,
3-14-199110, Cole Aldrich, Kansas vs. Dayton, 2d R, 3-22-
200910, Jeff Withey, Kansas vs. North Carolina St.,
RSF, 3-23-20129, David Robinson, Navy vs. Cleveland St., RSF,
3-21-19869, D’or Fischer, Northwestern St. vs. Winthrop,
OR/FF, 3-13-20018, Tim Perry, Temple vs. Lehigh, 1st R, 3-18-19888, Mark Strickland, Temple vs. Oklahoma St.,
RSF, 3-22-1991 (OT)8, Acie Earl, Iowa vs. Duke, 2d R, 3-21-19928, Tim Duncan, Wake Forest vs. Col. of
Charleston, 1st R, 3-17-19948, Erick Dampier, Mississippi St. vs. Utah, 2d R,
3-19-19958, Tim Duncan, Wake Forest vs. Oklahoma St.,
RSF, 3-24-19958, Kelvin Cato, Iowa St. vs. Illinois St., 1st R,
3-13-19978, Shane Battier, Duke vs. Kansas, 2d R, 3-19-
20008, Tarvis Williams, Hampton vs. Georgetown, 2d
R, 3-17-20018, Kevin Love, UCLA vs. Texas A&M, 2d R,
3-22-20088, Dallas Lauderdale, Ohio St. vs. UC Santa
Barbara, 1st R, 3-19-20108, D.J. Stephens, Memphis vs. Saint Mary’s
(CA), 2d R, 3-21-20138, Brice Johnson, North Carolina vs. FGCU, 1st
R, 3-17-2016
8, Jordan Bell, Oregon vs. Kansas, RF, 3-25-2017
Steals8, Darrell Hawkins, Arkansas vs. Holy Cross, 1st
R, 3-18-19938, Grant Hill, Duke vs. California, 2d R, 3-20-
19938, Duane Clemens, Ball St. vs. UCLA, 1st R,
3-16-20008, Ty Lawson, North Carolina vs. Michigan St.,
CH, 4-6-20097, Tommy Amaker, Duke vs. Old Dominion, 2d
R, 3-15-19867, Tommy Amaker, Duke vs. Louisville, CH,
3-31-19867, Reggie Miller, UCLA vs. Wyoming, 2d R,
3-14-19877, Delray Brooks, Providence vs. Austin Peay, 2d
R, 3-14-1987 (OT)7, Ricky Grace, Oklahoma vs. Iowa, RSF, 3-20-
1987 (OT)7, Mookie Blaylock, Oklahoma vs. Kansas, CH,
4-4-19887, Scott Burrell, UConn vs. Xavier, 2d R, 3-16-
19917, Ted Ellis, Manhattan vs. Oklahoma, 1st R,
3-16-19957, Kawika Akina, Northern Ariz. vs. Cincinnati, 1st
R, 3-12-19987, T.J. Ford, Texas vs. Oregon, RSF, 3-22-20027, Zakee Wadood, ETSU vs. Wake Forest, 1st
R, 3-21-20037, Jamon Gordon, Virginia Tech vs. Illinois, 1st
R, 3-16-20077, Darryl Proctor, UMBC vs. Georgetown, 1st R,
3-21-20087, Brent Arrington, Mississippi Val. vs. Western
Ky., 1st R, 3-13-2012*Record later vacated
8, *Russ Smith, Louisville vs. N.C. A&T, 2d R, 3-21-2013
7, *Edgar Padilla, Massachusetts vs. UCF, 1st R, 3-14-1996
Triple-DoublesGary Grant, Michigan vs. North Carolina, 2d R,
3-14-1987: 24 pts., 10 rebs. & 10 asts.Shaquille O’Neal, LSU vs. BYU, 1st R, 3-19-
1992: 26 pts., 13 rebs. & 11 blks.David Cain, St. John’s (NY) vs. Texas Tech, 1st
R, 3-18-1993: 12 pts., 11 rebs. & 11 asts.Andre Miller, Utah vs. Arizona, RF, 3-21-1998: 18
pts., 14 rebs. & 13 asts.Dwyane Wade, Marquette vs. Kentucky, RF,
3-29-2003: 29 pts., 11 rebs. & 11 asts.Cole Aldrich, Kansas vs. Dayton, 2d R, 3-22-
2009: 13 pts., 20 rebs. & 10 blks.Draymond Green, Michigan St. vs. UCLA, 2d R,
3-17-2011: 23 pts., 11 rebs. & 10 asts.Draymond Green, Michigan St. vs. LIU Brooklyn,
2d R, 3-16-2012: 24 pts., 12 rebs. & 10 asts.
“Unofficial” Triple-Doubles
B.H. Born, Kansas vs. Indiana, CH, 3-18-1953: 26 pts., 15 rebs. & 13 blks.
Oscar Robertson, Cincinnati vs. Kansas St., RF, 3-14-1959: 24 pts., 17 rebs. & 13 asts.
Tournament Records 85
Oscar Robertson, Cincinnati vs. Louisville, N3d, 3-21-1959: 39 pts., 17 rebs. & 10 asts.
Oscar Robertson, Cincinnati vs. California, NSF, 3-18-1960: 18 pts., 10 rebs. & 10 asts.
Oscar Robertson, Cincinnati vs. NYU, N3d, 3-19-1960: 32 pts., 14 rebs. & 11 asts.
Artis Gilmore, Jacksonville vs. Western Ky., 1st R, 3-13-1971: 12 pts., 22 rebs. & 11 blks.
Magic Johnson, Michigan St. vs. Lamar University, 2d R, 3-11-1979: 13 pts., 17 rebs. & 10 asts.
Magic Johnson, Michigan St. vs. Penn, NSF, 3-24-1979: 29 pts., 10 rebs. & 10 asts.
NOTE: Although assists were not ranked nation-ally until 1984, and steals and blocked shots were added in 1986, many official tournament box scores before this time included these statistics and were used in compiling the list of “unofficial” tournament triple-doubles.
INDIVIDUAL SERIES(Three-Game Minimum for Averages and Per centages)
Points184, Glen Rice, Michigan, 1989 (6 games)177, Bill Bradley, Princeton, 1965 (5)167, Elvin Hayes, Houston, 1968 (5)163, Danny Manning, Kansas, 1988 (6)160, Hal Lear, Temple, 1956 (5)160, Jerry West, West Virginia, 1959 (5)158, Austin Carr, Notre Dame, 1970 (3)158, Joe Barry Carroll, Purdue, 1980 (6)155, Juan Dixon, Maryland, 2002 (6)154, Jason Williams, Duke, 2001 (6)
Scoring Average52.7 (158 points in 3 games), Austin Carr, Notre
Dame, 197041.7 (125 in 3), Austin Carr, Notre Dame, 197135.8 (143 in 4), Jerry Chambers, Utah, 196635.8 (143 in 4), Bo Kimble, Loyola Marymount,
199035.4 (177 in 5), Bill Bradley, Princeton, 196535.3 (141 in 4), Clyde Lovellette, Kansas, 195235.0 (140 in 4), Gail Goodrich, UCLA, 196535.0 (105 in 3), Jerry West, West Virginia, 196034.8 (139 in 4), Bob Houbregs, Washington,
195333.4 (167 in 5), Elvin Hayes, Houston, 1968
Field Goals75, Glen Rice, Michigan, 1989 (6 games)70, Elvin Hayes, Houston, 1968 (5)69, Danny Manning, Kansas, 1988 (6)68, Austin Carr, Notre Dame, 1970 (3)66, Johnny Dawkins, Duke, 1986 (6)65, Bill Bradley, Princeton, 1965 (5)63, Hal Lear, Temple, 1956 (5)63, Joe Barry Carroll, Purdue, 1980 (6)63, Stacey King, Oklahoma, 1988 (6)
*Record later vacated
61, *Jim McDaniels, Western Ky., 1971 (5)
Field Goals Attempted137, Elvin Hayes, Houston, 1968 (5 games)131, Glen Rice, Michigan, 1989 (6)125, Danny Manning, Kansas, 1988 (6)124, Lennie Rosenbluth, North Carolina, 1957 (5)121, Ernie DiGregorio, Providence, 1973 (5)121, Bo Kimble, Loyola Marymount, 1990 (4)119, Elvin Hayes, Houston, 1967 (5)118, Austin Carr, Notre Dame, 1970 (3)116, Rick Mount, Purdue, 1969 (4)
*Record later vacated
138, *Jim McDaniels, Western Ky., 1971 (5)
Field-Goal Percentage(Minimum Five FGM Per Game)
81.5% (22-27), Jerrell Wright, La Salle, 2013 (4 games)
80.0% (16-20), Tyler Davis, Texas A&M, 2016 (3)78.9% (15-19), Arinze Onuaku, Syracuse, 2009
(3)78.8% (26-33), Christian Laettner, Duke, 1989
(5)78.6% (22-28), Heyward Dotson, Columbia,
1968 (3)78.0% (32-41), Kevin Gamble, Iowa, 1987 (4)78.0% (46-59), Blake Griffin, Oklahoma, 2009 (4)77.4% (24-31), Vernon Macklin, Florida, 2011 (4)77.1% (27-35), Mark Dressler, Missouri, 1980 (3)76.9% (20-26), Robert Werdann, St. John’s (NY),
1991 (4)76.9% (20-26), Shavlik Randolph, Duke, 2004 (5)
*Record later vacated
78.3% (18-23), *Winston Bennett, Kentucky, 1988 (3)
Three-Point Field Goals27, Glen Rice, Michigan, 1989 (6 games)26, Freddie Banks, UNLV, 1987 (5)24, Dennis Scott, Georgia Tech, 1990 (5)23, Jeff Fryer, Loyola Marymount, 1990 (4)23, Jason Williams, Duke, 2001 (6)23, Luther Head, Illinois, 2005 (6)23, Lee Humphrey, Florida, 2007 (6)23, Stephen Curry, Davidson, 2008 (4)23, Shelvin Mack, Butler, 2011 (6)22, Donald Williams, North Carolina, 1993 (6)22, Juan Dixon, Maryland, 2002 (6)22, Lee Humphrey, Florida, 2006 (6)
Three-Point Field Goals Made Per Game
5.75 (23 3FGM in 4 games), Jeff Fryer, Loyola Marymount, 1990
5.75 (23 in 4), Stephen Curry, Davidson, 20085.33 (16 in 3), Roburt Sallie, Memphis, 20095.25 (21 in 4), William Scott, Kansas St., 19885.20 (26 in 5), Freddie Banks, UNLV, 19875.00 (15 in 3), Gerry McNamara, Syracuse, 20044.80 (24 in 5), Dennis Scott, Georgia Tech, 19904.75 (19 in 4), A.J. Abrams, Texas, 20084.67 (14 in 3), Dedric Willoughby, Iowa St., 19974.67 (14 in 3), Tyron Brazelton, Western Ky.,
20084.67 (14 in 3) Bryce Alford, UCLA, 2015
4.67 (14 in 3) Bronson Koenig, Wisconsin, 2017
Three-Point Field Goals Attempted
66, Jason Williams, Duke, 2001 (6 games)65, Freddie Banks, UNLV, 1987 (5)58, Luther Head, Illinois, 2005 (6)57, Shelvin Mack, Butler, 2011 (6)55, Jeff Fryer, Loyola Marymount, 1990 (4)54, Dennis Scott, Georgia Tech, 1990 (5)49, Glen Rice, Michigan, 1989 (6)49, Kirk Hinrich, Kansas, 2003 (6)49, Lee Humphrey, Florida, 2007 (6)48, Lee Humphrey, Florida, 2006 (6)48, Buddy Hield, Oklahoma, 2016 (6)
Three-Point Field-Goal Percentage(Minimum 1.5 3FGM Per Game, 2.0 3FGM since 2002)
100% (6-6), Ranzino Smith, North Carolina, 1987 (4 games)
85.7% (6-7), Mike Chappell, Duke, 1998 (4)81.8% (9-11), Brandon Rush, Kansas, 2007 (4)80.0% (8-10), John Crotty, Virginia, 1989 (4)77.8% (7-9), Corey Williams, Oklahoma St.,
1992 (3)77.8% (7-9), Kenny Brown, Stanford, 2008 (3)75.0% (6-8), Brian Boddicker, Texas, 2002 (3)75.0% (6-8), Ryan Childress, Tennessee, 2007
(3)72.7% (8-11), A.J. Granger, Michigan St., 1999
(5)71.4% (5-7), Ben Caton, Utah, 1996 (3)71.4% (5-7), Casey Calvary, Gonzaga, 2001 (3)71.4% (10-14), David Lighty, Ohio St., 2011 (3)
Free Throws Made55, Bob Carney, Bradley, 1954 (5 games)49, Don Schlundt, Indiana, 1953 (4)49, Christian Laettner, Duke, 1991 (6)47, Bill Bradley, Princeton, 1965 (5)46, Jerry West, West Virginia, 1959 (5)45, Cedric Maxwell, Charlotte, 1977 (5)45, Michael Doleac, Utah, 1998 (6)44, Len Chappell, Wake Forest, 1962 (5)44, Kemba Walker, UConn, 2011 (6)43, Travis Mays, Texas, 1990 (4)
Free Throws Attempted71, Jerry West, West Virginia, 1959 (5 games)70, Bob Carney, Bradley, 1954 (5)63, Don Schlundt, Indiana, 1953 (4)62, Wilt Chamberlain, Kansas, 1957 (4)62, Len Chappell, Wake Forest, 1962 (5)55, David Robinson, Navy, 1986 (4)54, Christian Laettner, Duke, 1991 (6)54, Michael Doleac, Utah, 1998 (6)53, Cedric Maxwell, Charlotte, 1977 (5)53, Ed Pinckney, Villanova, 1985 (6)53, Tyler Hansbrough, North Carolina, 2009 (6)
*Record later vacated
63, Chris Douglas-Roberts, Memphis, 2008 (6)
Tournament Records 86
Perfect Free-Throw Percentage(Most Free Throws; No Game Minimum)
100% (35-35), Arthur Lee, Stanford, 1998 (5 games)
100% (25-25), J’Covan Brown, Texas, 2011 (2 games)
100% (23-23), Richard Morgan, Virginia, 1989 (4)
100% (23-23), Doug McDermott, Creighton, 2013 (2)
100% (21-21), Keith Van Horn, Utah, 1997 (4)100% (20-20), Shammond Williams, North
Carolina, 1998 (5)100% (18-18), Harley Swift, ETSU, 1968 (3)100% (18-18), Mike Vreeswyk, Temple, 1988 (4)100% (18-18), Malcolm Brogdon, Virginia, 2016
(4)100% (17-17), Henry Bibby, UCLA, 1971 (4)100% (17-17), Oliver Robinson, UAB, 1981 (3)
*Record later vacated
100% (19-19), *Derrick McKey, Alabama, 1987 (3)
Free-Throw Percentage(Minimum 20 FTM)
100% (35-35), Arthur Lee, Stanford, 1998 (5 games)
100% (23-23), Richard Morgan, Virginia, 1989 (4)
100% (21-21), Keith Van Horn, Utah, 1997 (4)100% (20-20), Shammond Williams, North
Carolina, 1998 (5)97.1% (33-34), Lynn Greer, Temple, 2001 (4)96.3% (26-27), Sidney Moncrief, Arkansas, 1979
(3)96.2% (25-26), Jeff Lamp, Virginia, 1981 (5)96.2% (25-26), Michael Doleac, Utah, 1997 (4)96.0% (24-25), Dwayne McClain, Villanova, 1985
(6)95.7% (22-23), Marcus Williams, Connecticut,
2006 (4)
Rebounds102, Tom Gola, La Salle, 1954 (5 games)97, Elvin Hayes, Houston, 1968 (5)96, Tom Gola, La Salle, 1955 (5)93, Artis Gilmore, Jacksonville, 1970 (5)91, Elgin Baylor, Seattle U., 1958 (5)90, Sam Lacey, New Mexico St., 1970 (5)86, Len Chappell, Wake Forest, 1962 (5)83, Tom Sanders, NYU, 1960 (5)82, Don May, Dayton, 1967 (5)81, Nick Collison, Kansas, 2003 (6)77, John Green, Michigan St., 1957 (4)
*Record later vacated
89, *Clarence Glover, Western Ky., 1971 (5)
Rebounds Since 197381, Nick Collison, Kansas, 2003 (6 games)75, Larry Johnson, UNLV, 1990 (6)75, Thomas Robinson, Kansas, 2012 (6)74, Anthony Davis, Kentucky, 2012 (6)73, Derrick Coleman, Syracuse, 1987 (6)
69, Kennedy Meeks, North Carolina, 2017 (6)68, Emeka Okafor, UConn, 2004 (6)68, Al Horford, Florida, 2007 (6)67, Larry Bird, Indiana St., 1979 (5)66, Jordan Bell, Oregon, 2017 (5)65, Akeem Olajuwon, Houston, 1983 (5)64, Cedric Maxwell, Charlotte, 1977 (5)64, Sean May, North Carolina, 2005 (6)64, Goran Suton, Michigan St., 2009 (6)64, Mitch McGary, Michigan, 2013 (6)
*Record later vacated
68, *Chris Webber, Michigan, 1993 (6)
Rebound Average23.3 (70 rebounds in 3 games), Nate Thurmond,
Bowling Green, 196321.7 (65 in 3), Howard Jolliff, Ohio, 196020.4 (102 in 5), Tom Gola, La Salle, 195419.4 (97 in 5), Elvin Hayes, Houston, 196819.3 (77 in 4), John Green, Michigan St., 195719.2 (96 in 5), Tom Gola, La Salle, 195419.0 (57 in 3), Paul Silas, Creighton, 196418.8 (75 in 4), Lew Alcindor, UCLA, 196818.6 (93 in 5), Artis Gilmore, Jacksonville, 197018.3 (73 in 4), Jerry Lucas, Ohio St., 196118.3 (55 in 3), James Ware, Oklahoma City, 196518.2 (91 in 5), Elgin Baylor, Seattle U., 1958
Rebound Average Since 1973
17.0 (51 rebounds in 3 games), Marvin Barnes, Providence, 1974
16.3 (49 in 3), Mike Franklin, Cincinnati, 197515.7 (47 in 3), Cole Aldrich, Kansas, 200915.3 (61 in 4), Tom Burleson, North Carolina
St., 197415.0 (45 in 3), Phil Hubbard, Michigan, 197715.0 (45 in 3), Shelden Williams, Duke, 200615.0 (60 in 4), Blake Griffin, Oklahoma, 200915.0 (45 in 3), Arsalan Kazemi, Oregon, 201314.7 (44 in 3), Dale Davis, Clemson, 199014.5 (58 in 4), Bill Walton, UCLA, 1973
Assists61, Mark Wade, UNLV, 1987 (5 games)56, Rumeal Robinson, Michigan, 1989 (6)51, T.J. Ford, Texas, 2003 (5)50, Deron Williams, Illinois, 2005 (6)49, Sherman Douglas, Syracuse, 1987 (6)47, Bobby Hurley, Duke, 1992 (6)46, Lazarus Sims, Syracuse, 1996 (6)46, Joey Rodriguez, VCU, 2011 (6)45, Michael Jackson, Georgetown, 1985 (6)43, Bobby Hurley, Duke, 1991 (6)
Assists Average12.20 (61 assists in 5 games), Mark Wade,
UNLV, 198711.00 (33 in 3), Earl Watson, UCLA, 200010.67 (32 in 3), Mark Wade, UNLV, 198610.33 (31 in 3), Jason Kidd, California, 199310.33 (31 in 3), Brett Comer, FGCU, 201310.20 (51 in 5), T.J. Ford, Texas, 20039.75 (39 in 4), John Crotty, Virginia, 1989
9.75 (39 in 4), Kendall Marshall, North Carolina, 2011
9.67 (29 in 3), Drew Barry, Georgia Tech, 19969.67 (29 in 3), Reggie Geary, Arizona, 19969.67 (29 in 3), Mitch Johnson, Stanford, 2008
Blocked Shots31, Jeff Withey, Kansas, 2012 (6 games)29, Joakim Noah, Florida, 2006 (6)29, Anthony Davis, Kentucky, 2012 (6)24, Loren Woods, Arizona, 2001 (6)23, David Robinson, Navy, 1986 (4)21, Ken Johnson, Ohio St., 1999 (5)21, Kevin Love, UCLA, 2008 (5)20, Tim Perry, Temple, 1988 (4)20, Tyler Lydon, Syracuse, 2016 (5)19, Alonzo Mourning, Georgetown, 1989 (4)18, Cherokee Parks, Duke, 1994 (6)18, Marcus Camby, Massachusetts, 1995 (4)18, Jamaal Magloire, Kentucky, 1998 (6)18, Zach Collins, Gonzaga, 2017 (6)
*Record later vacated
21, *Marcus Camby, Massachusetts, 1996 (5)
Blocked Shot Average5.75 (23 blocks in 4 games), David Robinson,
Navy, 19865.67 (17 in 3), Jeff Withey, Kansas, 20135.33 (16 in 3), Tim Duncan, Wake Forest, 19955.33 (16 in 3), Erick Dampier, Mississippi St.,
19955.33 (16 in 3), Cole Aldrich, Kansas, 20095.17 (31 in 6), Jeff Withey, Kansas, 20125.00 (20 in 4), Tim Perry, Temple, 19885.00 (15 in 3), Shelden Williams, Duke, 20064.83 (29 in 6), Joakim Noah, Florida, 20064.83 (29 in 6), Anthony Davis, Kentucky, 2012
Steals23, Mookie Blaylock, Oklahoma, 1988 (6 games)19, Mike Kelley, Wisconsin, 2000 (5)18, Tommy Amaker, Duke, 1986 (6)18, Mark Wade, UNLV, 1987 (5)18, Lee Mayberry, Arkansas, 1990 (5)17, Kendall Gill, Illinois, 1989 (5)17, Antoine Walker, Kentucky, 1996 (6)17, Jason Terry, Arizona, 1997 (6)17, Wayne Turner, Kentucky, 1997 (6)17, Gilbert Arenas, Arizona, 2001 (6)17, Mario Chalmers, Kansas, 2008 (6)
*Record later vacated
19, *Edgar Padilla, Massachusetts, 1996 (5)
Steals Average4.67 (14 steals in 3 games), Ricky Grace,
Oklahoma, 19874.33 (13 in 3), Jason Kidd, California, 19933.83 (23 in 6), Mookie Blaylock, Oklahoma, 19883.80 (19 in 5), Mike Kelley, Wisconsin, 20003.67 (11 in 3), Scott Burrell, UConn, 19913.67 (11 in 3), Damian Owens, West Virginia,
19983.67 (11 in 3), Jason Hart, Syracuse, 1998
Tournament Records 87
3.67 (11 in 3), Jamaal Williams, Washington, 2006
3.67 (11 in 3), Fred Van Vleet, Wichita St., 20163.60 (18 in 5), Mark Wade, UNLV, 19873.60 (18 in 5), Lee Mayberry, Arkansas, 1990
*Record later vacated
3.80 (19 in 5), *Edgar Padilla, Massachusetts, 1996
INDIVIDUAL CAREER(Two-Year Minimum for Averages and Per cent ages)
Points407, Christian Laettner, Duke, 1989-92 (23
games)358, Elvin Hayes, Houston, 1966-68 (13)328, Danny Manning, Kansas, 1985-88 (16)325, Tyler Hansbrough, North Carolina, 2006-09
(17)324, Oscar Robertson, Cincinnati, 1958-60 (10)308, Glen Rice, Michigan, 1986-89 (13)304, Lew Alcindor, UCLA, 1967-69 (12)303, Bill Bradley, Princeton, 1963-65 (9)303, Corliss Williamson, Arkansas, 1993-95 (15)294, Juan Dixon, Maryland, 1999-2002 (16)289, Austin Carr, Notre Dame, 1969-71 (7)279, Calbert Cheaney, Indiana, 1990-93 (13)278, Shane Battier, Duke, 1998-2001 (19)275, Jerry West, West Virginia, 1958-60 (9)269, Danny Ferry, Duke, 1986-89 (19)269, Grant Hill, Duke, 1991-94 (20)267, Nick Collison, Kansas, 2000-03 (16)267, Kenny Boynton, Florida, 2010-13 (13)266, Jerry Lucas, Ohio St., 1960-62 (12)260, Reggie Williams, Georgetown, 1984-87 (17)260, Miles Simon, Arizona, 1995-98 (14)
*Record later vacated
280, *Juwan Howard, Michigan, 1992-94 (16)
Scoring Average(Minimum six games)
41.3 (289 points in 7 games), Austin Carr, Notre Dame, 1969-71
33.7 (303 in 9), Bill Bradley, Princeton, 1963-6532.4 (324 in 10), Oscar Robertson, Cincinnati,
1958-6030.6 (275 in 9), Jerry West, West Virginia, 1958-
6030.5 (183 in 6), Bob Pettit, LSU, 1953-5429.3 (176 in 6), Dan Issel, Kentucky, 1968-7029.1 (204 in 7), Bo Kimble, Loyola Marymount,
1988-9028.6 (200 in 7), David Robinson, Navy, 1985-8727.8 (167 in 6), Hank Finkel, Dayton, 1965-6627.6 (221 in 8), Len Chappell, Wake Forest,
1961-6227.5 (358 in 13), Elvin Hayes, Houston, 1966-6827.4 (192 in 7), Bob Houbregs, Washington,
1951, 5327.0 (162 in 6), Don Schlundt, Indiana, 1953-5426.7 (160 in 6), Travis Mays, Texas, 1989-9026.3 (184 in 7), Jimmer Fredette, BYU, 2008-11
25.8 (155 in 6), Ollie Johnson, San Francisco, 1963-65
25.7 (180 in 7), Kenny Anderson, Georgia Tech, 1990-91
25.5 (153 in 6), Barry Kramer, NYU, 1962-63*Record later vacated
29.3 (176 in 6), *Jim McDaniels, Western Ky., 1970-71
29.2 (175 in 6), *Bo Lamar, Louisiana, 1972-73
Field Goals152, Elvin Hayes, Houston, 1966-68 (13 games)140, Danny Manning, Kansas, 1985-88 (16)128, Glen Rice, Michigan, 1986-89 (13)128, Christian Laettner, Duke, 1989-92 (23)123, Corliss Williamson, Arkansas, 1993-95 (15)
Field Goals Attempted310, Elvin Hayes, Houston, 1966-68 (13 games)257, Danny Manning, Kansas, 1985-88 (16)235, Oscar Robertson, Cincinnati, 1958-60 (10)225, Austin Carr, Notre Dame, 1969-71 (7)224, Glen Rice, Michigan, 1986-89 (13)
Field-Goal Percentage(Minimum 70 FGM)
68.6% (109-159), Bill Walton, UCLA, 1972-74 (12 games)
68.4% (78-114), Stephen Thompson, Syracuse, 1987-90 (15)
68.0% (70-103), Brad Daugherty, North Carolina, 1983-86 (12)
65.2% (86-132), Andre Hutson, Michigan St., 1998-2001 (19)
65.1% (95-146), Akeem Olajuwon, Houston, 1982-84 (15)
Three-Point Field Goals47, Lee Humphrey, Florida, 2004-07 (15 games)43, Shelvin Mack, Butler, 2009-11 (13)42, Bobby Hurley, Duke, 1990-93 (20)41, A.J. Abrams, Texas, 2006-09 (12)40, Tony Delk, Kentucky, 1993-96 (17)
Three-Point Field Goals Made Per Game(Minimum 25 3FGM)
5.43 (38 3FGM in 7 games), Jeff Fryer, Loyola Marymount, 1988-90
4.33 (26 in 6), William Scott, Kansas St., 1987-884.13 (33 in 8), Dennis Scott, Georgia Tech,
1988-903.78 (34 in 9), Darnell Burton, Cincinnati, 1994-
973.50 (28 in 8), Darryl Wilson, Mississippi St.,
1995-96
Three-Point Field Goals Attempted
115, J.J. Redick, Duke, 2003-06 (14 games)112, Jason Williams, Duke, 2000-02 (12)103, Anderson Hunt, UNLV, 1989-91 (15)102, Lee Humphrey, Florida, 2004-07 (15)100, Jeff Boschee, Kansas, 1999-2002 (12)
Three-Point Field-Goal Percentage(Minimum 20 3FGM)
65.0% (26-40), William Scott, Kansas St., 1987-88 (5 games)
62.5% (20-32), Sam Cassell, Florida St., 1992-93 (7)
61.8% (21-34), Steve Alford, Indiana, 1984, 86-87 (10)
60.0% (21-35), Pete Campbell, Butler, 2007-08 (5)
59.5% (25-42), Brian Boddicker, Texas, 2001-04 (12)
Free Throws Made142, Christian Laettner, Duke, 1989-92 (23
games)105, Tyler Hansbrough, North Carolina, 2006-09
(17)90, Oscar Robertson, Cincinnati, 1958-60 (10)87, Bill Bradley, Princeton, 1963-65 (9)83, Ed Pinckney, Villanova, 1982-85 (14)
Free Throws Attempted167, Christian Laettner, Duke, 1989-92 (23
games)138, Tyler Hansbrough, North Carolina, 2006-09
(17)119, Lew Alcindor, UCLA, 1967-69 (12)116, Oscar Robertson, Cincinnati, 1958-60 (10)115, Ed Pinckney, Villanova, 1982-85 (14)
Free-Throw Percentage(Minimum 30 FTM)
97.7% (42-43), Keith Van Horn, Utah, 1995-97 (8 games)
97.4% (38-39), Adreian Payne, Michigan St., 2011-14 (11)
95.7% (45-47), LaBradford Smith, Louisville, 1988-90 (8)
95.7% (44-46), Malcolm Brogdon, Virginia, 2014-16 (9)
94.9% (37-39), Phil Ford, North Carolina, 1975-78 (10)
94.3% (33-35), Lawrence Moten, Syracuse, 1992, 1994-95 (7)
94.3% (33-35), J’Covan Brown, Texas, 2010-12 (4)
Free-Throw Percentage(Minimum 50 FTM)
93.5% (58-62), Arthur Lee, Stanford, 1996-99 (12 games)
91.6% (87-95), Bill Bradley, Princeton, 1963-65 (9)
90.6% (58-64), Steve Alford, Indiana, 1984, 86-87 (10)
89.8% (53-59), Johnny Cox, Kentucky, 1957-59 (8)
89.1% (57-64), Jon Scheyer, Duke, 2007-10 (12)
Rebounds222, Elvin Hayes, Houston, 1966-68 (13 games)201, Lew Alcindor, UCLA, 1967-69 (12)198, Tom Gola, La Salle, 1954-55 (10)197, Jerry Lucas, Ohio St., 1960-62 (12)181, Nick Collison, Kansas, 2000-03 (16)
Tournament Records 88
176, Bill Walton, UCLA, 1972-74 (12)169, Christian Laettner, Duke, 1989-92 (23)165, Tim Duncan, Wake Forest, 1994-97 (11)160, Paul Hogue, Cincinnati, 1960-62 (12)157, Sam Lacey, New Mexico St., 1968-70 (11)155, Derrick Coleman, Syracuse, 1987-90 (14)153, Akeem Olajuwon, Houston, 1982-84 (15)146, Tyler Hansbrough, North Carolina, 2006-09
(17)144, Patrick Ewing, Georgetown, 1982-85 (18)144, Shelden Williams, Duke, 203-06 (13)141, Emeka Okafor, UConn, 2002-04 (13)139, Kennedy Meeks, North Carolina, 2014-17
(17)138, Marques Johnson, UCLA, 1974-77 (16)138, George Lynch, North Carolina, 1990-93 (17)137, Len Chappell, Wake Forest, 1961-62 (8)137, Lonny Baxter, Maryland, 1999-2002 (16)137, Al Horford, Florida, 2004-07 (14)
Rebounds Since 1973181, Nick Collison, Kansas, 2000-03 (16 games)169, Christian Laettner, Duke, 1989-92 (23)165, Tim Duncan, Wake Forest, 1994-97 (11)155, Derrick Coleman, Syracuse, 1987-90 (14)153, Akeem Olajuwon, Houston, 1982-84 (15)146, Tyler Hansbrough, North Carolina, 2006-09
(17)144, Patrick Ewing, Georgetown, 1982-85 (18)144, Shelden Williams, Duke, 2003-06 (13)141, Emeka Okafor, UConn, 2002-04 (13)139, Kennedy Meeks, North Carolina, 2014-17
(17)138, Marques Johnson, UCLA, 1974-77 (16)138, George Lynch, North Carolina, 1990-93 (17)137, Lonny Baxter, Maryland, 1999-2002 (16)137, Al Horford, Florida, 2004-07 (14)135, Ed Pinckney, Villanova, 1982-85 (14)135, Shane Battier, Duke, 1998-2001 (19)134, Grant Hill, Duke, 1991-94 (20)131, Danny Ferry, Duke, 1986-89 (19)129, Sam Perkins, North Carolina, 1981-84 (15)128, Mark Madsen, Stanford, 1997-2000 (12)
Rebounding Average(Minimum six games)
19.8 (198 rebounds in 10 games), Tom Gola, La Salle, 1954-55
19.7 (118 in 6), John Green, Michigan St., 1957, 59
19.2 (115 in 6), Artis Gilmore, Jacksonville, 1970-71
18.5 (111 in 6), Paul Silas, Creighton, 1962-6417.1 (137 in 8), Len Chappell, Wake Forest,
1961-6217.1 (222 in 13), Elvin Hayes, Houston, 1966-6816.8 (201 in 12), Lew Alcindor, UCLA, 1967-6916.4 (197 in 12), Jerry Lucas, Ohio St., 1960-6216.2 (97 in 6), Ollie Johnson, San Francisco,
1963-6515.8 (95 in 6), Clarence Glover, Western Ky.,
1970-7115.0 (165 in 11), Tim Duncan, Wake Forest,
1994-97
Rebounding Average Since 1973(Minimum 85 rebounds)
15.0 (165 rebounds in 11 games), Tim Duncan, Wake Forest, 1994-97
14.1 (99 in 7), Marvin Barnes, Providence, 1973-74
14.0 (112 in 8), Bill Walton, UCLA, 1973-7413.3 (106 in 8), Phil Hubbard, Michigan, 1976-7712.3 (86 in 7), David Robinson, Navy, 1985-8712.0 (96 in 8), Maurice Lucas, Marquette, 1973-
7411.5 (126 in 11), Larry Johnson, UNLV, 1990-9111.3 (181 in 16), Nick Collison, Kansas, 2000-0311.3 (113 in 10), Ralph Sampson, Virginia, 1981-
8311.3 (90 in 8), Greg Kelser, Michigan St., 1978-79
Assists145, Bobby Hurley, Duke, 1990-93 (20 games)118, Ed Cota, North Carolina, 1997-2000 (16)106, Sherman Douglas, Syracuse, 1986-89 (14)104, Aaron Miles, Kansas, 2002-05 (16)100, Greg Anthony, UNLV, 1989-91 (15)
Assists Average(Minimum 50 assists)
11.63 (93 assists in 8 games), Mark Wade, UNLV, 1986-87
10.20 (51 in 5), Sam Crawford, New Mexico St., 1992-93
8.63 (69 in 8), T.J. Ford, Texas, 2002-038.45 (93 in 11), Rumeal Robinson, Michigan,
1988-907.57 (106 in 14), Sherman Douglas, Syracuse,
1986-89
Blocked Shots50, Tim Duncan, Wake Forest, 1994-97 (11
games)49, Jeff Withey, Kansas, 2010-13 (12)42, Shane Battier, Duke, 1998-2001 (19)41, Joakim Noah, Florida, 2005-07 (13)41, Shelden Williams, Duke, 2003-06 (13)
*Record later vacated
43, *Marcus Camby, Massachusetts, 1994-96 (11)
Blocked Shots Average(Minimum 25 blocks)
5.80 (29 blocked shots in 5 games), Shaquille O’Neal, LSU, 1990-92
5.00 (25 in 5), David Robinson, Navy, 1986-874.55 (50 in 11), Tim Duncan, Wake Forest,
1994-974.08 (49 in 12), Jeff Withey, Kansas, 2010-133.86 (27 in 7), Ken Johnson, Ohio St., 1999-2000
*Record later vacated
3.91 (43 in 11), *Marcus Camby, Massachusetts, 1994-96
Steals39, Grant Hill, Duke, 1991-94 (20 games)38, Wayne Turner, Kentucky, 1996-99 (21)38, Chris Duhon, Duke, 2001-04 (17)
35, Anthony Epps, Kentucky, 1994-97 (18)34, Mario Chalmers, Kansas, 2005-08 (11)
Steals Average(Minimum 20 steals)
3.56 (32 steals in 9 games), Mookie Blaylock, Oklahoma, 1988-89
3.11 (28 in 9), Ricky Grace, Oklahoma, 1987-883.11 (28 in 9), Pepe Sanchez, Temple, 1997-
20003.09 (34 in 11), Mario Chalmers, Kansas, 2005-
082.92 (38 in 13), Aaron Craft, Ohio St., 2011-14
Games Played23, Christian Laettner, Duke, 1989-9222, Greg Koubek, Duke, 1988-9122, Brian Davis, Duke, 1989-9221, Wayne Turner, Kentucky, 1996-9920, Thomas Hill, Duke, 1990-9320, Bobby Hurley, Duke, 1990-9320, Grant Hill, Duke, 1991-9420, Antonio Lang, Duke, 1991-94
TEAM GAMEPoints
149, Loyola Marymount vs. Michigan (115), 2d R, 3-18-1990
131, UNLV vs. Loyola Marymount (101), RF, 3-25-1990
124, Oklahoma vs. Louisiana Tech (81), 2d R, 3-18-1989
123, North Carolina vs. Loyola Marymount (97), 2d R, 3-19-1988
121, Iowa vs. Notre Dame (106), R3d, 3-14-1970121, UNLV vs. San Francisco (95), 1st R, 3-12-
1977121, Tennessee vs. Long Beach St. (86), 1st R,
3-16-2007120, Utah vs. Saint Joseph’s (127), N3d, 3-25-
1961 (4 OT)120, Arkansas vs. Loyola Marymount (101), 1st
R, 3-16-1989*Record later vacated
127, *Saint Joseph’s vs. Utah (120), N3d, 3-25-1961 (4 OT)
Fewest Points20, North Carolina vs. Pittsburgh (26), RF, 3-21-
194124, Springfield vs. Indiana (48), RF, 3-20-194026, Pittsburgh vs. North Carolina (20), RF, 3-21-
194128, Kentucky vs. Dartmouth (47), NSF, 3-21-
194229, Western Ky. vs. Duquesne (30), RF, 3-20-
194029, Baylor vs. Oklahoma St. (44), RF, 3-22-194629, Mississippi Val. vs. UCLA (70), 1st R, 3-20-
200830, Brown vs. Villanova (42), RF, 3-17-193930, Duquesne vs. Western Ky. (29), RF, 3-20-
194030, Duquesne vs. Indiana (39), NSF, 3-21-1940
Tournament Records 89
30, Pittsburgh vs. Wisconsin (36), NSF, 3-22-1941
30, Oregon St. vs. Oklahoma St. (55), NSF, 3-19-1949
Winning Margin69, Loyola Chicago (111) vs. Tennessee Tech
(42), 1st R, 3-11-196358, Kansas (110) vs. Prairie View (52), 1st R,
3-13-199856, UConn (103) vs. Chattanooga (47), 1st R,
3-19-200949, UCLA (109) vs. Wyoming (60), RSF, 3-17-
196749, Syracuse (101) vs. Brown (52), 1st R, 3-14-
198647, Duke (101) vs. UConn (54), RF, 3-14-196447, DePaul (99) vs. Eastern Ky. (52), 1st R,
3-9-196547, Duke (84) vs. Winthrop (37), 1st R, 3-14-200247, Syracuse (81) vs. Montana (34), 2d R, 3-22-
201346, Kentucky (113) vs. Mt. St. Mary’s (67), 1st R,
3-16-199546, VCU (88) vs. Akron (42), 2d R, 3-21-2013
Smallest Winning Margin1, 195 tied (most recent: six in 2017)
Points by Losing Team120, Utah vs. Saint Joseph’s (127), N3d, 3-25-
1961 (4 OT)115, Wyoming vs. Loyola Marymount (119), 1st
R, 3-17-1988115, Michigan vs. Loyola Marymount (149), 2d
R, 3-18-1990109, UNLV vs. Arizona (114), RSF, 3-18-1976
(OT)106, Notre Dame vs. Iowa (121), R3d, 3-14-1970106, Notre Dame vs. Houston (119), R3d, 3-20-
1971105, Wake Forest vs. West Virginia (111), 2d R,
3-19-2005 (2 OT)103, Iowa vs. Jacksonville (104), RSF, 3-12-1970103, Kentucky vs. Duke (104), RF, 3-28-1992
(OT)102, BYU vs. Oklahoma City (112), R3d, 3-13-
1965102, UCLA vs. Tulsa (112), 1st R, 3-18-1994
Field Goals52, Iowa vs. Notre Dame, R3d, 3-14-197051, UCLA vs. Dayton, RSF, 3-14-1974 (3 OT)51, UNLV vs. Loyola Marymount, RF, 3-25-199050, Utah vs. Saint Joseph’s, N3d, 3-25-1961 (4
OT)50, Kentucky vs. Austin Peay, RSF, 3-15-1973
(OT)50, Notre Dame vs. Austin Peay, 1st R, 3-9-197449, Notre Dame vs. Vanderbilt, R3d, 3-16-197449, UNLV vs. San Francisco, 1st R, 3-12-197749, North Carolina vs. Loyola Marymount, 2d R,
3-19-198849, Loyola Marymount vs. Michigan, 2d R, 3-18-
1990
Fewest Field Goals8, Springfield vs. Indiana, 1st R, 3-20-19409, Pittsburgh vs. North Carolina, RSF, 3-21-19419, North Carolina vs. Pittsburgh, RSF, 3-21-19419, Oklahoma St. vs. Kentucky, CH, 3-26-194910, Wisconsin vs. Pittsburgh, NSF, 3-22-194110, Kentucky vs. Dartmouth, NSF, 3-21-194210, Harvard vs. Ohio St., 1st R, 3-21-194611, nine tied (most recent: Montana vs. Syracuse,
2d R, 3-21-2013)
Field Goals Attempted112, Marshall vs. Louisiana, 1st R, 3-11-1972106, Indiana vs. Miami (OH), R3d, 3-15-1958103, Saint Joseph’s vs. West Virginia, R3d,
3-12-1960103, Utah vs. Saint Joseph’s, N3d, 3-25-1961
(4 OT)103, Loyola Marymount vs. North Carolina, 2d
R, 3-19-1988102, Notre Dame vs. Houston, R3d, 3-20-1971101, Holy Cross vs. North Carolina St., RSF,
3-24-1950100, Iowa vs. Morehead St., RSF, 3-16-1956100, UCLA vs. San Francisco, RSF, 3-16-1956100, Houston vs. Pacific, R3d, 3-12-1966100, Rutgers vs. UCLA, N3d, 3-29-1976
*Record later vacated
105, *Western Ky. vs. Villanova, NSF, 3-25-1971 (2 OT)
101, *Saint Joseph’s vs. Utah, N3d, 3-25-1961 (4 OT)
Field-Goal Percentage80.0% (28-35), Oklahoma St. vs. Tulane, 2d R,
3-22-199279.0% (49-62), North Carolina vs. Loyola
Marymount, 2d R, 3-19-198878.6% (22-28), Villanova vs. Georgetown, CH,
4-1-198575.0% (33-44), Northeastern vs. VCU, 1st R,
3-16-198474.4% (29-39), Georgetown vs. Oregon St., RF,
3-20-198273.2% (30-41), North Carolina St. vs. UTEP, 2d
R, 3-17-198571.4% (30-42), Villanova vs. Marshall, 1st R,
3-16-198471.4% (25-35), Georgetown vs. Notre Dame, 2d
R, 3-19-198971.4% (35-49), Villanova vs. Oklahoma, NSF,
4-2-201670.5% (31-44), Washington vs. Duke, 2d R,
3-18-1984*Record later vacated
72.7% (40-55), *Alabama vs. New Orleans, 2d R, 3-14-1987
Lowest Field-Goal Percentage12.7% (8-63), Springfield vs. Indiana, RSF, 3-20-
194013.9% (10-72), Harvard vs. Ohio St., RSF, 3-21-
194618.8% (12-64), Butler vs. UConn, CH, 4-4-201119.4% (14-72), Creighton vs. Cincinnati, RSF,
3-16-1962
19.5% (15-77), North Carolina St. vs. Baylor, N3d, 3-28-1950
19.7% (13-66), Mississippi Val. vs. UCLA, 1st R, 3-20-2008
20.4% (11-54), Montana vs. Syracuse, 2d R, 3-21-2013
20.6% (13-63), Arkansas vs. Oregon St., RSF, 3-18-1949
20.7% (12-58), Cal Poly vs. Wichita St., 2d R, 3-21-2014
21.5% (14-65), Washington St. vs. Wisconsin, CH, 3-29-1941
Three-Point Field Goals21, Loyola Marymount vs. Michigan, 2d R, 3-18-
199018, Duke vs. Monmouth, 1st R, 3-15-200118, West Virginia vs. Louisville, RF, 3-26-2005
(OT)17, Loyola Marymount vs. UNLV, RF, 3-25-199016, Kentucky vs. Wake Forest, RSF, 3-25-199316, Georgia Tech vs. Boston College, 2d R,
3-17-199616, UC Santa Barbara vs. Arizona, 1st R, 3-14-
200216, Illinois vs. Arizona, RF, 3-26-200516, Indiana vs. Gonzaga, 2d R, 3-18-200616, Tennessee vs. Ohio St., RSF, 3-22-200716, Drake vs. Western Ky., 1st R, 3-21-2008 (OT)16, Ohio St. vs. George Mason, 3d R, 3-20-201116, Michigan vs. Oklahoma St., 1st R, 3-17-2017
Three-Point Field Goals Attempted
43, Saint Joseph’s vs. Boston College, 2d R, 3-15-1997 (OT)
42, LIU Brooklyn vs. Villanova, 1st R, 3-13-199742, Drake vs. Western Ky., 1st R, 3-21-2008 (OT)41, Loyola Marymount vs. UNLV, RF, 3-25-199040, Loyola Marymount vs. Michigan, 2d R, 3-18-
199040, Illinois vs. North Carolina, CH, 4-4-200539, Loyola Marymount vs. North Carolina, 2d R,
3-19-198839, Loyola Marymount vs. Arkansas, 1st R,
3-16-198939, Saint Louis vs. Wake Forest, 2d R, 3-18-199538, Kentucky vs. Marquette, 2d R, 3-20-199438, Chattanooga vs. UConn, 1st R, 3-16-199538, Duke vs. Monmouth, 1st R, 3-15-200138, Oregon vs. Mississippi St., 1st R, 3-21-2008
Three-Point Field-Goal Percentage(Minimum Seven 3FGM)
88.9% (8-9), Kansas St. vs. Georgia, 1st R, 3-12-1987 (OT)
80.0% (8-10), Kansas St. vs. Purdue, RSF, 3-25-1988
80.0% (8-10), Maryland vs. Massachusetts, 2d R, 3-19-1994
78.9% (15-19), Indiana vs. Kent St., RF, 3-23-2002
77.8% (7-9), Colorado vs. Indiana, 1st R, 3-13-1997
76.9% (10-13), Kansas St. vs. DePaul, 2d R, 3-19-1988
Tournament Records 90
73.7% (14-19), Duke vs. Southern Ill., 1st R, 3-18-1993
73.3% (11-15), Texas vs. Princeton, 1st R, 3-18-2004
72.7% (8-11), Duke vs. Indiana, RSF, 3-20-198772.7% (8-11), Alabama vs. Colorado St., 1st R,
3-16-199072.7% (8-11), Kansas vs. California, RSF, 3-25-
199372.7% (8-11), Oregon vs. Saint Louis, 3d R,
3-23-2013*Record later vacated
81.8% (9-11), *Alabama vs. N.C. A&T, 1st R, 3-13-1987
Free Throws Made43, Arizona vs. Illinois, RF, 3-25-200141, Utah vs. Santa Clara, R3d, 3-12-196041, Navy vs. Syracuse, 2d R, 3-16-198639, Seattle U. vs. Utah, R3d, 3-12-195539, UTEP vs. Tulsa, 1st R, 3-15-198538, Bradley vs. Colorado, RSF, 3-12-195438, Loyola Chicago vs. Kentucky, R3d, 3-14-
196437, Morehead St. vs. Pittsburgh, 1st R, 3-11-
195737, Jacksonville vs. St. Bonaventure, NSF, 3-19-
197037, Xavier vs. Kansas St., 1st R, 3-16-1990
*Record later vacated
37, *Saint Joseph’s vs. Utah, N3d, 3-25-1961 (4 OT)
Free Throws Attempted56, Arizona vs. Illinois, RF, 3-25-200155, UTEP vs. Tulsa, 1st R, 3-15-198554, Morehead St. vs. Pittsburgh, 1st R, 3-11-
195753, Morehead St. vs. Iowa, RSF, 3-16-195652, Iowa vs. Morehead St., RSF, 3-16-195652, Seattle U. vs. UCLA, R3d, 3-17-195652, Weber St. vs. Hawaii, 1st R, 3-11-197252, Navy vs. Syracuse, 2d R, 3-16-198651, Seattle U. vs. Utah, R3d, 3-12-195550, West Virginia vs. Saint Joseph’s, RSF, 3-13-
195950, Notre Dame vs. Kansas, 1st R, 3-15-1975
Free-Throw Percentage(Minimum 15 FTM)
100% (22-22), Fordham vs. South Carolina, R3d, 3-20-1971
100% (18-18), Kentucky vs. Utah, 2d R, 3-23-2003
100% (17-17), Dayton vs. Villanova, 1st R, 3-15-1985
100% (17-17), Villanova vs. Kentucky, RSF, 3-24-1988
100% (17-17), Notre Dame vs. West Virginia, 2d R, 3-18-2017
96.2% (25-26), Texas vs. New Mexico St., 1st R, 3-16-2007
96.0% (24-25), Georgia Tech vs. Oklahoma St., 1st R, 3-19-2010
95.8% (23-24), Oklahoma St. vs. Loyola (LA), 1st R, 3-11-1958
95.7% (22-23), Villanova vs. Pittsburgh, RF, 3-28-2009
95.5% (21-22), Vanderbilt vs. Marquette, RSF, 3-14-1974
95.5% (21-22), UConn vs. North Carolina St., 2d R, 3-17-2002
95.5% (21-22), UConn vs. Michigan St., RF, 3-30-2014
Rebounds86, Notre Dame vs. Tennessee Tech, 1st R,
3-11-195876, Temple vs. UConn, RSF, 3-16-195676, Houston vs. North Carolina, N3d, 3-25-196776, Houston vs. TCU, RF, 3-25-196876, UCLA vs. Weber St., RSF, 3-18-197272, UCLA vs. Seattle U., R3d, 3-17-195672, Seattle U. vs. Utah St., R3d, 3-14-196471, Kansas St. vs. Houston, R3d, 3-17-197070, Western Ky. vs. Miami (FL), 1st R, 3-8-196070, Arizona St. vs. Southern California, RSF,
3-17-1961
Rebound Margin42, Notre Dame (86) vs. Tennessee Tech (44),
1st R, 3-11-195835, St. John’s (NY) (56) vs. UConn (21), 1st R,
3-20-195135, Kansas (64) vs. Prairie View (29), 1st R,
3-13-199834, Kansas (61) vs. Jackson St. (27), 1st R,
3-13-199733, Cincinnati (68) vs. Texas Tech (35), RSF,
3-17-196133, Kansas (56) vs. Syracuse (23), 2d R, 3-18-
200133, North Carolina (63) vs. Ohio (30), RSF, 3-23-
2012 (OT)30, Louisiana Tech (56) vs. Pittsburgh (26), 1st
R, 3-14-198530, Kansas (45) vs. Evansville (15), 1st R, 3-12-
199929, West Virginia (63) vs. Dartmouth (34), 1st R,
3-10-195929, Utah (59) vs. Loyola Marymount (30), RSF,
3-17-196129, Indiana (52) vs. Robert Morris (23), 1st R,
3-11-198229, Texas (45) vs. West Virginia (16), RSF, 3-23-
2006
Assists36, North Carolina vs. Loyola Marymount, 2d R,
3-19-198835, UNLV vs. Loyola Marymount, RF, 3-25-199035, Kentucky vs. San Jose St., 1st R, 3-14-199633, Loyola Marymount vs. Michigan, 2d R, 3-18-
199033, Kansas vs. Chattanooga, 1st R, 3-17-199433, Kentucky vs. Mt. St. Mary’s, 1st R, 3-16-199532, Arkansas vs. Georgia St., 1st R, 3-15-199132, Kansas vs. Howard, 1st R, 3-20-199232, Kansas vs. South Carolina St., 1st R, 3-15-
1996*Record later vacated
32, *Michigan vs. ETSU, 2d R, 3-22-1992
Blocked Shots15, Kentucky vs. Stony Brook, 1st R, 3-17-201614, Kentucky vs. UCLA, RSF, 3-20-199813, Louisville vs. Illinois, RSF, 3-24-198913, BYU vs. Virginia, 1st R, 3-14-199113, Kansas vs. Jackson St., 1st R, 3-13-199713, UCLA vs. Mississippi Val., 1st R, 3-20-200813, Wake Forest vs. Cleveland St., 1st R, 3-20-
200912, Clemson vs. Saint Mary’s (CA), 1st R, 3-16-
198912, LSU vs. BYU, 1st R, 3-19-199212, Massachusetts vs. Stanford, 2d R, 3-19-199512, Wyoming vs. Gonzaga, 1st R, 3-14-200212, Kansas vs. Dayton, 2d R, 3-22-200912, Ohio St. vs. UC Santa Barbara, 1st R, 3-19-
201012, Memphis vs. Saint Mary’s (CA), 2d R, 3-21-
201312, Arizona vs. Weber St., 1st R, 3-21-2014
Steals19, Providence vs. Austin Peay, 2d R, 3-14-1987
(OT)19, UConn vs. Boston U., 1st R, 3-15-199019, Washington vs. UConn, RSF, 3-24-200618, Xavier vs. Kansas, 1st R, 3-18-198818, Arkansas vs. Holy Cross, 1st R, 3-18-199318, Louisville vs. Tulsa, 1st R, 3-15-199618, Mississippi Val. vs. Georgetown, 1st R, 3-15-
199618, Penn St. vs. North Carolina, 2d R, 3-18-200117, Seton Hall vs. Pepperdine, 1st R, 3-14-199117, Duke vs. St. John’s (NY), RF, 3-24-199117, Kentucky vs. Tennessee St., 1st R, 3-18-
199417, Duke vs. Michigan St., 2d R, 3-20-199417, Kentucky vs. San Jose St., 1st R, 3-14-199617, Duke vs. Radford, 1st R, 3-13-199817, Duke vs. UCLA, RSF, 3-22-200117, Kansas vs. UCLA, RSF, 3-24-2007
*Record later vacated
20, *Louisville vs. N.C. A&T, 2d R, 3-21-2013
Personal Fouls41, Dayton vs. Illinois, RSF, 3-21-195239, Kansas vs. Notre Dame, 1st R, 3-15-197536, UCLA vs. Seattle U., R3d, 3-17-195636, North Carolina vs. Texas A&M, 2d R, 3-9-
198036, Illinois vs. Arizona, RF, 3-25-200135, St. John’s (NY) vs. Kansas, CH, 3-26-195235, Iowa vs. Morehead St., RSF, 3-16-195635, Hawaii vs. Weber St., 1st R, 3-11-197235, DePaul vs. VMI, RSF, 3-18-1976 (OT)35, DePaul vs. Boston College, 2d R, 3-14-1982
*Record later vacated
35, *Texas Tech vs. Georgetown, RSF, 3-21-1996
Players Disqualified6, Kansas vs. Notre Dame, 1st R, 3-15-19756, Illinois vs. Arizona, RF, 3-25-20015, Dayton vs. Illinois, RSF, 3-21-1952
Tournament Records 91
5, Saint Joseph’s vs. West Virginia, RSF, 3-13-1959
5, DePaul vs. VMI, RSF, 3-18-1976 (OT)5, DePaul vs. Boston College, 2d R, 3-14-19825, Syracuse vs. Virginia, RSF, 3-22-19845, Wyoming vs. Loyola Marymount, 1st R, 3-17-
19885, Washington vs. UConn, RSF, 3-24-2006 (OT)4, 30 tied (most recent: *Texas Tech vs.
Georgetown, RSF, 3-21-1996)*Record later vacated
TWO-TEAM GAMEPoints
264, Loyola Marymount (149) vs. Michigan (115), 2d R, 3-18-1990
234, Loyola Marymount (119) vs. Wyoming (115), 1st R, 3-17-1988
232, UNLV (131) vs. Loyola Marymount (101), RF, 3-25-1990
227, Iowa (121) vs. Notre Dame (106), R3d, 3-14-1970
225, Houston (119) vs. Notre Dame (106), R3d, 3-20-1971
223, Arizona (114) vs. UNLV (109), RSF, 3-18-1976 (OT)
221, Arkansas (120) vs. Loyola Marymount (101), 1st R, 3-16-1989
220, North Carolina (123) vs. Loyola Marymount (97), 2d R, 3-19-1988
216, UNLV (121) vs. San Francisco (95), 1st R, 3-12-1977
216, West Virginia (111) vs. Wake Forest (105), 2d R, 3-19-2005 (2 OT)
*Record later vacated
247, *Saint Joseph’s (127) vs. Utah (120), N3d, 3-25-1961 (4 OT)
Fewest Points46, Pittsburgh (26) vs. North Carolina (20), RF,
3-21-194159, Duquesne (30) vs. Western Ky. (29), RF,
3-20-194066, Wisconsin (36) vs. Pittsburgh (30), NSF,
3-22-194169, Indiana (39) vs. Duquesne (30), NSF, 3-21-
194070, Southern California (38) vs. Colorado (32),
RF, 3-20-194071, Utah (40) vs. Iowa St. (31), NSF, 3-24-194472, Villanova (42) vs. Brown (30), RF, 3-17-193972, Indiana (48) vs. Springfield (24), RF, 3-20-
194073, Wisconsin (39) vs. Washington St. (34), CH,
3-29-194173, Oklahoma St. (44) vs. Baylor (29), RF, 3-22-
194673, Georgetown (37) vs. SMU (36), RSF, 3-23-
1984
Field Goals97, Iowa (52) vs. Notre Dame (45), R3d, 3-14-
197096, Kentucky (50) vs. Austin Peay (46), RSF,
3-15-1973 (OT)
94, Loyola Marymount (49) vs. Michigan (45), 2d R, 3-18-1990
91, UCLA (51) vs. Dayton (40), RSF, 3-14-1974 (3 OT)
*Record later vacated
95, Utah (50) vs. *Saint Joseph’s (45), N3d, 3-25-1961 (4 OT)
Field Goals Attempted196, Austin Peay (99) vs. Kentucky (97), RSF,
3-15-1973 (OT)195, Iowa (98) vs. Notre Dame (97), R3d, 3-14-
1970194, Indiana (106) vs. Miami (OH) (88), R3d,
3-15-1958194, Houston (100) vs. Pacific (94), R3d, 3-12-
1966*Record later vacated
204, Utah (103) vs. *Saint Joseph’s (101), N3d, 3-25-1961 (4 OT)
Three-Point Field Goals30, Drake (16) vs. Western Ky. (14), 1st R, 3-21-
2008 (OT)29, West Virginia (18) vs. Louisville (11), RF,
3-26-2005 (OT)28, Seton Hall (15) vs. Temple (13), 2d R, 3-19-
2000 (OT)27, Missouri (15) vs. Marquette (12), 2d R, 3-22-
2003 (OT)*Record later vacated
27, Wisconsin (15) vs. *Missouri (12), 2d R, 3-19-1994
Three-Point Field Goals Attempted
71, BYU (37) vs. Florida (34), RSF, 3-24-2011 (OT)
70, Drake (42) vs. Western Ky. (28), 1st R, 3-21-2008 (OT)
66, UCLA (36) vs. Cincinnati (30), 2d R, 3-17-2002
65, UNI (34) vs. Texas A&M (31), 2d R, 3-20-2016 (2OT)
62, Arkansas (34) vs. North Carolina (28), NSF, 4-1-1995
62, Saint Joseph’s (43) vs. Boston College (19), 2d R, 3-15-1997 (OT)
62, Temple (32) vs. Seton Hall (30), 2d R, 3-19-2000 (OT)
Free Throws69, Morehead St. (37) vs. Pittsburgh (32), 1st R,
3-11-195768, Iowa (35) vs. Morehead St. (33), RSF, 3-16-
195668, Oklahoma City (35) vs. Kansas St. (33), RSF,
3-16-195664, Bradley (38) vs. Colorado (26), RSF, 3-12-
195463, four tied (most recent: Arizona [43] vs. Illinois
[20], RF, 3-25-2001)
Free Throws Attempted105, Morehead St. (53) vs. Iowa (52), RSF,
3-16-195697, Morehead St. (54) vs. Pittsburgh (43), 1st R,
3-11-1957
92, Oklahoma City (48) vs. Kansas St. (44), RSF, 3-16-1956
92, Seattle U. (52) vs. UCLA (40), R3d, 3-17-1956
91, Manhattan (49) vs. West Virginia (42), 1st R, 3-11-1958
Rebounds132, Pacific (67) vs. Houston (65), R3d, 3-12-
1966131, Houston (76) vs. TCU (55), RF, 3-16-1968130, Notre Dame (86) vs. Tennessee Tech (44),
1st R, 3-11-1958130, UCLA (76) vs. Weber St. (54), RSF, 3-18-
1972128, UCLA (72) vs. Seattle U. (56), R3d, 3-17-
1956128, Houston (76) vs. North Carolina (52), N3d,
3-25-1967126, Drake (66) vs. Notre Dame (60), RSF, 3-18-
1971 (OT)124, three tied (most recent: Kansas St. [71] vs.
Houston [53], R3d, 3-17-1970)*Record later vacated
134, Marshall (68) vs. *Louisiana (66), 1st R, 3-11-1972
128, Utah (65) vs. *Saint Joseph’s (63), N3d, 3-25-1961 (4 OT)
Assists58, UNLV (35) vs. Loyola Marymount (23), RF,
3-25-199054, Loyola Marymount (33) vs. Michigan (21), 2d
R, 3-18-199053, North Carolina (36) vs. Loyola Marymount
(17), 2d R, 3-19-198852, Wyoming (29) vs. Loyola Marymount (23), 1st
R, 3-17-1988*Record later vacated
55, Michigan (30) vs. *Florida (25), 2d R, 3-19-1988
Blocked Shots20, Kentucky (14) vs. UCLA (6), RSF, 3-20-199818, Iowa (10) vs. Duke (8), 2d R, 3-21-199218, Kansas (13) vs. Jackson St. (5), 1st R, 3-13-
199718, UCLA (13) vs. Mississippi Val. (5), 1st R,
3-20-200818, Memphis (11) vs. Mississippi St. (7), 2d R,
3-23-200818, Kansas (12) vs. Dayton (6), 2d R, 3-22-200918, Kentucky (15) vs. Stony Brook (3), 1st R,
3-17-2016
Steals32, Kansas (17) vs. UCLA (15), RF, 3-24-200728, N.C. A&T (16) vs. Arkansas (12), 1st R,
3-18-199428, Purdue (16) vs. Delaware (12), 1st R, 3-13-
199828, TCU (16) vs. Florida St. (12), 1st R, 3-13-
199828, Florida (15) vs. Weber St. (13), 2d R, 3-13-
1999
Tournament Records 92
Personal Fouls68, Iowa (35) vs. Morehead St. (33), RSF, 3-16-
195663, UNLV (34) vs. Arizona (29), RSF, 3-18-197661, Dayton (41) vs. Illinois (20), RSF, 3-21-195261, Colorado (34) vs. Bradley (27), RSF, 3-12-
195461, West Virginia (32) vs. Manhattan (29), 1st R,
3-11-195861, Kentucky (31) vs. Syracuse (30), NSF, 3-29-
197561, Utah (33) vs. Pepperdine (28), 1st R, 3-19-
1979
TEAM GAME, OVERTIMES
Overtime Periods4, Canisius (79) vs. North Carolina St. (78), 1st
R, 3-12-19563, North Carolina (74) vs. Michigan St. (70), NSF,
3-22-19573, North Carolina (54) vs. Kansas (53), CH,
3-23-19573, UCLA (111) vs. Dayton (100), RSF, 3-14-19743, Villanova (76) vs. Northeastern (72), 2d R,
3-14-19823, Old Dominion (89) vs. Villanova (81), 1st R,
3-17-1995*Record later vacated
4, *Saint Joseph’s (127) vs. Utah (120), N3d, 3-25-1961
Points in Overtimes34, West Virginia vs. Wake Forest, 2d R, 3-19-
2005 (2 OT)31, Utah vs. Saint Joseph’s, N3d, 3-25-1961 (4
OT)31, UCLA vs. Dayton, RSF, 3-14-1974 (3 OT)31, Old Dominion vs. Villanova, 1st R, 3-17-1995
(3 OT)*Record later vacated
38, *Saint Joseph’s vs. Utah, N3d, 3-25-1961 (4 OT)
Points in Overtimes, Both Teams
62, West Virginia (34) vs. Wake Forest (28), 2d R, 3-19-2005 (2 OT)
54, Old Dominion (31) vs. Villanova (23), 1st R, 3-17-1995 (3 OT)
53, Kansas St. (29) vs. Xavier (24), RSF, 3-25-2010 (2 OT)
51, UCLA (31) vs. Dayton (20), RSF, 3-14-1974 (3 OT)
48, North Carolina St. (27) vs. Iowa (21), 2d R, 3-19-1989 (2 OT)
*Record later vacated
69, *Saint Joseph’s (38) vs. Utah (31), N3d, 3-25-1961 (4 OT)
Points in One Overtime Period
25, Texas A&M vs. North Carolina, 2d R, 3-9-1980 (2d OT)
24, Alabama vs. Penn, 1st R, 3-16-199522, Wake Forest vs. Saint Joseph’s, RSF, 3-16-
196221, LSU vs. Purdue, 1st R, 3-13-1986 (2d OT)21, Marquette vs. Missouri, 2d R, 3-22-2003
Points in One Overtime Period, Both Teams
42, Alabama (24) vs. Penn (18), 1st R, 3-16-199535, LSU (21) vs. Purdue (14), 1st R, 3-13-1986
(2d OT)33, Wake Forest (22) vs. Saint Joseph’s (11),
RSF, 3-16-196233, Texas A&M (25) vs. North Carolina (8), 2d R,
3-9-1980 (2d OT)33, Marquette (21) vs. Missouri (12), 2d R, 3-22-
2003
Fewest Points In One Overtime Period
0, nine tied (most recent: VCU vs. Tennessee, 2d R, 3-15-1981)
Fewest Points In One Overtime Period, Both Teams
0, Canisius vs. North Carolina St., 1st R, 3-12-1956 (3d OT)
0, North Carolina vs. Kansas, CH, 3-23-1957 (2d OT)
0, Texas A&M vs. North Carolina, 2d R, 3-9-1980 (1st OT)
1, Southern California (1) vs. Santa Clara (0), RF, 3-13-1954 (2d OT)
2, Tennessee (2) vs. VCU (0), 2d R, 3-15-1981 (1st OT)
Largest Winning Margin in an Overtime Game
17, Texas A&M (78) vs. North Carolina (61), 2d R, 3-9-1980 (2 OT)
14, North Carolina St. (80) vs. Little Rock (66), 2d R, 3-16-1986 (2 OT)
12, UCLA (103) vs. Michigan (91), 1st R, 3-15-1975
12, Louisville (80) vs. Kentucky (68), RF, 3-26-1983
12, Boston College (88) vs. Pacific (76), 1st R, 3-16-2006
12, Georgetown (96) vs. North Carolina (84), RF, 3-25-2007
Overtime Games by One Team in One Tournament
3, Syracuse, 19752, 24 tied (most recent: Florida in 2011)
Overtime Periods by One Team in One Tournament
6, North Carolina, 1957 (2 games)5, UCLA, 1974 (2)
4, Canisius, 1956 (1)4, North Carolina St., 1956 (1)4, Kansas, 1957 (2)4, Utah, 1961 (1)
*Record later vacated
4, *Saint Joseph’s, 1961 (1)
TEAM SERIES(Three-Game Minimum for Averages and Per cent ages)
Points571, UNLV, 1990 (6 games)552, Oklahoma, 1988 (6)540, Michigan, 1989 (6)535, Indiana, 1987 (6)535, Kentucky, 1996 (6)
Scoring Average105.8 (423 points in 4 games), Loyola Marymount,
1990105.7 (317 in 3), Notre Dame, 1970101.0 (505 in 5), UNLV, 1977100.0 (400 in 4), UCLA, 1965
*Record later vacated
98.7 (296 in 3), *Louisiana, 1972
Scoring Margin23.75, UCLA, 1967 (4 games)23.00, Loyola Chicago, 1963 (5)22.60, Indiana, 1981 (5)21.50, Kentucky, 1996 (6)21.30, UCLA, 1968 (4)
Field Goals218, UNLV, 1977 (5 games)217, Michigan, 1989 (6)217, UNLV, 1990 (6)206, Oklahoma, 1988 (6)203, Louisville, 1986 (6)
Field Goals Attempted441, UNLV, 1977 (5 games)418, Houston, 1968 (5)412, Oklahoma, 1988 (6)410, UNLV, 1990 (6)
*Record later vacated
442, *Western Ky., 1971 (5)
Field Goal Percentage60.4% (113-187), North Carolina, 1975 (3 games)59.6% (96-161), Michigan, 1988 (3)59.0% (92-156), Michigan St., 1978 (3)58.2% (85-146), Wake Forest, 1993 (3)58.2% (181-311), Villanova, 2016 (6)
*Record later vacated
58.6% (99-169), *Alabama, 1987 (3)
Three-Point Field Goals61, VCU, 2011 (6 games)60, Arkansas, 1995 (6)60, Duke, 2001 (6)
Tournament Records 93
57, Illinois, 2005 (6)56, Loyola Marymount, 1990 (4)56, Villanova, 2016 (6)
Three-Point Field Goals Attempted
175, Duke, 2001 (6 games)165, Arkansas, 1995 (6)160, Butler, 2011 (6)158, Illinois, 2005 (6)143, VCU, 2011 (6)
Three-Point Field-Goal Percentage(Minimum 12 3FGM)
60.9% (14-23), Indiana, 1989 (3 games)59.3% (16-27), St. John’s (NY), 1991 (4)56.7% (17-30), North Carolina, 2015 (3)54.0% (27-50), Virginia, 1989 (4)53.8% (28-52), Kansas, 2007 (4)53.5% (23-43), Miami (OH), 2000 (3)
Three-Point Field Goal Percentage(Minimum 30 3FGM)
51.9% (40-77), Kansas, 1993 (5 games)51.5% (34-66), Ohio St., 2011 (3)50.8% (33-65), Kansas St., 1988 (4)50.5% (47-93), Indiana, 2002 (6)50.0% (56-112), Villanova, 2016 (6)49.4% (40-81), Marquette, 2003 (5)
Free Throws Made146, Bradley, 1954 (5 games)136, Duke, 1990 (5)136, Duke, 1992 (6)135, Florida, 2007 (6)
*Record later vacated
136, *UCLA, 1980 (6)
Free Throws Attempted194, Bradley, 1954 (5 games)192, West Virginia, 1959 (5)185, Florida, 2007 (6)183, Duke, 1990 (5)183, Duke, 1992 (6)
Free-Throw Percentage89.0% (89-100), Arizona, 2015 (4 games)87.8% (101-115), UConn, 2014 (6)87.0% (47-54), St. John’s (NY), 1969 (3)85.7% (36-42), Utah, 1996 (3)85.5% (47-55), Notre Dame, 1987 (3)85.5% (47-55), BYU, 2011 (3)85.5% (53-62), Arizona, 2017 (3)
Rebounds306, Houston, 1968 (5 games)270, North Carolina, 2017 (6)268, New Mexico St., 1970 (5)264, UConn, 2004 (6)262, UNLV, 1990 (6)257, Gonzaga, 2017 (6)252, Kansas, 2012 (6)
*Record later vacated
289, *Western Ky., 1971 (5)
Assists143, Kentucky, 1996 (6 games)140, UNLV, 1990 (6)136, Oklahoma, 1988 (6)125, Michigan, 1989 (6)120, Louisville, 1986 (6)
Blocked Shots48, Kentucky, 1998 (6 games)45, Kentucky, 2012 (6)44, Florida, 2006 (6)42, Arizona, 2001 (6)42, UCLA, 2008 (5)
Steals72, Oklahoma, 1988 (6 games)71, Kentucky, 1996 (6)65, Arkansas, 1995 (6)64, Kentucky, 1997 (6)
*Record later vacated
65, *Louisville, 2013 (6)
Personal Fouls150, Penn, 1979 (6 games)135, Providence, 1987 (5)130, Arkansas, 1995 (6)128, Kentucky, 1975 (5)126, Kentucky, 1997 (6)
Tournament History Rankings 94
TOURNAMENT HISTORY RANKINGS
TEAM RECORDS*Does not include vacated years
Tournament Appearances56, *Kentucky, 1942-201748, North Carolina, 1941-201746, Kansas, 1940-201746, *UCLA, 1950-201741, Duke, 1955-201739, Indiana, 1940-201638, *Louisville, 1951-201736, Notre Dame, 1953-201736, *Syracuse, 1957-201736, *Villanova, 1942-2017
Consecutive Tournament Appearances28, Kansas, 1990-201727, North Carolina, 1975-200122, Duke, 1996-201720, Michigan St., 1998-201719, Gonzaga, 1999-201719, Wisconsin, 1999-201718, Indiana, 1986-200317, Kentucky, 1992-200814, #Arizona, 1985-9814, Cincinnati, 1992-200514, Georgetown, 1979-9214, Texas, 1999-2012
#Arizona had an actual streak of 25 from 1985 to 2009, but its 1999 and 2008 appearances were later vacated. Note: UCLA had a streak of 14 from 1989 to 2002 but their 1999 appearance was later vacated.
Current Consecutive Tournament Appearances
28, Kansas, 1990-201722, Duke, 1996-201720, Michigan St., 1998-201719, Gonzaga, 1999-201719, Wisconsin, 1999-20177, Cincinnati, 2011-177, North Carolina, 2011-177, VCU, 2011-176, Iowa St., 2012-176, Wichita St., 2012-175, Arizona, 2013-175, Oregon, 2013-175, Villanova, 2013-174, Baylor, 2014-174, Dayton, 2014-174, Kentucky, 2014-174, Providence, 2014-174, Virginia, 2014-174, Xavier, 2014-17
Tournament Games174, *Kentucky, 1942-2017168, North Carolina, 1941-2017148, Kansas, 1940-2017144, Duke, 1955-2017140, *UCLA, 1950-2017101, *Louisville, 1951-2017100, Indiana, 1940-201697, *Syracuse, 1957-201694, Michigan St., 1957-201789, *Villanova, 1939-201787, *Arizona, 1951-201786, *UConn, 1951-2016
Tournament Wins124, *Kentucky, 1942-2017123, North Carolina, 1941-2017108, Duke, 1955-2017103, Kansas, 1940-2017101, *UCLA, 1950-201766, Indiana, 1940-201664, Michigan St., 1957-201761, *Louisville, 1951-201761, *Syracuse, 1957-201657, *UConn, 1951-2016
Consecutive Tournament Wins38, UCLA, 1964-7413, Duke, 1991-9312, Cincinnati, 1960-6312, Florida, 2006-0712, Kentucky, 1945-5211, Arkansas, 1994-9511, Kentucky, 1996-9711, Kentucky, 2012-1411, San Francisco, 1955-5710, Georgetown, 1984-8510, Michigan St., 2000-0110, UNLV, 1990-91
Tournament Winning Percentage(Minimum 20 Games)
.750 (108-36), Duke, 1955-2017
.732 (123-45), North Carolina, 1941-2017
.724 (42-16), *Florida, 1987-2017
.723 (101-39), *UCLA, 1950-2017
.713 (124-50), *Kentucky, 1942-2017
.696 (103-45), Kansas, 1940-2017
.681 (64-30), Michigan St., 1957-2017
.671 (47-23), *Michigan, 1948-2017
.663 (57-29), *UConn, 1951-2016
.660 (66-34), Indiana, 1940-2016
Tournament History Rankings 95
Tournament Match-Ups, All-Time10, Kentucky vs. Marquette, 1955-20087, North Carolina vs. Villanova, 1982-20167, San Francisco vs. UCLA, 1956-796, Arkansas vs. North Carolina, 1990-20176, Kansas vs. North Carolina, 1957-20136, Kentucky vs. Ohio St., 1945-20116, Kentucky vs. Utah, 1993-20055, UConn vs. Duke, 1964-20045, Duke vs. Kansas, 1986-20035, Duke vs. Kentucky, 1966-19985, Duke vs. Michigan St., 1994-20155, Indiana vs. Kentucky, 1973-20165, Indiana vs. LSU, 1953-925, Kansas vs. UCLA, 1971-20075, Louisville vs. UCLA, 1972-925, Michigan St. vs. North Carolina, 1957-2009
*Kentucky and Louisville have met six times between 1951-2014. The 2012 and 2014 appearances by Louisville were later vacated by the Committee on Infractions.
Tournament Scoring Leaders 96
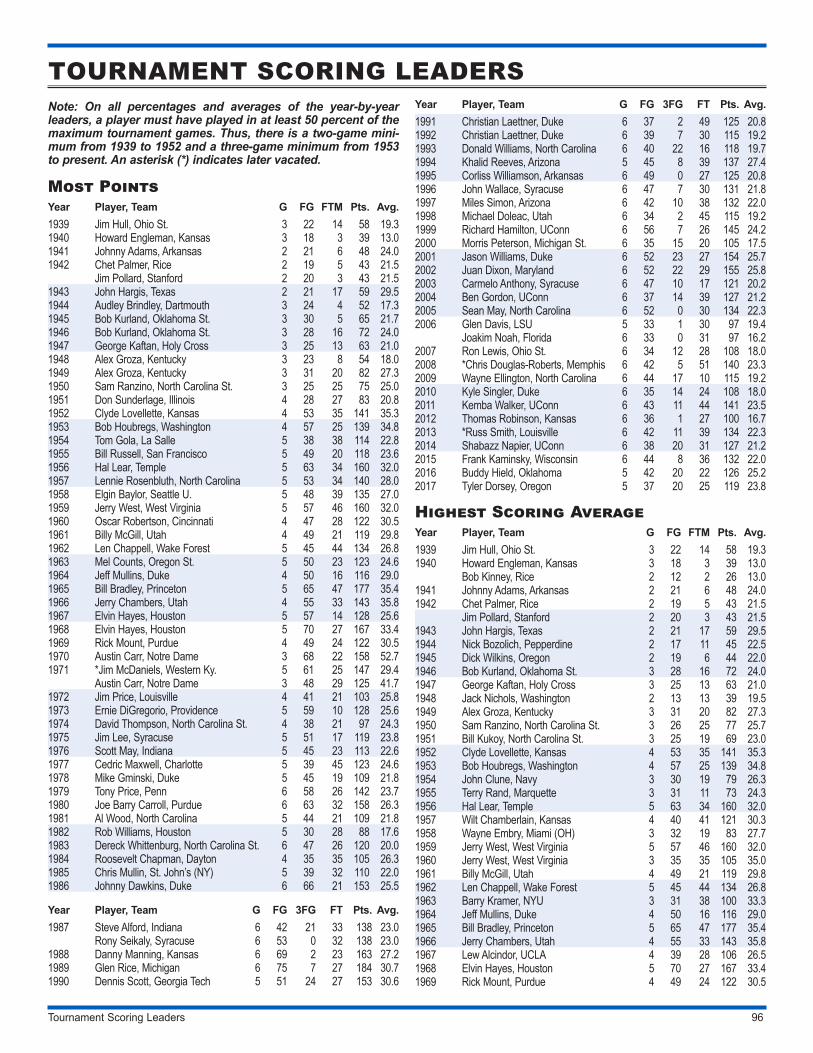
TOURNAMENT SCORING LEADERSNote: On all percentages and averages of the year-by-year leaders, a player must have played in at least 50 percent of the maximum tournament games. Thus, there is a two-game mini-mum from 1939 to 1952 and a three-game minimum from 1953 to present. An asterisk (*) indicates later vacated.
Most PointsYear Player, Team G FG FTM Pts. Avg.1939 Jim Hull, Ohio St. 3 22 14 58 19.31940 Howard Engleman, Kansas 3 18 3 39 13.01941 Johnny Adams, Arkansas 2 21 6 48 24.01942 Chet Palmer, Rice 2 19 5 43 21.5
Jim Pollard, Stanford 2 20 3 43 21.51943 John Hargis, Texas 2 21 17 59 29.51944 Audley Brindley, Dartmouth 3 24 4 52 17.31945 Bob Kurland, Oklahoma St. 3 30 5 65 21.71946 Bob Kurland, Oklahoma St. 3 28 16 72 24.01947 George Kaftan, Holy Cross 3 25 13 63 21.01948 Alex Groza, Kentucky 3 23 8 54 18.01949 Alex Groza, Kentucky 3 31 20 82 27.31950 Sam Ranzino, North Carolina St. 3 25 25 75 25.01951 Don Sunderlage, Illinois 4 28 27 83 20.81952 Clyde Lovellette, Kansas 4 53 35 141 35.31953 Bob Houbregs, Washington 4 57 25 139 34.81954 Tom Gola, La Salle 5 38 38 114 22.81955 Bill Russell, San Francisco 5 49 20 118 23.61956 Hal Lear, Temple 5 63 34 160 32.01957 Lennie Rosenbluth, North Carolina 5 53 34 140 28.01958 Elgin Baylor, Seattle U. 5 48 39 135 27.01959 Jerry West, West Virginia 5 57 46 160 32.01960 Oscar Robertson, Cincinnati 4 47 28 122 30.51961 Billy McGill, Utah 4 49 21 119 29.81962 Len Chappell, Wake Forest 5 45 44 134 26.81963 Mel Counts, Oregon St. 5 50 23 123 24.61964 Jeff Mullins, Duke 4 50 16 116 29.01965 Bill Bradley, Princeton 5 65 47 177 35.41966 Jerry Chambers, Utah 4 55 33 143 35.81967 Elvin Hayes, Houston 5 57 14 128 25.61968 Elvin Hayes, Houston 5 70 27 167 33.41969 Rick Mount, Purdue 4 49 24 122 30.51970 Austin Carr, Notre Dame 3 68 22 158 52.71971 *Jim McDaniels, Western Ky. 5 61 25 147 29.4
Austin Carr, Notre Dame 3 48 29 125 41.71972 Jim Price, Louisville 4 41 21 103 25.81973 Ernie DiGregorio, Providence 5 59 10 128 25.61974 David Thompson, North Carolina St. 4 38 21 97 24.31975 Jim Lee, Syracuse 5 51 17 119 23.81976 Scott May, Indiana 5 45 23 113 22.61977 Cedric Maxwell, Charlotte 5 39 45 123 24.61978 Mike Gminski, Duke 5 45 19 109 21.81979 Tony Price, Penn 6 58 26 142 23.71980 Joe Barry Carroll, Purdue 6 63 32 158 26.31981 Al Wood, North Carolina 5 44 21 109 21.81982 Rob Williams, Houston 5 30 28 88 17.61983 Dereck Whittenburg, North Carolina St. 6 47 26 120 20.01984 Roosevelt Chapman, Dayton 4 35 35 105 26.31985 Chris Mullin, St. John’s (NY) 5 39 32 110 22.01986 Johnny Dawkins, Duke 6 66 21 153 25.5
Year Player, Team G FG 3FG FT Pts. Avg.1987 Steve Alford, Indiana 6 42 21 33 138 23.0
Rony Seikaly, Syracuse 6 53 0 32 138 23.01988 Danny Manning, Kansas 6 69 2 23 163 27.21989 Glen Rice, Michigan 6 75 7 27 184 30.71990 Dennis Scott, Georgia Tech 5 51 24 27 153 30.6
Year Player, Team G FG 3FG FT Pts. Avg.1991 Christian Laettner, Duke 6 37 2 49 125 20.81992 Christian Laettner, Duke 6 39 7 30 115 19.21993 Donald Williams, North Carolina 6 40 22 16 118 19.71994 Khalid Reeves, Arizona 5 45 8 39 137 27.41995 Corliss Williamson, Arkansas 6 49 0 27 125 20.81996 John Wallace, Syracuse 6 47 7 30 131 21.81997 Miles Simon, Arizona 6 42 10 38 132 22.01998 Michael Doleac, Utah 6 34 2 45 115 19.21999 Richard Hamilton, UConn 6 56 7 26 145 24.22000 Morris Peterson, Michigan St. 6 35 15 20 105 17.52001 Jason Williams, Duke 6 52 23 27 154 25.72002 Juan Dixon, Maryland 6 52 22 29 155 25.82003 Carmelo Anthony, Syracuse 6 47 10 17 121 20.22004 Ben Gordon, UConn 6 37 14 39 127 21.22005 Sean May, North Carolina 6 52 0 30 134 22.32006 Glen Davis, LSU 5 33 1 30 97 19.4
Joakim Noah, Florida 6 33 0 31 97 16.22007 Ron Lewis, Ohio St. 6 34 12 28 108 18.02008 *Chris Douglas-Roberts, Memphis 6 42 5 51 140 23.32009 Wayne Ellington, North Carolina 6 44 17 10 115 19.22010 Kyle Singler, Duke 6 35 14 24 108 18.02011 Kemba Walker, UConn 6 43 11 44 141 23.52012 Thomas Robinson, Kansas 6 36 1 27 100 16.72013 *Russ Smith, Louisville 6 42 11 39 134 22.32014 Shabazz Napier, UConn 6 38 20 31 127 21.22015 Frank Kaminsky, Wisconsin 6 44 8 36 132 22.02016 Buddy Hield, Oklahoma 5 42 20 22 126 25.22017 Tyler Dorsey, Oregon 5 37 20 25 119 23.8
Highest Scoring AverageYear Player, Team G FG FTM Pts. Avg.1939 Jim Hull, Ohio St. 3 22 14 58 19.31940 Howard Engleman, Kansas 3 18 3 39 13.0
Bob Kinney, Rice 2 12 2 26 13.01941 Johnny Adams, Arkansas 2 21 6 48 24.01942 Chet Palmer, Rice 2 19 5 43 21.5
Jim Pollard, Stanford 2 20 3 43 21.51943 John Hargis, Texas 2 21 17 59 29.51944 Nick Bozolich, Pepperdine 2 17 11 45 22.51945 Dick Wilkins, Oregon 2 19 6 44 22.01946 Bob Kurland, Oklahoma St. 3 28 16 72 24.01947 George Kaftan, Holy Cross 3 25 13 63 21.01948 Jack Nichols, Washington 2 13 13 39 19.51949 Alex Groza, Kentucky 3 31 20 82 27.31950 Sam Ranzino, North Carolina St. 3 26 25 77 25.71951 Bill Kukoy, North Carolina St. 3 25 19 69 23.01952 Clyde Lovellette, Kansas 4 53 35 141 35.31953 Bob Houbregs, Washington 4 57 25 139 34.81954 John Clune, Navy 3 30 19 79 26.31955 Terry Rand, Marquette 3 31 11 73 24.31956 Hal Lear, Temple 5 63 34 160 32.01957 Wilt Chamberlain, Kansas 4 40 41 121 30.31958 Wayne Embry, Miami (OH) 3 32 19 83 27.71959 Jerry West, West Virginia 5 57 46 160 32.01960 Jerry West, West Virginia 3 35 35 105 35.01961 Billy McGill, Utah 4 49 21 119 29.81962 Len Chappell, Wake Forest 5 45 44 134 26.81963 Barry Kramer, NYU 3 31 38 100 33.31964 Jeff Mullins, Duke 4 50 16 116 29.01965 Bill Bradley, Princeton 5 65 47 177 35.41966 Jerry Chambers, Utah 4 55 33 143 35.81967 Lew Alcindor, UCLA 4 39 28 106 26.51968 Elvin Hayes, Houston 5 70 27 167 33.41969 Rick Mount, Purdue 4 49 24 122 30.5
Tournament Scoring Leaders 97
Year Player, Team G FG FTM Pts. Avg.1970 Austin Carr, Notre Dame 3 68 22 158 52.71971 Austin Carr, Notre Dame 3 48 29 125 41.71972 *Bo Lamar, Louisiana 3 41 18 100 33.3
Jim Price, Louisville 4 41 21 103 25.81973 Larry Finch, Memphis 4 34 39 107 26.81974 John Shumate, Notre Dame 3 35 16 86 28.71975 Adrian Dantley, Notre Dame 3 29 34 92 30.71976 Willie Smith, Missouri 3 38 18 94 31.31977 Cedric Maxwell, Charlotte 5 39 45 123 24.61978 Dave Corzine, DePaul 3 33 16 82 27.31979 Larry Bird, Indiana St. 5 52 32 136 27.21980 Joe Barry Carroll, Purdue 6 63 32 158 26.31981 Al Wood, North Carolina 5 44 21 109 21.81982 Oliver Robinson, UAB 3 27 12 66 22.01983 Greg Stokes, Iowa 3 24 13 61 20.31984 Roosevelt Chapman, Dayton 4 35 35 105 26.31985 Kenny Walker, Kentucky 3 28 19 75 25.01986 David Robinson, Navy 4 35 40 110 27.5
Year Player, Team G FG 3FG FT Pts. Avg.1987 Fennis Dembo, Wyoming 3 25 11 23 84 28.01988 Danny Manning, Kansas 6 69 2 23 163 27.21989 Glen Rice, Michigan 6 75 7 27 184 30.71990 Bo Kimble, Loyola Marymount 4 51 15 26 143 35.81991 Terry Dehere, Seton Hall 4 34 12 17 97 24.31992 Jamal Mashburn, Kentucky 4 34 6 22 96 24.01993 Calbert Cheaney, Indiana 4 40 3 23 106 26.51994 Gary Collier, Tulsa 3 30 13 21 94 31.31995 Darryl Wilson, Mississippi St. 3 21 9 22 73 24.31996 Allen Iverson, Georgetown 4 38 12 23 111 27.81997 Dedric Willoughby, Iowa St. 3 24 14 12 74 24.71998 Khalid El-Amin, UConn 4 30 10 23 93 23.31999 Wally Szczerbiak, Miami (OH) 3 32 11 15 90 30.02000 Marcus Fizer, Iowa St. 4 32 2 14 80 20.02001 Jason Williams, Duke 6 52 23 27 154 25.72002 Caron Butler, UConn 4 32 8 34 106 26.52003 Dahntay Jones, Duke 3 25 8 16 74 24.72004 Gerry McNamara, Syracuse 3 19 15 27 80 26.72005 Joah Tucker, Milwaukee 3 25 6 20 76 25.32006 Adam Morrison, Gonzaga 3 26 5 15 73 24.32007 Chris Lofton, Tennessee 3 22 13 12 69 23.02008 Stephen Curry, Davidson 4 42 23 21 128 32.02009 Blake Griffin, Oklahoma 4 46 0 22 114 28.52010 Jordan Crawford, Xavier 3 33 12 9 87 29.02011 Jimmer Fredette, BYU 3 32 12 22 98 32.72012 Tru Holloway, Xavier 3 22 7 17 68 22.72013 Mark Lyons, Arizona 3 26 8 13 73 24.32014 Xavier Thames, San Diego St. 6 24 6 24 78 26.02015 Fred VanVleet, Wichita St. 3 22 2 23 69 23.02014 Shabazz Napier, UConn 6 38 20 31 127 21.22015 Frank Kaminsky, Wisconsin 6 44 8 36 132 22.02016 Georges Niang, Iowa St. 3 33 8 12 86 28.72017 Tyler Dorsey, Oregon 5 27 20 25 119 23.8
Highest Field-Goal Percentage(Minimum: Five FGM Per Game)Year Player, Team G FGM FGA Pct.1950 Dick Schnittker, Ohio St. 2 15 29 51.71951 Don Sunderlage, Illinois 4 28 62 45.21963 William Humphrey, Texas 3 16 22 72.71964 Jay Buckley, Duke 4 24 39 61.51965 Dave Mills, DePaul 3 16 21 76.21966 Henry Finkel, Dayton 3 37 61 60.71967 Ken Talley, Virginia Tech 3 20 30 66.71968 Heyward Dotson, Columbia 3 22 28 78.61969 Jarrett Durham, Duquesne 3 26 38 68.4
Year Player, Team G FGM FGA Pct.1970 Pembrook Burrows, Jacksonville 5 24 33 72.71971 Jim Chones, Marquette 3 29 48 60.41972 *Wilbert Loftin, Louisiana 3 16 23 69.6
Bill Walton, UCLA 4 28 41 68.31973 Bill Walton, UCLA 4 45 59 76.31974 John Shumate, Notre Dame 3 35 50 70.01975 Mitch Kupchak, North Carolina 3 29 40 72.51976 Ron Carter, VMI 3 22 37 59.51977 Rick Robey, Kentucky 3 16 22 72.71978 Greg Kelser, Michigan St. 3 29 40 72.51979 Alex Gilbert, Indiana St. 5 26 34 76.51980 Mark Dressler, Missouri 3 27 35 77.11981 Randy Reed, Kansas St. 4 22 33 66.71982 Larry Micheaux, Houston 5 29 45 64.41983 Ralph Sampson, Virginia 3 23 31 74.21984 Kelvin Johnson, Richmond 3 29 38 76.31985 Brad Daugherty, North Carolina 4 29 40 72.51986 Kenny Walker, Kentucky 4 35 50 70.01987 Kevin Gamble, Iowa 4 32 41 78.01988 *Winston Bennett, Kentucky 3 18 23 78.3
Tim Perry, Temple 4 26 36 72.21989 Christian Laettner, Duke 5 26 33 78.81990 Alaa Abdelnaby, Duke 6 42 64 65.61991 Robert Werdann, St. John’s (NY) 4 20 26 76.91992 Eric Montross, North Carolina 3 24 32 75.01993 Corliss Williamson, Arkansas 3 19 25 76.01994 Keith Booth, Maryland 3 15 22 68.21995 Michael Wilson, Memphis 3 18 24 75.01996 *Darvin Ham, Texas Tech 3 16 23 69.61997 Kelvin Cato, Iowa St. 3 18 27 66.71998 Brent Solheim, West Virginia 3 17 24 70.81999 Elton Brand, Duke 6 37 57 64.92000 Casey Calvary, Gonzaga 3 15 21 71.42001 Nick Collison, Kansas 3 23 32 71.92002 Channing Frye, Arizona 3 15 21 71.42003 Jaron Brown, Pittsburgh 3 18 27 66.72004 Kevin Pinkney, Nevada 3 16 23 69.62005 Devonne Giles, Texas Tech 3 16 21 76.22006 Ryan Hollins, UCLA 6 23 32 71.92007 Brandon Rush, Kansas 4 23 37 62.22008 Derrick Brown, Xavier 4 20 27 74.12009 Arinze Onuaku, Syracuse 3 15 19 78.92010 DeMarcus Cousins, Kentucky 4 23 31 74.22011 Vernon Macklin, Florida 4 24 31 77.42012 Kenny Frease, Xavier 3 22 31 71.02013 Jerrell Wright, La Salle 4 22 27 81.52014 Stefan Nastic, Stanford 3 14 18 77.82015 Jakob Poeltl, Utah 3 17 23 73.92016 Tyler Davis, Texas A&M 3 16 20 80.02017 Jordan Bell, Oregon 5 27 37 73.0
Most Three-Point Field GoalsYear Player, Team G 3FGM1987 Freddie Banks, UNLV 5 261988 William Scott, Kansas St. 4 211989 Glen Rice, Michigan 6 271990 Dennis Scott, Georgia Tech 5 241991 Terry Brown, Kansas 6 141992 Bobby Hurley, Duke 6 151993 Donald Williams, North Carolina 6 221994 Cuonzo Martin, Purdue 4 161995 Randy Rutherford, Oklahoma St. 5 17
Scotty Thurman, Arkansas 6 171996 *Carmelo Travieso, Massachusetts 5 201997 Mike Bibby, Arizona 6 181998 Richard Hamilton, UConn 4 141999 Trajan Langdon, Duke 5 17
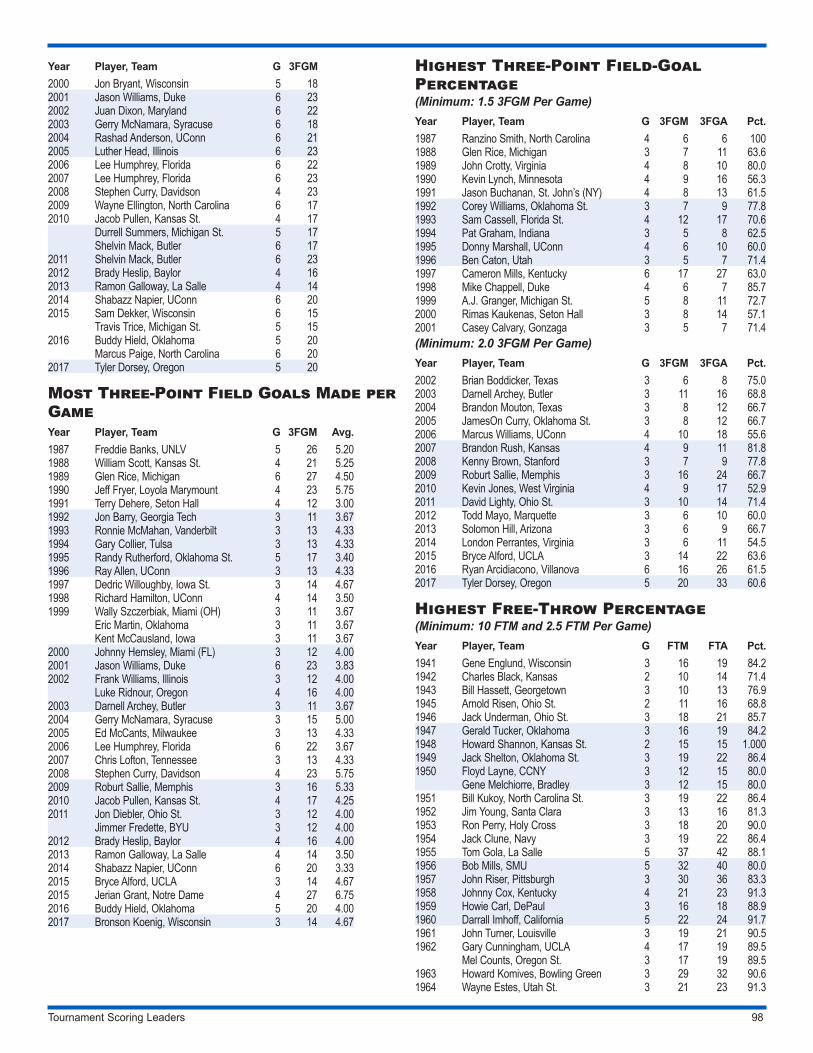
Tournament Scoring Leaders 98
Year Player, Team G 3FGM2000 Jon Bryant, Wisconsin 5 182001 Jason Williams, Duke 6 232002 Juan Dixon, Maryland 6 222003 Gerry McNamara, Syracuse 6 182004 Rashad Anderson, UConn 6 212005 Luther Head, Illinois 6 232006 Lee Humphrey, Florida 6 222007 Lee Humphrey, Florida 6 232008 Stephen Curry, Davidson 4 232009 Wayne Ellington, North Carolina 6 172010 Jacob Pullen, Kansas St. 4 17
Durrell Summers, Michigan St. 5 17Shelvin Mack, Butler 6 17
2011 Shelvin Mack, Butler 6 232012 Brady Heslip, Baylor 4 162013 Ramon Galloway, La Salle 4 142014 Shabazz Napier, UConn 6 202015 Sam Dekker, Wisconsin 6 15
Travis Trice, Michigan St. 5 152016 Buddy Hield, Oklahoma 5 20
Marcus Paige, North Carolina 6 202017 Tyler Dorsey, Oregon 5 20
Most Three-Point Field Goals Made per GameYear Player, Team G 3FGM Avg.1987 Freddie Banks, UNLV 5 26 5.201988 William Scott, Kansas St. 4 21 5.251989 Glen Rice, Michigan 6 27 4.501990 Jeff Fryer, Loyola Marymount 4 23 5.751991 Terry Dehere, Seton Hall 4 12 3.001992 Jon Barry, Georgia Tech 3 11 3.671993 Ronnie McMahan, Vanderbilt 3 13 4.331994 Gary Collier, Tulsa 3 13 4.331995 Randy Rutherford, Oklahoma St. 5 17 3.401996 Ray Allen, UConn 3 13 4.331997 Dedric Willoughby, Iowa St. 3 14 4.671998 Richard Hamilton, UConn 4 14 3.501999 Wally Szczerbiak, Miami (OH) 3 11 3.67
Eric Martin, Oklahoma 3 11 3.67Kent McCausland, Iowa 3 11 3.67
2000 Johnny Hemsley, Miami (FL) 3 12 4.002001 Jason Williams, Duke 6 23 3.832002 Frank Williams, Illinois 3 12 4.00
Luke Ridnour, Oregon 4 16 4.002003 Darnell Archey, Butler 3 11 3.672004 Gerry McNamara, Syracuse 3 15 5.002005 Ed McCants, Milwaukee 3 13 4.332006 Lee Humphrey, Florida 6 22 3.672007 Chris Lofton, Tennessee 3 13 4.332008 Stephen Curry, Davidson 4 23 5.752009 Roburt Sallie, Memphis 3 16 5.332010 Jacob Pullen, Kansas St. 4 17 4.252011 Jon Diebler, Ohio St. 3 12 4.00
Jimmer Fredette, BYU 3 12 4.002012 Brady Heslip, Baylor 4 16 4.002013 Ramon Galloway, La Salle 4 14 3.502014 Shabazz Napier, UConn 6 20 3.332015 Bryce Alford, UCLA 3 14 4.672015 Jerian Grant, Notre Dame 4 27 6.752016 Buddy Hield, Oklahoma 5 20 4.002017 Bronson Koenig, Wisconsin 3 14 4.67
Highest Three-Point Field-Goal Percentage(Minimum: 1.5 3FGM Per Game)Year Player, Team G 3FGM 3FGA Pct.1987 Ranzino Smith, North Carolina 4 6 6 1001988 Glen Rice, Michigan 3 7 11 63.61989 John Crotty, Virginia 4 8 10 80.01990 Kevin Lynch, Minnesota 4 9 16 56.31991 Jason Buchanan, St. John’s (NY) 4 8 13 61.51992 Corey Williams, Oklahoma St. 3 7 9 77.81993 Sam Cassell, Florida St. 4 12 17 70.61994 Pat Graham, Indiana 3 5 8 62.51995 Donny Marshall, UConn 4 6 10 60.01996 Ben Caton, Utah 3 5 7 71.41997 Cameron Mills, Kentucky 6 17 27 63.01998 Mike Chappell, Duke 4 6 7 85.71999 A.J. Granger, Michigan St. 5 8 11 72.72000 Rimas Kaukenas, Seton Hall 3 8 14 57.12001 Casey Calvary, Gonzaga 3 5 7 71.4(Minimum: 2.0 3FGM Per Game)Year Player, Team G 3FGM 3FGA Pct.2002 Brian Boddicker, Texas 3 6 8 75.02003 Darnell Archey, Butler 3 11 16 68.82004 Brandon Mouton, Texas 3 8 12 66.72005 JamesOn Curry, Oklahoma St. 3 8 12 66.72006 Marcus Williams, UConn 4 10 18 55.62007 Brandon Rush, Kansas 4 9 11 81.82008 Kenny Brown, Stanford 3 7 9 77.82009 Roburt Sallie, Memphis 3 16 24 66.72010 Kevin Jones, West Virginia 4 9 17 52.92011 David Lighty, Ohio St. 3 10 14 71.42012 Todd Mayo, Marquette 3 6 10 60.02013 Solomon Hill, Arizona 3 6 9 66.72014 London Perrantes, Virginia 3 6 11 54.52015 Bryce Alford, UCLA 3 14 22 63.62016 Ryan Arcidiacono, Villanova 6 16 26 61.52017 Tyler Dorsey, Oregon 5 20 33 60.6
Highest Free-Throw Percentage(Minimum: 10 FTM and 2.5 FTM Per Game)Year Player, Team G FTM FTA Pct.1941 Gene Englund, Wisconsin 3 16 19 84.21942 Charles Black, Kansas 2 10 14 71.41943 Bill Hassett, Georgetown 3 10 13 76.91945 Arnold Risen, Ohio St. 2 11 16 68.81946 Jack Underman, Ohio St. 3 18 21 85.71947 Gerald Tucker, Oklahoma 3 16 19 84.21948 Howard Shannon, Kansas St. 2 15 15 1.0001949 Jack Shelton, Oklahoma St. 3 19 22 86.41950 Floyd Layne, CCNY 3 12 15 80.0
Gene Melchiorre, Bradley 3 12 15 80.01951 Bill Kukoy, North Carolina St. 3 19 22 86.41952 Jim Young, Santa Clara 3 13 16 81.31953 Ron Perry, Holy Cross 3 18 20 90.01954 Jack Clune, Navy 3 19 22 86.41955 Tom Gola, La Salle 5 37 42 88.11956 Bob Mills, SMU 5 32 40 80.01957 John Riser, Pittsburgh 3 30 36 83.31958 Johnny Cox, Kentucky 4 21 23 91.31959 Howie Carl, DePaul 3 16 18 88.91960 Darrall Imhoff, California 5 22 24 91.71961 John Turner, Louisville 3 19 21 90.51962 Gary Cunningham, UCLA 4 17 19 89.5
Mel Counts, Oregon St. 3 17 19 89.51963 Howard Komives, Bowling Green 3 29 32 90.61964 Wayne Estes, Utah St. 3 21 23 91.3
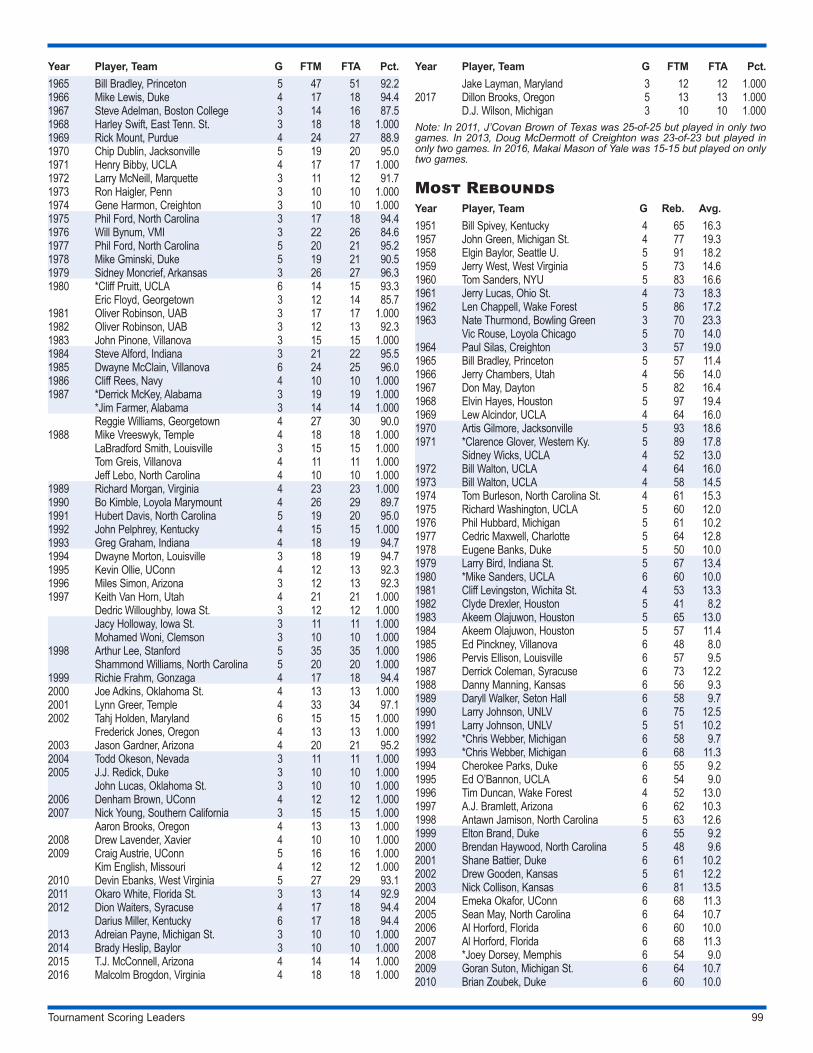
Tournament Scoring Leaders 99
Year Player, Team G FTM FTA Pct.1965 Bill Bradley, Princeton 5 47 51 92.21966 Mike Lewis, Duke 4 17 18 94.41967 Steve Adelman, Boston College 3 14 16 87.51968 Harley Swift, East Tenn. St. 3 18 18 1.0001969 Rick Mount, Purdue 4 24 27 88.91970 Chip Dublin, Jacksonville 5 19 20 95.01971 Henry Bibby, UCLA 4 17 17 1.0001972 Larry McNeill, Marquette 3 11 12 91.71973 Ron Haigler, Penn 3 10 10 1.0001974 Gene Harmon, Creighton 3 10 10 1.0001975 Phil Ford, North Carolina 3 17 18 94.41976 Will Bynum, VMI 3 22 26 84.61977 Phil Ford, North Carolina 5 20 21 95.21978 Mike Gminski, Duke 5 19 21 90.51979 Sidney Moncrief, Arkansas 3 26 27 96.31980 *Cliff Pruitt, UCLA 6 14 15 93.3
Eric Floyd, Georgetown 3 12 14 85.71981 Oliver Robinson, UAB 3 17 17 1.0001982 Oliver Robinson, UAB 3 12 13 92.31983 John Pinone, Villanova 3 15 15 1.0001984 Steve Alford, Indiana 3 21 22 95.51985 Dwayne McClain, Villanova 6 24 25 96.01986 Cliff Rees, Navy 4 10 10 1.0001987 *Derrick McKey, Alabama 3 19 19 1.000
*Jim Farmer, Alabama 3 14 14 1.000Reggie Williams, Georgetown 4 27 30 90.0
1988 Mike Vreeswyk, Temple 4 18 18 1.000LaBradford Smith, Louisville 3 15 15 1.000Tom Greis, Villanova 4 11 11 1.000Jeff Lebo, North Carolina 4 10 10 1.000
1989 Richard Morgan, Virginia 4 23 23 1.0001990 Bo Kimble, Loyola Marymount 4 26 29 89.71991 Hubert Davis, North Carolina 5 19 20 95.01992 John Pelphrey, Kentucky 4 15 15 1.0001993 Greg Graham, Indiana 4 18 19 94.71994 Dwayne Morton, Louisville 3 18 19 94.71995 Kevin Ollie, UConn 4 12 13 92.31996 Miles Simon, Arizona 3 12 13 92.31997 Keith Van Horn, Utah 4 21 21 1.000
Dedric Willoughby, Iowa St. 3 12 12 1.000Jacy Holloway, Iowa St. 3 11 11 1.000Mohamed Woni, Clemson 3 10 10 1.000
1998 Arthur Lee, Stanford 5 35 35 1.000Shammond Williams, North Carolina 5 20 20 1.000
1999 Richie Frahm, Gonzaga 4 17 18 94.42000 Joe Adkins, Oklahoma St. 4 13 13 1.0002001 Lynn Greer, Temple 4 33 34 97.12002 Tahj Holden, Maryland 6 15 15 1.000
Frederick Jones, Oregon 4 13 13 1.0002003 Jason Gardner, Arizona 4 20 21 95.22004 Todd Okeson, Nevada 3 11 11 1.0002005 J.J. Redick, Duke 3 10 10 1.000
John Lucas, Oklahoma St. 3 10 10 1.0002006 Denham Brown, UConn 4 12 12 1.0002007 Nick Young, Southern California 3 15 15 1.000
Aaron Brooks, Oregon 4 13 13 1.0002008 Drew Lavender, Xavier 4 10 10 1.0002009 Craig Austrie, UConn 5 16 16 1.000
Kim English, Missouri 4 12 12 1.0002010 Devin Ebanks, West Virginia 5 27 29 93.12011 Okaro White, Florida St. 3 13 14 92.92012 Dion Waiters, Syracuse 4 17 18 94.4
Darius Miller, Kentucky 6 17 18 94.42013 Adreian Payne, Michigan St. 3 10 10 1.0002014 Brady Heslip, Baylor 3 10 10 1.0002015 T.J. McConnell, Arizona 4 14 14 1.0002016 Malcolm Brogdon, Virginia 4 18 18 1.000
Year Player, Team G FTM FTA Pct.Jake Layman, Maryland 3 12 12 1.000
2017 Dillon Brooks, Oregon 5 13 13 1.000D.J. Wilson, Michigan 3 10 10 1.000
Note: In 2011, J’Covan Brown of Texas was 25-of-25 but played in only two games. In 2013, Doug McDermott of Creighton was 23-of-23 but played in only two games. In 2016, Makai Mason of Yale was 15-15 but played on only two games.
Most ReboundsYear Player, Team G Reb. Avg.1951 Bill Spivey, Kentucky 4 65 16.31957 John Green, Michigan St. 4 77 19.31958 Elgin Baylor, Seattle U. 5 91 18.21959 Jerry West, West Virginia 5 73 14.61960 Tom Sanders, NYU 5 83 16.61961 Jerry Lucas, Ohio St. 4 73 18.31962 Len Chappell, Wake Forest 5 86 17.21963 Nate Thurmond, Bowling Green 3 70 23.3
Vic Rouse, Loyola Chicago 5 70 14.01964 Paul Silas, Creighton 3 57 19.01965 Bill Bradley, Princeton 5 57 11.41966 Jerry Chambers, Utah 4 56 14.01967 Don May, Dayton 5 82 16.41968 Elvin Hayes, Houston 5 97 19.41969 Lew Alcindor, UCLA 4 64 16.01970 Artis Gilmore, Jacksonville 5 93 18.61971 *Clarence Glover, Western Ky. 5 89 17.8
Sidney Wicks, UCLA 4 52 13.01972 Bill Walton, UCLA 4 64 16.01973 Bill Walton, UCLA 4 58 14.51974 Tom Burleson, North Carolina St. 4 61 15.31975 Richard Washington, UCLA 5 60 12.01976 Phil Hubbard, Michigan 5 61 10.21977 Cedric Maxwell, Charlotte 5 64 12.81978 Eugene Banks, Duke 5 50 10.01979 Larry Bird, Indiana St. 5 67 13.41980 *Mike Sanders, UCLA 6 60 10.01981 Cliff Levingston, Wichita St. 4 53 13.31982 Clyde Drexler, Houston 5 41 8.21983 Akeem Olajuwon, Houston 5 65 13.01984 Akeem Olajuwon, Houston 5 57 11.41985 Ed Pinckney, Villanova 6 48 8.01986 Pervis Ellison, Louisville 6 57 9.51987 Derrick Coleman, Syracuse 6 73 12.21988 Danny Manning, Kansas 6 56 9.31989 Daryll Walker, Seton Hall 6 58 9.71990 Larry Johnson, UNLV 6 75 12.51991 Larry Johnson, UNLV 5 51 10.21992 *Chris Webber, Michigan 6 58 9.71993 *Chris Webber, Michigan 6 68 11.31994 Cherokee Parks, Duke 6 55 9.21995 Ed O’Bannon, UCLA 6 54 9.01996 Tim Duncan, Wake Forest 4 52 13.01997 A.J. Bramlett, Arizona 6 62 10.31998 Antawn Jamison, North Carolina 5 63 12.61999 Elton Brand, Duke 6 55 9.22000 Brendan Haywood, North Carolina 5 48 9.62001 Shane Battier, Duke 6 61 10.22002 Drew Gooden, Kansas 5 61 12.22003 Nick Collison, Kansas 6 81 13.52004 Emeka Okafor, UConn 6 68 11.32005 Sean May, North Carolina 6 64 10.72006 Al Horford, Florida 6 60 10.02007 Al Horford, Florida 6 68 11.32008 *Joey Dorsey, Memphis 6 54 9.02009 Goran Suton, Michigan St. 6 64 10.72010 Brian Zoubek, Duke 6 60 10.0
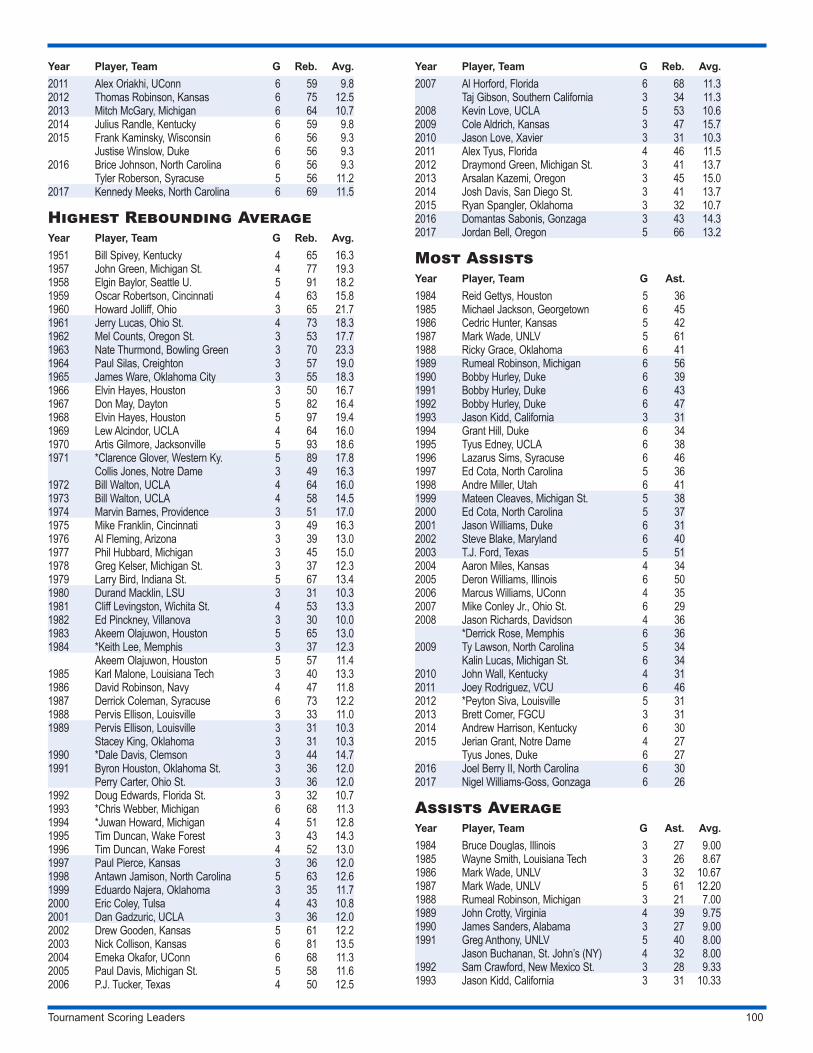
Tournament Scoring Leaders 100
Year Player, Team G Reb. Avg.2011 Alex Oriakhi, UConn 6 59 9.82012 Thomas Robinson, Kansas 6 75 12.52013 Mitch McGary, Michigan 6 64 10.72014 Julius Randle, Kentucky 6 59 9.82015 Frank Kaminsky, Wisconsin 6 56 9.3
Justise Winslow, Duke 6 56 9.32016 Brice Johnson, North Carolina 6 56 9.3
Tyler Roberson, Syracuse 5 56 11.22017 Kennedy Meeks, North Carolina 6 69 11.5
Highest Rebounding AverageYear Player, Team G Reb. Avg.1951 Bill Spivey, Kentucky 4 65 16.31957 John Green, Michigan St. 4 77 19.31958 Elgin Baylor, Seattle U. 5 91 18.21959 Oscar Robertson, Cincinnati 4 63 15.81960 Howard Jolliff, Ohio 3 65 21.71961 Jerry Lucas, Ohio St. 4 73 18.31962 Mel Counts, Oregon St. 3 53 17.71963 Nate Thurmond, Bowling Green 3 70 23.31964 Paul Silas, Creighton 3 57 19.01965 James Ware, Oklahoma City 3 55 18.31966 Elvin Hayes, Houston 3 50 16.71967 Don May, Dayton 5 82 16.41968 Elvin Hayes, Houston 5 97 19.41969 Lew Alcindor, UCLA 4 64 16.01970 Artis Gilmore, Jacksonville 5 93 18.61971 *Clarence Glover, Western Ky. 5 89 17.8
Collis Jones, Notre Dame 3 49 16.31972 Bill Walton, UCLA 4 64 16.01973 Bill Walton, UCLA 4 58 14.51974 Marvin Barnes, Providence 3 51 17.01975 Mike Franklin, Cincinnati 3 49 16.31976 Al Fleming, Arizona 3 39 13.01977 Phil Hubbard, Michigan 3 45 15.01978 Greg Kelser, Michigan St. 3 37 12.31979 Larry Bird, Indiana St. 5 67 13.41980 Durand Macklin, LSU 3 31 10.31981 Cliff Levingston, Wichita St. 4 53 13.31982 Ed Pinckney, Villanova 3 30 10.01983 Akeem Olajuwon, Houston 5 65 13.01984 *Keith Lee, Memphis 3 37 12.3
Akeem Olajuwon, Houston 5 57 11.41985 Karl Malone, Louisiana Tech 3 40 13.31986 David Robinson, Navy 4 47 11.81987 Derrick Coleman, Syracuse 6 73 12.21988 Pervis Ellison, Louisville 3 33 11.01989 Pervis Ellison, Louisville 3 31 10.3
Stacey King, Oklahoma 3 31 10.31990 *Dale Davis, Clemson 3 44 14.71991 Byron Houston, Oklahoma St. 3 36 12.0
Perry Carter, Ohio St. 3 36 12.01992 Doug Edwards, Florida St. 3 32 10.71993 *Chris Webber, Michigan 6 68 11.31994 *Juwan Howard, Michigan 4 51 12.81995 Tim Duncan, Wake Forest 3 43 14.31996 Tim Duncan, Wake Forest 4 52 13.01997 Paul Pierce, Kansas 3 36 12.01998 Antawn Jamison, North Carolina 5 63 12.61999 Eduardo Najera, Oklahoma 3 35 11.72000 Eric Coley, Tulsa 4 43 10.82001 Dan Gadzuric, UCLA 3 36 12.02002 Drew Gooden, Kansas 5 61 12.22003 Nick Collison, Kansas 6 81 13.52004 Emeka Okafor, UConn 6 68 11.32005 Paul Davis, Michigan St. 5 58 11.62006 P.J. Tucker, Texas 4 50 12.5
Year Player, Team G Reb. Avg.2007 Al Horford, Florida 6 68 11.3
Taj Gibson, Southern California 3 34 11.32008 Kevin Love, UCLA 5 53 10.62009 Cole Aldrich, Kansas 3 47 15.72010 Jason Love, Xavier 3 31 10.32011 Alex Tyus, Florida 4 46 11.52012 Draymond Green, Michigan St. 3 41 13.72013 Arsalan Kazemi, Oregon 3 45 15.02014 Josh Davis, San Diego St. 3 41 13.72015 Ryan Spangler, Oklahoma 3 32 10.72016 Domantas Sabonis, Gonzaga 3 43 14.32017 Jordan Bell, Oregon 5 66 13.2
Most AssistsYear Player, Team G Ast.1984 Reid Gettys, Houston 5 361985 Michael Jackson, Georgetown 6 451986 Cedric Hunter, Kansas 5 421987 Mark Wade, UNLV 5 611988 Ricky Grace, Oklahoma 6 411989 Rumeal Robinson, Michigan 6 561990 Bobby Hurley, Duke 6 391991 Bobby Hurley, Duke 6 431992 Bobby Hurley, Duke 6 471993 Jason Kidd, California 3 311994 Grant Hill, Duke 6 341995 Tyus Edney, UCLA 6 381996 Lazarus Sims, Syracuse 6 461997 Ed Cota, North Carolina 5 361998 Andre Miller, Utah 6 411999 Mateen Cleaves, Michigan St. 5 382000 Ed Cota, North Carolina 5 372001 Jason Williams, Duke 6 312002 Steve Blake, Maryland 6 402003 T.J. Ford, Texas 5 512004 Aaron Miles, Kansas 4 342005 Deron Williams, Illinois 6 502006 Marcus Williams, UConn 4 352007 Mike Conley Jr., Ohio St. 6 292008 Jason Richards, Davidson 4 36
*Derrick Rose, Memphis 6 362009 Ty Lawson, North Carolina 5 34
Kalin Lucas, Michigan St. 6 342010 John Wall, Kentucky 4 312011 Joey Rodriguez, VCU 6 462012 *Peyton Siva, Louisville 5 312013 Brett Comer, FGCU 3 312014 Andrew Harrison, Kentucky 6 302015 Jerian Grant, Notre Dame 4 27
Tyus Jones, Duke 6 272016 Joel Berry II, North Carolina 6 302017 Nigel Williams-Goss, Gonzaga 6 26
Assists AverageYear Player, Team G Ast. Avg.1984 Bruce Douglas, Illinois 3 27 9.001985 Wayne Smith, Louisiana Tech 3 26 8.671986 Mark Wade, UNLV 3 32 10.671987 Mark Wade, UNLV 5 61 12.201988 Rumeal Robinson, Michigan 3 21 7.001989 John Crotty, Virginia 4 39 9.751990 James Sanders, Alabama 3 27 9.001991 Greg Anthony, UNLV 5 40 8.00
Jason Buchanan, St. John’s (NY) 4 32 8.001992 Sam Crawford, New Mexico St. 3 28 9.331993 Jason Kidd, California 3 31 10.33
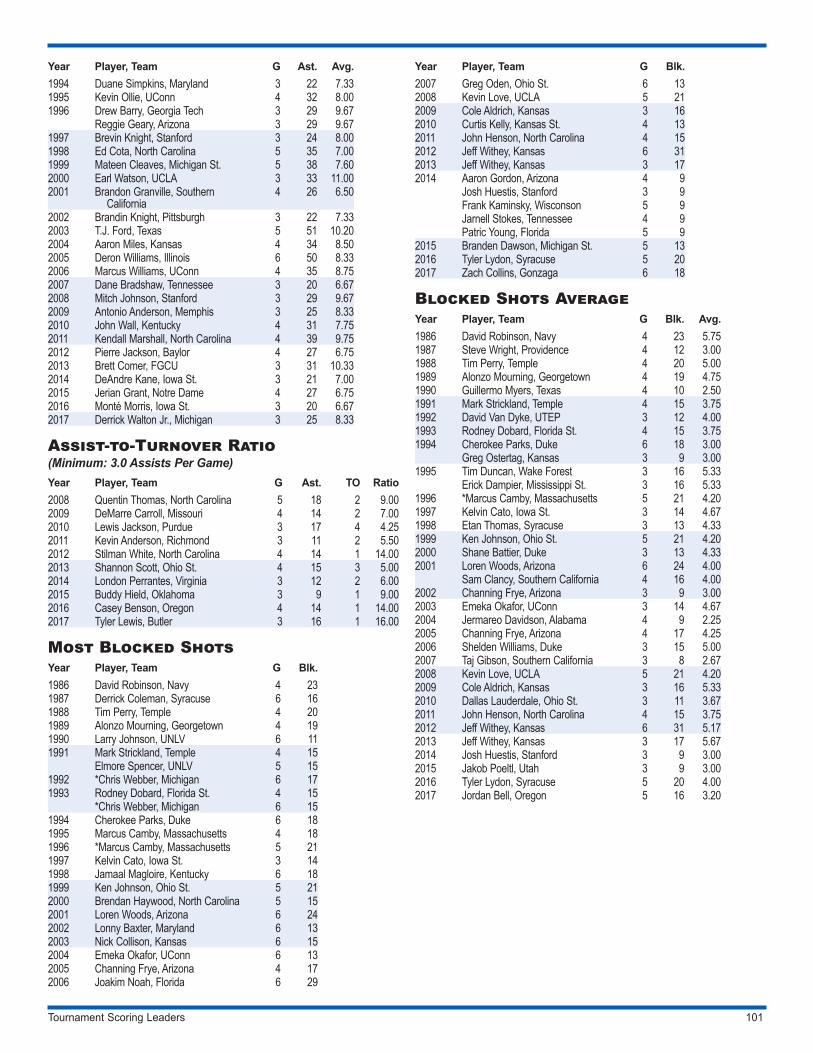
Tournament Scoring Leaders 101
Year Player, Team G Ast. Avg.1994 Duane Simpkins, Maryland 3 22 7.331995 Kevin Ollie, UConn 4 32 8.001996 Drew Barry, Georgia Tech 3 29 9.67
Reggie Geary, Arizona 3 29 9.671997 Brevin Knight, Stanford 3 24 8.001998 Ed Cota, North Carolina 5 35 7.001999 Mateen Cleaves, Michigan St. 5 38 7.602000 Earl Watson, UCLA 3 33 11.002001 Brandon Granville, Southern
California4 26 6.50
2002 Brandin Knight, Pittsburgh 3 22 7.332003 T.J. Ford, Texas 5 51 10.202004 Aaron Miles, Kansas 4 34 8.502005 Deron Williams, Illinois 6 50 8.332006 Marcus Williams, UConn 4 35 8.752007 Dane Bradshaw, Tennessee 3 20 6.672008 Mitch Johnson, Stanford 3 29 9.672009 Antonio Anderson, Memphis 3 25 8.332010 John Wall, Kentucky 4 31 7.752011 Kendall Marshall, North Carolina 4 39 9.752012 Pierre Jackson, Baylor 4 27 6.752013 Brett Comer, FGCU 3 31 10.332014 DeAndre Kane, Iowa St. 3 21 7.002015 Jerian Grant, Notre Dame 4 27 6.752016 Monté Morris, Iowa St. 3 20 6.672017 Derrick Walton Jr., Michigan 3 25 8.33
Assist-to-Turnover Ratio(Minimum: 3.0 Assists Per Game)Year Player, Team G Ast. TO Ratio2008 Quentin Thomas, North Carolina 5 18 2 9.002009 DeMarre Carroll, Missouri 4 14 2 7.002010 Lewis Jackson, Purdue 3 17 4 4.252011 Kevin Anderson, Richmond 3 11 2 5.502012 Stilman White, North Carolina 4 14 1 14.002013 Shannon Scott, Ohio St. 4 15 3 5.002014 London Perrantes, Virginia 3 12 2 6.002015 Buddy Hield, Oklahoma 3 9 1 9.002016 Casey Benson, Oregon 4 14 1 14.002017 Tyler Lewis, Butler 3 16 1 16.00
Most Blocked ShotsYear Player, Team G Blk.1986 David Robinson, Navy 4 231987 Derrick Coleman, Syracuse 6 161988 Tim Perry, Temple 4 201989 Alonzo Mourning, Georgetown 4 191990 Larry Johnson, UNLV 6 111991 Mark Strickland, Temple 4 15
Elmore Spencer, UNLV 5 151992 *Chris Webber, Michigan 6 171993 Rodney Dobard, Florida St. 4 15
*Chris Webber, Michigan 6 151994 Cherokee Parks, Duke 6 181995 Marcus Camby, Massachusetts 4 181996 *Marcus Camby, Massachusetts 5 211997 Kelvin Cato, Iowa St. 3 141998 Jamaal Magloire, Kentucky 6 181999 Ken Johnson, Ohio St. 5 212000 Brendan Haywood, North Carolina 5 152001 Loren Woods, Arizona 6 242002 Lonny Baxter, Maryland 6 132003 Nick Collison, Kansas 6 152004 Emeka Okafor, UConn 6 132005 Channing Frye, Arizona 4 172006 Joakim Noah, Florida 6 29
Year Player, Team G Blk.2007 Greg Oden, Ohio St. 6 132008 Kevin Love, UCLA 5 212009 Cole Aldrich, Kansas 3 162010 Curtis Kelly, Kansas St. 4 132011 John Henson, North Carolina 4 152012 Jeff Withey, Kansas 6 312013 Jeff Withey, Kansas 3 172014 Aaron Gordon, Arizona 4 9
Josh Huestis, Stanford 3 9Frank Kaminsky, Wisconson 5 9Jarnell Stokes, Tennessee 4 9Patric Young, Florida 5 9
2015 Branden Dawson, Michigan St. 5 132016 Tyler Lydon, Syracuse 5 202017 Zach Collins, Gonzaga 6 18
Blocked Shots AverageYear Player, Team G Blk. Avg.1986 David Robinson, Navy 4 23 5.751987 Steve Wright, Providence 4 12 3.001988 Tim Perry, Temple 4 20 5.001989 Alonzo Mourning, Georgetown 4 19 4.751990 Guillermo Myers, Texas 4 10 2.501991 Mark Strickland, Temple 4 15 3.751992 David Van Dyke, UTEP 3 12 4.001993 Rodney Dobard, Florida St. 4 15 3.751994 Cherokee Parks, Duke 6 18 3.00
Greg Ostertag, Kansas 3 9 3.001995 Tim Duncan, Wake Forest 3 16 5.33
Erick Dampier, Mississippi St. 3 16 5.331996 *Marcus Camby, Massachusetts 5 21 4.201997 Kelvin Cato, Iowa St. 3 14 4.671998 Etan Thomas, Syracuse 3 13 4.331999 Ken Johnson, Ohio St. 5 21 4.202000 Shane Battier, Duke 3 13 4.332001 Loren Woods, Arizona 6 24 4.00
Sam Clancy, Southern California 4 16 4.002002 Channing Frye, Arizona 3 9 3.002003 Emeka Okafor, UConn 3 14 4.672004 Jermareo Davidson, Alabama 4 9 2.252005 Channing Frye, Arizona 4 17 4.252006 Shelden Williams, Duke 3 15 5.002007 Taj Gibson, Southern California 3 8 2.672008 Kevin Love, UCLA 5 21 4.202009 Cole Aldrich, Kansas 3 16 5.332010 Dallas Lauderdale, Ohio St. 3 11 3.672011 John Henson, North Carolina 4 15 3.752012 Jeff Withey, Kansas 6 31 5.172013 Jeff Withey, Kansas 3 17 5.672014 Josh Huestis, Stanford 3 9 3.002015 Jakob Poeltl, Utah 3 9 3.002016 Tyler Lydon, Syracuse 5 20 4.002017 Jordan Bell, Oregon 5 16 3.20
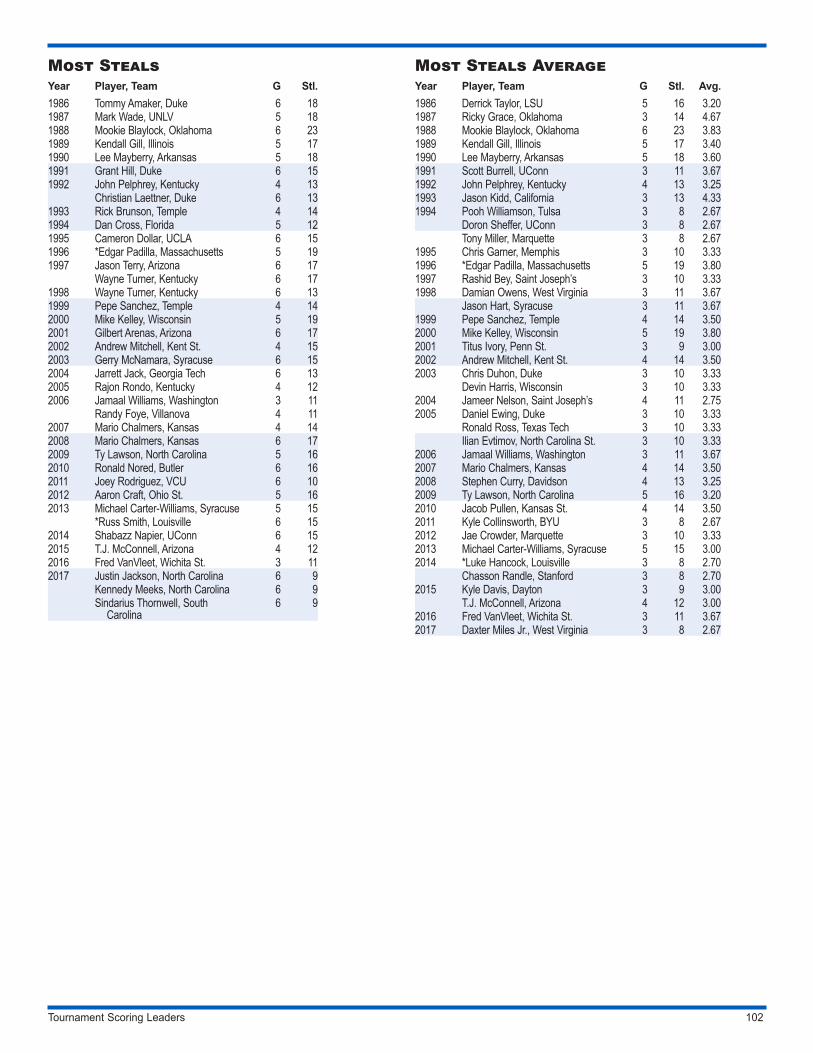
Tournament Scoring Leaders 102
Most StealsYear Player, Team G Stl.1986 Tommy Amaker, Duke 6 181987 Mark Wade, UNLV 5 181988 Mookie Blaylock, Oklahoma 6 231989 Kendall Gill, Illinois 5 171990 Lee Mayberry, Arkansas 5 181991 Grant Hill, Duke 6 151992 John Pelphrey, Kentucky 4 13
Christian Laettner, Duke 6 131993 Rick Brunson, Temple 4 141994 Dan Cross, Florida 5 121995 Cameron Dollar, UCLA 6 151996 *Edgar Padilla, Massachusetts 5 191997 Jason Terry, Arizona 6 17
Wayne Turner, Kentucky 6 171998 Wayne Turner, Kentucky 6 131999 Pepe Sanchez, Temple 4 142000 Mike Kelley, Wisconsin 5 192001 Gilbert Arenas, Arizona 6 172002 Andrew Mitchell, Kent St. 4 152003 Gerry McNamara, Syracuse 6 152004 Jarrett Jack, Georgia Tech 6 132005 Rajon Rondo, Kentucky 4 122006 Jamaal Williams, Washington 3 11
Randy Foye, Villanova 4 112007 Mario Chalmers, Kansas 4 142008 Mario Chalmers, Kansas 6 172009 Ty Lawson, North Carolina 5 162010 Ronald Nored, Butler 6 162011 Joey Rodriguez, VCU 6 102012 Aaron Craft, Ohio St. 5 162013 Michael Carter-Williams, Syracuse 5 15
*Russ Smith, Louisville 6 152014 Shabazz Napier, UConn 6 152015 T.J. McConnell, Arizona 4 12 2016 Fred VanVleet, Wichita St. 3 112017 Justin Jackson, North Carolina 6 9
Kennedy Meeks, North Carolina 6 9Sindarius Thornwell, South
Carolina6 9
Most Steals AverageYear Player, Team G Stl. Avg.1986 Derrick Taylor, LSU 5 16 3.201987 Ricky Grace, Oklahoma 3 14 4.671988 Mookie Blaylock, Oklahoma 6 23 3.831989 Kendall Gill, Illinois 5 17 3.401990 Lee Mayberry, Arkansas 5 18 3.601991 Scott Burrell, UConn 3 11 3.671992 John Pelphrey, Kentucky 4 13 3.251993 Jason Kidd, California 3 13 4.331994 Pooh Williamson, Tulsa 3 8 2.67
Doron Sheffer, UConn 3 8 2.67Tony Miller, Marquette 3 8 2.67
1995 Chris Garner, Memphis 3 10 3.331996 *Edgar Padilla, Massachusetts 5 19 3.801997 Rashid Bey, Saint Joseph’s 3 10 3.331998 Damian Owens, West Virginia 3 11 3.67
Jason Hart, Syracuse 3 11 3.671999 Pepe Sanchez, Temple 4 14 3.502000 Mike Kelley, Wisconsin 5 19 3.802001 Titus Ivory, Penn St. 3 9 3.002002 Andrew Mitchell, Kent St. 4 14 3.502003 Chris Duhon, Duke 3 10 3.33
Devin Harris, Wisconsin 3 10 3.332004 Jameer Nelson, Saint Joseph’s 4 11 2.752005 Daniel Ewing, Duke 3 10 3.33
Ronald Ross, Texas Tech 3 10 3.33Ilian Evtimov, North Carolina St. 3 10 3.33
2006 Jamaal Williams, Washington 3 11 3.672007 Mario Chalmers, Kansas 4 14 3.502008 Stephen Curry, Davidson 4 13 3.252009 Ty Lawson, North Carolina 5 16 3.202010 Jacob Pullen, Kansas St. 4 14 3.502011 Kyle Collinsworth, BYU 3 8 2.672012 Jae Crowder, Marquette 3 10 3.332013 Michael Carter-Williams, Syracuse 5 15 3.002014 *Luke Hancock, Louisville 3 8 2.70
Chasson Randle, Stanford 3 8 2.702015 Kyle Davis, Dayton 3 9 3.00
T.J. McConnell, Arizona 4 12 3.002016 Fred VanVleet, Wichita St. 3 11 3.672017 Daxter Miles Jr., West Virginia 3 8 2.67
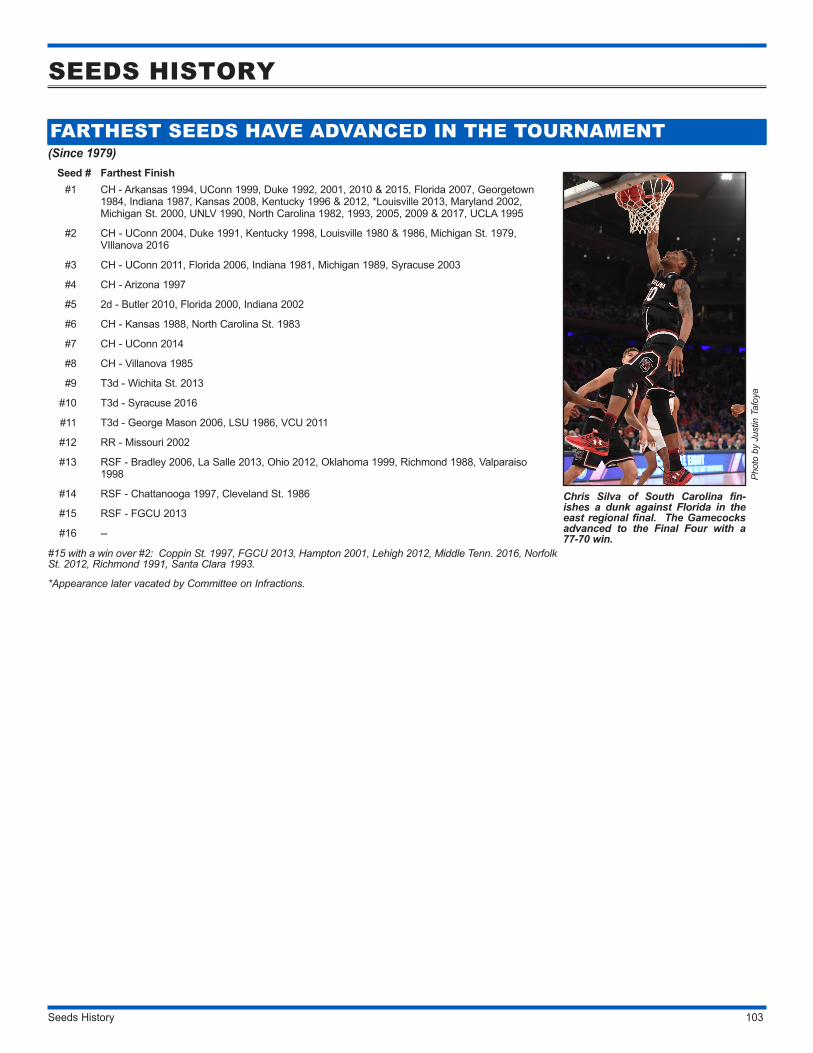
Seeds History 103
SEEDS HISTORY
FARTHEST SEEDS HAVE ADVANCED IN THE TOURNAMENT(Since 1979)
Seed # Farthest Finish #1 CH - Arkansas 1994, UConn 1999, Duke 1992, 2001, 2010 & 2015, Florida 2007, Georgetown
1984, Indiana 1987, Kansas 2008, Kentucky 1996 & 2012, *Louisville 2013, Maryland 2002, Michigan St. 2000, UNLV 1990, North Carolina 1982, 1993, 2005, 2009 & 2017, UCLA 1995
#2 CH - UConn 2004, Duke 1991, Kentucky 1998, Louisville 1980 & 1986, Michigan St. 1979, VIllanova 2016
#3 CH - UConn 2011, Florida 2006, Indiana 1981, Michigan 1989, Syracuse 2003
#4 CH - Arizona 1997
#5 2d - Butler 2010, Florida 2000, Indiana 2002
#6 CH - Kansas 1988, North Carolina St. 1983
#7 CH - UConn 2014
#8 CH - Villanova 1985
#9 T3d - Wichita St. 2013
#10 T3d - Syracuse 2016
#11 T3d - George Mason 2006, LSU 1986, VCU 2011
#12 RR - Missouri 2002
#13 RSF - Bradley 2006, La Salle 2013, Ohio 2012, Oklahoma 1999, Richmond 1988, Valparaiso 1998
#14 RSF - Chattanooga 1997, Cleveland St. 1986
#15 RSF - FGCU 2013
#16 --
#15 with a win over #2: Coppin St. 1997, FGCU 2013, Hampton 2001, Lehigh 2012, Middle Tenn. 2016, Norfolk St. 2012, Richmond 1991, Santa Clara 1993.
*Appearance later vacated by Committee on Infractions.
Chris Silva of South Carolina fin-ishes a dunk against Florida in the east regional final. The Gamecocks advanced to the Final Four with a 77-70 win.
Phot
o by
Jus
tin T
afoy
a
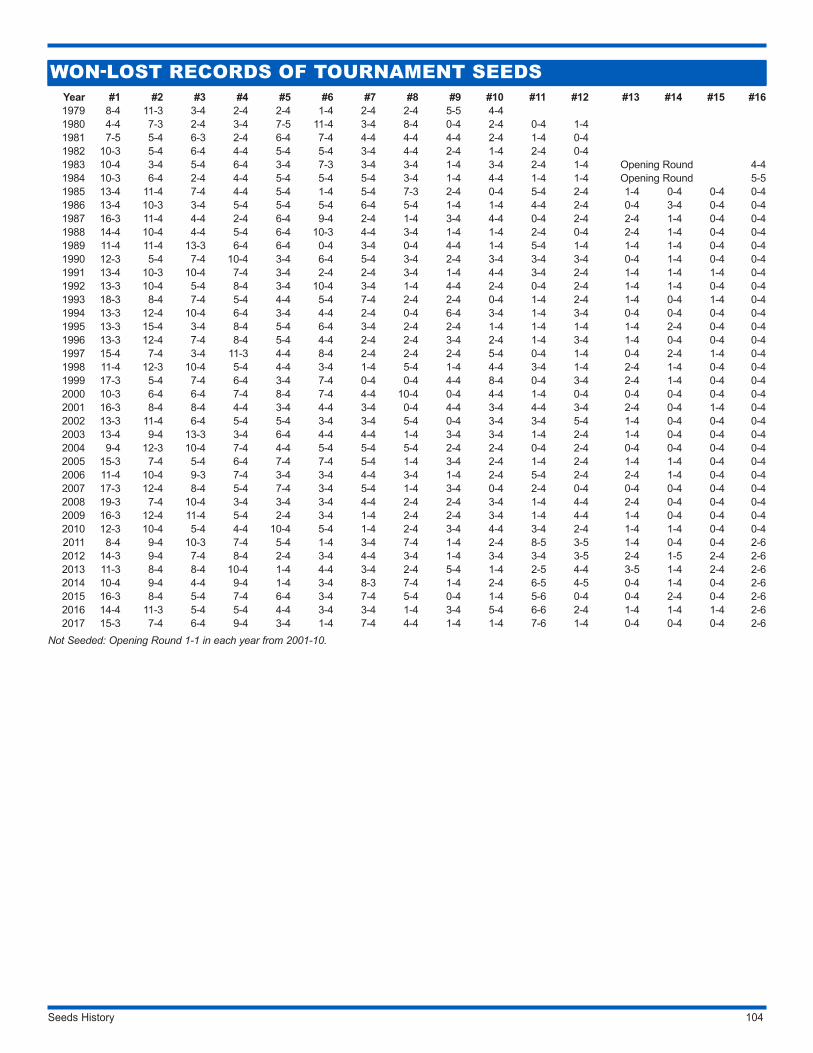
Seeds History 104
WON-LOST RECORDS OF TOURNAMENT SEEDSYear #1 #2 #3 #4 #5 #6 #7 #8 #9 #10 #11 #12 #13 #14 #15 #161979 8-4 11-3 3-4 2-4 2-4 1-4 2-4 2-4 5-5 4-41980 4-4 7-3 2-4 3-4 7-5 11-4 3-4 8-4 0-4 2-4 0-4 1-41981 7-5 5-4 6-3 2-4 6-4 7-4 4-4 4-4 4-4 2-4 1-4 0-41982 10-3 5-4 6-4 4-4 5-4 5-4 3-4 4-4 2-4 1-4 2-4 0-41983 10-4 3-4 5-4 6-4 3-4 7-3 3-4 3-4 1-4 3-4 2-4 1-4 Opening Round 4-41984 10-3 6-4 2-4 4-4 5-4 5-4 5-4 3-4 1-4 4-4 1-4 1-4 Opening Round 5-51985 13-4 11-4 7-4 4-4 5-4 1-4 5-4 7-3 2-4 0-4 5-4 2-4 1-4 0-4 0-4 0-41986 13-4 10-3 3-4 5-4 5-4 5-4 6-4 5-4 1-4 1-4 4-4 2-4 0-4 3-4 0-4 0-41987 16-3 11-4 4-4 2-4 6-4 9-4 2-4 1-4 3-4 4-4 0-4 2-4 2-4 1-4 0-4 0-41988 14-4 10-4 4-4 5-4 6-4 10-3 4-4 3-4 1-4 1-4 2-4 0-4 2-4 1-4 0-4 0-41989 11-4 11-4 13-3 6-4 6-4 0-4 3-4 0-4 4-4 1-4 5-4 1-4 1-4 1-4 0-4 0-41990 12-3 5-4 7-4 10-4 3-4 6-4 5-4 3-4 2-4 3-4 3-4 3-4 0-4 1-4 0-4 0-41991 13-4 10-3 10-4 7-4 3-4 2-4 2-4 3-4 1-4 4-4 3-4 2-4 1-4 1-4 1-4 0-41992 13-3 10-4 5-4 8-4 3-4 10-4 3-4 1-4 4-4 2-4 0-4 2-4 1-4 1-4 0-4 0-41993 18-3 8-4 7-4 5-4 4-4 5-4 7-4 2-4 2-4 0-4 1-4 2-4 1-4 0-4 1-4 0-41994 13-3 12-4 10-4 6-4 3-4 4-4 2-4 0-4 6-4 3-4 1-4 3-4 0-4 0-4 0-4 0-41995 13-3 15-4 3-4 8-4 5-4 6-4 3-4 2-4 2-4 1-4 1-4 1-4 1-4 2-4 0-4 0-41996 13-3 12-4 7-4 8-4 5-4 4-4 2-4 2-4 3-4 2-4 1-4 3-4 1-4 0-4 0-4 0-41997 15-4 7-4 3-4 11-3 4-4 8-4 2-4 2-4 2-4 5-4 0-4 1-4 0-4 2-4 1-4 0-41998 11-4 12-3 10-4 5-4 4-4 3-4 1-4 5-4 1-4 4-4 3-4 1-4 2-4 1-4 0-4 0-41999 17-3 5-4 7-4 6-4 3-4 7-4 0-4 0-4 4-4 8-4 0-4 3-4 2-4 1-4 0-4 0-42000 10-3 6-4 6-4 7-4 8-4 7-4 4-4 10-4 0-4 4-4 1-4 0-4 0-4 0-4 0-4 0-42001 16-3 8-4 8-4 4-4 3-4 4-4 3-4 0-4 4-4 3-4 4-4 3-4 2-4 0-4 1-4 0-42002 13-3 11-4 6-4 5-4 5-4 3-4 3-4 5-4 0-4 3-4 3-4 5-4 1-4 0-4 0-4 0-42003 13-4 9-4 13-3 3-4 6-4 4-4 4-4 1-4 3-4 3-4 1-4 2-4 1-4 0-4 0-4 0-42004 9-4 12-3 10-4 7-4 4-4 5-4 5-4 5-4 2-4 2-4 0-4 2-4 0-4 0-4 0-4 0-42005 15-3 7-4 5-4 6-4 7-4 7-4 5-4 1-4 3-4 2-4 1-4 2-4 1-4 1-4 0-4 0-42006 11-4 10-4 9-3 7-4 3-4 3-4 4-4 3-4 1-4 2-4 5-4 2-4 2-4 1-4 0-4 0-42007 17-3 12-4 8-4 5-4 7-4 3-4 5-4 1-4 3-4 0-4 2-4 0-4 0-4 0-4 0-4 0-42008 19-3 7-4 10-4 3-4 3-4 3-4 4-4 2-4 2-4 3-4 1-4 4-4 2-4 0-4 0-4 0-42009 16-3 12-4 11-4 5-4 2-4 3-4 1-4 2-4 2-4 3-4 1-4 4-4 1-4 0-4 0-4 0-42010 12-3 10-4 5-4 4-4 10-4 5-4 1-4 2-4 3-4 4-4 3-4 2-4 1-4 1-4 0-4 0-42011 8-4 9-4 10-3 7-4 5-4 1-4 3-4 7-4 1-4 2-4 8-5 3-5 1-4 0-4 0-4 2-62012 14-3 9-4 7-4 8-4 2-4 3-4 4-4 3-4 1-4 3-4 3-4 3-5 2-4 1-5 2-4 2-62013 11-3 8-4 8-4 10-4 1-4 4-4 3-4 2-4 5-4 1-4 2-5 4-4 3-5 1-4 2-4 2-62014 10-4 9-4 4-4 9-4 1-4 3-4 8-3 7-4 1-4 2-4 6-5 4-5 0-4 1-4 0-4 2-62015 16-3 8-4 5-4 7-4 6-4 3-4 7-4 5-4 0-4 1-4 5-6 0-4 0-4 2-4 0-4 2-62016 14-4 11-3 5-4 5-4 4-4 3-4 3-4 1-4 3-4 5-4 6-6 2-4 1-4 1-4 1-4 2-62017 15-3 7-4 6-4 9-4 3-4 1-4 7-4 4-4 1-4 1-4 7-6 1-4 0-4 0-4 0-4 2-6
Not Seeded: Opening Round 1-1 in each year from 2001-10.
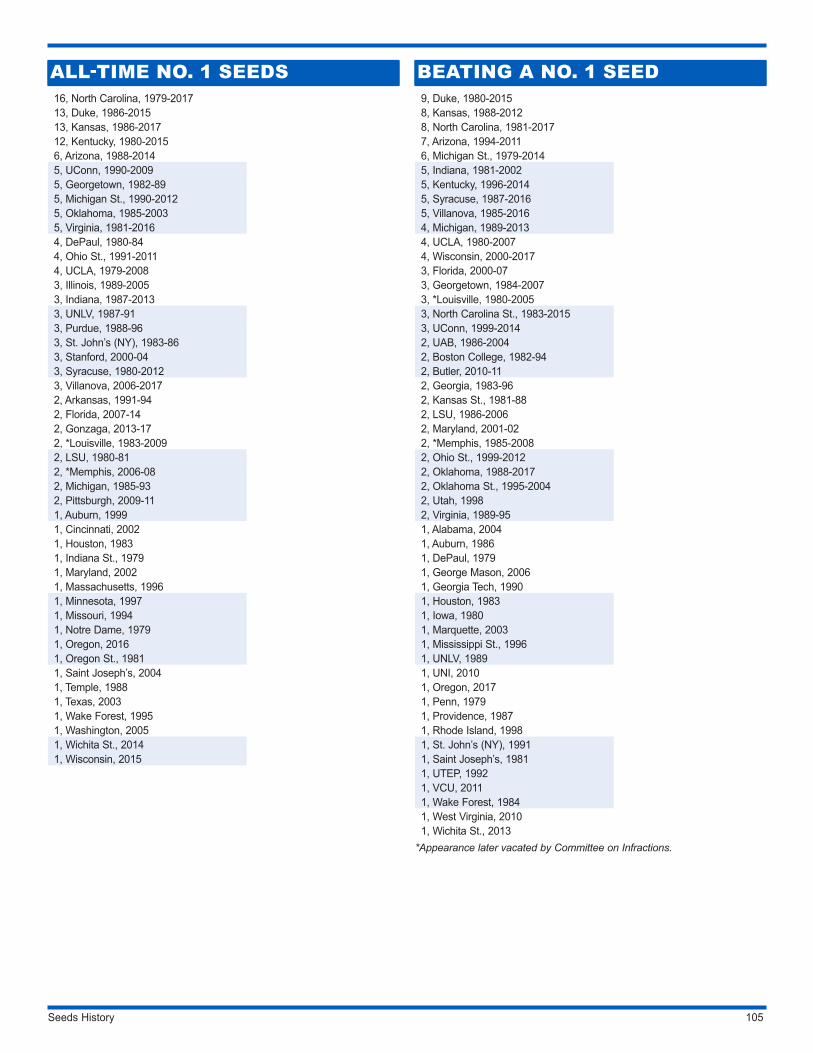
Seeds History 105
ALL-TIME NO. 1 SEEDS16, North Carolina, 1979-201713, Duke, 1986-201513, Kansas, 1986-201712, Kentucky, 1980-20156, Arizona, 1988-20145, UConn, 1990-20095, Georgetown, 1982-895, Michigan St., 1990-20125, Oklahoma, 1985-20035, Virginia, 1981-20164, DePaul, 1980-844, Ohio St., 1991-20114, UCLA, 1979-20083, Illinois, 1989-20053, Indiana, 1987-20133, UNLV, 1987-913, Purdue, 1988-963, St. John’s (NY), 1983-863, Stanford, 2000-043, Syracuse, 1980-20123, Villanova, 2006-20172, Arkansas, 1991-942, Florida, 2007-142, Gonzaga, 2013-172, *Louisville, 1983-20092, LSU, 1980-812, *Memphis, 2006-082, Michigan, 1985-932, Pittsburgh, 2009-111, Auburn, 19991, Cincinnati, 20021, Houston, 19831, Indiana St., 19791, Maryland, 20021, Massachusetts, 19961, Minnesota, 19971, Missouri, 19941, Notre Dame, 19791, Oregon, 20161, Oregon St., 19811, Saint Joseph’s, 20041, Temple, 19881, Texas, 20031, Wake Forest, 19951, Washington, 20051, Wichita St., 20141, Wisconsin, 2015
BEATING A NO. 1 SEED9, Duke, 1980-20158, Kansas, 1988-20128, North Carolina, 1981-20177, Arizona, 1994-20116, Michigan St., 1979-20145, Indiana, 1981-20025, Kentucky, 1996-20145, Syracuse, 1987-20165, Villanova, 1985-20164, Michigan, 1989-20134, UCLA, 1980-20074, Wisconsin, 2000-20173, Florida, 2000-073, Georgetown, 1984-20073, *Louisville, 1980-20053, North Carolina St., 1983-20153, UConn, 1999-20142, UAB, 1986-20042, Boston College, 1982-942, Butler, 2010-112, Georgia, 1983-962, Kansas St., 1981-882, LSU, 1986-20062, Maryland, 2001-022, *Memphis, 1985-20082, Ohio St., 1999-20122, Oklahoma, 1988-20172, Oklahoma St., 1995-20042, Utah, 19982, Virginia, 1989-951, Alabama, 20041, Auburn, 19861, DePaul, 19791, George Mason, 20061, Georgia Tech, 19901, Houston, 19831, Iowa, 19801, Marquette, 20031, Mississippi St., 19961, UNLV, 19891, UNI, 20101, Oregon, 20171, Penn, 19791, Providence, 19871, Rhode Island, 19981, St. John’s (NY), 19911, Saint Joseph’s, 19811, UTEP, 19921, VCU, 20111, Wake Forest, 19841, West Virginia, 20101, Wichita St., 2013
*Appearance later vacated by Committee on Infractions.
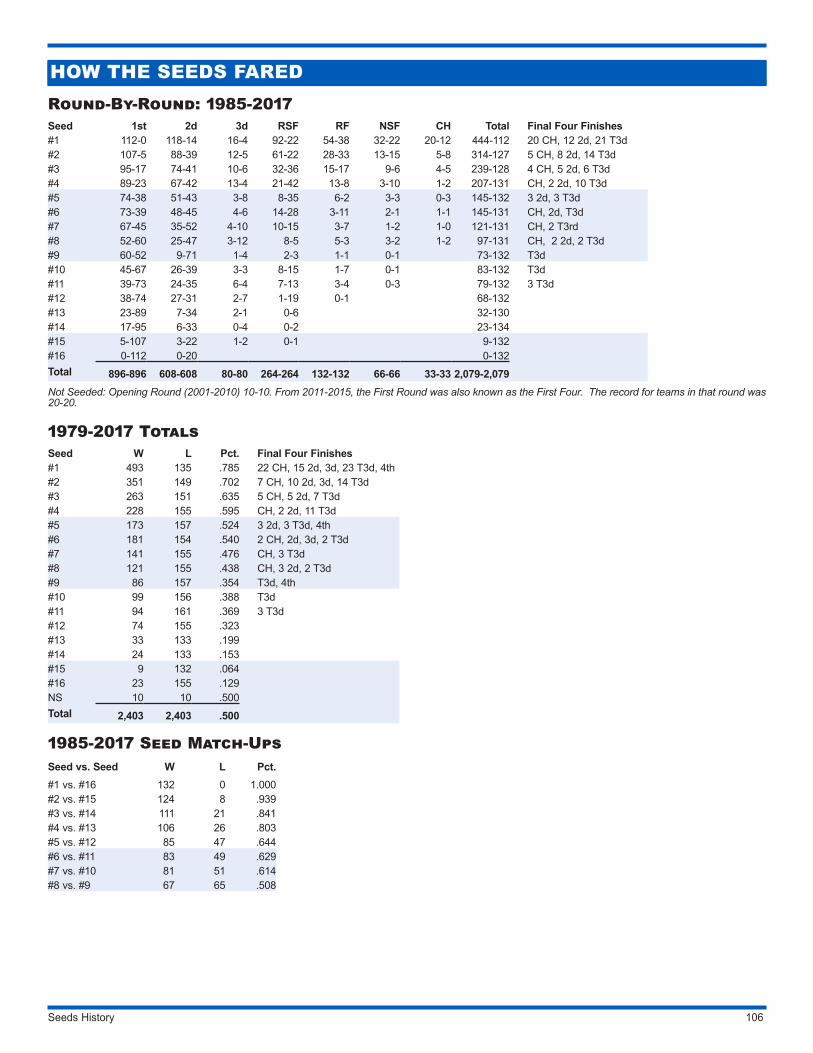
Seeds History 106
HOW THE SEEDS FAREDRound-By-Round: 1985-2017Seed 1st 2d 3d RSF RF NSF CH Total Final Four Finishes#1 112-0 118-14 16-4 92-22 54-38 32-22 20-12 444-112 20 CH, 12 2d, 21 T3d#2 107-5 88-39 12-5 61-22 28-33 13-15 5-8 314-127 5 CH, 8 2d, 14 T3d#3 95-17 74-41 10-6 32-36 15-17 9-6 4-5 239-128 4 CH, 5 2d, 6 T3d#4 89-23 67-42 13-4 21-42 13-8 3-10 1-2 207-131 CH, 2 2d, 10 T3d#5 74-38 51-43 3-8 8-35 6-2 3-3 0-3 145-132 3 2d, 3 T3d#6 73-39 48-45 4-6 14-28 3-11 2-1 1-1 145-131 CH, 2d, T3d#7 67-45 35-52 4-10 10-15 3-7 1-2 1-0 121-131 CH, 2 T3rd#8 52-60 25-47 3-12 8-5 5-3 3-2 1-2 97-131 CH, 2 2d, 2 T3d#9 60-52 9-71 1-4 2-3 1-1 0-1 73-132 T3d#10 45-67 26-39 3-3 8-15 1-7 0-1 83-132 T3d#11 39-73 24-35 6-4 7-13 3-4 0-3 79-132 3 T3d#12 38-74 27-31 2-7 1-19 0-1 68-132#13 23-89 7-34 2-1 0-6 32-130#14 17-95 6-33 0-4 0-2 23-134#15 5-107 3-22 1-2 0-1 9-132#16 0-112 0-20 0-132Total 896-896 608-608 80-80 264-264 132-132 66-66 33-33 2,079-2,079Not Seeded: Opening Round (2001-2010) 10-10. From 2011-2015, the First Round was also known as the First Four. The record for teams in that round was 20-20.
1979-2017 TotalsSeed W L Pct. Final Four Finishes#1 493 135 .785 22 CH, 15 2d, 3d, 23 T3d, 4th#2 351 149 .702 7 CH, 10 2d, 3d, 14 T3d#3 263 151 .635 5 CH, 5 2d, 7 T3d#4 228 155 .595 CH, 2 2d, 11 T3d#5 173 157 .524 3 2d, 3 T3d, 4th#6 181 154 .540 2 CH, 2d, 3d, 2 T3d#7 141 155 .476 CH, 3 T3d#8 121 155 .438 CH, 3 2d, 2 T3d#9 86 157 .354 T3d, 4th#10 99 156 .388 T3d#11 94 161 .369 3 T3d#12 74 155 .323#13 33 133 .199#14 24 133 .153#15 9 132 .064#16 23 155 .129NS 10 10 .500Total 2,403 2,403 .500
1985-2017 Seed Match-UpsSeed vs. Seed W L Pct.#1 vs. #16 132 0 1.000#2 vs. #15 124 8 .939#3 vs. #14 111 21 .841#4 vs. #13 106 26 .803#5 vs. #12 85 47 .644#6 vs. #11 83 49 .629#7 vs. #10 81 51 .614#8 vs. #9 67 65 .508
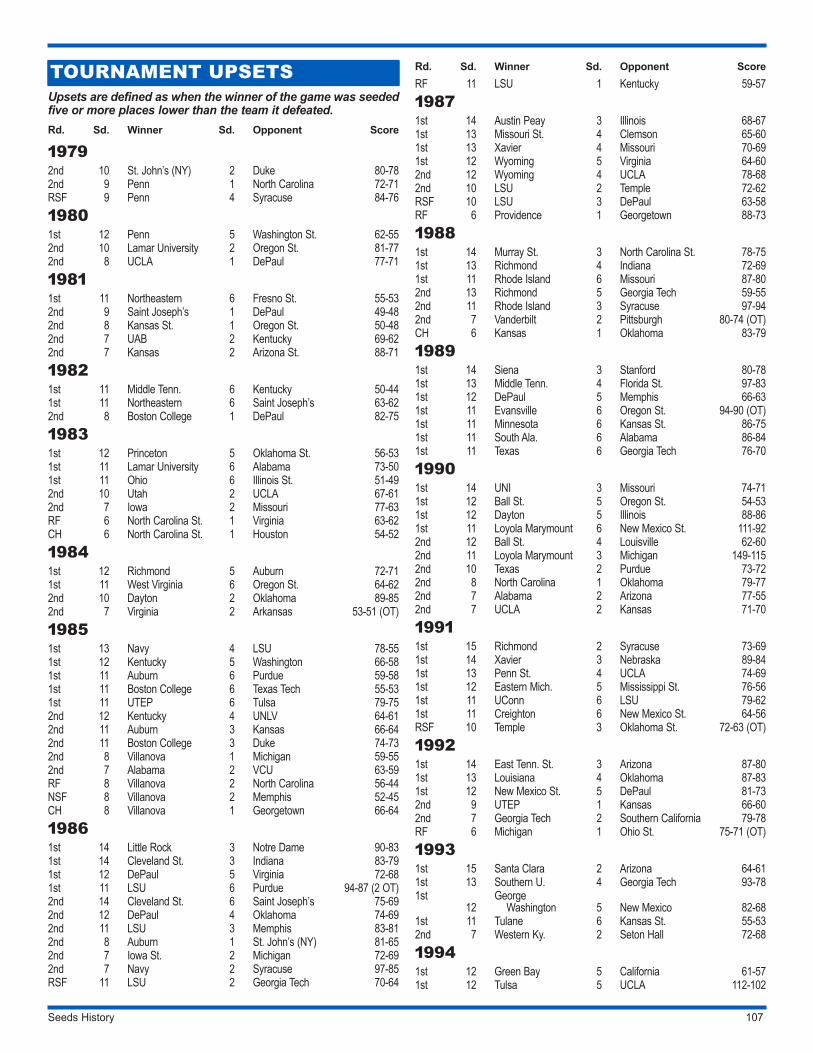
Seeds History 107
TOURNAMENT UPSETSUpsets are defined as when the winner of the game was seeded five or more places lower than the team it defeated.Rd. Sd. Winner Sd. Opponent Score
19792nd 10 St. John’s (NY) 2 Duke 80-782nd 9 Penn 1 North Carolina 72-71RSF 9 Penn 4 Syracuse 84-7619801st 12 Penn 5 Washington St. 62-552nd 10 Lamar University 2 Oregon St. 81-772nd 8 UCLA 1 DePaul 77-7119811st 11 Northeastern 6 Fresno St. 55-532nd 9 Saint Joseph’s 1 DePaul 49-482nd 8 Kansas St. 1 Oregon St. 50-482nd 7 UAB 2 Kentucky 69-622nd 7 Kansas 2 Arizona St. 88-7119821st 11 Middle Tenn. 6 Kentucky 50-441st 11 Northeastern 6 Saint Joseph’s 63-622nd 8 Boston College 1 DePaul 82-7519831st 12 Princeton 5 Oklahoma St. 56-531st 11 Lamar University 6 Alabama 73-501st 11 Ohio 6 Illinois St. 51-492nd 10 Utah 2 UCLA 67-612nd 7 Iowa 2 Missouri 77-63RF 6 North Carolina St. 1 Virginia 63-62CH 6 North Carolina St. 1 Houston 54-5219841st 12 Richmond 5 Auburn 72-711st 11 West Virginia 6 Oregon St. 64-622nd 10 Dayton 2 Oklahoma 89-852nd 7 Virginia 2 Arkansas 53-51 (OT)19851st 13 Navy 4 LSU 78-551st 12 Kentucky 5 Washington 66-581st 11 Auburn 6 Purdue 59-581st 11 Boston College 6 Texas Tech 55-531st 11 UTEP 6 Tulsa 79-752nd 12 Kentucky 4 UNLV 64-612nd 11 Auburn 3 Kansas 66-642nd 11 Boston College 3 Duke 74-732nd 8 Villanova 1 Michigan 59-552nd 7 Alabama 2 VCU 63-59RF 8 Villanova 2 North Carolina 56-44NSF 8 Villanova 2 Memphis 52-45CH 8 Villanova 1 Georgetown 66-6419861st 14 Little Rock 3 Notre Dame 90-831st 14 Cleveland St. 3 Indiana 83-791st 12 DePaul 5 Virginia 72-681st 11 LSU 6 Purdue 94-87 (2 OT)2nd 14 Cleveland St. 6 Saint Joseph’s 75-692nd 12 DePaul 4 Oklahoma 74-692nd 11 LSU 3 Memphis 83-812nd 8 Auburn 1 St. John’s (NY) 81-652nd 7 Iowa St. 2 Michigan 72-692nd 7 Navy 2 Syracuse 97-85RSF 11 LSU 2 Georgia Tech 70-64
Rd. Sd. Winner Sd. Opponent ScoreRF 11 LSU 1 Kentucky 59-5719871st 14 Austin Peay 3 Illinois 68-671st 13 Missouri St. 4 Clemson 65-601st 13 Xavier 4 Missouri 70-691st 12 Wyoming 5 Virginia 64-602nd 12 Wyoming 4 UCLA 78-682nd 10 LSU 2 Temple 72-62RSF 10 LSU 3 DePaul 63-58RF 6 Providence 1 Georgetown 88-7319881st 14 Murray St. 3 North Carolina St. 78-751st 13 Richmond 4 Indiana 72-691st 11 Rhode Island 6 Missouri 87-802nd 13 Richmond 5 Georgia Tech 59-552nd 11 Rhode Island 3 Syracuse 97-942nd 7 Vanderbilt 2 Pittsburgh 80-74 (OT)CH 6 Kansas 1 Oklahoma 83-7919891st 14 Siena 3 Stanford 80-781st 13 Middle Tenn. 4 Florida St. 97-831st 12 DePaul 5 Memphis 66-631st 11 Evansville 6 Oregon St. 94-90 (OT)1st 11 Minnesota 6 Kansas St. 86-751st 11 South Ala. 6 Alabama 86-841st 11 Texas 6 Georgia Tech 76-7019901st 14 UNI 3 Missouri 74-711st 12 Ball St. 5 Oregon St. 54-531st 12 Dayton 5 Illinois 88-861st 11 Loyola Marymount 6 New Mexico St. 111-922nd 12 Ball St. 4 Louisville 62-602nd 11 Loyola Marymount 3 Michigan 149-1152nd 10 Texas 2 Purdue 73-722nd 8 North Carolina 1 Oklahoma 79-772nd 7 Alabama 2 Arizona 77-552nd 7 UCLA 2 Kansas 71-7019911st 15 Richmond 2 Syracuse 73-691st 14 Xavier 3 Nebraska 89-841st 13 Penn St. 4 UCLA 74-691st 12 Eastern Mich. 5 Mississippi St. 76-561st 11 UConn 6 LSU 79-621st 11 Creighton 6 New Mexico St. 64-56RSF 10 Temple 3 Oklahoma St. 72-63 (OT)19921st 14 East Tenn. St. 3 Arizona 87-801st 13 Louisiana 4 Oklahoma 87-831st 12 New Mexico St. 5 DePaul 81-732nd 9 UTEP 1 Kansas 66-602nd 7 Georgia Tech 2 Southern California 79-78RF 6 Michigan 1 Ohio St. 75-71 (OT)19931st 15 Santa Clara 2 Arizona 64-611st 13 Southern U. 4 Georgia Tech 93-781st
12George
Washington 5 New Mexico 82-681st 11 Tulane 6 Kansas St. 55-532nd 7 Western Ky. 2 Seton Hall 72-6819941st 12 Green Bay 5 California 61-571st 12 Tulsa 5 UCLA 112-102
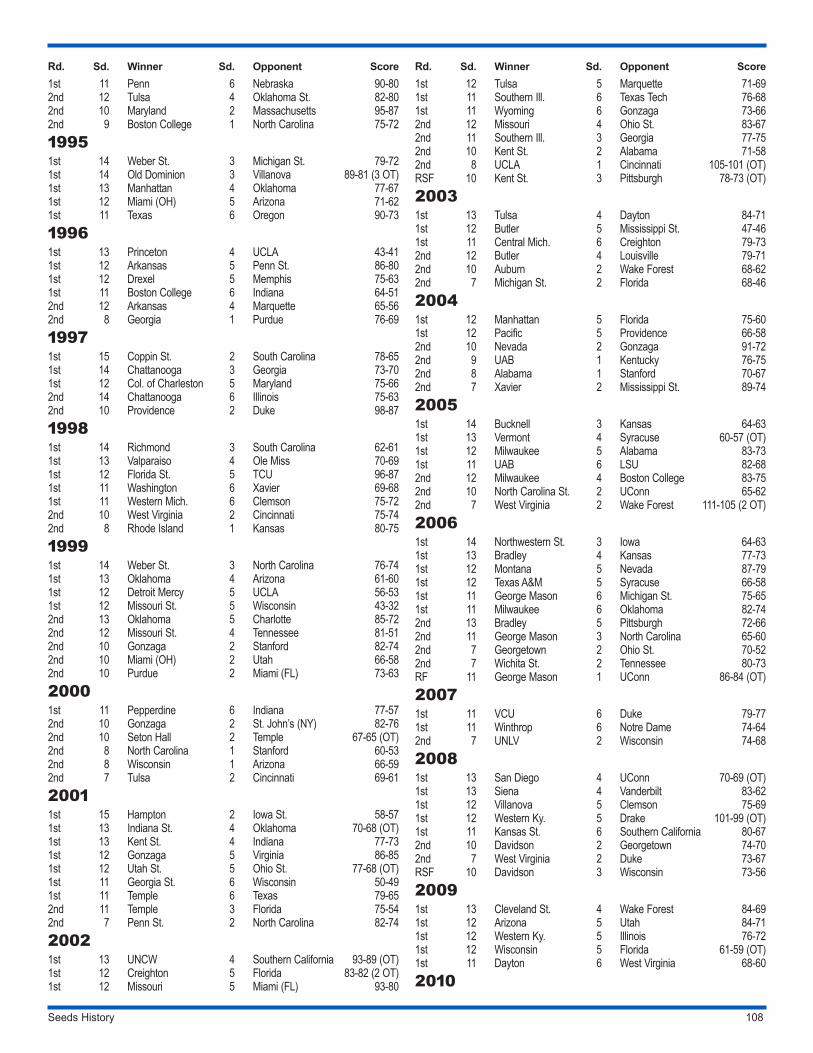
Seeds History 108
Rd. Sd. Winner Sd. Opponent Score1st 11 Penn 6 Nebraska 90-802nd 12 Tulsa 4 Oklahoma St. 82-802nd 10 Maryland 2 Massachusetts 95-872nd 9 Boston College 1 North Carolina 75-7219951st 14 Weber St. 3 Michigan St. 79-721st 14 Old Dominion 3 Villanova 89-81 (3 OT)1st 13 Manhattan 4 Oklahoma 77-671st 12 Miami (OH) 5 Arizona 71-621st 11 Texas 6 Oregon 90-7319961st 13 Princeton 4 UCLA 43-411st 12 Arkansas 5 Penn St. 86-801st 12 Drexel 5 Memphis 75-631st 11 Boston College 6 Indiana 64-512nd 12 Arkansas 4 Marquette 65-562nd 8 Georgia 1 Purdue 76-6919971st 15 Coppin St. 2 South Carolina 78-651st 14 Chattanooga 3 Georgia 73-701st 12 Col. of Charleston 5 Maryland 75-662nd 14 Chattanooga 6 Illinois 75-632nd 10 Providence 2 Duke 98-8719981st 14 Richmond 3 South Carolina 62-611st 13 Valparaiso 4 Ole Miss 70-691st 12 Florida St. 5 TCU 96-871st 11 Washington 6 Xavier 69-681st 11 Western Mich. 6 Clemson 75-722nd 10 West Virginia 2 Cincinnati 75-742nd 8 Rhode Island 1 Kansas 80-7519991st 14 Weber St. 3 North Carolina 76-741st 13 Oklahoma 4 Arizona 61-601st 12 Detroit Mercy 5 UCLA 56-531st 12 Missouri St. 5 Wisconsin 43-322nd 13 Oklahoma 5 Charlotte 85-722nd 12 Missouri St. 4 Tennessee 81-512nd 10 Gonzaga 2 Stanford 82-742nd 10 Miami (OH) 2 Utah 66-582nd 10 Purdue 2 Miami (FL) 73-6320001st 11 Pepperdine 6 Indiana 77-572nd 10 Gonzaga 2 St. John’s (NY) 82-762nd 10 Seton Hall 2 Temple 67-65 (OT)2nd 8 North Carolina 1 Stanford 60-532nd 8 Wisconsin 1 Arizona 66-592nd 7 Tulsa 2 Cincinnati 69-6120011st 15 Hampton 2 Iowa St. 58-571st 13 Indiana St. 4 Oklahoma 70-68 (OT)1st 13 Kent St. 4 Indiana 77-731st 12 Gonzaga 5 Virginia 86-851st 12 Utah St. 5 Ohio St. 77-68 (OT)1st 11 Georgia St. 6 Wisconsin 50-491st 11 Temple 6 Texas 79-652nd 11 Temple 3 Florida 75-542nd 7 Penn St. 2 North Carolina 82-7420021st 13 UNCW 4 Southern California 93-89 (OT)1st 12 Creighton 5 Florida 83-82 (2 OT)1st 12 Missouri 5 Miami (FL) 93-80
Rd. Sd. Winner Sd. Opponent Score1st 12 Tulsa 5 Marquette 71-691st 11 Southern Ill. 6 Texas Tech 76-681st 11 Wyoming 6 Gonzaga 73-662nd 12 Missouri 4 Ohio St. 83-672nd 11 Southern Ill. 3 Georgia 77-752nd 10 Kent St. 2 Alabama 71-582nd 8 UCLA 1 Cincinnati 105-101 (OT)RSF 10 Kent St. 3 Pittsburgh 78-73 (OT)20031st 13 Tulsa 4 Dayton 84-711st 12 Butler 5 Mississippi St. 47-461st 11 Central Mich. 6 Creighton 79-732nd 12 Butler 4 Louisville 79-712nd 10 Auburn 2 Wake Forest 68-622nd 7 Michigan St. 2 Florida 68-4620041st 12 Manhattan 5 Florida 75-601st 12 Pacific 5 Providence 66-582nd 10 Nevada 2 Gonzaga 91-722nd 9 UAB 1 Kentucky 76-752nd 8 Alabama 1 Stanford 70-672nd 7 Xavier 2 Mississippi St. 89-7420051st 14 Bucknell 3 Kansas 64-631st 13 Vermont 4 Syracuse 60-57 (OT)1st 12 Milwaukee 5 Alabama 83-731st 11 UAB 6 LSU 82-682nd 12 Milwaukee 4 Boston College 83-752nd 10 North Carolina St. 2 UConn 65-622nd 7 West Virginia 2 Wake Forest 111-105 (2 OT)20061st 14 Northwestern St. 3 Iowa 64-631st 13 Bradley 4 Kansas 77-731st 12 Montana 5 Nevada 87-791st 12 Texas A&M 5 Syracuse 66-581st 11 George Mason 6 Michigan St. 75-651st 11 Milwaukee 6 Oklahoma 82-742nd 13 Bradley 5 Pittsburgh 72-662nd 11 George Mason 3 North Carolina 65-602nd 7 Georgetown 2 Ohio St. 70-522nd 7 Wichita St. 2 Tennessee 80-73RF 11 George Mason 1 UConn 86-84 (OT)20071st 11 VCU 6 Duke 79-771st 11 Winthrop 6 Notre Dame 74-642nd 7 UNLV 2 Wisconsin 74-6820081st 13 San Diego 4 UConn 70-69 (OT)1st 13 Siena 4 Vanderbilt 83-621st 12 Villanova 5 Clemson 75-691st 12 Western Ky. 5 Drake 101-99 (OT)1st 11 Kansas St. 6 Southern California 80-672nd 10 Davidson 2 Georgetown 74-702nd 7 West Virginia 2 Duke 73-67RSF 10 Davidson 3 Wisconsin 73-5620091st 13 Cleveland St. 4 Wake Forest 84-691st 12 Arizona 5 Utah 84-711st 12 Western Ky. 5 Illinois 76-721st 12 Wisconsin 5 Florida 61-59 (OT)1st 11 Dayton 6 West Virginia 68-602010
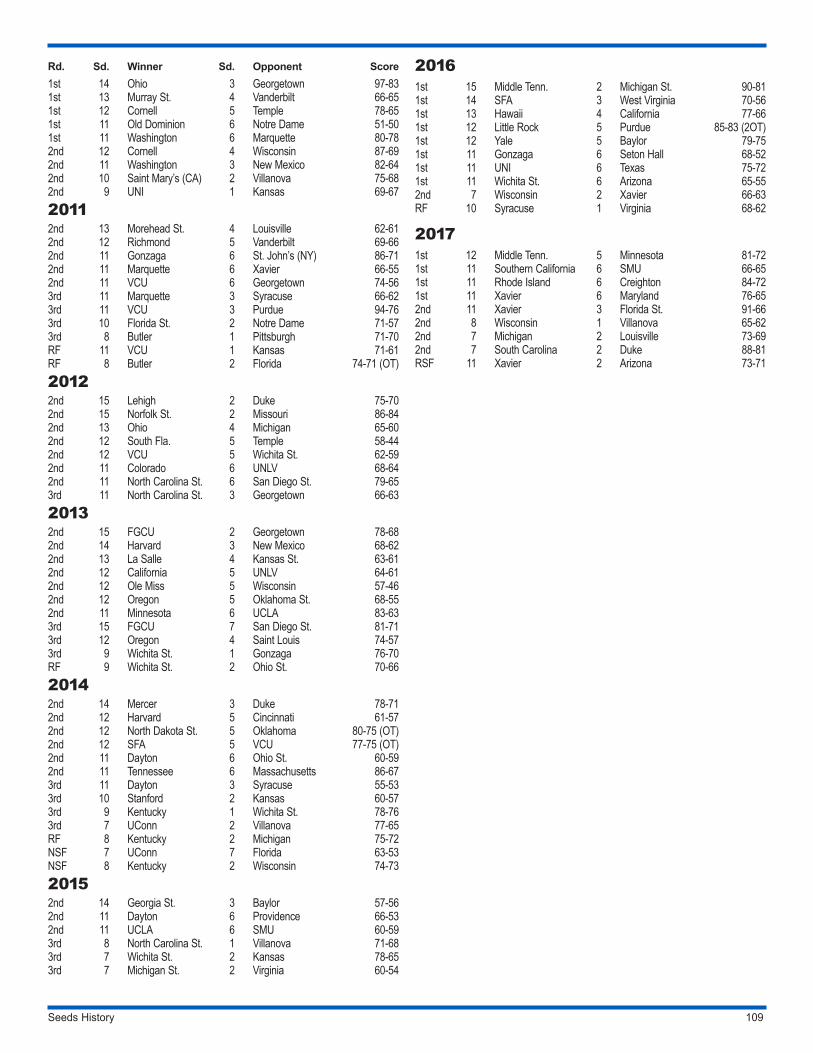
Seeds History 109
Rd. Sd. Winner Sd. Opponent Score1st 14 Ohio 3 Georgetown 97-831st 13 Murray St. 4 Vanderbilt 66-651st 12 Cornell 5 Temple 78-651st 11 Old Dominion 6 Notre Dame 51-501st 11 Washington 6 Marquette 80-782nd 12 Cornell 4 Wisconsin 87-692nd 11 Washington 3 New Mexico 82-642nd 10 Saint Mary’s (CA) 2 Villanova 75-682nd 9 UNI 1 Kansas 69-6720112nd 13 Morehead St. 4 Louisville 62-612nd 12 Richmond 5 Vanderbilt 69-662nd 11 Gonzaga 6 St. John’s (NY) 86-712nd 11 Marquette 6 Xavier 66-552nd 11 VCU 6 Georgetown 74-563rd 11 Marquette 3 Syracuse 66-623rd 11 VCU 3 Purdue 94-763rd 10 Florida St. 2 Notre Dame 71-573rd 8 Butler 1 Pittsburgh 71-70RF 11 VCU 1 Kansas 71-61RF 8 Butler 2 Florida 74-71 (OT)20122nd 15 Lehigh 2 Duke 75-702nd 15 Norfolk St. 2 Missouri 86-842nd 13 Ohio 4 Michigan 65-602nd 12 South Fla. 5 Temple 58-442nd 12 VCU 5 Wichita St. 62-592nd 11 Colorado 6 UNLV 68-642nd 11 North Carolina St. 6 San Diego St. 79-653rd 11 North Carolina St. 3 Georgetown 66-6320132nd 15 FGCU 2 Georgetown 78-682nd 14 Harvard 3 New Mexico 68-622nd 13 La Salle 4 Kansas St. 63-612nd 12 California 5 UNLV 64-612nd 12 Ole Miss 5 Wisconsin 57-462nd 12 Oregon 5 Oklahoma St. 68-552nd 11 Minnesota 6 UCLA 83-633rd 15 FGCU 7 San Diego St. 81-713rd 12 Oregon 4 Saint Louis 74-573rd 9 Wichita St. 1 Gonzaga 76-70RF 9 Wichita St. 2 Ohio St. 70-6620142nd 14 Mercer 3 Duke 78-712nd 12 Harvard 5 Cincinnati 61-572nd 12 North Dakota St. 5 Oklahoma 80-75 (OT)2nd 12 SFA 5 VCU 77-75 (OT)2nd 11 Dayton 6 Ohio St. 60-592nd 11 Tennessee 6 Massachusetts 86-673rd 11 Dayton 3 Syracuse 55-533rd 10 Stanford 2 Kansas 60-573rd 9 Kentucky 1 Wichita St. 78-763rd 7 UConn 2 Villanova 77-65RF 8 Kentucky 2 Michigan 75-72NSF 7 UConn 7 Florida 63-53NSF 8 Kentucky 2 Wisconsin 74-7320152nd 14 Georgia St. 3 Baylor 57-562nd 11 Dayton 6 Providence 66-532nd 11 UCLA 6 SMU 60-593rd 8 North Carolina St. 1 Villanova 71-683rd 7 Wichita St. 2 Kansas 78-653rd 7 Michigan St. 2 Virginia 60-54
20161st 15 Middle Tenn. 2 Michigan St. 90-811st 14 SFA 3 West Virginia 70-561st 13 Hawaii 4 California 77-661st 12 Little Rock 5 Purdue 85-83 (2OT)1st 12 Yale 5 Baylor 79-751st 11 Gonzaga 6 Seton Hall 68-521st 11 UNI 6 Texas 75-721st 11 Wichita St. 6 Arizona 65-552nd 7 Wisconsin 2 Xavier 66-63RF 10 Syracuse 1 Virginia 68-62
20171st 12 Middle Tenn. 5 Minnesota 81-721st 11 Southern California 6 SMU 66-651st 11 Rhode Island 6 Creighton 84-721st 11 Xavier 6 Maryland 76-652nd 11 Xavier 3 Florida St. 91-662nd 8 Wisconsin 1 Villanova 65-622nd 7 Michigan 2 Louisville 73-692nd 7 South Carolina 2 Duke 88-81RSF 11 Xavier 2 Arizona 73-71
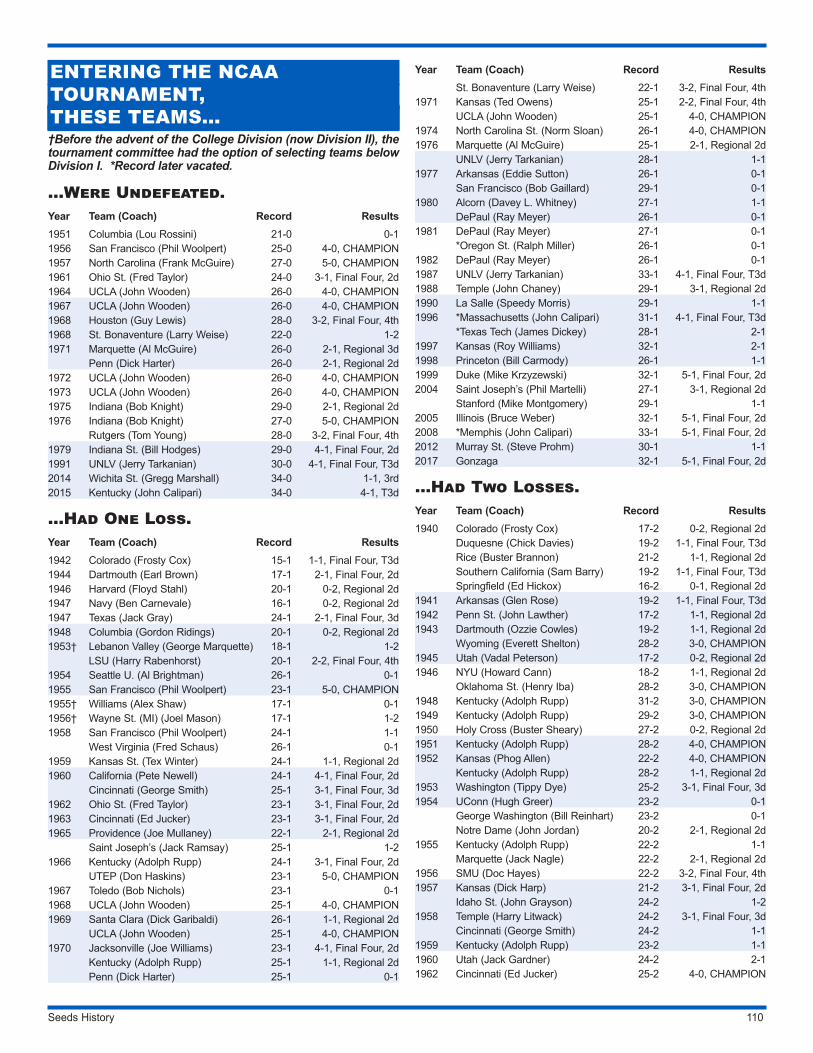
Seeds History 110
ENTERING THE NCAA TOURNAMENT,THESE TEAMS…†Before the advent of the College Division (now Division II), the tournament committee had the option of selecting teams below Division I. *Record later vacated.
…Were Undefeated.Year Team (Coach) Record Results1951 Columbia (Lou Rossini) 21-0 0-11956 San Francisco (Phil Woolpert) 25-0 4-0, CHAMPION1957 North Carolina (Frank McGuire) 27-0 5-0, CHAMPION1961 Ohio St. (Fred Taylor) 24-0 3-1, Final Four, 2d1964 UCLA (John Wooden) 26-0 4-0, CHAMPION1967 UCLA (John Wooden) 26-0 4-0, CHAMPION1968 Houston (Guy Lewis) 28-0 3-2, Final Four, 4th1968 St. Bonaventure (Larry Weise) 22-0 1-21971 Marquette (Al McGuire) 26-0 2-1, Regional 3d
Penn (Dick Harter) 26-0 2-1, Regional 2d1972 UCLA (John Wooden) 26-0 4-0, CHAMPION1973 UCLA (John Wooden) 26-0 4-0, CHAMPION1975 Indiana (Bob Knight) 29-0 2-1, Regional 2d1976 Indiana (Bob Knight) 27-0 5-0, CHAMPION
Rutgers (Tom Young) 28-0 3-2, Final Four, 4th1979 Indiana St. (Bill Hodges) 29-0 4-1, Final Four, 2d1991 UNLV (Jerry Tarkanian) 30-0 4-1, Final Four, T3d2014 Wichita St. (Gregg Marshall) 34-0 1-1, 3rd2015 Kentucky (John Calipari) 34-0 4-1, T3d
…Had One Loss.Year Team (Coach) Record Results1942 Colorado (Frosty Cox) 15-1 1-1, Final Four, T3d1944 Dartmouth (Earl Brown) 17-1 2-1, Final Four, 2d1946 Harvard (Floyd Stahl) 20-1 0-2, Regional 2d1947 Navy (Ben Carnevale) 16-1 0-2, Regional 2d1947 Texas (Jack Gray) 24-1 2-1, Final Four, 3d1948 Columbia (Gordon Ridings) 20-1 0-2, Regional 2d1953† Lebanon Valley (George Marquette) 18-1 1-2
LSU (Harry Rabenhorst) 20-1 2-2, Final Four, 4th1954 Seattle U. (Al Brightman) 26-1 0-11955 San Francisco (Phil Woolpert) 23-1 5-0, CHAMPION1955† Williams (Alex Shaw) 17-1 0-11956† Wayne St. (MI) (Joel Mason) 17-1 1-21958 San Francisco (Phil Woolpert) 24-1 1-1
West Virginia (Fred Schaus) 26-1 0-11959 Kansas St. (Tex Winter) 24-1 1-1, Regional 2d1960 California (Pete Newell) 24-1 4-1, Final Four, 2d
Cincinnati (George Smith) 25-1 3-1, Final Four, 3d1962 Ohio St. (Fred Taylor) 23-1 3-1, Final Four, 2d1963 Cincinnati (Ed Jucker) 23-1 3-1, Final Four, 2d1965 Providence (Joe Mullaney) 22-1 2-1, Regional 2d
Saint Joseph’s (Jack Ramsay) 25-1 1-21966 Kentucky (Adolph Rupp) 24-1 3-1, Final Four, 2d
UTEP (Don Haskins) 23-1 5-0, CHAMPION1967 Toledo (Bob Nichols) 23-1 0-11968 UCLA (John Wooden) 25-1 4-0, CHAMPION1969 Santa Clara (Dick Garibaldi) 26-1 1-1, Regional 2d
UCLA (John Wooden) 25-1 4-0, CHAMPION1970 Jacksonville (Joe Williams) 23-1 4-1, Final Four, 2d
Kentucky (Adolph Rupp) 25-1 1-1, Regional 2dPenn (Dick Harter) 25-1 0-1
Year Team (Coach) Record ResultsSt. Bonaventure (Larry Weise) 22-1 3-2, Final Four, 4th
1971 Kansas (Ted Owens) 25-1 2-2, Final Four, 4thUCLA (John Wooden) 25-1 4-0, CHAMPION
1974 North Carolina St. (Norm Sloan) 26-1 4-0, CHAMPION1976 Marquette (Al McGuire) 25-1 2-1, Regional 2d
UNLV (Jerry Tarkanian) 28-1 1-11977 Arkansas (Eddie Sutton) 26-1 0-1
San Francisco (Bob Gaillard) 29-1 0-11980 Alcorn (Davey L. Whitney) 27-1 1-1
DePaul (Ray Meyer) 26-1 0-11981 DePaul (Ray Meyer) 27-1 0-1
*Oregon St. (Ralph Miller) 26-1 0-11982 DePaul (Ray Meyer) 26-1 0-11987 UNLV (Jerry Tarkanian) 33-1 4-1, Final Four, T3d1988 Temple (John Chaney) 29-1 3-1, Regional 2d1990 La Salle (Speedy Morris) 29-1 1-11996 *Massachusetts (John Calipari) 31-1 4-1, Final Four, T3d
*Texas Tech (James Dickey) 28-1 2-11997 Kansas (Roy Williams) 32-1 2-11998 Princeton (Bill Carmody) 26-1 1-11999 Duke (Mike Krzyzewski) 32-1 5-1, Final Four, 2d2004 Saint Joseph’s (Phil Martelli) 27-1 3-1, Regional 2d
Stanford (Mike Montgomery) 29-1 1-12005 Illinois (Bruce Weber) 32-1 5-1, Final Four, 2d2008 *Memphis (John Calipari) 33-1 5-1, Final Four, 2d2012 Murray St. (Steve Prohm) 30-1 1-12017 Gonzaga 32-1 5-1, Final Four, 2d
…Had Two Losses.Year Team (Coach) Record Results1940 Colorado (Frosty Cox) 17-2 0-2, Regional 2d
Duquesne (Chick Davies) 19-2 1-1, Final Four, T3dRice (Buster Brannon) 21-2 1-1, Regional 2dSouthern California (Sam Barry) 19-2 1-1, Final Four, T3dSpringfield (Ed Hickox) 16-2 0-1, Regional 2d
1941 Arkansas (Glen Rose) 19-2 1-1, Final Four, T3d1942 Penn St. (John Lawther) 17-2 1-1, Regional 2d1943 Dartmouth (Ozzie Cowles) 19-2 1-1, Regional 2d
Wyoming (Everett Shelton) 28-2 3-0, CHAMPION1945 Utah (Vadal Peterson) 17-2 0-2, Regional 2d1946 NYU (Howard Cann) 18-2 1-1, Regional 2d
Oklahoma St. (Henry Iba) 28-2 3-0, CHAMPION1948 Kentucky (Adolph Rupp) 31-2 3-0, CHAMPION1949 Kentucky (Adolph Rupp) 29-2 3-0, CHAMPION1950 Holy Cross (Buster Sheary) 27-2 0-2, Regional 2d1951 Kentucky (Adolph Rupp) 28-2 4-0, CHAMPION1952 Kansas (Phog Allen) 22-2 4-0, CHAMPION
Kentucky (Adolph Rupp) 28-2 1-1, Regional 2d1953 Washington (Tippy Dye) 25-2 3-1, Final Four, 3d1954 UConn (Hugh Greer) 23-2 0-1
George Washington (Bill Reinhart) 23-2 0-1Notre Dame (John Jordan) 20-2 2-1, Regional 2d
1955 Kentucky (Adolph Rupp) 22-2 1-1Marquette (Jack Nagle) 22-2 2-1, Regional 2d
1956 SMU (Doc Hayes) 22-2 3-2, Final Four, 4th1957 Kansas (Dick Harp) 21-2 3-1, Final Four, 2d
Idaho St. (John Grayson) 24-2 1-21958 Temple (Harry Litwack) 24-2 3-1, Final Four, 3d
Cincinnati (George Smith) 24-2 1-11959 Kentucky (Adolph Rupp) 23-2 1-11960 Utah (Jack Gardner) 24-2 2-11962 Cincinnati (Ed Jucker) 25-2 4-0, CHAMPION
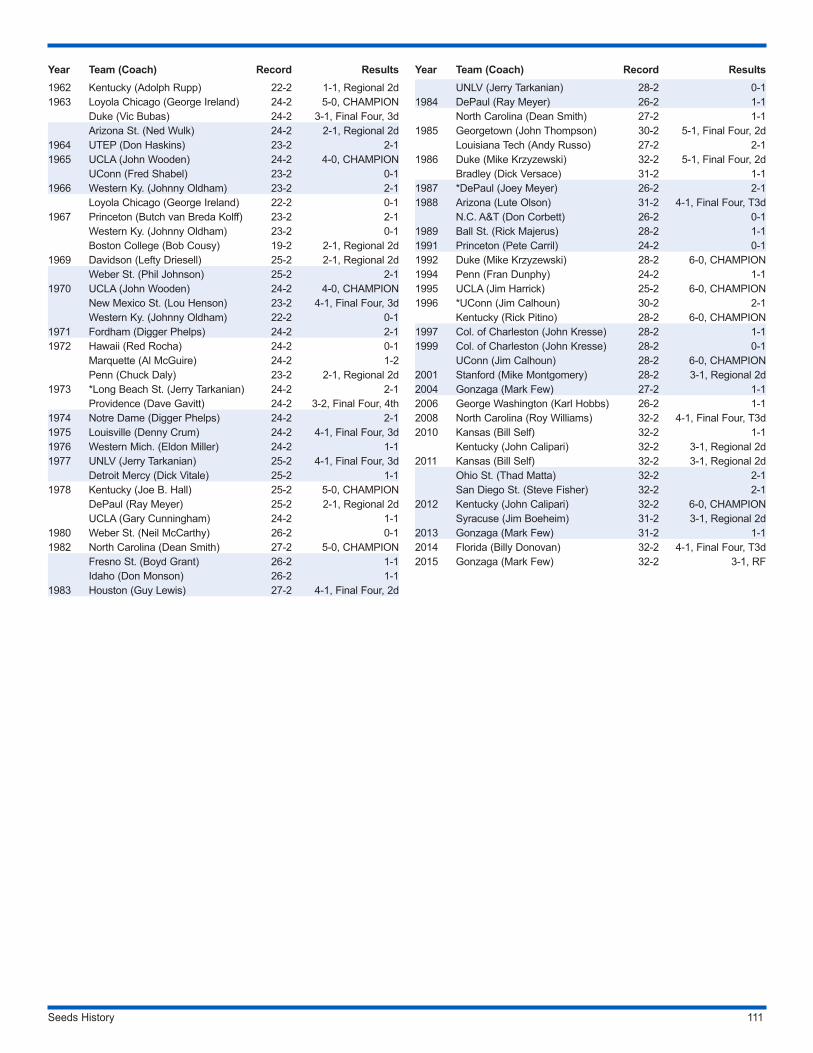
Seeds History 111
Year Team (Coach) Record Results1962 Kentucky (Adolph Rupp) 22-2 1-1, Regional 2d1963 Loyola Chicago (George Ireland) 24-2 5-0, CHAMPION
Duke (Vic Bubas) 24-2 3-1, Final Four, 3dArizona St. (Ned Wulk) 24-2 2-1, Regional 2d
1964 UTEP (Don Haskins) 23-2 2-11965 UCLA (John Wooden) 24-2 4-0, CHAMPION
UConn (Fred Shabel) 23-2 0-11966 Western Ky. (Johnny Oldham) 23-2 2-1
Loyola Chicago (George Ireland) 22-2 0-11967 Princeton (Butch van Breda Kolff) 23-2 2-1
Western Ky. (Johnny Oldham) 23-2 0-1Boston College (Bob Cousy) 19-2 2-1, Regional 2d
1969 Davidson (Lefty Driesell) 25-2 2-1, Regional 2dWeber St. (Phil Johnson) 25-2 2-1
1970 UCLA (John Wooden) 24-2 4-0, CHAMPIONNew Mexico St. (Lou Henson) 23-2 4-1, Final Four, 3dWestern Ky. (Johnny Oldham) 22-2 0-1
1971 Fordham (Digger Phelps) 24-2 2-11972 Hawaii (Red Rocha) 24-2 0-1
Marquette (Al McGuire) 24-2 1-2Penn (Chuck Daly) 23-2 2-1, Regional 2d
1973 *Long Beach St. (Jerry Tarkanian) 24-2 2-1Providence (Dave Gavitt) 24-2 3-2, Final Four, 4th
1974 Notre Dame (Digger Phelps) 24-2 2-11975 Louisville (Denny Crum) 24-2 4-1, Final Four, 3d1976 Western Mich. (Eldon Miller) 24-2 1-11977 UNLV (Jerry Tarkanian) 25-2 4-1, Final Four, 3d
Detroit Mercy (Dick Vitale) 25-2 1-11978 Kentucky (Joe B. Hall) 25-2 5-0, CHAMPION
DePaul (Ray Meyer) 25-2 2-1, Regional 2dUCLA (Gary Cunningham) 24-2 1-1
1980 Weber St. (Neil McCarthy) 26-2 0-11982 North Carolina (Dean Smith) 27-2 5-0, CHAMPION
Fresno St. (Boyd Grant) 26-2 1-1Idaho (Don Monson) 26-2 1-1
1983 Houston (Guy Lewis) 27-2 4-1, Final Four, 2d
Year Team (Coach) Record ResultsUNLV (Jerry Tarkanian) 28-2 0-1
1984 DePaul (Ray Meyer) 26-2 1-1North Carolina (Dean Smith) 27-2 1-1
1985 Georgetown (John Thompson) 30-2 5-1, Final Four, 2dLouisiana Tech (Andy Russo) 27-2 2-1
1986 Duke (Mike Krzyzewski) 32-2 5-1, Final Four, 2dBradley (Dick Versace) 31-2 1-1
1987 *DePaul (Joey Meyer) 26-2 2-11988 Arizona (Lute Olson) 31-2 4-1, Final Four, T3d
N.C. A&T (Don Corbett) 26-2 0-11989 Ball St. (Rick Majerus) 28-2 1-11991 Princeton (Pete Carril) 24-2 0-11992 Duke (Mike Krzyzewski) 28-2 6-0, CHAMPION1994 Penn (Fran Dunphy) 24-2 1-11995 UCLA (Jim Harrick) 25-2 6-0, CHAMPION1996 *UConn (Jim Calhoun) 30-2 2-1
Kentucky (Rick Pitino) 28-2 6-0, CHAMPION1997 Col. of Charleston (John Kresse) 28-2 1-11999 Col. of Charleston (John Kresse) 28-2 0-1
UConn (Jim Calhoun) 28-2 6-0, CHAMPION2001 Stanford (Mike Montgomery) 28-2 3-1, Regional 2d2004 Gonzaga (Mark Few) 27-2 1-12006 George Washington (Karl Hobbs) 26-2 1-12008 North Carolina (Roy Williams) 32-2 4-1, Final Four, T3d2010 Kansas (Bill Self) 32-2 1-1
Kentucky (John Calipari) 32-2 3-1, Regional 2d2011 Kansas (Bill Self) 32-2 3-1, Regional 2d
Ohio St. (Thad Matta) 32-2 2-1San Diego St. (Steve Fisher) 32-2 2-1
2012 Kentucky (John Calipari) 32-2 6-0, CHAMPIONSyracuse (Jim Boeheim) 31-2 3-1, Regional 2d
2013 Gonzaga (Mark Few) 31-2 1-12014 Florida (Billy Donovan) 32-2 4-1, Final Four, T3d2015 Gonzaga (Mark Few) 32-2 3-1, RF
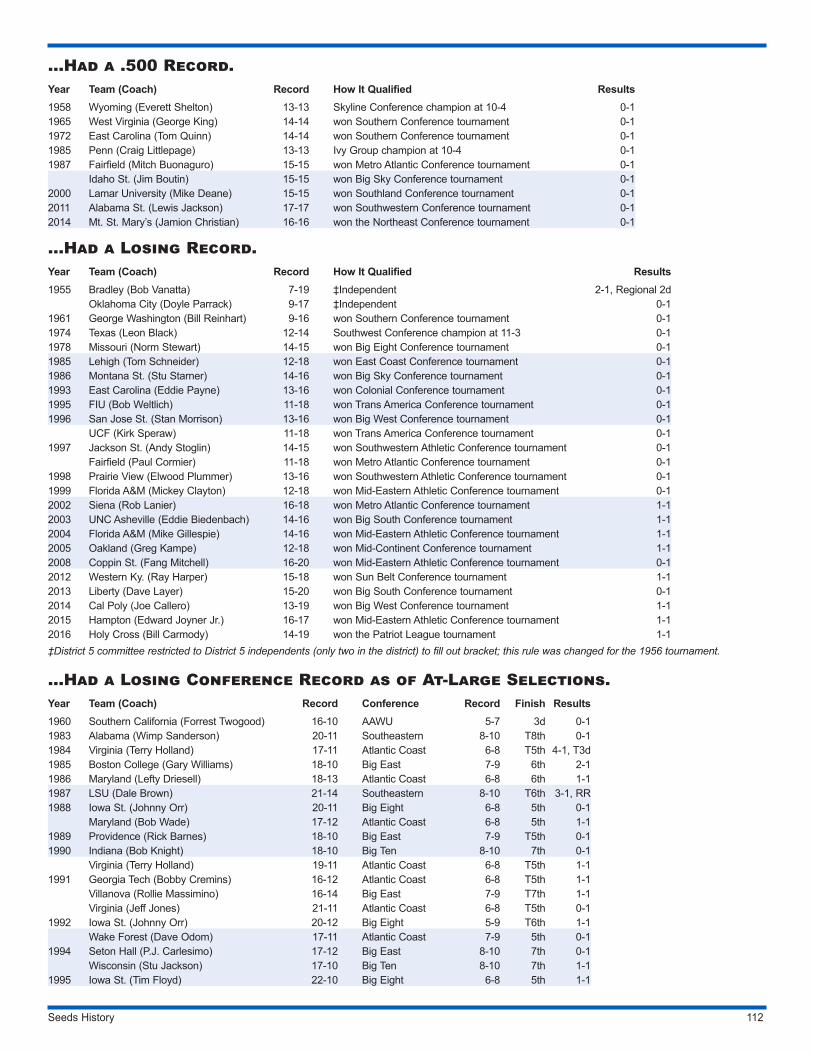
Seeds History 112
…Had a .500 Record.Year Team (Coach) Record How It Qualified Results1958 Wyoming (Everett Shelton) 13-13 Skyline Conference champion at 10-4 0-11965 West Virginia (George King) 14-14 won Southern Conference tournament 0-11972 East Carolina (Tom Quinn) 14-14 won Southern Conference tournament 0-11985 Penn (Craig Littlepage) 13-13 Ivy Group champion at 10-4 0-11987 Fairfield (Mitch Buonaguro) 15-15 won Metro Atlantic Conference tournament 0-1
Idaho St. (Jim Boutin) 15-15 won Big Sky Conference tournament 0-12000 Lamar University (Mike Deane) 15-15 won Southland Conference tournament 0-12011 Alabama St. (Lewis Jackson) 17-17 won Southwestern Conference tournament 0-12014 Mt. St. Mary’s (Jamion Christian) 16-16 won the Northeast Conference tournament 0-1
…Had a Losing Record.Year Team (Coach) Record How It Qualified Results1955 Bradley (Bob Vanatta) 7-19 ‡Independent 2-1, Regional 2d
Oklahoma City (Doyle Parrack) 9-17 ‡Independent 0-11961 George Washington (Bill Reinhart) 9-16 won Southern Conference tournament 0-11974 Texas (Leon Black) 12-14 Southwest Conference champion at 11-3 0-11978 Missouri (Norm Stewart) 14-15 won Big Eight Conference tournament 0-11985 Lehigh (Tom Schneider) 12-18 won East Coast Conference tournament 0-11986 Montana St. (Stu Starner) 14-16 won Big Sky Conference tournament 0-11993 East Carolina (Eddie Payne) 13-16 won Colonial Conference tournament 0-11995 FIU (Bob Weltlich) 11-18 won Trans America Conference tournament 0-11996 San Jose St. (Stan Morrison) 13-16 won Big West Conference tournament 0-1
UCF (Kirk Speraw) 11-18 won Trans America Conference tournament 0-11997 Jackson St. (Andy Stoglin) 14-15 won Southwestern Athletic Conference tournament 0-1
Fairfield (Paul Cormier) 11-18 won Metro Atlantic Conference tournament 0-11998 Prairie View (Elwood Plummer) 13-16 won Southwestern Athletic Conference tournament 0-11999 Florida A&M (Mickey Clayton) 12-18 won Mid-Eastern Athletic Conference tournament 0-12002 Siena (Rob Lanier) 16-18 won Metro Atlantic Conference tournament 1-12003 UNC Asheville (Eddie Biedenbach) 14-16 won Big South Conference tournament 1-12004 Florida A&M (Mike Gillespie) 14-16 won Mid-Eastern Athletic Conference tournament 1-12005 Oakland (Greg Kampe) 12-18 won Mid-Continent Conference tournament 1-12008 Coppin St. (Fang Mitchell) 16-20 won Mid-Eastern Athletic Conference tournament 0-12012 Western Ky. (Ray Harper) 15-18 won Sun Belt Conference tournament 1-12013 Liberty (Dave Layer) 15-20 won Big South Conference tournament 0-12014 Cal Poly (Joe Callero) 13-19 won Big West Conference tournament 1-12015 Hampton (Edward Joyner Jr.) 16-17 won Mid-Eastern Athletic Conference tournament 1-12016 Holy Cross (Bill Carmody) 14-19 won the Patriot League tournament 1-1‡District 5 committee restricted to District 5 independents (only two in the district) to fill out bracket; this rule was changed for the 1956 tournament.
…Had a Losing Conference Record as of At-Large Selections.Year Team (Coach) Record Conference Record Finish Results1960 Southern California (Forrest Twogood) 16-10 AAWU 5-7 3d 0-11983 Alabama (Wimp Sanderson) 20-11 Southeastern 8-10 T8th 0-11984 Virginia (Terry Holland) 17-11 Atlantic Coast 6-8 T5th 4-1, T3d1985 Boston College (Gary Williams) 18-10 Big East 7-9 6th 2-11986 Maryland (Lefty Driesell) 18-13 Atlantic Coast 6-8 6th 1-11987 LSU (Dale Brown) 21-14 Southeastern 8-10 T6th 3-1, RR1988 Iowa St. (Johnny Orr) 20-11 Big Eight 6-8 5th 0-1
Maryland (Bob Wade) 17-12 Atlantic Coast 6-8 5th 1-11989 Providence (Rick Barnes) 18-10 Big East 7-9 T5th 0-11990 Indiana (Bob Knight) 18-10 Big Ten 8-10 7th 0-1
Virginia (Terry Holland) 19-11 Atlantic Coast 6-8 T5th 1-11991 Georgia Tech (Bobby Cremins) 16-12 Atlantic Coast 6-8 T5th 1-1
Villanova (Rollie Massimino) 16-14 Big East 7-9 T7th 1-1Virginia (Jeff Jones) 21-11 Atlantic Coast 6-8 T5th 0-1
1992 Iowa St. (Johnny Orr) 20-12 Big Eight 5-9 T6th 1-1Wake Forest (Dave Odom) 17-11 Atlantic Coast 7-9 5th 0-1
1994 Seton Hall (P.J. Carlesimo) 17-12 Big East 8-10 7th 0-1Wisconsin (Stu Jackson) 17-10 Big Ten 8-10 7th 1-1
1995 Iowa St. (Tim Floyd) 22-10 Big Eight 6-8 5th 1-1
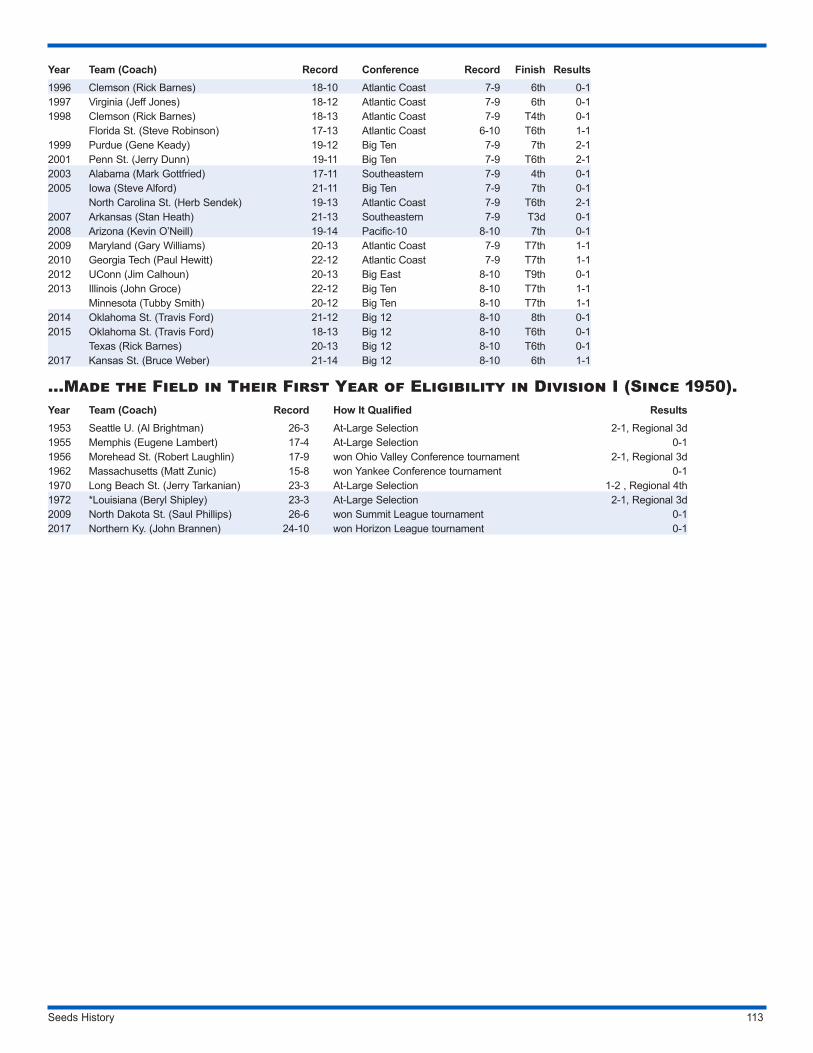
Seeds History 113
Year Team (Coach) Record Conference Record Finish Results1996 Clemson (Rick Barnes) 18-10 Atlantic Coast 7-9 6th 0-11997 Virginia (Jeff Jones) 18-12 Atlantic Coast 7-9 6th 0-11998 Clemson (Rick Barnes) 18-13 Atlantic Coast 7-9 T4th 0-1
Florida St. (Steve Robinson) 17-13 Atlantic Coast 6-10 T6th 1-11999 Purdue (Gene Keady) 19-12 Big Ten 7-9 7th 2-12001 Penn St. (Jerry Dunn) 19-11 Big Ten 7-9 T6th 2-12003 Alabama (Mark Gottfried) 17-11 Southeastern 7-9 4th 0-12005 Iowa (Steve Alford) 21-11 Big Ten 7-9 7th 0-1
North Carolina St. (Herb Sendek) 19-13 Atlantic Coast 7-9 T6th 2-12007 Arkansas (Stan Heath) 21-13 Southeastern 7-9 T3d 0-12008 Arizona (Kevin O’Neill) 19-14 Pacific-10 8-10 7th 0-12009 Maryland (Gary Williams) 20-13 Atlantic Coast 7-9 T7th 1-12010 Georgia Tech (Paul Hewitt) 22-12 Atlantic Coast 7-9 T7th 1-12012 UConn (Jim Calhoun) 20-13 Big East 8-10 T9th 0-12013 Illinois (John Groce) 22-12 Big Ten 8-10 T7th 1-1
Minnesota (Tubby Smith) 20-12 Big Ten 8-10 T7th 1-12014 Oklahoma St. (Travis Ford) 21-12 Big 12 8-10 8th 0-12015 Oklahoma St. (Travis Ford) 18-13 Big 12 8-10 T6th 0-1
Texas (Rick Barnes) 20-13 Big 12 8-10 T6th 0-12017 Kansas St. (Bruce Weber) 21-14 Big 12 8-10 6th 1-1
…Made the Field in Their First Year of Eligibility in Division I (Since 1950).Year Team (Coach) Record How It Qualified Results1953 Seattle U. (Al Brightman) 26-3 At-Large Selection 2-1, Regional 3d1955 Memphis (Eugene Lambert) 17-4 At-Large Selection 0-11956 Morehead St. (Robert Laughlin) 17-9 won Ohio Valley Conference tournament 2-1, Regional 3d1962 Massachusetts (Matt Zunic) 15-8 won Yankee Conference tournament 0-11970 Long Beach St. (Jerry Tarkanian) 23-3 At-Large Selection 1-2 , Regional 4th1972 *Louisiana (Beryl Shipley) 23-3 At-Large Selection 2-1, Regional 3d2009 North Dakota St. (Saul Phillips) 26-6 won Summit League tournament 0-12017 Northern Ky. (John Brannen) 24-10 won Horizon League tournament 0-1
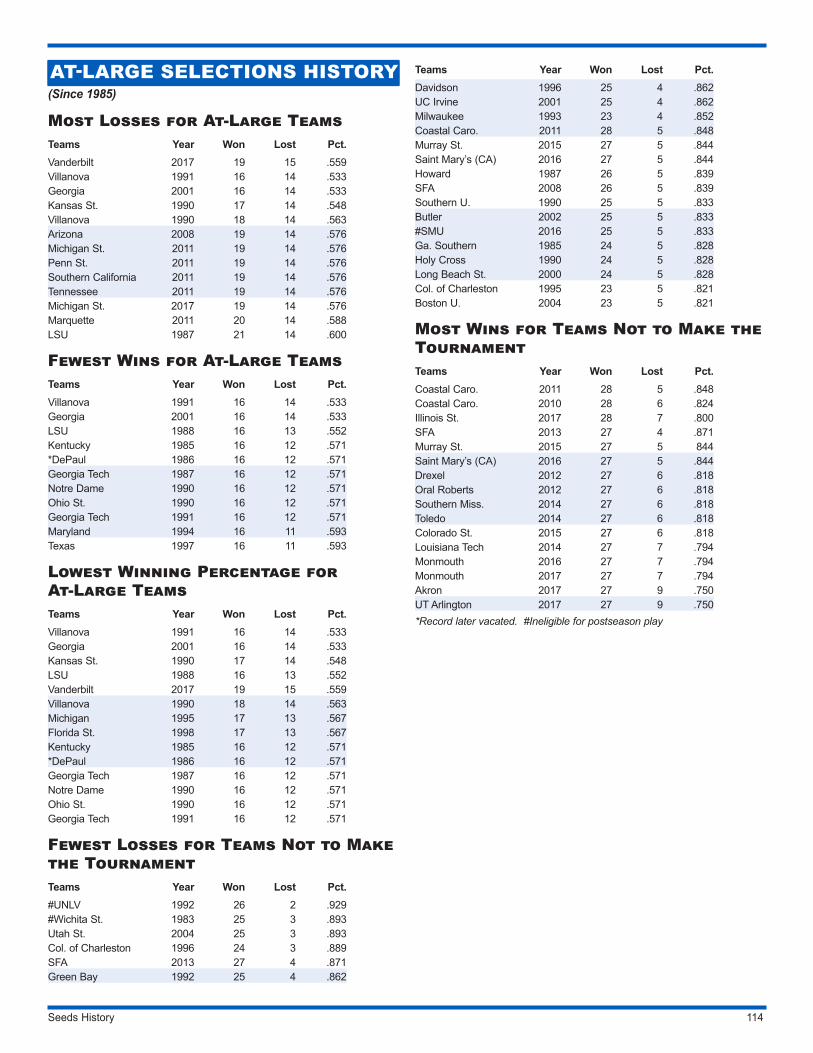
Seeds History 114
AT-LARGE SELECTIONS HISTORY(Since 1985)
Most Losses for At-Large TeamsTeams Year Won Lost Pct.Vanderbilt 2017 19 15 .559Villanova 1991 16 14 .533Georgia 2001 16 14 .533Kansas St. 1990 17 14 .548Villanova 1990 18 14 .563Arizona 2008 19 14 .576Michigan St. 2011 19 14 .576Penn St. 2011 19 14 .576Southern California 2011 19 14 .576Tennessee 2011 19 14 .576Michigan St. 2017 19 14 .576Marquette 2011 20 14 .588LSU 1987 21 14 .600
Fewest Wins for At-Large Teams Teams Year Won Lost Pct.Villanova 1991 16 14 .533Georgia 2001 16 14 .533LSU 1988 16 13 .552Kentucky 1985 16 12 .571*DePaul 1986 16 12 .571Georgia Tech 1987 16 12 .571Notre Dame 1990 16 12 .571Ohio St. 1990 16 12 .571Georgia Tech 1991 16 12 .571Maryland 1994 16 11 .593Texas 1997 16 11 .593
Lowest Winning Percentage for At-Large Teams Teams Year Won Lost Pct.Villanova 1991 16 14 .533Georgia 2001 16 14 .533Kansas St. 1990 17 14 .548LSU 1988 16 13 .552Vanderbilt 2017 19 15 .559Villanova 1990 18 14 .563Michigan 1995 17 13 .567Florida St. 1998 17 13 .567Kentucky 1985 16 12 .571*DePaul 1986 16 12 .571Georgia Tech 1987 16 12 .571Notre Dame 1990 16 12 .571Ohio St. 1990 16 12 .571Georgia Tech 1991 16 12 .571
Fewest Losses for Teams Not to Make the Tournament Teams Year Won Lost Pct.#UNLV 1992 26 2 .929#Wichita St. 1983 25 3 .893Utah St. 2004 25 3 .893Col. of Charleston 1996 24 3 .889SFA 2013 27 4 .871Green Bay 1992 25 4 .862
Teams Year Won Lost Pct.Davidson 1996 25 4 .862UC Irvine 2001 25 4 .862Milwaukee 1993 23 4 .852Coastal Caro. 2011 28 5 .848Murray St. 2015 27 5 .844Saint Mary’s (CA) 2016 27 5 .844Howard 1987 26 5 .839SFA 2008 26 5 .839Southern U. 1990 25 5 .833Butler 2002 25 5 .833#SMU 2016 25 5 .833Ga. Southern 1985 24 5 .828Holy Cross 1990 24 5 .828Long Beach St. 2000 24 5 .828Col. of Charleston 1995 23 5 .821Boston U. 2004 23 5 .821
Most Wins for Teams Not to Make the Tournament Teams Year Won Lost Pct.Coastal Caro. 2011 28 5 .848Coastal Caro. 2010 28 6 .824Illinois St. 2017 28 7 .800SFA 2013 27 4 .871Murray St. 2015 27 5 844Saint Mary’s (CA) 2016 27 5 .844Drexel 2012 27 6 .818Oral Roberts 2012 27 6 .818Southern Miss. 2014 27 6 .818Toledo 2014 27 6 .818Colorado St. 2015 27 6 .818Louisiana Tech 2014 27 7 .794Monmouth 2016 27 7 .794Monmouth 2017 27 7 .794Akron 2017 27 9 .750UT Arlington 2017 27 9 .750*Record later vacated. #Ineligible for postseason play
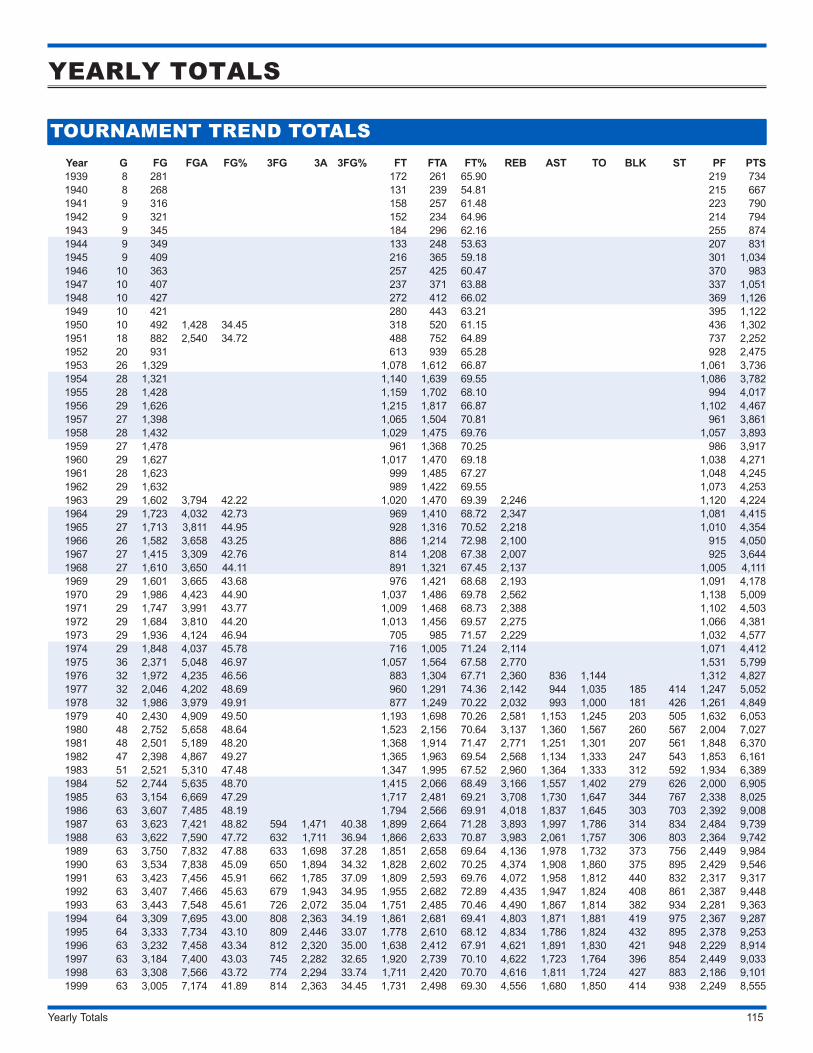
Yearly Totals 115
YEARLY TOTALS
TOURNAMENT TREND TOTALSYear G FG FGA FG% 3FG 3A 3FG% FT FTA FT% REB AST TO BLK ST PF PTS1939 8 281 172 261 65.90 219 7341940 8 268 131 239 54.81 215 6671941 9 316 158 257 61.48 223 7901942 9 321 152 234 64.96 214 7941943 9 345 184 296 62.16 255 8741944 9 349 133 248 53.63 207 8311945 9 409 216 365 59.18 301 1,0341946 10 363 257 425 60.47 370 9831947 10 407 237 371 63.88 337 1,0511948 10 427 272 412 66.02 369 1,1261949 10 421 280 443 63.21 395 1,1221950 10 492 1,428 34.45 318 520 61.15 436 1,3021951 18 882 2,540 34.72 488 752 64.89 737 2,2521952 20 931 613 939 65.28 928 2,4751953 26 1,329 1,078 1,612 66.87 1,061 3,7361954 28 1,321 1,140 1,639 69.55 1,086 3,7821955 28 1,428 1,159 1,702 68.10 994 4,0171956 29 1,626 1,215 1,817 66.87 1,102 4,4671957 27 1,398 1,065 1,504 70.81 961 3,8611958 28 1,432 1,029 1,475 69.76 1,057 3,8931959 27 1,478 961 1,368 70.25 986 3,9171960 29 1,627 1,017 1,470 69.18 1,038 4,2711961 28 1,623 999 1,485 67.27 1,048 4,2451962 29 1,632 989 1,422 69.55 1,073 4,2531963 29 1,602 3,794 42.22 1,020 1,470 69.39 2,246 1,120 4,2241964 29 1,723 4,032 42.73 969 1,410 68.72 2,347 1,081 4,4151965 27 1,713 3,811 44.95 928 1,316 70.52 2,218 1,010 4,3541966 26 1,582 3,658 43.25 886 1,214 72.98 2,100 915 4,0501967 27 1,415 3,309 42.76 814 1,208 67.38 2,007 925 3,6441968 27 1,610 3,650 44.11 891 1,321 67.45 2,137 1,005 4,1111969 29 1,601 3,665 43.68 976 1,421 68.68 2,193 1,091 4,1781970 29 1,986 4,423 44.90 1,037 1,486 69.78 2,562 1,138 5,0091971 29 1,747 3,991 43.77 1,009 1,468 68.73 2,388 1,102 4,5031972 29 1,684 3,810 44.20 1,013 1,456 69.57 2,275 1,066 4,3811973 29 1,936 4,124 46.94 705 985 71.57 2,229 1,032 4,5771974 29 1,848 4,037 45.78 716 1,005 71.24 2,114 1,071 4,4121975 36 2,371 5,048 46.97 1,057 1,564 67.58 2,770 1,531 5,7991976 32 1,972 4,235 46.56 883 1,304 67.71 2,360 836 1,144 1,312 4,8271977 32 2,046 4,202 48.69 960 1,291 74.36 2,142 944 1,035 185 414 1,247 5,0521978 32 1,986 3,979 49.91 877 1,249 70.22 2,032 993 1,000 181 426 1,261 4,8491979 40 2,430 4,909 49.50 1,193 1,698 70.26 2,581 1,153 1,245 203 505 1,632 6,0531980 48 2,752 5,658 48.64 1,523 2,156 70.64 3,137 1,360 1,567 260 567 2,004 7,0271981 48 2,501 5,189 48.20 1,368 1,914 71.47 2,771 1,251 1,301 207 561 1,848 6,3701982 47 2,398 4,867 49.27 1,365 1,963 69.54 2,568 1,134 1,333 247 543 1,853 6,1611983 51 2,521 5,310 47.48 1,347 1,995 67.52 2,960 1,364 1,333 312 592 1,934 6,3891984 52 2,744 5,635 48.70 1,415 2,066 68.49 3,166 1,557 1,402 279 626 2,000 6,9051985 63 3,154 6,669 47.29 1,717 2,481 69.21 3,708 1,730 1,647 344 767 2,338 8,0251986 63 3,607 7,485 48.19 1,794 2,566 69.91 4,018 1,837 1,645 303 703 2,392 9,0081987 63 3,623 7,421 48.82 594 1,471 40.38 1,899 2,664 71.28 3,893 1,997 1,786 314 834 2,484 9,7391988 63 3,622 7,590 47.72 632 1,711 36.94 1,866 2,633 70.87 3,983 2,061 1,757 306 803 2,364 9,7421989 63 3,750 7,832 47.88 633 1,698 37.28 1,851 2,658 69.64 4,136 1,978 1,732 373 756 2,449 9,9841990 63 3,534 7,838 45.09 650 1,894 34.32 1,828 2,602 70.25 4,374 1,908 1,860 375 895 2,429 9,5461991 63 3,423 7,456 45.91 662 1,785 37.09 1,809 2,593 69.76 4,072 1,958 1,812 440 832 2,317 9,3171992 63 3,407 7,466 45.63 679 1,943 34.95 1,955 2,682 72.89 4,435 1,947 1,824 408 861 2,387 9,4481993 63 3,443 7,548 45.61 726 2,072 35.04 1,751 2,485 70.46 4,490 1,867 1,814 382 934 2,281 9,3631994 64 3,309 7,695 43.00 808 2,363 34.19 1,861 2,681 69.41 4,803 1,871 1,881 419 975 2,367 9,2871995 64 3,333 7,734 43.10 809 2,446 33.07 1,778 2,610 68.12 4,834 1,786 1,824 432 895 2,378 9,2531996 63 3,232 7,458 43.34 812 2,320 35.00 1,638 2,412 67.91 4,621 1,891 1,830 421 948 2,229 8,9141997 63 3,184 7,400 43.03 745 2,282 32.65 1,920 2,739 70.10 4,622 1,723 1,764 396 854 2,449 9,0331998 63 3,308 7,566 43.72 774 2,294 33.74 1,711 2,420 70.70 4,616 1,811 1,724 427 883 2,186 9,1011999 63 3,005 7,174 41.89 814 2,363 34.45 1,731 2,498 69.30 4,556 1,680 1,850 414 938 2,249 8,555
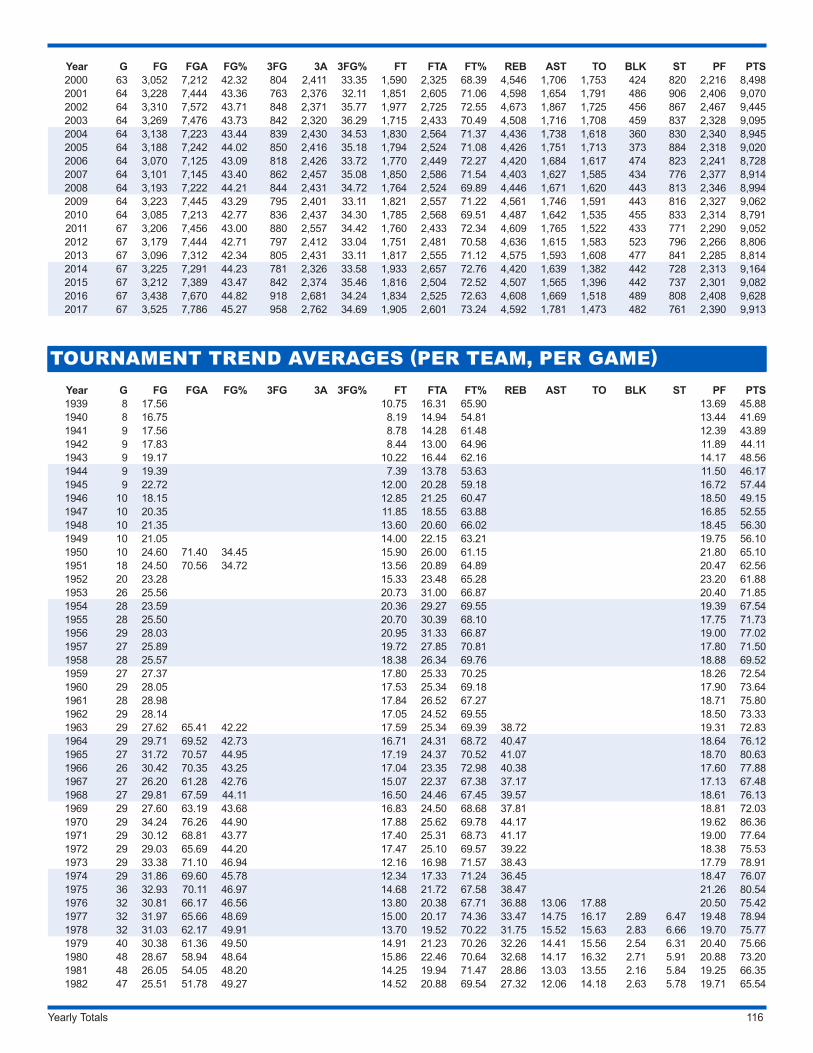
Yearly Totals 116
Year G FG FGA FG% 3FG 3A 3FG% FT FTA FT% REB AST TO BLK ST PF PTS2000 63 3,052 7,212 42.32 804 2,411 33.35 1,590 2,325 68.39 4,546 1,706 1,753 424 820 2,216 8,4982001 64 3,228 7,444 43.36 763 2,376 32.11 1,851 2,605 71.06 4,598 1,654 1,791 486 906 2,406 9,0702002 64 3,310 7,572 43.71 848 2,371 35.77 1,977 2,725 72.55 4,673 1,867 1,725 456 867 2,467 9,4452003 64 3,269 7,476 43.73 842 2,320 36.29 1,715 2,433 70.49 4,508 1,716 1,708 459 837 2,328 9,0952004 64 3,138 7,223 43.44 839 2,430 34.53 1,830 2,564 71.37 4,436 1,738 1,618 360 830 2,340 8,9452005 64 3,188 7,242 44.02 850 2,416 35.18 1,794 2,524 71.08 4,426 1,751 1,713 373 884 2,318 9,0202006 64 3,070 7,125 43.09 818 2,426 33.72 1,770 2,449 72.27 4,420 1,684 1,617 474 823 2,241 8,7282007 64 3,101 7,145 43.40 862 2,457 35.08 1,850 2,586 71.54 4,403 1,627 1,585 434 776 2,377 8,9142008 64 3,193 7,222 44.21 844 2,431 34.72 1,764 2,524 69.89 4,446 1,671 1,620 443 813 2,346 8,9942009 64 3,223 7,445 43.29 795 2,401 33.11 1,821 2,557 71.22 4,561 1,746 1,591 443 816 2,327 9,0622010 64 3,085 7,213 42.77 836 2,437 34.30 1,785 2,568 69.51 4,487 1,642 1,535 455 833 2,314 8,7912011 67 3,206 7,456 43.00 880 2,557 34.42 1,760 2,433 72.34 4,609 1,765 1,522 433 771 2,290 9,0522012 67 3,179 7,444 42.71 797 2,412 33.04 1,751 2,481 70.58 4,636 1,615 1,583 523 796 2,266 8,8062013 67 3,096 7,312 42.34 805 2,431 33.11 1,817 2,555 71.12 4,575 1,593 1,608 477 841 2,285 8,8142014 67 3,225 7,291 44.23 781 2,326 33.58 1,933 2,657 72.76 4,420 1,639 1,382 442 728 2,313 9,1642015 67 3,212 7,389 43.47 842 2,374 35.46 1,816 2,504 72.52 4,507 1,565 1,396 442 737 2,301 9,0822016 67 3,438 7,670 44.82 918 2,681 34.24 1,834 2,525 72.63 4,608 1,669 1,518 489 808 2,408 9,6282017 67 3,525 7,786 45.27 958 2,762 34.69 1,905 2,601 73.24 4,592 1,781 1,473 482 761 2,390 9,913
TOURNAMENT TREND AVERAGES (PER TEAM, PER GAME)Year G FG FGA FG% 3FG 3A 3FG% FT FTA FT% REB AST TO BLK ST PF PTS1939 8 17.56 10.75 16.31 65.90 13.69 45.881940 8 16.75 8.19 14.94 54.81 13.44 41.691941 9 17.56 8.78 14.28 61.48 12.39 43.891942 9 17.83 8.44 13.00 64.96 11.89 44.111943 9 19.17 10.22 16.44 62.16 14.17 48.561944 9 19.39 7.39 13.78 53.63 11.50 46.171945 9 22.72 12.00 20.28 59.18 16.72 57.441946 10 18.15 12.85 21.25 60.47 18.50 49.151947 10 20.35 11.85 18.55 63.88 16.85 52.551948 10 21.35 13.60 20.60 66.02 18.45 56.301949 10 21.05 14.00 22.15 63.21 19.75 56.101950 10 24.60 71.40 34.45 15.90 26.00 61.15 21.80 65.101951 18 24.50 70.56 34.72 13.56 20.89 64.89 20.47 62.561952 20 23.28 15.33 23.48 65.28 23.20 61.881953 26 25.56 20.73 31.00 66.87 20.40 71.851954 28 23.59 20.36 29.27 69.55 19.39 67.541955 28 25.50 20.70 30.39 68.10 17.75 71.731956 29 28.03 20.95 31.33 66.87 19.00 77.021957 27 25.89 19.72 27.85 70.81 17.80 71.501958 28 25.57 18.38 26.34 69.76 18.88 69.521959 27 27.37 17.80 25.33 70.25 18.26 72.541960 29 28.05 17.53 25.34 69.18 17.90 73.641961 28 28.98 17.84 26.52 67.27 18.71 75.801962 29 28.14 17.05 24.52 69.55 18.50 73.331963 29 27.62 65.41 42.22 17.59 25.34 69.39 38.72 19.31 72.831964 29 29.71 69.52 42.73 16.71 24.31 68.72 40.47 18.64 76.121965 27 31.72 70.57 44.95 17.19 24.37 70.52 41.07 18.70 80.631966 26 30.42 70.35 43.25 17.04 23.35 72.98 40.38 17.60 77.881967 27 26.20 61.28 42.76 15.07 22.37 67.38 37.17 17.13 67.481968 27 29.81 67.59 44.11 16.50 24.46 67.45 39.57 18.61 76.131969 29 27.60 63.19 43.68 16.83 24.50 68.68 37.81 18.81 72.031970 29 34.24 76.26 44.90 17.88 25.62 69.78 44.17 19.62 86.361971 29 30.12 68.81 43.77 17.40 25.31 68.73 41.17 19.00 77.641972 29 29.03 65.69 44.20 17.47 25.10 69.57 39.22 18.38 75.531973 29 33.38 71.10 46.94 12.16 16.98 71.57 38.43 17.79 78.911974 29 31.86 69.60 45.78 12.34 17.33 71.24 36.45 18.47 76.071975 36 32.93 70.11 46.97 14.68 21.72 67.58 38.47 21.26 80.541976 32 30.81 66.17 46.56 13.80 20.38 67.71 36.88 13.06 17.88 20.50 75.421977 32 31.97 65.66 48.69 15.00 20.17 74.36 33.47 14.75 16.17 2.89 6.47 19.48 78.941978 32 31.03 62.17 49.91 13.70 19.52 70.22 31.75 15.52 15.63 2.83 6.66 19.70 75.771979 40 30.38 61.36 49.50 14.91 21.23 70.26 32.26 14.41 15.56 2.54 6.31 20.40 75.661980 48 28.67 58.94 48.64 15.86 22.46 70.64 32.68 14.17 16.32 2.71 5.91 20.88 73.201981 48 26.05 54.05 48.20 14.25 19.94 71.47 28.86 13.03 13.55 2.16 5.84 19.25 66.351982 47 25.51 51.78 49.27 14.52 20.88 69.54 27.32 12.06 14.18 2.63 5.78 19.71 65.54
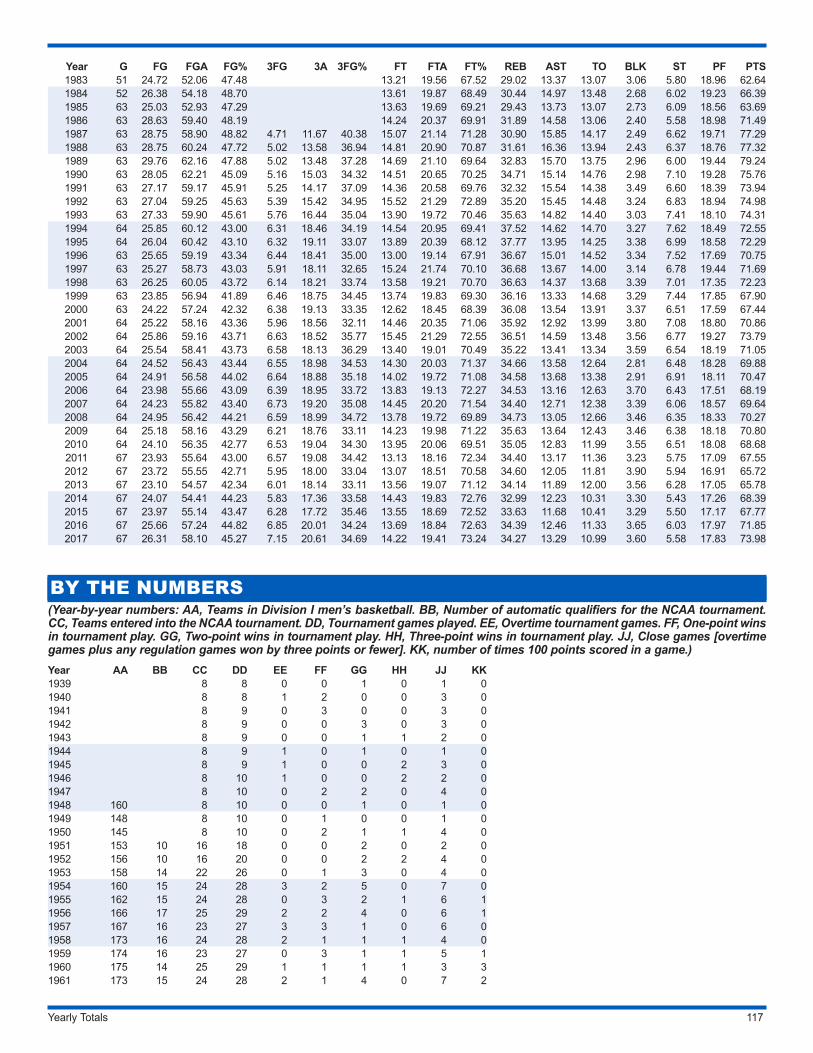
Yearly Totals 117
Year G FG FGA FG% 3FG 3A 3FG% FT FTA FT% REB AST TO BLK ST PF PTS1983 51 24.72 52.06 47.48 13.21 19.56 67.52 29.02 13.37 13.07 3.06 5.80 18.96 62.641984 52 26.38 54.18 48.70 13.61 19.87 68.49 30.44 14.97 13.48 2.68 6.02 19.23 66.391985 63 25.03 52.93 47.29 13.63 19.69 69.21 29.43 13.73 13.07 2.73 6.09 18.56 63.691986 63 28.63 59.40 48.19 14.24 20.37 69.91 31.89 14.58 13.06 2.40 5.58 18.98 71.491987 63 28.75 58.90 48.82 4.71 11.67 40.38 15.07 21.14 71.28 30.90 15.85 14.17 2.49 6.62 19.71 77.291988 63 28.75 60.24 47.72 5.02 13.58 36.94 14.81 20.90 70.87 31.61 16.36 13.94 2.43 6.37 18.76 77.321989 63 29.76 62.16 47.88 5.02 13.48 37.28 14.69 21.10 69.64 32.83 15.70 13.75 2.96 6.00 19.44 79.241990 63 28.05 62.21 45.09 5.16 15.03 34.32 14.51 20.65 70.25 34.71 15.14 14.76 2.98 7.10 19.28 75.761991 63 27.17 59.17 45.91 5.25 14.17 37.09 14.36 20.58 69.76 32.32 15.54 14.38 3.49 6.60 18.39 73.941992 63 27.04 59.25 45.63 5.39 15.42 34.95 15.52 21.29 72.89 35.20 15.45 14.48 3.24 6.83 18.94 74.981993 63 27.33 59.90 45.61 5.76 16.44 35.04 13.90 19.72 70.46 35.63 14.82 14.40 3.03 7.41 18.10 74.311994 64 25.85 60.12 43.00 6.31 18.46 34.19 14.54 20.95 69.41 37.52 14.62 14.70 3.27 7.62 18.49 72.551995 64 26.04 60.42 43.10 6.32 19.11 33.07 13.89 20.39 68.12 37.77 13.95 14.25 3.38 6.99 18.58 72.291996 63 25.65 59.19 43.34 6.44 18.41 35.00 13.00 19.14 67.91 36.67 15.01 14.52 3.34 7.52 17.69 70.751997 63 25.27 58.73 43.03 5.91 18.11 32.65 15.24 21.74 70.10 36.68 13.67 14.00 3.14 6.78 19.44 71.691998 63 26.25 60.05 43.72 6.14 18.21 33.74 13.58 19.21 70.70 36.63 14.37 13.68 3.39 7.01 17.35 72.231999 63 23.85 56.94 41.89 6.46 18.75 34.45 13.74 19.83 69.30 36.16 13.33 14.68 3.29 7.44 17.85 67.902000 63 24.22 57.24 42.32 6.38 19.13 33.35 12.62 18.45 68.39 36.08 13.54 13.91 3.37 6.51 17.59 67.442001 64 25.22 58.16 43.36 5.96 18.56 32.11 14.46 20.35 71.06 35.92 12.92 13.99 3.80 7.08 18.80 70.862002 64 25.86 59.16 43.71 6.63 18.52 35.77 15.45 21.29 72.55 36.51 14.59 13.48 3.56 6.77 19.27 73.792003 64 25.54 58.41 43.73 6.58 18.13 36.29 13.40 19.01 70.49 35.22 13.41 13.34 3.59 6.54 18.19 71.052004 64 24.52 56.43 43.44 6.55 18.98 34.53 14.30 20.03 71.37 34.66 13.58 12.64 2.81 6.48 18.28 69.882005 64 24.91 56.58 44.02 6.64 18.88 35.18 14.02 19.72 71.08 34.58 13.68 13.38 2.91 6.91 18.11 70.472006 64 23.98 55.66 43.09 6.39 18.95 33.72 13.83 19.13 72.27 34.53 13.16 12.63 3.70 6.43 17.51 68.192007 64 24.23 55.82 43.40 6.73 19.20 35.08 14.45 20.20 71.54 34.40 12.71 12.38 3.39 6.06 18.57 69.642008 64 24.95 56.42 44.21 6.59 18.99 34.72 13.78 19.72 69.89 34.73 13.05 12.66 3.46 6.35 18.33 70.272009 64 25.18 58.16 43.29 6.21 18.76 33.11 14.23 19.98 71.22 35.63 13.64 12.43 3.46 6.38 18.18 70.802010 64 24.10 56.35 42.77 6.53 19.04 34.30 13.95 20.06 69.51 35.05 12.83 11.99 3.55 6.51 18.08 68.682011 67 23.93 55.64 43.00 6.57 19.08 34.42 13.13 18.16 72.34 34.40 13.17 11.36 3.23 5.75 17.09 67.552012 67 23.72 55.55 42.71 5.95 18.00 33.04 13.07 18.51 70.58 34.60 12.05 11.81 3.90 5.94 16.91 65.722013 67 23.10 54.57 42.34 6.01 18.14 33.11 13.56 19.07 71.12 34.14 11.89 12.00 3.56 6.28 17.05 65.782014 67 24.07 54.41 44.23 5.83 17.36 33.58 14.43 19.83 72.76 32.99 12.23 10.31 3.30 5.43 17.26 68.392015 67 23.97 55.14 43.47 6.28 17.72 35.46 13.55 18.69 72.52 33.63 11.68 10.41 3.29 5.50 17.17 67.772016 67 25.66 57.24 44.82 6.85 20.01 34.24 13.69 18.84 72.63 34.39 12.46 11.33 3.65 6.03 17.97 71.852017 67 26.31 58.10 45.27 7.15 20.61 34.69 14.22 19.41 73.24 34.27 13.29 10.99 3.60 5.58 17.83 73.98
BY THE NUMBERS(Year-by-year numbers: AA, Teams in Division I men’s basketball. BB, Number of automatic qualifiers for the NCAA tournament. CC, Teams entered into the NCAA tournament. DD, Tournament games played. EE, Overtime tournament games. FF, One-point wins in tournament play. GG, Two-point wins in tournament play. HH, Three-point wins in tournament play. JJ, Close games [overtime games plus any regulation games won by three points or fewer]. KK, number of times 100 points scored in a game.)Year AA BB CC DD EE FF GG HH JJ KK1939 8 8 0 0 1 0 1 01940 8 8 1 2 0 0 3 01941 8 9 0 3 0 0 3 01942 8 9 0 0 3 0 3 01943 8 9 0 0 1 1 2 01944 8 9 1 0 1 0 1 01945 8 9 1 0 0 2 3 01946 8 10 1 0 0 2 2 01947 8 10 0 2 2 0 4 01948 160 8 10 0 0 1 0 1 01949 148 8 10 0 1 0 0 1 01950 145 8 10 0 2 1 1 4 01951 153 10 16 18 0 0 2 0 2 01952 156 10 16 20 0 0 2 2 4 01953 158 14 22 26 0 1 3 0 4 01954 160 15 24 28 3 2 5 0 7 01955 162 15 24 28 0 3 2 1 6 11956 166 17 25 29 2 2 4 0 6 11957 167 16 23 27 3 3 1 0 6 01958 173 16 24 28 2 1 1 1 4 01959 174 16 23 27 0 3 1 1 5 11960 175 14 25 29 1 1 1 1 3 31961 173 15 24 28 2 1 4 0 7 2
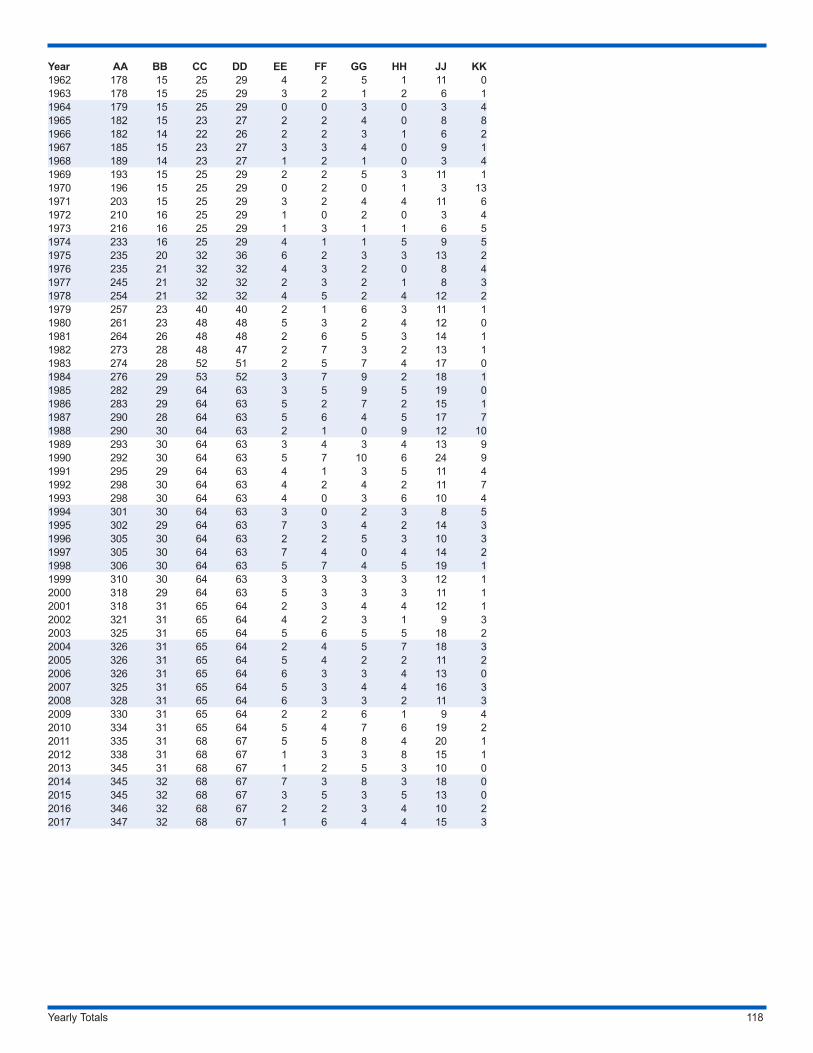
Yearly Totals 118
Year AA BB CC DD EE FF GG HH JJ KK1962 178 15 25 29 4 2 5 1 11 01963 178 15 25 29 3 2 1 2 6 11964 179 15 25 29 0 0 3 0 3 41965 182 15 23 27 2 2 4 0 8 81966 182 14 22 26 2 2 3 1 6 21967 185 15 23 27 3 3 4 0 9 11968 189 14 23 27 1 2 1 0 3 41969 193 15 25 29 2 2 5 3 11 11970 196 15 25 29 0 2 0 1 3 131971 203 15 25 29 3 2 4 4 11 61972 210 16 25 29 1 0 2 0 3 41973 216 16 25 29 1 3 1 1 6 51974 233 16 25 29 4 1 1 5 9 51975 235 20 32 36 6 2 3 3 13 21976 235 21 32 32 4 3 2 0 8 41977 245 21 32 32 2 3 2 1 8 31978 254 21 32 32 4 5 2 4 12 21979 257 23 40 40 2 1 6 3 11 11980 261 23 48 48 5 3 2 4 12 01981 264 26 48 48 2 6 5 3 14 11982 273 28 48 47 2 7 3 2 13 11983 274 28 52 51 2 5 7 4 17 01984 276 29 53 52 3 7 9 2 18 11985 282 29 64 63 3 5 9 5 19 01986 283 29 64 63 5 2 7 2 15 11987 290 28 64 63 5 6 4 5 17 71988 290 30 64 63 2 1 0 9 12 101989 293 30 64 63 3 4 3 4 13 91990 292 30 64 63 5 7 10 6 24 91991 295 29 64 63 4 1 3 5 11 41992 298 30 64 63 4 2 4 2 11 71993 298 30 64 63 4 0 3 6 10 41994 301 30 64 63 3 0 2 3 8 51995 302 29 64 63 7 3 4 2 14 31996 305 30 64 63 2 2 5 3 10 31997 305 30 64 63 7 4 0 4 14 21998 306 30 64 63 5 7 4 5 19 11999 310 30 64 63 3 3 3 3 12 12000 318 29 64 63 5 3 3 3 11 12001 318 31 65 64 2 3 4 4 12 12002 321 31 65 64 4 2 3 1 9 32003 325 31 65 64 5 6 5 5 18 22004 326 31 65 64 2 4 5 7 18 32005 326 31 65 64 5 4 2 2 11 22006 326 31 65 64 6 3 3 4 13 02007 325 31 65 64 5 3 4 4 16 32008 328 31 65 64 6 3 3 2 11 32009 330 31 65 64 2 2 6 1 9 42010 334 31 65 64 5 4 7 6 19 22011 335 31 68 67 5 5 8 4 20 12012 338 31 68 67 1 3 3 8 15 12013 345 31 68 67 1 2 5 3 10 02014 345 32 68 67 7 3 8 3 18 02015 345 32 68 67 3 5 3 5 13 02016 346 32 68 67 2 2 3 4 10 22017 347 32 68 67 1 6 4 4 15 3
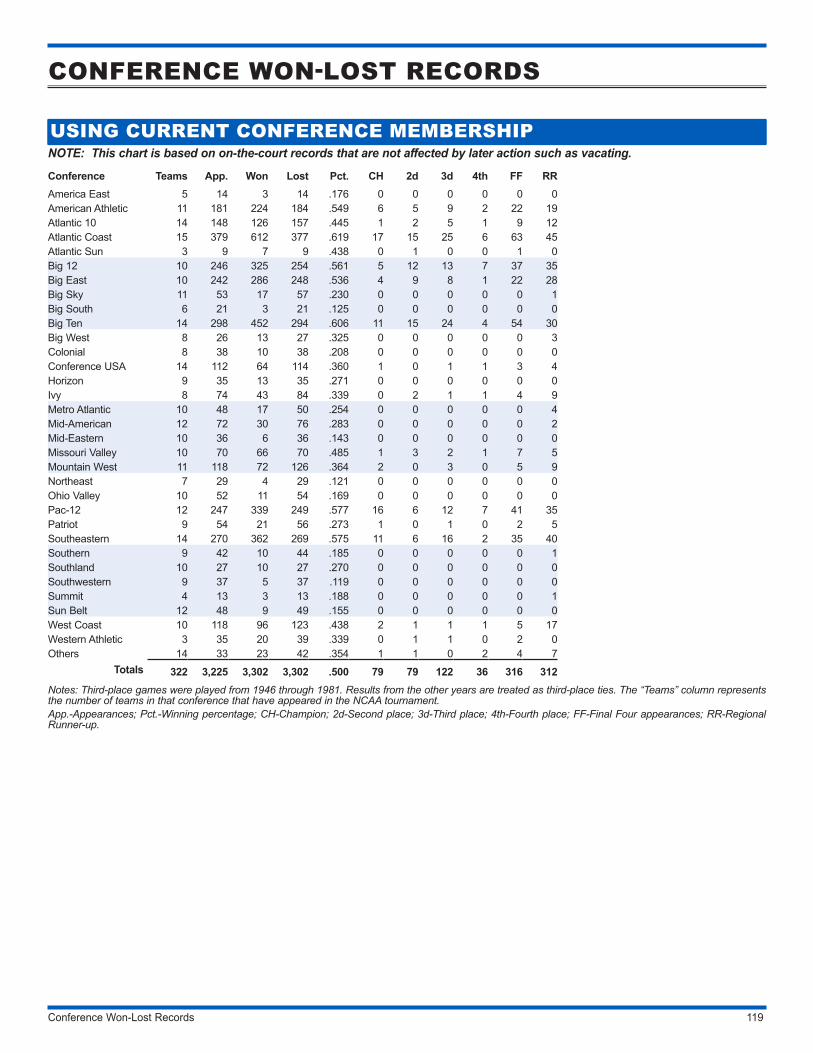
Conference Won-Lost Records 119
CONFERENCE WON-LOST RECORDS
USING CURRENT CONFERENCE MEMBERSHIPNOTE: This chart is based on on-the-court records that are not affected by later action such as vacating.
Conference Teams App. Won Lost Pct. CH 2d 3d 4th FF RRAmerica East 5 14 3 14 .176 0 0 0 0 0 0American Athletic 11 181 224 184 .549 6 5 9 2 22 19Atlantic 10 14 148 126 157 .445 1 2 5 1 9 12Atlantic Coast 15 379 612 377 .619 17 15 25 6 63 45Atlantic Sun 3 9 7 9 .438 0 1 0 0 1 0Big 12 10 246 325 254 .561 5 12 13 7 37 35Big East 10 242 286 248 .536 4 9 8 1 22 28Big Sky 11 53 17 57 .230 0 0 0 0 0 1Big South 6 21 3 21 .125 0 0 0 0 0 0Big Ten 14 298 452 294 .606 11 15 24 4 54 30Big West 8 26 13 27 .325 0 0 0 0 0 3Colonial 8 38 10 38 .208 0 0 0 0 0 0Conference USA 14 112 64 114 .360 1 0 1 1 3 4Horizon 9 35 13 35 .271 0 0 0 0 0 0Ivy 8 74 43 84 .339 0 2 1 1 4 9Metro Atlantic 10 48 17 50 .254 0 0 0 0 0 4Mid-American 12 72 30 76 .283 0 0 0 0 0 2Mid-Eastern 10 36 6 36 .143 0 0 0 0 0 0Missouri Valley 10 70 66 70 .485 1 3 2 1 7 5Mountain West 11 118 72 126 .364 2 0 3 0 5 9Northeast 7 29 4 29 .121 0 0 0 0 0 0Ohio Valley 10 52 11 54 .169 0 0 0 0 0 0Pac-12 12 247 339 249 .577 16 6 12 7 41 35Patriot 9 54 21 56 .273 1 0 1 0 2 5Southeastern 14 270 362 269 .575 11 6 16 2 35 40Southern 9 42 10 44 .185 0 0 0 0 0 1Southland 10 27 10 27 .270 0 0 0 0 0 0Southwestern 9 37 5 37 .119 0 0 0 0 0 0Summit 4 13 3 13 .188 0 0 0 0 0 1Sun Belt 12 48 9 49 .155 0 0 0 0 0 0West Coast 10 118 96 123 .438 2 1 1 1 5 17Western Athletic 3 35 20 39 .339 0 1 1 0 2 0Others 14 33 23 42 .354 1 1 0 2 4 7
Totals 322 3,225 3,302 3,302 .500 79 79 122 36 316 312Notes: Third-place games were played from 1946 through 1981. Results from the other years are treated as third-place ties. The “Teams” column represents the number of teams in that conference that have appeared in the NCAA tournament. App.-Appearances; Pct.-Winning percentage; CH-Champion; 2d-Second place; 3d-Third place; 4th-Fourth place; FF-Final Four appearances; RR-Regional Runner-up.
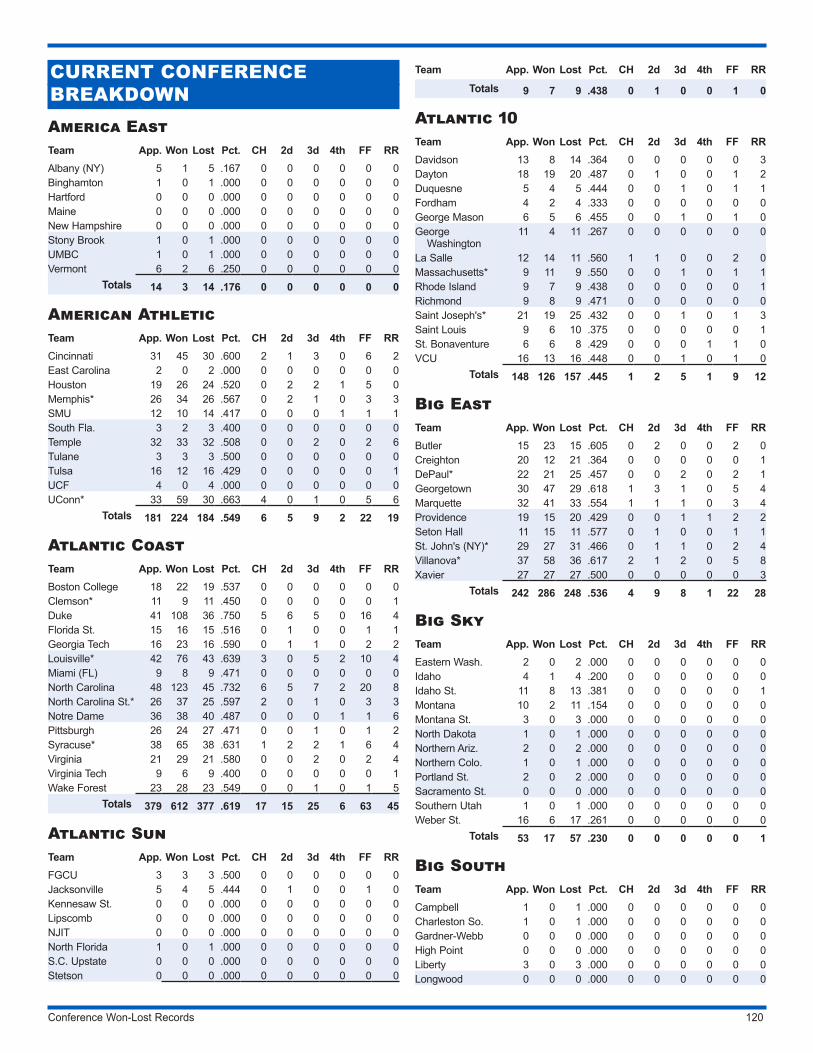
Conference Won-Lost Records 120
CURRENT CONFERENCE BREAKDOWNAmerica EastTeam App. Won Lost Pct. CH 2d 3d 4th FF RRAlbany (NY) 5 1 5 .167 0 0 0 0 0 0Binghamton 1 0 1 .000 0 0 0 0 0 0Hartford 0 0 0 .000 0 0 0 0 0 0Maine 0 0 0 .000 0 0 0 0 0 0New Hampshire 0 0 0 .000 0 0 0 0 0 0Stony Brook 1 0 1 .000 0 0 0 0 0 0UMBC 1 0 1 .000 0 0 0 0 0 0Vermont 6 2 6 .250 0 0 0 0 0 0
Totals 14 3 14 .176 0 0 0 0 0 0
American AthleticTeam App. Won Lost Pct. CH 2d 3d 4th FF RRCincinnati 31 45 30 .600 2 1 3 0 6 2East Carolina 2 0 2 .000 0 0 0 0 0 0Houston 19 26 24 .520 0 2 2 1 5 0Memphis* 26 34 26 .567 0 2 1 0 3 3SMU 12 10 14 .417 0 0 0 1 1 1South Fla. 3 2 3 .400 0 0 0 0 0 0Temple 32 33 32 .508 0 0 2 0 2 6Tulane 3 3 3 .500 0 0 0 0 0 0Tulsa 16 12 16 .429 0 0 0 0 0 1UCF 4 0 4 .000 0 0 0 0 0 0UConn* 33 59 30 .663 4 0 1 0 5 6
Totals 181 224 184 .549 6 5 9 2 22 19
Atlantic CoastTeam App. Won Lost Pct. CH 2d 3d 4th FF RRBoston College 18 22 19 .537 0 0 0 0 0 0Clemson* 11 9 11 .450 0 0 0 0 0 1Duke 41 108 36 .750 5 6 5 0 16 4Florida St. 15 16 15 .516 0 1 0 0 1 1Georgia Tech 16 23 16 .590 0 1 1 0 2 2Louisville* 42 76 43 .639 3 0 5 2 10 4Miami (FL) 9 8 9 .471 0 0 0 0 0 0North Carolina 48 123 45 .732 6 5 7 2 20 8North Carolina St.* 26 37 25 .597 2 0 1 0 3 3Notre Dame 36 38 40 .487 0 0 0 1 1 6Pittsburgh 26 24 27 .471 0 0 1 0 1 2Syracuse* 38 65 38 .631 1 2 2 1 6 4Virginia 21 29 21 .580 0 0 2 0 2 4Virginia Tech 9 6 9 .400 0 0 0 0 0 1Wake Forest 23 28 23 .549 0 0 1 0 1 5
Totals 379 612 377 .619 17 15 25 6 63 45
Atlantic SunTeam App. Won Lost Pct. CH 2d 3d 4th FF RRFGCU 3 3 3 .500 0 0 0 0 0 0Jacksonville 5 4 5 .444 0 1 0 0 1 0Kennesaw St. 0 0 0 .000 0 0 0 0 0 0Lipscomb 0 0 0 .000 0 0 0 0 0 0NJIT 0 0 0 .000 0 0 0 0 0 0North Florida 1 0 1 .000 0 0 0 0 0 0S.C. Upstate 0 0 0 .000 0 0 0 0 0 0Stetson 0 0 0 .000 0 0 0 0 0 0
Team App. Won Lost Pct. CH 2d 3d 4th FF RRTotals 9 7 9 .438 0 1 0 0 1 0
Atlantic 10Team App. Won Lost Pct. CH 2d 3d 4th FF RRDavidson 13 8 14 .364 0 0 0 0 0 3Dayton 18 19 20 .487 0 1 0 0 1 2Duquesne 5 4 5 .444 0 0 1 0 1 1Fordham 4 2 4 .333 0 0 0 0 0 0George Mason 6 5 6 .455 0 0 1 0 1 0George
Washington11 4 11 .267 0 0 0 0 0 0
La Salle 12 14 11 .560 1 1 0 0 2 0Massachusetts* 9 11 9 .550 0 0 1 0 1 1Rhode Island 9 7 9 .438 0 0 0 0 0 1Richmond 9 8 9 .471 0 0 0 0 0 0Saint Joseph's* 21 19 25 .432 0 0 1 0 1 3Saint Louis 9 6 10 .375 0 0 0 0 0 1St. Bonaventure 6 6 8 .429 0 0 0 1 1 0VCU 16 13 16 .448 0 0 1 0 1 0
Totals 148 126 157 .445 1 2 5 1 9 12
Big EastTeam App. Won Lost Pct. CH 2d 3d 4th FF RRButler 15 23 15 .605 0 2 0 0 2 0Creighton 20 12 21 .364 0 0 0 0 0 1DePaul* 22 21 25 .457 0 0 2 0 2 1Georgetown 30 47 29 .618 1 3 1 0 5 4Marquette 32 41 33 .554 1 1 1 0 3 4Providence 19 15 20 .429 0 0 1 1 2 2Seton Hall 11 15 11 .577 0 1 0 0 1 1St. John's (NY)* 29 27 31 .466 0 1 1 0 2 4Villanova* 37 58 36 .617 2 1 2 0 5 8Xavier 27 27 27 .500 0 0 0 0 0 3
Totals 242 286 248 .536 4 9 8 1 22 28
Big SkyTeam App. Won Lost Pct. CH 2d 3d 4th FF RREastern Wash. 2 0 2 .000 0 0 0 0 0 0Idaho 4 1 4 .200 0 0 0 0 0 0Idaho St. 11 8 13 .381 0 0 0 0 0 1Montana 10 2 11 .154 0 0 0 0 0 0Montana St. 3 0 3 .000 0 0 0 0 0 0North Dakota 1 0 1 .000 0 0 0 0 0 0Northern Ariz. 2 0 2 .000 0 0 0 0 0 0Northern Colo. 1 0 1 .000 0 0 0 0 0 0Portland St. 2 0 2 .000 0 0 0 0 0 0Sacramento St. 0 0 0 .000 0 0 0 0 0 0Southern Utah 1 0 1 .000 0 0 0 0 0 0Weber St. 16 6 17 .261 0 0 0 0 0 0
Totals 53 17 57 .230 0 0 0 0 0 1
Big SouthTeam App. Won Lost Pct. CH 2d 3d 4th FF RRCampbell 1 0 1 .000 0 0 0 0 0 0Charleston So. 1 0 1 .000 0 0 0 0 0 0Gardner-Webb 0 0 0 .000 0 0 0 0 0 0High Point 0 0 0 .000 0 0 0 0 0 0Liberty 3 0 3 .000 0 0 0 0 0 0Longwood 0 0 0 .000 0 0 0 0 0 0
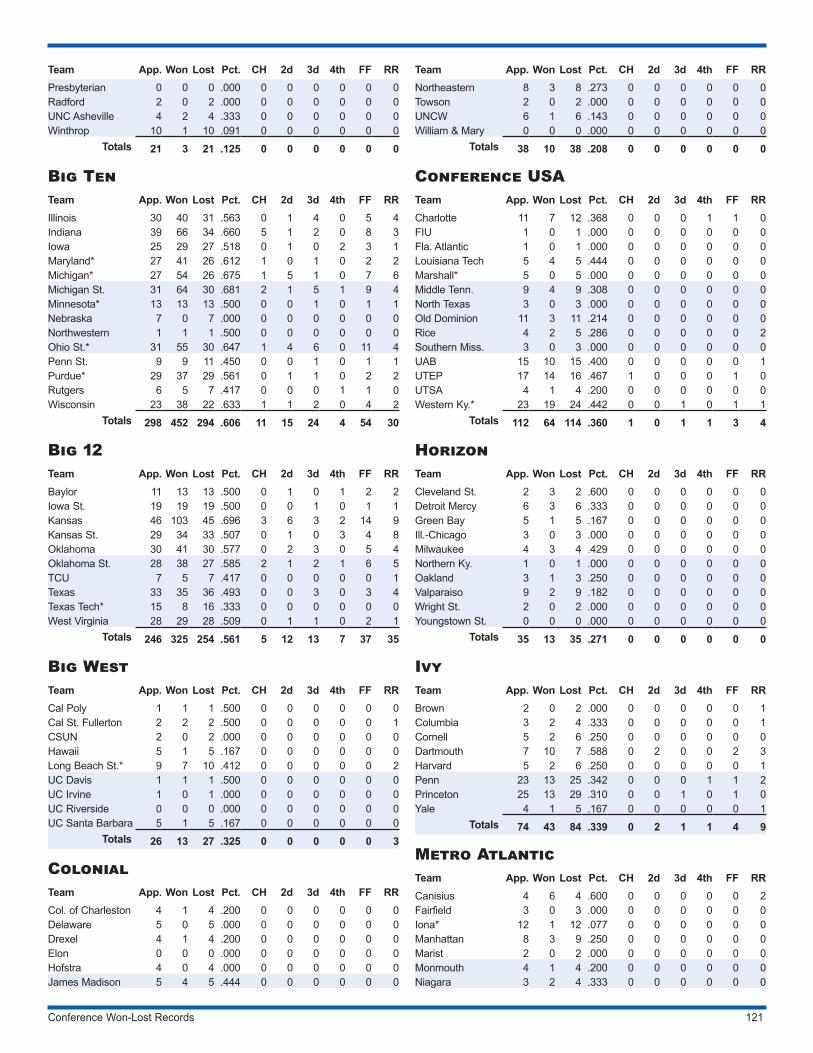
Conference Won-Lost Records 121
Team App. Won Lost Pct. CH 2d 3d 4th FF RRPresbyterian 0 0 0 .000 0 0 0 0 0 0Radford 2 0 2 .000 0 0 0 0 0 0UNC Asheville 4 2 4 .333 0 0 0 0 0 0Winthrop 10 1 10 .091 0 0 0 0 0 0
Totals 21 3 21 .125 0 0 0 0 0 0
Big TenTeam App. Won Lost Pct. CH 2d 3d 4th FF RRIllinois 30 40 31 .563 0 1 4 0 5 4Indiana 39 66 34 .660 5 1 2 0 8 3Iowa 25 29 27 .518 0 1 0 2 3 1Maryland* 27 41 26 .612 1 0 1 0 2 2Michigan* 27 54 26 .675 1 5 1 0 7 6Michigan St. 31 64 30 .681 2 1 5 1 9 4Minnesota* 13 13 13 .500 0 0 1 0 1 1Nebraska 7 0 7 .000 0 0 0 0 0 0Northwestern 1 1 1 .500 0 0 0 0 0 0Ohio St.* 31 55 30 .647 1 4 6 0 11 4Penn St. 9 9 11 .450 0 0 1 0 1 1Purdue* 29 37 29 .561 0 1 1 0 2 2Rutgers 6 5 7 .417 0 0 0 1 1 0Wisconsin 23 38 22 .633 1 1 2 0 4 2
Totals 298 452 294 .606 11 15 24 4 54 30
Big 12Team App. Won Lost Pct. CH 2d 3d 4th FF RRBaylor 11 13 13 .500 0 1 0 1 2 2Iowa St. 19 19 19 .500 0 0 1 0 1 1Kansas 46 103 45 .696 3 6 3 2 14 9Kansas St. 29 34 33 .507 0 1 0 3 4 8Oklahoma 30 41 30 .577 0 2 3 0 5 4Oklahoma St. 28 38 27 .585 2 1 2 1 6 5TCU 7 5 7 .417 0 0 0 0 0 1Texas 33 35 36 .493 0 0 3 0 3 4Texas Tech* 15 8 16 .333 0 0 0 0 0 0West Virginia 28 29 28 .509 0 1 1 0 2 1
Totals 246 325 254 .561 5 12 13 7 37 35
Big WestTeam App. Won Lost Pct. CH 2d 3d 4th FF RRCal Poly 1 1 1 .500 0 0 0 0 0 0Cal St. Fullerton 2 2 2 .500 0 0 0 0 0 1CSUN 2 0 2 .000 0 0 0 0 0 0Hawaii 5 1 5 .167 0 0 0 0 0 0Long Beach St.* 9 7 10 .412 0 0 0 0 0 2UC Davis 1 1 1 .500 0 0 0 0 0 0UC Irvine 1 0 1 .000 0 0 0 0 0 0UC Riverside 0 0 0 .000 0 0 0 0 0 0UC Santa Barbara 5 1 5 .167 0 0 0 0 0 0
Totals 26 13 27 .325 0 0 0 0 0 3
ColonialTeam App. Won Lost Pct. CH 2d 3d 4th FF RRCol. of Charleston 4 1 4 .200 0 0 0 0 0 0Delaware 5 0 5 .000 0 0 0 0 0 0Drexel 4 1 4 .200 0 0 0 0 0 0Elon 0 0 0 .000 0 0 0 0 0 0Hofstra 4 0 4 .000 0 0 0 0 0 0James Madison 5 4 5 .444 0 0 0 0 0 0
Team App. Won Lost Pct. CH 2d 3d 4th FF RRNortheastern 8 3 8 .273 0 0 0 0 0 0Towson 2 0 2 .000 0 0 0 0 0 0UNCW 6 1 6 .143 0 0 0 0 0 0William & Mary 0 0 0 .000 0 0 0 0 0 0
Totals 38 10 38 .208 0 0 0 0 0 0
Conference USATeam App. Won Lost Pct. CH 2d 3d 4th FF RRCharlotte 11 7 12 .368 0 0 0 1 1 0FIU 1 0 1 .000 0 0 0 0 0 0Fla. Atlantic 1 0 1 .000 0 0 0 0 0 0Louisiana Tech 5 4 5 .444 0 0 0 0 0 0Marshall* 5 0 5 .000 0 0 0 0 0 0Middle Tenn. 9 4 9 .308 0 0 0 0 0 0North Texas 3 0 3 .000 0 0 0 0 0 0Old Dominion 11 3 11 .214 0 0 0 0 0 0Rice 4 2 5 .286 0 0 0 0 0 2Southern Miss. 3 0 3 .000 0 0 0 0 0 0UAB 15 10 15 .400 0 0 0 0 0 1UTEP 17 14 16 .467 1 0 0 0 1 0UTSA 4 1 4 .200 0 0 0 0 0 0Western Ky.* 23 19 24 .442 0 0 1 0 1 1
Totals 112 64 114 .360 1 0 1 1 3 4
HorizonTeam App. Won Lost Pct. CH 2d 3d 4th FF RRCleveland St. 2 3 2 .600 0 0 0 0 0 0Detroit Mercy 6 3 6 .333 0 0 0 0 0 0Green Bay 5 1 5 .167 0 0 0 0 0 0Ill.-Chicago 3 0 3 .000 0 0 0 0 0 0Milwaukee 4 3 4 .429 0 0 0 0 0 0Northern Ky. 1 0 1 .000 0 0 0 0 0 0Oakland 3 1 3 .250 0 0 0 0 0 0Valparaiso 9 2 9 .182 0 0 0 0 0 0Wright St. 2 0 2 .000 0 0 0 0 0 0Youngstown St. 0 0 0 .000 0 0 0 0 0 0
Totals 35 13 35 .271 0 0 0 0 0 0
IvyTeam App. Won Lost Pct. CH 2d 3d 4th FF RRBrown 2 0 2 .000 0 0 0 0 0 1Columbia 3 2 4 .333 0 0 0 0 0 1Cornell 5 2 6 .250 0 0 0 0 0 0Dartmouth 7 10 7 .588 0 2 0 0 2 3Harvard 5 2 6 .250 0 0 0 0 0 1Penn 23 13 25 .342 0 0 0 1 1 2Princeton 25 13 29 .310 0 0 1 0 1 0Yale 4 1 5 .167 0 0 0 0 0 1
Totals 74 43 84 .339 0 2 1 1 4 9
Metro AtlanticTeam App. Won Lost Pct. CH 2d 3d 4th FF RRCanisius 4 6 4 .600 0 0 0 0 0 2Fairfield 3 0 3 .000 0 0 0 0 0 0Iona* 12 1 12 .077 0 0 0 0 0 0Manhattan 8 3 9 .250 0 0 0 0 0 0Marist 2 0 2 .000 0 0 0 0 0 0Monmouth 4 1 4 .200 0 0 0 0 0 0Niagara 3 2 4 .333 0 0 0 0 0 0
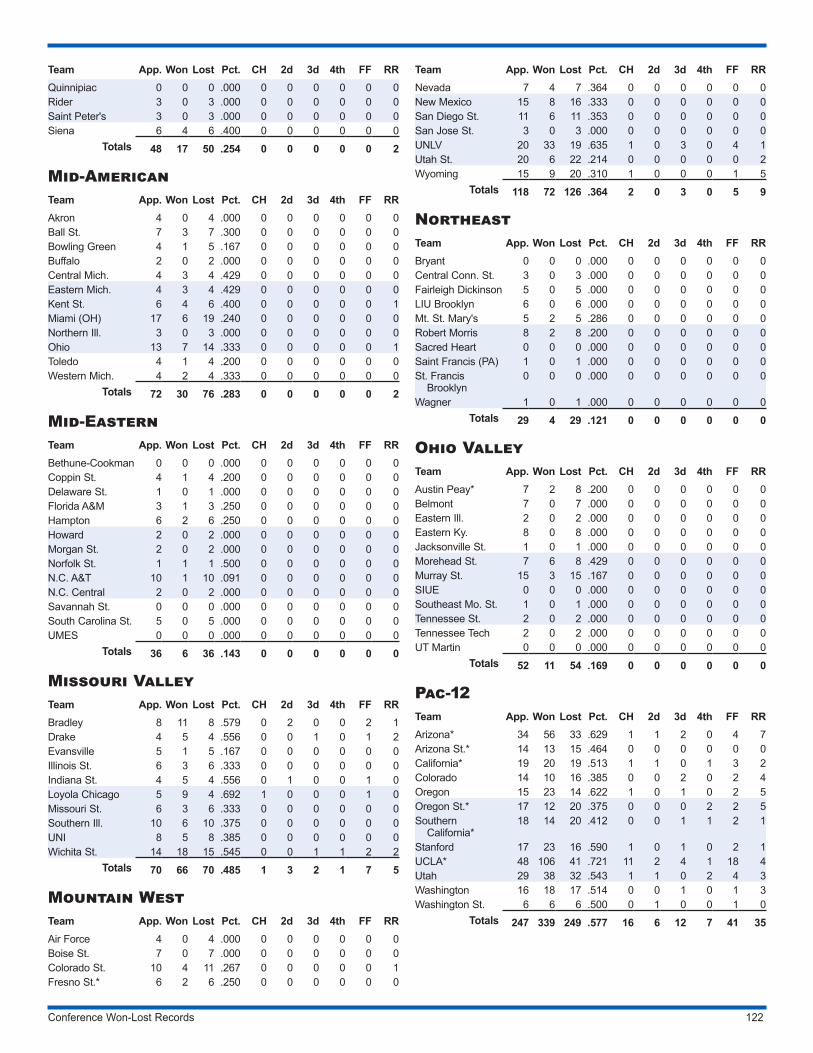
Conference Won-Lost Records 122
Team App. Won Lost Pct. CH 2d 3d 4th FF RRQuinnipiac 0 0 0 .000 0 0 0 0 0 0Rider 3 0 3 .000 0 0 0 0 0 0Saint Peter's 3 0 3 .000 0 0 0 0 0 0Siena 6 4 6 .400 0 0 0 0 0 0
Totals 48 17 50 .254 0 0 0 0 0 2
Mid-AmericanTeam App. Won Lost Pct. CH 2d 3d 4th FF RRAkron 4 0 4 .000 0 0 0 0 0 0Ball St. 7 3 7 .300 0 0 0 0 0 0Bowling Green 4 1 5 .167 0 0 0 0 0 0Buffalo 2 0 2 .000 0 0 0 0 0 0Central Mich. 4 3 4 .429 0 0 0 0 0 0Eastern Mich. 4 3 4 .429 0 0 0 0 0 0Kent St. 6 4 6 .400 0 0 0 0 0 1Miami (OH) 17 6 19 .240 0 0 0 0 0 0Northern Ill. 3 0 3 .000 0 0 0 0 0 0Ohio 13 7 14 .333 0 0 0 0 0 1Toledo 4 1 4 .200 0 0 0 0 0 0Western Mich. 4 2 4 .333 0 0 0 0 0 0
Totals 72 30 76 .283 0 0 0 0 0 2
Mid-EasternTeam App. Won Lost Pct. CH 2d 3d 4th FF RRBethune-Cookman 0 0 0 .000 0 0 0 0 0 0Coppin St. 4 1 4 .200 0 0 0 0 0 0Delaware St. 1 0 1 .000 0 0 0 0 0 0Florida A&M 3 1 3 .250 0 0 0 0 0 0Hampton 6 2 6 .250 0 0 0 0 0 0Howard 2 0 2 .000 0 0 0 0 0 0Morgan St. 2 0 2 .000 0 0 0 0 0 0Norfolk St. 1 1 1 .500 0 0 0 0 0 0N.C. A&T 10 1 10 .091 0 0 0 0 0 0N.C. Central 2 0 2 .000 0 0 0 0 0 0Savannah St. 0 0 0 .000 0 0 0 0 0 0South Carolina St. 5 0 5 .000 0 0 0 0 0 0UMES 0 0 0 .000 0 0 0 0 0 0
Totals 36 6 36 .143 0 0 0 0 0 0
Missouri ValleyTeam App. Won Lost Pct. CH 2d 3d 4th FF RRBradley 8 11 8 .579 0 2 0 0 2 1Drake 4 5 4 .556 0 0 1 0 1 2Evansville 5 1 5 .167 0 0 0 0 0 0Illinois St. 6 3 6 .333 0 0 0 0 0 0Indiana St. 4 5 4 .556 0 1 0 0 1 0Loyola Chicago 5 9 4 .692 1 0 0 0 1 0Missouri St. 6 3 6 .333 0 0 0 0 0 0Southern Ill. 10 6 10 .375 0 0 0 0 0 0UNI 8 5 8 .385 0 0 0 0 0 0Wichita St. 14 18 15 .545 0 0 1 1 2 2
Totals 70 66 70 .485 1 3 2 1 7 5
Mountain WestTeam App. Won Lost Pct. CH 2d 3d 4th FF RRAir Force 4 0 4 .000 0 0 0 0 0 0Boise St. 7 0 7 .000 0 0 0 0 0 0Colorado St. 10 4 11 .267 0 0 0 0 0 1Fresno St.* 6 2 6 .250 0 0 0 0 0 0
Team App. Won Lost Pct. CH 2d 3d 4th FF RRNevada 7 4 7 .364 0 0 0 0 0 0New Mexico 15 8 16 .333 0 0 0 0 0 0San Diego St. 11 6 11 .353 0 0 0 0 0 0San Jose St. 3 0 3 .000 0 0 0 0 0 0UNLV 20 33 19 .635 1 0 3 0 4 1Utah St. 20 6 22 .214 0 0 0 0 0 2Wyoming 15 9 20 .310 1 0 0 0 1 5
Totals 118 72 126 .364 2 0 3 0 5 9
NortheastTeam App. Won Lost Pct. CH 2d 3d 4th FF RRBryant 0 0 0 .000 0 0 0 0 0 0Central Conn. St. 3 0 3 .000 0 0 0 0 0 0Fairleigh Dickinson 5 0 5 .000 0 0 0 0 0 0LIU Brooklyn 6 0 6 .000 0 0 0 0 0 0Mt. St. Mary's 5 2 5 .286 0 0 0 0 0 0Robert Morris 8 2 8 .200 0 0 0 0 0 0Sacred Heart 0 0 0 .000 0 0 0 0 0 0Saint Francis (PA) 1 0 1 .000 0 0 0 0 0 0St. Francis
Brooklyn0 0 0 .000 0 0 0 0 0 0
Wagner 1 0 1 .000 0 0 0 0 0 0Totals 29 4 29 .121 0 0 0 0 0 0
Ohio ValleyTeam App. Won Lost Pct. CH 2d 3d 4th FF RRAustin Peay* 7 2 8 .200 0 0 0 0 0 0Belmont 7 0 7 .000 0 0 0 0 0 0Eastern Ill. 2 0 2 .000 0 0 0 0 0 0Eastern Ky. 8 0 8 .000 0 0 0 0 0 0Jacksonville St. 1 0 1 .000 0 0 0 0 0 0Morehead St. 7 6 8 .429 0 0 0 0 0 0Murray St. 15 3 15 .167 0 0 0 0 0 0SIUE 0 0 0 .000 0 0 0 0 0 0Southeast Mo. St. 1 0 1 .000 0 0 0 0 0 0Tennessee St. 2 0 2 .000 0 0 0 0 0 0Tennessee Tech 2 0 2 .000 0 0 0 0 0 0UT Martin 0 0 0 .000 0 0 0 0 0 0
Totals 52 11 54 .169 0 0 0 0 0 0
Pac-12Team App. Won Lost Pct. CH 2d 3d 4th FF RRArizona* 34 56 33 .629 1 1 2 0 4 7Arizona St.* 14 13 15 .464 0 0 0 0 0 0California* 19 20 19 .513 1 1 0 1 3 2Colorado 14 10 16 .385 0 0 2 0 2 4Oregon 15 23 14 .622 1 0 1 0 2 5Oregon St.* 17 12 20 .375 0 0 0 2 2 5Southern
California*18 14 20 .412 0 0 1 1 2 1
Stanford 17 23 16 .590 1 0 1 0 2 1UCLA* 48 106 41 .721 11 2 4 1 18 4Utah 29 38 32 .543 1 1 0 2 4 3Washington 16 18 17 .514 0 0 1 0 1 3Washington St. 6 6 6 .500 0 1 0 0 1 0
Totals 247 339 249 .577 16 6 12 7 41 35
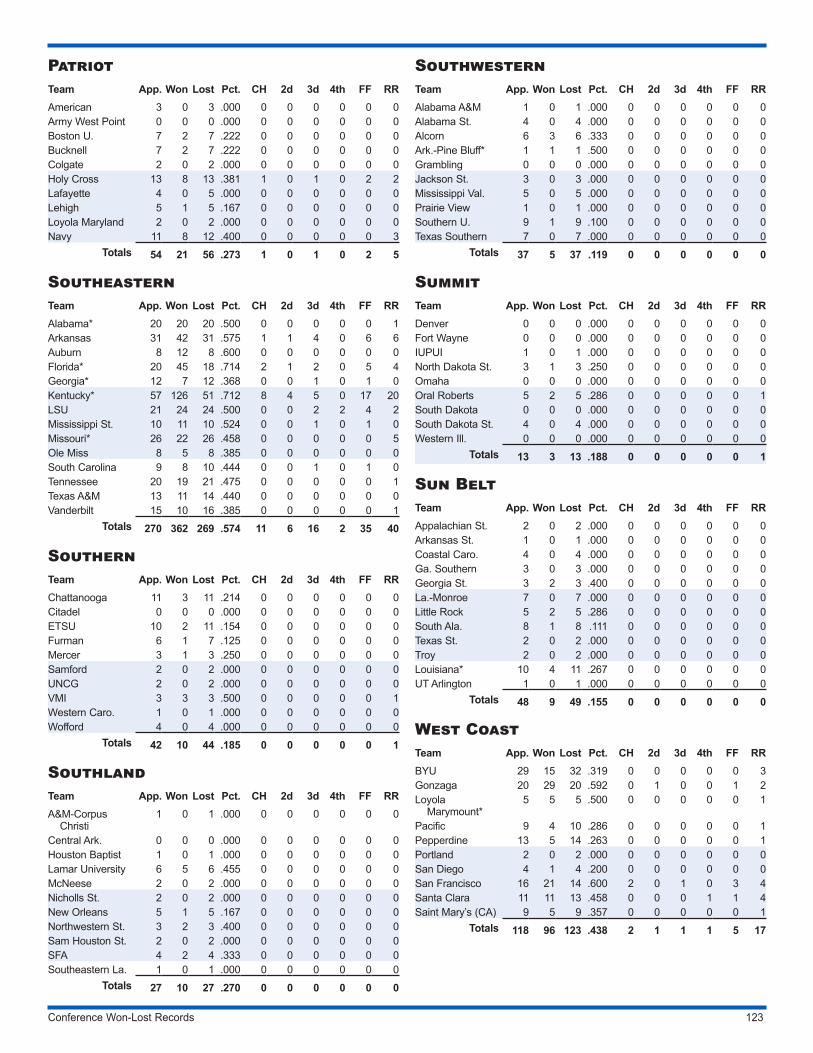
Conference Won-Lost Records 123
PatriotTeam App. Won Lost Pct. CH 2d 3d 4th FF RRAmerican 3 0 3 .000 0 0 0 0 0 0Army West Point 0 0 0 .000 0 0 0 0 0 0Boston U. 7 2 7 .222 0 0 0 0 0 0Bucknell 7 2 7 .222 0 0 0 0 0 0Colgate 2 0 2 .000 0 0 0 0 0 0Holy Cross 13 8 13 .381 1 0 1 0 2 2Lafayette 4 0 5 .000 0 0 0 0 0 0Lehigh 5 1 5 .167 0 0 0 0 0 0Loyola Maryland 2 0 2 .000 0 0 0 0 0 0Navy 11 8 12 .400 0 0 0 0 0 3
Totals 54 21 56 .273 1 0 1 0 2 5
SoutheasternTeam App. Won Lost Pct. CH 2d 3d 4th FF RRAlabama* 20 20 20 .500 0 0 0 0 0 1Arkansas 31 42 31 .575 1 1 4 0 6 6Auburn 8 12 8 .600 0 0 0 0 0 0Florida* 20 45 18 .714 2 1 2 0 5 4Georgia* 12 7 12 .368 0 0 1 0 1 0Kentucky* 57 126 51 .712 8 4 5 0 17 20LSU 21 24 24 .500 0 0 2 2 4 2Mississippi St. 10 11 10 .524 0 0 1 0 1 0Missouri* 26 22 26 .458 0 0 0 0 0 5Ole Miss 8 5 8 .385 0 0 0 0 0 0South Carolina 9 8 10 .444 0 0 1 0 1 0Tennessee 20 19 21 .475 0 0 0 0 0 1Texas A&M 13 11 14 .440 0 0 0 0 0 0Vanderbilt 15 10 16 .385 0 0 0 0 0 1
Totals 270 362 269 .574 11 6 16 2 35 40
SouthernTeam App. Won Lost Pct. CH 2d 3d 4th FF RRChattanooga 11 3 11 .214 0 0 0 0 0 0Citadel 0 0 0 .000 0 0 0 0 0 0ETSU 10 2 11 .154 0 0 0 0 0 0Furman 6 1 7 .125 0 0 0 0 0 0Mercer 3 1 3 .250 0 0 0 0 0 0Samford 2 0 2 .000 0 0 0 0 0 0UNCG 2 0 2 .000 0 0 0 0 0 0VMI 3 3 3 .500 0 0 0 0 0 1Western Caro. 1 0 1 .000 0 0 0 0 0 0Wofford 4 0 4 .000 0 0 0 0 0 0
Totals 42 10 44 .185 0 0 0 0 0 1
SouthlandTeam App. Won Lost Pct. CH 2d 3d 4th FF RRA&M-Corpus
Christi1 0 1 .000 0 0 0 0 0 0
Central Ark. 0 0 0 .000 0 0 0 0 0 0Houston Baptist 1 0 1 .000 0 0 0 0 0 0Lamar University 6 5 6 .455 0 0 0 0 0 0McNeese 2 0 2 .000 0 0 0 0 0 0Nicholls St. 2 0 2 .000 0 0 0 0 0 0New Orleans 5 1 5 .167 0 0 0 0 0 0Northwestern St. 3 2 3 .400 0 0 0 0 0 0Sam Houston St. 2 0 2 .000 0 0 0 0 0 0SFA 4 2 4 .333 0 0 0 0 0 0Southeastern La. 1 0 1 .000 0 0 0 0 0 0
Totals 27 10 27 .270 0 0 0 0 0 0
SouthwesternTeam App. Won Lost Pct. CH 2d 3d 4th FF RRAlabama A&M 1 0 1 .000 0 0 0 0 0 0Alabama St. 4 0 4 .000 0 0 0 0 0 0Alcorn 6 3 6 .333 0 0 0 0 0 0Ark.-Pine Bluff* 1 1 1 .500 0 0 0 0 0 0Grambling 0 0 0 .000 0 0 0 0 0 0Jackson St. 3 0 3 .000 0 0 0 0 0 0Mississippi Val. 5 0 5 .000 0 0 0 0 0 0Prairie View 1 0 1 .000 0 0 0 0 0 0Southern U. 9 1 9 .100 0 0 0 0 0 0Texas Southern 7 0 7 .000 0 0 0 0 0 0
Totals 37 5 37 .119 0 0 0 0 0 0
SummitTeam App. Won Lost Pct. CH 2d 3d 4th FF RRDenver 0 0 0 .000 0 0 0 0 0 0Fort Wayne 0 0 0 .000 0 0 0 0 0 0IUPUI 1 0 1 .000 0 0 0 0 0 0North Dakota St. 3 1 3 .250 0 0 0 0 0 0Omaha 0 0 0 .000 0 0 0 0 0 0Oral Roberts 5 2 5 .286 0 0 0 0 0 1South Dakota 0 0 0 .000 0 0 0 0 0 0South Dakota St. 4 0 4 .000 0 0 0 0 0 0Western Ill. 0 0 0 .000 0 0 0 0 0 0
Totals 13 3 13 .188 0 0 0 0 0 1
Sun BeltTeam App. Won Lost Pct. CH 2d 3d 4th FF RRAppalachian St. 2 0 2 .000 0 0 0 0 0 0Arkansas St. 1 0 1 .000 0 0 0 0 0 0Coastal Caro. 4 0 4 .000 0 0 0 0 0 0Ga. Southern 3 0 3 .000 0 0 0 0 0 0Georgia St. 3 2 3 .400 0 0 0 0 0 0La.-Monroe 7 0 7 .000 0 0 0 0 0 0Little Rock 5 2 5 .286 0 0 0 0 0 0South Ala. 8 1 8 .111 0 0 0 0 0 0Texas St. 2 0 2 .000 0 0 0 0 0 0Troy 2 0 2 .000 0 0 0 0 0 0Louisiana* 10 4 11 .267 0 0 0 0 0 0UT Arlington 1 0 1 .000 0 0 0 0 0 0
Totals 48 9 49 .155 0 0 0 0 0 0
West CoastTeam App. Won Lost Pct. CH 2d 3d 4th FF RRBYU 29 15 32 .319 0 0 0 0 0 3Gonzaga 20 29 20 .592 0 1 0 0 1 2Loyola
Marymount*5 5 5 .500 0 0 0 0 0 1
Pacific 9 4 10 .286 0 0 0 0 0 1Pepperdine 13 5 14 .263 0 0 0 0 0 1Portland 2 0 2 .000 0 0 0 0 0 0San Diego 4 1 4 .200 0 0 0 0 0 0San Francisco 16 21 14 .600 2 0 1 0 3 4Santa Clara 11 11 13 .458 0 0 0 1 1 4Saint Mary’s (CA) 9 5 9 .357 0 0 0 0 0 1
Totals 118 96 123 .438 2 1 1 1 5 17
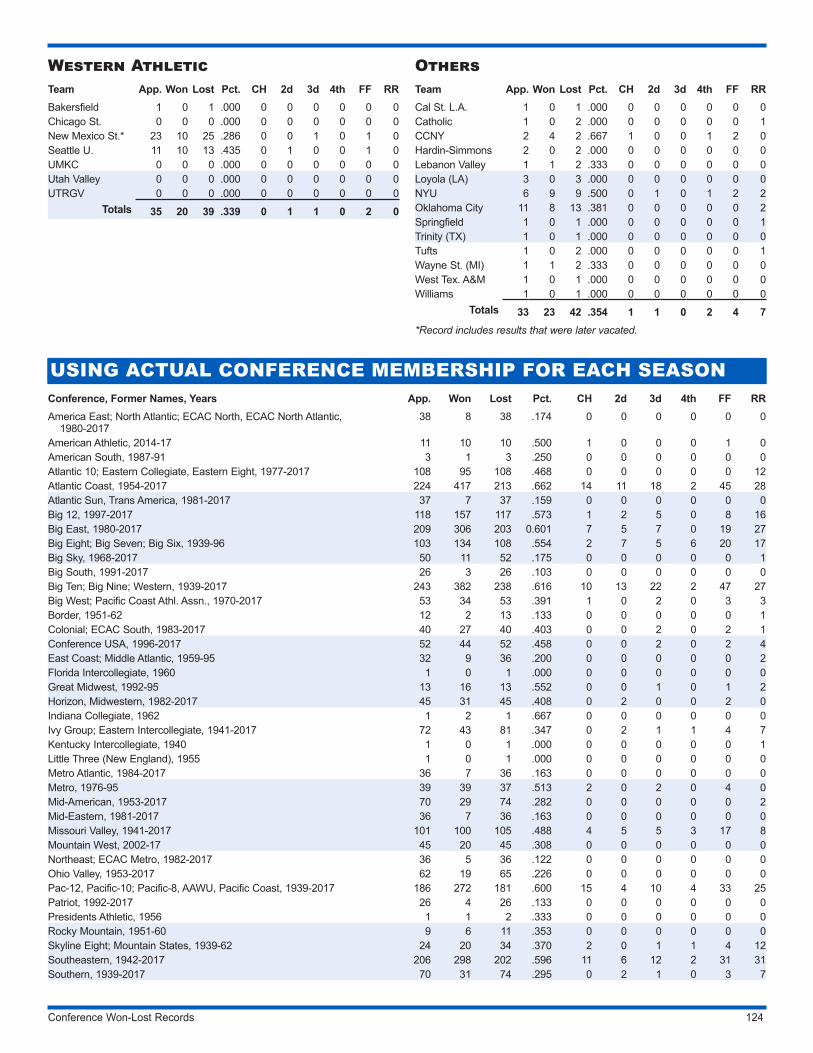
Conference Won-Lost Records 124
Western AthleticTeam App. Won Lost Pct. CH 2d 3d 4th FF RRBakersfield 1 0 1 .000 0 0 0 0 0 0Chicago St. 0 0 0 .000 0 0 0 0 0 0New Mexico St.* 23 10 25 .286 0 0 1 0 1 0Seattle U. 11 10 13 .435 0 1 0 0 1 0UMKC 0 0 0 .000 0 0 0 0 0 0Utah Valley 0 0 0 .000 0 0 0 0 0 0UTRGV 0 0 0 .000 0 0 0 0 0 0
Totals 35 20 39 .339 0 1 1 0 2 0
OthersTeam App. Won Lost Pct. CH 2d 3d 4th FF RRCal St. L.A. 1 0 1 .000 0 0 0 0 0 0Catholic 1 0 2 .000 0 0 0 0 0 1CCNY 2 4 2 .667 1 0 0 1 2 0Hardin-Simmons 2 0 2 .000 0 0 0 0 0 0Lebanon Valley 1 1 2 .333 0 0 0 0 0 0Loyola (LA) 3 0 3 .000 0 0 0 0 0 0NYU 6 9 9 .500 0 1 0 1 2 2Oklahoma City 11 8 13 .381 0 0 0 0 0 2Springfield 1 0 1 .000 0 0 0 0 0 1Trinity (TX) 1 0 1 .000 0 0 0 0 0 0Tufts 1 0 2 .000 0 0 0 0 0 1Wayne St. (MI) 1 1 2 .333 0 0 0 0 0 0West Tex. A&M 1 0 1 .000 0 0 0 0 0 0Williams 1 0 1 .000 0 0 0 0 0 0
Totals 33 23 42 .354 1 1 0 2 4 7*Record includes results that were later vacated.
USING ACTUAL CONFERENCE MEMBERSHIP FOR EACH SEASONConference, Former Names, Years App. Won Lost Pct. CH 2d 3d 4th FF RRAmerica East; North Atlantic; ECAC North, ECAC North Atlantic,
1980-201738 8 38 .174 0 0 0 0 0 0
American Athletic, 2014-17 11 10 10 .500 1 0 0 0 1 0American South, 1987-91 3 1 3 .250 0 0 0 0 0 0Atlantic 10; Eastern Collegiate, Eastern Eight, 1977-2017 108 95 108 .468 0 0 0 0 0 12Atlantic Coast, 1954-2017 224 417 213 .662 14 11 18 2 45 28Atlantic Sun, Trans America, 1981-2017 37 7 37 .159 0 0 0 0 0 0Big 12, 1997-2017 118 157 117 .573 1 2 5 0 8 16Big East, 1980-2017 209 306 203 0.601 7 5 7 0 19 27Big Eight; Big Seven; Big Six, 1939-96 103 134 108 .554 2 7 5 6 20 17Big Sky, 1968-2017 50 11 52 .175 0 0 0 0 0 1Big South, 1991-2017 26 3 26 .103 0 0 0 0 0 0Big Ten; Big Nine; Western, 1939-2017 243 382 238 .616 10 13 22 2 47 27Big West; Pacific Coast Athl. Assn., 1970-2017 53 34 53 .391 1 0 2 0 3 3Border, 1951-62 12 2 13 .133 0 0 0 0 0 1Colonial; ECAC South, 1983-2017 40 27 40 .403 0 0 2 0 2 1Conference USA, 1996-2017 52 44 52 .458 0 0 2 0 2 4East Coast; Middle Atlantic, 1959-95 32 9 36 .200 0 0 0 0 0 2Florida Intercollegiate, 1960 1 0 1 .000 0 0 0 0 0 0Great Midwest, 1992-95 13 16 13 .552 0 0 1 0 1 2Horizon, Midwestern, 1982-2017 45 31 45 .408 0 2 0 0 2 0Indiana Collegiate, 1962 1 2 1 .667 0 0 0 0 0 0Ivy Group; Eastern Intercollegiate, 1941-2017 72 43 81 .347 0 2 1 1 4 7Kentucky Intercollegiate, 1940 1 0 1 .000 0 0 0 0 0 1Little Three (New England), 1955 1 0 1 .000 0 0 0 0 0 0Metro Atlantic, 1984-2017 36 7 36 .163 0 0 0 0 0 0Metro, 1976-95 39 39 37 .513 2 0 2 0 4 0Mid-American, 1953-2017 70 29 74 .282 0 0 0 0 0 2Mid-Eastern, 1981-2017 36 7 36 .163 0 0 0 0 0 0Missouri Valley, 1941-2017 101 100 105 .488 4 5 5 3 17 8Mountain West, 2002-17 45 20 45 .308 0 0 0 0 0 0Northeast; ECAC Metro, 1982-2017 36 5 36 .122 0 0 0 0 0 0Ohio Valley, 1953-2017 62 19 65 .226 0 0 0 0 0 0Pac-12, Pacific-10; Pacific-8, AAWU, Pacific Coast, 1939-2017 186 272 181 .600 15 4 10 4 33 25Patriot, 1992-2017 26 4 26 .133 0 0 0 0 0 0Presidents Athletic, 1956 1 1 2 .333 0 0 0 0 0 0Rocky Mountain, 1951-60 9 6 11 .353 0 0 0 0 0 0Skyline Eight; Mountain States, 1939-62 24 20 34 .370 2 0 1 1 4 12Southeastern, 1942-2017 206 298 202 .596 11 6 12 2 31 31Southern, 1939-2017 70 31 74 .295 0 2 1 0 3 7
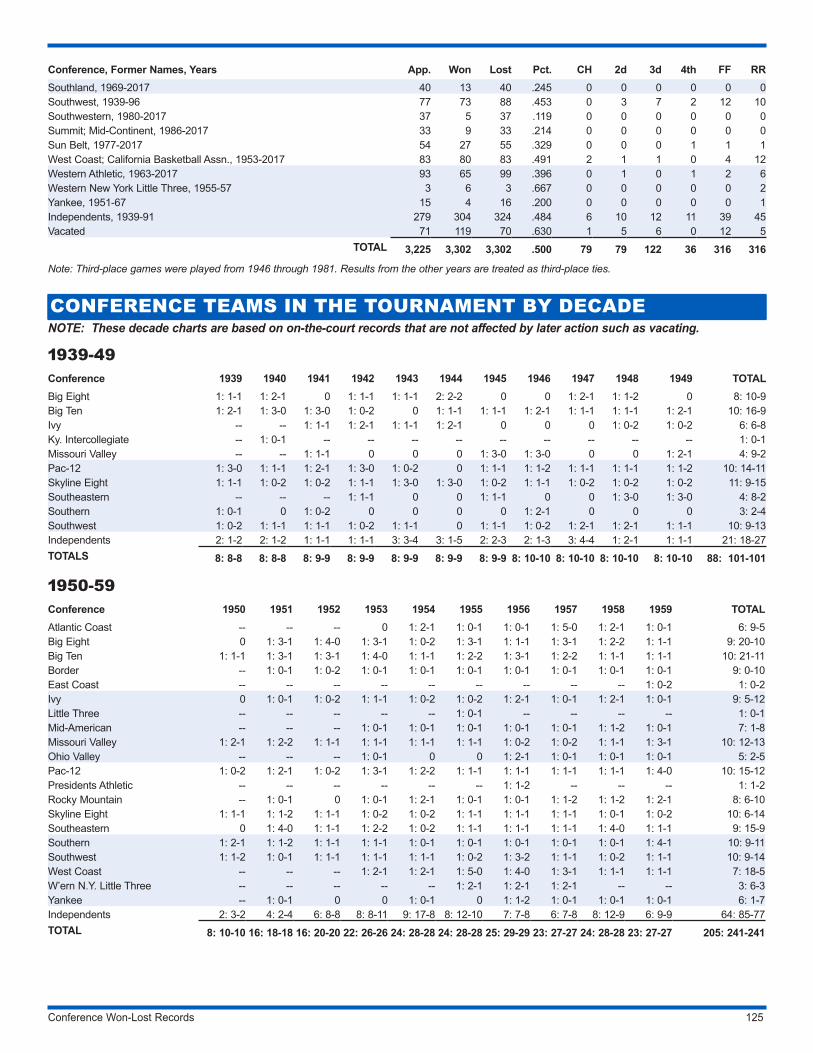
Conference Won-Lost Records 125
Conference, Former Names, Years App. Won Lost Pct. CH 2d 3d 4th FF RRSouthland, 1969-2017 40 13 40 .245 0 0 0 0 0 0Southwest, 1939-96 77 73 88 .453 0 3 7 2 12 10Southwestern, 1980-2017 37 5 37 .119 0 0 0 0 0 0Summit; Mid-Continent, 1986-2017 33 9 33 .214 0 0 0 0 0 0Sun Belt, 1977-2017 54 27 55 .329 0 0 0 1 1 1West Coast; California Basketball Assn., 1953-2017 83 80 83 .491 2 1 1 0 4 12Western Athletic, 1963-2017 93 65 99 .396 0 1 0 1 2 6Western New York Little Three, 1955-57 3 6 3 .667 0 0 0 0 0 2Yankee, 1951-67 15 4 16 .200 0 0 0 0 0 1Independents, 1939-91 279 304 324 .484 6 10 12 11 39 45Vacated 71 119 70 .630 1 5 6 0 12 5
TOTAL 3,225 3,302 3,302 .500 79 79 122 36 316 316
Note: Third-place games were played from 1946 through 1981. Results from the other years are treated as third-place ties.
CONFERENCE TEAMS IN THE TOURNAMENT BY DECADENOTE: These decade charts are based on on-the-court records that are not affected by later action such as vacating.
1939-49Conference 1939 1940 1941 1942 1943 1944 1945 1946 1947 1948 1949 TOTALBig Eight 1: 1-1 1: 2-1 0 1: 1-1 1: 1-1 2: 2-2 0 0 1: 2-1 1: 1-2 0 8: 10-9Big Ten 1: 2-1 1: 3-0 1: 3-0 1: 0-2 0 1: 1-1 1: 1-1 1: 2-1 1: 1-1 1: 1-1 1: 2-1 10: 16-9Ivy -- -- 1: 1-1 1: 2-1 1: 1-1 1: 2-1 0 0 0 1: 0-2 1: 0-2 6: 6-8Ky. Intercollegiate -- 1: 0-1 -- -- -- -- -- -- -- -- -- 1: 0-1Missouri Valley -- -- 1: 1-1 0 0 0 1: 3-0 1: 3-0 0 0 1: 2-1 4: 9-2Pac-12 1: 3-0 1: 1-1 1: 2-1 1: 3-0 1: 0-2 0 1: 1-1 1: 1-2 1: 1-1 1: 1-1 1: 1-2 10: 14-11Skyline Eight 1: 1-1 1: 0-2 1: 0-2 1: 1-1 1: 3-0 1: 3-0 1: 0-2 1: 1-1 1: 0-2 1: 0-2 1: 0-2 11: 9-15Southeastern -- -- -- 1: 1-1 0 0 1: 1-1 0 0 1: 3-0 1: 3-0 4: 8-2Southern 1: 0-1 0 1: 0-2 0 0 0 0 1: 2-1 0 0 0 3: 2-4Southwest 1: 0-2 1: 1-1 1: 1-1 1: 0-2 1: 1-1 0 1: 1-1 1: 0-2 1: 2-1 1: 2-1 1: 1-1 10: 9-13Independents 2: 1-2 2: 1-2 1: 1-1 1: 1-1 3: 3-4 3: 1-5 2: 2-3 2: 1-3 3: 4-4 1: 2-1 1: 1-1 21: 18-27TOTALS 8: 8-8 8: 8-8 8: 9-9 8: 9-9 8: 9-9 8: 9-9 8: 9-9 8: 10-10 8: 10-10 8: 10-10 8: 10-10 88: 101-101
1950-59Conference 1950 1951 1952 1953 1954 1955 1956 1957 1958 1959 TOTALAtlantic Coast -- -- -- 0 1: 2-1 1: 0-1 1: 0-1 1: 5-0 1: 2-1 1: 0-1 6: 9-5Big Eight 0 1: 3-1 1: 4-0 1: 3-1 1: 0-2 1: 3-1 1: 1-1 1: 3-1 1: 2-2 1: 1-1 9: 20-10Big Ten 1: 1-1 1: 3-1 1: 3-1 1: 4-0 1: 1-1 1: 2-2 1: 3-1 1: 2-2 1: 1-1 1: 1-1 10: 21-11Border -- 1: 0-1 1: 0-2 1: 0-1 1: 0-1 1: 0-1 1: 0-1 1: 0-1 1: 0-1 1: 0-1 9: 0-10East Coast -- -- -- -- -- -- -- -- -- 1: 0-2 1: 0-2Ivy 0 1: 0-1 1: 0-2 1: 1-1 1: 0-2 1: 0-2 1: 2-1 1: 0-1 1: 2-1 1: 0-1 9: 5-12Little Three -- -- -- -- -- 1: 0-1 -- -- -- -- 1: 0-1Mid-American -- -- -- 1: 0-1 1: 0-1 1: 0-1 1: 0-1 1: 0-1 1: 1-2 1: 0-1 7: 1-8Missouri Valley 1: 2-1 1: 2-2 1: 1-1 1: 1-1 1: 1-1 1: 1-1 1: 0-2 1: 0-2 1: 1-1 1: 3-1 10: 12-13Ohio Valley -- -- -- 1: 0-1 0 0 1: 2-1 1: 0-1 1: 0-1 1: 0-1 5: 2-5Pac-12 1: 0-2 1: 2-1 1: 0-2 1: 3-1 1: 2-2 1: 1-1 1: 1-1 1: 1-1 1: 1-1 1: 4-0 10: 15-12Presidents Athletic -- -- -- -- -- -- 1: 1-2 -- -- -- 1: 1-2Rocky Mountain -- 1: 0-1 0 1: 0-1 1: 2-1 1: 0-1 1: 0-1 1: 1-2 1: 1-2 1: 2-1 8: 6-10Skyline Eight 1: 1-1 1: 1-2 1: 1-1 1: 0-2 1: 0-2 1: 1-1 1: 1-1 1: 1-1 1: 0-1 1: 0-2 10: 6-14Southeastern 0 1: 4-0 1: 1-1 1: 2-2 1: 0-2 1: 1-1 1: 1-1 1: 1-1 1: 4-0 1: 1-1 9: 15-9Southern 1: 2-1 1: 1-2 1: 1-1 1: 1-1 1: 0-1 1: 0-1 1: 0-1 1: 0-1 1: 0-1 1: 4-1 10: 9-11Southwest 1: 1-2 1: 0-1 1: 1-1 1: 1-1 1: 1-1 1: 0-2 1: 3-2 1: 1-1 1: 0-2 1: 1-1 10: 9-14West Coast -- -- -- 1: 2-1 1: 2-1 1: 5-0 1: 4-0 1: 3-1 1: 1-1 1: 1-1 7: 18-5W’ern N.Y. Little Three -- -- -- -- -- 1: 2-1 1: 2-1 1: 2-1 -- -- 3: 6-3Yankee -- 1: 0-1 0 0 1: 0-1 0 1: 1-2 1: 0-1 1: 0-1 1: 0-1 6: 1-7Independents 2: 3-2 4: 2-4 6: 8-8 8: 8-11 9: 17-8 8: 12-10 7: 7-8 6: 7-8 8: 12-9 6: 9-9 64: 85-77TOTAL 8: 10-10 16: 18-18 16: 20-20 22: 26-26 24: 28-28 24: 28-28 25: 29-29 23: 27-27 24: 28-28 23: 27-27 205: 241-241
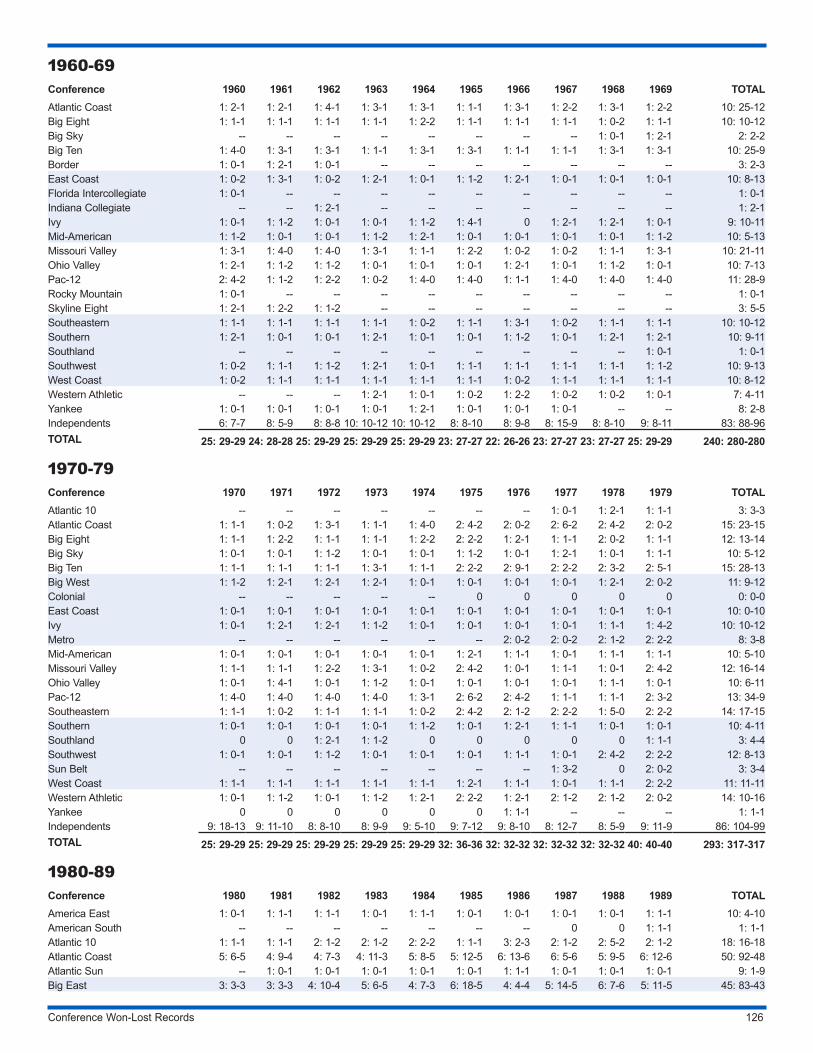
Conference Won-Lost Records 126
1960-69Conference 1960 1961 1962 1963 1964 1965 1966 1967 1968 1969 TOTALAtlantic Coast 1: 2-1 1: 2-1 1: 4-1 1: 3-1 1: 3-1 1: 1-1 1: 3-1 1: 2-2 1: 3-1 1: 2-2 10: 25-12Big Eight 1: 1-1 1: 1-1 1: 1-1 1: 1-1 1: 2-2 1: 1-1 1: 1-1 1: 1-1 1: 0-2 1: 1-1 10: 10-12Big Sky -- -- -- -- -- -- -- -- 1: 0-1 1: 2-1 2: 2-2Big Ten 1: 4-0 1: 3-1 1: 3-1 1: 1-1 1: 3-1 1: 3-1 1: 1-1 1: 1-1 1: 3-1 1: 3-1 10: 25-9Border 1: 0-1 1: 2-1 1: 0-1 -- -- -- -- -- -- -- 3: 2-3East Coast 1: 0-2 1: 3-1 1: 0-2 1: 2-1 1: 0-1 1: 1-2 1: 2-1 1: 0-1 1: 0-1 1: 0-1 10: 8-13Florida Intercollegiate 1: 0-1 -- -- -- -- -- -- -- -- -- 1: 0-1Indiana Collegiate -- -- 1: 2-1 -- -- -- -- -- -- -- 1: 2-1Ivy 1: 0-1 1: 1-2 1: 0-1 1: 0-1 1: 1-2 1: 4-1 0 1: 2-1 1: 2-1 1: 0-1 9: 10-11Mid-American 1: 1-2 1: 0-1 1: 0-1 1: 1-2 1: 2-1 1: 0-1 1: 0-1 1: 0-1 1: 0-1 1: 1-2 10: 5-13Missouri Valley 1: 3-1 1: 4-0 1: 4-0 1: 3-1 1: 1-1 1: 2-2 1: 0-2 1: 0-2 1: 1-1 1: 3-1 10: 21-11Ohio Valley 1: 2-1 1: 1-2 1: 1-2 1: 0-1 1: 0-1 1: 0-1 1: 2-1 1: 0-1 1: 1-2 1: 0-1 10: 7-13Pac-12 2: 4-2 1: 1-2 1: 2-2 1: 0-2 1: 4-0 1: 4-0 1: 1-1 1: 4-0 1: 4-0 1: 4-0 11: 28-9Rocky Mountain 1: 0-1 -- -- -- -- -- -- -- -- -- 1: 0-1Skyline Eight 1: 2-1 1: 2-2 1: 1-2 -- -- -- -- -- -- -- 3: 5-5Southeastern 1: 1-1 1: 1-1 1: 1-1 1: 1-1 1: 0-2 1: 1-1 1: 3-1 1: 0-2 1: 1-1 1: 1-1 10: 10-12Southern 1: 2-1 1: 0-1 1: 0-1 1: 2-1 1: 0-1 1: 0-1 1: 1-2 1: 0-1 1: 2-1 1: 2-1 10: 9-11Southland -- -- -- -- -- -- -- -- -- 1: 0-1 1: 0-1Southwest 1: 0-2 1: 1-1 1: 1-2 1: 2-1 1: 0-1 1: 1-1 1: 1-1 1: 1-1 1: 1-1 1: 1-2 10: 9-13West Coast 1: 0-2 1: 1-1 1: 1-1 1: 1-1 1: 1-1 1: 1-1 1: 0-2 1: 1-1 1: 1-1 1: 1-1 10: 8-12Western Athletic -- -- -- 1: 2-1 1: 0-1 1: 0-2 1: 2-2 1: 0-2 1: 0-2 1: 0-1 7: 4-11Yankee 1: 0-1 1: 0-1 1: 0-1 1: 0-1 1: 2-1 1: 0-1 1: 0-1 1: 0-1 -- -- 8: 2-8Independents 6: 7-7 8: 5-9 8: 8-8 10: 10-12 10: 10-12 8: 8-10 8: 9-8 8: 15-9 8: 8-10 9: 8-11 83: 88-96TOTAL 25: 29-29 24: 28-28 25: 29-29 25: 29-29 25: 29-29 23: 27-27 22: 26-26 23: 27-27 23: 27-27 25: 29-29 240: 280-280
1970-79Conference 1970 1971 1972 1973 1974 1975 1976 1977 1978 1979 TOTALAtlantic 10 -- -- -- -- -- -- -- 1: 0-1 1: 2-1 1: 1-1 3: 3-3Atlantic Coast 1: 1-1 1: 0-2 1: 3-1 1: 1-1 1: 4-0 2: 4-2 2: 0-2 2: 6-2 2: 4-2 2: 0-2 15: 23-15Big Eight 1: 1-1 1: 2-2 1: 1-1 1: 1-1 1: 2-2 2: 2-2 1: 2-1 1: 1-1 2: 0-2 1: 1-1 12: 13-14Big Sky 1: 0-1 1: 0-1 1: 1-2 1: 0-1 1: 0-1 1: 1-2 1: 0-1 1: 2-1 1: 0-1 1: 1-1 10: 5-12Big Ten 1: 1-1 1: 1-1 1: 1-1 1: 3-1 1: 1-1 2: 2-2 2: 9-1 2: 2-2 2: 3-2 2: 5-1 15: 28-13Big West 1: 1-2 1: 2-1 1: 2-1 1: 2-1 1: 0-1 1: 0-1 1: 0-1 1: 0-1 1: 2-1 2: 0-2 11: 9-12Colonial -- -- -- -- -- 0 0 0 0 0 0: 0-0East Coast 1: 0-1 1: 0-1 1: 0-1 1: 0-1 1: 0-1 1: 0-1 1: 0-1 1: 0-1 1: 0-1 1: 0-1 10: 0-10Ivy 1: 0-1 1: 2-1 1: 2-1 1: 1-2 1: 0-1 1: 0-1 1: 0-1 1: 0-1 1: 1-1 1: 4-2 10: 10-12Metro -- -- -- -- -- -- 2: 0-2 2: 0-2 2: 1-2 2: 2-2 8: 3-8Mid-American 1: 0-1 1: 0-1 1: 0-1 1: 0-1 1: 0-1 1: 2-1 1: 1-1 1: 0-1 1: 1-1 1: 1-1 10: 5-10Missouri Valley 1: 1-1 1: 1-1 1: 2-2 1: 3-1 1: 0-2 2: 4-2 1: 0-1 1: 1-1 1: 0-1 2: 4-2 12: 16-14Ohio Valley 1: 0-1 1: 4-1 1: 0-1 1: 1-2 1: 0-1 1: 0-1 1: 0-1 1: 0-1 1: 1-1 1: 0-1 10: 6-11Pac-12 1: 4-0 1: 4-0 1: 4-0 1: 4-0 1: 3-1 2: 6-2 2: 4-2 1: 1-1 1: 1-1 2: 3-2 13: 34-9Southeastern 1: 1-1 1: 0-2 1: 1-1 1: 1-1 1: 0-2 2: 4-2 2: 1-2 2: 2-2 1: 5-0 2: 2-2 14: 17-15Southern 1: 0-1 1: 0-1 1: 0-1 1: 0-1 1: 1-2 1: 0-1 1: 2-1 1: 1-1 1: 0-1 1: 0-1 10: 4-11Southland 0 0 1: 2-1 1: 1-2 0 0 0 0 0 1: 1-1 3: 4-4Southwest 1: 0-1 1: 0-1 1: 1-2 1: 0-1 1: 0-1 1: 0-1 1: 1-1 1: 0-1 2: 4-2 2: 2-2 12: 8-13Sun Belt -- -- -- -- -- -- -- 1: 3-2 0 2: 0-2 3: 3-4West Coast 1: 1-1 1: 1-1 1: 1-1 1: 1-1 1: 1-1 1: 2-1 1: 1-1 1: 0-1 1: 1-1 2: 2-2 11: 11-11Western Athletic 1: 0-1 1: 1-2 1: 0-1 1: 1-2 1: 2-1 2: 2-2 1: 2-1 2: 1-2 2: 1-2 2: 0-2 14: 10-16Yankee 0 0 0 0 0 0 1: 1-1 -- -- -- 1: 1-1Independents 9: 18-13 9: 11-10 8: 8-10 8: 9-9 9: 5-10 9: 7-12 9: 8-10 8: 12-7 8: 5-9 9: 11-9 86: 104-99TOTAL 25: 29-29 25: 29-29 25: 29-29 25: 29-29 25: 29-29 32: 36-36 32: 32-32 32: 32-32 32: 32-32 40: 40-40 293: 317-317
1980-89Conference 1980 1981 1982 1983 1984 1985 1986 1987 1988 1989 TOTALAmerica East 1: 0-1 1: 1-1 1: 1-1 1: 0-1 1: 1-1 1: 0-1 1: 0-1 1: 0-1 1: 0-1 1: 1-1 10: 4-10American South -- -- -- -- -- -- -- 0 0 1: 1-1 1: 1-1Atlantic 10 1: 1-1 1: 1-1 2: 1-2 2: 1-2 2: 2-2 1: 1-1 3: 2-3 2: 1-2 2: 5-2 2: 1-2 18: 16-18Atlantic Coast 5: 6-5 4: 9-4 4: 7-3 4: 11-3 5: 8-5 5: 12-5 6: 13-6 6: 5-6 5: 9-5 6: 12-6 50: 92-48Atlantic Sun -- 1: 0-1 1: 0-1 1: 0-1 1: 0-1 1: 0-1 1: 1-1 1: 0-1 1: 0-1 1: 0-1 9: 1-9Big East 3: 3-3 3: 3-3 4: 10-4 5: 6-5 4: 7-3 6: 18-5 4: 4-4 5: 14-5 6: 7-6 5: 11-5 45: 83-43
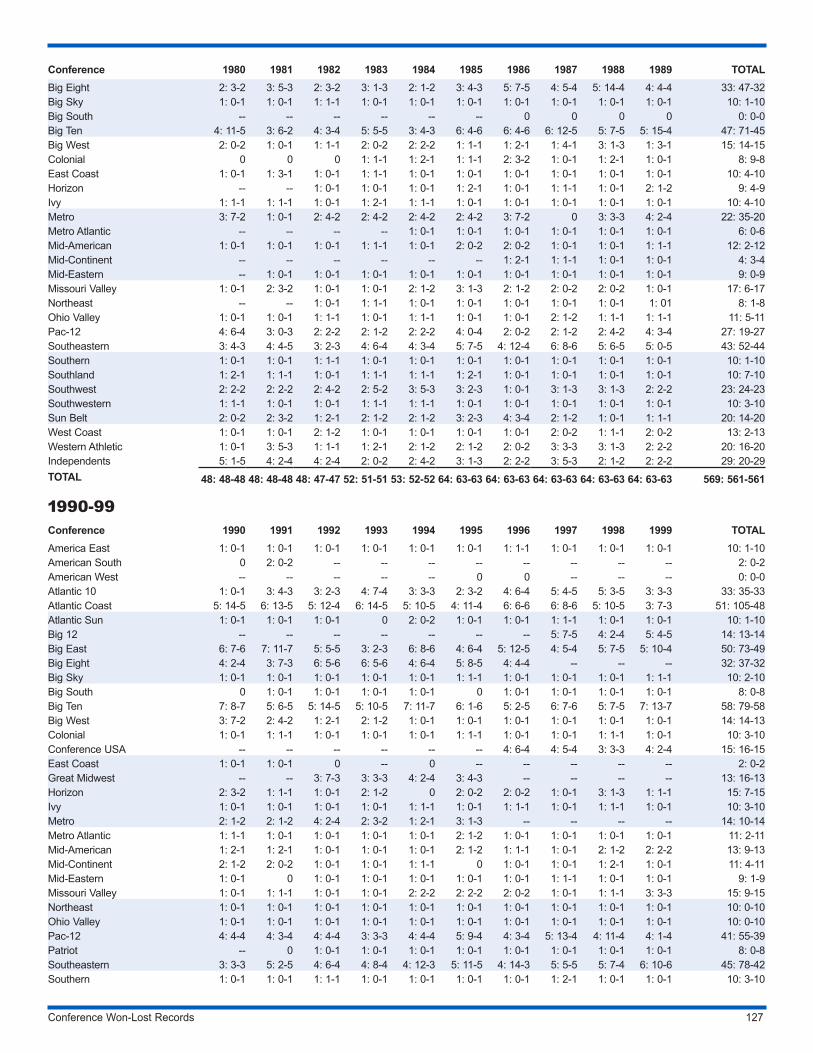
Conference Won-Lost Records 127
Conference 1980 1981 1982 1983 1984 1985 1986 1987 1988 1989 TOTALBig Eight 2: 3-2 3: 5-3 2: 3-2 3: 1-3 2: 1-2 3: 4-3 5: 7-5 4: 5-4 5: 14-4 4: 4-4 33: 47-32Big Sky 1: 0-1 1: 0-1 1: 1-1 1: 0-1 1: 0-1 1: 0-1 1: 0-1 1: 0-1 1: 0-1 1: 0-1 10: 1-10Big South -- -- -- -- -- -- 0 0 0 0 0: 0-0Big Ten 4: 11-5 3: 6-2 4: 3-4 5: 5-5 3: 4-3 6: 4-6 6: 4-6 6: 12-5 5: 7-5 5: 15-4 47: 71-45Big West 2: 0-2 1: 0-1 1: 1-1 2: 0-2 2: 2-2 1: 1-1 1: 2-1 1: 4-1 3: 1-3 1: 3-1 15: 14-15Colonial 0 0 0 1: 1-1 1: 2-1 1: 1-1 2: 3-2 1: 0-1 1: 2-1 1: 0-1 8: 9-8East Coast 1: 0-1 1: 3-1 1: 0-1 1: 1-1 1: 0-1 1: 0-1 1: 0-1 1: 0-1 1: 0-1 1: 0-1 10: 4-10Horizon -- -- 1: 0-1 1: 0-1 1: 0-1 1: 2-1 1: 0-1 1: 1-1 1: 0-1 2: 1-2 9: 4-9Ivy 1: 1-1 1: 1-1 1: 0-1 1: 2-1 1: 1-1 1: 0-1 1: 0-1 1: 0-1 1: 0-1 1: 0-1 10: 4-10Metro 3: 7-2 1: 0-1 2: 4-2 2: 4-2 2: 4-2 2: 4-2 3: 7-2 0 3: 3-3 4: 2-4 22: 35-20Metro Atlantic -- -- -- -- 1: 0-1 1: 0-1 1: 0-1 1: 0-1 1: 0-1 1: 0-1 6: 0-6Mid-American 1: 0-1 1: 0-1 1: 0-1 1: 1-1 1: 0-1 2: 0-2 2: 0-2 1: 0-1 1: 0-1 1: 1-1 12: 2-12Mid-Continent -- -- -- -- -- -- 1: 2-1 1: 1-1 1: 0-1 1: 0-1 4: 3-4Mid-Eastern -- 1: 0-1 1: 0-1 1: 0-1 1: 0-1 1: 0-1 1: 0-1 1: 0-1 1: 0-1 1: 0-1 9: 0-9Missouri Valley 1: 0-1 2: 3-2 1: 0-1 1: 0-1 2: 1-2 3: 1-3 2: 1-2 2: 0-2 2: 0-2 1: 0-1 17: 6-17Northeast -- -- 1: 0-1 1: 1-1 1: 0-1 1: 0-1 1: 0-1 1: 0-1 1: 0-1 1: 01 8: 1-8Ohio Valley 1: 0-1 1: 0-1 1: 1-1 1: 0-1 1: 1-1 1: 0-1 1: 0-1 2: 1-2 1: 1-1 1: 1-1 11: 5-11Pac-12 4: 6-4 3: 0-3 2: 2-2 2: 1-2 2: 2-2 4: 0-4 2: 0-2 2: 1-2 2: 4-2 4: 3-4 27: 19-27Southeastern 3: 4-3 4: 4-5 3: 2-3 4: 6-4 4: 3-4 5: 7-5 4: 12-4 6: 8-6 5: 6-5 5: 0-5 43: 52-44Southern 1: 0-1 1: 0-1 1: 1-1 1: 0-1 1: 0-1 1: 0-1 1: 0-1 1: 0-1 1: 0-1 1: 0-1 10: 1-10Southland 1: 2-1 1: 1-1 1: 0-1 1: 1-1 1: 1-1 1: 2-1 1: 0-1 1: 0-1 1: 0-1 1: 0-1 10: 7-10Southwest 2: 2-2 2: 2-2 2: 4-2 2: 5-2 3: 5-3 3: 2-3 1: 0-1 3: 1-3 3: 1-3 2: 2-2 23: 24-23Southwestern 1: 1-1 1: 0-1 1: 0-1 1: 1-1 1: 1-1 1: 0-1 1: 0-1 1: 0-1 1: 0-1 1: 0-1 10: 3-10Sun Belt 2: 0-2 2: 3-2 1: 2-1 2: 1-2 2: 1-2 3: 2-3 4: 3-4 2: 1-2 1: 0-1 1: 1-1 20: 14-20West Coast 1: 0-1 1: 0-1 2: 1-2 1: 0-1 1: 0-1 1: 0-1 1: 0-1 2: 0-2 1: 1-1 2: 0-2 13: 2-13Western Athletic 1: 0-1 3: 5-3 1: 1-1 1: 2-1 2: 1-2 2: 1-2 2: 0-2 3: 3-3 3: 1-3 2: 2-2 20: 16-20Independents 5: 1-5 4: 2-4 4: 2-4 2: 0-2 2: 4-2 3: 1-3 2: 2-2 3: 5-3 2: 1-2 2: 2-2 29: 20-29TOTAL 48: 48-48 48: 48-48 48: 47-47 52: 51-51 53: 52-52 64: 63-63 64: 63-63 64: 63-63 64: 63-63 64: 63-63 569: 561-561
1990-99Conference 1990 1991 1992 1993 1994 1995 1996 1997 1998 1999 TOTALAmerica East 1: 0-1 1: 0-1 1: 0-1 1: 0-1 1: 0-1 1: 0-1 1: 1-1 1: 0-1 1: 0-1 1: 0-1 10: 1-10American South 0 2: 0-2 -- -- -- -- -- -- -- -- 2: 0-2American West -- -- -- -- -- 0 0 -- -- -- 0: 0-0Atlantic 10 1: 0-1 3: 4-3 3: 2-3 4: 7-4 3: 3-3 2: 3-2 4: 6-4 5: 4-5 5: 3-5 3: 3-3 33: 35-33Atlantic Coast 5: 14-5 6: 13-5 5: 12-4 6: 14-5 5: 10-5 4: 11-4 6: 6-6 6: 8-6 5: 10-5 3: 7-3 51: 105-48Atlantic Sun 1: 0-1 1: 0-1 1: 0-1 0 2: 0-2 1: 0-1 1: 0-1 1: 1-1 1: 0-1 1: 0-1 10: 1-10Big 12 -- -- -- -- -- -- -- 5: 7-5 4: 2-4 5: 4-5 14: 13-14Big East 6: 7-6 7: 11-7 5: 5-5 3: 2-3 6: 8-6 4: 6-4 5: 12-5 4: 5-4 5: 7-5 5: 10-4 50: 73-49Big Eight 4: 2-4 3: 7-3 6: 5-6 6: 5-6 4: 6-4 5: 8-5 4: 4-4 -- -- -- 32: 37-32Big Sky 1: 0-1 1: 0-1 1: 0-1 1: 0-1 1: 0-1 1: 1-1 1: 0-1 1: 0-1 1: 0-1 1: 1-1 10: 2-10Big South 0 1: 0-1 1: 0-1 1: 0-1 1: 0-1 0 1: 0-1 1: 0-1 1: 0-1 1: 0-1 8: 0-8Big Ten 7: 8-7 5: 6-5 5: 14-5 5: 10-5 7: 11-7 6: 1-6 5: 2-5 6: 7-6 5: 7-5 7: 13-7 58: 79-58Big West 3: 7-2 2: 4-2 1: 2-1 2: 1-2 1: 0-1 1: 0-1 1: 0-1 1: 0-1 1: 0-1 1: 0-1 14: 14-13Colonial 1: 0-1 1: 1-1 1: 0-1 1: 0-1 1: 0-1 1: 1-1 1: 0-1 1: 0-1 1: 1-1 1: 0-1 10: 3-10Conference USA -- -- -- -- -- -- 4: 6-4 4: 5-4 3: 3-3 4: 2-4 15: 16-15East Coast 1: 0-1 1: 0-1 0 -- 0 -- -- -- -- -- 2: 0-2Great Midwest -- -- 3: 7-3 3: 3-3 4: 2-4 3: 4-3 -- -- -- -- 13: 16-13Horizon 2: 3-2 1: 1-1 1: 0-1 2: 1-2 0 2: 0-2 2: 0-2 1: 0-1 3: 1-3 1: 1-1 15: 7-15Ivy 1: 0-1 1: 0-1 1: 0-1 1: 0-1 1: 1-1 1: 0-1 1: 1-1 1: 0-1 1: 1-1 1: 0-1 10: 3-10Metro 2: 1-2 2: 1-2 4: 2-4 2: 3-2 1: 2-1 3: 1-3 -- -- -- -- 14: 10-14Metro Atlantic 1: 1-1 1: 0-1 1: 0-1 1: 0-1 1: 0-1 2: 1-2 1: 0-1 1: 0-1 1: 0-1 1: 0-1 11: 2-11Mid-American 1: 2-1 1: 2-1 1: 0-1 1: 0-1 1: 0-1 2: 1-2 1: 1-1 1: 0-1 2: 1-2 2: 2-2 13: 9-13Mid-Continent 2: 1-2 2: 0-2 1: 0-1 1: 0-1 1: 1-1 0 1: 0-1 1: 0-1 1: 2-1 1: 0-1 11: 4-11Mid-Eastern 1: 0-1 0 1: 0-1 1: 0-1 1: 0-1 1: 0-1 1: 0-1 1: 1-1 1: 0-1 1: 0-1 9: 1-9Missouri Valley 1: 0-1 1: 1-1 1: 0-1 1: 0-1 2: 2-2 2: 2-2 2: 0-2 1: 0-1 1: 1-1 3: 3-3 15: 9-15Northeast 1: 0-1 1: 0-1 1: 0-1 1: 0-1 1: 0-1 1: 0-1 1: 0-1 1: 0-1 1: 0-1 1: 0-1 10: 0-10Ohio Valley 1: 0-1 1: 0-1 1: 0-1 1: 0-1 1: 0-1 1: 0-1 1: 0-1 1: 0-1 1: 0-1 1: 0-1 10: 0-10Pac-12 4: 4-4 4: 3-4 4: 4-4 3: 3-3 4: 4-4 5: 9-4 4: 3-4 5: 13-4 4: 11-4 4: 1-4 41: 55-39Patriot -- 0 1: 0-1 1: 0-1 1: 0-1 1: 0-1 1: 0-1 1: 0-1 1: 0-1 1: 0-1 8: 0-8Southeastern 3: 3-3 5: 2-5 4: 6-4 4: 8-4 4: 12-3 5: 11-5 4: 14-3 5: 5-5 5: 7-4 6: 10-6 45: 78-42Southern 1: 0-1 1: 0-1 1: 1-1 1: 0-1 1: 0-1 1: 0-1 1: 0-1 1: 2-1 1: 0-1 1: 0-1 10: 3-10
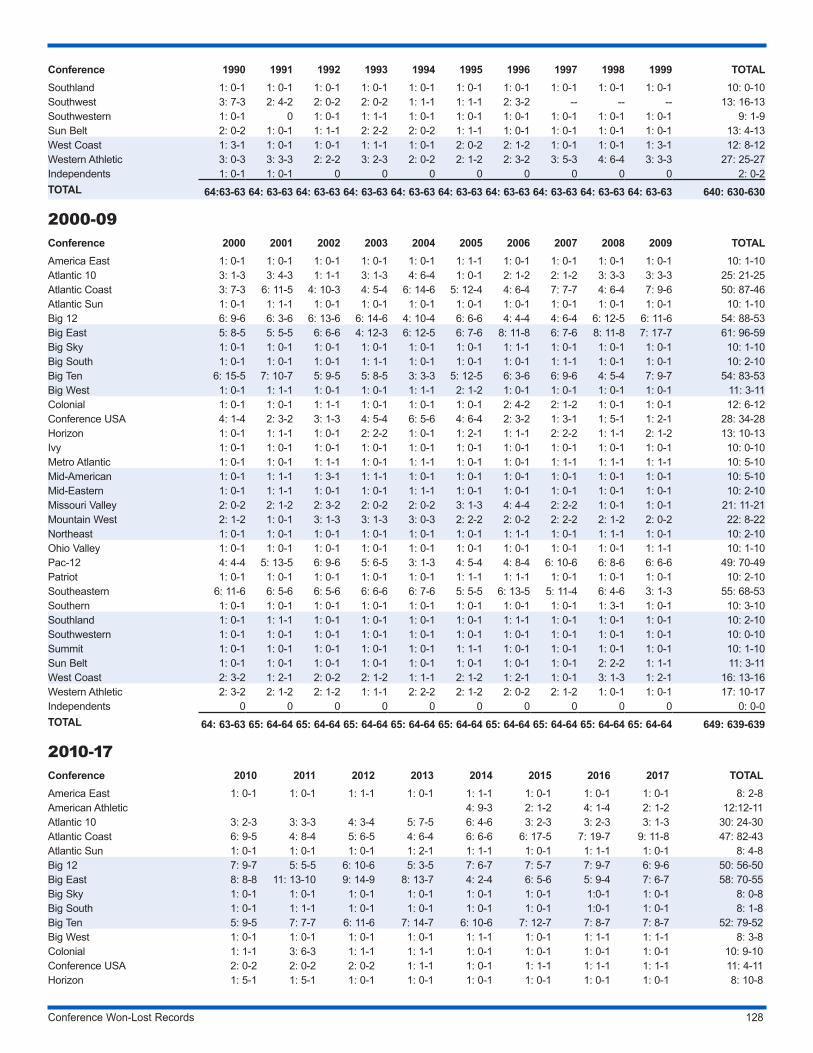
Conference Won-Lost Records 128
Conference 1990 1991 1992 1993 1994 1995 1996 1997 1998 1999 TOTALSouthland 1: 0-1 1: 0-1 1: 0-1 1: 0-1 1: 0-1 1: 0-1 1: 0-1 1: 0-1 1: 0-1 1: 0-1 10: 0-10Southwest 3: 7-3 2: 4-2 2: 0-2 2: 0-2 1: 1-1 1: 1-1 2: 3-2 -- -- -- 13: 16-13Southwestern 1: 0-1 0 1: 0-1 1: 1-1 1: 0-1 1: 0-1 1: 0-1 1: 0-1 1: 0-1 1: 0-1 9: 1-9Sun Belt 2: 0-2 1: 0-1 1: 1-1 2: 2-2 2: 0-2 1: 1-1 1: 0-1 1: 0-1 1: 0-1 1: 0-1 13: 4-13West Coast 1: 3-1 1: 0-1 1: 0-1 1: 1-1 1: 0-1 2: 0-2 2: 1-2 1: 0-1 1: 0-1 1: 3-1 12: 8-12Western Athletic 3: 0-3 3: 3-3 2: 2-2 3: 2-3 2: 0-2 2: 1-2 2: 3-2 3: 5-3 4: 6-4 3: 3-3 27: 25-27Independents 1: 0-1 1: 0-1 0 0 0 0 0 0 0 0 2: 0-2TOTAL 64:63-63 64: 63-63 64: 63-63 64: 63-63 64: 63-63 64: 63-63 64: 63-63 64: 63-63 64: 63-63 64: 63-63 640: 630-630
2000-09Conference 2000 2001 2002 2003 2004 2005 2006 2007 2008 2009 TOTALAmerica East 1: 0-1 1: 0-1 1: 0-1 1: 0-1 1: 0-1 1: 1-1 1: 0-1 1: 0-1 1: 0-1 1: 0-1 10: 1-10Atlantic 10 3: 1-3 3: 4-3 1: 1-1 3: 1-3 4: 6-4 1: 0-1 2: 1-2 2: 1-2 3: 3-3 3: 3-3 25: 21-25Atlantic Coast 3: 7-3 6: 11-5 4: 10-3 4: 5-4 6: 14-6 5: 12-4 4: 6-4 7: 7-7 4: 6-4 7: 9-6 50: 87-46Atlantic Sun 1: 0-1 1: 1-1 1: 0-1 1: 0-1 1: 0-1 1: 0-1 1: 0-1 1: 0-1 1: 0-1 1: 0-1 10: 1-10Big 12 6: 9-6 6: 3-6 6: 13-6 6: 14-6 4: 10-4 6: 6-6 4: 4-4 4: 6-4 6: 12-5 6: 11-6 54: 88-53Big East 5: 8-5 5: 5-5 6: 6-6 4: 12-3 6: 12-5 6: 7-6 8: 11-8 6: 7-6 8: 11-8 7: 17-7 61: 96-59Big Sky 1: 0-1 1: 0-1 1: 0-1 1: 0-1 1: 0-1 1: 0-1 1: 1-1 1: 0-1 1: 0-1 1: 0-1 10: 1-10Big South 1: 0-1 1: 0-1 1: 0-1 1: 1-1 1: 0-1 1: 0-1 1: 0-1 1: 1-1 1: 0-1 1: 0-1 10: 2-10Big Ten 6: 15-5 7: 10-7 5: 9-5 5: 8-5 3: 3-3 5: 12-5 6: 3-6 6: 9-6 4: 5-4 7: 9-7 54: 83-53Big West 1: 0-1 1: 1-1 1: 0-1 1: 0-1 1: 1-1 2: 1-2 1: 0-1 1: 0-1 1: 0-1 1: 0-1 11: 3-11Colonial 1: 0-1 1: 0-1 1: 1-1 1: 0-1 1: 0-1 1: 0-1 2: 4-2 2: 1-2 1: 0-1 1: 0-1 12: 6-12Conference USA 4: 1-4 2: 3-2 3: 1-3 4: 5-4 6: 5-6 4: 6-4 2: 3-2 1: 3-1 1: 5-1 1: 2-1 28: 34-28Horizon 1: 0-1 1: 1-1 1: 0-1 2: 2-2 1: 0-1 1: 2-1 1: 1-1 2: 2-2 1: 1-1 2: 1-2 13: 10-13Ivy 1: 0-1 1: 0-1 1: 0-1 1: 0-1 1: 0-1 1: 0-1 1: 0-1 1: 0-1 1: 0-1 1: 0-1 10: 0-10Metro Atlantic 1: 0-1 1: 0-1 1: 1-1 1: 0-1 1: 1-1 1: 0-1 1: 0-1 1: 1-1 1: 1-1 1: 1-1 10: 5-10Mid-American 1: 0-1 1: 1-1 1: 3-1 1: 1-1 1: 0-1 1: 0-1 1: 0-1 1: 0-1 1: 0-1 1: 0-1 10: 5-10Mid-Eastern 1: 0-1 1: 1-1 1: 0-1 1: 0-1 1: 1-1 1: 0-1 1: 0-1 1: 0-1 1: 0-1 1: 0-1 10: 2-10Missouri Valley 2: 0-2 2: 1-2 2: 3-2 2: 0-2 2: 0-2 3: 1-3 4: 4-4 2: 2-2 1: 0-1 1: 0-1 21: 11-21Mountain West 2: 1-2 1: 0-1 3: 1-3 3: 1-3 3: 0-3 2: 2-2 2: 0-2 2: 2-2 2: 1-2 2: 0-2 22: 8-22Northeast 1: 0-1 1: 0-1 1: 0-1 1: 0-1 1: 0-1 1: 0-1 1: 1-1 1: 0-1 1: 1-1 1: 0-1 10: 2-10Ohio Valley 1: 0-1 1: 0-1 1: 0-1 1: 0-1 1: 0-1 1: 0-1 1: 0-1 1: 0-1 1: 0-1 1: 1-1 10: 1-10Pac-12 4: 4-4 5: 13-5 6: 9-6 5: 6-5 3: 1-3 4: 5-4 4: 8-4 6: 10-6 6: 8-6 6: 6-6 49: 70-49Patriot 1: 0-1 1: 0-1 1: 0-1 1: 0-1 1: 0-1 1: 1-1 1: 1-1 1: 0-1 1: 0-1 1: 0-1 10: 2-10Southeastern 6: 11-6 6: 5-6 6: 5-6 6: 6-6 6: 7-6 5: 5-5 6: 13-5 5: 11-4 6: 4-6 3: 1-3 55: 68-53Southern 1: 0-1 1: 0-1 1: 0-1 1: 0-1 1: 0-1 1: 0-1 1: 0-1 1: 0-1 1: 3-1 1: 0-1 10: 3-10Southland 1: 0-1 1: 1-1 1: 0-1 1: 0-1 1: 0-1 1: 0-1 1: 1-1 1: 0-1 1: 0-1 1: 0-1 10: 2-10Southwestern 1: 0-1 1: 0-1 1: 0-1 1: 0-1 1: 0-1 1: 0-1 1: 0-1 1: 0-1 1: 0-1 1: 0-1 10: 0-10Summit 1: 0-1 1: 0-1 1: 0-1 1: 0-1 1: 0-1 1: 1-1 1: 0-1 1: 0-1 1: 0-1 1: 0-1 10: 1-10Sun Belt 1: 0-1 1: 0-1 1: 0-1 1: 0-1 1: 0-1 1: 0-1 1: 0-1 1: 0-1 2: 2-2 1: 1-1 11: 3-11West Coast 2: 3-2 1: 2-1 2: 0-2 2: 1-2 1: 1-1 2: 1-2 1: 2-1 1: 0-1 3: 1-3 1: 2-1 16: 13-16Western Athletic 2: 3-2 2: 1-2 2: 1-2 1: 1-1 2: 2-2 2: 1-2 2: 0-2 2: 1-2 1: 0-1 1: 0-1 17: 10-17Independents 0 0 0 0 0 0 0 0 0 0 0: 0-0TOTAL 64: 63-63 65: 64-64 65: 64-64 65: 64-64 65: 64-64 65: 64-64 65: 64-64 65: 64-64 65: 64-64 65: 64-64 649: 639-639
2010-17Conference 2010 2011 2012 2013 2014 2015 2016 2017 TOTALAmerica East 1: 0-1 1: 0-1 1: 1-1 1: 0-1 1: 1-1 1: 0-1 1: 0-1 1: 0-1 8: 2-8American Athletic 4: 9-3 2: 1-2 4: 1-4 2: 1-2 12:12-11Atlantic 10 3: 2-3 3: 3-3 4: 3-4 5: 7-5 6: 4-6 3: 2-3 3: 2-3 3: 1-3 30: 24-30Atlantic Coast 6: 9-5 4: 8-4 5: 6-5 4: 6-4 6: 6-6 6: 17-5 7: 19-7 9: 11-8 47: 82-43Atlantic Sun 1: 0-1 1: 0-1 1: 0-1 1: 2-1 1: 1-1 1: 0-1 1: 1-1 1: 0-1 8: 4-8Big 12 7: 9-7 5: 5-5 6: 10-6 5: 3-5 7: 6-7 7: 5-7 7: 9-7 6: 9-6 50: 56-50Big East 8: 8-8 11: 13-10 9: 14-9 8: 13-7 4: 2-4 6: 5-6 5: 9-4 7: 6-7 58: 70-55Big Sky 1: 0-1 1: 0-1 1: 0-1 1: 0-1 1: 0-1 1: 0-1 1:0-1 1: 0-1 8: 0-8Big South 1: 0-1 1: 1-1 1: 0-1 1: 0-1 1: 0-1 1: 0-1 1:0-1 1: 0-1 8: 1-8Big Ten 5: 9-5 7: 7-7 6: 11-6 7: 14-7 6: 10-6 7: 12-7 7: 8-7 7: 8-7 52: 79-52Big West 1: 0-1 1: 0-1 1: 0-1 1: 0-1 1: 1-1 1: 0-1 1: 1-1 1: 1-1 8: 3-8Colonial 1: 1-1 3: 6-3 1: 1-1 1: 1-1 1: 0-1 1: 0-1 1: 0-1 1: 0-1 10: 9-10Conference USA 2: 0-2 2: 0-2 2: 0-2 1: 1-1 1: 0-1 1: 1-1 1: 1-1 1: 1-1 11: 4-11Horizon 1: 5-1 1: 5-1 1: 0-1 1: 0-1 1: 0-1 1: 0-1 1: 0-1 1: 0-1 8: 10-8
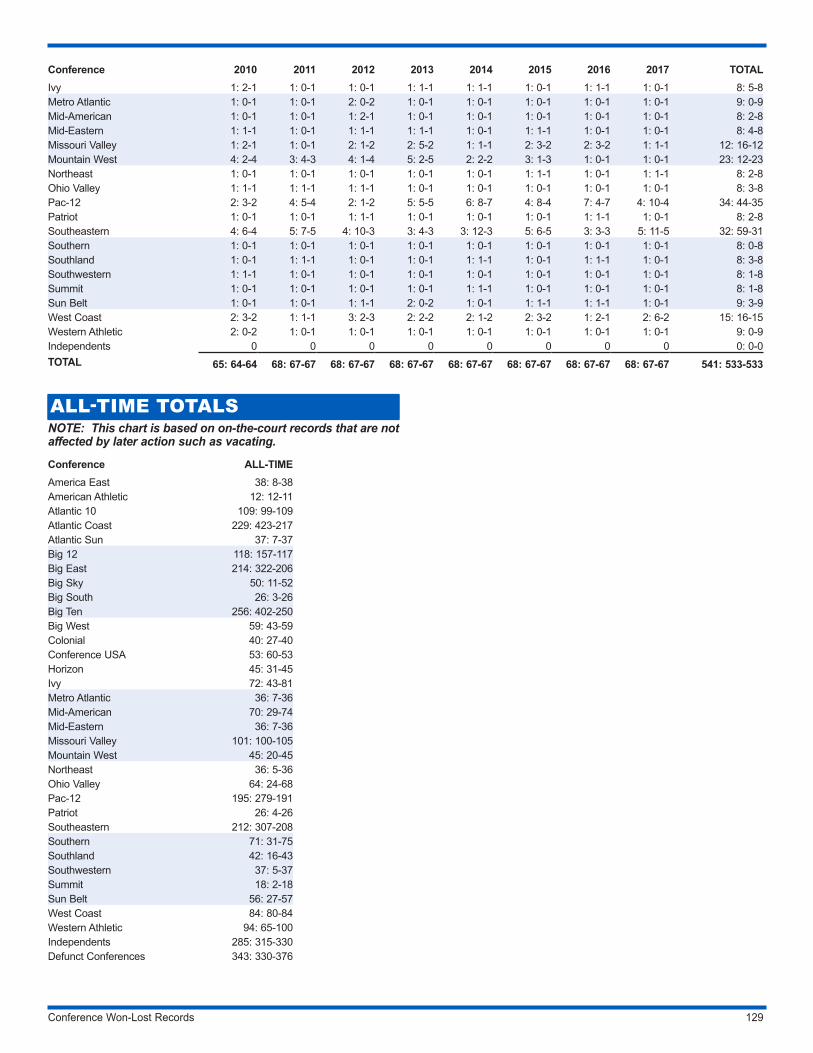
Conference Won-Lost Records 129
Conference 2010 2011 2012 2013 2014 2015 2016 2017 TOTALIvy 1: 2-1 1: 0-1 1: 0-1 1: 1-1 1: 1-1 1: 0-1 1: 1-1 1: 0-1 8: 5-8Metro Atlantic 1: 0-1 1: 0-1 2: 0-2 1: 0-1 1: 0-1 1: 0-1 1: 0-1 1: 0-1 9: 0-9Mid-American 1: 0-1 1: 0-1 1: 2-1 1: 0-1 1: 0-1 1: 0-1 1: 0-1 1: 0-1 8: 2-8Mid-Eastern 1: 1-1 1: 0-1 1: 1-1 1: 1-1 1: 0-1 1: 1-1 1: 0-1 1: 0-1 8: 4-8Missouri Valley 1: 2-1 1: 0-1 2: 1-2 2: 5-2 1: 1-1 2: 3-2 2: 3-2 1: 1-1 12: 16-12Mountain West 4: 2-4 3: 4-3 4: 1-4 5: 2-5 2: 2-2 3: 1-3 1: 0-1 1: 0-1 23: 12-23Northeast 1: 0-1 1: 0-1 1: 0-1 1: 0-1 1: 0-1 1: 1-1 1: 0-1 1: 1-1 8: 2-8Ohio Valley 1: 1-1 1: 1-1 1: 1-1 1: 0-1 1: 0-1 1: 0-1 1: 0-1 1: 0-1 8: 3-8Pac-12 2: 3-2 4: 5-4 2: 1-2 5: 5-5 6: 8-7 4: 8-4 7: 4-7 4: 10-4 34: 44-35Patriot 1: 0-1 1: 0-1 1: 1-1 1: 0-1 1: 0-1 1: 0-1 1: 1-1 1: 0-1 8: 2-8Southeastern 4: 6-4 5: 7-5 4: 10-3 3: 4-3 3: 12-3 5: 6-5 3: 3-3 5: 11-5 32: 59-31Southern 1: 0-1 1: 0-1 1: 0-1 1: 0-1 1: 0-1 1: 0-1 1: 0-1 1: 0-1 8: 0-8Southland 1: 0-1 1: 1-1 1: 0-1 1: 0-1 1: 1-1 1: 0-1 1: 1-1 1: 0-1 8: 3-8Southwestern 1: 1-1 1: 0-1 1: 0-1 1: 0-1 1: 0-1 1: 0-1 1: 0-1 1: 0-1 8: 1-8Summit 1: 0-1 1: 0-1 1: 0-1 1: 0-1 1: 1-1 1: 0-1 1: 0-1 1: 0-1 8: 1-8Sun Belt 1: 0-1 1: 0-1 1: 1-1 2: 0-2 1: 0-1 1: 1-1 1: 1-1 1: 0-1 9: 3-9West Coast 2: 3-2 1: 1-1 3: 2-3 2: 2-2 2: 1-2 2: 3-2 1: 2-1 2: 6-2 15: 16-15Western Athletic 2: 0-2 1: 0-1 1: 0-1 1: 0-1 1: 0-1 1: 0-1 1: 0-1 1: 0-1 9: 0-9Independents 0 0 0 0 0 0 0 0 0: 0-0TOTAL 65: 64-64 68: 67-67 68: 67-67 68: 67-67 68: 67-67 68: 67-67 68: 67-67 68: 67-67 541: 533-533
ALL-TIME TOTALSNOTE: This chart is based on on-the-court records that are not affected by later action such as vacating.
Conference ALL-TIMEAmerica East 38: 8-38American Athletic 12: 12-11Atlantic 10 109: 99-109Atlantic Coast 229: 423-217Atlantic Sun 37: 7-37Big 12 118: 157-117Big East 214: 322-206Big Sky 50: 11-52Big South 26: 3-26Big Ten 256: 402-250Big West 59: 43-59Colonial 40: 27-40Conference USA 53: 60-53Horizon 45: 31-45Ivy 72: 43-81Metro Atlantic 36: 7-36Mid-American 70: 29-74Mid-Eastern 36: 7-36Missouri Valley 101: 100-105Mountain West 45: 20-45Northeast 36: 5-36Ohio Valley 64: 24-68Pac-12 195: 279-191Patriot 26: 4-26Southeastern 212: 307-208Southern 71: 31-75Southland 42: 16-43Southwestern 37: 5-37Summit 18: 2-18Sun Belt 56: 27-57West Coast 84: 80-84Western Athletic 94: 65-100Independents 285: 315-330Defunct Conferences 343: 330-376
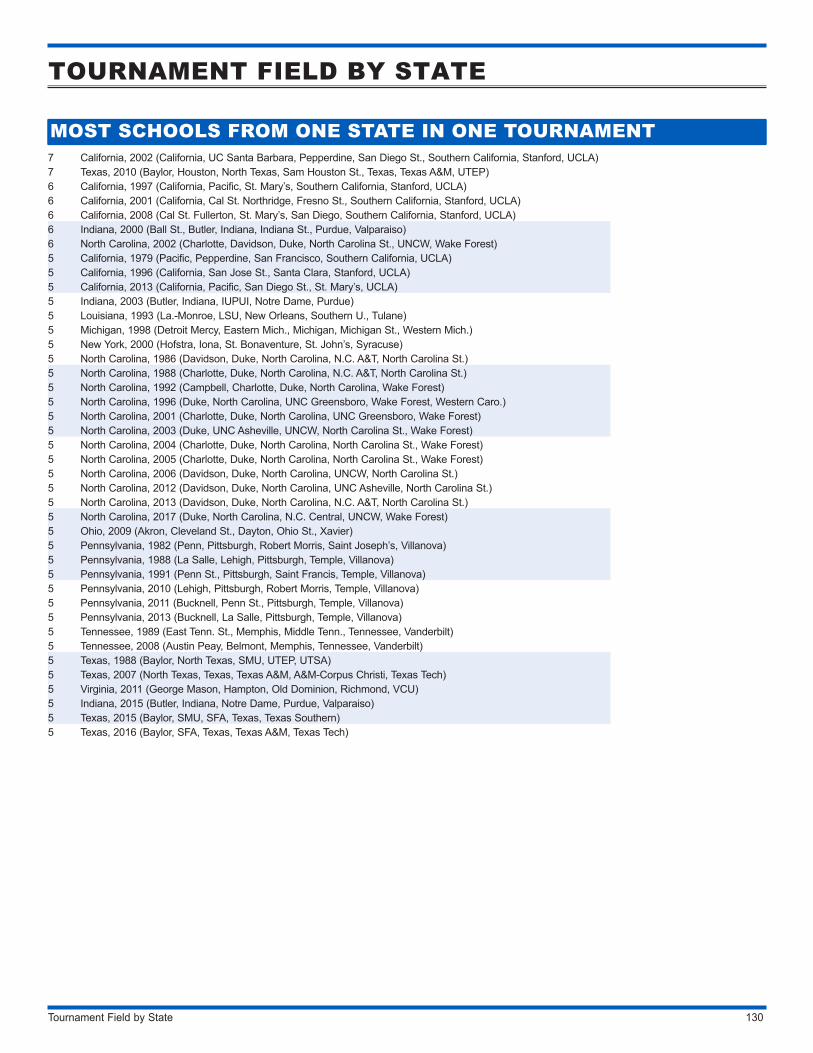
Tournament Field by State 130
TOURNAMENT FIELD BY STATE
MOST SCHOOLS FROM ONE STATE IN ONE TOURNAMENT7 California, 2002 (California, UC Santa Barbara, Pepperdine, San Diego St., Southern California, Stanford, UCLA)7 Texas, 2010 (Baylor, Houston, North Texas, Sam Houston St., Texas, Texas A&M, UTEP)6 California, 1997 (California, Pacific, St. Mary’s, Southern California, Stanford, UCLA)6 California, 2001 (California, Cal St. Northridge, Fresno St., Southern California, Stanford, UCLA)6 California, 2008 (Cal St. Fullerton, St. Mary’s, San Diego, Southern California, Stanford, UCLA)6 Indiana, 2000 (Ball St., Butler, Indiana, Indiana St., Purdue, Valparaiso)6 North Carolina, 2002 (Charlotte, Davidson, Duke, North Carolina St., UNCW, Wake Forest)5 California, 1979 (Pacific, Pepperdine, San Francisco, Southern California, UCLA)5 California, 1996 (California, San Jose St., Santa Clara, Stanford, UCLA)5 California, 2013 (California, Pacific, San Diego St., St. Mary’s, UCLA)5 Indiana, 2003 (Butler, Indiana, IUPUI, Notre Dame, Purdue)5 Louisiana, 1993 (La.-Monroe, LSU, New Orleans, Southern U., Tulane)5 Michigan, 1998 (Detroit Mercy, Eastern Mich., Michigan, Michigan St., Western Mich.)5 New York, 2000 (Hofstra, Iona, St. Bonaventure, St. John’s, Syracuse)5 North Carolina, 1986 (Davidson, Duke, North Carolina, N.C. A&T, North Carolina St.)5 North Carolina, 1988 (Charlotte, Duke, North Carolina, N.C. A&T, North Carolina St.)5 North Carolina, 1992 (Campbell, Charlotte, Duke, North Carolina, Wake Forest)5 North Carolina, 1996 (Duke, North Carolina, UNC Greensboro, Wake Forest, Western Caro.)5 North Carolina, 2001 (Charlotte, Duke, North Carolina, UNC Greensboro, Wake Forest)5 North Carolina, 2003 (Duke, UNC Asheville, UNCW, North Carolina St., Wake Forest)5 North Carolina, 2004 (Charlotte, Duke, North Carolina, North Carolina St., Wake Forest)5 North Carolina, 2005 (Charlotte, Duke, North Carolina, North Carolina St., Wake Forest)5 North Carolina, 2006 (Davidson, Duke, North Carolina, UNCW, North Carolina St.)5 North Carolina, 2012 (Davidson, Duke, North Carolina, UNC Asheville, North Carolina St.)5 North Carolina, 2013 (Davidson, Duke, North Carolina, N.C. A&T, North Carolina St.)5 North Carolina, 2017 (Duke, North Carolina, N.C. Central, UNCW, Wake Forest)5 Ohio, 2009 (Akron, Cleveland St., Dayton, Ohio St., Xavier)5 Pennsylvania, 1982 (Penn, Pittsburgh, Robert Morris, Saint Joseph’s, Villanova)5 Pennsylvania, 1988 (La Salle, Lehigh, Pittsburgh, Temple, Villanova)5 Pennsylvania, 1991 (Penn St., Pittsburgh, Saint Francis, Temple, Villanova)5 Pennsylvania, 2010 (Lehigh, Pittsburgh, Robert Morris, Temple, Villanova)5 Pennsylvania, 2011 (Bucknell, Penn St., Pittsburgh, Temple, Villanova)5 Pennsylvania, 2013 (Bucknell, La Salle, Pittsburgh, Temple, Villanova)5 Tennessee, 1989 (East Tenn. St., Memphis, Middle Tenn., Tennessee, Vanderbilt)5 Tennessee, 2008 (Austin Peay, Belmont, Memphis, Tennessee, Vanderbilt)5 Texas, 1988 (Baylor, North Texas, SMU, UTEP, UTSA)5 Texas, 2007 (North Texas, Texas, Texas A&M, A&M-Corpus Christi, Texas Tech)5 Virginia, 2011 (George Mason, Hampton, Old Dominion, Richmond, VCU)5 Indiana, 2015 (Butler, Indiana, Notre Dame, Purdue, Valparaiso)5 Texas, 2015 (Baylor, SMU, SFA, Texas, Texas Southern)5 Texas, 2016 (Baylor, SFA, Texas, Texas A&M, Texas Tech)
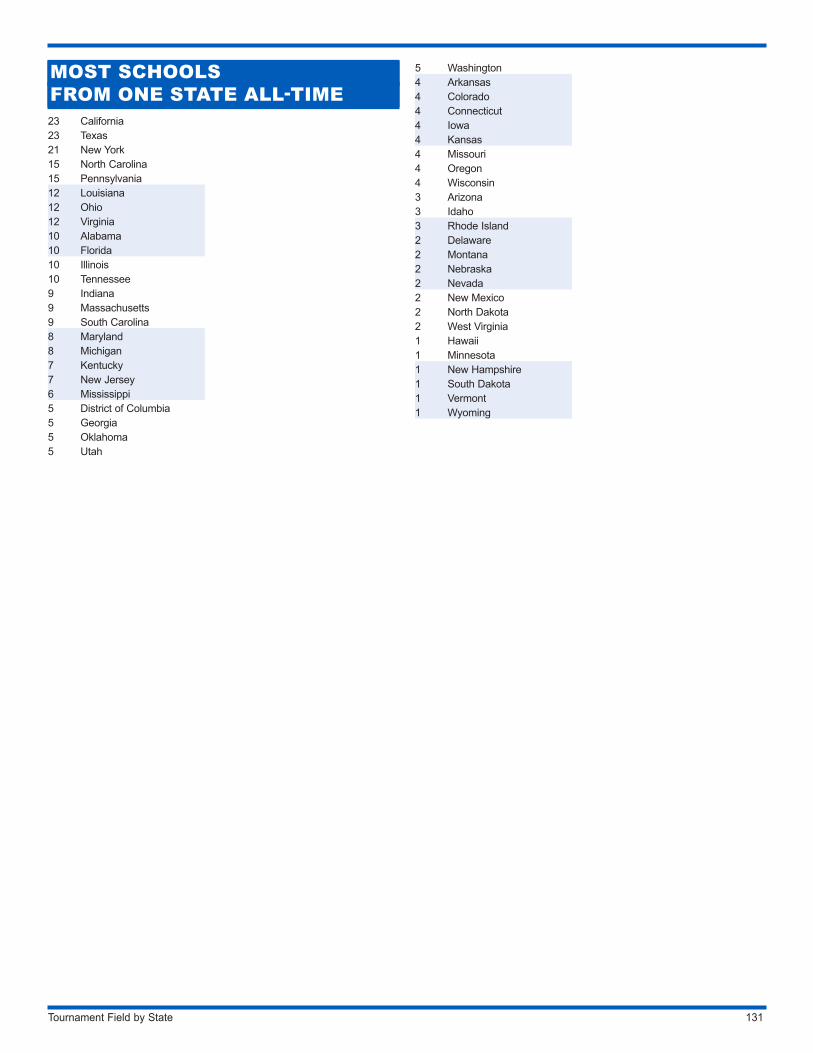
Tournament Field by State 131
MOST SCHOOLS FROM ONE STATE ALL-TIME23 California23 Texas21 New York15 North Carolina15 Pennsylvania12 Louisiana12 Ohio12 Virginia10 Alabama10 Florida10 Illinois10 Tennessee9 Indiana9 Massachusetts9 South Carolina8 Maryland8 Michigan7 Kentucky7 New Jersey6 Mississippi5 District of Columbia5 Georgia5 Oklahoma5 Utah
5 Washington4 Arkansas4 Colorado4 Connecticut4 Iowa4 Kansas4 Missouri4 Oregon4 Wisconsin3 Arizona3 Idaho3 Rhode Island2 Delaware2 Montana2 Nebraska2 Nevada2 New Mexico2 North Dakota2 West Virginia1 Hawaii1 Minnesota1 New Hampshire1 South Dakota1 Vermont1 Wyoming
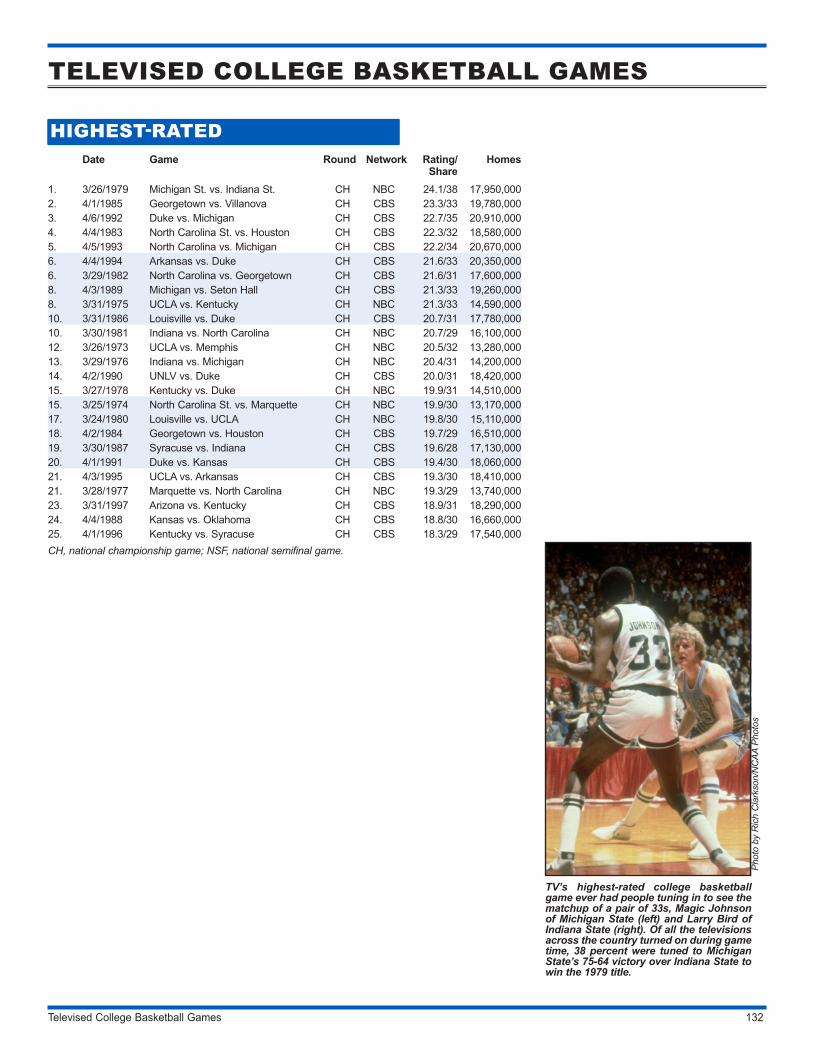
Televised College Basketball Games 132
TELEVISED COLLEGE BASKETBALL GAMES
HIGHEST-RATEDDate Game Round Network Rating/
ShareHomes
1. 3/26/1979 Michigan St. vs. Indiana St. CH NBC 24.1/38 17,950,0002. 4/1/1985 Georgetown vs. Villanova CH CBS 23.3/33 19,780,0003. 4/6/1992 Duke vs. Michigan CH CBS 22.7/35 20,910,0004. 4/4/1983 North Carolina St. vs. Houston CH CBS 22.3/32 18,580,0005. 4/5/1993 North Carolina vs. Michigan CH CBS 22.2/34 20,670,0006. 4/4/1994 Arkansas vs. Duke CH CBS 21.6/33 20,350,0006. 3/29/1982 North Carolina vs. Georgetown CH CBS 21.6/31 17,600,0008. 4/3/1989 Michigan vs. Seton Hall CH CBS 21.3/33 19,260,0008. 3/31/1975 UCLA vs. Kentucky CH NBC 21.3/33 14,590,00010. 3/31/1986 Louisville vs. Duke CH CBS 20.7/31 17,780,00010. 3/30/1981 Indiana vs. North Carolina CH NBC 20.7/29 16,100,00012. 3/26/1973 UCLA vs. Memphis CH NBC 20.5/32 13,280,00013. 3/29/1976 Indiana vs. Michigan CH NBC 20.4/31 14,200,00014. 4/2/1990 UNLV vs. Duke CH CBS 20.0/31 18,420,00015. 3/27/1978 Kentucky vs. Duke CH NBC 19.9/31 14,510,00015. 3/25/1974 North Carolina St. vs. Marquette CH NBC 19.9/30 13,170,00017. 3/24/1980 Louisville vs. UCLA CH NBC 19.8/30 15,110,00018. 4/2/1984 Georgetown vs. Houston CH CBS 19.7/29 16,510,00019. 3/30/1987 Syracuse vs. Indiana CH CBS 19.6/28 17,130,00020. 4/1/1991 Duke vs. Kansas CH CBS 19.4/30 18,060,00021. 4/3/1995 UCLA vs. Arkansas CH CBS 19.3/30 18,410,00021. 3/28/1977 Marquette vs. North Carolina CH NBC 19.3/29 13,740,00023. 3/31/1997 Arizona vs. Kentucky CH CBS 18.9/31 18,290,00024. 4/4/1988 Kansas vs. Oklahoma CH CBS 18.8/30 16,660,00025. 4/1/1996 Kentucky vs. Syracuse CH CBS 18.3/29 17,540,000CH, national championship game; NSF, national semifinal game.
TV’s highest-rated college basketball game ever had people tuning in to see the matchup of a pair of 33s, Magic Johnson of Michigan State (left) and Larry Bird of Indiana State (right). Of all the televisions across the country turned on during game time, 38 percent were tuned to Michigan State’s 75-64 victory over Indiana State to win the 1979 title.
Phot
o by
Ric
h C
lark
son/
NC
AA P
hoto
s
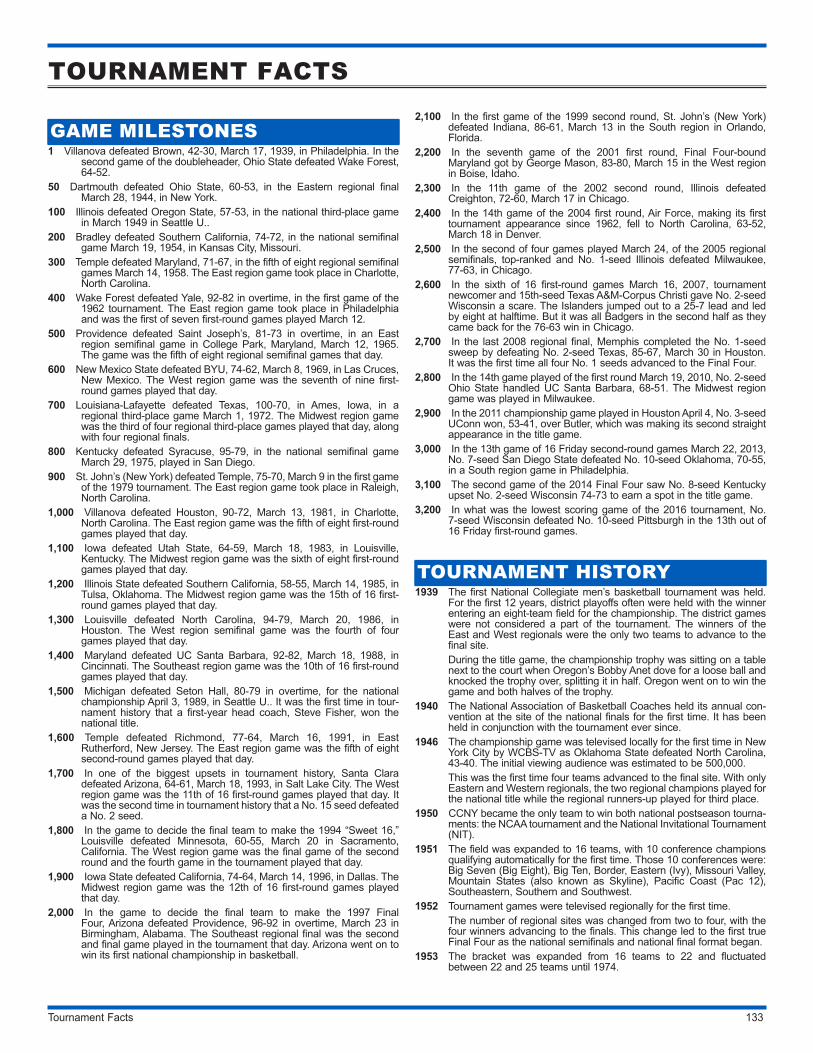
Tournament Facts 133
TOURNAMENT FACTS
GAME MILESTONES1 Villanova defeated Brown, 42-30, March 17, 1939, in Philadelphia. In the
second game of the doubleheader, Ohio State defeated Wake Forest, 64-52.
50 Dartmouth defeated Ohio State, 60-53, in the Eastern regional final March 28, 1944, in New York.
100 Illinois defeated Oregon State, 57-53, in the national third-place game in March 1949 in Seattle U..
200 Bradley defeated Southern California, 74-72, in the national semifinal game March 19, 1954, in Kansas City, Missouri.
300 Temple defeated Maryland, 71-67, in the fifth of eight regional semifinal games March 14, 1958. The East region game took place in Charlotte, North Carolina.
400 Wake Forest defeated Yale, 92-82 in overtime, in the first game of the 1962 tournament. The East region game took place in Philadelphia and was the first of seven first-round games played March 12.
500 Providence defeated Saint Joseph’s, 81-73 in overtime, in an East region semifinal game in College Park, Maryland, March 12, 1965. The game was the fifth of eight regional semifinal games that day.
600 New Mexico State defeated BYU, 74-62, March 8, 1969, in Las Cruces, New Mexico. The West region game was the seventh of nine first-round games played that day.
700 Louisiana-Lafayette defeated Texas, 100-70, in Ames, Iowa, in a regional third-place game March 1, 1972. The Midwest region game was the third of four regional third-place games played that day, along with four regional finals.
800 Kentucky defeated Syracuse, 95-79, in the national semifinal game March 29, 1975, played in San Diego.
900 St. John’s (New York) defeated Temple, 75-70, March 9 in the first game of the 1979 tournament. The East region game took place in Raleigh, North Carolina.
1,000 Villanova defeated Houston, 90-72, March 13, 1981, in Charlotte, North Carolina. The East region game was the fifth of eight first-round games played that day.
1,100 Iowa defeated Utah State, 64-59, March 18, 1983, in Louisville, Kentucky. The Midwest region game was the sixth of eight first-round games played that day.
1,200 Illinois State defeated Southern California, 58-55, March 14, 1985, in Tulsa, Oklahoma. The Midwest region game was the 15th of 16 first-round games played that day.
1,300 Louisville defeated North Carolina, 94-79, March 20, 1986, in Houston. The West region semifinal game was the fourth of four games played that day.
1,400 Maryland defeated UC Santa Barbara, 92-82, March 18, 1988, in Cincinnati. The Southeast region game was the 10th of 16 first-round games played that day.
1,500 Michigan defeated Seton Hall, 80-79 in overtime, for the national championship April 3, 1989, in Seattle U.. It was the first time in tour-nament history that a first-year head coach, Steve Fisher, won the national title.
1,600 Temple defeated Richmond, 77-64, March 16, 1991, in East Rutherford, New Jersey. The East region game was the fifth of eight second-round games played that day.
1,700 In one of the biggest upsets in tournament history, Santa Clara defeated Arizona, 64-61, March 18, 1993, in Salt Lake City. The West region game was the 11th of 16 first-round games played that day. It was the second time in tournament history that a No. 15 seed defeated a No. 2 seed.
1,800 In the game to decide the final team to make the 1994 “Sweet 16,” Louisville defeated Minnesota, 60-55, March 20 in Sacramento, California. The West region game was the final game of the second round and the fourth game in the tournament played that day.
1,900 Iowa State defeated California, 74-64, March 14, 1996, in Dallas. The Midwest region game was the 12th of 16 first-round games played that day.
2,000 In the game to decide the final team to make the 1997 Final Four, Arizona defeated Providence, 96-92 in overtime, March 23 in Birmingham, Alabama. The Southeast regional final was the second and final game played in the tournament that day. Arizona went on to win its first national championship in basketball.
2,100 In the first game of the 1999 second round, St. John’s (New York) defeated Indiana, 86-61, March 13 in the South region in Orlando, Florida.
2,200 In the seventh game of the 2001 first round, Final Four-bound Maryland got by George Mason, 83-80, March 15 in the West region in Boise, Idaho.
2,300 In the 11th game of the 2002 second round, Illinois defeated Creighton, 72-60, March 17 in Chicago.
2,400 In the 14th game of the 2004 first round, Air Force, making its first tournament appearance since 1962, fell to North Carolina, 63-52, March 18 in Denver.
2,500 In the second of four games played March 24, of the 2005 regional semifinals, top-ranked and No. 1-seed Illinois defeated Milwaukee, 77-63, in Chicago.
2,600 In the sixth of 16 first-round games March 16, 2007, tournament newcomer and 15th-seed Texas A&M-Corpus Christi gave No. 2-seed Wisconsin a scare. The Islanders jumped out to a 25-7 lead and led by eight at halftime. But it was all Badgers in the second half as they came back for the 76-63 win in Chicago.
2,700 In the last 2008 regional final, Memphis completed the No. 1-seed sweep by defeating No. 2-seed Texas, 85-67, March 30 in Houston. It was the first time all four No. 1 seeds advanced to the Final Four.
2,800 In the 14th game played of the first round March 19, 2010, No. 2-seed Ohio State handled UC Santa Barbara, 68-51. The Midwest region game was played in Milwaukee.
2,900 In the 2011 championship game played in Houston April 4, No. 3-seed UConn won, 53-41, over Butler, which was making its second straight appearance in the title game.
3,000 In the 13th game of 16 Friday second-round games March 22, 2013, No. 7-seed San Diego State defeated No. 10-seed Oklahoma, 70-55, in a South region game in Philadelphia.
3,100 The second game of the 2014 Final Four saw No. 8-seed Kentucky upset No. 2-seed Wisconsin 74-73 to earn a spot in the title game.
3,200 In what was the lowest scoring game of the 2016 tournament, No. 7-seed Wisconsin defeated No. 10-seed Pittsburgh in the 13th out of 16 Friday first-round games.
TOURNAMENT HISTORY1939 The first National Collegiate men’s basketball tournament was held.
For the first 12 years, district playoffs often were held with the winner entering an eight-team field for the championship. The district games were not considered a part of the tournament. The winners of the East and West regionals were the only two teams to advance to the final site.
During the title game, the championship trophy was sitting on a table next to the court when Oregon’s Bobby Anet dove for a loose ball and knocked the trophy over, splitting it in half. Oregon went on to win the game and both halves of the trophy.
1940 The National Association of Basketball Coaches held its annual con-vention at the site of the national finals for the first time. It has been held in conjunction with the tournament ever since.
1946 The championship game was televised locally for the first time in New York City by WCBS-TV as Oklahoma State defeated North Carolina, 43-40. The initial viewing audience was estimated to be 500,000.
This was the first time four teams advanced to the final site. With only Eastern and Western regionals, the two regional champions played for the national title while the regional runners-up played for third place.
1950 CCNY became the only team to win both national postseason tourna-ments: the NCAA tournament and the National Invitational Tournament (NIT).
1951 The field was expanded to 16 teams, with 10 conference champions qualifying automatically for the first time. Those 10 conferences were: Big Seven (Big Eight), Big Ten, Border, Eastern (Ivy), Missouri Valley, Mountain States (also known as Skyline), Pacific Coast (Pac 12), Southeastern, Southern and Southwest.
1952 Tournament games were televised regionally for the first time. The number of regional sites was changed from two to four, with the
four winners advancing to the finals. This change led to the first true Final Four as the national semifinals and national final format began.
1953 The bracket was expanded from 16 teams to 22 and fluctuated between 22 and 25 teams until 1974.
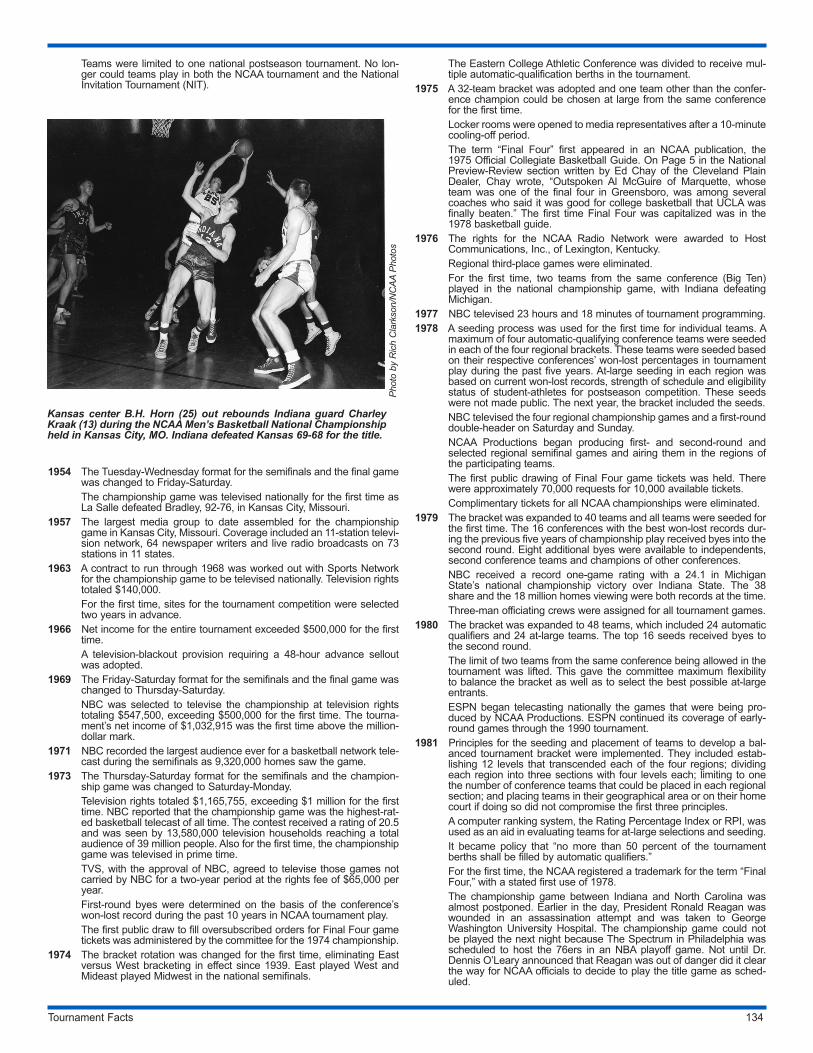
Tournament Facts 134
Teams were limited to one national postseason tournament. No lon-ger could teams play in both the NCAA tournament and the National Invitation Tournament (NIT).
1954 The Tuesday-Wednesday format for the semifinals and the final game was changed to Friday-Saturday.
The championship game was televised nationally for the first time as La Salle defeated Bradley, 92-76, in Kansas City, Missouri.
1957 The largest media group to date assembled for the championship game in Kansas City, Missouri. Coverage included an 11-station televi-sion network, 64 newspaper writers and live radio broadcasts on 73 stations in 11 states.
1963 A contract to run through 1968 was worked out with Sports Network for the championship game to be televised nationally. Television rights totaled $140,000.
For the first time, sites for the tournament competition were selected two years in advance.
1966 Net income for the entire tournament exceeded $500,000 for the first time.
A television-blackout provision requiring a 48-hour advance sellout was adopted.
1969 The Friday-Saturday format for the semifinals and the final game was changed to Thursday-Saturday.
NBC was selected to televise the championship at television rights totaling $547,500, exceeding $500,000 for the first time. The tourna-ment’s net income of $1,032,915 was the first time above the million-dollar mark.
1971 NBC recorded the largest audience ever for a basketball network tele-cast during the semifinals as 9,320,000 homes saw the game.
1973 The Thursday-Saturday format for the semifinals and the champion-ship game was changed to Saturday-Monday.
Television rights totaled $1,165,755, exceeding $1 million for the first time. NBC reported that the championship game was the highest-rat-ed basketball telecast of all time. The contest received a rating of 20.5 and was seen by 13,580,000 television households reaching a total audience of 39 million people. Also for the first time, the championship game was televised in prime time.
TVS, with the approval of NBC, agreed to televise those games not carried by NBC for a two-year period at the rights fee of $65,000 per year.
First-round byes were determined on the basis of the conference’s won-lost record during the past 10 years in NCAA tournament play.
The first public draw to fill oversubscribed orders for Final Four game tickets was administered by the committee for the 1974 championship.
1974 The bracket rotation was changed for the first time, eliminating East versus West bracketing in effect since 1939. East played West and Mideast played Midwest in the national semifinals.
The Eastern College Athletic Conference was divided to receive mul-tiple automatic-qualification berths in the tournament.
1975 A 32-team bracket was adopted and one team other than the confer-ence champion could be chosen at large from the same conference for the first time.
Locker rooms were opened to media representatives after a 10-minute cooling-off period.
The term “Final Four” first appeared in an NCAA publication, the 1975 Official Collegiate Basketball Guide. On Page 5 in the National Preview-Review section written by Ed Chay of the Cleveland Plain Dealer, Chay wrote, “Outspoken Al McGuire of Marquette, whose team was one of the final four in Greensboro, was among several coaches who said it was good for college basketball that UCLA was finally beaten.” The first time Final Four was capitalized was in the 1978 basketball guide.
1976 The rights for the NCAA Radio Network were awarded to Host Communications, Inc., of Lexington, Kentucky.
Regional third-place games were eliminated. For the first time, two teams from the same conference (Big Ten)
played in the national championship game, with Indiana defeating Michigan.
1977 NBC televised 23 hours and 18 minutes of tournament programming.1978 A seeding process was used for the first time for individual teams. A
maximum of four automatic-qualifying conference teams were seeded in each of the four regional brackets. These teams were seeded based on their respective conferences’ won-lost percentages in tournament play during the past five years. At-large seeding in each region was based on current won-lost records, strength of schedule and eligibility status of student-athletes for postseason competition. These seeds were not made public. The next year, the bracket included the seeds.
NBC televised the four regional championship games and a first-round double-header on Saturday and Sunday.
NCAA Productions began producing first- and second-round and selected regional semifinal games and airing them in the regions of the participating teams.
The first public drawing of Final Four game tickets was held. There were approximately 70,000 requests for 10,000 available tickets.
Complimentary tickets for all NCAA championships were eliminated.1979 The bracket was expanded to 40 teams and all teams were seeded for
the first time. The 16 conferences with the best won-lost records dur-ing the previous five years of championship play received byes into the second round. Eight additional byes were available to independents, second conference teams and champions of other conferences.
NBC received a record one-game rating with a 24.1 in Michigan State’s na tional championship victory over Indiana State. The 38 share and the 18 million homes viewing were both records at the time.
Three-man officiating crews were assigned for all tournament games.1980 The bracket was expanded to 48 teams, which included 24 automatic
qualifiers and 24 at-large teams. The top 16 seeds received byes to the second round.
The limit of two teams from the same conference being allowed in the tournament was lifted. This gave the committee maximum flexibility to balance the bracket as well as to select the best possible at-large entrants.
ESPN began telecasting nationally the games that were being pro-duced by NCAA Productions. ESPN continued its coverage of early-round games through the 1990 tournament.
1981 Principles for the seeding and placement of teams to develop a bal-anced tournament bracket were implemented. They included estab-lishing 12 levels that transcended each of the four regions; dividing each region into three sections with four levels each; limiting to one the number of conference teams that could be placed in each regional section; and placing teams in their geographical area or on their home court if doing so did not compromise the first three principles.
A computer ranking system, the Rating Percentage Index or RPI, was used as an aid in evaluating teams for at-large selections and seeding.
It became policy that “no more than 50 percent of the tournament berths shall be filled by automatic qualifiers.”
For the first time, the NCAA registered a trademark for the term “Final Four,” with a stated first use of 1978.
The championship game between Indiana and North Carolina was almost postponed. Earlier in the day, President Ronald Reagan was wounded in an assassination attempt and was taken to George Washington University Hospital. The championship game could not be played the next night because The Spectrum in Philadelphia was scheduled to host the 76ers in an NBA playoff game. Not until Dr. Dennis O’Leary announced that Reagan was out of danger did it clear the way for NCAA officials to decide to play the title game as sched-uled.
Kansas center B.H. Horn (25) out rebounds Indiana guard Charley Kraak (13) during the NCAA Men’s Basketball National Championship held in Kansas City, MO. Indiana defeated Kansas 69-68 for the title.
Phot
o by
Ric
h C
lark
son/
NC
AA P
hoto
s
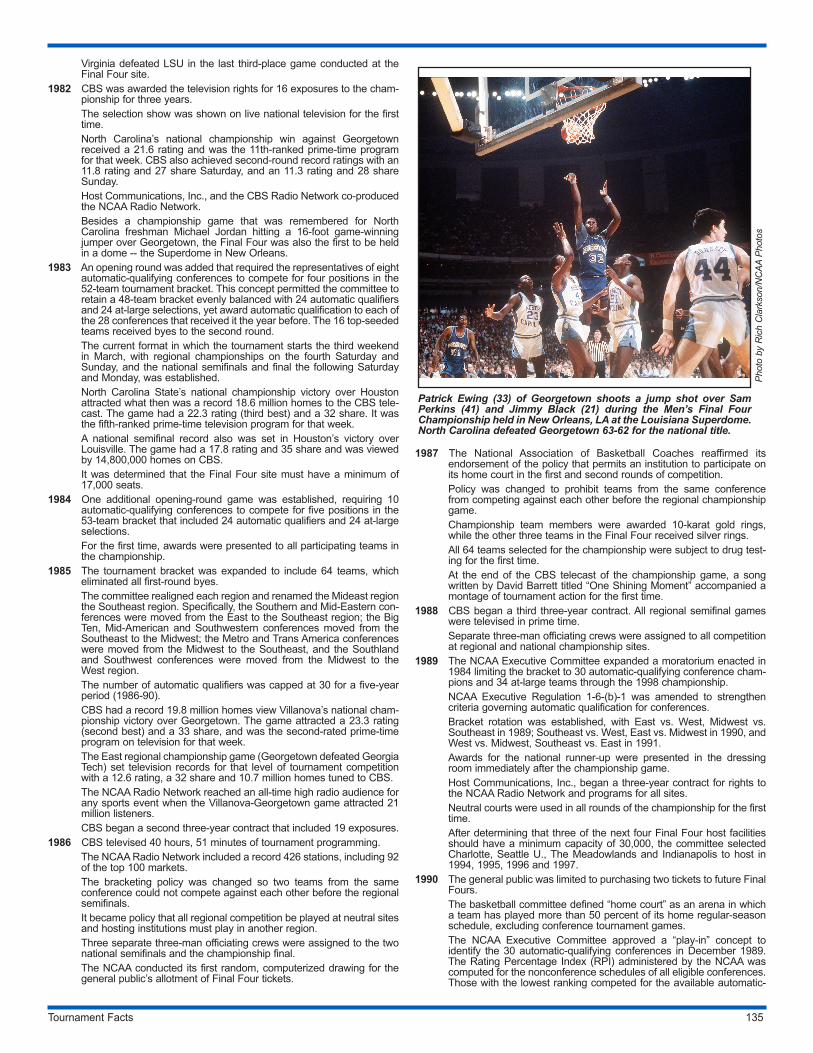
Tournament Facts 135
Virginia defeated LSU in the last third-place game conducted at the Final Four site.
1982 CBS was awarded the television rights for 16 exposures to the cham-pionship for three years.
The selection show was shown on live national television for the first time.
North Carolina’s national championship win against Georgetown received a 21.6 rating and was the 11th-ranked prime-time program for that week. CBS also achieved second-round record ratings with an 11.8 rating and 27 share Saturday, and an 11.3 rating and 28 share Sunday.
Host Communications, Inc., and the CBS Radio Network co-produced the NCAA Radio Network.
Besides a championship game that was remembered for North Carolina freshman Michael Jordan hitting a 16-foot game-winning jumper over Georgetown, the Final Four was also the first to be held in a dome -- the Superdome in New Orleans.
1983 An opening round was added that required the representatives of eight automatic-qualifying conferences to compete for four positions in the 52-team tournament bracket. This concept permitted the committee to retain a 48-team bracket evenly balanced with 24 automatic qualifiers and 24 at-large selections, yet award automatic qualification to each of the 28 conferences that received it the year before. The 16 top-seeded teams received byes to the second round.
The current format in which the tournament starts the third weekend in March, with regional championships on the fourth Saturday and Sunday, and the national semifinals and final the following Saturday and Monday, was established.
North Carolina State’s national championship victory over Houston attracted what then was a record 18.6 million homes to the CBS tele-cast. The game had a 22.3 rating (third best) and a 32 share. It was the fifth-ranked prime-time television program for that week.
A national semifinal record also was set in Houston’s victory over Louisville. The game had a 17.8 rating and 35 share and was viewed by 14,800,000 homes on CBS.
It was determined that the Final Four site must have a minimum of 17,000 seats.
1984 One additional opening-round game was established, requiring 10 automatic-qualifying conferences to compete for five positions in the 53-team bracket that included 24 automatic qualifiers and 24 at-large selections.
For the first time, awards were presented to all participating teams in the championship.
1985 The tournament bracket was expanded to include 64 teams, which eliminated all first-round byes.
The committee realigned each region and renamed the Mideast region the Southeast region. Specifically, the Southern and Mid-Eastern con-ferences were moved from the East to the Southeast region; the Big Ten, Mid-American and Southwestern conferences moved from the Southeast to the Midwest; the Metro and Trans America conferences were moved from the Midwest to the Southeast, and the Southland and Southwest conferences were moved from the Midwest to the West region.
The number of automatic qualifiers was capped at 30 for a five-year period (1986-90).
CBS had a record 19.8 million homes view Villanova’s national cham-pionship victory over Georgetown. The game attracted a 23.3 rating (second best) and a 33 share, and was the second-rated prime-time program on television for that week.
The East regional championship game (Georgetown defeated Georgia Tech) set television records for that level of tournament competition with a 12.6 rating, a 32 share and 10.7 million homes tuned to CBS.
The NCAA Radio Network reached an all-time high radio audience for any sports event when the Villanova-Georgetown game attracted 21 million listeners.
CBS began a second three-year contract that included 19 exposures.1986 CBS televised 40 hours, 51 minutes of tournament programming. The NCAA Radio Network included a record 426 stations, including 92
of the top 100 markets. The bracketing policy was changed so two teams from the same
conference could not compete against each other before the regional semifinals.
It became policy that all regional competition be played at neutral sites and hosting institutions must play in another region.
Three separate three-man officiating crews were assigned to the two national semifinals and the championship final.
The NCAA conducted its first random, computerized drawing for the general public’s allotment of Final Four tickets.
1987 The National Association of Basketball Coaches reaffirmed its endorsement of the policy that permits an institution to participate on its home court in the first and second rounds of competition.
Policy was changed to prohibit teams from the same conference from competing against each other before the regional championship game.
Championship team members were awarded 10-karat gold rings, while the other three teams in the Final Four received silver rings.
All 64 teams selected for the championship were subject to drug test-ing for the first time.
At the end of the CBS telecast of the championship game, a song written by David Barrett titled “One Shining Moment” accompanied a montage of tournament action for the first time.
1988 CBS began a third three-year contract. All regional semifinal games were televised in prime time.
Separate three-man officiating crews were assigned to all competition at regional and national championship sites.
1989 The NCAA Executive Committee expanded a moratorium enacted in 1984 limiting the bracket to 30 automatic-qualifying conference cham-pions and 34 at-large teams through the 1998 championship.
NCAA Executive Regulation 1-6-(b)-1 was amended to strengthen criteria governing automatic qualification for conferences.
Bracket rotation was established, with East vs. West, Midwest vs. Southeast in 1989; Southeast vs. West, East vs. Midwest in 1990, and West vs. Midwest, Southeast vs. East in 1991.
Awards for the national runner-up were presented in the dressing room immediately after the championship game.
Host Communications, Inc., began a three-year contract for rights to the NCAA Radio Network and programs for all sites.
Neutral courts were used in all rounds of the championship for the first time.
After determining that three of the next four Final Four host facilities should have a minimum capacity of 30,000, the committee selected Charlotte, Seattle U., The Meadowlands and Indianapolis to host in 1994, 1995, 1996 and 1997.
1990 The general public was limited to purchasing two tickets to future Final Fours.
The basketball committee defined “home court” as an arena in which a team has played more than 50 percent of its home regular-season schedule, excluding conference tournament games.
The NCAA Executive Committee approved a “play-in” concept to identify the 30 automatic-qualifying conferences in December 1989. The Rating Percentage Index (RPI) administered by the NCAA was computed for the nonconference schedules of all eligible conferences. Those with the lowest ranking competed for the available automatic-
Phot
o by
Ric
h C
lark
son/
NC
AA P
hoto
s
Patrick Ewing (33) of Georgetown shoots a jump shot over Sam Perkins (41) and Jimmy Black (21) during the Men’s Final Four Championship held in New Orleans, LA at the Louisiana Superdome. North Carolina defeated Georgetown 63-62 for the national title.
Tournament Facts 136
qualifying positions. The play-in was implemented in 1991 with 33 eligible conferences. Six conference representatives played for three automatic-qualifying berths in the 64-team bracket.
For the first time, the RPI was updated daily during the selection meetings. Previously, the RPI was updated only once through the night before the meetings began and used throughout the selection process.
1991 CBS Sports began a seven-year contract for $1 billion, which included live coverage of all sessions of the championship.
The NCAA began a new system for distributing championship revenue to the membership. The system was based upon sports sponsorship, grants-in-aid, and basketball performance, and also included fund-ing for academic enhancement and special assistance to student-athletes. The basketball fund was based on each conference’s perfor-mance during a rolling six-year period.
The definition of “home court” was further defined to exclude from hosting arenas in which teams played more than three games of a regular-season schedule, excluding conference tournaments.
A play-in was conducted between the six lowest-rated conferences from the previous year’s RPI since 33 conferences were eligible for automatic qualification. Game results were as follows: Saint Francis (Pennsylvania) (Northeast Conference) defeated Fordham (Patriot League), 70-64; Louisiana-Monroe (Southland) defeated Florida A&M (Mid-Eastern), 87-63; and Coastal Carolina (Big South) defeated Jackson State (Southwestern), 86-75.
Only 29 automatic berths were given instead of 30 because Missouri won the Big Eight conference tournament and was ineligible for the NCAA tournament.
1992 Duke won its second consecutive national championship, the first team to successfully defend its title since UCLA in 1973.
1993 A minimum facility seating capacity of 12,000 for first and second rounds and regionals was established.
The basketball committee selected San Antonio; St. Petersburg, Florida; Indianapolis; Minneapolis; and Atlanta to host the Final Four in 1998 through 2002. All the facilities had capacities in excess of 30,000.
1994 For the first time, all 100 of the top 100 markets in the country received the radio play-by-play broadcast of the Final Four. This included a record 488 stations.
President Bill Clinton became the first sitting president to attend the tournament, when he was present at the Midwest regional champion-ship game in Dallas and the national semifinals and final in Charlotte, North Carolina.
The use of combined shot clocks/game clocks was required at all sites.
The committee agreed to attempt to assign the top four seeds in each region away from a site that may create a “home-crowd advantage” for their opponents. The committee recognized that it could be neces-sary to move lower-seeded teams from their natural regions in order to accomplish this.
The weighing of the three factors composing the Rating Percentage Index (RPI), Division I winning percentage, opponents’ winning per-centage and opponents’ opponent’s winning percentage, was adjust-ed from 20-40-40 to 25-50-25. Factor IV was introduced to produce an adjusted RPI. It was based on a team’s “good” wins, “bad” losses and nonconference scheduling.
1995 The existing CBS Sports contract was replaced with a new agreement for $1.725 billion extending through the 2002 championship.
1996 The NCAA created the first online computer page for the men’s Final Four.
Pool reporters were permitted under specified conditions to interview game officials after games.
Participating institutions’ seating locations were moved closer to mid-court and nearer to the playing floor.
1997 Bracketing policies were changed so that once the highest-seeded team from a conference is assigned to a region, only the eighth team selected from that conference may be placed in that region.
The NCAA’s online computer page was expanded to include prelimi-nary rounds.
1998 Competition at all three sites within each region began being con-ducted on the same days of the week and tournament hosts’ teams were permitted to play on the days they are hosting.
The name of the Southeast Region was changed to the South Region. The basketball committee continued selecting Final Four host facili-
ties with a minimum seating capacity of 30,000, when it picked New Orleans, San Antonio, St. Louis, Indianapolis and Atlanta to host from 2003 to 2007.
1999 Bracketing policies were changed so that, once the highest-seeded team from a conference is assigned to a region, only the sixth team from that conference may be placed in that region.
The NCAA signed a new 11-year agreement with CBS Sports, com-mencing with the 2003 championship. The agreement, which was for a minimum of $6 billion, included rights to television (over-the-air, cable, satellite, digital and home video), marketing, game programs, radio, Internet, fan festivals and licensing (excluding concessionaire agree-ments).
In its continuing effort to combat the effects of gambling, the com-mittee began conducting background checks on game officials. The NCAA checked 50 officials randomly selected from among the 96 who worked the previous year’s tournament.
2000 The NCAA and the Illinois High School Association formed the “March Madness Athletic Association” and applied for trademark registration for the term “March Madness.” The registration was granted in 2001.
2001 Inasmuch as 31 conferences were eligible for automatic qualifica-tion, the committee agreed to conduct an opening-round game the Tuesday before the first/second rounds, pitting teams seeded Nos. 64 and 65.
The National Network (TNN) telecast the opening-round game. For the first time, the NCAA registered a trademark for the term “Big
Dance,” with a stated first use of 2000.2002 Championship-, first- and second-round sites were no longer assigned
to specific regions. Rather, the committee had the flexibility to assign four-team pods to sites near the teams’ natural geographic areas, if possible.
The committee eliminated the bracketing provision that, once the high-est-seeded team from a conference was assigned to a region, only the sixth team from that conference could be placed in that region.
CBS expanded its live selection show to one hour. ESPN televised the opening-round game for the first time. First-/second-round sites in non-domed stadiums drew 99.5 percent of
capacity, an all-time record at the time. During the selection meeting, for the first time, each committee mem-
ber had the use of an individual computer for researching and evaluat-ing teams.
2003 Westwood One assumed administration of the tournament’s radio rights.
The committee set the minimum Final Four seating capacity at 40,000 and picked San Antonio, Detroit, Indianapolis and Houston to host from 2008 to 2011.
2004 Rather than using the traditional annual rotation of Final Four semifi-nals pairings (i.e., West vs. East, South vs. Midwest), the committee assigned the pairings during selection weekend. The top No. 1 seed’s region was assigned to meet the fourth No. 1 seed’s region and the second No. 1 seed’s region met the third No. 1 seed’s region.
Directional regional site designations (i.e., East, South, Midwest, West) were dropped. Instead, regional sites were known by the city in which the games were played (e.g., Atlanta regional).
2005 Culminating a four-year study, the committee revised the RPI formula to give additional weight to playing on the road. The new formula weighed road victories and home losses at 1.4; home victories and road losses at .6; and neutral-site victories and losses at 1.0. The new weighting system affected only Factor I of the RPI. Factor IV was eliminated.
CBS began a two-year deal with CSTV.com for exclusive Internet video streaming rights for out-of-market game coverage of the first 58 games of the tournament.
The committee revised the bracketing principles to permit two teams from the same conference to meet each other before the regional final if the conference had more than eight teams selected for the champi-onship.
Attendance at first-/second-round and regional sites was 98.4 percent of the facilities’ capacity, an all-time record. Arenas other than domes were filled to 99.9 percent of capacity, also a record.
2006 The official RPI was released to the public for the first time February 1, 2006, when the Rating Percentage Index appeared on the NCAA website: ncaasports.com.
The committee revised the bracketing principles so that if it is unable to reconcile the bracket after exhausting all possible options, it has the flexibility to permit two teams from the same conference to meet each other after the first round, if the conference has more than five participants.
2007 The committee returned to geographical regional site designations rather than identifying the sites by the host city, as it did from 2004-06. Regional sites were referred to as East, South, Midwest and West, rather than East Rutherford, San Antonio, St. Louis and San Jose.
In response to tremendous traffic resulting in 19 million video streams and five million visits in 2006, CBS Sportsline doubled its bandwidth capacity for March Madness on Demand, which offers free live Internet streams of each game of the first three rounds of the championship.
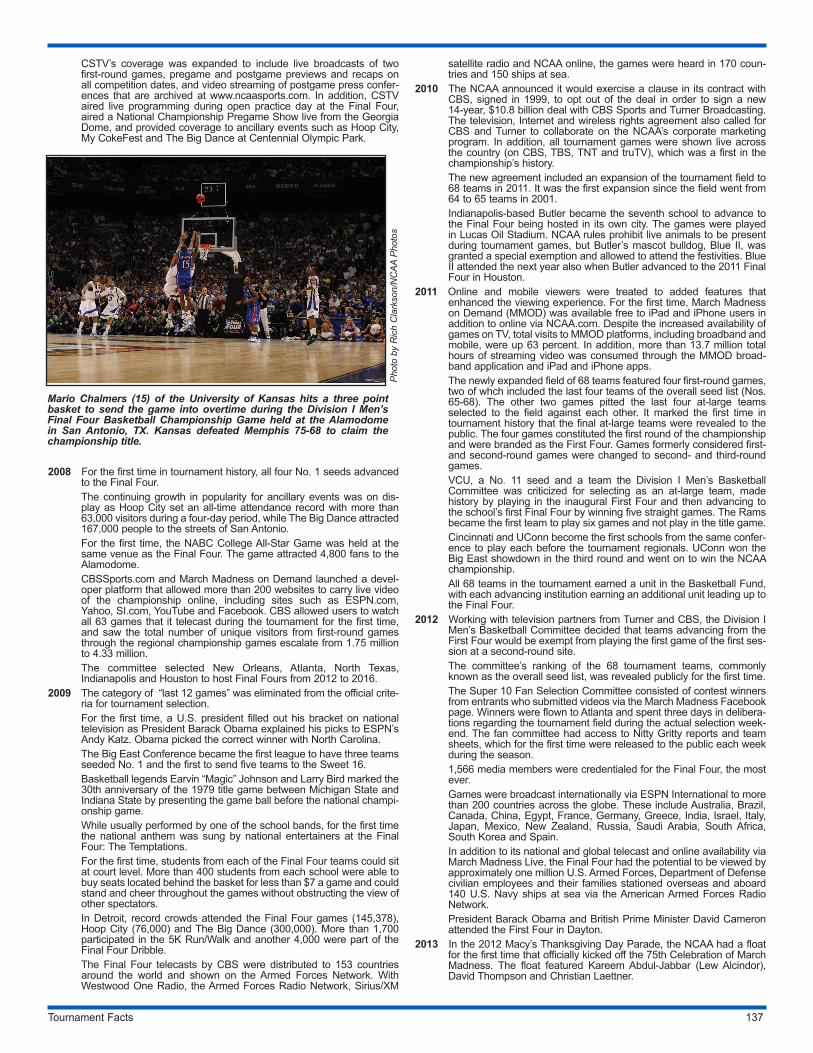
Tournament Facts 137
CSTV’s coverage was expanded to include live broadcasts of two first-round games, pregame and postgame previews and recaps on all competition dates, and video streaming of postgame press confer-ences that are archived at www.ncaasports.com. In addition, CSTV aired live programming during open practice day at the Final Four, aired a National Championship Pregame Show live from the Georgia Dome, and provided coverage to ancillary events such as Hoop City, My CokeFest and The Big Dance at Centennial Olympic Park.
2008 For the first time in tournament history, all four No. 1 seeds advanced to the Final Four.
The continuing growth in popularity for ancillary events was on dis-play as Hoop City set an all-time attendance record with more than 63,000 visitors during a four-day period, while The Big Dance attracted 167,000 people to the streets of San Antonio.
For the first time, the NABC College All-Star Game was held at the same venue as the Final Four. The game attracted 4,800 fans to the Alamodome.
CBSSports.com and March Madness on Demand launched a devel-oper platform that allowed more than 200 websites to carry live video of the championship online, including sites such as ESPN.com, Yahoo, SI.com, YouTube and Facebook. CBS allowed users to watch all 63 games that it telecast during the tournament for the first time, and saw the total number of unique visitors from first-round games through the regional championship games escalate from 1.75 million to 4.33 million.
The committee selected New Orleans, Atlanta, North Texas, Indianapolis and Houston to host Final Fours from 2012 to 2016.
2009 The category of “last 12 games” was eliminated from the official crite-ria for tournament selection.
For the first time, a U.S. president filled out his bracket on national television as President Barack Obama explained his picks to ESPN’s Andy Katz. Obama picked the correct winner with North Carolina.
The Big East Conference became the first league to have three teams seeded No. 1 and the first to send five teams to the Sweet 16.
Basketball legends Earvin “Magic” Johnson and Larry Bird marked the 30th anniversary of the 1979 title game between Michigan State and Indiana State by presenting the game ball before the national champi-onship game.
While usually performed by one of the school bands, for the first time the national anthem was sung by national entertainers at the Final Four: The Temptations.
For the first time, students from each of the Final Four teams could sit at court level. More than 400 students from each school were able to buy seats located behind the basket for less than $7 a game and could stand and cheer throughout the games without obstructing the view of other spectators.
In Detroit, record crowds attended the Final Four games (145,378), Hoop City (76,000) and The Big Dance (300,000). More than 1,700 participated in the 5K Run/Walk and another 4,000 were part of the Final Four Dribble.
The Final Four telecasts by CBS were distributed to 153 countries around the world and shown on the Armed Forces Network. With Westwood One Radio, the Armed Forces Radio Network, Sirius/XM
satellite radio and NCAA online, the games were heard in 170 coun-tries and 150 ships at sea.
2010 The NCAA announced it would exercise a clause in its contract with CBS, signed in 1999, to opt out of the deal in order to sign a new 14-year, $10.8 billion deal with CBS Sports and Turner Broadcasting. The television, Internet and wireless rights agreement also called for CBS and Turner to collaborate on the NCAA’s corporate marketing program. In addition, all tournament games were shown live across the country (on CBS, TBS, TNT and truTV), which was a first in the championship’s history.
The new agreement included an expansion of the tournament field to 68 teams in 2011. It was the first expansion since the field went from 64 to 65 teams in 2001.
Indianapolis-based Butler became the seventh school to advance to the Final Four being hosted in its own city. The games were played in Lucas Oil Stadium. NCAA rules prohibit live animals to be present during tournament games, but Butler’s mascot bulldog, Blue II, was granted a special exemption and allowed to attend the festivities. Blue II attended the next year also when Butler advanced to the 2011 Final Four in Houston.
2011 Online and mobile viewers were treated to added features that enhanced the viewing experience. For the first time, March Madness on Demand (MMOD) was available free to iPad and iPhone users in addition to online via NCAA.com. Despite the increased availability of games on TV, total visits to MMOD platforms, including broadband and mobile, were up 63 percent. In addition, more than 13.7 million total hours of streaming video was consumed through the MMOD broad-band application and iPad and iPhone apps.
The newly expanded field of 68 teams featured four first-round games, two of whch included the last four teams of the overall seed list (Nos. 65-68). The other two games pitted the last four at-large teams selected to the field against each other. It marked the first time in tournament history that the final at-large teams were revealed to the public. The four games constituted the first round of the championship and were branded as the First Four. Games formerly considered first- and second-round games were changed to second- and third-round games.
VCU, a No. 11 seed and a team the Division I Men’s Basketball Committee was criticized for selecting as an at-large team, made history by playing in the inaugural First Four and then advancing to the school’s first Final Four by winning five straight games. The Rams became the first team to play six games and not play in the title game.
Cincinnati and UConn become the first schools from the same confer-ence to play each before the tournament regionals. UConn won the Big East showdown in the third round and went on to win the NCAA championship.
All 68 teams in the tournament earned a unit in the Basketball Fund, with each advancing institution earning an additional unit leading up to the Final Four.
2012 Working with television partners from Turner and CBS, the Division I Men’s Basketball Committee decided that teams advancing from the First Four would be exempt from playing the first game of the first ses-sion at a second-round site.
The committee’s ranking of the 68 tournament teams, commonly known as the overall seed list, was revealed publicly for the first time.
The Super 10 Fan Selection Committee consisted of contest winners from entrants who submitted videos via the March Madness Facebook page. Winners were flown to Atlanta and spent three days in delibera-tions regarding the tournament field during the actual selection week-end. The fan committee had access to Nitty Gritty reports and team sheets, which for the first time were released to the public each week during the season.
1,566 media members were credentialed for the Final Four, the most ever.
Games were broadcast internationally via ESPN International to more than 200 countries across the globe. These include Australia, Brazil, Canada, China, Egypt, France, Germany, Greece, India, Israel, Italy, Japan, Mexico, New Zealand, Russia, Saudi Arabia, South Africa, South Korea and Spain.
In addition to its national and global telecast and online availability via March Madness Live, the Final Four had the potential to be viewed by approximately one million U.S. Armed Forces, Department of Defense civilian employees and their families stationed overseas and aboard 140 U.S. Navy ships at sea via the American Armed Forces Radio Network.
President Barack Obama and British Prime Minister David Cameron attended the First Four in Dayton.
2013 In the 2012 Macy’s Thanksgiving Day Parade, the NCAA had a float for the first time that officially kicked off the 75th Celebration of March Madness. The float featured Kareem Abdul-Jabbar (Lew Alcindor), David Thompson and Christian Laettner.
Phot
o by
Ric
h C
lark
son/
NC
AA P
hoto
sMario Chalmers (15) of the University of Kansas hits a three point basket to send the game into overtime during the Division I Men’s Final Four Basketball Championship Game held at the Alamodome in San Antonio, TX. Kansas defeated Memphis 75-68 to claim the championship title.
Tournament Facts 138
For the first time in history, the Division II and Division III champion-ship games were played in the same city as the Final Four. More than 6,200 fans watched Amherst defeat Mary Hardin-Baylor in the Division III game, and then better than 7,700 watched Drury rally to beat Metro State in the Division II game. The games were played at Philips Arena in downtown Atlanta.
Wichita State became the first Missouri Valley Conference school to advance to the Final Four since the 1979 Indiana State team led by Larry Bird.
The NCAA celebrated 75 years of March Madness, culminating with the selection of the top 15 players, the top team and top moment in tournament history, as chosen by fan voting on NCAA.com and a panel of experts that included former committee members, the NABC and USBWA.
The NCAA created additional courtside seating for fans at all rounds of the championship, providing fans of the participating teams, spe-cifically family and friends of the coaches and student-athletes, seats closer to the court. Military personnel were also provided with better seats, while other fans were afforded the opportunity to purchase pre-mium seating.
Before 2013, there were only six instances of a No. 15 seed defeat-ing a No. 2 seed, including two in 2012. In 2013, Florida Gulf Coast made its first tournament appearance a memorable one. The Eagles stunned Georgetown and San Diego State to become the first 15-seed to reach the Sweet 16.
For the fourth time in five years, there were 10 occurrences of a lower-seeded team defeating a higher-seeded team in the round of 64. In addition to Florida Gulf Coast’s win, one 14-seed, a 13, three 12s, an 11-seed, a 10 and two No. 9s advanced to the third round. Since the field expanded to 64 teams in 1985, the 2013 tournament marked only the second time that at least one team seeded 9th, 10th, 11th, 12th, 13th, 14th and 15th won a tournament game. The other year was 1991.
2014 The new principles allow for teams from the same conference to meet as early as the round of 32 if they only played each other once during the season, to include the conference tournament. If the teams played twice, they may not meet until the Sweet 16, and if they played three times, they may not play until the regional final. In addition, the top four teams from a conference shall be in separate regions, if they are seeded on the first four lines (top 16 seeds).
Connecticut won its fourth national title -- all since 1999 -- by becom-ing the first seventh-seeded team to capture the championship. Led by Most Outstanding Player Shabaaz Napier, the Huskies escaped Saint Joseph’s in the round of 64, winning in overtime. UConn then upset second-seeded Villanova to get to the Sweet 16, where it knocked off third-seeded Iowa St. and fourth-seeded Michigan St. to win the East Regional and reach the Final Four. In the national semifinals, the Huskies rallied from an early 12-point deficit to beat Florida, the tournament’s overall top seed. Connecticut never trailed in the title game, holding off Kentucky, 60-54 to give former player Kevin Ollie a championship in his first tournament as UConn’s head coach.
UConn was a No. 7 seed in the East Regional, while Kentucky was the No. 8 seed in the Midwest. The combined seed total (15) for the championship game was the highest in tournament history, easily breaking the record of 11 when third-seeded Connecticut beat No. 8 Butler in the 2011 championship game.
The two-session North Texas Final Four attendance totaled 158,682 fans in AT&T Stadium, setting the record for the highest ever atten-dance and surpassing the 2013 Final Four in Atlanta by 9,006 fans. This year marked the highest attended national championship game with 79,238 fans, exceeding the previous record, also Atlanta in 2013, by 4,912 fans. It also marks the highest attended semifinals in tourna-ment history with 79,444 fans, besting the previous record from the 2011 Final Four at Reliant Stadium in Houston by 4,023 fans. In total, 739,189 fans attended the 36 sessions of the 2014 Division I Men’s Basketball tournament.
A record-breaking 1,829 media credentials were issued for the Final Four.
For the first time, the national semifinals were carried on cable televi-sion as Turner’s TBS Network carried Saturday’s Final Four games. The two games (Kentucky-Wisconsin and Connecticut-Florida) were the two most viewed college basketball games in cable television his-tory, with 16.3 million watching the second game (Kentucky edging Wisconsin) and 11.7 watching the first game. Nearly 40 million people watched CBS’s telecast of the national championship game.
In addition to the record-breaking television audience, more people tuned in using NCAA March Madness Live. Across online and mobile (tablets and smart phones) platforms, the two semifinal games netted 3.8 million live streams for an increase of 76 percent over last year. The doubleheader also combined to register more than one million hours of live video consumed, up 37 percent over 2013. Over the course of the tournament, 9.9 million unique viewers (up 9 percent from 2013) streamed 70 million live video streams (up 42 percent from
2013). A total of 15.1 million live hours were watched (up 7 percent from 2013). The NCAA March Madness Live app was downloaded more than 4.5 million times. According to Social Guide, the National Semifinals tallied more than 1.8 million tweets – that were seen by nearly 200 million followers – for a 36 percent increase over last year. NCAA Final Four social media accounts saw a 39 percent growth in social media audience to approximately 1.3 million people, and recorded approximately 43.2 million impressions during the entire Final Four, including the national championship game
2015 In the fall of 2015, the committee selected the following future Final Four sites: Phoenix (2017), San Antonio (2018), Minneapolis (2019), Atlanta (2020) and Indianapolis (2021). The committee also announced preliminary round sites for the 2016-18 championships.
Starting with the 2016 tournament, the first weekend of the tournament will be referred to as the first- and second-rounds, rather than the second and third. The four games that start the tournament will still be known as the First Four, or opening round.
For the second consecutive year, a record-breaking number of cre-dentials were issued for the Final Four. A total of 2,069 media creden-tials, including those for television partners from Turner and CBS, were issued in Indianapolis.
Duke Coach Mike Krzyzewski broke a tie with Adolph Rupp to move into second place with five national championships. John Wooden won 10 with UCLA to remain the all-time leader. Coach Krzyzewski advanced to the Final Four for the 12th time, tying Coach Wooden for the most all-time, and appeared in his 31st NCAA tournament, tying Jim Boeheim for the most all-time.
Duke guard Tyus Jones became just the fifth freshman to win Most Outstanding Player at the Final Four, joining Arnie Ferrin of Utah in 1944, Pervis Ellison of Louisville in 1986, Carmelo Anthony of Syracuse (2003) and Anthony Davis of Kentucky (2012).
For the second straight year, a team entered the tournament undefeat-ed. Kentucky’s record was unblemished through 34 regular-season and Southeastern Conference tournament games, and the Wildcats’ wins in their first four NCAA tournament games allowed them to become the first team since the 1991 UNLV squad to enter the Final Four without a loss.
Wisconsin and Kentucky met in the national semifinals for the second straight year, marking the first time since 1991 that a Final Four game was a rematch from the previous year’s Final Four. Duke and UNLV met in the championship game in 1990 and in the semifinals the fol-lowing year.
Wisconsin All-American Frank Kaminsky recorded a double-double in both Final Four games, becoming the first player to do that since Carmelo Anthony in 2003.
Michigan State and Louisville needed overtime to decide their East Regional championship game. It was the 200th March Madness game to go to overtime.
Thursday, March 19 was a memorable day as for the first time in tournament history, five March Madness games were decided by one point: UAB 60, Iowa St. 59; Georgia St. 57, Baylor 56; UCLA 60, SMU 59; Cincinnati 66, Purdue 65; and North Carolina St. 66, LSU 65.
March Madness Live had another record-setting year, with more than 80 million live stream starts resulting in more than 17 million hours of tournament games watched on the app. On the social media front, there were more than 11 million social engagements resulting in better than 352 million impressions.
2016 The national championship game featured a buzzer-beater for the first time since 1983, as Villanova’s Kris Jenkins drilled a three-pointer just before the clock hit zero to lift the Wildcats to a 77-74 victory over North Carolina. It marked Villanova’s second national championship and first since 1985.
Villanova set a Final Four record for shooting, making 63 of 97 shots (64.9 percent) in its wins over Oklahoma and North Carolina at NRG Stadium. The Wildcats’ 71.4 percent performance in a record-setting 44-point win over the Sooners in Saturday’s first semifinal was the second-highest shooting percentage in Final Four history, trailing only Villanova’s 78.6 clip in the 1985 title game versus Georgetown.
North Carolina advanced to the Final Four for the 19th time in school history, the most by any Division I school.
Syracuse became the fourth double-digit seed since seeding began in 1979 to reach the Final Four. 11th-seeded LSU was the first to do it, in 1986, and George Mason (2006) and VCU (2011) matched the feat, also as No. 11 seeds.
Syracuse became the 12th institution to send both its men’s and women’s teams to the Final Four, joining Georgia in 1983, Duke in 1999, Oklahoma in 2002, Texas in 2003, Michigan St. in 2005, LSU in 2006, Louisville in 2013 and UConn in 2004, 2009, 2011 and 2014.
Lon Kruger guided Oklahoma to the Final Four, 22 years after leading Florida to the 1994 Final Four. It is the second-longest gap between
Tournament Facts 139
Final Four appearances for a coach, trailing only Ray Meyer, who led DePaul to the 1943 and 1979 Final Fours.
UNI experienced an extreme high in its first-round win over Texas, as Paul Jesperson nailed a half-court shot at the buzzer to lift the Panthers to a 75-72 win. Two days later against Texas A&M, UNI had a 12-point lead with 35 seconds remaining, but the Aggies rallied to force overtime. A&M eventually won in double overtime, 92-88, mark-ing the largest comeback in the final minute in the history of men’s college basketball.
The Atlantic Coast Conference set a record by sending six teams to the Sweet 16 (North Carolina, Syracuse, Virginia, Notre Dame, Duke and Miami).
A record 10 double-digit seeds (two 10s, three 11s, two 12s, a 13, a 14 and a 15) won first-round games, breaking the record of nine set in 2001 and 2012. Hawaii, Stephen F. Austin and Middle Tennessee all won on March 18, marking the first day featuring wins by teams seeded 13th, 14th and 15th.
More than ever before, fans tuned in using the NCAA March Madness Live app. Across online platforms, tablets and smart phones, NCAA March Madness Live netted 3.4 million live video streams for the national title game, which resulted in 1.1 million live hours of video consumption, a 16 percent increase over last year and an all-time record for an individual game during the NCAA tournament. With 18.1 million live hours, the tournament also generated more video con-sumption than any other tournament.
Turner Sports’ exclusive presentation of the national championship across TBS, TNT and truTV averaged 17.8 million viewers and a 13.2 household coverage rating/10.6 U.S. household rating. Viewership peaked at an average 22.3 million viewers in the final minutes of the game. The Villanova University-University of North Carolina, Chapel Hill, game became the second-most-viewed college basketball game of all time on a cable television network, following only the University of Wisconsin-Madison’s defeat of the University of Kentucky in the 2015 semifinals, which ended Kentucky’s perfect season. The champion-ship game was also the most viewed event of any kind on Sling TV. Beyond the national reach, ESPN International broadcast the games to 188 countries and territories, marking an increase of eight countries from the previous year.
The national championship game generated 56 million impressions across March Madness social media accounts, up 112 percent over last year. Video consumption for social media was also up with 8 mil-lion views overall, more than five times the volume of video for last year’s championship game.
The two-session Final Four attendance totaled 149,845, the second-highest attendance in Men’s Final Four history. The championship game attendance of 74,340 is also the second-highest in champion-ship game history. The semifinals round marked an NRG Stadium attendance record with 75,505 fans.
2017 With the Final Four in the western part of the country for the first time since 1995, two Pacific time zone teams (Gonzaga and Oregon) advanced to Phoenix, marking the first time ever two teams from the west coast made it to the Final Four. It was only the sixth time ever that the Final Four featured more than one team from the Pacific or Mountain time zones.
The three Final Four games were decided by a total of 11 points, which tied for the second smallest combined margin ever, behind the 10 in 1950 and 1982.
Consistent with the increased scoring trends seen during the regular season, all four Final Four teams scored at least 70 points in the national semifinals. It was the first time that had happened in 25 years.
The Southeastern Conference sent three teams (South Carolina, Kentucky and Florida) to the Elite 8, marking the first time the league accomplished that since 1986.
For only the second time since tournament expansion in 1985, all 16 teams seeded on the first four lines advanced to the Sweet 16. 2014 was the other occurrence.
Xavier became just the second No. 11 seed ever to beat teams seeded sixth, third and second in its region to advance to the Elite 8. The 1986 LSU team was the other.
A total of 176 countries carried the Final Four, including 3.22 million viewers in China. Westwood One also carried the first-ever Spanish radio broadcast in Final Four history. Turner Sports and CBS Sports’ exclusive coverage of the 2017 NCAA Division I Men’s Basketball Championship delivered huge audiences across all platforms – televi-sion, digital and social. The 2017 NCAA Tournament on TBS, CBS, TNT and truTV was the second most-watched in 23 years (1994), averaging 10.827 million viewers, which is also up +16% from 2016 (9.373 million viewers). The National Championship was watched by an average of 22.998 million viewers, up +30% from last year. The game peaked with 26.105 million viewers from 11:15-11:30 p.m. ET.
Additionally, NCAA March Madness Live netted a record-setting 98 million live video streams during the NCAA Tournament, up +33% over last year. The national championship game garnered 4.4 million live video streams, an all-time record for the title game. Official March Madness social media handles garnered over 74 million engagements throughout the NCAA Tournament, a 42% increase over last year.
In venue, the second-largest crowds in Final Four history attended the semifinals (77,612) and championship game (76,168). In addition, a record 2,201 media credentials were issued.
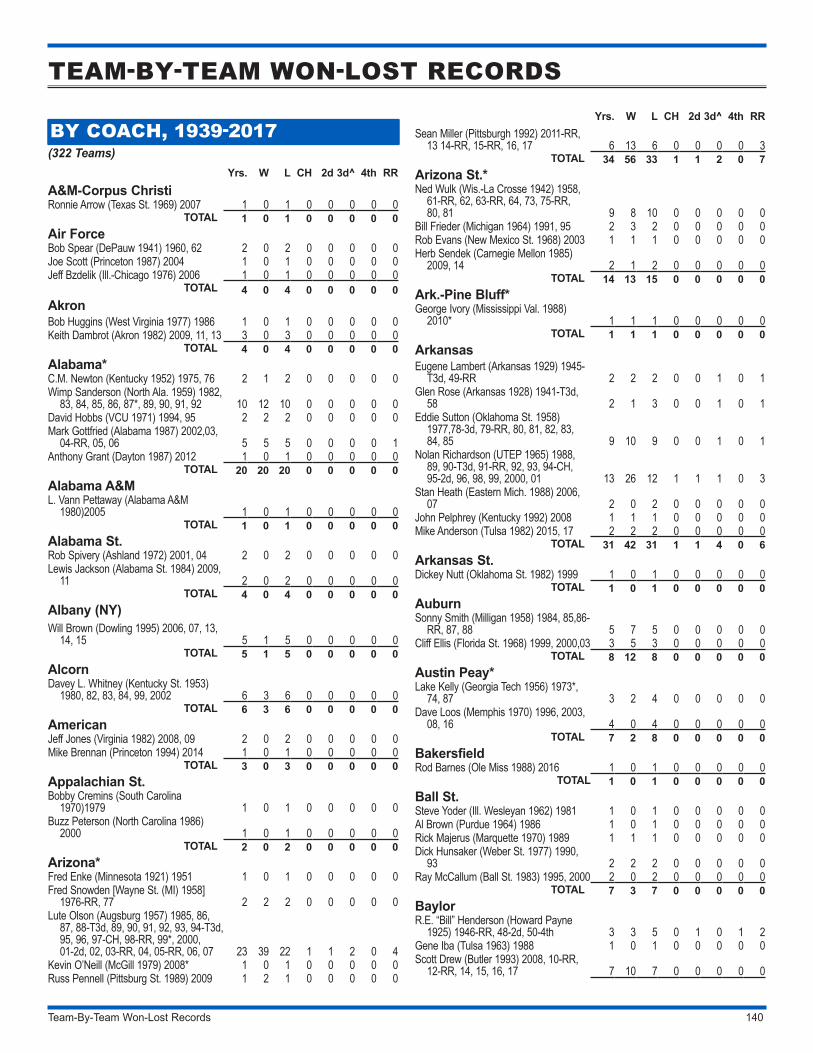
Team-By-Team Won-Lost Records 140
TEAM-BY-TEAM WON-LOST RECORDS
BY COACH, 1939-2017(322 Teams)
Yrs. W L CH 2d 3d^ 4th RRA&M-Corpus ChristiRonnie Arrow (Texas St. 1969) 2007 1 0 1 0 0 0 0 0
TOTAL 1 0 1 0 0 0 0 0Air ForceBob Spear (DePauw 1941) 1960, 62 2 0 2 0 0 0 0 0Joe Scott (Princeton 1987) 2004 1 0 1 0 0 0 0 0Jeff Bzdelik (Ill.-Chicago 1976) 2006 1 0 1 0 0 0 0 0
TOTAL 4 0 4 0 0 0 0 0AkronBob Huggins (West Virginia 1977) 1986 1 0 1 0 0 0 0 0Keith Dambrot (Akron 1982) 2009, 11, 13 3 0 3 0 0 0 0 0
TOTAL 4 0 4 0 0 0 0 0Alabama*C.M. Newton (Kentucky 1952) 1975, 76 2 1 2 0 0 0 0 0Wimp Sanderson (North Ala. 1959) 1982,
83, 84, 85, 86, 87*, 89, 90, 91, 92 10 12 10 0 0 0 0 0David Hobbs (VCU 1971) 1994, 95 2 2 2 0 0 0 0 0Mark Gottfried (Alabama 1987) 2002,03,
04-RR, 05, 06 5 5 5 0 0 0 0 1Anthony Grant (Dayton 1987) 2012 1 0 1 0 0 0 0 0
TOTAL 20 20 20 0 0 0 0 0Alabama A&ML. Vann Pettaway (Alabama A&M
1980)2005 1 0 1 0 0 0 0 0TOTAL 1 0 1 0 0 0 0 0
Alabama St.Rob Spivery (Ashland 1972) 2001, 04 2 0 2 0 0 0 0 0Lewis Jackson (Alabama St. 1984) 2009,
11 2 0 2 0 0 0 0 0TOTAL 4 0 4 0 0 0 0 0
Albany (NY)Will Brown (Dowling 1995) 2006, 07, 13,
14, 15 5 1 5 0 0 0 0 0TOTAL 5 1 5 0 0 0 0 0
AlcornDavey L. Whitney (Kentucky St. 1953)
1980, 82, 83, 84, 99, 2002 6 3 6 0 0 0 0 0TOTAL 6 3 6 0 0 0 0 0
AmericanJeff Jones (Virginia 1982) 2008, 09 2 0 2 0 0 0 0 0Mike Brennan (Princeton 1994) 2014 1 0 1 0 0 0 0 0
TOTAL 3 0 3 0 0 0 0 0Appalachian St.Bobby Cremins (South Carolina
1970)1979 1 0 1 0 0 0 0 0Buzz Peterson (North Carolina 1986)
2000 1 0 1 0 0 0 0 0TOTAL 2 0 2 0 0 0 0 0
Arizona*Fred Enke (Minnesota 1921) 1951 1 0 1 0 0 0 0 0Fred Snowden [Wayne St. (MI) 1958]
1976-RR, 77 2 2 2 0 0 0 0 0Lute Olson (Augsburg 1957) 1985, 86,
87, 88-T3d, 89, 90, 91, 92, 93, 94-T3d, 95, 96, 97-CH, 98-RR, 99*, 2000, 01-2d, 02, 03-RR, 04, 05-RR, 06, 07 23 39 22 1 1 2 0 4
Kevin O’Neill (McGill 1979) 2008* 1 0 1 0 0 0 0 0Russ Pennell (Pittsburg St. 1989) 2009 1 2 1 0 0 0 0 0
Yrs. W L CH 2d 3d^ 4th RRSean Miller (Pittsburgh 1992) 2011-RR,
13 14-RR, 15-RR, 16, 17 6 13 6 0 0 0 0 3TOTAL 34 56 33 1 1 2 0 7
Arizona St.*Ned Wulk (Wis.-La Crosse 1942) 1958,
61-RR, 62, 63-RR, 64, 73, 75-RR, 80, 81 9 8 10 0 0 0 0 0
Bill Frieder (Michigan 1964) 1991, 95 2 3 2 0 0 0 0 0Rob Evans (New Mexico St. 1968) 2003 1 1 1 0 0 0 0 0Herb Sendek (Carnegie Mellon 1985)
2009, 14 2 1 2 0 0 0 0 0TOTAL 14 13 15 0 0 0 0 0
Ark.-Pine Bluff*George Ivory (Mississippi Val. 1988)
2010* 1 1 1 0 0 0 0 0TOTAL 1 1 1 0 0 0 0 0
ArkansasEugene Lambert (Arkansas 1929) 1945-
T3d, 49-RR 2 2 2 0 0 1 0 1Glen Rose (Arkansas 1928) 1941-T3d,
58 2 1 3 0 0 1 0 1Eddie Sutton (Oklahoma St. 1958)
1977,78-3d, 79-RR, 80, 81, 82, 83, 84, 85 9 10 9 0 0 1 0 1
Nolan Richardson (UTEP 1965) 1988, 89, 90-T3d, 91-RR, 92, 93, 94-CH, 95-2d, 96, 98, 99, 2000, 01 13 26 12 1 1 1 0 3
Stan Heath (Eastern Mich. 1988) 2006, 07 2 0 2 0 0 0 0 0
John Pelphrey (Kentucky 1992) 2008 1 1 1 0 0 0 0 0Mike Anderson (Tulsa 1982) 2015, 17 2 2 2 0 0 0 0 0
TOTAL 31 42 31 1 1 4 0 6Arkansas St.Dickey Nutt (Oklahoma St. 1982) 1999 1 0 1 0 0 0 0 0
TOTAL 1 0 1 0 0 0 0 0AuburnSonny Smith (Milligan 1958) 1984, 85,86-
RR, 87, 88 5 7 5 0 0 0 0 0Cliff Ellis (Florida St. 1968) 1999, 2000,03 3 5 3 0 0 0 0 0
TOTAL 8 12 8 0 0 0 0 0Austin Peay*Lake Kelly (Georgia Tech 1956) 1973*,
74, 87 3 2 4 0 0 0 0 0Dave Loos (Memphis 1970) 1996, 2003,
08, 16 4 0 4 0 0 0 0 0TOTAL 7 2 8 0 0 0 0 0
BakersfieldRod Barnes (Ole Miss 1988) 2016 1 0 1 0 0 0 0 0
TOTAL 1 0 1 0 0 0 0 0Ball St. Steve Yoder (Ill. Wesleyan 1962) 1981 1 0 1 0 0 0 0 0Al Brown (Purdue 1964) 1986 1 0 1 0 0 0 0 0Rick Majerus (Marquette 1970) 1989 1 1 1 0 0 0 0 0Dick Hunsaker (Weber St. 1977) 1990,
93 2 2 2 0 0 0 0 0Ray McCallum (Ball St. 1983) 1995, 2000 2 0 2 0 0 0 0 0
TOTAL 7 3 7 0 0 0 0 0BaylorR.E. “Bill” Henderson (Howard Payne
1925) 1946-RR, 48-2d, 50-4th 3 3 5 0 1 0 1 2Gene Iba (Tulsa 1963) 1988 1 0 1 0 0 0 0 0Scott Drew (Butler 1993) 2008, 10-RR,
12-RR, 14, 15, 16, 17 7 10 7 0 0 0 0 0
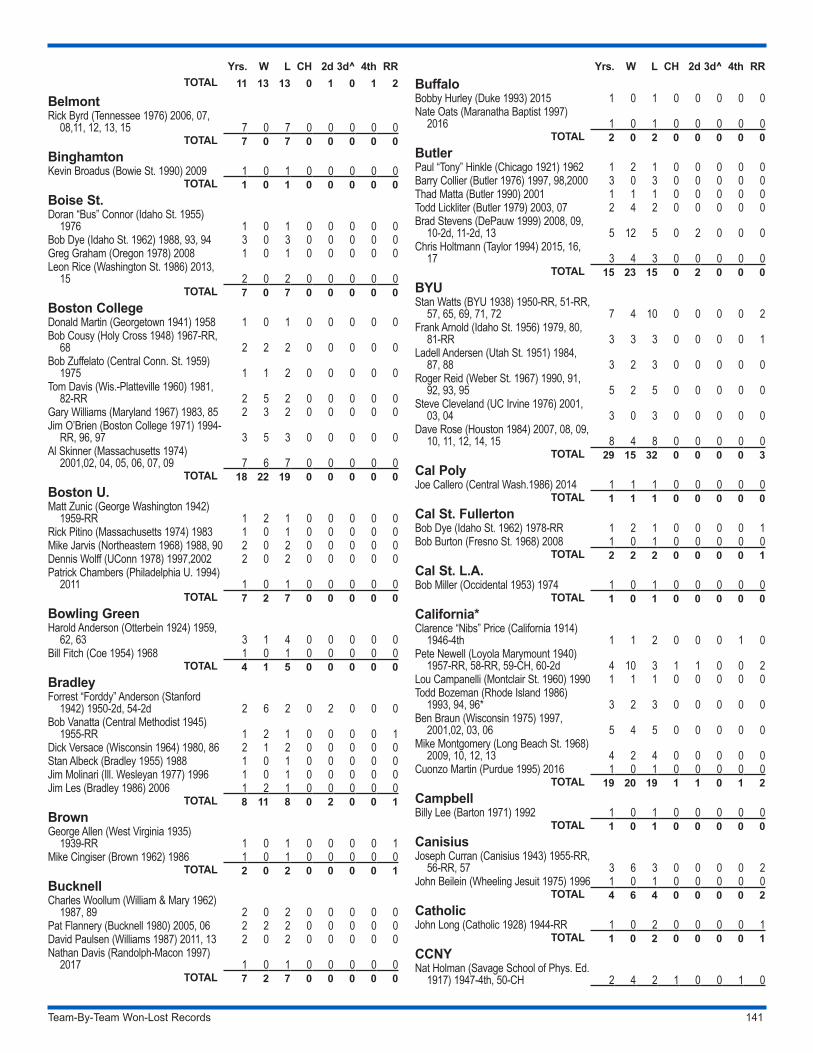
Team-By-Team Won-Lost Records 141
Yrs. W L CH 2d 3d^ 4th RRTOTAL 11 13 13 0 1 0 1 2
BelmontRick Byrd (Tennessee 1976) 2006, 07,
08,11, 12, 13, 15 7 0 7 0 0 0 0 0TOTAL 7 0 7 0 0 0 0 0
BinghamtonKevin Broadus (Bowie St. 1990) 2009 1 0 1 0 0 0 0 0
TOTAL 1 0 1 0 0 0 0 0Boise St.Doran “Bus” Connor (Idaho St. 1955)
1976 1 0 1 0 0 0 0 0Bob Dye (Idaho St. 1962) 1988, 93, 94 3 0 3 0 0 0 0 0Greg Graham (Oregon 1978) 2008 1 0 1 0 0 0 0 0Leon Rice (Washington St. 1986) 2013,
15 2 0 2 0 0 0 0 0TOTAL 7 0 7 0 0 0 0 0
Boston CollegeDonald Martin (Georgetown 1941) 1958 1 0 1 0 0 0 0 0Bob Cousy (Holy Cross 1948) 1967-RR,
68 2 2 2 0 0 0 0 0Bob Zuffelato (Central Conn. St. 1959)
1975 1 1 2 0 0 0 0 0Tom Davis (Wis.-Platteville 1960) 1981,
82-RR 2 5 2 0 0 0 0 0Gary Williams (Maryland 1967) 1983, 85 2 3 2 0 0 0 0 0Jim O’Brien (Boston College 1971) 1994-
RR, 96, 97 3 5 3 0 0 0 0 0Al Skinner (Massachusetts 1974)
2001,02, 04, 05, 06, 07, 09 7 6 7 0 0 0 0 0TOTAL 18 22 19 0 0 0 0 0
Boston U.Matt Zunic (George Washington 1942)
1959-RR 1 2 1 0 0 0 0 0Rick Pitino (Massachusetts 1974) 1983 1 0 1 0 0 0 0 0Mike Jarvis (Northeastern 1968) 1988, 90 2 0 2 0 0 0 0 0Dennis Wolff (UConn 1978) 1997,2002 2 0 2 0 0 0 0 0Patrick Chambers (Philadelphia U. 1994)
2011 1 0 1 0 0 0 0 0TOTAL 7 2 7 0 0 0 0 0
Bowling GreenHarold Anderson (Otterbein 1924) 1959,
62, 63 3 1 4 0 0 0 0 0Bill Fitch (Coe 1954) 1968 1 0 1 0 0 0 0 0
TOTAL 4 1 5 0 0 0 0 0BradleyForrest “Forddy” Anderson (Stanford
1942) 1950-2d, 54-2d 2 6 2 0 2 0 0 0Bob Vanatta (Central Methodist 1945)
1955-RR 1 2 1 0 0 0 0 1Dick Versace (Wisconsin 1964) 1980, 86 2 1 2 0 0 0 0 0Stan Albeck (Bradley 1955) 1988 1 0 1 0 0 0 0 0Jim Molinari (Ill. Wesleyan 1977) 1996 1 0 1 0 0 0 0 0Jim Les (Bradley 1986) 2006 1 2 1 0 0 0 0 0
TOTAL 8 11 8 0 2 0 0 1BrownGeorge Allen (West Virginia 1935)
1939-RR 1 0 1 0 0 0 0 1Mike Cingiser (Brown 1962) 1986 1 0 1 0 0 0 0 0
TOTAL 2 0 2 0 0 0 0 1BucknellCharles Woollum (William & Mary 1962)
1987, 89 2 0 2 0 0 0 0 0Pat Flannery (Bucknell 1980) 2005, 06 2 2 2 0 0 0 0 0David Paulsen (Williams 1987) 2011, 13 2 0 2 0 0 0 0 0Nathan Davis (Randolph-Macon 1997)
2017 1 0 1 0 0 0 0 0TOTAL 7 2 7 0 0 0 0 0
Yrs. W L CH 2d 3d^ 4th RRBuffaloBobby Hurley (Duke 1993) 2015 1 0 1 0 0 0 0 0Nate Oats (Maranatha Baptist 1997)
2016 1 0 1 0 0 0 0 0TOTAL 2 0 2 0 0 0 0 0
ButlerPaul “Tony” Hinkle (Chicago 1921) 1962 1 2 1 0 0 0 0 0Barry Collier (Butler 1976) 1997, 98,2000 3 0 3 0 0 0 0 0Thad Matta (Butler 1990) 2001 1 1 1 0 0 0 0 0Todd Lickliter (Butler 1979) 2003, 07 2 4 2 0 0 0 0 0Brad Stevens (DePauw 1999) 2008, 09,
10-2d, 11-2d, 13 5 12 5 0 2 0 0 0Chris Holtmann (Taylor 1994) 2015, 16,
17 3 4 3 0 0 0 0 0TOTAL 15 23 15 0 2 0 0 0
BYUStan Watts (BYU 1938) 1950-RR, 51-RR,
57, 65, 69, 71, 72 7 4 10 0 0 0 0 2Frank Arnold (Idaho St. 1956) 1979, 80,
81-RR 3 3 3 0 0 0 0 1Ladell Andersen (Utah St. 1951) 1984,
87, 88 3 2 3 0 0 0 0 0Roger Reid (Weber St. 1967) 1990, 91,
92, 93, 95 5 2 5 0 0 0 0 0Steve Cleveland (UC Irvine 1976) 2001,
03, 04 3 0 3 0 0 0 0 0Dave Rose (Houston 1984) 2007, 08, 09,
10, 11, 12, 14, 15 8 4 8 0 0 0 0 0TOTAL 29 15 32 0 0 0 0 3
Cal PolyJoe Callero (Central Wash.1986) 2014 1 1 1 0 0 0 0 0
TOTAL 1 1 1 0 0 0 0 0Cal St. FullertonBob Dye (Idaho St. 1962) 1978-RR 1 2 1 0 0 0 0 1Bob Burton (Fresno St. 1968) 2008 1 0 1 0 0 0 0 0
TOTAL 2 2 2 0 0 0 0 1Cal St. L.A.Bob Miller (Occidental 1953) 1974 1 0 1 0 0 0 0 0
TOTAL 1 0 1 0 0 0 0 0California*Clarence “Nibs” Price (California 1914)
1946-4th 1 1 2 0 0 0 1 0Pete Newell (Loyola Marymount 1940)
1957-RR, 58-RR, 59-CH, 60-2d 4 10 3 1 1 0 0 2Lou Campanelli (Montclair St. 1960) 1990 1 1 1 0 0 0 0 0Todd Bozeman (Rhode Island 1986)
1993, 94, 96* 3 2 3 0 0 0 0 0Ben Braun (Wisconsin 1975) 1997,
2001,02, 03, 06 5 4 5 0 0 0 0 0Mike Montgomery (Long Beach St. 1968)
2009, 10, 12, 13 4 2 4 0 0 0 0 0Cuonzo Martin (Purdue 1995) 2016 1 0 1 0 0 0 0 0
TOTAL 19 20 19 1 1 0 1 2CampbellBilly Lee (Barton 1971) 1992 1 0 1 0 0 0 0 0
TOTAL 1 0 1 0 0 0 0 0CanisiusJoseph Curran (Canisius 1943) 1955-RR,
56-RR, 57 3 6 3 0 0 0 0 2John Beilein (Wheeling Jesuit 1975) 1996 1 0 1 0 0 0 0 0
TOTAL 4 6 4 0 0 0 0 2CatholicJohn Long (Catholic 1928) 1944-RR 1 0 2 0 0 0 0 1
TOTAL 1 0 2 0 0 0 0 1CCNYNat Holman (Savage School of Phys. Ed.
1917) 1947-4th, 50-CH 2 4 2 1 0 0 1 0
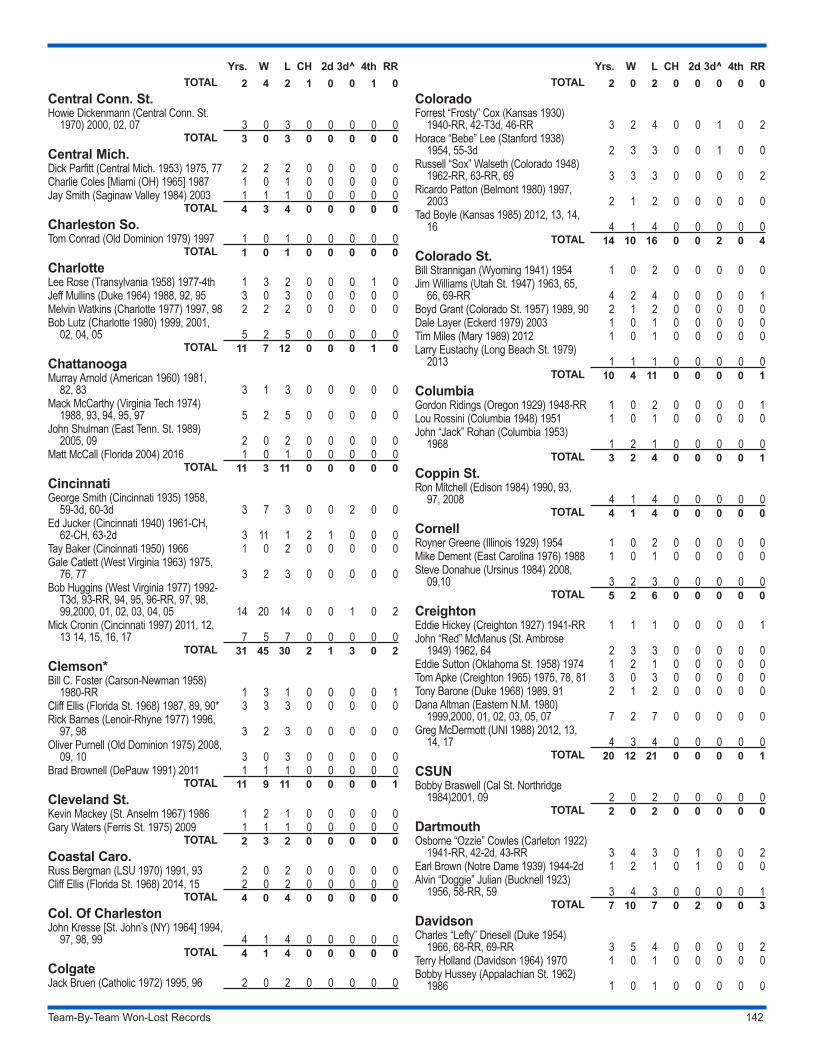
Team-By-Team Won-Lost Records 142
Yrs. W L CH 2d 3d^ 4th RRTOTAL 2 4 2 1 0 0 1 0
Central Conn. St.Howie Dickenmann (Central Conn. St.
1970) 2000, 02, 07 3 0 3 0 0 0 0 0TOTAL 3 0 3 0 0 0 0 0
Central Mich.Dick Parfitt (Central Mich. 1953) 1975, 77 2 2 2 0 0 0 0 0Charlie Coles [Miami (OH) 1965] 1987 1 0 1 0 0 0 0 0Jay Smith (Saginaw Valley 1984) 2003 1 1 1 0 0 0 0 0
TOTAL 4 3 4 0 0 0 0 0Charleston So.Tom Conrad (Old Dominion 1979) 1997 1 0 1 0 0 0 0 0
TOTAL 1 0 1 0 0 0 0 0CharlotteLee Rose (Transylvania 1958) 1977-4th 1 3 2 0 0 0 1 0Jeff Mullins (Duke 1964) 1988, 92, 95 3 0 3 0 0 0 0 0Melvin Watkins (Charlotte 1977) 1997, 98 2 2 2 0 0 0 0 0Bob Lutz (Charlotte 1980) 1999, 2001,
02, 04, 05 5 2 5 0 0 0 0 0TOTAL 11 7 12 0 0 0 1 0
ChattanoogaMurray Arnold (American 1960) 1981,
82, 83 3 1 3 0 0 0 0 0Mack McCarthy (Virginia Tech 1974)
1988, 93, 94, 95, 97 5 2 5 0 0 0 0 0John Shulman (East Tenn. St. 1989)
2005, 09 2 0 2 0 0 0 0 0Matt McCall (Florida 2004) 2016 1 0 1 0 0 0 0 0
TOTAL 11 3 11 0 0 0 0 0CincinnatiGeorge Smith (Cincinnati 1935) 1958,
59-3d, 60-3d 3 7 3 0 0 2 0 0Ed Jucker (Cincinnati 1940) 1961-CH,
62-CH, 63-2d 3 11 1 2 1 0 0 0Tay Baker (Cincinnati 1950) 1966 1 0 2 0 0 0 0 0Gale Catlett (West Virginia 1963) 1975,
76, 77 3 2 3 0 0 0 0 0Bob Huggins (West Virginia 1977) 1992-
T3d, 93-RR, 94, 95, 96-RR, 97, 98, 99,2000, 01, 02, 03, 04, 05 14 20 14 0 0 1 0 2
Mick Cronin (Cincinnati 1997) 2011, 12, 13 14, 15, 16, 17 7 5 7 0 0 0 0 0
TOTAL 31 45 30 2 1 3 0 2Clemson*Bill C. Foster (Carson-Newman 1958)
1980-RR 1 3 1 0 0 0 0 1Cliff Ellis (Florida St. 1968) 1987, 89, 90* 3 3 3 0 0 0 0 0Rick Barnes (Lenoir-Rhyne 1977) 1996,
97, 98 3 2 3 0 0 0 0 0Oliver Purnell (Old Dominion 1975) 2008,
09, 10 3 0 3 0 0 0 0 0Brad Brownell (DePauw 1991) 2011 1 1 1 0 0 0 0 0
TOTAL 11 9 11 0 0 0 0 1Cleveland St.Kevin Mackey (St. Anselm 1967) 1986 1 2 1 0 0 0 0 0Gary Waters (Ferris St. 1975) 2009 1 1 1 0 0 0 0 0
TOTAL 2 3 2 0 0 0 0 0Coastal Caro.Russ Bergman (LSU 1970) 1991, 93 2 0 2 0 0 0 0 0Cliff Ellis (Florida St. 1968) 2014, 15 2 0 2 0 0 0 0 0
TOTAL 4 0 4 0 0 0 0 0Col. Of CharlestonJohn Kresse [St. John’s (NY) 1964] 1994,
97, 98, 99 4 1 4 0 0 0 0 0TOTAL 4 1 4 0 0 0 0 0
ColgateJack Bruen (Catholic 1972) 1995, 96 2 0 2 0 0 0 0 0
Yrs. W L CH 2d 3d^ 4th RRTOTAL 2 0 2 0 0 0 0 0
ColoradoForrest “Frosty” Cox (Kansas 1930)
1940-RR, 42-T3d, 46-RR 3 2 4 0 0 1 0 2Horace “Bebe” Lee (Stanford 1938)
1954, 55-3d 2 3 3 0 0 1 0 0Russell “Sox” Walseth (Colorado 1948)
1962-RR, 63-RR, 69 3 3 3 0 0 0 0 2Ricardo Patton (Belmont 1980) 1997,
2003 2 1 2 0 0 0 0 0Tad Boyle (Kansas 1985) 2012, 13, 14,
16 4 1 4 0 0 0 0 0TOTAL 14 10 16 0 0 2 0 4
Colorado St.Bill Strannigan (Wyoming 1941) 1954 1 0 2 0 0 0 0 0Jim Williams (Utah St. 1947) 1963, 65,
66, 69-RR 4 2 4 0 0 0 0 1Boyd Grant (Colorado St. 1957) 1989, 90 2 1 2 0 0 0 0 0Dale Layer (Eckerd 1979) 2003 1 0 1 0 0 0 0 0Tim Miles (Mary 1989) 2012 1 0 1 0 0 0 0 0Larry Eustachy (Long Beach St. 1979)
2013 1 1 1 0 0 0 0 0TOTAL 10 4 11 0 0 0 0 1
ColumbiaGordon Ridings (Oregon 1929) 1948-RR 1 0 2 0 0 0 0 1Lou Rossini (Columbia 1948) 1951 1 0 1 0 0 0 0 0John “Jack” Rohan (Columbia 1953)
1968 1 2 1 0 0 0 0 0TOTAL 3 2 4 0 0 0 0 1
Coppin St.Ron Mitchell (Edison 1984) 1990, 93,
97, 2008 4 1 4 0 0 0 0 0TOTAL 4 1 4 0 0 0 0 0
CornellRoyner Greene (Illinois 1929) 1954 1 0 2 0 0 0 0 0Mike Dement (East Carolina 1976) 1988 1 0 1 0 0 0 0 0Steve Donahue (Ursinus 1984) 2008,
09,10 3 2 3 0 0 0 0 0TOTAL 5 2 6 0 0 0 0 0
CreightonEddie Hickey (Creighton 1927) 1941-RR 1 1 1 0 0 0 0 1John “Red” McManus (St. Ambrose
1949) 1962, 64 2 3 3 0 0 0 0 0Eddie Sutton (Oklahoma St. 1958) 1974 1 2 1 0 0 0 0 0Tom Apke (Creighton 1965) 1975, 78, 81 3 0 3 0 0 0 0 0Tony Barone (Duke 1968) 1989, 91 2 1 2 0 0 0 0 0Dana Altman (Eastern N.M. 1980)
1999,2000, 01, 02, 03, 05, 07 7 2 7 0 0 0 0 0Greg McDermott (UNI 1988) 2012, 13,
14, 17 4 3 4 0 0 0 0 0TOTAL 20 12 21 0 0 0 0 1
CSUNBobby Braswell (Cal St. Northridge
1984)2001, 09 2 0 2 0 0 0 0 0TOTAL 2 0 2 0 0 0 0 0
DartmouthOsborne “Ozzie” Cowles (Carleton 1922)
1941-RR, 42-2d, 43-RR 3 4 3 0 1 0 0 2Earl Brown (Notre Dame 1939) 1944-2d 1 2 1 0 1 0 0 0Alvin “Doggie” Julian (Bucknell 1923)
1956, 58-RR, 59 3 4 3 0 0 0 0 1TOTAL 7 10 7 0 2 0 0 3
DavidsonCharles “Lefty” Driesell (Duke 1954)
1966, 68-RR, 69-RR 3 5 4 0 0 0 0 2Terry Holland (Davidson 1964) 1970 1 0 1 0 0 0 0 0Bobby Hussey (Appalachian St. 1962)
1986 1 0 1 0 0 0 0 0
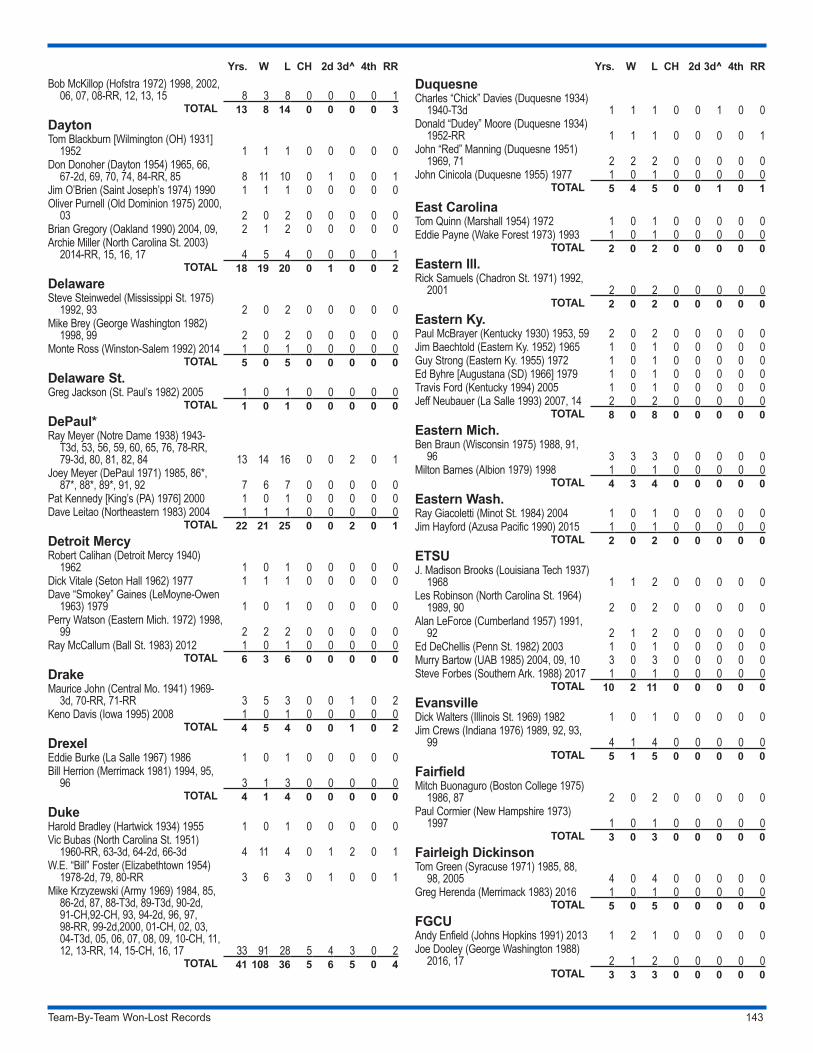
Team-By-Team Won-Lost Records 143
Yrs. W L CH 2d 3d^ 4th RRBob McKillop (Hofstra 1972) 1998, 2002,
06, 07, 08-RR, 12, 13, 15 8 3 8 0 0 0 0 1TOTAL 13 8 14 0 0 0 0 3
DaytonTom Blackburn [Wilmington (OH) 1931]
1952 1 1 1 0 0 0 0 0Don Donoher (Dayton 1954) 1965, 66,
67-2d, 69, 70, 74, 84-RR, 85 8 11 10 0 1 0 0 1Jim O’Brien (Saint Joseph’s 1974) 1990 1 1 1 0 0 0 0 0Oliver Purnell (Old Dominion 1975) 2000,
03 2 0 2 0 0 0 0 0Brian Gregory (Oakland 1990) 2004, 09, 2 1 2 0 0 0 0 0Archie Miller (North Carolina St. 2003)
2014-RR, 15, 16, 17 4 5 4 0 0 0 0 1TOTAL 18 19 20 0 1 0 0 2
DelawareSteve Steinwedel (Mississippi St. 1975)
1992, 93 2 0 2 0 0 0 0 0Mike Brey (George Washington 1982)
1998, 99 2 0 2 0 0 0 0 0Monte Ross (Winston-Salem 1992) 2014 1 0 1 0 0 0 0 0
TOTAL 5 0 5 0 0 0 0 0Delaware St.Greg Jackson (St. Paul’s 1982) 2005 1 0 1 0 0 0 0 0
TOTAL 1 0 1 0 0 0 0 0DePaul*Ray Meyer (Notre Dame 1938) 1943-
T3d, 53, 56, 59, 60, 65, 76, 78-RR, 79-3d, 80, 81, 82, 84 13 14 16 0 0 2 0 1
Joey Meyer (DePaul 1971) 1985, 86*, 87*, 88*, 89*, 91, 92 7 6 7 0 0 0 0 0
Pat Kennedy [King’s (PA) 1976] 2000 1 0 1 0 0 0 0 0Dave Leitao (Northeastern 1983) 2004 1 1 1 0 0 0 0 0
TOTAL 22 21 25 0 0 2 0 1Detroit MercyRobert Calihan (Detroit Mercy 1940)
1962 1 0 1 0 0 0 0 0Dick Vitale (Seton Hall 1962) 1977 1 1 1 0 0 0 0 0Dave “Smokey” Gaines (LeMoyne-Owen
1963) 1979 1 0 1 0 0 0 0 0Perry Watson (Eastern Mich. 1972) 1998,
99 2 2 2 0 0 0 0 0Ray McCallum (Ball St. 1983) 2012 1 0 1 0 0 0 0 0
TOTAL 6 3 6 0 0 0 0 0DrakeMaurice John (Central Mo. 1941) 1969-
3d, 70-RR, 71-RR 3 5 3 0 0 1 0 2Keno Davis (Iowa 1995) 2008 1 0 1 0 0 0 0 0
TOTAL 4 5 4 0 0 1 0 2DrexelEddie Burke (La Salle 1967) 1986 1 0 1 0 0 0 0 0Bill Herrion (Merrimack 1981) 1994, 95,
96 3 1 3 0 0 0 0 0TOTAL 4 1 4 0 0 0 0 0
DukeHarold Bradley (Hartwick 1934) 1955 1 0 1 0 0 0 0 0Vic Bubas (North Carolina St. 1951)
1960-RR, 63-3d, 64-2d, 66-3d 4 11 4 0 1 2 0 1W.E. “Bill” Foster (Elizabethtown 1954)
1978-2d, 79, 80-RR 3 6 3 0 1 0 0 1Mike Krzyzewski (Army 1969) 1984, 85,
86-2d, 87, 88-T3d, 89-T3d, 90-2d, 91-CH,92-CH, 93, 94-2d, 96, 97, 98-RR, 99-2d,2000, 01-CH, 02, 03, 04-T3d, 05, 06, 07, 08, 09, 10-CH, 11, 12, 13-RR, 14, 15-CH, 16, 17 33 91 28 5 4 3 0 2
TOTAL 41 108 36 5 6 5 0 4
Yrs. W L CH 2d 3d^ 4th RRDuquesneCharles “Chick” Davies (Duquesne 1934)
1940-T3d 1 1 1 0 0 1 0 0Donald “Dudey” Moore (Duquesne 1934)
1952-RR 1 1 1 0 0 0 0 1John “Red” Manning (Duquesne 1951)
1969, 71 2 2 2 0 0 0 0 0John Cinicola (Duquesne 1955) 1977 1 0 1 0 0 0 0 0
TOTAL 5 4 5 0 0 1 0 1
East CarolinaTom Quinn (Marshall 1954) 1972 1 0 1 0 0 0 0 0Eddie Payne (Wake Forest 1973) 1993 1 0 1 0 0 0 0 0
TOTAL 2 0 2 0 0 0 0 0Eastern Ill.Rick Samuels (Chadron St. 1971) 1992,
2001 2 0 2 0 0 0 0 0TOTAL 2 0 2 0 0 0 0 0
Eastern Ky.Paul McBrayer (Kentucky 1930) 1953, 59 2 0 2 0 0 0 0 0Jim Baechtold (Eastern Ky. 1952) 1965 1 0 1 0 0 0 0 0Guy Strong (Eastern Ky. 1955) 1972 1 0 1 0 0 0 0 0Ed Byhre [Augustana (SD) 1966] 1979 1 0 1 0 0 0 0 0Travis Ford (Kentucky 1994) 2005 1 0 1 0 0 0 0 0Jeff Neubauer (La Salle 1993) 2007, 14 2 0 2 0 0 0 0 0
TOTAL 8 0 8 0 0 0 0 0Eastern Mich.Ben Braun (Wisconsin 1975) 1988, 91,
96 3 3 3 0 0 0 0 0Milton Barnes (Albion 1979) 1998 1 0 1 0 0 0 0 0
TOTAL 4 3 4 0 0 0 0 0Eastern Wash.Ray Giacoletti (Minot St. 1984) 2004 1 0 1 0 0 0 0 0Jim Hayford (Azusa Pacific 1990) 2015 1 0 1 0 0 0 0 0
TOTAL 2 0 2 0 0 0 0 0ETSUJ. Madison Brooks (Louisiana Tech 1937)
1968 1 1 2 0 0 0 0 0Les Robinson (North Carolina St. 1964)
1989, 90 2 0 2 0 0 0 0 0Alan LeForce (Cumberland 1957) 1991,
92 2 1 2 0 0 0 0 0Ed DeChellis (Penn St. 1982) 2003 1 0 1 0 0 0 0 0Murry Bartow (UAB 1985) 2004, 09, 10 3 0 3 0 0 0 0 0Steve Forbes (Southern Ark. 1988) 2017 1 0 1 0 0 0 0 0
TOTAL 10 2 11 0 0 0 0 0EvansvilleDick Walters (Illinois St. 1969) 1982 1 0 1 0 0 0 0 0Jim Crews (Indiana 1976) 1989, 92, 93,
99 4 1 4 0 0 0 0 0TOTAL 5 1 5 0 0 0 0 0
FairfieldMitch Buonaguro (Boston College 1975)
1986, 87 2 0 2 0 0 0 0 0Paul Cormier (New Hampshire 1973)
1997 1 0 1 0 0 0 0 0TOTAL 3 0 3 0 0 0 0 0
Fairleigh DickinsonTom Green (Syracuse 1971) 1985, 88,
98, 2005 4 0 4 0 0 0 0 0Greg Herenda (Merrimack 1983) 2016 1 0 1 0 0 0 0 0
TOTAL 5 0 5 0 0 0 0 0FGCUAndy Enfield (Johns Hopkins 1991) 2013 1 2 1 0 0 0 0 0Joe Dooley (George Washington 1988)
2016, 17 2 1 2 0 0 0 0 0TOTAL 3 3 3 0 0 0 0 0
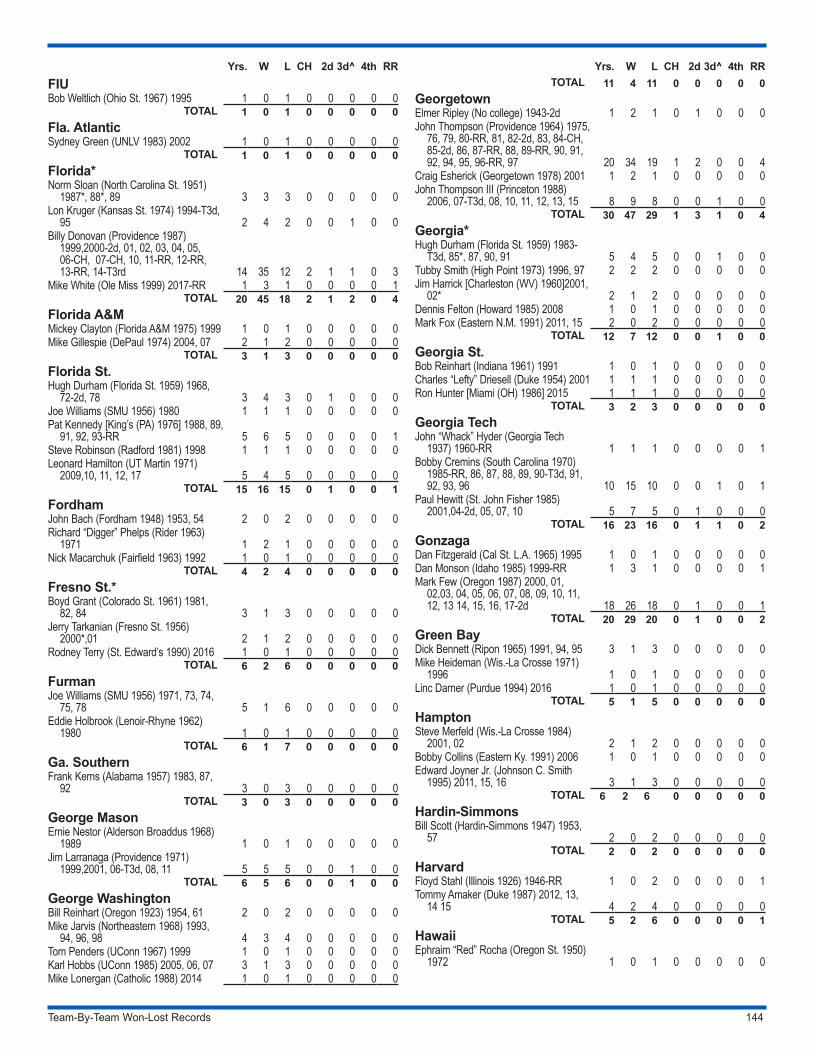
Team-By-Team Won-Lost Records 144
Yrs. W L CH 2d 3d^ 4th RRFIUBob Weltlich (Ohio St. 1967) 1995 1 0 1 0 0 0 0 0
TOTAL 1 0 1 0 0 0 0 0Fla. AtlanticSydney Green (UNLV 1983) 2002 1 0 1 0 0 0 0 0
TOTAL 1 0 1 0 0 0 0 0Florida*Norm Sloan (North Carolina St. 1951)
1987*, 88*, 89 3 3 3 0 0 0 0 0Lon Kruger (Kansas St. 1974) 1994-T3d,
95 2 4 2 0 0 1 0 0Billy Donovan (Providence 1987)
1999,2000-2d, 01, 02, 03, 04, 05, 06-CH, 07-CH, 10, 11-RR, 12-RR, 13-RR, 14-T3rd 14 35 12 2 1 1 0 3
Mike White (Ole Miss 1999) 2017-RR 1 3 1 0 0 0 0 1TOTAL 20 45 18 2 1 2 0 4
Florida A&MMickey Clayton (Florida A&M 1975) 1999 1 0 1 0 0 0 0 0Mike Gillespie (DePaul 1974) 2004, 07 2 1 2 0 0 0 0 0
TOTAL 3 1 3 0 0 0 0 0Florida St.Hugh Durham (Florida St. 1959) 1968,
72-2d, 78 3 4 3 0 1 0 0 0Joe Williams (SMU 1956) 1980 1 1 1 0 0 0 0 0Pat Kennedy [King’s (PA) 1976] 1988, 89,
91, 92, 93-RR 5 6 5 0 0 0 0 1Steve Robinson (Radford 1981) 1998 1 1 1 0 0 0 0 0Leonard Hamilton (UT Martin 1971)
2009,10, 11, 12, 17 5 4 5 0 0 0 0 0TOTAL 15 16 15 0 1 0 0 1
FordhamJohn Bach (Fordham 1948) 1953, 54 2 0 2 0 0 0 0 0Richard “Digger” Phelps (Rider 1963)
1971 1 2 1 0 0 0 0 0Nick Macarchuk (Fairfield 1963) 1992 1 0 1 0 0 0 0 0
TOTAL 4 2 4 0 0 0 0 0Fresno St.*Boyd Grant (Colorado St. 1961) 1981,
82, 84 3 1 3 0 0 0 0 0Jerry Tarkanian (Fresno St. 1956)
2000*,01 2 1 2 0 0 0 0 0Rodney Terry (St. Edward’s 1990) 2016 1 0 1 0 0 0 0 0
TOTAL 6 2 6 0 0 0 0 0FurmanJoe Williams (SMU 1956) 1971, 73, 74,
75, 78 5 1 6 0 0 0 0 0Eddie Holbrook (Lenoir-Rhyne 1962)
1980 1 0 1 0 0 0 0 0TOTAL 6 1 7 0 0 0 0 0
Ga. SouthernFrank Kerns (Alabama 1957) 1983, 87,
92 3 0 3 0 0 0 0 0TOTAL 3 0 3 0 0 0 0 0
George MasonErnie Nestor (Alderson Broaddus 1968)
1989 1 0 1 0 0 0 0 0Jim Larranaga (Providence 1971)
1999,2001, 06-T3d, 08, 11 5 5 5 0 0 1 0 0TOTAL 6 5 6 0 0 1 0 0
George WashingtonBill Reinhart (Oregon 1923) 1954, 61 2 0 2 0 0 0 0 0Mike Jarvis (Northeastern 1968) 1993,
94, 96, 98 4 3 4 0 0 0 0 0Tom Penders (UConn 1967) 1999 1 0 1 0 0 0 0 0Karl Hobbs (UConn 1985) 2005, 06, 07 3 1 3 0 0 0 0 0Mike Lonergan (Catholic 1988) 2014 1 0 1 0 0 0 0 0
Yrs. W L CH 2d 3d^ 4th RRTOTAL 11 4 11 0 0 0 0 0
GeorgetownElmer Ripley (No college) 1943-2d 1 2 1 0 1 0 0 0John Thompson (Providence 1964) 1975,
76, 79, 80-RR, 81, 82-2d, 83, 84-CH, 85-2d, 86, 87-RR, 88, 89-RR, 90, 91, 92, 94, 95, 96-RR, 97 20 34 19 1 2 0 0 4
Craig Esherick (Georgetown 1978) 2001 1 2 1 0 0 0 0 0John Thompson III (Princeton 1988)
2006, 07-T3d, 08, 10, 11, 12, 13, 15 8 9 8 0 0 1 0 0TOTAL 30 47 29 1 3 1 0 4
Georgia*Hugh Durham (Florida St. 1959) 1983-
T3d, 85*, 87, 90, 91 5 4 5 0 0 1 0 0Tubby Smith (High Point 1973) 1996, 97 2 2 2 0 0 0 0 0Jim Harrick [Charleston (WV) 1960]2001,
02* 2 1 2 0 0 0 0 0Dennis Felton (Howard 1985) 2008 1 0 1 0 0 0 0 0Mark Fox (Eastern N.M. 1991) 2011, 15 2 0 2 0 0 0 0 0
TOTAL 12 7 12 0 0 1 0 0Georgia St.Bob Reinhart (Indiana 1961) 1991 1 0 1 0 0 0 0 0Charles “Lefty” Driesell (Duke 1954) 2001 1 1 1 0 0 0 0 0Ron Hunter [Miami (OH) 1986] 2015 1 1 1 0 0 0 0 0
TOTAL 3 2 3 0 0 0 0 0Georgia TechJohn “Whack” Hyder (Georgia Tech
1937) 1960-RR 1 1 1 0 0 0 0 1Bobby Cremins (South Carolina 1970)
1985-RR, 86, 87, 88, 89, 90-T3d, 91, 92, 93, 96 10 15 10 0 0 1 0 1
Paul Hewitt (St. John Fisher 1985) 2001,04-2d, 05, 07, 10 5 7 5 0 1 0 0 0
TOTAL 16 23 16 0 1 1 0 2GonzagaDan Fitzgerald (Cal St. L.A. 1965) 1995 1 0 1 0 0 0 0 0Dan Monson (Idaho 1985) 1999-RR 1 3 1 0 0 0 0 1Mark Few (Oregon 1987) 2000, 01,
02,03, 04, 05, 06, 07, 08, 09, 10, 11, 12, 13 14, 15, 16, 17-2d 18 26 18 0 1 0 0 1
TOTAL 20 29 20 0 1 0 0 2Green BayDick Bennett (Ripon 1965) 1991, 94, 95 3 1 3 0 0 0 0 0Mike Heideman (Wis.-La Crosse 1971)
1996 1 0 1 0 0 0 0 0Linc Darner (Purdue 1994) 2016 1 0 1 0 0 0 0 0
TOTAL 5 1 5 0 0 0 0 0HamptonSteve Merfeld (Wis.-La Crosse 1984)
2001, 02 2 1 2 0 0 0 0 0Bobby Collins (Eastern Ky. 1991) 2006 1 0 1 0 0 0 0 0Edward Joyner Jr. (Johnson C. Smith
1995) 2011, 15, 16 3 1 3 0 0 0 0 0TOTAL 6 2 6 0 0 0 0 0
Hardin-SimmonsBill Scott (Hardin-Simmons 1947) 1953,
57 2 0 2 0 0 0 0 0TOTAL 2 0 2 0 0 0 0 0
HarvardFloyd Stahl (Illinois 1926) 1946-RR 1 0 2 0 0 0 0 1Tommy Amaker (Duke 1987) 2012, 13,
14 15 4 2 4 0 0 0 0 0TOTAL 5 2 6 0 0 0 0 1
HawaiiEphraim “Red” Rocha (Oregon St. 1950)
1972 1 0 1 0 0 0 0 0
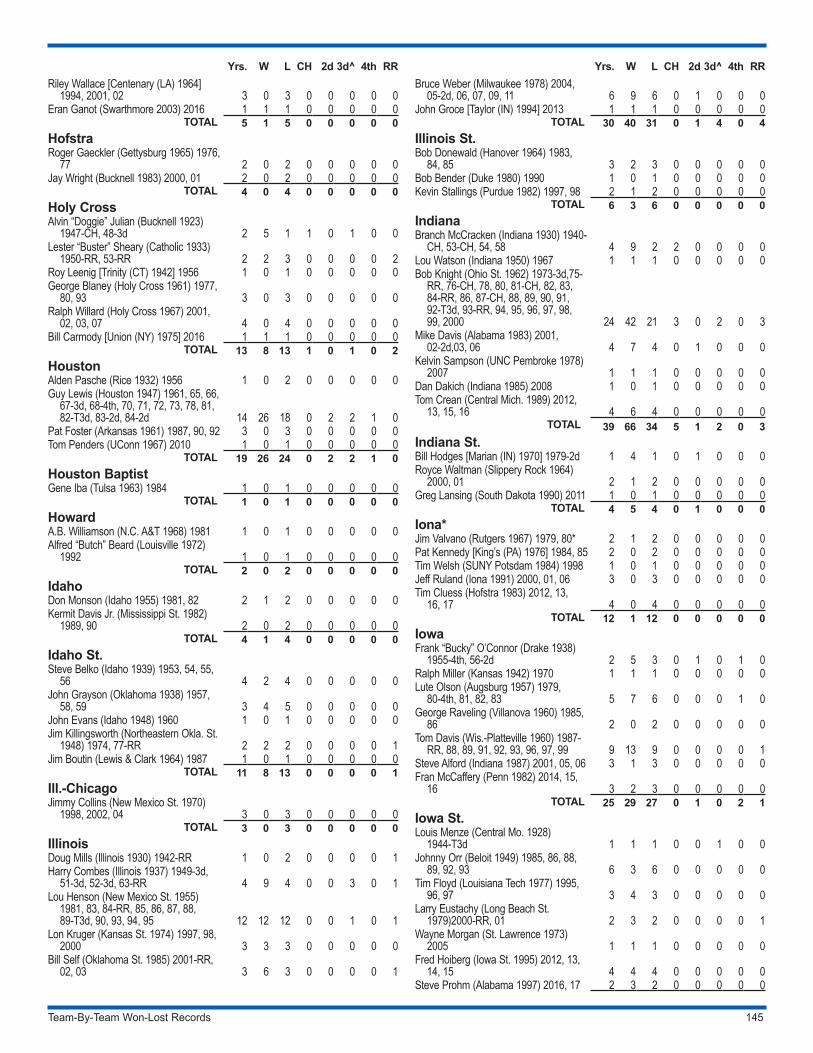
Team-By-Team Won-Lost Records 145
Yrs. W L CH 2d 3d^ 4th RRRiley Wallace [Centenary (LA) 1964]
1994, 2001, 02 3 0 3 0 0 0 0 0Eran Ganot (Swarthmore 2003) 2016 1 1 1 0 0 0 0 0
TOTAL 5 1 5 0 0 0 0 0HofstraRoger Gaeckler (Gettysburg 1965) 1976,
77 2 0 2 0 0 0 0 0Jay Wright (Bucknell 1983) 2000, 01 2 0 2 0 0 0 0 0
TOTAL 4 0 4 0 0 0 0 0Holy CrossAlvin “Doggie” Julian (Bucknell 1923)
1947-CH, 48-3d 2 5 1 1 0 1 0 0Lester “Buster” Sheary (Catholic 1933)
1950-RR, 53-RR 2 2 3 0 0 0 0 2Roy Leenig [Trinity (CT) 1942] 1956 1 0 1 0 0 0 0 0George Blaney (Holy Cross 1961) 1977,
80, 93 3 0 3 0 0 0 0 0Ralph Willard (Holy Cross 1967) 2001,
02, 03, 07 4 0 4 0 0 0 0 0Bill Carmody [Union (NY) 1975] 2016 1 1 1 0 0 0 0 0
TOTAL 13 8 13 1 0 1 0 2HoustonAlden Pasche (Rice 1932) 1956 1 0 2 0 0 0 0 0Guy Lewis (Houston 1947) 1961, 65, 66,
67-3d, 68-4th, 70, 71, 72, 73, 78, 81, 82-T3d, 83-2d, 84-2d 14 26 18 0 2 2 1 0
Pat Foster (Arkansas 1961) 1987, 90, 92 3 0 3 0 0 0 0 0Tom Penders (UConn 1967) 2010 1 0 1 0 0 0 0 0
TOTAL 19 26 24 0 2 2 1 0Houston BaptistGene Iba (Tulsa 1963) 1984 1 0 1 0 0 0 0 0
TOTAL 1 0 1 0 0 0 0 0HowardA.B. Williamson (N.C. A&T 1968) 1981 1 0 1 0 0 0 0 0Alfred “Butch” Beard (Louisville 1972)
1992 1 0 1 0 0 0 0 0TOTAL 2 0 2 0 0 0 0 0
IdahoDon Monson (Idaho 1955) 1981, 82 2 1 2 0 0 0 0 0Kermit Davis Jr. (Mississippi St. 1982)
1989, 90 2 0 2 0 0 0 0 0TOTAL 4 1 4 0 0 0 0 0
Idaho St.Steve Belko (Idaho 1939) 1953, 54, 55,
56 4 2 4 0 0 0 0 0John Grayson (Oklahoma 1938) 1957,
58, 59 3 4 5 0 0 0 0 0John Evans (Idaho 1948) 1960 1 0 1 0 0 0 0 0Jim Killingsworth (Northeastern Okla. St.
1948) 1974, 77-RR 2 2 2 0 0 0 0 1Jim Boutin (Lewis & Clark 1964) 1987 1 0 1 0 0 0 0 0
TOTAL 11 8 13 0 0 0 0 1Ill.-ChicagoJimmy Collins (New Mexico St. 1970)
1998, 2002, 04 3 0 3 0 0 0 0 0TOTAL 3 0 3 0 0 0 0 0
IllinoisDoug Mills (Illinois 1930) 1942-RR 1 0 2 0 0 0 0 1Harry Combes (Illinois 1937) 1949-3d,
51-3d, 52-3d, 63-RR 4 9 4 0 0 3 0 1Lou Henson (New Mexico St. 1955)
1981, 83, 84-RR, 85, 86, 87, 88, 89-T3d, 90, 93, 94, 95 12 12 12 0 0 1 0 1
Lon Kruger (Kansas St. 1974) 1997, 98, 2000 3 3 3 0 0 0 0 0
Bill Self (Oklahoma St. 1985) 2001-RR, 02, 03 3 6 3 0 0 0 0 1
Yrs. W L CH 2d 3d^ 4th RRBruce Weber (Milwaukee 1978) 2004,
05-2d, 06, 07, 09, 11 6 9 6 0 1 0 0 0John Groce [Taylor (IN) 1994] 2013 1 1 1 0 0 0 0 0
TOTAL 30 40 31 0 1 4 0 4Illinois St.Bob Donewald (Hanover 1964) 1983,
84, 85 3 2 3 0 0 0 0 0Bob Bender (Duke 1980) 1990 1 0 1 0 0 0 0 0Kevin Stallings (Purdue 1982) 1997, 98 2 1 2 0 0 0 0 0
TOTAL 6 3 6 0 0 0 0 0IndianaBranch McCracken (Indiana 1930) 1940-
CH, 53-CH, 54, 58 4 9 2 2 0 0 0 0Lou Watson (Indiana 1950) 1967 1 1 1 0 0 0 0 0Bob Knight (Ohio St. 1962) 1973-3d,75-
RR, 76-CH, 78, 80, 81-CH, 82, 83, 84-RR, 86, 87-CH, 88, 89, 90, 91, 92-T3d, 93-RR, 94, 95, 96, 97, 98, 99, 2000 24 42 21 3 0 2 0 3
Mike Davis (Alabama 1983) 2001, 02-2d,03, 06 4 7 4 0 1 0 0 0
Kelvin Sampson (UNC Pembroke 1978) 2007 1 1 1 0 0 0 0 0
Dan Dakich (Indiana 1985) 2008 1 0 1 0 0 0 0 0Tom Crean (Central Mich. 1989) 2012,
13, 15, 16 4 6 4 0 0 0 0 0TOTAL 39 66 34 5 1 2 0 3
Indiana St.Bill Hodges [Marian (IN) 1970] 1979-2d 1 4 1 0 1 0 0 0Royce Waltman (Slippery Rock 1964)
2000, 01 2 1 2 0 0 0 0 0Greg Lansing (South Dakota 1990) 2011 1 0 1 0 0 0 0 0
TOTAL 4 5 4 0 1 0 0 0Iona*Jim Valvano (Rutgers 1967) 1979, 80* 2 1 2 0 0 0 0 0Pat Kennedy [King’s (PA) 1976] 1984, 85 2 0 2 0 0 0 0 0Tim Welsh (SUNY Potsdam 1984) 1998 1 0 1 0 0 0 0 0Jeff Ruland (Iona 1991) 2000, 01, 06 3 0 3 0 0 0 0 0Tim Cluess (Hofstra 1983) 2012, 13,
16, 17 4 0 4 0 0 0 0 0TOTAL 12 1 12 0 0 0 0 0
IowaFrank “Bucky” O’Connor (Drake 1938)
1955-4th, 56-2d 2 5 3 0 1 0 1 0Ralph Miller (Kansas 1942) 1970 1 1 1 0 0 0 0 0Lute Olson (Augsburg 1957) 1979,
80-4th, 81, 82, 83 5 7 6 0 0 0 1 0George Raveling (Villanova 1960) 1985,
86 2 0 2 0 0 0 0 0Tom Davis (Wis.-Platteville 1960) 1987-
RR, 88, 89, 91, 92, 93, 96, 97, 99 9 13 9 0 0 0 0 1Steve Alford (Indiana 1987) 2001, 05, 06 3 1 3 0 0 0 0 0Fran McCaffery (Penn 1982) 2014, 15,
16 3 2 3 0 0 0 0 0TOTAL 25 29 27 0 1 0 2 1
Iowa St.Louis Menze (Central Mo. 1928)
1944-T3d 1 1 1 0 0 1 0 0Johnny Orr (Beloit 1949) 1985, 86, 88,
89, 92, 93 6 3 6 0 0 0 0 0Tim Floyd (Louisiana Tech 1977) 1995,
96, 97 3 4 3 0 0 0 0 0Larry Eustachy (Long Beach St.
1979)2000-RR, 01 2 3 2 0 0 0 0 1Wayne Morgan (St. Lawrence 1973)
2005 1 1 1 0 0 0 0 0Fred Hoiberg (Iowa St. 1995) 2012, 13,
14, 15 4 4 4 0 0 0 0 0Steve Prohm (Alabama 1997) 2016, 17 2 3 2 0 0 0 0 0
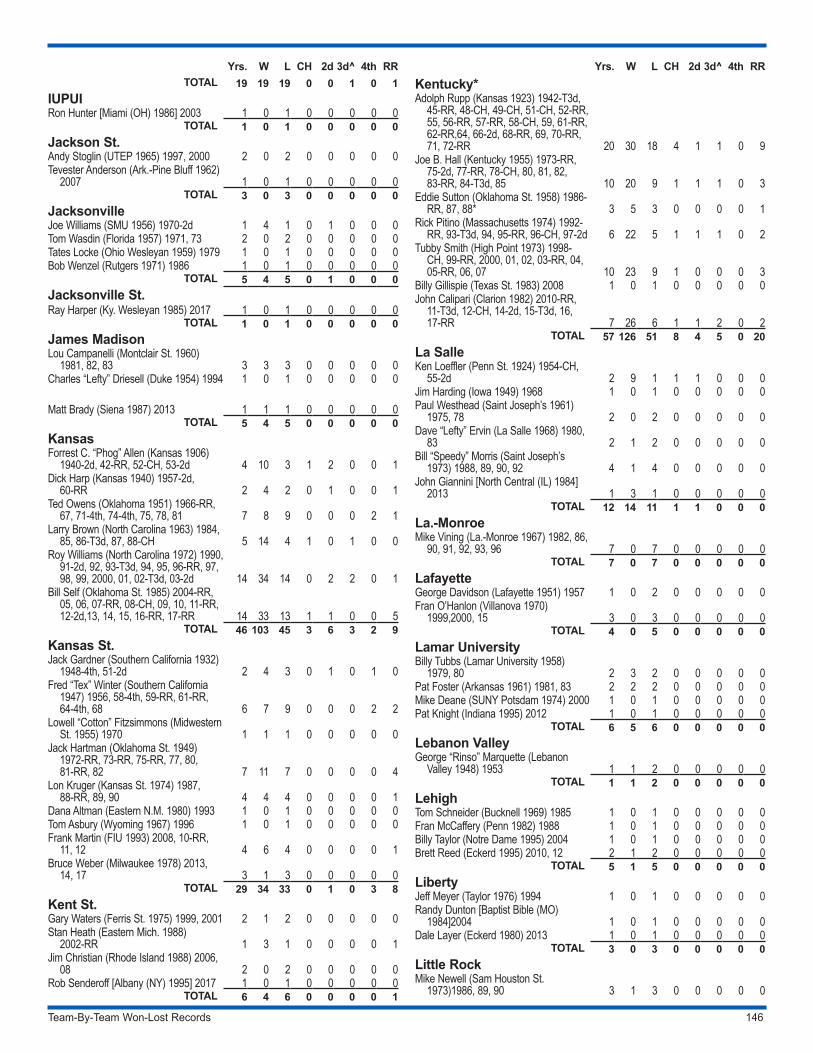
Team-By-Team Won-Lost Records 146
Yrs. W L CH 2d 3d^ 4th RRTOTAL 19 19 19 0 0 1 0 1
IUPUIRon Hunter [Miami (OH) 1986] 2003 1 0 1 0 0 0 0 0
TOTAL 1 0 1 0 0 0 0 0Jackson St.Andy Stoglin (UTEP 1965) 1997, 2000 2 0 2 0 0 0 0 0Tevester Anderson (Ark.-Pine Bluff 1962)
2007 1 0 1 0 0 0 0 0TOTAL 3 0 3 0 0 0 0 0
JacksonvilleJoe Williams (SMU 1956) 1970-2d 1 4 1 0 1 0 0 0Tom Wasdin (Florida 1957) 1971, 73 2 0 2 0 0 0 0 0Tates Locke (Ohio Wesleyan 1959) 1979 1 0 1 0 0 0 0 0Bob Wenzel (Rutgers 1971) 1986 1 0 1 0 0 0 0 0
TOTAL 5 4 5 0 1 0 0 0Jacksonville St.Ray Harper (Ky. Wesleyan 1985) 2017 1 0 1 0 0 0 0 0
TOTAL 1 0 1 0 0 0 0 0James MadisonLou Campanelli (Montclair St. 1960)
1981, 82, 83 3 3 3 0 0 0 0 0Charles “Lefty” Driesell (Duke 1954) 1994 1 0 1 0 0 0 0 0
Matt Brady (Siena 1987) 2013 1 1 1 0 0 0 0 0TOTAL 5 4 5 0 0 0 0 0
KansasForrest C. “Phog” Allen (Kansas 1906)
1940-2d, 42-RR, 52-CH, 53-2d 4 10 3 1 2 0 0 1Dick Harp (Kansas 1940) 1957-2d,
60-RR 2 4 2 0 1 0 0 1Ted Owens (Oklahoma 1951) 1966-RR,
67, 71-4th, 74-4th, 75, 78, 81 7 8 9 0 0 0 2 1Larry Brown (North Carolina 1963) 1984,
85, 86-T3d, 87, 88-CH 5 14 4 1 0 1 0 0Roy Williams (North Carolina 1972) 1990,
91-2d, 92, 93-T3d, 94, 95, 96-RR, 97, 98, 99, 2000, 01, 02-T3d, 03-2d 14 34 14 0 2 2 0 1
Bill Self (Oklahoma St. 1985) 2004-RR, 05, 06, 07-RR, 08-CH, 09, 10, 11-RR, 12-2d,13, 14, 15, 16-RR, 17-RR 14 33 13 1 1 0 0 5
TOTAL 46 103 45 3 6 3 2 9Kansas St.Jack Gardner (Southern California 1932)
1948-4th, 51-2d 2 4 3 0 1 0 1 0Fred “Tex” Winter (Southern California
1947) 1956, 58-4th, 59-RR, 61-RR, 64-4th, 68 6 7 9 0 0 0 2 2
Lowell “Cotton” Fitzsimmons (Midwestern St. 1955) 1970 1 1 1 0 0 0 0 0
Jack Hartman (Oklahoma St. 1949) 1972-RR, 73-RR, 75-RR, 77, 80, 81-RR, 82 7 11 7 0 0 0 0 4
Lon Kruger (Kansas St. 1974) 1987, 88-RR, 89, 90 4 4 4 0 0 0 0 1
Dana Altman (Eastern N.M. 1980) 1993 1 0 1 0 0 0 0 0Tom Asbury (Wyoming 1967) 1996 1 0 1 0 0 0 0 0Frank Martin (FIU 1993) 2008, 10-RR,
11, 12 4 6 4 0 0 0 0 1Bruce Weber (Milwaukee 1978) 2013,
14, 17 3 1 3 0 0 0 0 0TOTAL 29 34 33 0 1 0 3 8
Kent St.Gary Waters (Ferris St. 1975) 1999, 2001 2 1 2 0 0 0 0 0Stan Heath (Eastern Mich. 1988)
2002-RR 1 3 1 0 0 0 0 1Jim Christian (Rhode Island 1988) 2006,
08 2 0 2 0 0 0 0 0Rob Senderoff [Albany (NY) 1995] 2017 1 0 1 0 0 0 0 0
TOTAL 6 4 6 0 0 0 0 1
Yrs. W L CH 2d 3d^ 4th RRKentucky*Adolph Rupp (Kansas 1923) 1942-T3d,
45-RR, 48-CH, 49-CH, 51-CH, 52-RR, 55, 56-RR, 57-RR, 58-CH, 59, 61-RR, 62-RR,64, 66-2d, 68-RR, 69, 70-RR, 71, 72-RR 20 30 18 4 1 1 0 9
Joe B. Hall (Kentucky 1955) 1973-RR, 75-2d, 77-RR, 78-CH, 80, 81, 82, 83-RR, 84-T3d, 85 10 20 9 1 1 1 0 3
Eddie Sutton (Oklahoma St. 1958) 1986-RR, 87, 88* 3 5 3 0 0 0 0 1
Rick Pitino (Massachusetts 1974) 1992-RR, 93-T3d, 94, 95-RR, 96-CH, 97-2d 6 22 5 1 1 1 0 2
Tubby Smith (High Point 1973) 1998-CH, 99-RR, 2000, 01, 02, 03-RR, 04, 05-RR, 06, 07 10 23 9 1 0 0 0 3
Billy Gillispie (Texas St. 1983) 2008 1 0 1 0 0 0 0 0John Calipari (Clarion 1982) 2010-RR,
11-T3d, 12-CH, 14-2d, 15-T3d, 16, 17-RR 7 26 6 1 1 2 0 2
TOTAL 57 126 51 8 4 5 0 20La SalleKen Loeffler (Penn St. 1924) 1954-CH,
55-2d 2 9 1 1 1 0 0 0Jim Harding (Iowa 1949) 1968 1 0 1 0 0 0 0 0Paul Westhead (Saint Joseph’s 1961)
1975, 78 2 0 2 0 0 0 0 0Dave “Lefty” Ervin (La Salle 1968) 1980,
83 2 1 2 0 0 0 0 0Bill “Speedy” Morris (Saint Joseph’s
1973) 1988, 89, 90, 92 4 1 4 0 0 0 0 0John Giannini [North Central (IL) 1984]
2013 1 3 1 0 0 0 0 0TOTAL 12 14 11 1 1 0 0 0
La.-MonroeMike Vining (La.-Monroe 1967) 1982, 86,
90, 91, 92, 93, 96 7 0 7 0 0 0 0 0TOTAL 7 0 7 0 0 0 0 0
LafayetteGeorge Davidson (Lafayette 1951) 1957 1 0 2 0 0 0 0 0Fran O’Hanlon (Villanova 1970)
1999,2000, 15 3 0 3 0 0 0 0 0TOTAL 4 0 5 0 0 0 0 0
Lamar UniversityBilly Tubbs (Lamar University 1958)
1979, 80 2 3 2 0 0 0 0 0Pat Foster (Arkansas 1961) 1981, 83 2 2 2 0 0 0 0 0Mike Deane (SUNY Potsdam 1974) 2000 1 0 1 0 0 0 0 0Pat Knight (Indiana 1995) 2012 1 0 1 0 0 0 0 0
TOTAL 6 5 6 0 0 0 0 0Lebanon ValleyGeorge “Rinso” Marquette (Lebanon
Valley 1948) 1953 1 1 2 0 0 0 0 0TOTAL 1 1 2 0 0 0 0 0
LehighTom Schneider (Bucknell 1969) 1985 1 0 1 0 0 0 0 0Fran McCaffery (Penn 1982) 1988 1 0 1 0 0 0 0 0Billy Taylor (Notre Dame 1995) 2004 1 0 1 0 0 0 0 0Brett Reed (Eckerd 1995) 2010, 12 2 1 2 0 0 0 0 0
TOTAL 5 1 5 0 0 0 0 0LibertyJeff Meyer (Taylor 1976) 1994 1 0 1 0 0 0 0 0Randy Dunton [Baptist Bible (MO)
1984]2004 1 0 1 0 0 0 0 0Dale Layer (Eckerd 1980) 2013 1 0 1 0 0 0 0 0
TOTAL 3 0 3 0 0 0 0 0Little RockMike Newell (Sam Houston St.
1973)1986, 89, 90 3 1 3 0 0 0 0 0
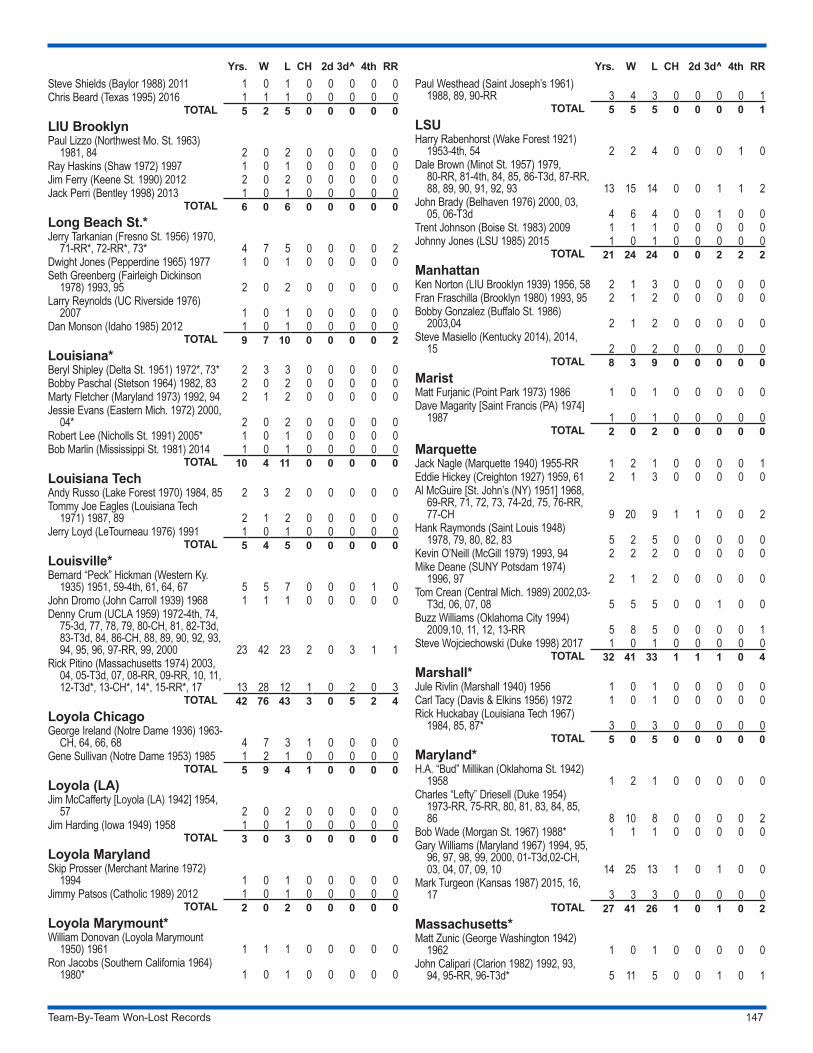
Team-By-Team Won-Lost Records 147
Yrs. W L CH 2d 3d^ 4th RRSteve Shields (Baylor 1988) 2011 1 0 1 0 0 0 0 0Chris Beard (Texas 1995) 2016 1 1 1 0 0 0 0 0
TOTAL 5 2 5 0 0 0 0 0LIU BrooklynPaul Lizzo (Northwest Mo. St. 1963)
1981, 84 2 0 2 0 0 0 0 0Ray Haskins (Shaw 1972) 1997 1 0 1 0 0 0 0 0Jim Ferry (Keene St. 1990) 2012 2 0 2 0 0 0 0 0Jack Perri (Bentley 1998) 2013 1 0 1 0 0 0 0 0
TOTAL 6 0 6 0 0 0 0 0Long Beach St.*Jerry Tarkanian (Fresno St. 1956) 1970,
71-RR*, 72-RR*, 73* 4 7 5 0 0 0 0 2Dwight Jones (Pepperdine 1965) 1977 1 0 1 0 0 0 0 0Seth Greenberg (Fairleigh Dickinson
1978) 1993, 95 2 0 2 0 0 0 0 0Larry Reynolds (UC Riverside 1976)
2007 1 0 1 0 0 0 0 0Dan Monson (Idaho 1985) 2012 1 0 1 0 0 0 0 0
TOTAL 9 7 10 0 0 0 0 2Louisiana*Beryl Shipley (Delta St. 1951) 1972*, 73* 2 3 3 0 0 0 0 0Bobby Paschal (Stetson 1964) 1982, 83 2 0 2 0 0 0 0 0Marty Fletcher (Maryland 1973) 1992, 94 2 1 2 0 0 0 0 0Jessie Evans (Eastern Mich. 1972) 2000,
04* 2 0 2 0 0 0 0 0Robert Lee (Nicholls St. 1991) 2005* 1 0 1 0 0 0 0 0Bob Marlin (Mississippi St. 1981) 2014 1 0 1 0 0 0 0 0
TOTAL 10 4 11 0 0 0 0 0Louisiana TechAndy Russo (Lake Forest 1970) 1984, 85 2 3 2 0 0 0 0 0Tommy Joe Eagles (Louisiana Tech
1971) 1987, 89 2 1 2 0 0 0 0 0Jerry Loyd (LeTourneau 1976) 1991 1 0 1 0 0 0 0 0
TOTAL 5 4 5 0 0 0 0 0Louisville*Bernard “Peck” Hickman (Western Ky.
1935) 1951, 59-4th, 61, 64, 67 5 5 7 0 0 0 1 0John Dromo (John Carroll 1939) 1968 1 1 1 0 0 0 0 0Denny Crum (UCLA 1959) 1972-4th, 74,
75-3d, 77, 78, 79, 80-CH, 81, 82-T3d, 83-T3d, 84, 86-CH, 88, 89, 90, 92, 93, 94, 95, 96, 97-RR, 99, 2000 23 42 23 2 0 3 1 1
Rick Pitino (Massachusetts 1974) 2003, 04, 05-T3d, 07, 08-RR, 09-RR, 10, 11, 12-T3d*, 13-CH*, 14*, 15-RR*, 17 13 28 12 1 0 2 0 3
TOTAL 42 76 43 3 0 5 2 4Loyola ChicagoGeorge Ireland (Notre Dame 1936) 1963-
CH, 64, 66, 68 4 7 3 1 0 0 0 0Gene Sullivan (Notre Dame 1953) 1985 1 2 1 0 0 0 0 0
TOTAL 5 9 4 1 0 0 0 0Loyola (LA)Jim McCafferty [Loyola (LA) 1942] 1954,
57 2 0 2 0 0 0 0 0Jim Harding (Iowa 1949) 1958 1 0 1 0 0 0 0 0
TOTAL 3 0 3 0 0 0 0 0Loyola MarylandSkip Prosser (Merchant Marine 1972)
1994 1 0 1 0 0 0 0 0Jimmy Patsos (Catholic 1989) 2012 1 0 1 0 0 0 0 0
TOTAL 2 0 2 0 0 0 0 0Loyola Marymount*William Donovan (Loyola Marymount
1950) 1961 1 1 1 0 0 0 0 0Ron Jacobs (Southern California 1964)
1980* 1 0 1 0 0 0 0 0
Yrs. W L CH 2d 3d^ 4th RRPaul Westhead (Saint Joseph’s 1961)
1988, 89, 90-RR 3 4 3 0 0 0 0 1TOTAL 5 5 5 0 0 0 0 1
LSUHarry Rabenhorst (Wake Forest 1921)
1953-4th, 54 2 2 4 0 0 0 1 0Dale Brown (Minot St. 1957) 1979,
80-RR, 81-4th, 84, 85, 86-T3d, 87-RR, 88, 89, 90, 91, 92, 93 13 15 14 0 0 1 1 2
John Brady (Belhaven 1976) 2000, 03, 05, 06-T3d 4 6 4 0 0 1 0 0
Trent Johnson (Boise St. 1983) 2009 1 1 1 0 0 0 0 0Johnny Jones (LSU 1985) 2015 1 0 1 0 0 0 0 0
TOTAL 21 24 24 0 0 2 2 2ManhattanKen Norton (LIU Brooklyn 1939) 1956, 58 2 1 3 0 0 0 0 0Fran Fraschilla (Brooklyn 1980) 1993, 95 2 1 2 0 0 0 0 0Bobby Gonzalez (Buffalo St. 1986)
2003,04 2 1 2 0 0 0 0 0Steve Masiello (Kentucky 2014), 2014,
15 2 0 2 0 0 0 0 0TOTAL 8 3 9 0 0 0 0 0
MaristMatt Furjanic (Point Park 1973) 1986 1 0 1 0 0 0 0 0Dave Magarity [Saint Francis (PA) 1974]
1987 1 0 1 0 0 0 0 0TOTAL 2 0 2 0 0 0 0 0
MarquetteJack Nagle (Marquette 1940) 1955-RR 1 2 1 0 0 0 0 1Eddie Hickey (Creighton 1927) 1959, 61 2 1 3 0 0 0 0 0Al McGuire [St. John’s (NY) 1951] 1968,
69-RR, 71, 72, 73, 74-2d, 75, 76-RR, 77-CH 9 20 9 1 1 0 0 2
Hank Raymonds (Saint Louis 1948) 1978, 79, 80, 82, 83 5 2 5 0 0 0 0 0
Kevin O’Neill (McGill 1979) 1993, 94 2 2 2 0 0 0 0 0Mike Deane (SUNY Potsdam 1974)
1996, 97 2 1 2 0 0 0 0 0Tom Crean (Central Mich. 1989) 2002,03-
T3d, 06, 07, 08 5 5 5 0 0 1 0 0Buzz Williams (Oklahoma City 1994)
2009,10, 11, 12, 13-RR 5 8 5 0 0 0 0 1Steve Wojciechowski (Duke 1998) 2017 1 0 1 0 0 0 0 0
TOTAL 32 41 33 1 1 1 0 4Marshall*Jule Rivlin (Marshall 1940) 1956 1 0 1 0 0 0 0 0Carl Tacy (Davis & Elkins 1956) 1972 1 0 1 0 0 0 0 0Rick Huckabay (Louisiana Tech 1967)
1984, 85, 87* 3 0 3 0 0 0 0 0TOTAL 5 0 5 0 0 0 0 0
Maryland*H.A. “Bud” Millikan (Oklahoma St. 1942)
1958 1 2 1 0 0 0 0 0Charles “Lefty” Driesell (Duke 1954)
1973-RR, 75-RR, 80, 81, 83, 84, 85, 86 8 10 8 0 0 0 0 2
Bob Wade (Morgan St. 1967) 1988* 1 1 1 0 0 0 0 0Gary Williams (Maryland 1967) 1994, 95,
96, 97, 98, 99, 2000, 01-T3d,02-CH, 03, 04, 07, 09, 10 14 25 13 1 0 1 0 0
Mark Turgeon (Kansas 1987) 2015, 16, 17 3 3 3 0 0 0 0 0
TOTAL 27 41 26 1 0 1 0 2Massachusetts*Matt Zunic (George Washington 1942)
1962 1 0 1 0 0 0 0 0John Calipari (Clarion 1982) 1992, 93,
94, 95-RR, 96-T3d* 5 11 5 0 0 1 0 1
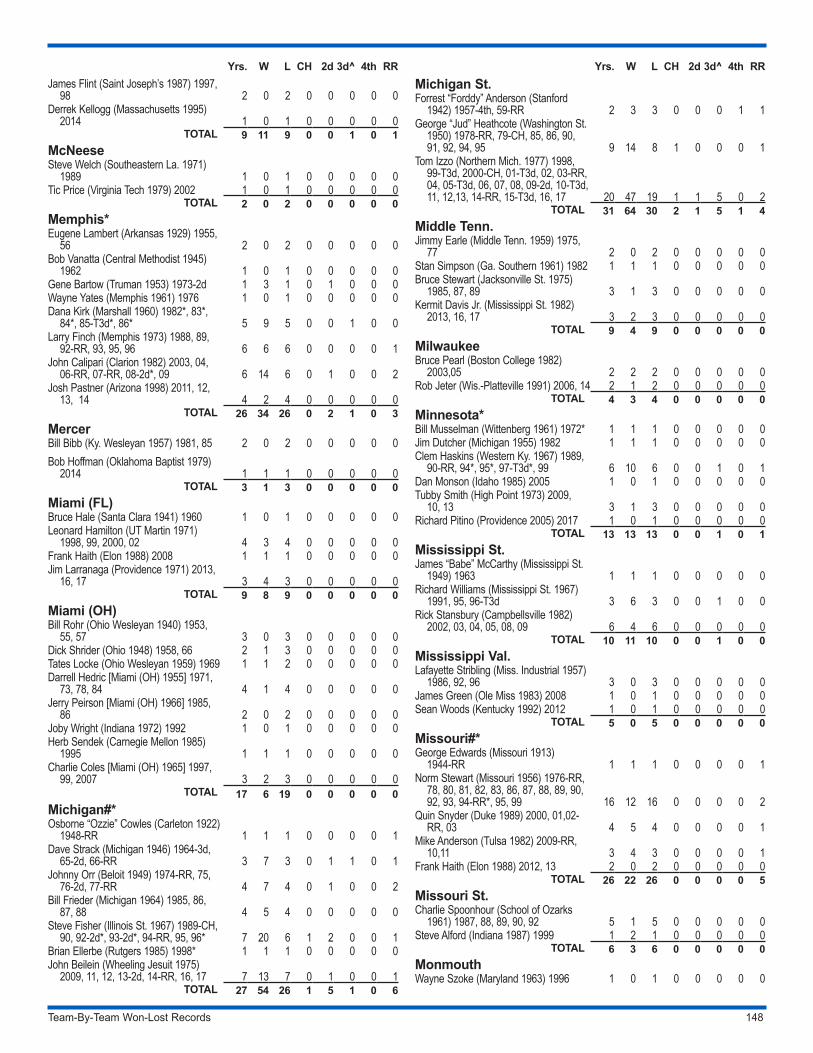
Team-By-Team Won-Lost Records 148
Yrs. W L CH 2d 3d^ 4th RRJames Flint (Saint Joseph’s 1987) 1997,
98 2 0 2 0 0 0 0 0Derrek Kellogg (Massachusetts 1995)
2014 1 0 1 0 0 0 0 0TOTAL 9 11 9 0 0 1 0 1
McNeeseSteve Welch (Southeastern La. 1971)
1989 1 0 1 0 0 0 0 0Tic Price (Virginia Tech 1979) 2002 1 0 1 0 0 0 0 0
TOTAL 2 0 2 0 0 0 0 0Memphis*Eugene Lambert (Arkansas 1929) 1955,
56 2 0 2 0 0 0 0 0Bob Vanatta (Central Methodist 1945)
1962 1 0 1 0 0 0 0 0Gene Bartow (Truman 1953) 1973-2d 1 3 1 0 1 0 0 0Wayne Yates (Memphis 1961) 1976 1 0 1 0 0 0 0 0Dana Kirk (Marshall 1960) 1982*, 83*,
84*, 85-T3d*, 86* 5 9 5 0 0 1 0 0Larry Finch (Memphis 1973) 1988, 89,
92-RR, 93, 95, 96 6 6 6 0 0 0 0 1John Calipari (Clarion 1982) 2003, 04,
06-RR, 07-RR, 08-2d*, 09 6 14 6 0 1 0 0 2Josh Pastner (Arizona 1998) 2011, 12,
13, 14 4 2 4 0 0 0 0 0TOTAL 26 34 26 0 2 1 0 3
MercerBill Bibb (Ky. Wesleyan 1957) 1981, 85 2 0 2 0 0 0 0 0Bob Hoffman (Oklahoma Baptist 1979)
2014 1 1 1 0 0 0 0 0TOTAL 3 1 3 0 0 0 0 0
Miami (FL)Bruce Hale (Santa Clara 1941) 1960 1 0 1 0 0 0 0 0Leonard Hamilton (UT Martin 1971)
1998, 99, 2000, 02 4 3 4 0 0 0 0 0Frank Haith (Elon 1988) 2008 1 1 1 0 0 0 0 0Jim Larranaga (Providence 1971) 2013,
16, 17 3 4 3 0 0 0 0 0TOTAL 9 8 9 0 0 0 0 0
Miami (OH)Bill Rohr (Ohio Wesleyan 1940) 1953,
55, 57 3 0 3 0 0 0 0 0Dick Shrider (Ohio 1948) 1958, 66 2 1 3 0 0 0 0 0Tates Locke (Ohio Wesleyan 1959) 1969 1 1 2 0 0 0 0 0Darrell Hedric [Miami (OH) 1955] 1971,
73, 78, 84 4 1 4 0 0 0 0 0Jerry Peirson [Miami (OH) 1966] 1985,
86 2 0 2 0 0 0 0 0Joby Wright (Indiana 1972) 1992 1 0 1 0 0 0 0 0Herb Sendek (Carnegie Mellon 1985)
1995 1 1 1 0 0 0 0 0Charlie Coles [Miami (OH) 1965] 1997,
99, 2007 3 2 3 0 0 0 0 0TOTAL 17 6 19 0 0 0 0 0
Michigan#*Osborne “Ozzie” Cowles (Carleton 1922)
1948-RR 1 1 1 0 0 0 0 1Dave Strack (Michigan 1946) 1964-3d,
65-2d, 66-RR 3 7 3 0 1 1 0 1Johnny Orr (Beloit 1949) 1974-RR, 75,
76-2d, 77-RR 4 7 4 0 1 0 0 2Bill Frieder (Michigan 1964) 1985, 86,
87, 88 4 5 4 0 0 0 0 0Steve Fisher (Illinois St. 1967) 1989-CH,
90, 92-2d*, 93-2d*, 94-RR, 95, 96* 7 20 6 1 2 0 0 1Brian Ellerbe (Rutgers 1985) 1998* 1 1 1 0 0 0 0 0John Beilein (Wheeling Jesuit 1975)
2009, 11, 12, 13-2d, 14-RR, 16, 17 7 13 7 0 1 0 0 1TOTAL 27 54 26 1 5 1 0 6
Yrs. W L CH 2d 3d^ 4th RRMichigan St.Forrest “Forddy” Anderson (Stanford
1942) 1957-4th, 59-RR 2 3 3 0 0 0 1 1George “Jud” Heathcote (Washington St.
1950) 1978-RR, 79-CH, 85, 86, 90, 91, 92, 94, 95 9 14 8 1 0 0 0 1
Tom Izzo (Northern Mich. 1977) 1998, 99-T3d, 2000-CH, 01-T3d, 02, 03-RR, 04, 05-T3d, 06, 07, 08, 09-2d, 10-T3d, 11, 12,13, 14-RR, 15-T3d, 16, 17 20 47 19 1 1 5 0 2
TOTAL 31 64 30 2 1 5 1 4Middle Tenn. Jimmy Earle (Middle Tenn. 1959) 1975,
77 2 0 2 0 0 0 0 0Stan Simpson (Ga. Southern 1961) 1982 1 1 1 0 0 0 0 0Bruce Stewart (Jacksonville St. 1975)
1985, 87, 89 3 1 3 0 0 0 0 0Kermit Davis Jr. (Mississippi St. 1982)
2013, 16, 17 3 2 3 0 0 0 0 0TOTAL 9 4 9 0 0 0 0 0
MilwaukeeBruce Pearl (Boston College 1982)
2003,05 2 2 2 0 0 0 0 0Rob Jeter (Wis.-Platteville 1991) 2006, 14 2 1 2 0 0 0 0 0
TOTAL 4 3 4 0 0 0 0 0Minnesota*Bill Musselman (Wittenberg 1961) 1972* 1 1 1 0 0 0 0 0Jim Dutcher (Michigan 1955) 1982 1 1 1 0 0 0 0 0Clem Haskins (Western Ky. 1967) 1989,
90-RR, 94*, 95*, 97-T3d*, 99 6 10 6 0 0 1 0 1Dan Monson (Idaho 1985) 2005 1 0 1 0 0 0 0 0Tubby Smith (High Point 1973) 2009,
10, 13 3 1 3 0 0 0 0 0Richard Pitino (Providence 2005) 2017 1 0 1 0 0 0 0 0
TOTAL 13 13 13 0 0 1 0 1Mississippi St.James “Babe” McCarthy (Mississippi St.
1949) 1963 1 1 1 0 0 0 0 0Richard Williams (Mississippi St. 1967)
1991, 95, 96-T3d 3 6 3 0 0 1 0 0Rick Stansbury (Campbellsville 1982)
2002, 03, 04, 05, 08, 09 6 4 6 0 0 0 0 0TOTAL 10 11 10 0 0 1 0 0
Mississippi Val.Lafayette Stribling (Miss. Industrial 1957)
1986, 92, 96 3 0 3 0 0 0 0 0James Green (Ole Miss 1983) 2008 1 0 1 0 0 0 0 0Sean Woods (Kentucky 1992) 2012 1 0 1 0 0 0 0 0
TOTAL 5 0 5 0 0 0 0 0Missouri#*George Edwards (Missouri 1913)
1944-RR 1 1 1 0 0 0 0 1Norm Stewart (Missouri 1956) 1976-RR,
78, 80, 81, 82, 83, 86, 87, 88, 89, 90, 92, 93, 94-RR*, 95, 99 16 12 16 0 0 0 0 2
Quin Snyder (Duke 1989) 2000, 01,02-RR, 03 4 5 4 0 0 0 0 1
Mike Anderson (Tulsa 1982) 2009-RR, 10,11 3 4 3 0 0 0 0 1
Frank Haith (Elon 1988) 2012, 13 2 0 2 0 0 0 0 0TOTAL 26 22 26 0 0 0 0 5
Missouri St.Charlie Spoonhour (School of Ozarks
1961) 1987, 88, 89, 90, 92 5 1 5 0 0 0 0 0Steve Alford (Indiana 1987) 1999 1 2 1 0 0 0 0 0
TOTAL 6 3 6 0 0 0 0 0MonmouthWayne Szoke (Maryland 1963) 1996 1 0 1 0 0 0 0 0
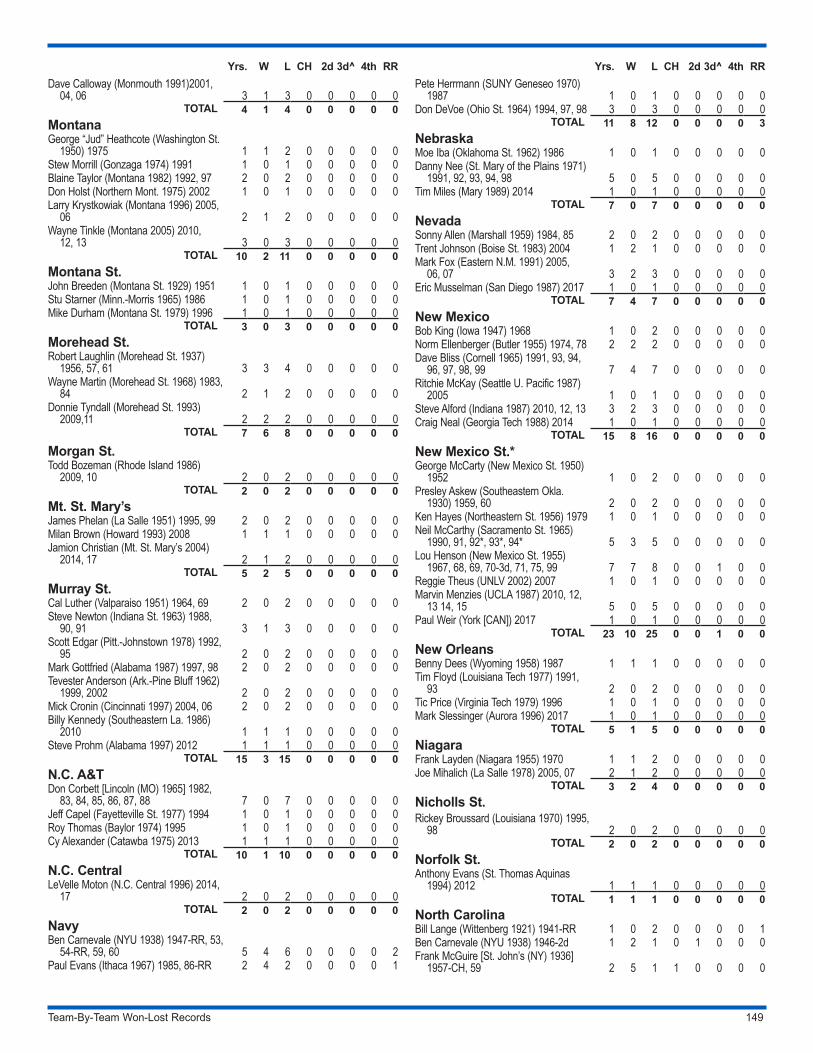
Team-By-Team Won-Lost Records 149
Yrs. W L CH 2d 3d^ 4th RRDave Calloway (Monmouth 1991)2001,
04, 06 3 1 3 0 0 0 0 0TOTAL 4 1 4 0 0 0 0 0
MontanaGeorge “Jud” Heathcote (Washington St.
1950) 1975 1 1 2 0 0 0 0 0Stew Morrill (Gonzaga 1974) 1991 1 0 1 0 0 0 0 0Blaine Taylor (Montana 1982) 1992, 97 2 0 2 0 0 0 0 0Don Holst (Northern Mont. 1975) 2002 1 0 1 0 0 0 0 0Larry Krystkowiak (Montana 1996) 2005,
06 2 1 2 0 0 0 0 0Wayne Tinkle (Montana 2005) 2010,
12, 13 3 0 3 0 0 0 0 0TOTAL 10 2 11 0 0 0 0 0
Montana St.John Breeden (Montana St. 1929) 1951 1 0 1 0 0 0 0 0Stu Starner (Minn.-Morris 1965) 1986 1 0 1 0 0 0 0 0Mike Durham (Montana St. 1979) 1996 1 0 1 0 0 0 0 0
TOTAL 3 0 3 0 0 0 0 0Morehead St.Robert Laughlin (Morehead St. 1937)
1956, 57, 61 3 3 4 0 0 0 0 0Wayne Martin (Morehead St. 1968) 1983,
84 2 1 2 0 0 0 0 0Donnie Tyndall (Morehead St. 1993)
2009,11 2 2 2 0 0 0 0 0TOTAL 7 6 8 0 0 0 0 0
Morgan St.Todd Bozeman (Rhode Island 1986)
2009, 10 2 0 2 0 0 0 0 0TOTAL 2 0 2 0 0 0 0 0
Mt. St. Mary’sJames Phelan (La Salle 1951) 1995, 99 2 0 2 0 0 0 0 0Milan Brown (Howard 1993) 2008 1 1 1 0 0 0 0 0Jamion Christian (Mt. St. Mary’s 2004)
2014, 17 2 1 2 0 0 0 0 0TOTAL 5 2 5 0 0 0 0 0
Murray St.Cal Luther (Valparaiso 1951) 1964, 69 2 0 2 0 0 0 0 0Steve Newton (Indiana St. 1963) 1988,
90, 91 3 1 3 0 0 0 0 0Scott Edgar (Pitt.-Johnstown 1978) 1992,
95 2 0 2 0 0 0 0 0Mark Gottfried (Alabama 1987) 1997, 98 2 0 2 0 0 0 0 0Tevester Anderson (Ark.-Pine Bluff 1962)
1999, 2002 2 0 2 0 0 0 0 0Mick Cronin (Cincinnati 1997) 2004, 06 2 0 2 0 0 0 0 0Billy Kennedy (Southeastern La. 1986)
2010 1 1 1 0 0 0 0 0Steve Prohm (Alabama 1997) 2012 1 1 1 0 0 0 0 0
TOTAL 15 3 15 0 0 0 0 0N.C. A&TDon Corbett [Lincoln (MO) 1965] 1982,
83, 84, 85, 86, 87, 88 7 0 7 0 0 0 0 0Jeff Capel (Fayetteville St. 1977) 1994 1 0 1 0 0 0 0 0Roy Thomas (Baylor 1974) 1995 1 0 1 0 0 0 0 0Cy Alexander (Catawba 1975) 2013 1 1 1 0 0 0 0 0
TOTAL 10 1 10 0 0 0 0 0N.C. CentralLeVelle Moton (N.C. Central 1996) 2014,
17 2 0 2 0 0 0 0 0TOTAL 2 0 2 0 0 0 0 0
NavyBen Carnevale (NYU 1938) 1947-RR, 53,
54-RR, 59, 60 5 4 6 0 0 0 0 2Paul Evans (Ithaca 1967) 1985, 86-RR 2 4 2 0 0 0 0 1
Yrs. W L CH 2d 3d^ 4th RRPete Herrmann (SUNY Geneseo 1970)
1987 1 0 1 0 0 0 0 0Don DeVoe (Ohio St. 1964) 1994, 97, 98 3 0 3 0 0 0 0 0
TOTAL 11 8 12 0 0 0 0 3NebraskaMoe Iba (Oklahoma St. 1962) 1986 1 0 1 0 0 0 0 0Danny Nee (St. Mary of the Plains 1971)
1991, 92, 93, 94, 98 5 0 5 0 0 0 0 0Tim Miles (Mary 1989) 2014 1 0 1 0 0 0 0 0
TOTAL 7 0 7 0 0 0 0 0NevadaSonny Allen (Marshall 1959) 1984, 85 2 0 2 0 0 0 0 0Trent Johnson (Boise St. 1983) 2004 1 2 1 0 0 0 0 0Mark Fox (Eastern N.M. 1991) 2005,
06, 07 3 2 3 0 0 0 0 0Eric Musselman (San Diego 1987) 2017 1 0 1 0 0 0 0 0
TOTAL 7 4 7 0 0 0 0 0New MexicoBob King (Iowa 1947) 1968 1 0 2 0 0 0 0 0Norm Ellenberger (Butler 1955) 1974, 78 2 2 2 0 0 0 0 0Dave Bliss (Cornell 1965) 1991, 93, 94,
96, 97, 98, 99 7 4 7 0 0 0 0 0Ritchie McKay (Seattle U. Pacific 1987)
2005 1 0 1 0 0 0 0 0Steve Alford (Indiana 1987) 2010, 12, 13 3 2 3 0 0 0 0 0Craig Neal (Georgia Tech 1988) 2014 1 0 1 0 0 0 0 0
TOTAL 15 8 16 0 0 0 0 0New Mexico St.*George McCarty (New Mexico St. 1950)
1952 1 0 2 0 0 0 0 0Presley Askew (Southeastern Okla.
1930) 1959, 60 2 0 2 0 0 0 0 0Ken Hayes (Northeastern St. 1956) 1979 1 0 1 0 0 0 0 0Neil McCarthy (Sacramento St. 1965)
1990, 91, 92*, 93*, 94* 5 3 5 0 0 0 0 0Lou Henson (New Mexico St. 1955)
1967, 68, 69, 70-3d, 71, 75, 99 7 7 8 0 0 1 0 0Reggie Theus (UNLV 2002) 2007 1 0 1 0 0 0 0 0Marvin Menzies (UCLA 1987) 2010, 12,
13 14, 15 5 0 5 0 0 0 0 0Paul Weir (York [CAN]) 2017 1 0 1 0 0 0 0 0
TOTAL 23 10 25 0 0 1 0 0New OrleansBenny Dees (Wyoming 1958) 1987 1 1 1 0 0 0 0 0Tim Floyd (Louisiana Tech 1977) 1991,
93 2 0 2 0 0 0 0 0Tic Price (Virginia Tech 1979) 1996 1 0 1 0 0 0 0 0Mark Slessinger (Aurora 1996) 2017 1 0 1 0 0 0 0 0
TOTAL 5 1 5 0 0 0 0 0NiagaraFrank Layden (Niagara 1955) 1970 1 1 2 0 0 0 0 0Joe Mihalich (La Salle 1978) 2005, 07 2 1 2 0 0 0 0 0
TOTAL 3 2 4 0 0 0 0 0Nicholls St.Rickey Broussard (Louisiana 1970) 1995,
98 2 0 2 0 0 0 0 0TOTAL 2 0 2 0 0 0 0 0
Norfolk St.Anthony Evans (St. Thomas Aquinas
1994) 2012 1 1 1 0 0 0 0 0TOTAL 1 1 1 0 0 0 0 0
North CarolinaBill Lange (Wittenberg 1921) 1941-RR 1 0 2 0 0 0 0 1Ben Carnevale (NYU 1938) 1946-2d 1 2 1 0 1 0 0 0Frank McGuire [St. John’s (NY) 1936]
1957-CH, 59 2 5 1 1 0 0 0 0
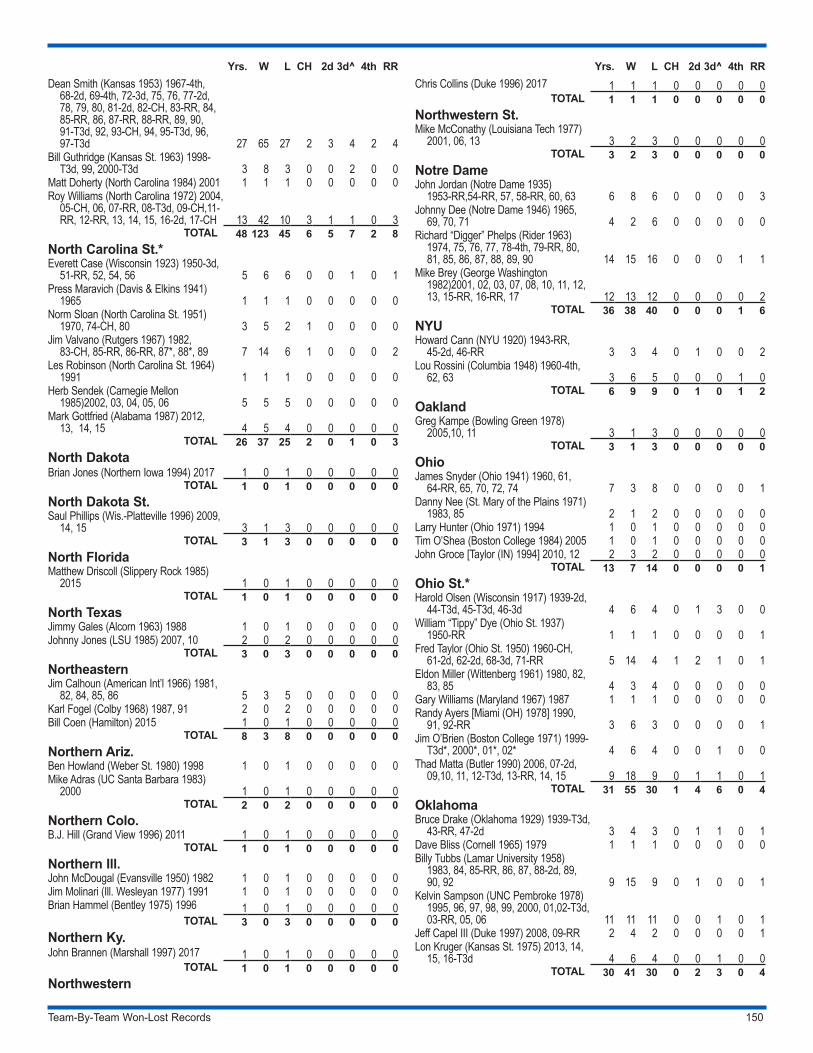
Team-By-Team Won-Lost Records 150
Yrs. W L CH 2d 3d^ 4th RRDean Smith (Kansas 1953) 1967-4th,
68-2d, 69-4th, 72-3d, 75, 76, 77-2d, 78, 79, 80, 81-2d, 82-CH, 83-RR, 84, 85-RR, 86, 87-RR, 88-RR, 89, 90, 91-T3d, 92, 93-CH, 94, 95-T3d, 96, 97-T3d 27 65 27 2 3 4 2 4
Bill Guthridge (Kansas St. 1963) 1998-T3d, 99, 2000-T3d 3 8 3 0 0 2 0 0
Matt Doherty (North Carolina 1984) 2001 1 1 1 0 0 0 0 0Roy Williams (North Carolina 1972) 2004,
05-CH, 06, 07-RR, 08-T3d, 09-CH,11-RR, 12-RR, 13, 14, 15, 16-2d, 17-CH 13 42 10 3 1 1 0 3
TOTAL 48 123 45 6 5 7 2 8North Carolina St.*Everett Case (Wisconsin 1923) 1950-3d,
51-RR, 52, 54, 56 5 6 6 0 0 1 0 1Press Maravich (Davis & Elkins 1941)
1965 1 1 1 0 0 0 0 0Norm Sloan (North Carolina St. 1951)
1970, 74-CH, 80 3 5 2 1 0 0 0 0Jim Valvano (Rutgers 1967) 1982,
83-CH, 85-RR, 86-RR, 87*, 88*, 89 7 14 6 1 0 0 0 2Les Robinson (North Carolina St. 1964)
1991 1 1 1 0 0 0 0 0Herb Sendek (Carnegie Mellon
1985)2002, 03, 04, 05, 06 5 5 5 0 0 0 0 0Mark Gottfried (Alabama 1987) 2012,
13, 14, 15 4 5 4 0 0 0 0 0TOTAL 26 37 25 2 0 1 0 3
North DakotaBrian Jones (Northern Iowa 1994) 2017 1 0 1 0 0 0 0 0
TOTAL 1 0 1 0 0 0 0 0North Dakota St.Saul Phillips (Wis.-Platteville 1996) 2009,
14, 15 3 1 3 0 0 0 0 0TOTAL 3 1 3 0 0 0 0 0
North FloridaMatthew Driscoll (Slippery Rock 1985)
2015 1 0 1 0 0 0 0 0TOTAL 1 0 1 0 0 0 0 0
North TexasJimmy Gales (Alcorn 1963) 1988 1 0 1 0 0 0 0 0Johnny Jones (LSU 1985) 2007, 10 2 0 2 0 0 0 0 0
TOTAL 3 0 3 0 0 0 0 0NortheasternJim Calhoun (American Int’l 1966) 1981,
82, 84, 85, 86 5 3 5 0 0 0 0 0Karl Fogel (Colby 1968) 1987, 91 2 0 2 0 0 0 0 0Bill Coen (Hamilton) 2015 1 0 1 0 0 0 0 0
TOTAL 8 3 8 0 0 0 0 0Northern Ariz.Ben Howland (Weber St. 1980) 1998 1 0 1 0 0 0 0 0Mike Adras (UC Santa Barbara 1983)
2000 1 0 1 0 0 0 0 0TOTAL 2 0 2 0 0 0 0 0
Northern Colo.B.J. Hill (Grand View 1996) 2011 1 0 1 0 0 0 0 0
TOTAL 1 0 1 0 0 0 0 0Northern Ill.John McDougal (Evansville 1950) 1982 1 0 1 0 0 0 0 0Jim Molinari (Ill. Wesleyan 1977) 1991 1 0 1 0 0 0 0 0Brian Hammel (Bentley 1975) 1996 1 0 1 0 0 0 0 0
TOTAL 3 0 3 0 0 0 0 0Northern Ky.John Brannen (Marshall 1997) 2017 1 0 1 0 0 0 0 0
TOTAL 1 0 1 0 0 0 0 0Northwestern
Yrs. W L CH 2d 3d^ 4th RRChris Collins (Duke 1996) 2017 1 1 1 0 0 0 0 0
TOTAL 1 1 1 0 0 0 0 0Northwestern St.Mike McConathy (Louisiana Tech 1977)
2001, 06, 13 3 2 3 0 0 0 0 0TOTAL 3 2 3 0 0 0 0 0
Notre DameJohn Jordan (Notre Dame 1935)
1953-RR,54-RR, 57, 58-RR, 60, 63 6 8 6 0 0 0 0 3Johnny Dee (Notre Dame 1946) 1965,
69, 70, 71 4 2 6 0 0 0 0 0Richard “Digger” Phelps (Rider 1963)
1974, 75, 76, 77, 78-4th, 79-RR, 80, 81, 85, 86, 87, 88, 89, 90 14 15 16 0 0 0 1 1
Mike Brey (George Washington 1982)2001, 02, 03, 07, 08, 10, 11, 12, 13, 15-RR, 16-RR, 17 12 13 12 0 0 0 0 2
TOTAL 36 38 40 0 0 0 1 6NYUHoward Cann (NYU 1920) 1943-RR,
45-2d, 46-RR 3 3 4 0 1 0 0 2Lou Rossini (Columbia 1948) 1960-4th,
62, 63 3 6 5 0 0 0 1 0TOTAL 6 9 9 0 1 0 1 2
OaklandGreg Kampe (Bowling Green 1978)
2005,10, 11 3 1 3 0 0 0 0 0TOTAL 3 1 3 0 0 0 0 0
OhioJames Snyder (Ohio 1941) 1960, 61,
64-RR, 65, 70, 72, 74 7 3 8 0 0 0 0 1Danny Nee (St. Mary of the Plains 1971)
1983, 85 2 1 2 0 0 0 0 0Larry Hunter (Ohio 1971) 1994 1 0 1 0 0 0 0 0Tim O’Shea (Boston College 1984) 2005 1 0 1 0 0 0 0 0John Groce [Taylor (IN) 1994] 2010, 12 2 3 2 0 0 0 0 0
TOTAL 13 7 14 0 0 0 0 1Ohio St.*Harold Olsen (Wisconsin 1917) 1939-2d,
44-T3d, 45-T3d, 46-3d 4 6 4 0 1 3 0 0William “Tippy” Dye (Ohio St. 1937)
1950-RR 1 1 1 0 0 0 0 1Fred Taylor (Ohio St. 1950) 1960-CH,
61-2d, 62-2d, 68-3d, 71-RR 5 14 4 1 2 1 0 1Eldon Miller (Wittenberg 1961) 1980, 82,
83, 85 4 3 4 0 0 0 0 0Gary Williams (Maryland 1967) 1987 1 1 1 0 0 0 0 0Randy Ayers [Miami (OH) 1978] 1990,
91, 92-RR 3 6 3 0 0 0 0 1Jim O’Brien (Boston College 1971) 1999-
T3d*, 2000*, 01*, 02* 4 6 4 0 0 1 0 0Thad Matta (Butler 1990) 2006, 07-2d,
09,10, 11, 12-T3d, 13-RR, 14, 15 9 18 9 0 1 1 0 1TOTAL 31 55 30 1 4 6 0 4
OklahomaBruce Drake (Oklahoma 1929) 1939-T3d,
43-RR, 47-2d 3 4 3 0 1 1 0 1Dave Bliss (Cornell 1965) 1979 1 1 1 0 0 0 0 0Billy Tubbs (Lamar University 1958)
1983, 84, 85-RR, 86, 87, 88-2d, 89, 90, 92 9 15 9 0 1 0 0 1
Kelvin Sampson (UNC Pembroke 1978) 1995, 96, 97, 98, 99, 2000, 01,02-T3d, 03-RR, 05, 06 11 11 11 0 0 1 0 1
Jeff Capel III (Duke 1997) 2008, 09-RR 2 4 2 0 0 0 0 1Lon Kruger (Kansas St. 1975) 2013, 14,
15, 16-T3d 4 6 4 0 0 1 0 0TOTAL 30 41 30 0 2 3 0 4
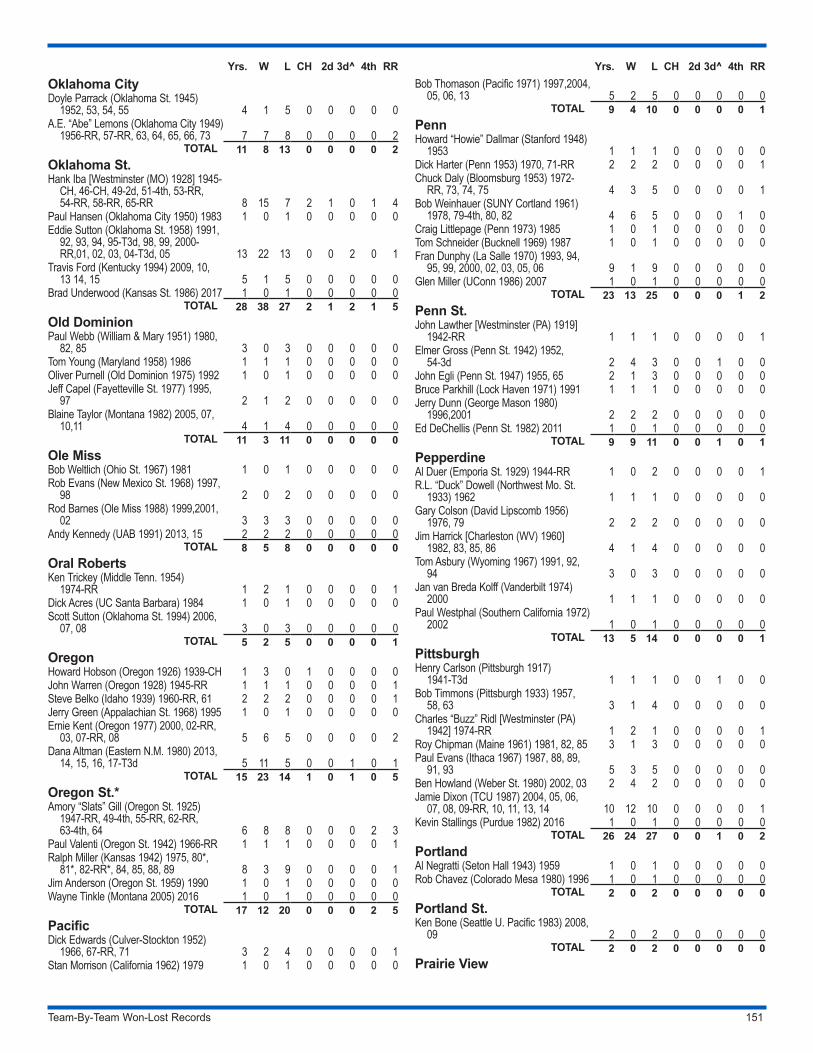
Team-By-Team Won-Lost Records 151
Yrs. W L CH 2d 3d^ 4th RROklahoma CityDoyle Parrack (Oklahoma St. 1945)
1952, 53, 54, 55 4 1 5 0 0 0 0 0A.E. “Abe” Lemons (Oklahoma City 1949)
1956-RR, 57-RR, 63, 64, 65, 66, 73 7 7 8 0 0 0 0 2TOTAL 11 8 13 0 0 0 0 2
Oklahoma St.Hank Iba [Westminster (MO) 1928] 1945-
CH, 46-CH, 49-2d, 51-4th, 53-RR, 54-RR, 58-RR, 65-RR 8 15 7 2 1 0 1 4
Paul Hansen (Oklahoma City 1950) 1983 1 0 1 0 0 0 0 0Eddie Sutton (Oklahoma St. 1958) 1991,
92, 93, 94, 95-T3d, 98, 99, 2000-RR,01, 02, 03, 04-T3d, 05 13 22 13 0 0 2 0 1
Travis Ford (Kentucky 1994) 2009, 10, 13 14, 15 5 1 5 0 0 0 0 0
Brad Underwood (Kansas St. 1986) 2017 1 0 1 0 0 0 0 0TOTAL 28 38 27 2 1 2 1 5
Old DominionPaul Webb (William & Mary 1951) 1980,
82, 85 3 0 3 0 0 0 0 0Tom Young (Maryland 1958) 1986 1 1 1 0 0 0 0 0Oliver Purnell (Old Dominion 1975) 1992 1 0 1 0 0 0 0 0Jeff Capel (Fayetteville St. 1977) 1995,
97 2 1 2 0 0 0 0 0Blaine Taylor (Montana 1982) 2005, 07,
10,11 4 1 4 0 0 0 0 0TOTAL 11 3 11 0 0 0 0 0
Ole Miss Bob Weltlich (Ohio St. 1967) 1981 1 0 1 0 0 0 0 0Rob Evans (New Mexico St. 1968) 1997,
98 2 0 2 0 0 0 0 0Rod Barnes (Ole Miss 1988) 1999,2001,
02 3 3 3 0 0 0 0 0Andy Kennedy (UAB 1991) 2013, 15 2 2 2 0 0 0 0 0
TOTAL 8 5 8 0 0 0 0 0Oral RobertsKen Trickey (Middle Tenn. 1954)
1974-RR 1 2 1 0 0 0 0 1Dick Acres (UC Santa Barbara) 1984 1 0 1 0 0 0 0 0Scott Sutton (Oklahoma St. 1994) 2006,
07, 08 3 0 3 0 0 0 0 0TOTAL 5 2 5 0 0 0 0 1
OregonHoward Hobson (Oregon 1926) 1939-CH 1 3 0 1 0 0 0 0John Warren (Oregon 1928) 1945-RR 1 1 1 0 0 0 0 1Steve Belko (Idaho 1939) 1960-RR, 61 2 2 2 0 0 0 0 1Jerry Green (Appalachian St. 1968) 1995 1 0 1 0 0 0 0 0Ernie Kent (Oregon 1977) 2000, 02-RR,
03, 07-RR, 08 5 6 5 0 0 0 0 2Dana Altman (Eastern N.M. 1980) 2013,
14, 15, 16, 17-T3d 5 11 5 0 0 1 0 1TOTAL 15 23 14 1 0 1 0 5
Oregon St.*Amory “Slats” Gill (Oregon St. 1925)
1947-RR, 49-4th, 55-RR, 62-RR, 63-4th, 64 6 8 8 0 0 0 2 3
Paul Valenti (Oregon St. 1942) 1966-RR 1 1 1 0 0 0 0 1Ralph Miller (Kansas 1942) 1975, 80*,
81*, 82-RR*, 84, 85, 88, 89 8 3 9 0 0 0 0 1Jim Anderson (Oregon St. 1959) 1990 1 0 1 0 0 0 0 0Wayne Tinkle (Montana 2005) 2016 1 0 1 0 0 0 0 0
TOTAL 17 12 20 0 0 0 2 5PacificDick Edwards (Culver-Stockton 1952)
1966, 67-RR, 71 3 2 4 0 0 0 0 1Stan Morrison (California 1962) 1979 1 0 1 0 0 0 0 0
Yrs. W L CH 2d 3d^ 4th RRBob Thomason (Pacific 1971) 1997,2004,
05, 06, 13 5 2 5 0 0 0 0 0TOTAL 9 4 10 0 0 0 0 1
PennHoward “Howie” Dallmar (Stanford 1948)
1953 1 1 1 0 0 0 0 0Dick Harter (Penn 1953) 1970, 71-RR 2 2 2 0 0 0 0 1Chuck Daly (Bloomsburg 1953) 1972-
RR, 73, 74, 75 4 3 5 0 0 0 0 1Bob Weinhauer (SUNY Cortland 1961)
1978, 79-4th, 80, 82 4 6 5 0 0 0 1 0Craig Littlepage (Penn 1973) 1985 1 0 1 0 0 0 0 0Tom Schneider (Bucknell 1969) 1987 1 0 1 0 0 0 0 0Fran Dunphy (La Salle 1970) 1993, 94,
95, 99, 2000, 02, 03, 05, 06 9 1 9 0 0 0 0 0Glen Miller (UConn 1986) 2007 1 0 1 0 0 0 0 0
TOTAL 23 13 25 0 0 0 1 2Penn St.John Lawther [Westminster (PA) 1919]
1942-RR 1 1 1 0 0 0 0 1Elmer Gross (Penn St. 1942) 1952,
54-3d 2 4 3 0 0 1 0 0John Egli (Penn St. 1947) 1955, 65 2 1 3 0 0 0 0 0Bruce Parkhill (Lock Haven 1971) 1991 1 1 1 0 0 0 0 0Jerry Dunn (George Mason 1980)
1996,2001 2 2 2 0 0 0 0 0Ed DeChellis (Penn St. 1982) 2011 1 0 1 0 0 0 0 0
TOTAL 9 9 11 0 0 1 0 1PepperdineAl Duer (Emporia St. 1929) 1944-RR 1 0 2 0 0 0 0 1R.L. “Duck” Dowell (Northwest Mo. St.
1933) 1962 1 1 1 0 0 0 0 0Gary Colson (David Lipscomb 1956)
1976, 79 2 2 2 0 0 0 0 0Jim Harrick [Charleston (WV) 1960]
1982, 83, 85, 86 4 1 4 0 0 0 0 0Tom Asbury (Wyoming 1967) 1991, 92,
94 3 0 3 0 0 0 0 0Jan van Breda Kolff (Vanderbilt 1974)
2000 1 1 1 0 0 0 0 0Paul Westphal (Southern California 1972)
2002 1 0 1 0 0 0 0 0TOTAL 13 5 14 0 0 0 0 1
PittsburghHenry Carlson (Pittsburgh 1917)
1941-T3d 1 1 1 0 0 1 0 0Bob Timmons (Pittsburgh 1933) 1957,
58, 63 3 1 4 0 0 0 0 0Charles “Buzz” Ridl [Westminster (PA)
1942] 1974-RR 1 2 1 0 0 0 0 1Roy Chipman (Maine 1961) 1981, 82, 85 3 1 3 0 0 0 0 0Paul Evans (Ithaca 1967) 1987, 88, 89,
91, 93 5 3 5 0 0 0 0 0Ben Howland (Weber St. 1980) 2002, 03 2 4 2 0 0 0 0 0Jamie Dixon (TCU 1987) 2004, 05, 06,
07, 08, 09-RR, 10, 11, 13, 14 10 12 10 0 0 0 0 1Kevin Stallings (Purdue 1982) 2016 1 0 1 0 0 0 0 0
TOTAL 26 24 27 0 0 1 0 2PortlandAl Negratti (Seton Hall 1943) 1959 1 0 1 0 0 0 0 0Rob Chavez (Colorado Mesa 1980) 1996 1 0 1 0 0 0 0 0
TOTAL 2 0 2 0 0 0 0 0Portland St.Ken Bone (Seattle U. Pacific 1983) 2008,
09 2 0 2 0 0 0 0 0TOTAL 2 0 2 0 0 0 0 0
Prairie View
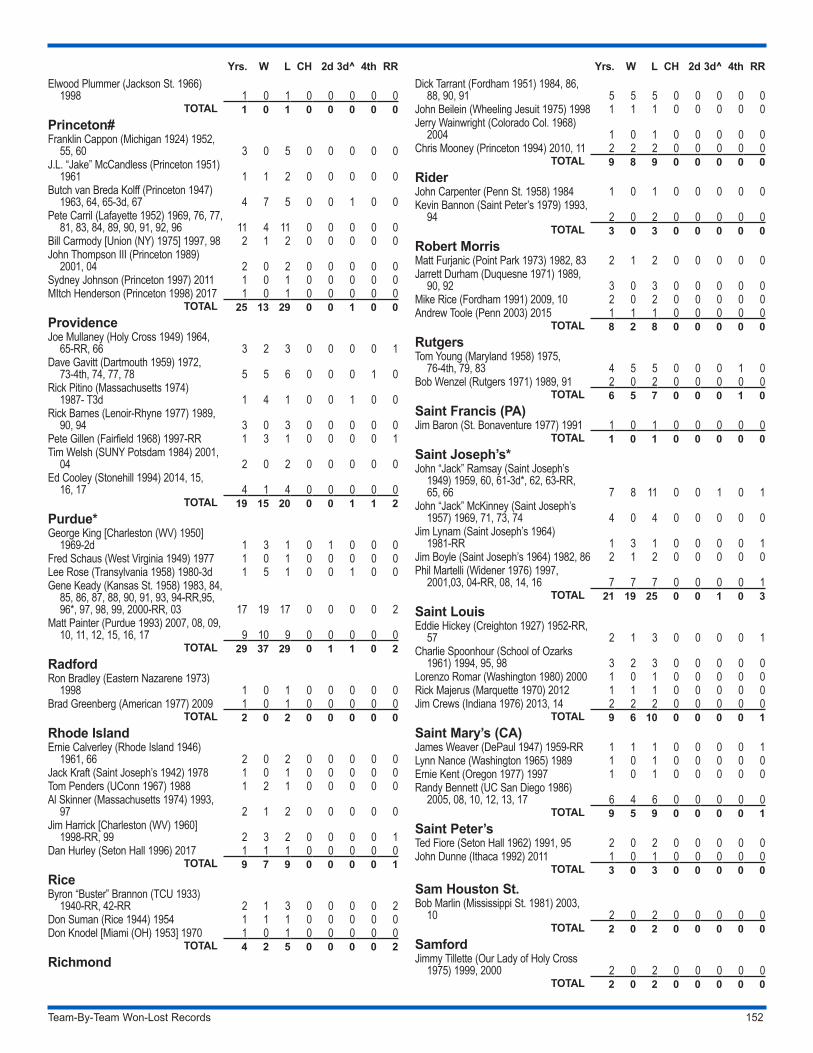
Team-By-Team Won-Lost Records 152
Yrs. W L CH 2d 3d^ 4th RRElwood Plummer (Jackson St. 1966)
1998 1 0 1 0 0 0 0 0TOTAL 1 0 1 0 0 0 0 0
Princeton#Franklin Cappon (Michigan 1924) 1952,
55, 60 3 0 5 0 0 0 0 0J.L. “Jake” McCandless (Princeton 1951)
1961 1 1 2 0 0 0 0 0Butch van Breda Kolff (Princeton 1947)
1963, 64, 65-3d, 67 4 7 5 0 0 1 0 0Pete Carril (Lafayette 1952) 1969, 76, 77,
81, 83, 84, 89, 90, 91, 92, 96 11 4 11 0 0 0 0 0Bill Carmody [Union (NY) 1975] 1997, 98 2 1 2 0 0 0 0 0John Thompson III (Princeton 1989)
2001, 04 2 0 2 0 0 0 0 0Sydney Johnson (Princeton 1997) 2011 1 0 1 0 0 0 0 0MItch Henderson (Princeton 1998) 2017 1 0 1 0 0 0 0 0
TOTAL 25 13 29 0 0 1 0 0ProvidenceJoe Mullaney (Holy Cross 1949) 1964,
65-RR, 66 3 2 3 0 0 0 0 1Dave Gavitt (Dartmouth 1959) 1972,
73-4th, 74, 77, 78 5 5 6 0 0 0 1 0Rick Pitino (Massachusetts 1974)
1987- T3d 1 4 1 0 0 1 0 0Rick Barnes (Lenoir-Rhyne 1977) 1989,
90, 94 3 0 3 0 0 0 0 0Pete Gillen (Fairfield 1968) 1997-RR 1 3 1 0 0 0 0 1Tim Welsh (SUNY Potsdam 1984) 2001,
04 2 0 2 0 0 0 0 0Ed Cooley (Stonehill 1994) 2014, 15,
16, 17 4 1 4 0 0 0 0 0TOTAL 19 15 20 0 0 1 1 2
Purdue*George King [Charleston (WV) 1950]
1969-2d 1 3 1 0 1 0 0 0Fred Schaus (West Virginia 1949) 1977 1 0 1 0 0 0 0 0Lee Rose (Transylvania 1958) 1980-3d 1 5 1 0 0 1 0 0Gene Keady (Kansas St. 1958) 1983, 84,
85, 86, 87, 88, 90, 91, 93, 94-RR,95, 96*, 97, 98, 99, 2000-RR, 03 17 19 17 0 0 0 0 2
Matt Painter (Purdue 1993) 2007, 08, 09, 10, 11, 12, 15, 16, 17 9 10 9 0 0 0 0 0
TOTAL 29 37 29 0 1 1 0 2RadfordRon Bradley (Eastern Nazarene 1973)
1998 1 0 1 0 0 0 0 0Brad Greenberg (American 1977) 2009 1 0 1 0 0 0 0 0
TOTAL 2 0 2 0 0 0 0 0Rhode IslandErnie Calverley (Rhode Island 1946)
1961, 66 2 0 2 0 0 0 0 0Jack Kraft (Saint Joseph’s 1942) 1978 1 0 1 0 0 0 0 0Tom Penders (UConn 1967) 1988 1 2 1 0 0 0 0 0Al Skinner (Massachusetts 1974) 1993,
97 2 1 2 0 0 0 0 0Jim Harrick [Charleston (WV) 1960]
1998-RR, 99 2 3 2 0 0 0 0 1Dan Hurley (Seton Hall 1996) 2017 1 1 1 0 0 0 0 0
TOTAL 9 7 9 0 0 0 0 1RiceByron “Buster” Brannon (TCU 1933)
1940-RR, 42-RR 2 1 3 0 0 0 0 2Don Suman (Rice 1944) 1954 1 1 1 0 0 0 0 0Don Knodel [Miami (OH) 1953] 1970 1 0 1 0 0 0 0 0
TOTAL 4 2 5 0 0 0 0 2Richmond
Yrs. W L CH 2d 3d^ 4th RRDick Tarrant (Fordham 1951) 1984, 86,
88, 90, 91 5 5 5 0 0 0 0 0John Beilein (Wheeling Jesuit 1975) 1998 1 1 1 0 0 0 0 0Jerry Wainwright (Colorado Col. 1968)
2004 1 0 1 0 0 0 0 0Chris Mooney (Princeton 1994) 2010, 11 2 2 2 0 0 0 0 0
TOTAL 9 8 9 0 0 0 0 0RiderJohn Carpenter (Penn St. 1958) 1984 1 0 1 0 0 0 0 0Kevin Bannon (Saint Peter’s 1979) 1993,
94 2 0 2 0 0 0 0 0TOTAL 3 0 3 0 0 0 0 0
Robert MorrisMatt Furjanic (Point Park 1973) 1982, 83 2 1 2 0 0 0 0 0Jarrett Durham (Duquesne 1971) 1989,
90, 92 3 0 3 0 0 0 0 0Mike Rice (Fordham 1991) 2009, 10 2 0 2 0 0 0 0 0Andrew Toole (Penn 2003) 2015 1 1 1 0 0 0 0 0
TOTAL 8 2 8 0 0 0 0 0RutgersTom Young (Maryland 1958) 1975,
76-4th, 79, 83 4 5 5 0 0 0 1 0Bob Wenzel (Rutgers 1971) 1989, 91 2 0 2 0 0 0 0 0
TOTAL 6 5 7 0 0 0 1 0Saint Francis (PA)Jim Baron (St. Bonaventure 1977) 1991 1 0 1 0 0 0 0 0
TOTAL 1 0 1 0 0 0 0 0Saint Joseph’s*John “Jack” Ramsay (Saint Joseph’s
1949) 1959, 60, 61-3d*, 62, 63-RR, 65, 66 7 8 11 0 0 1 0 1
John “Jack” McKinney (Saint Joseph’s 1957) 1969, 71, 73, 74 4 0 4 0 0 0 0 0
Jim Lynam (Saint Joseph’s 1964) 1981-RR 1 3 1 0 0 0 0 1
Jim Boyle (Saint Joseph’s 1964) 1982, 86 2 1 2 0 0 0 0 0Phil Martelli (Widener 1976) 1997,
2001,03, 04-RR, 08, 14, 16 7 7 7 0 0 0 0 1TOTAL 21 19 25 0 0 1 0 3
Saint LouisEddie Hickey (Creighton 1927) 1952-RR,
57 2 1 3 0 0 0 0 1Charlie Spoonhour (School of Ozarks
1961) 1994, 95, 98 3 2 3 0 0 0 0 0Lorenzo Romar (Washington 1980) 2000 1 0 1 0 0 0 0 0Rick Majerus (Marquette 1970) 2012 1 1 1 0 0 0 0 0Jim Crews (Indiana 1976) 2013, 14 2 2 2 0 0 0 0 0
TOTAL 9 6 10 0 0 0 0 1Saint Mary’s (CA)James Weaver (DePaul 1947) 1959-RR 1 1 1 0 0 0 0 1Lynn Nance (Washington 1965) 1989 1 0 1 0 0 0 0 0Ernie Kent (Oregon 1977) 1997 1 0 1 0 0 0 0 0Randy Bennett (UC San Diego 1986)
2005, 08, 10, 12, 13, 17 6 4 6 0 0 0 0 0TOTAL 9 5 9 0 0 0 0 1
Saint Peter’sTed Fiore (Seton Hall 1962) 1991, 95 2 0 2 0 0 0 0 0John Dunne (Ithaca 1992) 2011 1 0 1 0 0 0 0 0
TOTAL 3 0 3 0 0 0 0 0
Sam Houston St.Bob Marlin (Mississippi St. 1981) 2003,
10 2 0 2 0 0 0 0 0TOTAL 2 0 2 0 0 0 0 0
SamfordJimmy Tillette (Our Lady of Holy Cross
1975) 1999, 2000 2 0 2 0 0 0 0 0TOTAL 2 0 2 0 0 0 0 0
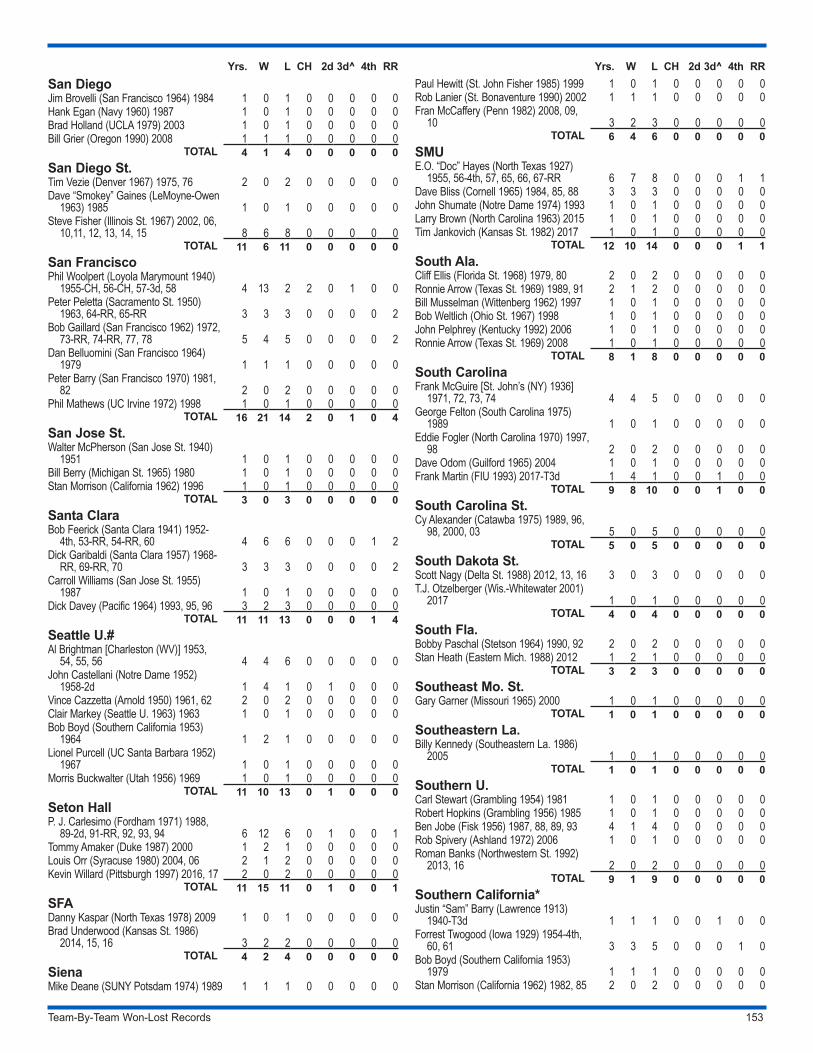
Team-By-Team Won-Lost Records 153
Yrs. W L CH 2d 3d^ 4th RRSan DiegoJim Brovelli (San Francisco 1964) 1984 1 0 1 0 0 0 0 0Hank Egan (Navy 1960) 1987 1 0 1 0 0 0 0 0Brad Holland (UCLA 1979) 2003 1 0 1 0 0 0 0 0Bill Grier (Oregon 1990) 2008 1 1 1 0 0 0 0 0
TOTAL 4 1 4 0 0 0 0 0San Diego St.Tim Vezie (Denver 1967) 1975, 76 2 0 2 0 0 0 0 0Dave “Smokey” Gaines (LeMoyne-Owen
1963) 1985 1 0 1 0 0 0 0 0Steve Fisher (Illinois St. 1967) 2002, 06,
10,11, 12, 13, 14, 15 8 6 8 0 0 0 0 0TOTAL 11 6 11 0 0 0 0 0
San FranciscoPhil Woolpert (Loyola Marymount 1940)
1955-CH, 56-CH, 57-3d, 58 4 13 2 2 0 1 0 0Peter Peletta (Sacramento St. 1950)
1963, 64-RR, 65-RR 3 3 3 0 0 0 0 2Bob Gaillard (San Francisco 1962) 1972,
73-RR, 74-RR, 77, 78 5 4 5 0 0 0 0 2Dan Belluomini (San Francisco 1964)
1979 1 1 1 0 0 0 0 0Peter Barry (San Francisco 1970) 1981,
82 2 0 2 0 0 0 0 0Phil Mathews (UC Irvine 1972) 1998 1 0 1 0 0 0 0 0
TOTAL 16 21 14 2 0 1 0 4San Jose St.Walter McPherson (San Jose St. 1940)
1951 1 0 1 0 0 0 0 0Bill Berry (Michigan St. 1965) 1980 1 0 1 0 0 0 0 0Stan Morrison (California 1962) 1996 1 0 1 0 0 0 0 0
TOTAL 3 0 3 0 0 0 0 0Santa ClaraBob Feerick (Santa Clara 1941) 1952-
4th, 53-RR, 54-RR, 60 4 6 6 0 0 0 1 2Dick Garibaldi (Santa Clara 1957) 1968-
RR, 69-RR, 70 3 3 3 0 0 0 0 2Carroll Williams (San Jose St. 1955)
1987 1 0 1 0 0 0 0 0Dick Davey (Pacific 1964) 1993, 95, 96 3 2 3 0 0 0 0 0
TOTAL 11 11 13 0 0 0 1 4Seattle U.#Al Brightman [Charleston (WV)] 1953,
54, 55, 56 4 4 6 0 0 0 0 0John Castellani (Notre Dame 1952)
1958-2d 1 4 1 0 1 0 0 0Vince Cazzetta (Arnold 1950) 1961, 62 2 0 2 0 0 0 0 0Clair Markey (Seattle U. 1963) 1963 1 0 1 0 0 0 0 0Bob Boyd (Southern California 1953)
1964 1 2 1 0 0 0 0 0Lionel Purcell (UC Santa Barbara 1952)
1967 1 0 1 0 0 0 0 0Morris Buckwalter (Utah 1956) 1969 1 0 1 0 0 0 0 0
TOTAL 11 10 13 0 1 0 0 0Seton HallP. J. Carlesimo (Fordham 1971) 1988,
89-2d, 91-RR, 92, 93, 94 6 12 6 0 1 0 0 1Tommy Amaker (Duke 1987) 2000 1 2 1 0 0 0 0 0Louis Orr (Syracuse 1980) 2004, 06 2 1 2 0 0 0 0 0Kevin Willard (Pittsburgh 1997) 2016, 17 2 0 2 0 0 0 0 0
TOTAL 11 15 11 0 1 0 0 1SFADanny Kaspar (North Texas 1978) 2009 1 0 1 0 0 0 0 0Brad Underwood (Kansas St. 1986)
2014, 15, 16 3 2 2 0 0 0 0 0TOTAL 4 2 4 0 0 0 0 0
SienaMike Deane (SUNY Potsdam 1974) 1989 1 1 1 0 0 0 0 0
Yrs. W L CH 2d 3d^ 4th RRPaul Hewitt (St. John Fisher 1985) 1999 1 0 1 0 0 0 0 0Rob Lanier (St. Bonaventure 1990) 2002 1 1 1 0 0 0 0 0Fran McCaffery (Penn 1982) 2008, 09,
10 3 2 3 0 0 0 0 0TOTAL 6 4 6 0 0 0 0 0
SMUE.O. “Doc” Hayes (North Texas 1927)
1955, 56-4th, 57, 65, 66, 67-RR 6 7 8 0 0 0 1 1Dave Bliss (Cornell 1965) 1984, 85, 88 3 3 3 0 0 0 0 0John Shumate (Notre Dame 1974) 1993 1 0 1 0 0 0 0 0Larry Brown (North Carolina 1963) 2015 1 0 1 0 0 0 0 0Tim Jankovich (Kansas St. 1982) 2017 1 0 1 0 0 0 0 0
TOTAL 12 10 14 0 0 0 1 1South Ala.Cliff Ellis (Florida St. 1968) 1979, 80 2 0 2 0 0 0 0 0Ronnie Arrow (Texas St. 1969) 1989, 91 2 1 2 0 0 0 0 0Bill Musselman (Wittenberg 1962) 1997 1 0 1 0 0 0 0 0Bob Weltlich (Ohio St. 1967) 1998 1 0 1 0 0 0 0 0John Pelphrey (Kentucky 1992) 2006 1 0 1 0 0 0 0 0Ronnie Arrow (Texas St. 1969) 2008 1 0 1 0 0 0 0 0
TOTAL 8 1 8 0 0 0 0 0South CarolinaFrank McGuire [St. John’s (NY) 1936]
1971, 72, 73, 74 4 4 5 0 0 0 0 0George Felton (South Carolina 1975)
1989 1 0 1 0 0 0 0 0Eddie Fogler (North Carolina 1970) 1997,
98 2 0 2 0 0 0 0 0Dave Odom (Guilford 1965) 2004 1 0 1 0 0 0 0 0Frank Martin (FIU 1993) 2017-T3d 1 4 1 0 0 1 0 0
TOTAL 9 8 10 0 0 1 0 0South Carolina St.Cy Alexander (Catawba 1975) 1989, 96,
98, 2000, 03 5 0 5 0 0 0 0 0TOTAL 5 0 5 0 0 0 0 0
South Dakota St.Scott Nagy (Delta St. 1988) 2012, 13, 16 3 0 3 0 0 0 0 0T.J. Otzelberger (Wis.-Whitewater 2001)
2017 1 0 1 0 0 0 0 0TOTAL 4 0 4 0 0 0 0 0
South Fla.Bobby Paschal (Stetson 1964) 1990, 92 2 0 2 0 0 0 0 0Stan Heath (Eastern Mich. 1988) 2012 1 2 1 0 0 0 0 0
TOTAL 3 2 3 0 0 0 0 0Southeast Mo. St.Gary Garner (Missouri 1965) 2000 1 0 1 0 0 0 0 0
TOTAL 1 0 1 0 0 0 0 0Southeastern La.Billy Kennedy (Southeastern La. 1986)
2005 1 0 1 0 0 0 0 0TOTAL 1 0 1 0 0 0 0 0
Southern U.Carl Stewart (Grambling 1954) 1981 1 0 1 0 0 0 0 0Robert Hopkins (Grambling 1956) 1985 1 0 1 0 0 0 0 0Ben Jobe (Fisk 1956) 1987, 88, 89, 93 4 1 4 0 0 0 0 0Rob Spivery (Ashland 1972) 2006 1 0 1 0 0 0 0 0Roman Banks (Northwestern St. 1992)
2013, 16 2 0 2 0 0 0 0 0TOTAL 9 1 9 0 0 0 0 0
Southern California*Justin “Sam” Barry (Lawrence 1913)
1940-T3d 1 1 1 0 0 1 0 0Forrest Twogood (Iowa 1929) 1954-4th,
60, 61 3 3 5 0 0 0 1 0Bob Boyd (Southern California 1953)
1979 1 1 1 0 0 0 0 0Stan Morrison (California 1962) 1982, 85 2 0 2 0 0 0 0 0
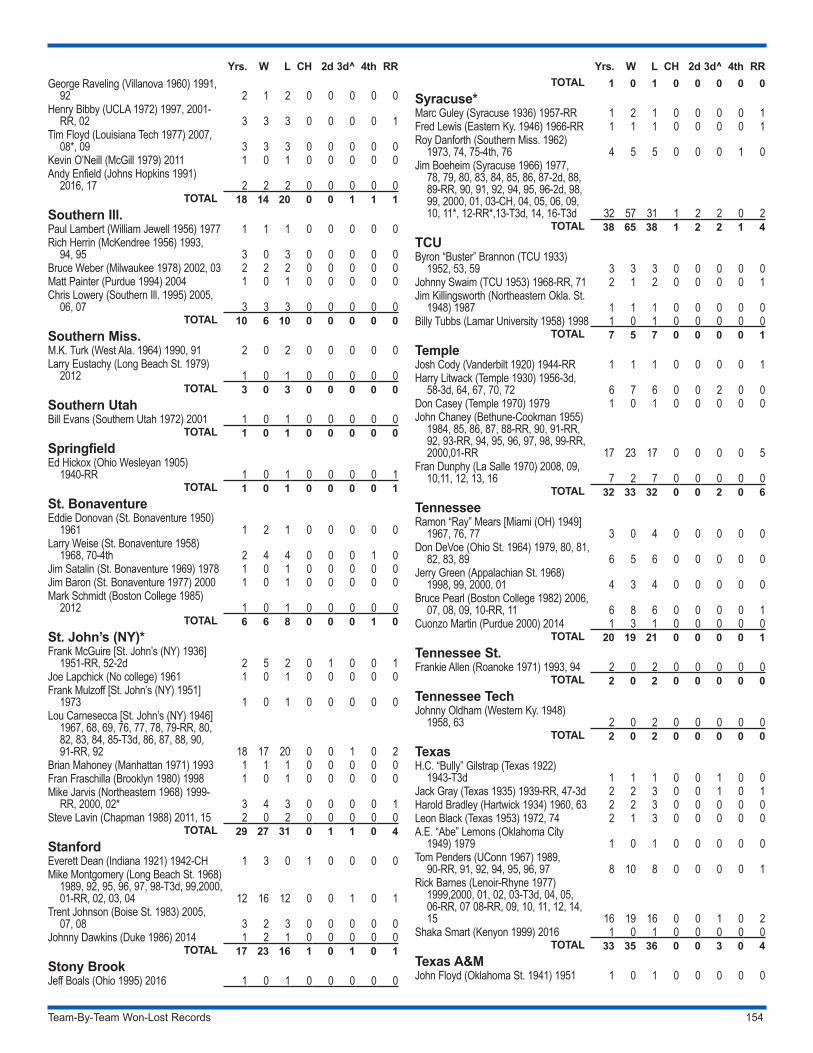
Team-By-Team Won-Lost Records 154
Yrs. W L CH 2d 3d^ 4th RRGeorge Raveling (Villanova 1960) 1991,
92 2 1 2 0 0 0 0 0Henry Bibby (UCLA 1972) 1997, 2001-
RR, 02 3 3 3 0 0 0 0 1Tim Floyd (Louisiana Tech 1977) 2007,
08*, 09 3 3 3 0 0 0 0 0Kevin O’Neill (McGill 1979) 2011 1 0 1 0 0 0 0 0Andy Enfield (Johns Hopkins 1991)
2016, 17 2 2 2 0 0 0 0 0TOTAL 18 14 20 0 0 1 1 1
Southern Ill.Paul Lambert (William Jewell 1956) 1977 1 1 1 0 0 0 0 0Rich Herrin (McKendree 1956) 1993,
94, 95 3 0 3 0 0 0 0 0Bruce Weber (Milwaukee 1978) 2002, 03 2 2 2 0 0 0 0 0Matt Painter (Purdue 1994) 2004 1 0 1 0 0 0 0 0Chris Lowery (Southern Ill. 1995) 2005,
06, 07 3 3 3 0 0 0 0 0TOTAL 10 6 10 0 0 0 0 0
Southern Miss.M.K. Turk (West Ala. 1964) 1990, 91 2 0 2 0 0 0 0 0Larry Eustachy (Long Beach St. 1979)
2012 1 0 1 0 0 0 0 0TOTAL 3 0 3 0 0 0 0 0
Southern UtahBill Evans (Southern Utah 1972) 2001 1 0 1 0 0 0 0 0
TOTAL 1 0 1 0 0 0 0 0SpringfieldEd Hickox (Ohio Wesleyan 1905)
1940-RR 1 0 1 0 0 0 0 1TOTAL 1 0 1 0 0 0 0 1
St. BonaventureEddie Donovan (St. Bonaventure 1950)
1961 1 2 1 0 0 0 0 0Larry Weise (St. Bonaventure 1958)
1968, 70-4th 2 4 4 0 0 0 1 0Jim Satalin (St. Bonaventure 1969) 1978 1 0 1 0 0 0 0 0Jim Baron (St. Bonaventure 1977) 2000 1 0 1 0 0 0 0 0Mark Schmidt (Boston College 1985)
2012 1 0 1 0 0 0 0 0TOTAL 6 6 8 0 0 0 1 0
St. John’s (NY)*Frank McGuire [St. John’s (NY) 1936]
1951-RR, 52-2d 2 5 2 0 1 0 0 1Joe Lapchick (No college) 1961 1 0 1 0 0 0 0 0Frank Mulzoff [St. John’s (NY) 1951]
1973 1 0 1 0 0 0 0 0Lou Carnesecca [St. John’s (NY) 1946]
1967, 68, 69, 76, 77, 78, 79-RR, 80, 82, 83, 84, 85-T3d, 86, 87, 88, 90, 91-RR, 92 18 17 20 0 0 1 0 2
Brian Mahoney (Manhattan 1971) 1993 1 1 1 0 0 0 0 0Fran Fraschilla (Brooklyn 1980) 1998 1 0 1 0 0 0 0 0Mike Jarvis (Northeastern 1968) 1999-
RR, 2000, 02* 3 4 3 0 0 0 0 1Steve Lavin (Chapman 1988) 2011, 15 2 0 2 0 0 0 0 0
TOTAL 29 27 31 0 1 1 0 4StanfordEverett Dean (Indiana 1921) 1942-CH 1 3 0 1 0 0 0 0Mike Montgomery (Long Beach St. 1968)
1989, 92, 95, 96, 97, 98-T3d, 99,2000, 01-RR, 02, 03, 04 12 16 12 0 0 1 0 1
Trent Johnson (Boise St. 1983) 2005, 07, 08 3 2 3 0 0 0 0 0
Johnny Dawkins (Duke 1986) 2014 1 2 1 0 0 0 0 0TOTAL 17 23 16 1 0 1 0 1
Stony BrookJeff Boals (Ohio 1995) 2016 1 0 1 0 0 0 0 0
Yrs. W L CH 2d 3d^ 4th RRTOTAL 1 0 1 0 0 0 0 0
Syracuse*Marc Guley (Syracuse 1936) 1957-RR 1 2 1 0 0 0 0 1Fred Lewis (Eastern Ky. 1946) 1966-RR 1 1 1 0 0 0 0 1Roy Danforth (Southern Miss. 1962)
1973, 74, 75-4th, 76 4 5 5 0 0 0 1 0Jim Boeheim (Syracuse 1966) 1977,
78, 79, 80, 83, 84, 85, 86, 87-2d, 88, 89-RR, 90, 91, 92, 94, 95, 96-2d, 98, 99, 2000, 01, 03-CH, 04, 05, 06, 09, 10, 11*, 12-RR*,13-T3d, 14, 16-T3d 32 57 31 1 2 2 0 2
TOTAL 38 65 38 1 2 2 1 4TCUByron “Buster” Brannon (TCU 1933)
1952, 53, 59 3 3 3 0 0 0 0 0Johnny Swaim (TCU 1953) 1968-RR, 71 2 1 2 0 0 0 0 1Jim Killingsworth (Northeastern Okla. St.
1948) 1987 1 1 1 0 0 0 0 0Billy Tubbs (Lamar University 1958) 1998 1 0 1 0 0 0 0 0
TOTAL 7 5 7 0 0 0 0 1TempleJosh Cody (Vanderbilt 1920) 1944-RR 1 1 1 0 0 0 0 1Harry Litwack (Temple 1930) 1956-3d,
58-3d, 64, 67, 70, 72 6 7 6 0 0 2 0 0Don Casey (Temple 1970) 1979 1 0 1 0 0 0 0 0John Chaney (Bethune-Cookman 1955)
1984, 85, 86, 87, 88-RR, 90, 91-RR, 92, 93-RR, 94, 95, 96, 97, 98, 99-RR, 2000,01-RR 17 23 17 0 0 0 0 5
Fran Dunphy (La Salle 1970) 2008, 09, 10,11, 12, 13, 16 7 2 7 0 0 0 0 0
TOTAL 32 33 32 0 0 2 0 6TennesseeRamon “Ray” Mears [Miami (OH) 1949]
1967, 76, 77 3 0 4 0 0 0 0 0Don DeVoe (Ohio St. 1964) 1979, 80, 81,
82, 83, 89 6 5 6 0 0 0 0 0Jerry Green (Appalachian St. 1968)
1998, 99, 2000, 01 4 3 4 0 0 0 0 0Bruce Pearl (Boston College 1982) 2006,
07, 08, 09, 10-RR, 11 6 8 6 0 0 0 0 1Cuonzo Martin (Purdue 2000) 2014 1 3 1 0 0 0 0 0
TOTAL 20 19 21 0 0 0 0 1Tennessee St.Frankie Allen (Roanoke 1971) 1993, 94 2 0 2 0 0 0 0 0
TOTAL 2 0 2 0 0 0 0 0Tennessee TechJohnny Oldham (Western Ky. 1948)
1958, 63 2 0 2 0 0 0 0 0TOTAL 2 0 2 0 0 0 0 0
TexasH.C. “Bully” Gilstrap (Texas 1922)
1943-T3d 1 1 1 0 0 1 0 0Jack Gray (Texas 1935) 1939-RR, 47-3d 2 2 3 0 0 1 0 1Harold Bradley (Hartwick 1934) 1960, 63 2 2 3 0 0 0 0 0Leon Black (Texas 1953) 1972, 74 2 1 3 0 0 0 0 0A.E. “Abe” Lemons (Oklahoma City
1949) 1979 1 0 1 0 0 0 0 0Tom Penders (UConn 1967) 1989,
90-RR, 91, 92, 94, 95, 96, 97 8 10 8 0 0 0 0 1Rick Barnes (Lenoir-Rhyne 1977)
1999,2000, 01, 02, 03-T3d, 04, 05, 06-RR, 07 08-RR, 09, 10, 11, 12, 14, 15 16 19 16 0 0 1 0 2
Shaka Smart (Kenyon 1999) 2016 1 0 1 0 0 0 0 0TOTAL 33 35 36 0 0 3 0 4
Texas A&MJohn Floyd (Oklahoma St. 1941) 1951 1 0 1 0 0 0 0 0
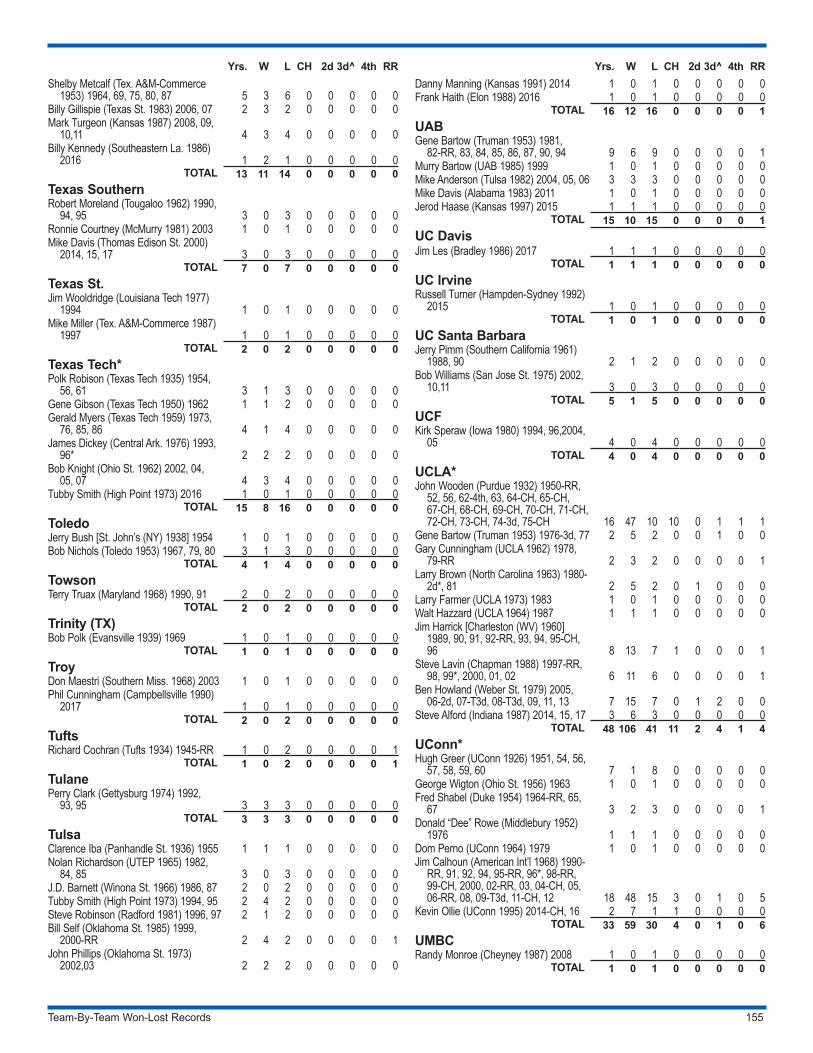
Team-By-Team Won-Lost Records 155
Yrs. W L CH 2d 3d^ 4th RRShelby Metcalf (Tex. A&M-Commerce
1953) 1964, 69, 75, 80, 87 5 3 6 0 0 0 0 0Billy Gillispie (Texas St. 1983) 2006, 07 2 3 2 0 0 0 0 0Mark Turgeon (Kansas 1987) 2008, 09,
10,11 4 3 4 0 0 0 0 0Billy Kennedy (Southeastern La. 1986)
2016 1 2 1 0 0 0 0 0TOTAL 13 11 14 0 0 0 0 0
Texas SouthernRobert Moreland (Tougaloo 1962) 1990,
94, 95 3 0 3 0 0 0 0 0Ronnie Courtney (McMurry 1981) 2003 1 0 1 0 0 0 0 0Mike Davis (Thomas Edison St. 2000)
2014, 15, 17 3 0 3 0 0 0 0 0TOTAL 7 0 7 0 0 0 0 0
Texas St.Jim Wooldridge (Louisiana Tech 1977)
1994 1 0 1 0 0 0 0 0Mike Miller (Tex. A&M-Commerce 1987)
1997 1 0 1 0 0 0 0 0TOTAL 2 0 2 0 0 0 0 0
Texas Tech*Polk Robison (Texas Tech 1935) 1954,
56, 61 3 1 3 0 0 0 0 0Gene Gibson (Texas Tech 1950) 1962 1 1 2 0 0 0 0 0Gerald Myers (Texas Tech 1959) 1973,
76, 85, 86 4 1 4 0 0 0 0 0James Dickey (Central Ark. 1976) 1993,
96* 2 2 2 0 0 0 0 0Bob Knight (Ohio St. 1962) 2002, 04,
05, 07 4 3 4 0 0 0 0 0Tubby Smith (High Point 1973) 2016 1 0 1 0 0 0 0 0
TOTAL 15 8 16 0 0 0 0 0ToledoJerry Bush [St. John’s (NY) 1938] 1954 1 0 1 0 0 0 0 0Bob Nichols (Toledo 1953) 1967, 79, 80 3 1 3 0 0 0 0 0
TOTAL 4 1 4 0 0 0 0 0TowsonTerry Truax (Maryland 1968) 1990, 91 2 0 2 0 0 0 0 0
TOTAL 2 0 2 0 0 0 0 0Trinity (TX)Bob Polk (Evansville 1939) 1969 1 0 1 0 0 0 0 0
TOTAL 1 0 1 0 0 0 0 0Troy Don Maestri (Southern Miss. 1968) 2003 1 0 1 0 0 0 0 0Phil Cunningham (Campbellsville 1990)
2017 1 0 1 0 0 0 0 0TOTAL 2 0 2 0 0 0 0 0
TuftsRichard Cochran (Tufts 1934) 1945-RR 1 0 2 0 0 0 0 1
TOTAL 1 0 2 0 0 0 0 1TulanePerry Clark (Gettysburg 1974) 1992,
93, 95 3 3 3 0 0 0 0 0TOTAL 3 3 3 0 0 0 0 0
TulsaClarence Iba (Panhandle St. 1936) 1955 1 1 1 0 0 0 0 0Nolan Richardson (UTEP 1965) 1982,
84, 85 3 0 3 0 0 0 0 0J.D. Barnett (Winona St. 1966) 1986, 87 2 0 2 0 0 0 0 0Tubby Smith (High Point 1973) 1994, 95 2 4 2 0 0 0 0 0Steve Robinson (Radford 1981) 1996, 97 2 1 2 0 0 0 0 0Bill Self (Oklahoma St. 1985) 1999,
2000-RR 2 4 2 0 0 0 0 1John Phillips (Oklahoma St. 1973)
2002,03 2 2 2 0 0 0 0 0
Yrs. W L CH 2d 3d^ 4th RRDanny Manning (Kansas 1991) 2014 1 0 1 0 0 0 0 0Frank Haith (Elon 1988) 2016 1 0 1 0 0 0 0 0
TOTAL 16 12 16 0 0 0 0 1UABGene Bartow (Truman 1953) 1981,
82-RR, 83, 84, 85, 86, 87, 90, 94 9 6 9 0 0 0 0 1Murry Bartow (UAB 1985) 1999 1 0 1 0 0 0 0 0Mike Anderson (Tulsa 1982) 2004, 05, 06 3 3 3 0 0 0 0 0Mike Davis (Alabama 1983) 2011 1 0 1 0 0 0 0 0Jerod Haase (Kansas 1997) 2015 1 1 1 0 0 0 0 0
TOTAL 15 10 15 0 0 0 0 1UC DavisJim Les (Bradley 1986) 2017 1 1 1 0 0 0 0 0
TOTAL 1 1 1 0 0 0 0 0UC IrvineRussell Turner (Hampden-Sydney 1992)
2015 1 0 1 0 0 0 0 0TOTAL 1 0 1 0 0 0 0 0
UC Santa BarbaraJerry Pimm (Southern California 1961)
1988, 90 2 1 2 0 0 0 0 0Bob Williams (San Jose St. 1975) 2002,
10,11 3 0 3 0 0 0 0 0TOTAL 5 1 5 0 0 0 0 0
UCFKirk Speraw (Iowa 1980) 1994, 96,2004,
05 4 0 4 0 0 0 0 0TOTAL 4 0 4 0 0 0 0 0
UCLA*John Wooden (Purdue 1932) 1950-RR,
52, 56, 62-4th, 63, 64-CH, 65-CH, 67-CH, 68-CH, 69-CH, 70-CH, 71-CH, 72-CH, 73-CH, 74-3d, 75-CH 16 47 10 10 0 1 1 1
Gene Bartow (Truman 1953) 1976-3d, 77 2 5 2 0 0 1 0 0Gary Cunningham (UCLA 1962) 1978,
79-RR 2 3 2 0 0 0 0 1Larry Brown (North Carolina 1963) 1980-
2d*, 81 2 5 2 0 1 0 0 0Larry Farmer (UCLA 1973) 1983 1 0 1 0 0 0 0 0Walt Hazzard (UCLA 1964) 1987 1 1 1 0 0 0 0 0Jim Harrick [Charleston (WV) 1960]
1989, 90, 91, 92-RR, 93, 94, 95-CH, 96 8 13 7 1 0 0 0 1
Steve Lavin (Chapman 1988) 1997-RR, 98, 99*, 2000, 01, 02 6 11 6 0 0 0 0 1
Ben Howland (Weber St. 1979) 2005, 06-2d, 07-T3d, 08-T3d, 09, 11, 13 7 15 7 0 1 2 0 0
Steve Alford (Indiana 1987) 2014, 15, 17 3 6 3 0 0 0 0 0TOTAL 48 106 41 11 2 4 1 4
UConn*Hugh Greer (UConn 1926) 1951, 54, 56,
57, 58, 59, 60 7 1 8 0 0 0 0 0George Wigton (Ohio St. 1956) 1963 1 0 1 0 0 0 0 0Fred Shabel (Duke 1954) 1964-RR, 65,
67 3 2 3 0 0 0 0 1Donald “Dee” Rowe (Middlebury 1952)
1976 1 1 1 0 0 0 0 0Dom Perno (UConn 1964) 1979 1 0 1 0 0 0 0 0Jim Calhoun (American Int’l 1968) 1990-
RR, 91, 92, 94, 95-RR, 96*, 98-RR, 99-CH, 2000, 02-RR, 03, 04-CH, 05, 06-RR, 08, 09-T3d, 11-CH, 12 18 48 15 3 0 1 0 5
Kevin Ollie (UConn 1995) 2014-CH, 16 2 7 1 1 0 0 0 0TOTAL 33 59 30 4 0 1 0 6
UMBCRandy Monroe (Cheyney 1987) 2008 1 0 1 0 0 0 0 0
TOTAL 1 0 1 0 0 0 0 0
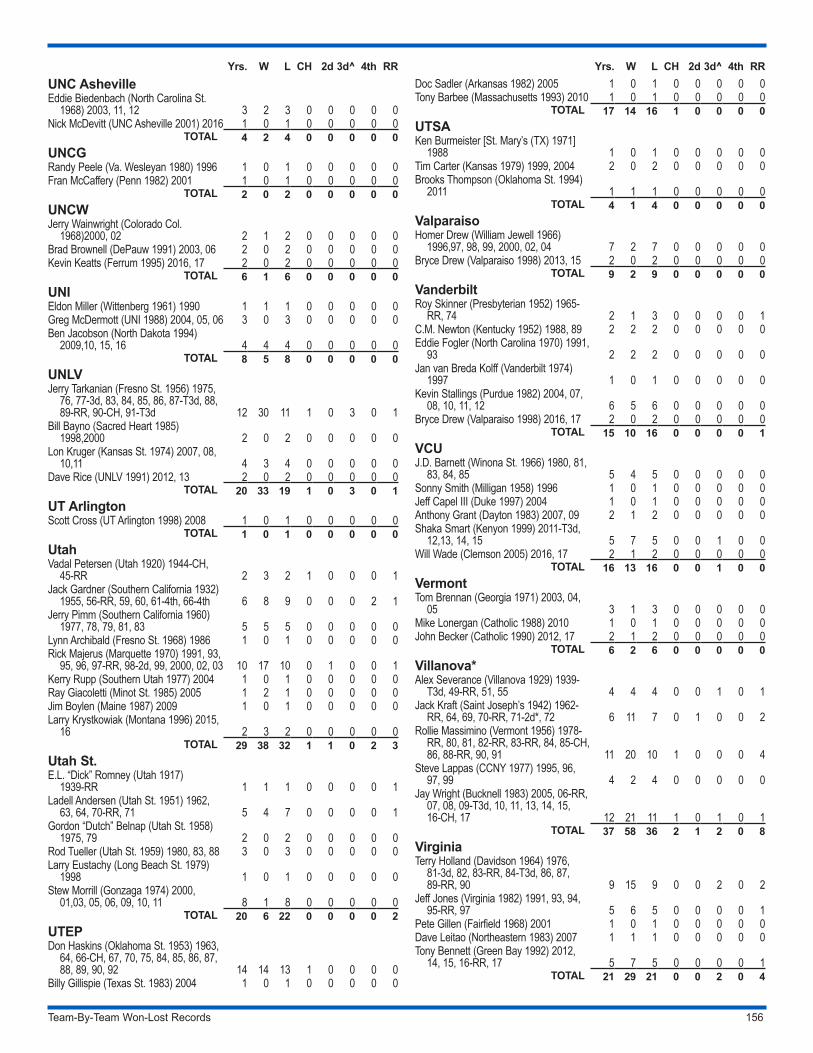
Team-By-Team Won-Lost Records 156
Yrs. W L CH 2d 3d^ 4th RRUNC AshevilleEddie Biedenbach (North Carolina St.
1968) 2003, 11, 12 3 2 3 0 0 0 0 0Nick McDevitt (UNC Asheville 2001) 2016 1 0 1 0 0 0 0 0
TOTAL 4 2 4 0 0 0 0 0UNCGRandy Peele (Va. Wesleyan 1980) 1996 1 0 1 0 0 0 0 0Fran McCaffery (Penn 1982) 2001 1 0 1 0 0 0 0 0
TOTAL 2 0 2 0 0 0 0 0UNCWJerry Wainwright (Colorado Col.
1968)2000, 02 2 1 2 0 0 0 0 0Brad Brownell (DePauw 1991) 2003, 06 2 0 2 0 0 0 0 0Kevin Keatts (Ferrum 1995) 2016, 17 2 0 2 0 0 0 0 0
TOTAL 6 1 6 0 0 0 0 0UNIEldon Miller (Wittenberg 1961) 1990 1 1 1 0 0 0 0 0Greg McDermott (UNI 1988) 2004, 05, 06 3 0 3 0 0 0 0 0Ben Jacobson (North Dakota 1994)
2009,10, 15, 16 4 4 4 0 0 0 0 0TOTAL 8 5 8 0 0 0 0 0
UNLVJerry Tarkanian (Fresno St. 1956) 1975,
76, 77-3d, 83, 84, 85, 86, 87-T3d, 88, 89-RR, 90-CH, 91-T3d 12 30 11 1 0 3 0 1
Bill Bayno (Sacred Heart 1985) 1998,2000 2 0 2 0 0 0 0 0
Lon Kruger (Kansas St. 1974) 2007, 08, 10,11 4 3 4 0 0 0 0 0
Dave Rice (UNLV 1991) 2012, 13 2 0 2 0 0 0 0 0TOTAL 20 33 19 1 0 3 0 1
UT ArlingtonScott Cross (UT Arlington 1998) 2008 1 0 1 0 0 0 0 0
TOTAL 1 0 1 0 0 0 0 0UtahVadal Petersen (Utah 1920) 1944-CH,
45-RR 2 3 2 1 0 0 0 1Jack Gardner (Southern California 1932)
1955, 56-RR, 59, 60, 61-4th, 66-4th 6 8 9 0 0 0 2 1Jerry Pimm (Southern California 1960)
1977, 78, 79, 81, 83 5 5 5 0 0 0 0 0Lynn Archibald (Fresno St. 1968) 1986 1 0 1 0 0 0 0 0Rick Majerus (Marquette 1970) 1991, 93,
95, 96, 97-RR, 98-2d, 99, 2000, 02, 03 10 17 10 0 1 0 0 1Kerry Rupp (Southern Utah 1977) 2004 1 0 1 0 0 0 0 0Ray Giacoletti (Minot St. 1985) 2005 1 2 1 0 0 0 0 0Jim Boylen (Maine 1987) 2009 1 0 1 0 0 0 0 0Larry Krystkowiak (Montana 1996) 2015,
16 2 3 2 0 0 0 0 0TOTAL 29 38 32 1 1 0 2 3
Utah St.E.L. “Dick” Romney (Utah 1917)
1939-RR 1 1 1 0 0 0 0 1Ladell Andersen (Utah St. 1951) 1962,
63, 64, 70-RR, 71 5 4 7 0 0 0 0 1Gordon “Dutch” Belnap (Utah St. 1958)
1975, 79 2 0 2 0 0 0 0 0Rod Tueller (Utah St. 1959) 1980, 83, 88 3 0 3 0 0 0 0 0Larry Eustachy (Long Beach St. 1979)
1998 1 0 1 0 0 0 0 0Stew Morrill (Gonzaga 1974) 2000,
01,03, 05, 06, 09, 10, 11 8 1 8 0 0 0 0 0TOTAL 20 6 22 0 0 0 0 2
UTEPDon Haskins (Oklahoma St. 1953) 1963,
64, 66-CH, 67, 70, 75, 84, 85, 86, 87, 88, 89, 90, 92 14 14 13 1 0 0 0 0
Billy Gillispie (Texas St. 1983) 2004 1 0 1 0 0 0 0 0
Yrs. W L CH 2d 3d^ 4th RRDoc Sadler (Arkansas 1982) 2005 1 0 1 0 0 0 0 0Tony Barbee (Massachusetts 1993) 2010 1 0 1 0 0 0 0 0
TOTAL 17 14 16 1 0 0 0 0UTSAKen Burmeister [St. Mary’s (TX) 1971]
1988 1 0 1 0 0 0 0 0Tim Carter (Kansas 1979) 1999, 2004 2 0 2 0 0 0 0 0Brooks Thompson (Oklahoma St. 1994)
2011 1 1 1 0 0 0 0 0TOTAL 4 1 4 0 0 0 0 0
ValparaisoHomer Drew (William Jewell 1966)
1996,97, 98, 99, 2000, 02, 04 7 2 7 0 0 0 0 0Bryce Drew (Valparaiso 1998) 2013, 15 2 0 2 0 0 0 0 0
TOTAL 9 2 9 0 0 0 0 0VanderbiltRoy Skinner (Presbyterian 1952) 1965-
RR, 74 2 1 3 0 0 0 0 1C.M. Newton (Kentucky 1952) 1988, 89 2 2 2 0 0 0 0 0Eddie Fogler (North Carolina 1970) 1991,
93 2 2 2 0 0 0 0 0Jan van Breda Kolff (Vanderbilt 1974)
1997 1 0 1 0 0 0 0 0Kevin Stallings (Purdue 1982) 2004, 07,
08, 10, 11, 12 6 5 6 0 0 0 0 0Bryce Drew (Valparaiso 1998) 2016, 17 2 0 2 0 0 0 0 0
TOTAL 15 10 16 0 0 0 0 1VCUJ.D. Barnett (Winona St. 1966) 1980, 81,
83, 84, 85 5 4 5 0 0 0 0 0Sonny Smith (Milligan 1958) 1996 1 0 1 0 0 0 0 0Jeff Capel III (Duke 1997) 2004 1 0 1 0 0 0 0 0Anthony Grant (Dayton 1983) 2007, 09 2 1 2 0 0 0 0 0Shaka Smart (Kenyon 1999) 2011-T3d,
12,13, 14, 15 5 7 5 0 0 1 0 0Will Wade (Clemson 2005) 2016, 17 2 1 2 0 0 0 0 0
TOTAL 16 13 16 0 0 1 0 0VermontTom Brennan (Georgia 1971) 2003, 04,
05 3 1 3 0 0 0 0 0Mike Lonergan (Catholic 1988) 2010 1 0 1 0 0 0 0 0John Becker (Catholic 1990) 2012, 17 2 1 2 0 0 0 0 0
TOTAL 6 2 6 0 0 0 0 0Villanova*Alex Severance (Villanova 1929) 1939-
T3d, 49-RR, 51, 55 4 4 4 0 0 1 0 1Jack Kraft (Saint Joseph’s 1942) 1962-
RR, 64, 69, 70-RR, 71-2d*, 72 6 11 7 0 1 0 0 2Rollie Massimino (Vermont 1956) 1978-
RR, 80, 81, 82-RR, 83-RR, 84, 85-CH, 86, 88-RR, 90, 91 11 20 10 1 0 0 0 4
Steve Lappas (CCNY 1977) 1995, 96, 97, 99 4 2 4 0 0 0 0 0
Jay Wright (Bucknell 1983) 2005, 06-RR, 07, 08, 09-T3d, 10, 11, 13, 14, 15, 16-CH, 17 12 21 11 1 0 1 0 1
TOTAL 37 58 36 2 1 2 0 8VirginiaTerry Holland (Davidson 1964) 1976,
81-3d, 82, 83-RR, 84-T3d, 86, 87, 89-RR, 90 9 15 9 0 0 2 0 2
Jeff Jones (Virginia 1982) 1991, 93, 94, 95-RR, 97 5 6 5 0 0 0 0 1
Pete Gillen (Fairfield 1968) 2001 1 0 1 0 0 0 0 0Dave Leitao (Northeastern 1983) 2007 1 1 1 0 0 0 0 0Tony Bennett (Green Bay 1992) 2012,
14, 15, 16-RR, 17 5 7 5 0 0 0 0 1TOTAL 21 29 21 0 0 2 0 4
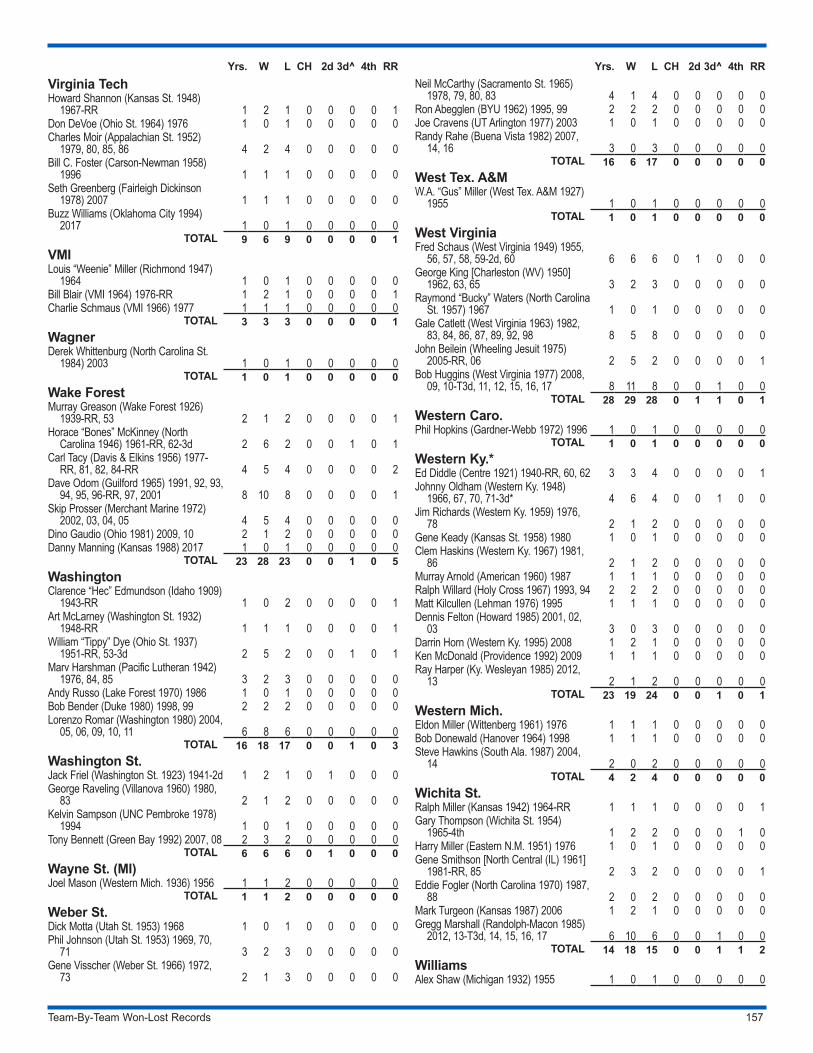
Team-By-Team Won-Lost Records 157
Yrs. W L CH 2d 3d^ 4th RRVirginia TechHoward Shannon (Kansas St. 1948)
1967-RR 1 2 1 0 0 0 0 1Don DeVoe (Ohio St. 1964) 1976 1 0 1 0 0 0 0 0Charles Moir (Appalachian St. 1952)
1979, 80, 85, 86 4 2 4 0 0 0 0 0Bill C. Foster (Carson-Newman 1958)
1996 1 1 1 0 0 0 0 0Seth Greenberg (Fairleigh Dickinson
1978) 2007 1 1 1 0 0 0 0 0Buzz Williams (Oklahoma City 1994)
2017 1 0 1 0 0 0 0 0TOTAL 9 6 9 0 0 0 0 1
VMILouis “Weenie” Miller (Richmond 1947)
1964 1 0 1 0 0 0 0 0Bill Blair (VMI 1964) 1976-RR 1 2 1 0 0 0 0 1Charlie Schmaus (VMI 1966) 1977 1 1 1 0 0 0 0 0
TOTAL 3 3 3 0 0 0 0 1WagnerDerek Whittenburg (North Carolina St.
1984) 2003 1 0 1 0 0 0 0 0TOTAL 1 0 1 0 0 0 0 0
Wake ForestMurray Greason (Wake Forest 1926)
1939-RR, 53 2 1 2 0 0 0 0 1Horace “Bones” McKinney (North
Carolina 1946) 1961-RR, 62-3d 2 6 2 0 0 1 0 1Carl Tacy (Davis & Elkins 1956) 1977-
RR, 81, 82, 84-RR 4 5 4 0 0 0 0 2Dave Odom (Guilford 1965) 1991, 92, 93,
94, 95, 96-RR, 97, 2001 8 10 8 0 0 0 0 1Skip Prosser (Merchant Marine 1972)
2002, 03, 04, 05 4 5 4 0 0 0 0 0Dino Gaudio (Ohio 1981) 2009, 10 2 1 2 0 0 0 0 0Danny Manning (Kansas 1988) 2017 1 0 1 0 0 0 0 0
TOTAL 23 28 23 0 0 1 0 5WashingtonClarence “Hec” Edmundson (Idaho 1909)
1943-RR 1 0 2 0 0 0 0 1Art McLarney (Washington St. 1932)
1948-RR 1 1 1 0 0 0 0 1William “Tippy” Dye (Ohio St. 1937)
1951-RR, 53-3d 2 5 2 0 0 1 0 1Marv Harshman (Pacific Lutheran 1942)
1976, 84, 85 3 2 3 0 0 0 0 0Andy Russo (Lake Forest 1970) 1986 1 0 1 0 0 0 0 0Bob Bender (Duke 1980) 1998, 99 2 2 2 0 0 0 0 0Lorenzo Romar (Washington 1980) 2004,
05, 06, 09, 10, 11 6 8 6 0 0 0 0 0TOTAL 16 18 17 0 0 1 0 3
Washington St.Jack Friel (Washington St. 1923) 1941-2d 1 2 1 0 1 0 0 0George Raveling (Villanova 1960) 1980,
83 2 1 2 0 0 0 0 0Kelvin Sampson (UNC Pembroke 1978)
1994 1 0 1 0 0 0 0 0Tony Bennett (Green Bay 1992) 2007, 08 2 3 2 0 0 0 0 0
TOTAL 6 6 6 0 1 0 0 0Wayne St. (MI)Joel Mason (Western Mich. 1936) 1956 1 1 2 0 0 0 0 0
TOTAL 1 1 2 0 0 0 0 0Weber St.Dick Motta (Utah St. 1953) 1968 1 0 1 0 0 0 0 0Phil Johnson (Utah St. 1953) 1969, 70,
71 3 2 3 0 0 0 0 0Gene Visscher (Weber St. 1966) 1972,
73 2 1 3 0 0 0 0 0
Yrs. W L CH 2d 3d^ 4th RRNeil McCarthy (Sacramento St. 1965)
1978, 79, 80, 83 4 1 4 0 0 0 0 0Ron Abegglen (BYU 1962) 1995, 99 2 2 2 0 0 0 0 0Joe Cravens (UT Arlington 1977) 2003 1 0 1 0 0 0 0 0Randy Rahe (Buena Vista 1982) 2007,
14, 16 3 0 3 0 0 0 0 0TOTAL 16 6 17 0 0 0 0 0
West Tex. A&MW.A. “Gus” Miller (West Tex. A&M 1927)
1955 1 0 1 0 0 0 0 0TOTAL 1 0 1 0 0 0 0 0
West VirginiaFred Schaus (West Virginia 1949) 1955,
56, 57, 58, 59-2d, 60 6 6 6 0 1 0 0 0George King [Charleston (WV) 1950]
1962, 63, 65 3 2 3 0 0 0 0 0Raymond “Bucky” Waters (North Carolina
St. 1957) 1967 1 0 1 0 0 0 0 0Gale Catlett (West Virginia 1963) 1982,
83, 84, 86, 87, 89, 92, 98 8 5 8 0 0 0 0 0John Beilein (Wheeling Jesuit 1975)
2005-RR, 06 2 5 2 0 0 0 0 1Bob Huggins (West Virginia 1977) 2008,
09, 10-T3d, 11, 12, 15, 16, 17 8 11 8 0 0 1 0 0TOTAL 28 29 28 0 1 1 0 1
Western Caro.Phil Hopkins (Gardner-Webb 1972) 1996 1 0 1 0 0 0 0 0
TOTAL 1 0 1 0 0 0 0 0Western Ky.*Ed Diddle (Centre 1921) 1940-RR, 60, 62 3 3 4 0 0 0 0 1Johnny Oldham (Western Ky. 1948)
1966, 67, 70, 71-3d* 4 6 4 0 0 1 0 0Jim Richards (Western Ky. 1959) 1976,
78 2 1 2 0 0 0 0 0Gene Keady (Kansas St. 1958) 1980 1 0 1 0 0 0 0 0Clem Haskins (Western Ky. 1967) 1981,
86 2 1 2 0 0 0 0 0Murray Arnold (American 1960) 1987 1 1 1 0 0 0 0 0Ralph Willard (Holy Cross 1967) 1993, 94 2 2 2 0 0 0 0 0Matt Kilcullen (Lehman 1976) 1995 1 1 1 0 0 0 0 0Dennis Felton (Howard 1985) 2001, 02,
03 3 0 3 0 0 0 0 0Darrin Horn (Western Ky. 1995) 2008 1 2 1 0 0 0 0 0Ken McDonald (Providence 1992) 2009 1 1 1 0 0 0 0 0Ray Harper (Ky. Wesleyan 1985) 2012,
13 2 1 2 0 0 0 0 0TOTAL 23 19 24 0 0 1 0 1
Western Mich.Eldon Miller (Wittenberg 1961) 1976 1 1 1 0 0 0 0 0Bob Donewald (Hanover 1964) 1998 1 1 1 0 0 0 0 0Steve Hawkins (South Ala. 1987) 2004,
14 2 0 2 0 0 0 0 0TOTAL 4 2 4 0 0 0 0 0
Wichita St.Ralph Miller (Kansas 1942) 1964-RR 1 1 1 0 0 0 0 1Gary Thompson (Wichita St. 1954)
1965-4th 1 2 2 0 0 0 1 0Harry Miller (Eastern N.M. 1951) 1976 1 0 1 0 0 0 0 0Gene Smithson [North Central (IL) 1961]
1981-RR, 85 2 3 2 0 0 0 0 1Eddie Fogler (North Carolina 1970) 1987,
88 2 0 2 0 0 0 0 0Mark Turgeon (Kansas 1987) 2006 1 2 1 0 0 0 0 0Gregg Marshall (Randolph-Macon 1985)
2012, 13-T3d, 14, 15, 16, 17 6 10 6 0 0 1 0 0TOTAL 14 18 15 0 0 1 1 2
WilliamsAlex Shaw (Michigan 1932) 1955 1 0 1 0 0 0 0 0
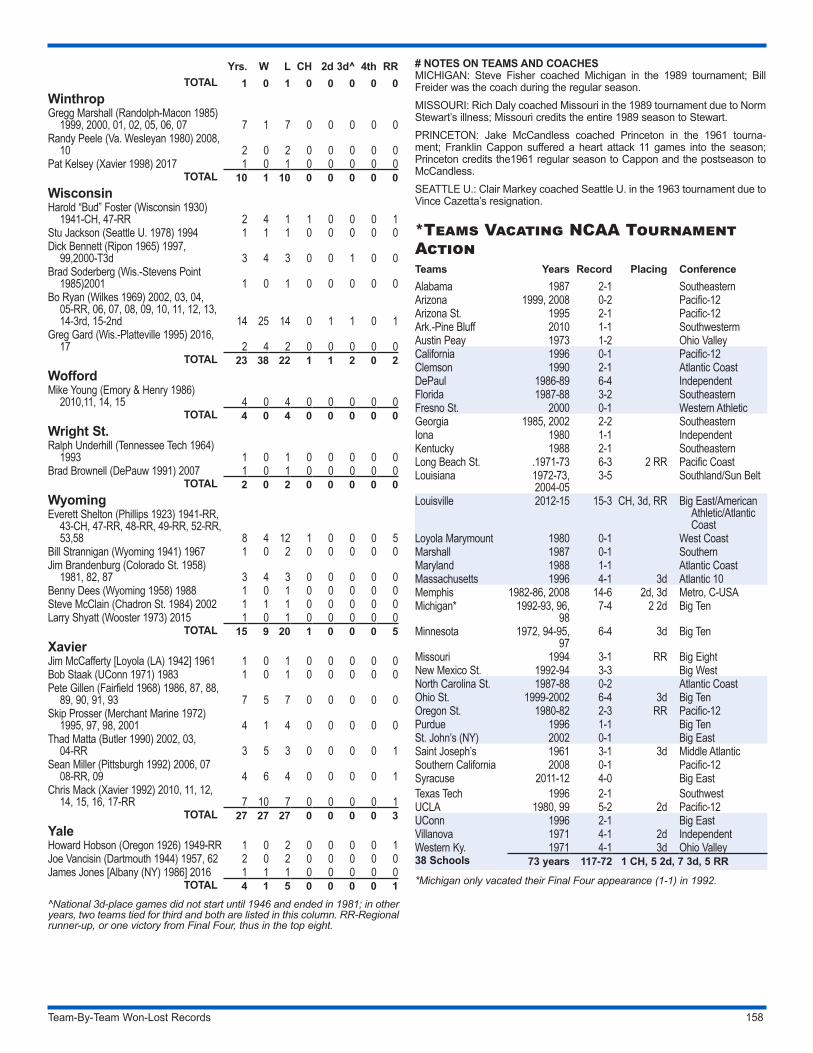
Team-By-Team Won-Lost Records 158
Yrs. W L CH 2d 3d^ 4th RRTOTAL 1 0 1 0 0 0 0 0
WinthropGregg Marshall (Randolph-Macon 1985)
1999, 2000, 01, 02, 05, 06, 07 7 1 7 0 0 0 0 0Randy Peele (Va. Wesleyan 1980) 2008,
10 2 0 2 0 0 0 0 0Pat Kelsey (Xavier 1998) 2017 1 0 1 0 0 0 0 0
TOTAL 10 1 10 0 0 0 0 0WisconsinHarold “Bud” Foster (Wisconsin 1930)
1941-CH, 47-RR 2 4 1 1 0 0 0 1Stu Jackson (Seattle U. 1978) 1994 1 1 1 0 0 0 0 0Dick Bennett (Ripon 1965) 1997,
99,2000-T3d 3 4 3 0 0 1 0 0Brad Soderberg (Wis.-Stevens Point
1985)2001 1 0 1 0 0 0 0 0Bo Ryan (Wilkes 1969) 2002, 03, 04,
05-RR, 06, 07, 08, 09, 10, 11, 12, 13, 14-3rd, 15-2nd 14 25 14 0 1 1 0 1
Greg Gard (Wis.-Platteville 1995) 2016, 17 2 4 2 0 0 0 0 0
TOTAL 23 38 22 1 1 2 0 2WoffordMike Young (Emory & Henry 1986)
2010,11, 14, 15 4 0 4 0 0 0 0 0TOTAL 4 0 4 0 0 0 0 0
Wright St.Ralph Underhill (Tennessee Tech 1964)
1993 1 0 1 0 0 0 0 0Brad Brownell (DePauw 1991) 2007 1 0 1 0 0 0 0 0
TOTAL 2 0 2 0 0 0 0 0WyomingEverett Shelton (Phillips 1923) 1941-RR,
43-CH, 47-RR, 48-RR, 49-RR, 52-RR, 53,58 8 4 12 1 0 0 0 5
Bill Strannigan (Wyoming 1941) 1967 1 0 2 0 0 0 0 0Jim Brandenburg (Colorado St. 1958)
1981, 82, 87 3 4 3 0 0 0 0 0Benny Dees (Wyoming 1958) 1988 1 0 1 0 0 0 0 0Steve McClain (Chadron St. 1984) 2002 1 1 1 0 0 0 0 0Larry Shyatt (Wooster 1973) 2015 1 0 1 0 0 0 0 0
TOTAL 15 9 20 1 0 0 0 5XavierJim McCafferty [Loyola (LA) 1942] 1961 1 0 1 0 0 0 0 0Bob Staak (UConn 1971) 1983 1 0 1 0 0 0 0 0Pete Gillen (Fairfield 1968) 1986, 87, 88,
89, 90, 91, 93 7 5 7 0 0 0 0 0Skip Prosser (Merchant Marine 1972)
1995, 97, 98, 2001 4 1 4 0 0 0 0 0Thad Matta (Butler 1990) 2002, 03,
04-RR 3 5 3 0 0 0 0 1Sean Miller (Pittsburgh 1992) 2006, 07
08-RR, 09 4 6 4 0 0 0 0 1Chris Mack (Xavier 1992) 2010, 11, 12,
14, 15, 16, 17-RR 7 10 7 0 0 0 0 1TOTAL 27 27 27 0 0 0 0 3
YaleHoward Hobson (Oregon 1926) 1949-RR 1 0 2 0 0 0 0 1Joe Vancisin (Dartmouth 1944) 1957, 62 2 0 2 0 0 0 0 0James Jones [Albany (NY) 1986] 2016 1 1 1 0 0 0 0 0
TOTAL 4 1 5 0 0 0 0 1^National 3d-place games did not start until 1946 and ended in 1981; in other years, two teams tied for third and both are listed in this column. RR-Regional runner-up, or one victory from Final Four, thus in the top eight.
# NOTES ON TEAMS AND COACHESMICHIGAN: Steve Fisher coached Michigan in the 1989 tournament; Bill Freider was the coach during the regular season.MISSOURI: Rich Daly coached Missouri in the 1989 tournament due to Norm Stewart’s illness; Missouri credits the entire 1989 season to Stewart.PRINCETON: Jake McCandless coached Princeton in the 1961 tourna-ment; Franklin Cappon suffered a heart attack 11 games into the season; Princeton credits the1961 regular season to Cappon and the postseason to McCandless.SEATTLE U.: Clair Markey coached Seattle U. in the 1963 tournament due to Vince Cazetta’s resignation.
*Teams Vacating NCAA Tournament ActionTeams Years Record Placing ConferenceAlabama 1987 2-1 SoutheasternArizona 1999, 2008 0-2 Pacific-12Arizona St. 1995 2-1 Pacific-12Ark.-Pine Bluff 2010 1-1 SouthwestermAustin Peay 1973 1-2 Ohio ValleyCalifornia 1996 0-1 Pacific-12Clemson 1990 2-1 Atlantic CoastDePaul 1986-89 6-4 IndependentFlorida 1987-88 3-2 SoutheasternFresno St. 2000 0-1 Western AthleticGeorgia 1985, 2002 2-2 SoutheasternIona 1980 1-1 IndependentKentucky 1988 2-1 SoutheasternLong Beach St. .1971-73 6-3 2 RR Pacific CoastLouisiana 1972-73,
2004-053-5 Southland/Sun Belt
Louisville 2012-15 15-3 CH, 3d, RR Big East/American Athletic/Atlantic Coast
Loyola Marymount 1980 0-1 West CoastMarshall 1987 0-1 SouthernMaryland 1988 1-1 Atlantic CoastMassachusetts 1996 4-1 3d Atlantic 10Memphis 1982-86, 2008 14-6 2d, 3d Metro, C-USAMichigan* 1992-93, 96,
987-4 2 2d Big Ten
Minnesota 1972, 94-95, 97
6-4 3d Big Ten
Missouri 1994 3-1 RR Big EightNew Mexico St. 1992-94 3-3 Big WestNorth Carolina St. 1987-88 0-2 Atlantic CoastOhio St. 1999-2002 6-4 3d Big TenOregon St. 1980-82 2-3 RR Pacific-12Purdue 1996 1-1 Big TenSt. John’s (NY) 2002 0-1 Big EastSaint Joseph’s 1961 3-1 3d Middle AtlanticSouthern California 2008 0-1 Pacific-12Syracuse 2011-12 4-0 Big EastTexas Tech 1996 2-1 SouthwestUCLA 1980, 99 5-2 2d Pacific-12UConn 1996 2-1 Big EastVillanova 1971 4-1 2d IndependentWestern Ky. 1971 4-1 3d Ohio Valley38 Schools 73 years 117-72 1 CH, 5 2d, 7 3d, 5 RR
*Michigan only vacated their Final Four appearance (1-1) in 1992.
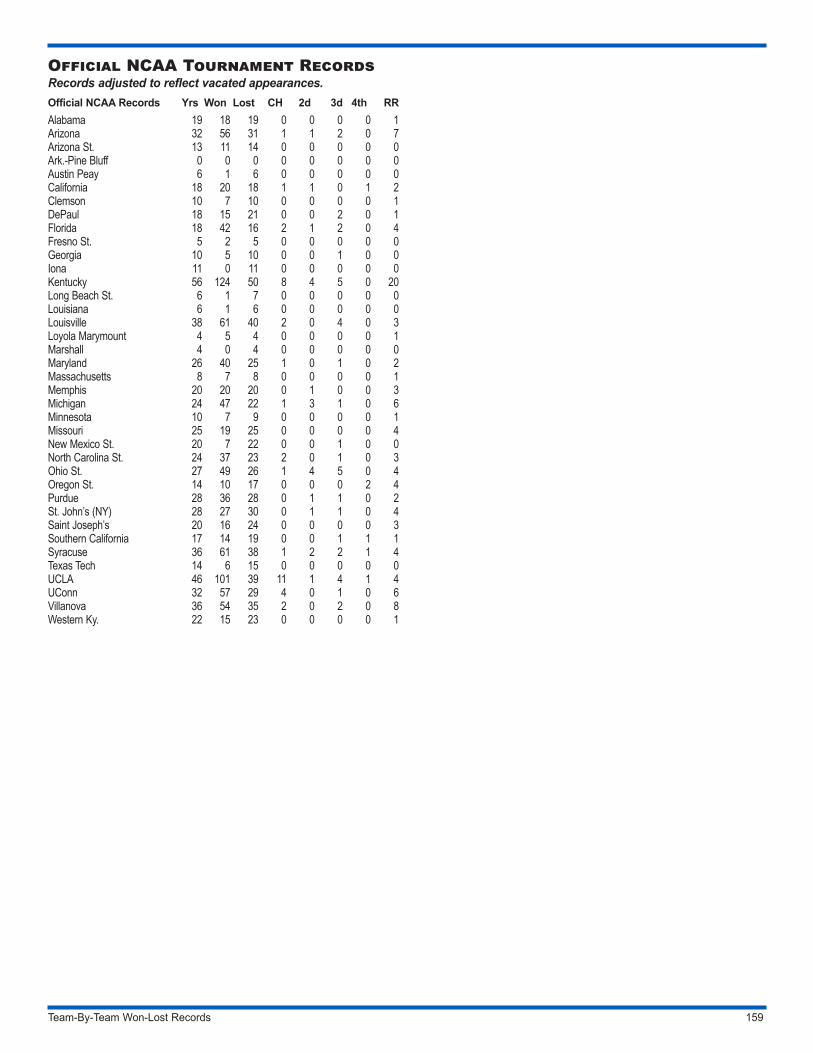
Team-By-Team Won-Lost Records 159
Official NCAA Tournament RecordsRecords adjusted to reflect vacated appearances.Official NCAA Records Yrs Won Lost CH 2d 3d 4th RRAlabama 19 18 19 0 0 0 0 1Arizona 32 56 31 1 1 2 0 7Arizona St. 13 11 14 0 0 0 0 0Ark.-Pine Bluff 0 0 0 0 0 0 0 0Austin Peay 6 1 6 0 0 0 0 0California 18 20 18 1 1 0 1 2Clemson 10 7 10 0 0 0 0 1DePaul 18 15 21 0 0 2 0 1Florida 18 42 16 2 1 2 0 4Fresno St. 5 2 5 0 0 0 0 0Georgia 10 5 10 0 0 1 0 0Iona 11 0 11 0 0 0 0 0Kentucky 56 124 50 8 4 5 0 20Long Beach St. 6 1 7 0 0 0 0 0Louisiana 6 1 6 0 0 0 0 0Louisville 38 61 40 2 0 4 0 3Loyola Marymount 4 5 4 0 0 0 0 1Marshall 4 0 4 0 0 0 0 0Maryland 26 40 25 1 0 1 0 2Massachusetts 8 7 8 0 0 0 0 1Memphis 20 20 20 0 1 0 0 3Michigan 24 47 22 1 3 1 0 6Minnesota 10 7 9 0 0 0 0 1Missouri 25 19 25 0 0 0 0 4New Mexico St. 20 7 22 0 0 1 0 0North Carolina St. 24 37 23 2 0 1 0 3Ohio St. 27 49 26 1 4 5 0 4Oregon St. 14 10 17 0 0 0 2 4Purdue 28 36 28 0 1 1 0 2St. John’s (NY) 28 27 30 0 1 1 0 4Saint Joseph’s 20 16 24 0 0 0 0 3Southern California 17 14 19 0 0 1 1 1Syracuse 36 61 38 1 2 2 1 4Texas Tech 14 6 15 0 0 0 0 0UCLA 46 101 39 11 1 4 1 4UConn 32 57 29 4 0 1 0 6Villanova 36 54 35 2 0 2 0 8Western Ky. 22 15 23 0 0 0 0 1