Embed Size (px)
Citation preview
1
Tourism industry
Made by: Business Consulting Club (Gazdasági Tanácsadó Klub)
Strategic coordination: Kerezsi Miklós
Györfy Lehel
Rácz Béla Gergely
Szász Levente
Fekete Réka
Coordination: Deák Levente, Nagy Loránd, Szabó László Tamás
Research & Analysis:Balla Zsófia
Boros Éva
Bálint Alexandra Teodóra
Costiniuc Norbert
Csíki Ottó
Deák Péter
Dibernardo Attila
Éltes Rita
Gagiu Krisztina
Gergely Andrea
Griz Zsuzsanna
Győri Hunor
Géger Gyopár
Horváth Adrienn
Jeszenszky Attila
Jánosi Eszter
Kelemen Kincső
Kiss Norbert
• by:Korcsmáros Boglárka
Pitó Emőke
Pádár Zsuzsa
Pál Tamás
Szabó Norbert
Szász Karina
Tankó Attila
Vizeli Ibolya
Vojkuj Csongor

AGENDA
[World] [Europe] [Romania]
[conclu
sions]
Overview
Subsectors
CEE
Overview
Subsectors
Attractions
Overview
Subsectors

AGENDA
[World]
Overview
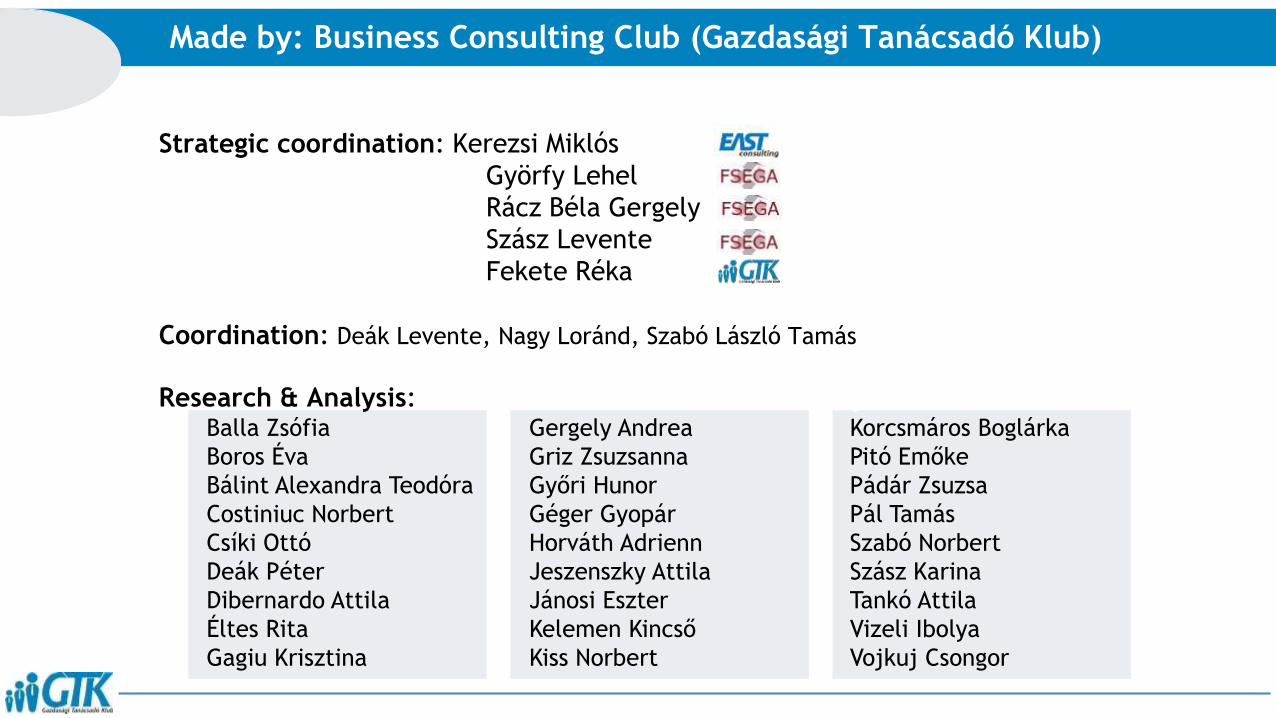
The global travel & tourism industry generated a total revenue of 2.06 € trillion in 2015. With this number itgained the 5th place on the top sectors list.
Global travel & tourism industry overview
Source: statista.com; wttc.org; databank.worldbank.org; csimarket.com; Bloomberg.com
8.8
4.3
2.6
2.5
2.1
1.51.31.0
Revenue
The top sectors by revenue in 2015(€ trillion)
Technology Sector Financial Sector
Retail Sector Capital Goods Sector
Travel & Tourism Sector Services Sector
Consumer Discretionary Sector Energy Sector
2.06
67.85
The size of the travel & tourism industry in2015, (€ trillion)
Travel &Tourismindustry
World GDP
The industry accounts for 3.03% of the World GDP if we only
look at its direct contribution. This means it generates 2.1
trillion (€) revenue and it`s the 5th on the top industries list.
Counting the total economic impact of the sector, this number
would rise to 9.75%.

The tourism revenue growth between 2011-2015 with a 2.24% CAGR. In 2015, the revenue was 2.06 €trillion. The revenue will grow between 2016-2020 with 3.44% CAGR and in 2020 will be over 2.57 € trillion.
International tourism revenue
Source: unwto.org;
1.88 1.942.04
2.232.06
2.172.27
2.372.47
2.57
2011 2012 2013 2014 2015 2016 2017 2018 2019 2020
The tourism revenue growth between 2011-2015 with a 2.24% CAGR. In 2015, the revenue was 2.1 € trillion. The
forecast shows a constant revenue growth between 2016-2020 with an 3,44% CAGR. The revenue in 2020 will be
over 2.57 € trillion.
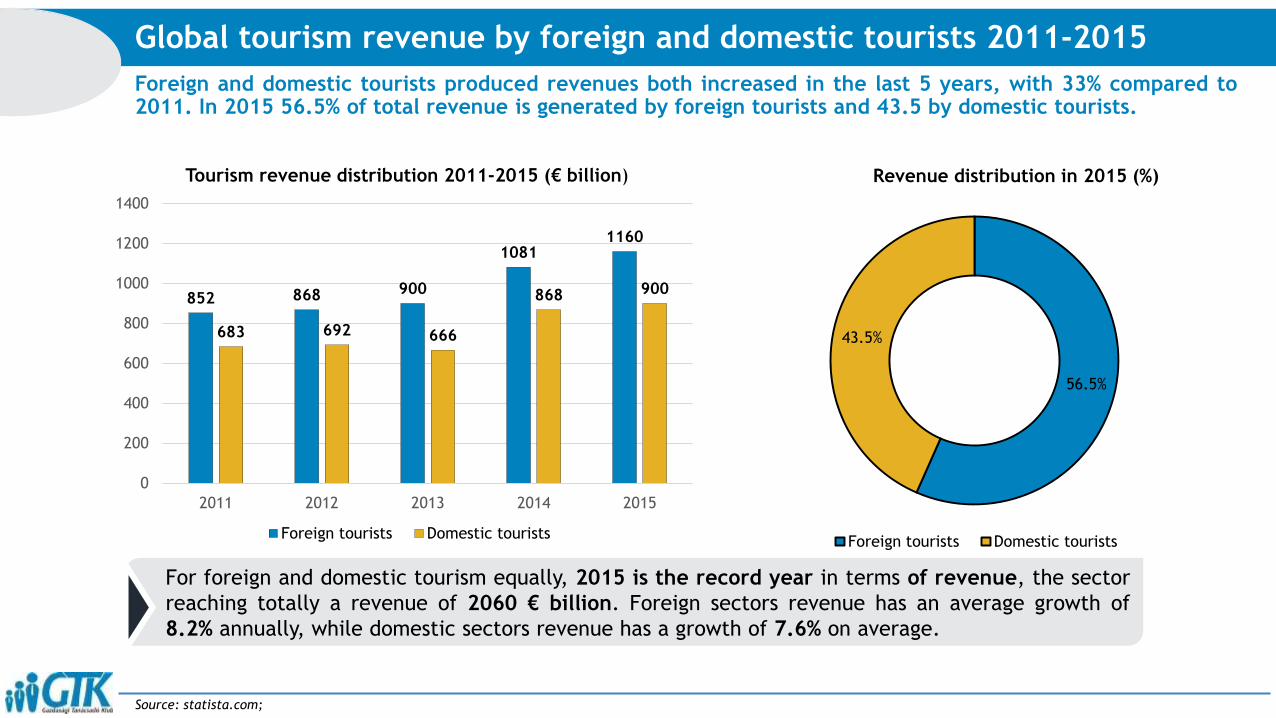
56.5%
43.5%
Revenue distribution in 2015 (%)
Foreign tourists Domestic tourists
Foreign and domestic tourists produced revenues both increased in the last 5 years, with 33% compared to2011. In 2015 56.5% of total revenue is generated by foreign tourists and 43.5 by domestic tourists.
Global tourism revenue by foreign and domestic tourists 2011-2015
Source: statista.com;
For foreign and domestic tourism equally, 2015 is the record year in terms of revenue, the sector
reaching totally a revenue of 2060 € billion. Foreign sectors revenue has an average growth of
8.2% annually, while domestic sectors revenue has a growth of 7.6% on average.
852 868 900
10811160
683 692 666
868 900
0
200
400
600
800
1000
1200
1400
2011 2012 2013 2014 2015
Tourism revenue distribution 2011-2015 (€ billion)
Foreign tourists Domestic tourists
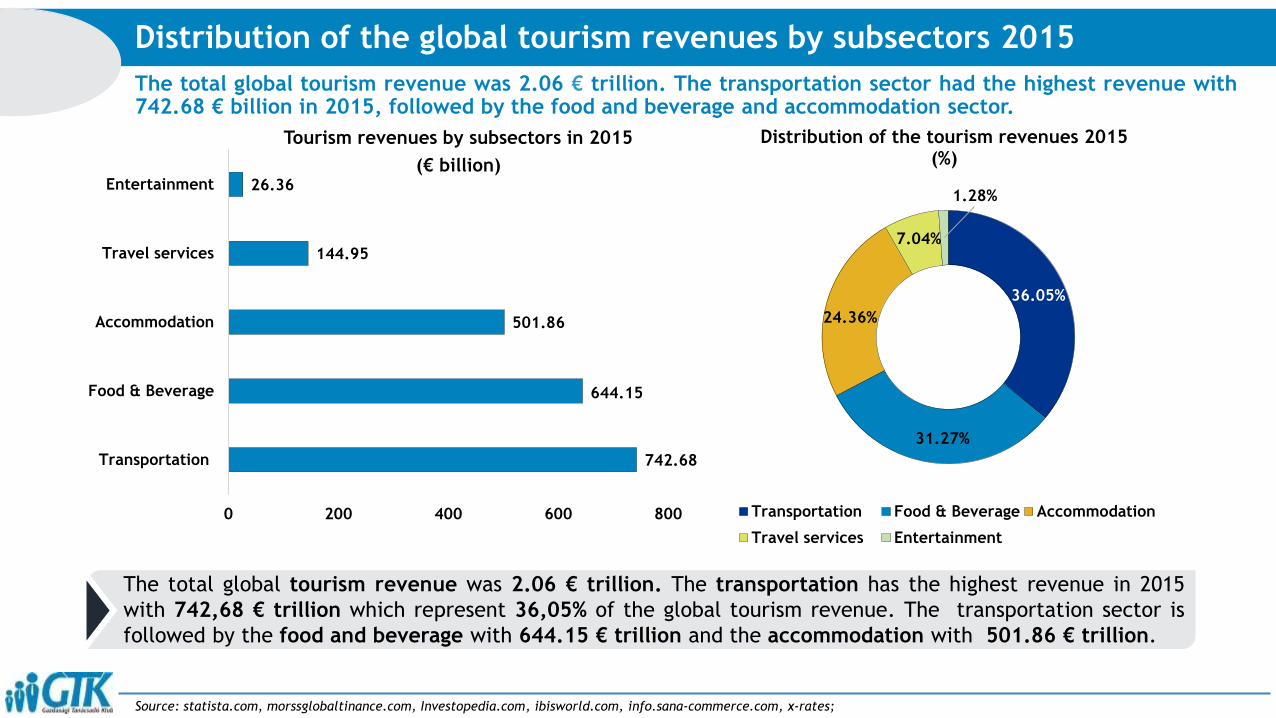
742.68
644.15
501.86
144.95
26.36
0 200 400 600 800
Transportation
Food & Beverage
Accommodation
Travel services
Entertainment
Tourism revenues by subsectors in 2015
(€ billion)
The total global tourism revenue was 2.06 € trillion. The transportation sector had the highest revenue with742.68 € billion in 2015, followed by the food and beverage and accommodation sector.
Distribution of the global tourism revenues by subsectors 2015
Source: statista.com, morssglobaltinance.com, Investopedia.com, ibisworld.com, info.sana-commerce.com, x-rates;
36.05%
31.27%
24.36%
7.04%
1.28%
Distribution of the tourism revenues 2015(%)
Transportation Food & Beverage Accommodation
Travel services Entertainment
The total global tourism revenue was 2.06 € trillion. The transportation has the highest revenue in 2015
with 742,68 € trillion which represent 36,05% of the global tourism revenue. The transportation sector is
followed by the food and beverage with 644.15 € trillion and the accommodation with 501.86 € trillion.
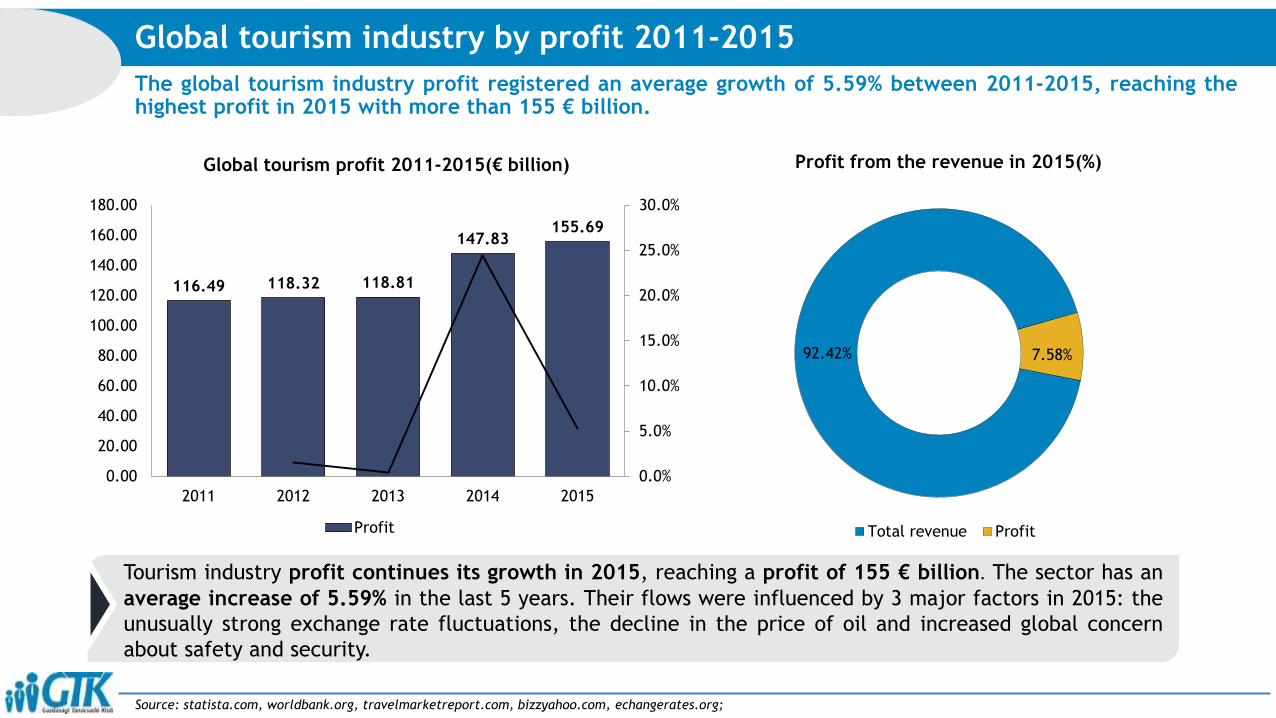
The global tourism industry profit registered an average growth of 5.59% between 2011-2015, reaching thehighest profit in 2015 with more than 155 € billion.
Global tourism industry by profit 2011-2015
Source: statista.com, worldbank.org, travelmarketreport.com, bizzyahoo.com, echangerates.org;
116.49 118.32 118.81
147.83155.69
0.0%
5.0%
10.0%
15.0%
20.0%
25.0%
30.0%
0.00
20.00
40.00
60.00
80.00
100.00
120.00
140.00
160.00
180.00
2011 2012 2013 2014 2015
Global tourism profit 2011-2015(€ billion)
Profit
Tourism industry profit continues its growth in 2015, reaching a profit of 155 € billion. The sector has an
average increase of 5.59% in the last 5 years. Their flows were influenced by 3 major factors in 2015: the
unusually strong exchange rate fluctuations, the decline in the price of oil and increased global concern
about safety and security.
92.42% 7.58%
Profit from the revenue in 2015(%)
Total revenue Profit
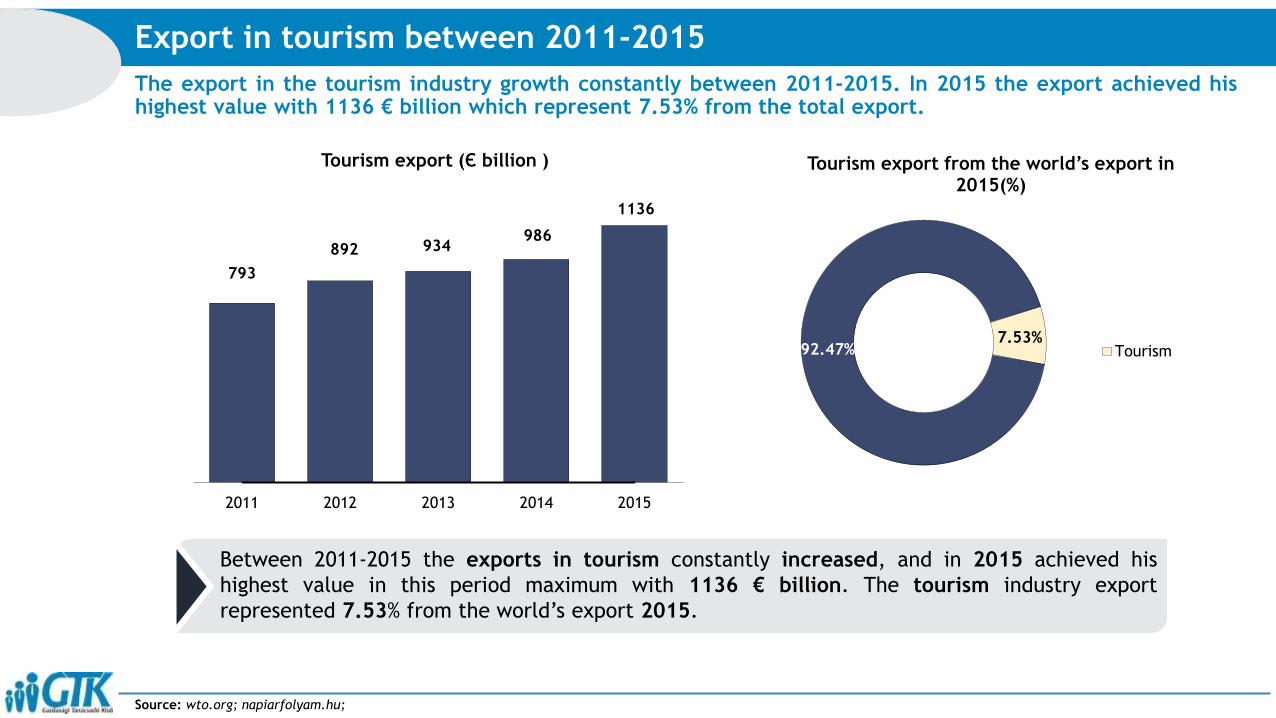
The export in the tourism industry growth constantly between 2011-2015. In 2015 the export achieved hishighest value with 1136 € billion which represent 7.53% from the total export.
Export in tourism between 2011-2015
Source: wto.org; napiarfolyam.hu;
793
892 934986
1136
2011 2012 2013 2014 2015
Tourism export (Є billion )
Between 2011-2015 the exports in tourism constantly increased, and in 2015 achieved his
highest value in this period maximum with 1136 € billion. The tourism industry export
represented 7.53% from the world’s export 2015.
92.47%7.53%
Tourism export from the world’s export in 2015(%)
Tourism
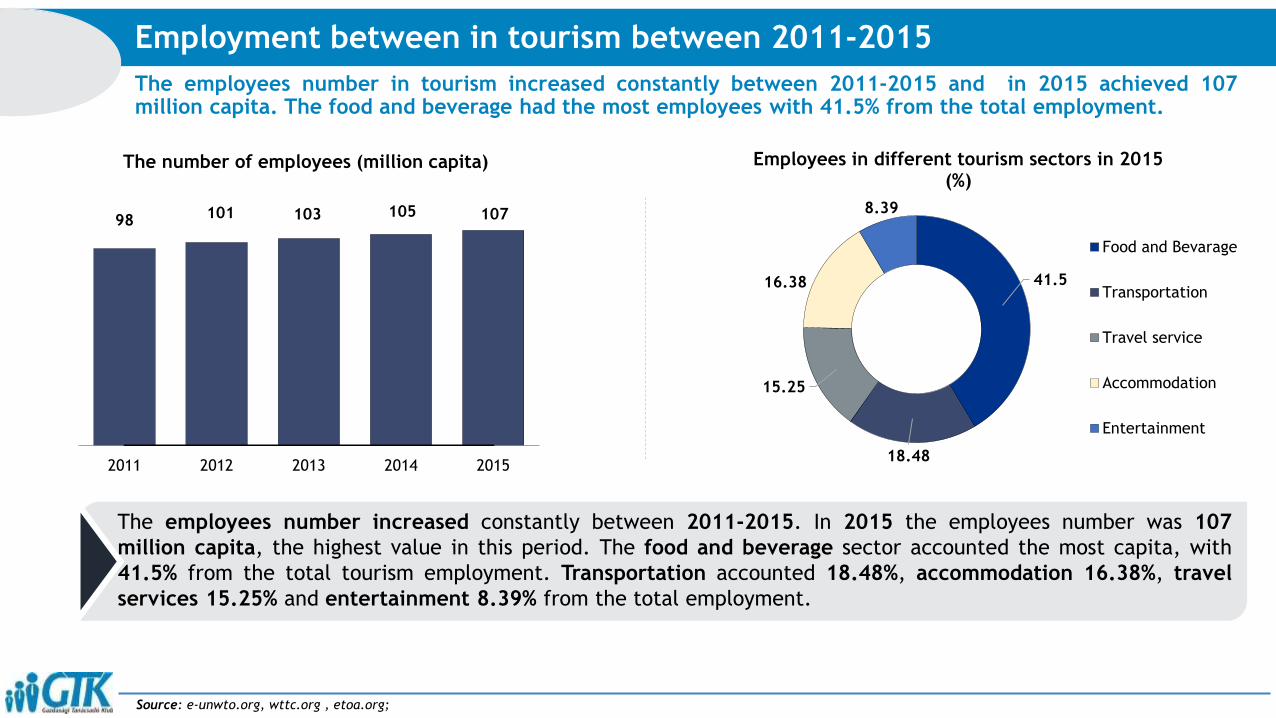
The employees number in tourism increased constantly between 2011-2015 and in 2015 achieved 107million capita. The food and beverage had the most employees with 41.5% from the total employment.
Employment between in tourism between 2011-2015
Source: e-unwto.org, wttc.org , etoa.org;
98 101 103 105 107
2011 2012 2013 2014 2015
The number of employees (million capita)
41.5
18.48
15.25
16.38
8.39
Employees in different tourism sectors in 2015 (%)
Food and Bevarage
Transportation
Travel service
Accommodation
Entertainment
The employees number increased constantly between 2011-2015. In 2015 the employees number was 107
million capita, the highest value in this period. The food and beverage sector accounted the most capita, with
41.5% from the total tourism employment. Transportation accounted 18.48%, accommodation 16.38%, travel
services 15.25% and entertainment 8.39% from the total employment.
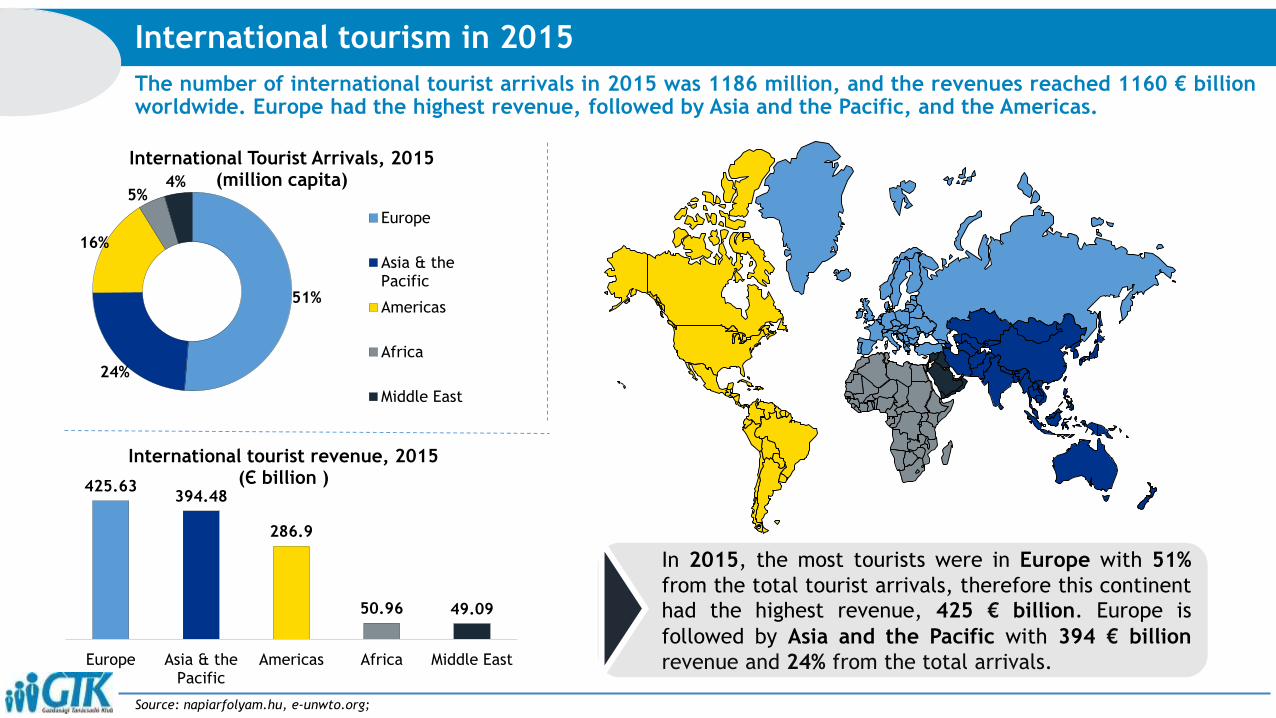
The number of international tourist arrivals in 2015 was 1186 million, and the revenues reached 1160 € billionworldwide. Europe had the highest revenue, followed by Asia and the Pacific, and the Americas.
International tourism in 2015
Source: napiarfolyam.hu, e-unwto.org;
51%
24%
16%
5%4%
International Tourist Arrivals, 2015 (million capita)
Europe
Asia & thePacific
Americas
Africa
Middle East
425.63394.48
286.9
50.96 49.09
Europe Asia & thePacific
Americas Africa Middle East
International tourist revenue, 2015(Є billion )
In 2015, the most tourists were in Europe with 51%
from the total tourist arrivals, therefore this continent
had the highest revenue, 425 € billion. Europe is
followed by Asia and the Pacific with 394 € billion
revenue and 24% from the total arrivals.
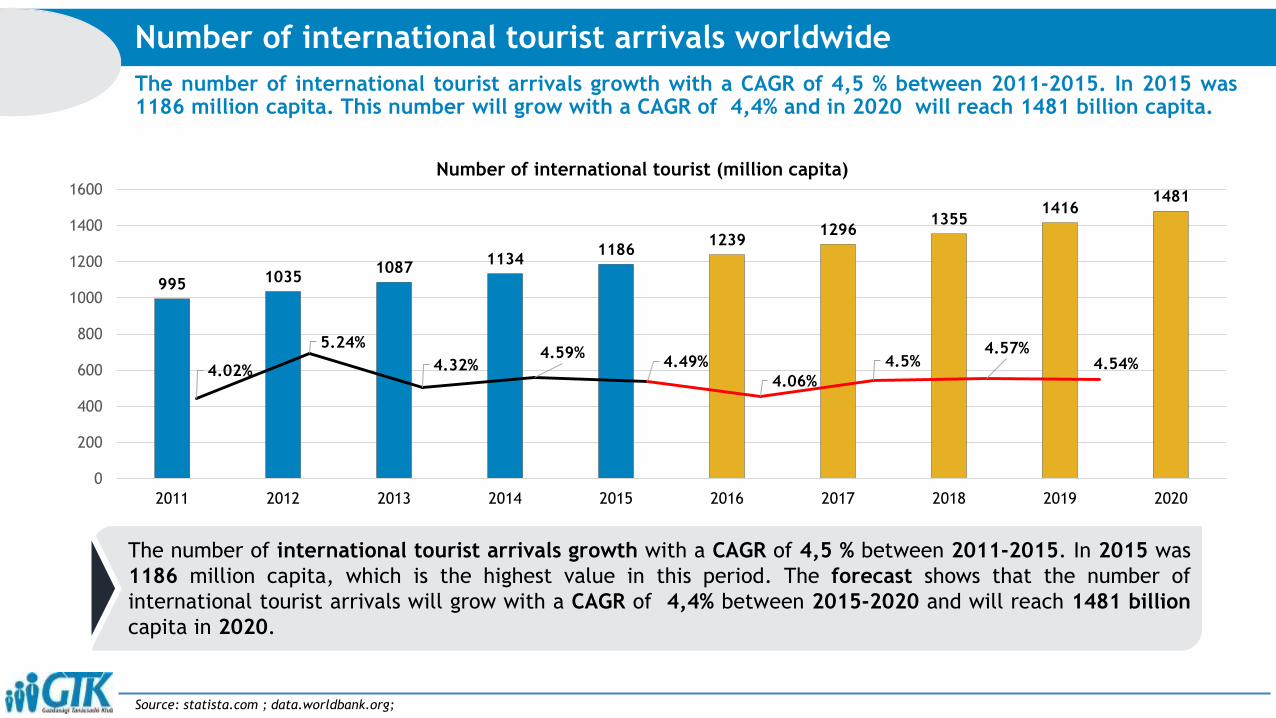
The number of international tourist arrivals growth with a CAGR of 4,5 % between 2011-2015. In 2015 was1186 million capita. This number will grow with a CAGR of 4,4% and in 2020 will reach 1481 billion capita.
Number of international tourist arrivals worldwide
Source: statista.com ; data.worldbank.org;
995 10351087
11341186
12391296
13551416
1481
0
200
400
600
800
1000
1200
1400
1600
2011 2012 2013 2014 2015 2016 2017 2018 2019 2020
Number of international tourist (million capita)
4.02%
5.24%
4.32%4.59%
4.49%
4.06%
4.5%4.57%
4.54%
The number of international tourist arrivals growth with a CAGR of 4,5 % between 2011-2015. In 2015 was
1186 million capita, which is the highest value in this period. The forecast shows that the number of
international tourist arrivals will grow with a CAGR of 4,4% between 2015-2020 and will reach 1481 billion
capita in 2020.
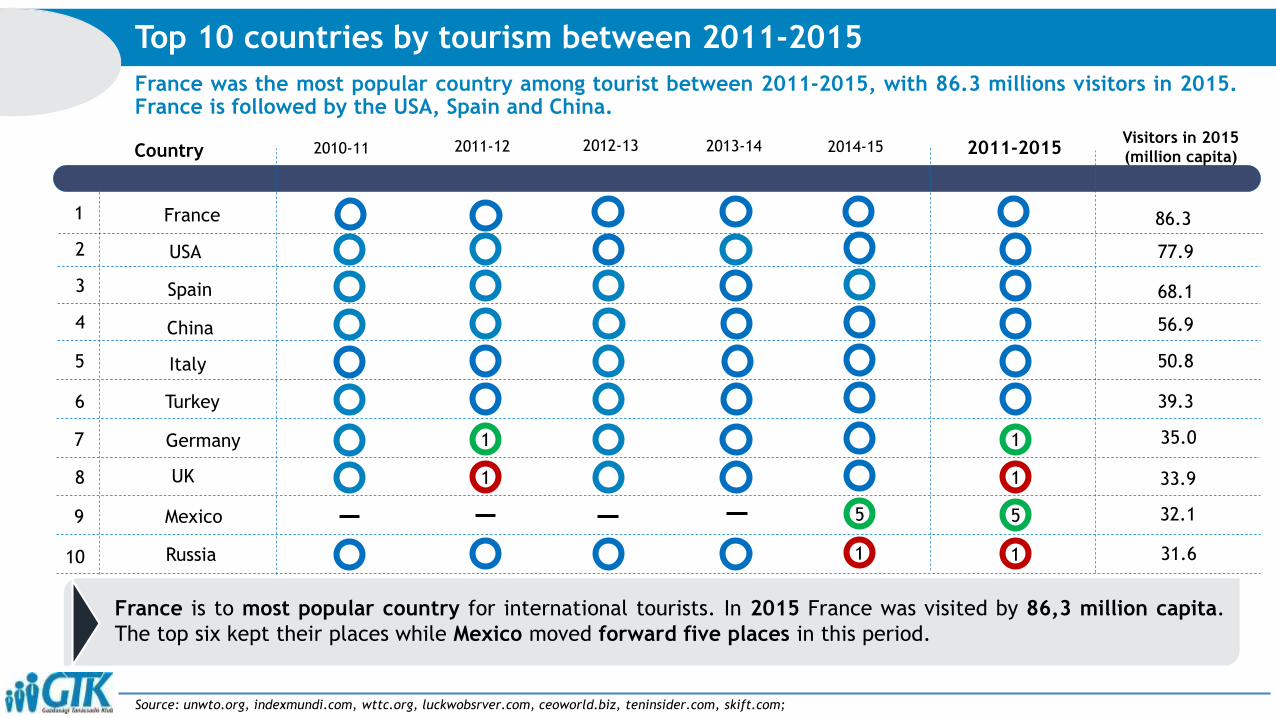
France was the most popular country among tourist between 2011-2015, with 86.3 millions visitors in 2015.France is followed by the USA, Spain and China.
Top 10 countries by tourism between 2011-2015
Source: unwto.org, indexmundi.com, wttc.org, luckwobsrver.com, ceoworld.biz, teninsider.com, skift.com;
2010-11 2011-12 2012-13 2013-14 2011-2015Country
1
2
3
4
5
6
7
8
9
10
1
1
5
1
1
1
5
1
2014-15
USA
Spain
China
Italy
Turkey
Germany
UK
Mexico
Russia
France
Visitors in 2015
(million capita)
86.3
77.9
68.1
56.9
50.8
39.3
35.0
33.9
32.1
31.6
France is to most popular country for international tourists. In 2015 France was visited by 86,3 million capita.
The top six kept their places while Mexico moved forward five places in this period.
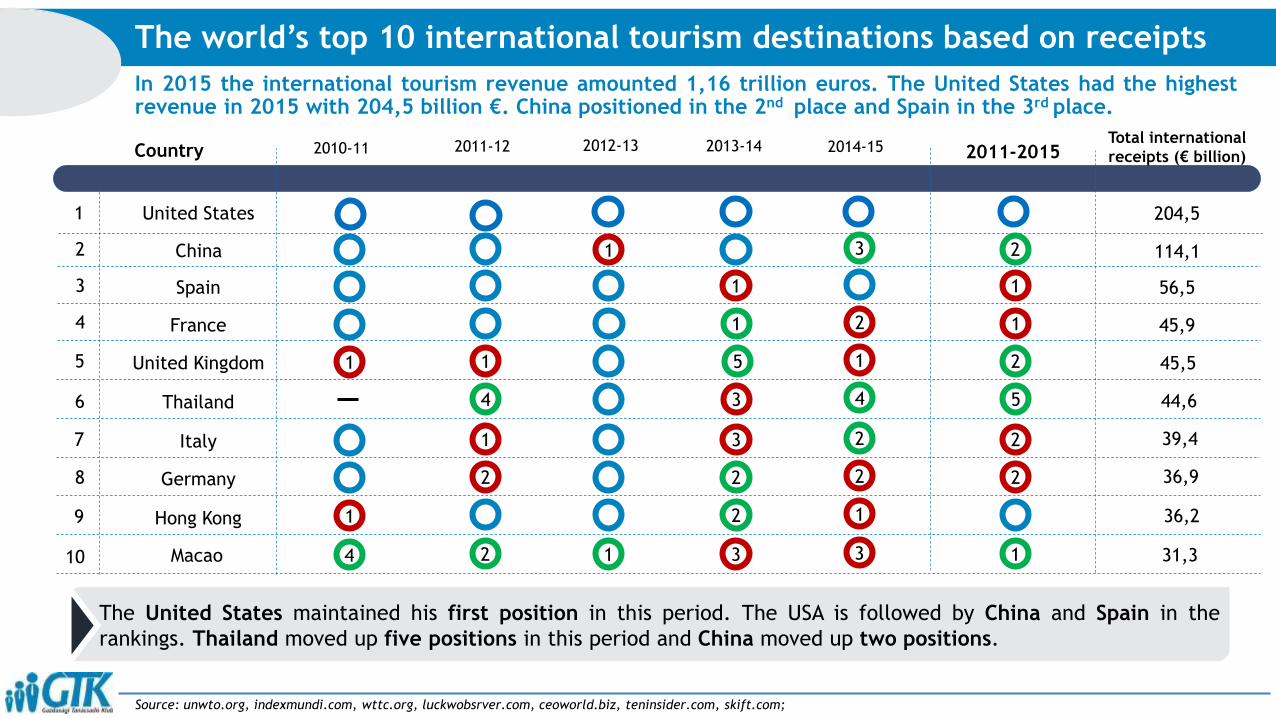
In 2015 the international tourism revenue amounted 1,16 trillion euros. The United States had the highestrevenue in 2015 with 204,5 billion €. China positioned in the 2nd place and Spain in the 3rd place.
The world’s top 10 international tourism destinations based on receipts
Source: unwto.org, indexmundi.com, wttc.org, luckwobsrver.com, ceoworld.biz, teninsider.com, skift.com;
2010-11 2011-12 2012-13 2013-14 2011-2015Country
1
2
3
4
5
6
7
8
9
10
Total international
receipts (€ billion)
204,5
114,1
56,5
45,9
United States
China
Spain
France
United Kingdom
Thailand
Italy
Germany
Hong Kong
Macao
1
4
1
2
2 1
1
1
5
3
3
2
2
3
3
2
1
4
2
2
1
3
2
1
1
2
5
2
2
1
2014-15
1
1
4
45,5
44,6
39,4
36,9
36,2
31,3
The United States maintained his first position in this period. The USA is followed by China and Spain in the
rankings. Thailand moved up five positions in this period and China moved up two positions.
1

The USA residents made the most outbound travel trips between 2011-2015. In 2015 the residents of USAmade 161,3 million trips, they were followed by China and Germany.
Countries worldwide with the most outbound travel trips
Source: unwto.org, traveller.com, oyster.com, statista.com, knoema.com, ons.gov.uk, forbes.com;
2010-11 2011-12 2013-14 2014-15 2011-2015Country
1
2
3
4
5
6
7
8
9
10
United States
China
Germany
United Kingdom
Italy
Russia
Canada
India
Mexico
Netherlands
8
1
1
1
1
1
1
1
1
1
1
8
1
1
1
1
4
1
3
161,3
110
95,8
65,7
50,9
36,8
35,3
20,4
19,3
17,8
2012-13
1
1
3
3
2
Number of outbound
trips (million)
Residents from the United States travelled the most in 2015, with 161,3 million travels abroad. With 110 million
outbound trips, China ranked second and with 95,8 million trips abroad, Germany remained is the third. Germany
moved up eight positions in the rankings and India moved up four positions.
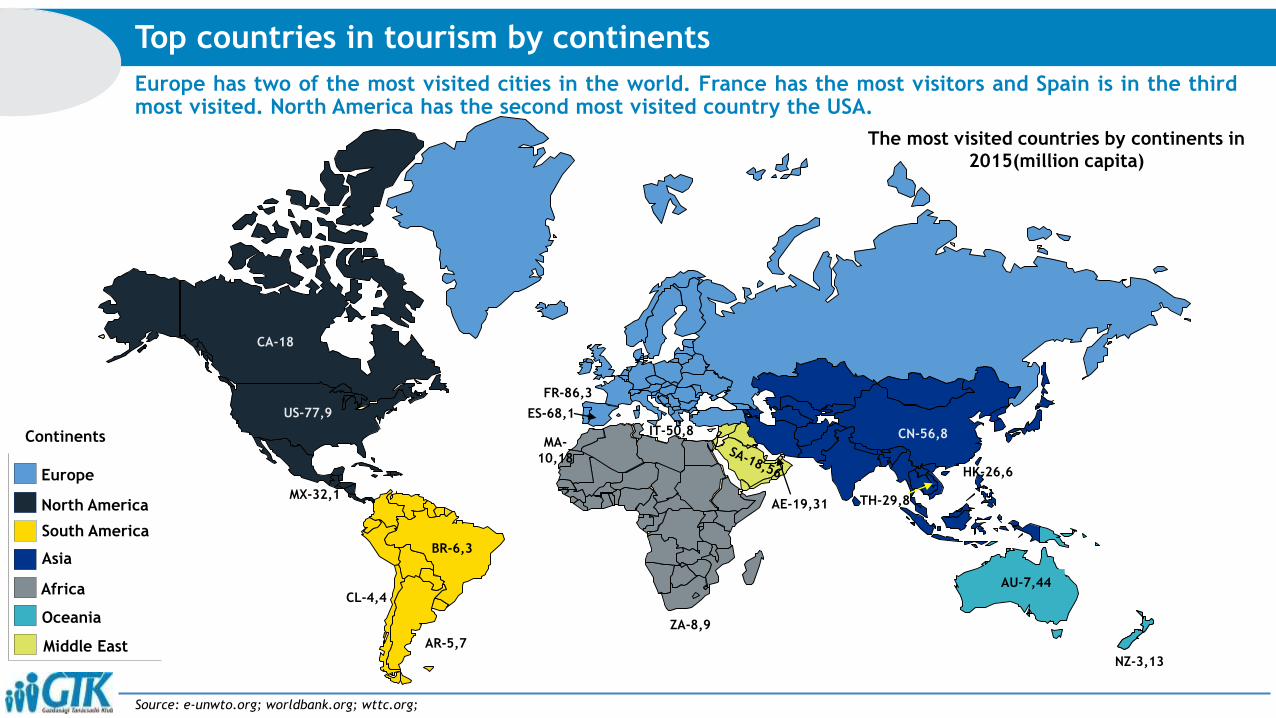
Europe has two of the most visited cities in the world. France has the most visitors and Spain is in the thirdmost visited. North America has the second most visited country the USA.
Top countries in tourism by continents
Source: e-unwto.org; worldbank.org; wttc.org;
TH-29,8
BR-6,3
AR-5,7
CL-4,4
US-77,9
CA-18
MX-32,1
MA-
10,18
ZA-8,9
CN-56,8
HK-26,6
AU-7,44
NZ-3,13
FR-86,3
ES-68,1
The most visited countries by continents in
2015(million capita)
AE-19,31
Europe
North America
South America
Asia
Oceania
Africa
Middle East
Continents IT-50,8

AGENDA
[World]
Overview
Subsectors

The travel services sector revenue growth constantly between 2011-2015 with a CAGR of 4.3%. In 2015 therevenue was 144.95 billion € which represent 7% of the total tourism revenue.
Travel services sector revenue between 2011-2015
Source: ibisworld.com; statista.com;
121.58
127.04
132.75
138.72
144.95
105
110
115
120
125
130
135
140
145
150
2011 2012 2013 2014 2015
Revenue of travel sevices between 2011-2015 (Є billion)
7.04%92.96%
Travel services sector revenue from total revenue in 2015 (%)
Travel Services Revenue Tourism Revenue
The travel services sector revenue growth constantly between 2011-2015 with a CAGR of 4.3%. In
2015 the revenue was 144.95 billion € which is the highest value in this period and represent 7% of
the total tourism revenue.
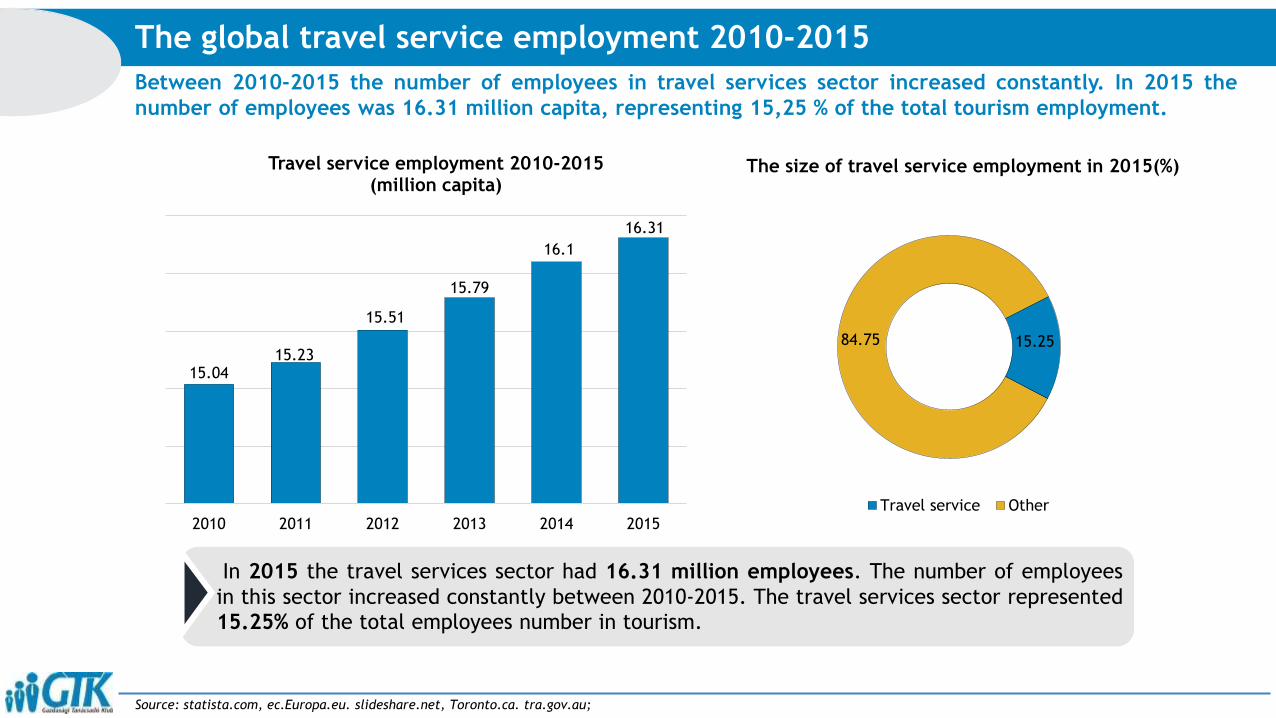
Between 2010-2015 the number of employees in travel services sector increased constantly. In 2015 the
number of employees was 16.31 million capita, representing 15,25 % of the total tourism employment.
The global travel service employment 2010-2015
Source: statista.com, ec.Europa.eu. slideshare.net, Toronto.ca. tra.gov.au;
15.0415.23
15.51
15.79
16.1
16.31
2010 2011 2012 2013 2014 2015
Travel service employment 2010-2015(million capita)
15.2584.75
The size of travel service employment in 2015(%)
Travel service Other
In 2015 the travel services sector had 16.31 million employees. The number of employees
in this sector increased constantly between 2010-2015. The travel services sector represented
15.25% of the total employees number in tourism.
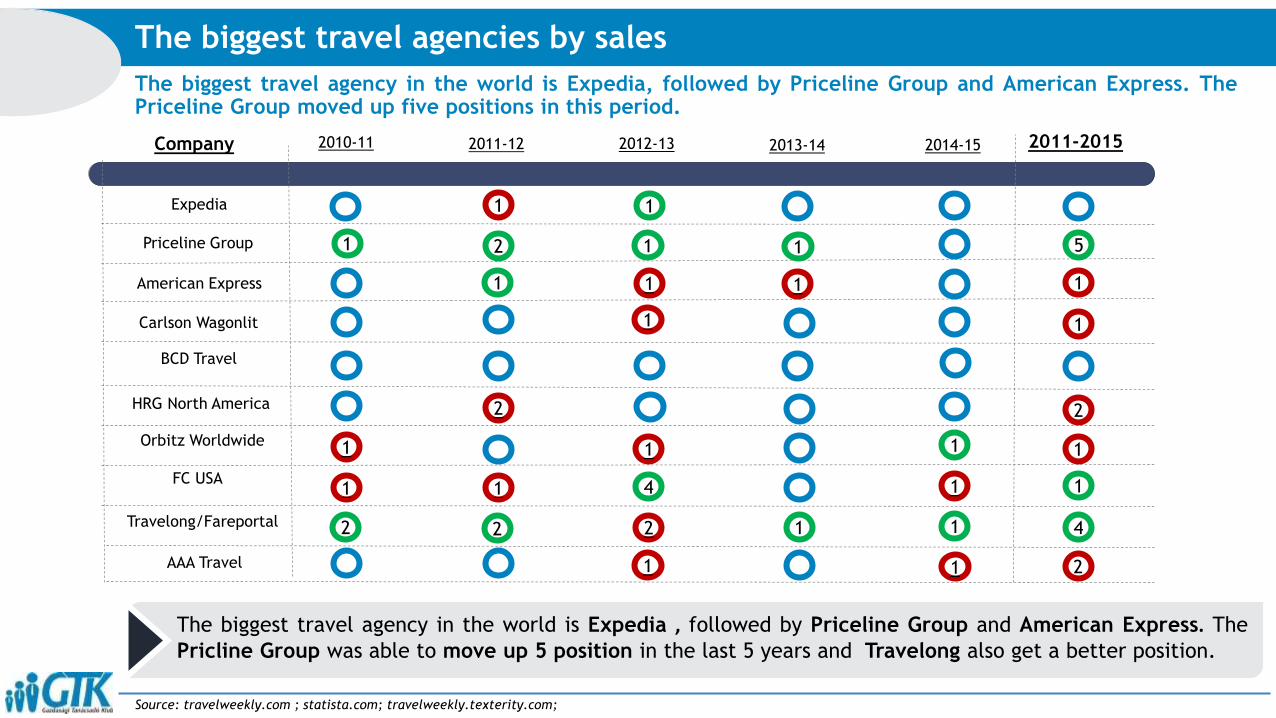
The biggest travel agency in the world is Expedia, followed by Priceline Group and American Express. ThePriceline Group moved up five positions in this period.
The biggest travel agencies by sales
Source: travelweekly.com ; statista.com; travelweekly.texterity.com;
Company 2010-11 2011-12 2012-13 2013-14 2011-20152014-15
Expedia
Priceline Group
American Express
HRG North America
BCD Travel
Orbitz Worldwide
Travelong/Fareportal
AAA Travel
1
2
1
FC USA
1
5
1
1
1
1
1
1
1
1
1
11
2
1
2
1 1
4 1
4
1
22
Carlson Wagonlit
1
1
1
2
1
2
The biggest travel agency in the world is Expedia , followed by Priceline Group and American Express. The
Pricline Group was able to move up 5 position in the last 5 years and Travelong also get a better position.
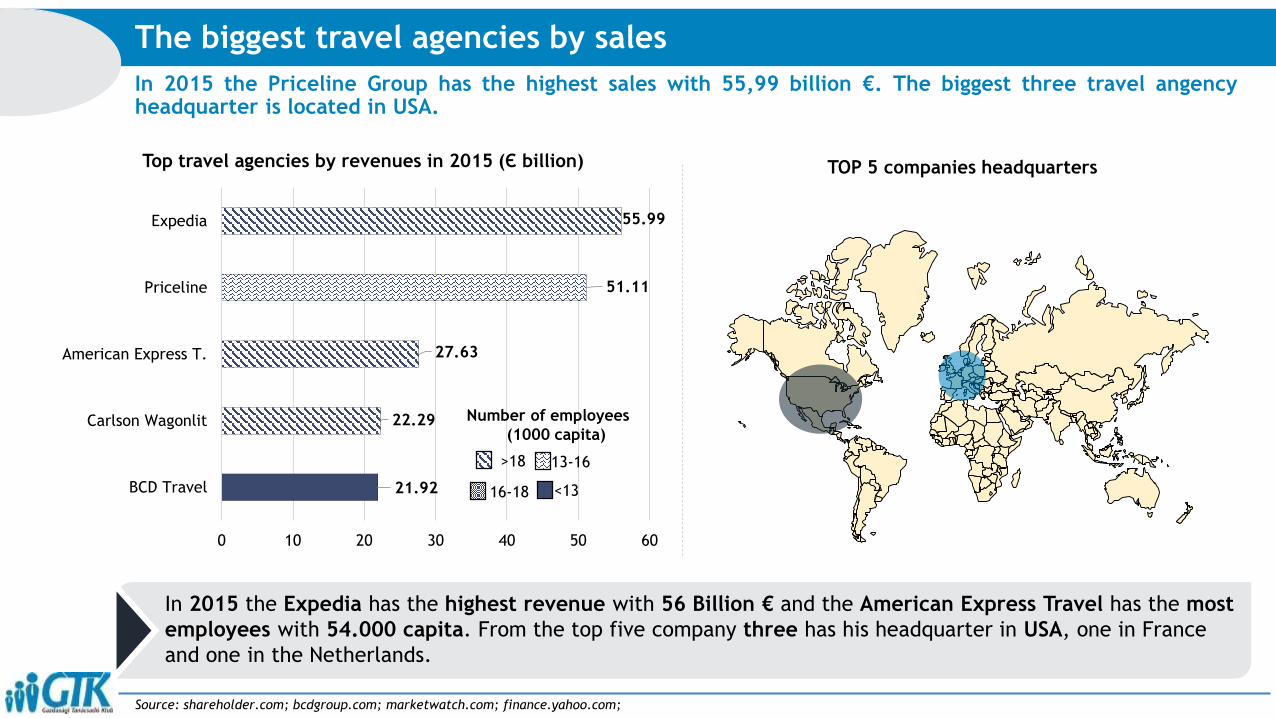
In 2015 the Priceline Group has the highest sales with 55,99 billion €. The biggest three travel angencyheadquarter is located in USA.
The biggest travel agencies by sales
Source: shareholder.com; bcdgroup.com; marketwatch.com; finance.yahoo.com;
TOP 5 companies headquarters
In 2015 the Expedia has the highest revenue with 56 Billion € and the American Express Travel has the most
employees with 54.000 capita. From the top five company three has his headquarter in USA, one in France
and one in the Netherlands.
21.92
22.29
27.63
51.11
55.99
0 10 20 30 40 50 60
BCD Travel
Carlson Wagonlit
American Express T.
Priceline
Expedia
Top travel agencies by revenues in 2015 (Є billion)
>18
16-18
13-16
<13
Number of employees
(1000 capita)

Expedia, Inc. is an online travel company, empowering business and leisure travelers. Their advertising and mediabusinesses help other businesses, primarily travel providers, reach a large audience of travelers around the globe.
1.Expedia Inc.
Source: shareholder.com, travelweekly.com;
55.99
41.64
28.58
25.73
22.55
0.00 10.00 20.00 30.00 40.00 50.00 60.00
2015
2014
2013
2012
2011
Sales between 2011-2015 (€ billion)
Market Management
Technology
Corporate
Lodging Partner Services
Bellevue,
United States
Founded in: 1996
18.000+ employees now
Localized sites in 33 countries
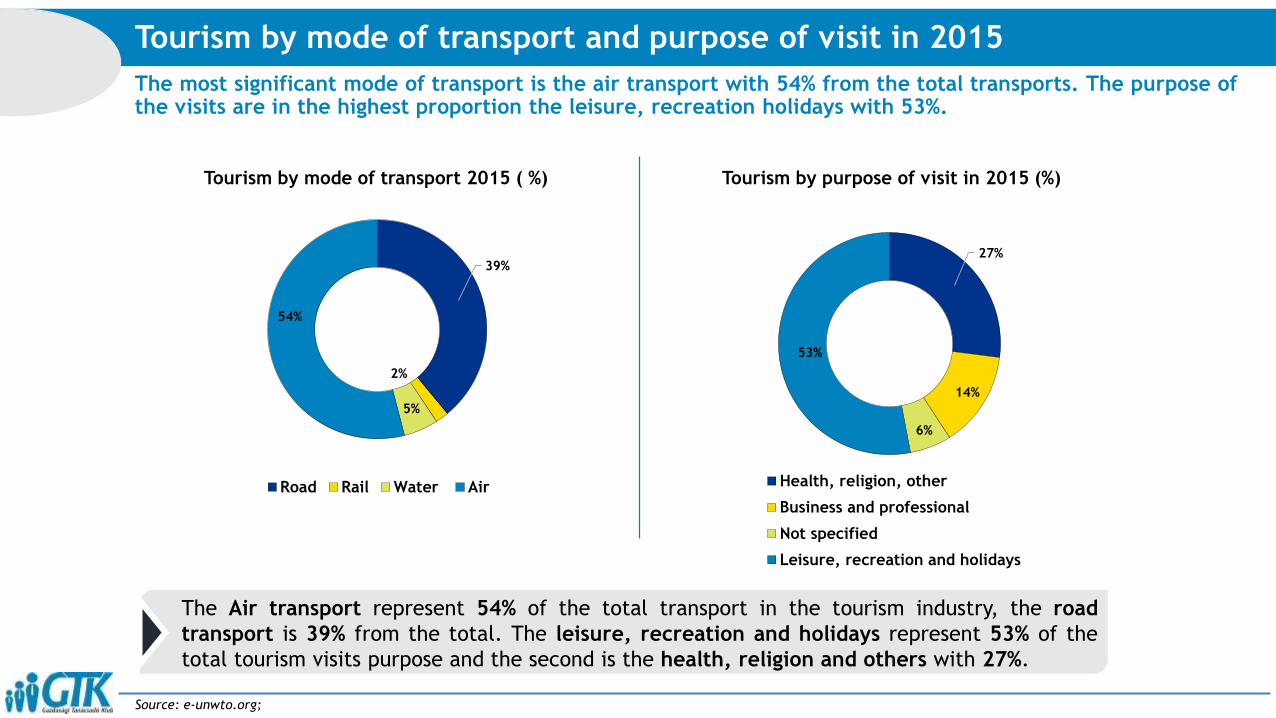
The most significant mode of transport is the air transport with 54% from the total transports. The purpose ofthe visits are in the highest proportion the leisure, recreation holidays with 53%.
Tourism by mode of transport and purpose of visit in 2015
Source: e-unwto.org;
39%
2%
5%
54%
Tourism by mode of transport 2015 ( %)
Road Rail Water Air
27%
14%
6%
53%
Tourism by purpose of visit in 2015 (%)
Health, religion, other
Business and professional
Not specified
Leisure, recreation and holidays
The Air transport represent 54% of the total transport in the tourism industry, the road
transport is 39% from the total. The leisure, recreation and holidays represent 53% of the
total tourism visits purpose and the second is the health, religion and others with 27%.

36.05%63.95%
Transportation sector revenue from the total revenue in 2015(%)
Transportation Other
The transportation sector revenue growth constantly between 2011-2015 with a CAGR of 3.5%. In 2015 therevenue was billion € which represent 41% of the total tourism revenue.
Transportation sector revenue between 2011-2015
Source: ibisworld.com; statista.com;
The transportation sector revenue growth constantly between 2011-2015 with a CAGR of 3.5%. In
2015 the revenue was 742.68 billion € which is the highest value in this period and represent 41% of
the total tourism revenue.
647.2 669.85693.30
717.57742.68
0
100
200
300
400
500
600
700
800
900
1000
2011 2012 2013 2014 2015
Transportation sector revenue 2011-2015 (billion €)
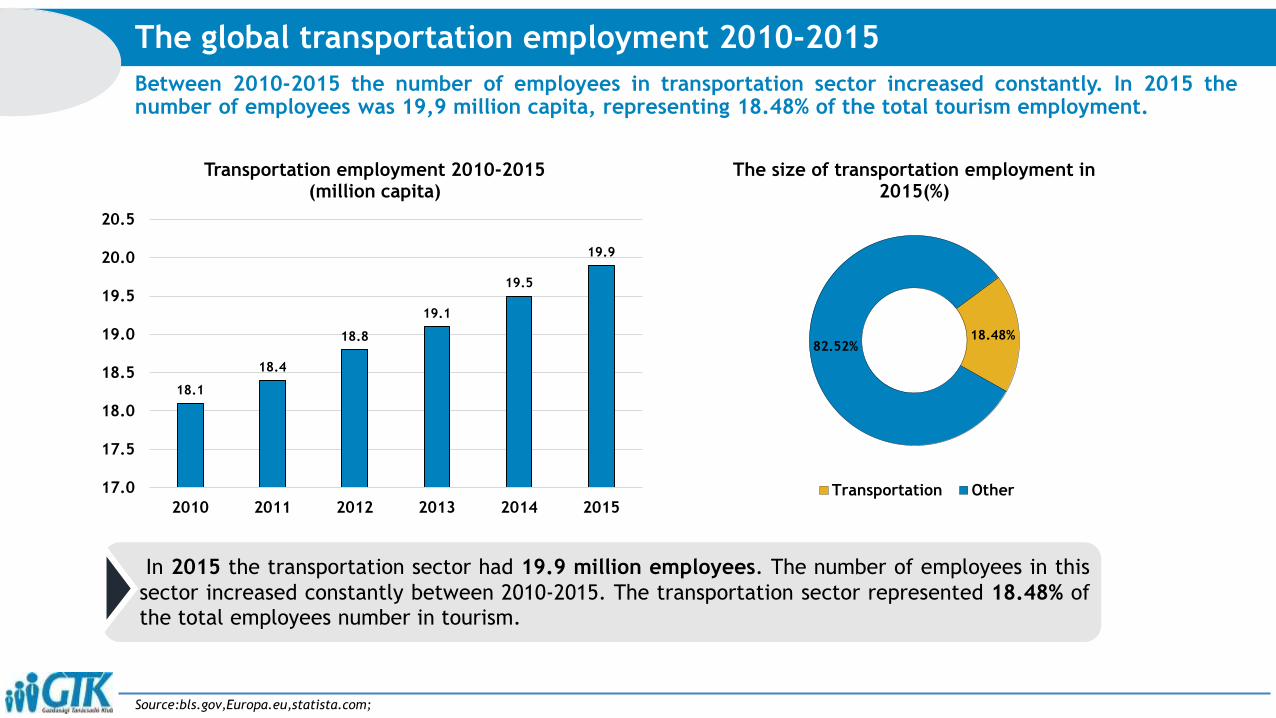
Between 2010-2015 the number of employees in transportation sector increased constantly. In 2015 thenumber of employees was 19,9 million capita, representing 18.48% of the total tourism employment.
The global transportation employment 2010-2015
Source:bls.gov,Europa.eu,statista.com;
18.1
18.4
18.8
19.1
19.5
19.9
17.0
17.5
18.0
18.5
19.0
19.5
20.0
20.5
2010 2011 2012 2013 2014 2015
Transportation employment 2010-2015(million capita)
18.48%82.52%
The size of transportation employment in 2015(%)
Transportation Other
In 2015 the transportation sector had 19.9 million employees. The number of employees in this
sector increased constantly between 2010-2015. The transportation sector represented 18.48% of
the total employees number in tourism.

The top five airlines are American, Delta, United, Lufthansa and Air France they lead the list between 2011-2015. American Airlines and Southwest moved up 4 positions in this period.
Top 10 airlines 2011-2015
2010-2011 2011-2012 2012-2013 2013-2014 2014-2015 Fleet in 2015 (planes)Airline
4American Airlines
Delta
United
Lufthansa Group
Air France
Southwest
Qantas Airlines
Alaska Air
Ryanair
easyJet
1494
830
736
600
573
711
123
365
233
233
1.
2.
3.
4.
5.
6.
7.
8.
9.
10.
2011-2015
4
1
1 1
1
1
The top 10 airlines are: American, Delta, United, Lufthansa and Air France, Southwest, Qantas, Alaska Air,
Ryanair, and EasyJet. American Airlines and Southwest moved up four positions, on the other hand Lufthansa
moved down three positions.
Source: transportation.gov, aci-na.org, rita.dot.gov, marketwatch.com, tharawat-magazine.com, insidermonkey.com, ideaworkscompany.com, planespotters.net, investor.ryanair.com
2
12
3
1
1 3
1
4
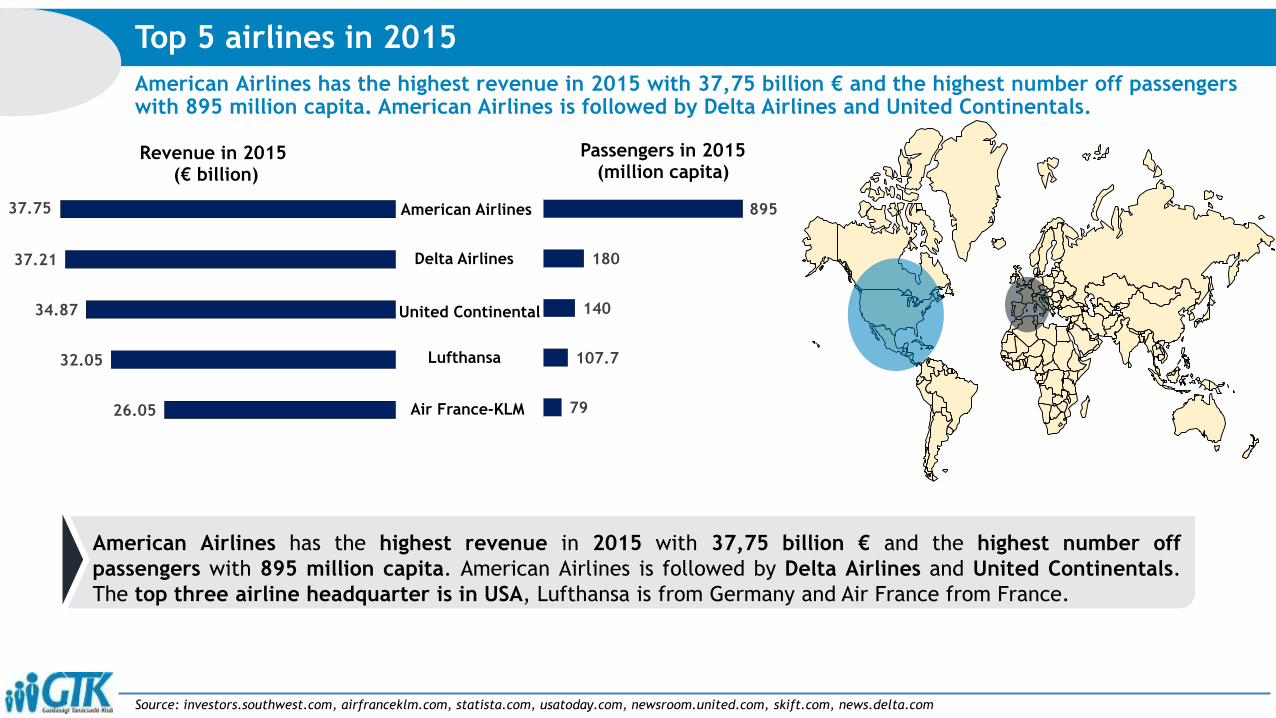
Top 5 airlines in 2015
Source: investors.southwest.com, airfranceklm.com, statista.com, usatoday.com, newsroom.united.com, skift.com, news.delta.com
American Airlines has the highest revenue in 2015 with 37,75 billion € and the highest number off
passengers with 895 million capita. American Airlines is followed by Delta Airlines and United Continentals.
The top three airline headquarter is in USA, Lufthansa is from Germany and Air France from France.
79
107.7
140
180
895
Passengers in 2015 (million capita)
26.05
32.05
34.87
37.21
37.75
Revenue in 2015(€ billion)
American Airlines
Delta Airlines
United Continental
Lufthansa
Air France-KLM
American Airlines has the highest revenue in 2015 with 37,75 billion € and the highest number off passengerswith 895 million capita. American Airlines is followed by Delta Airlines and United Continentals.
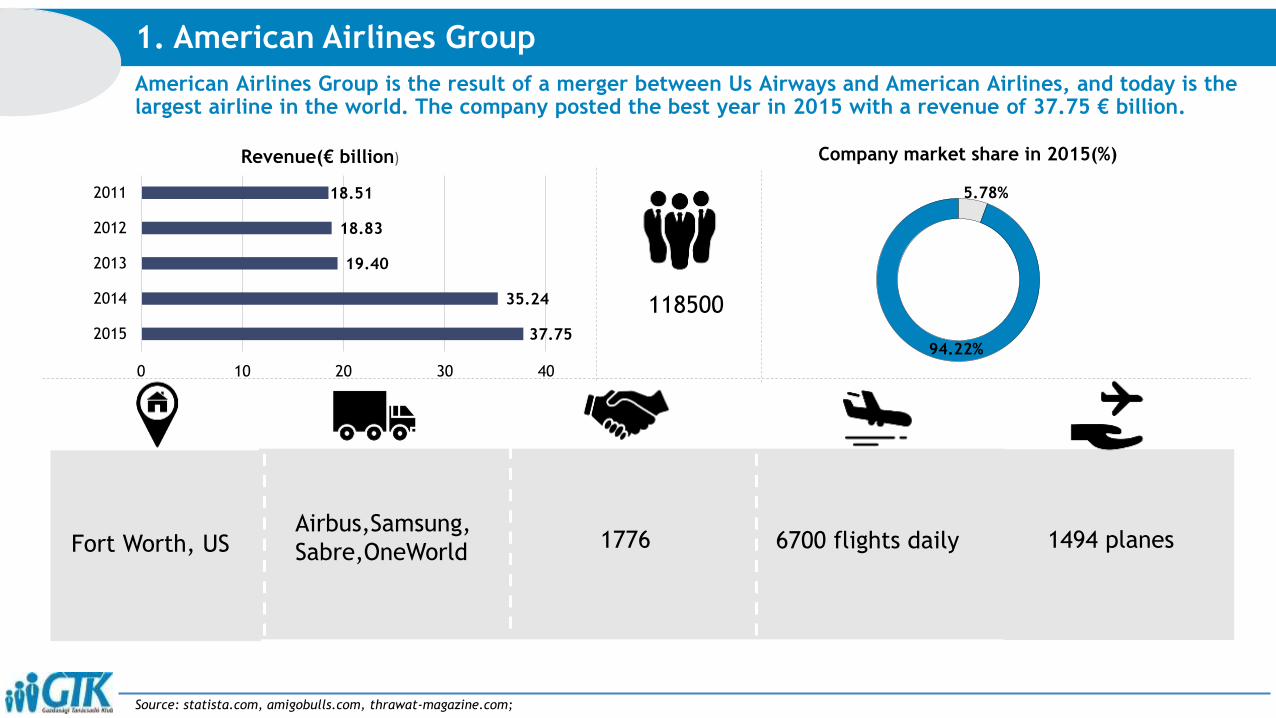
37.75
35.24
19.40
18.83
18.51
0 10 20 30 40
2015
2014
2013
2012
2011
Revenue(€ billion)
American Airlines Group is the result of a merger between Us Airways and American Airlines, and today is thelargest airline in the world. The company posted the best year in 2015 with a revenue of 37.75 € billion.
1. American Airlines Group
Source: statista.com, amigobulls.com, thrawat-magazine.com;
Airbus,Samsung,
Sabre,OneWorldFort Worth, US 6700 flights daily 1494 planes1776
5.78%
94.22%
Company market share in 2015(%)
118500
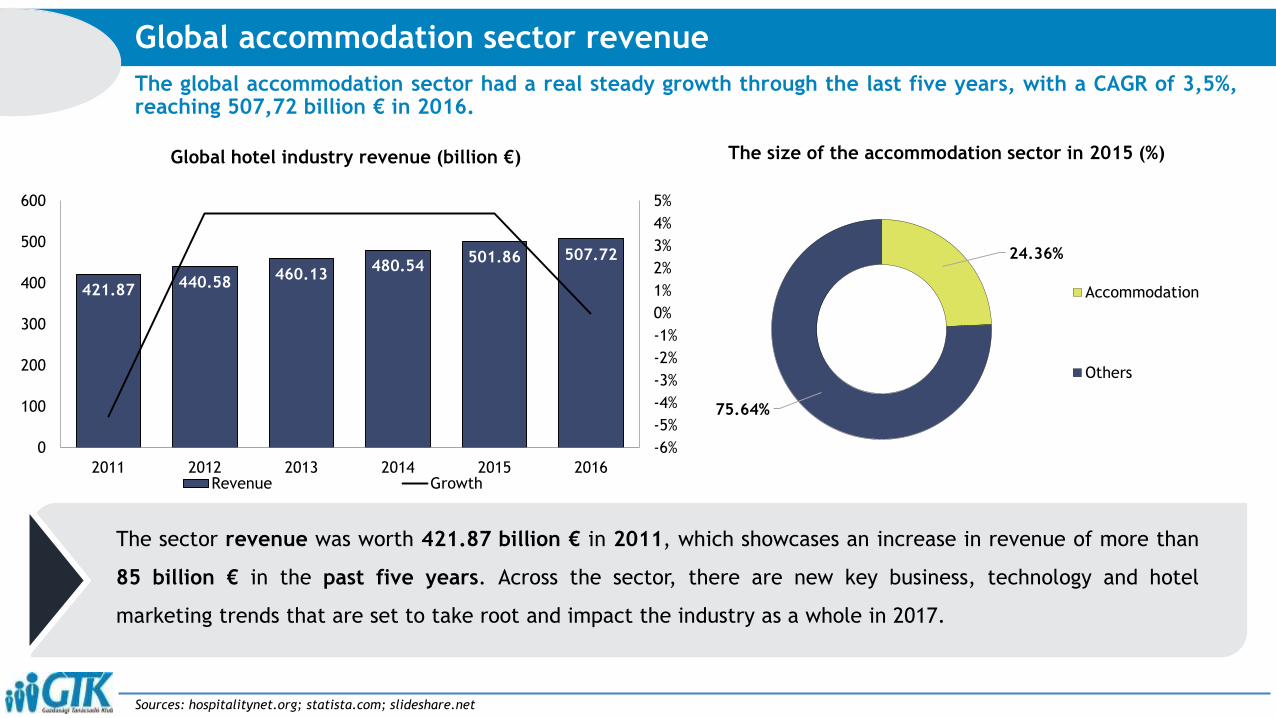
The global accommodation sector had a real steady growth through the last five years, with a CAGR of 3,5%,reaching 507,72 billion € in 2016.
Global accommodation sector revenue
Sources: hospitalitynet.org; statista.com; slideshare.net
421.87440.58
460.13480.54
501.86 507.72
-6%
-5%
-4%
-3%
-2%
-1%
0%
1%
2%
3%
4%
5%
0
100
200
300
400
500
600
2011 2012 2013 2014 2015 2016
Global hotel industry revenue (billion €)
Revenue Growth
The sector revenue was worth 421.87 billion € in 2011, which showcases an increase in revenue of more than
85 billion € in the past five years. Across the sector, there are new key business, technology and hotel
marketing trends that are set to take root and impact the industry as a whole in 2017.
24.36%
75.64%
The size of the accommodation sector in 2015 (%)
Accommodation
Others
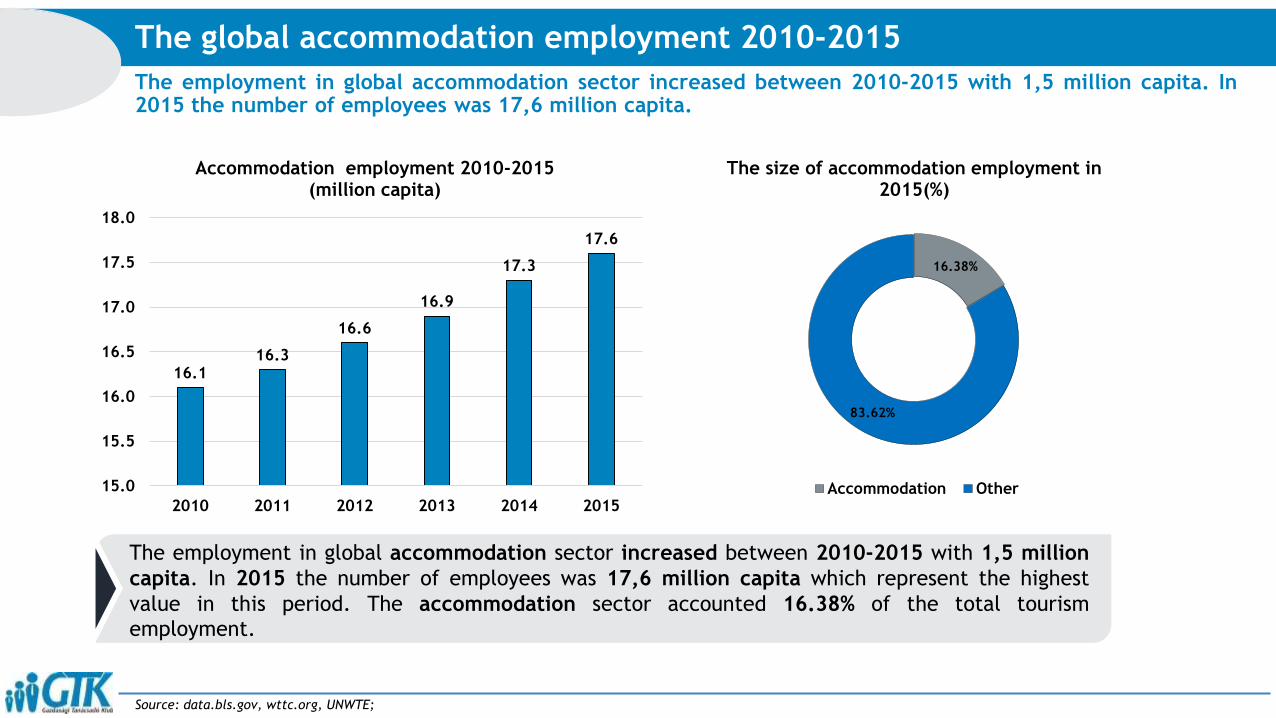
The employment in global accommodation sector increased between 2010-2015 with 1,5 million capita. In2015 the number of employees was 17,6 million capita.
The global accommodation employment 2010-2015
Source: data.bls.gov, wttc.org, UNWTE;
16.116.3
16.6
16.9
17.3
17.6
15.0
15.5
16.0
16.5
17.0
17.5
18.0
2010 2011 2012 2013 2014 2015
Accommodation employment 2010-2015(million capita)
16.38%
83.62%
The size of accommodation employment in 2015(%)
Accommodation Other
The employment in global accommodation sector increased between 2010-2015 with 1,5 million
capita. In 2015 the number of employees was 17,6 million capita which represent the highest
value in this period. The accommodation sector accounted 16.38% of the total tourism
employment.
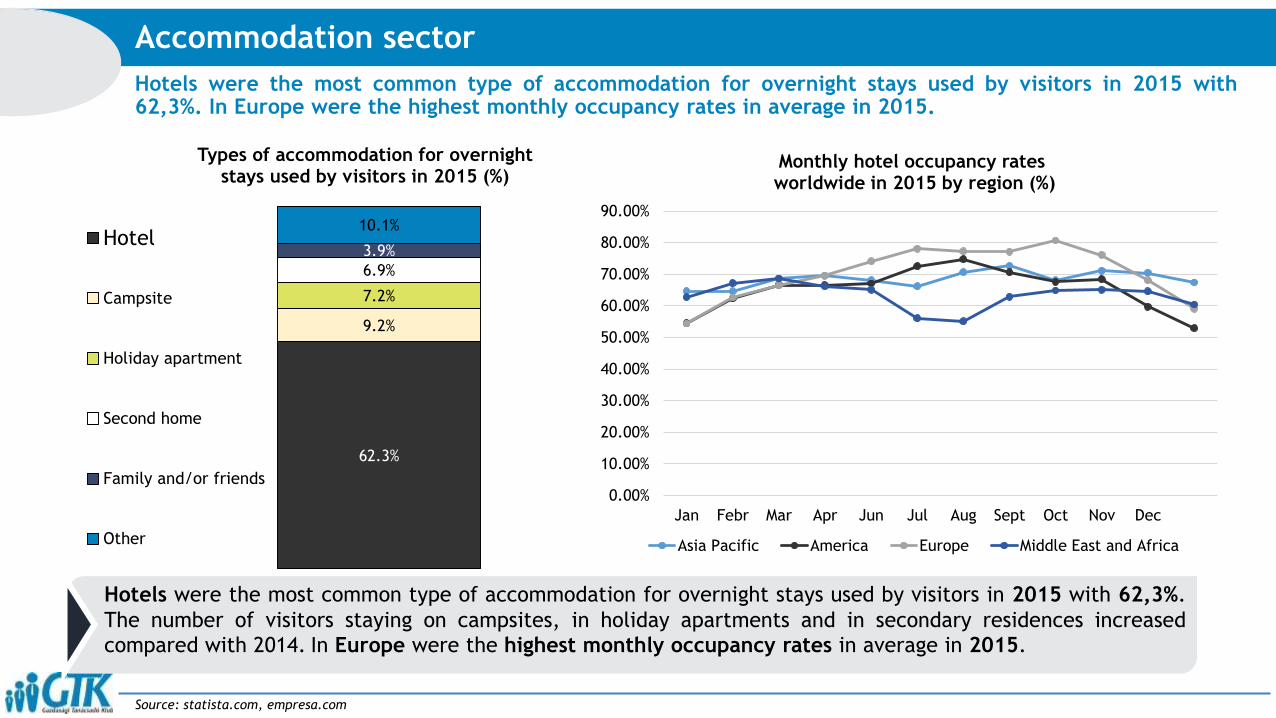
Hotels were the most common type of accommodation for overnight stays used by visitors in 2015 with62,3%. In Europe were the highest monthly occupancy rates in average in 2015.
Accommodation sector
Source: statista.com, empresa.com
62.3%
9.2%
7.2%
6.9%
3.9%
10.1%
Types of accommodation for overnightstays used by visitors in 2015 (%)
Hotel
Campsite
Holiday apartment
Second home
Family and/or friends
Other
0.00%
10.00%
20.00%
30.00%
40.00%
50.00%
60.00%
70.00%
80.00%
90.00%
Jan Febr Mar Apr Jun Jul Aug Sept Oct Nov Dec
Monthly hotel occupancy ratesworldwide in 2015 by region (%)
Asia Pacific America Europe Middle East and Africa
Hotels were the most common type of accommodation for overnight stays used by visitors in 2015 with 62,3%.
The number of visitors staying on campsites, in holiday apartments and in secondary residences increased
compared with 2014. In Europe were the highest monthly occupancy rates in average in 2015.
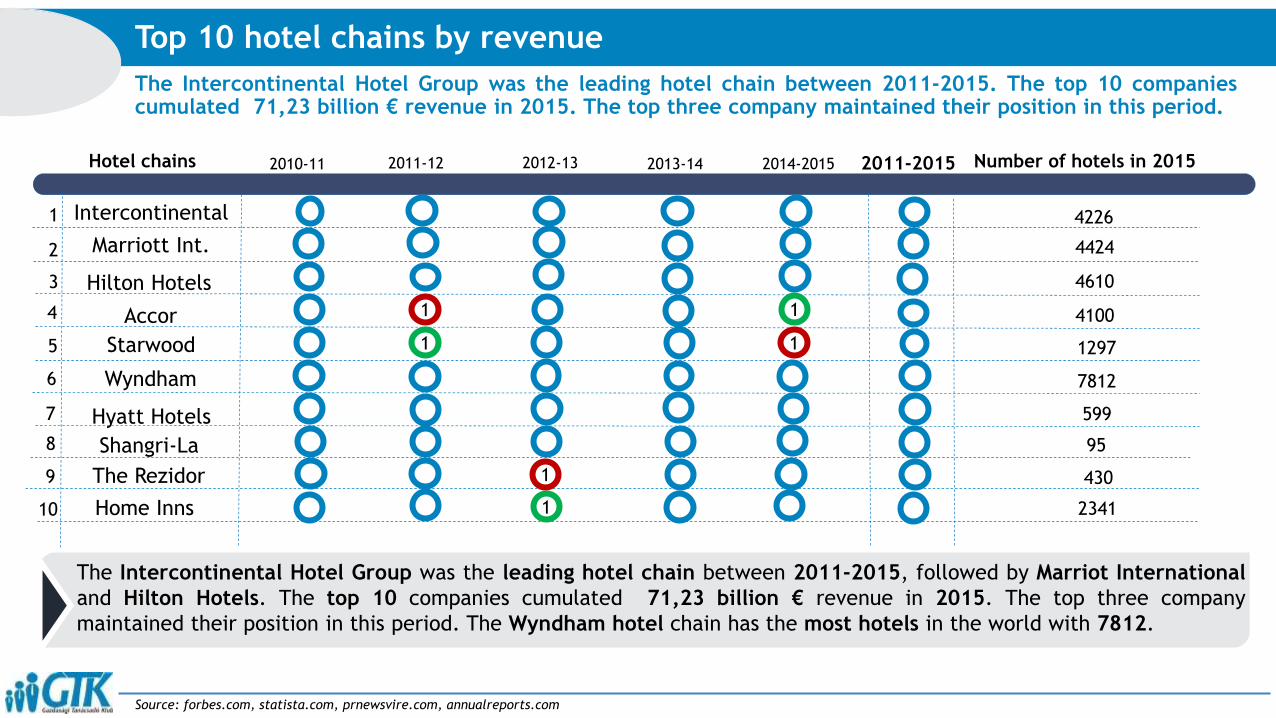
The Intercontinental Hotel Group was the leading hotel chain between 2011-2015. The top 10 companiescumulated 71,23 billion € revenue in 2015. The top three company maintained their position in this period.
Top 10 hotel chains by revenue
Source: forbes.com, statista.com, prnewsvire.com, annualreports.com
2010-11 2011-12 2012-13 2013-14 2011-2015Hotel chains
1
2
3
4
5
6
7
8
9
10
1
1
1
The Intercontinental Hotel Group was the leading hotel chain between 2011-2015, followed by Marriot International
and Hilton Hotels. The top 10 companies cumulated 71,23 billion € revenue in 2015. The top three company
maintained their position in this period. The Wyndham hotel chain has the most hotels in the world with 7812.
Number of hotels in 2015
Intercontinental
Marriott Int.
Hilton Hotels
Accor
Starwood
Wyndham
Hyatt Hotels
Shangri-La
The Rezidor
Home Inns
4226
4424
4610
4100
1297
7812
599
95
430
2341
2014-2015
1
1
1
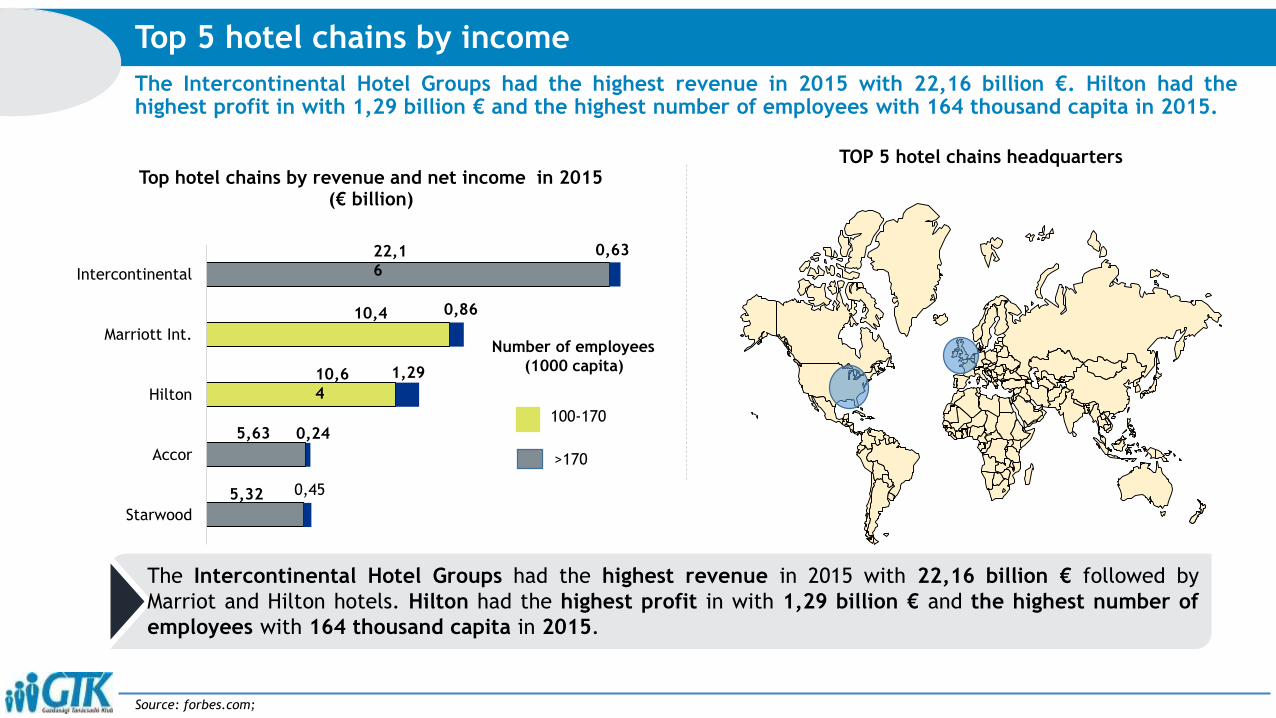
The Intercontinental Hotel Groups had the highest revenue in 2015 with 22,16 billion €. Hilton had thehighest profit in with 1,29 billion € and the highest number of employees with 164 thousand capita in 2015.
Top 5 hotel chains by income
Source: forbes.com;
Starwood
Accor
Hilton
Marriott Int.
Intercontinental
Top hotel chains by revenue and net income in 2015 (€ billion)
0,86
0,45
Number of employees
(1000 capita)
5,63
0,63
1,29
0,24100-170
>170
TOP 5 hotel chains headquarters
The Intercontinental Hotel Groups had the highest revenue in 2015 with 22,16 billion € followed by
Marriot and Hilton hotels. Hilton had the highest profit in with 1,29 billion € and the highest number of
employees with 164 thousand capita in 2015.
22,1
6
10,4
10,6
4
5,32
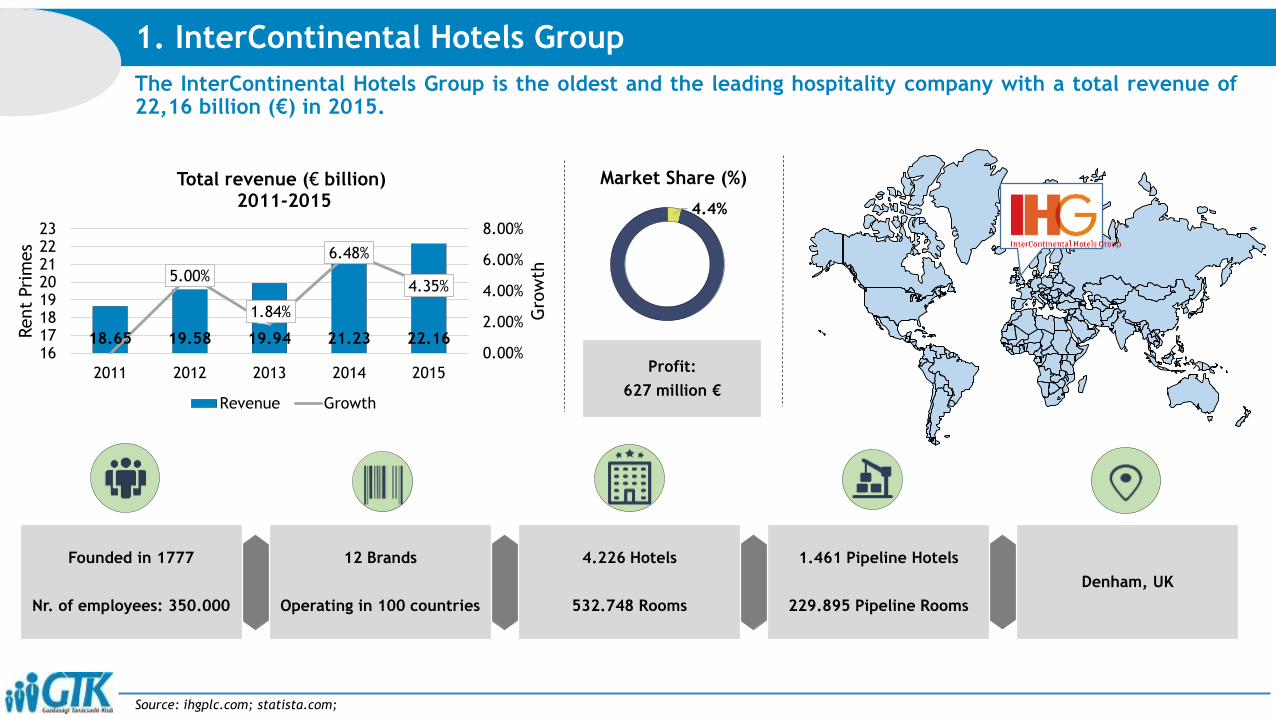
1. InterContinental Hotels Group
Source: ihgplc.com; statista.com;
The InterContinental Hotels Group is the oldest and the leading hospitality company with a total revenue of22,16 billion (€) in 2015.
18.65 19.58 19.94 21.23 22.16
5.00%
1.84%
6.48%
4.35%
0.00%
2.00%
4.00%
6.00%
8.00%
1617181920212223
2011 2012 2013 2014 2015
Gro
wth
Rent
Pri
mes
Total revenue (€ billion)2011-2015
Revenue Growth
4.226 Hotels
532.748 Rooms
1.461 Pipeline Hotels
229.895 Pipeline Rooms
Denham, UK
12 Brands
Operating in 100 countries
Founded in 1777
Nr. of employees: 350.000
4.4%
Market Share (%)
Profit:
627 million €

Between 2011 and 2015, the food and beverage sector’s revenue increased with more than 118 billion €.
This sector represents 31,27 % of the total tourism sector’s revenue.
Food and beverage sector’s revenue
Source: opentextbc.com, napiarfolyam.hu, slideshare.net, Toronto.ca;
31.27
68.73
Food and Beverage sector revenue from the global tourism revenue in 2015(%)
Food and beverage Other sectors
526.71554.9
591.42 600.88644.15
0
100
200
300
400
500
600
700
2011 2012 2013 2014 2015
Annual revenue (€ billion)
The food and beverage sector revenue increased constantly between 2011-2015. In 2015, the
food and beverage sector revenue reached 644 billion € which is the highest value between in
this period. The food and beverage sector accounted 31,27% from the global tourism revenue.
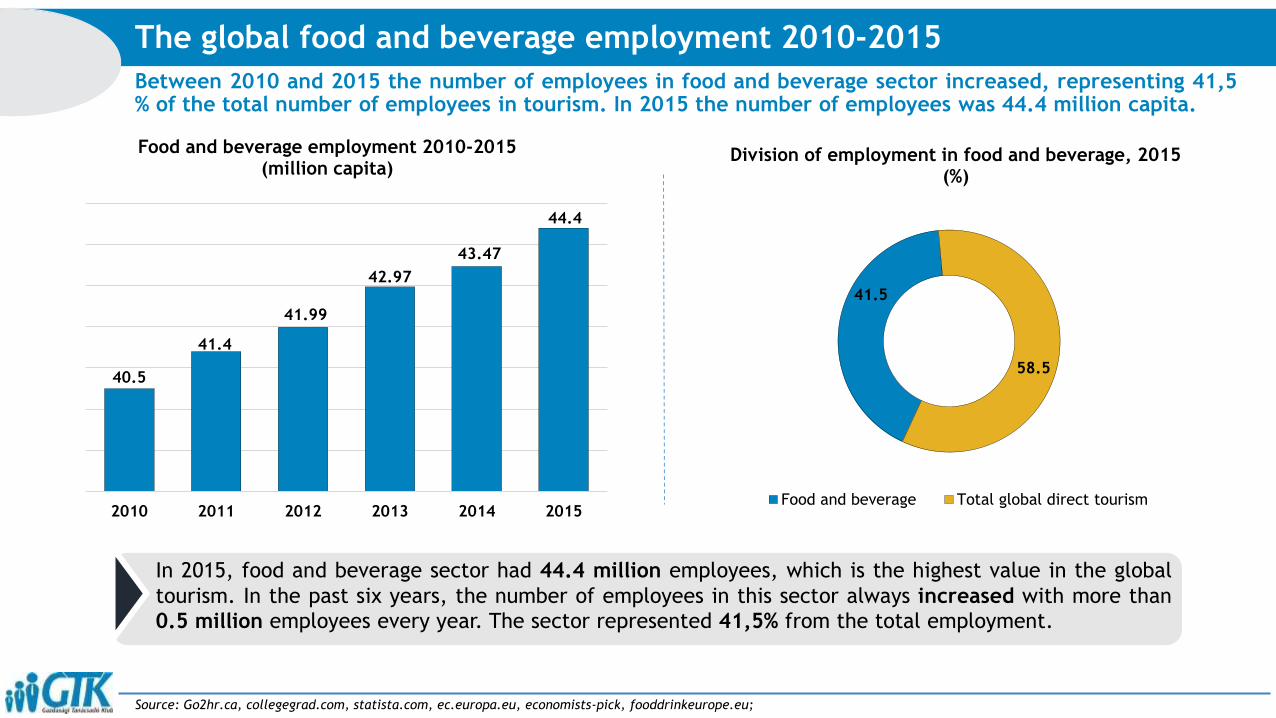
Between 2010 and 2015 the number of employees in food and beverage sector increased, representing 41,5% of the total number of employees in tourism. In 2015 the number of employees was 44.4 million capita.
The global food and beverage employment 2010-2015
Source: Go2hr.ca, collegegrad.com, statista.com, ec.europa.eu, economists-pick, fooddrinkeurope.eu;
40.5
41.4
41.99
42.97
43.47
44.4
2010 2011 2012 2013 2014 2015
Food and beverage employment 2010-2015(million capita)
41.5
58.5
Division of employment in food and beverage, 2015 (%)
Food and beverage Total global direct tourism
In 2015, food and beverage sector had 44.4 million employees, which is the highest value in the global
tourism. In the past six years, the number of employees in this sector always increased with more than
0.5 million employees every year. The sector represented 41,5% from the total employment.
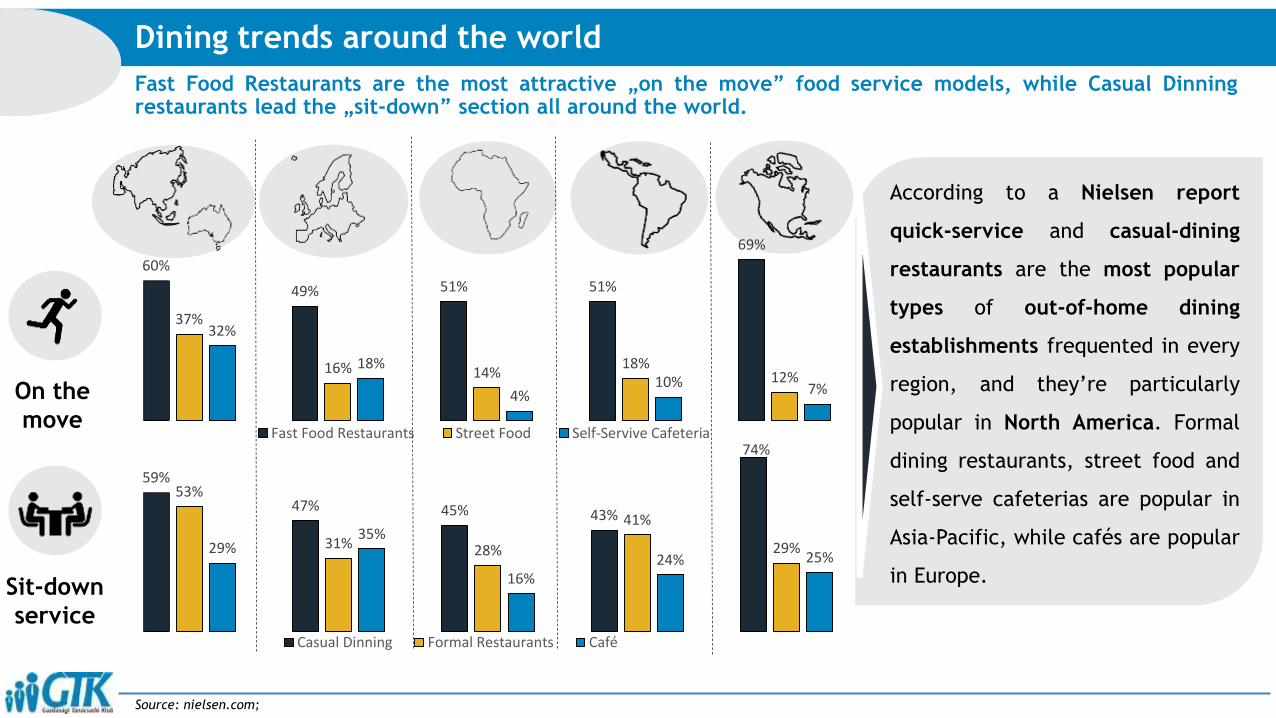
Fast Food Restaurants are the most attractive „on the move” food service models, while Casual Dinningrestaurants lead the „sit-down” section all around the world.
Dining trends around the world
Source: nielsen.com;
60%
49% 51% 51%
69%
37%
16% 14%18%
12%
32%
18%
4%10% 7%
Fast Food Restaurants Street Food Self-Servive Cafeteria
59%
47% 45% 43%
74%
53%
31% 28%
41%
29%29%35%
16%24% 25%
Casual Dinning Formal Restaurants Café
According to a Nielsen report
quick-service and casual-dining
restaurants are the most popular
types of out-of-home dining
establishments frequented in every
region, and they’re particularly
popular in North America. Formal
dining restaurants, street food and
self-serve cafeterias are popular in
Asia-Pacific, while cafés are popular
in Europe.
On the
move
Sit-down
service
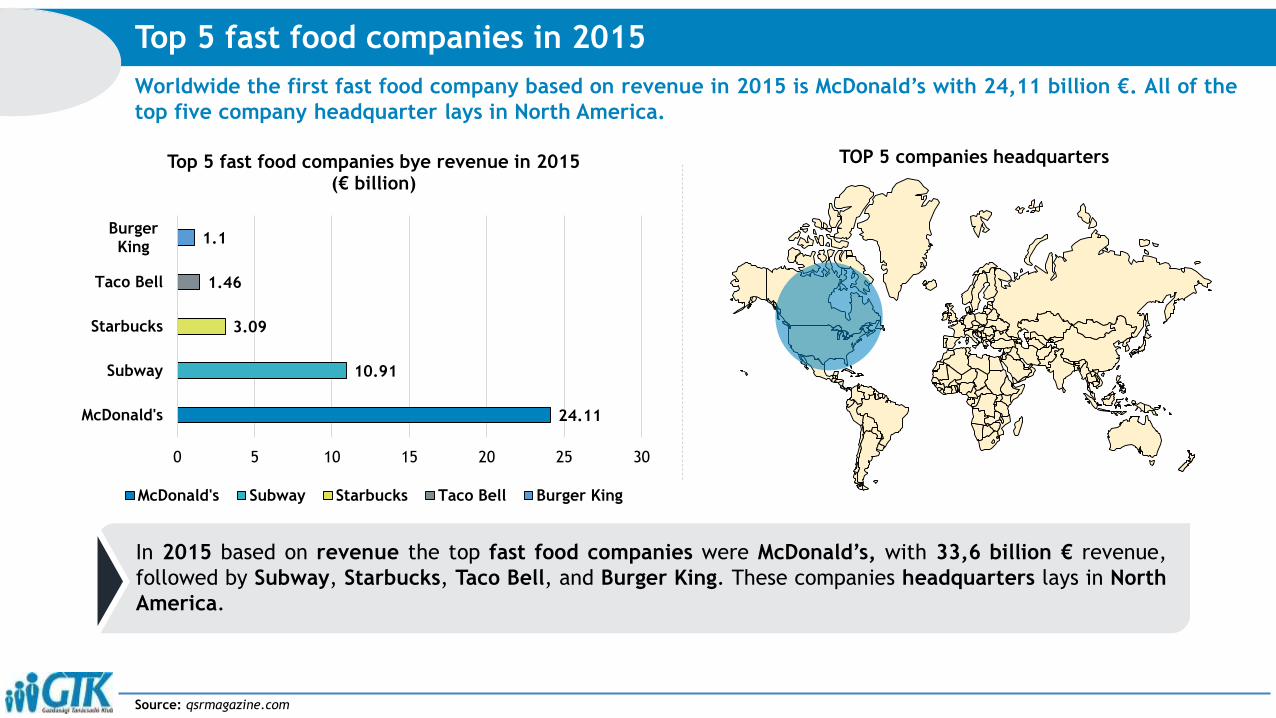
Worldwide the first fast food company based on revenue in 2015 is McDonald’s with 24,11 billion €. All of the
top five company headquarter lays in North America.
Top 5 fast food companies in 2015
Source: qsrmagazine.com
TOP 5 companies headquarters
In 2015 based on revenue the top fast food companies were McDonald’s, with 33,6 billion € revenue,
followed by Subway, Starbucks, Taco Bell, and Burger King. These companies headquarters lays in North
America.
24.11
10.91
3.09
1.46
1.1
0 5 10 15 20 25 30
McDonald's
Subway
Starbucks
Taco Bell
BurgerKing
Top 5 fast food companies bye revenue in 2015 (€ billion)
McDonald's Subway Starbucks Taco Bell Burger King
3.74
96.26
Market Share (%)
McDonald's Others
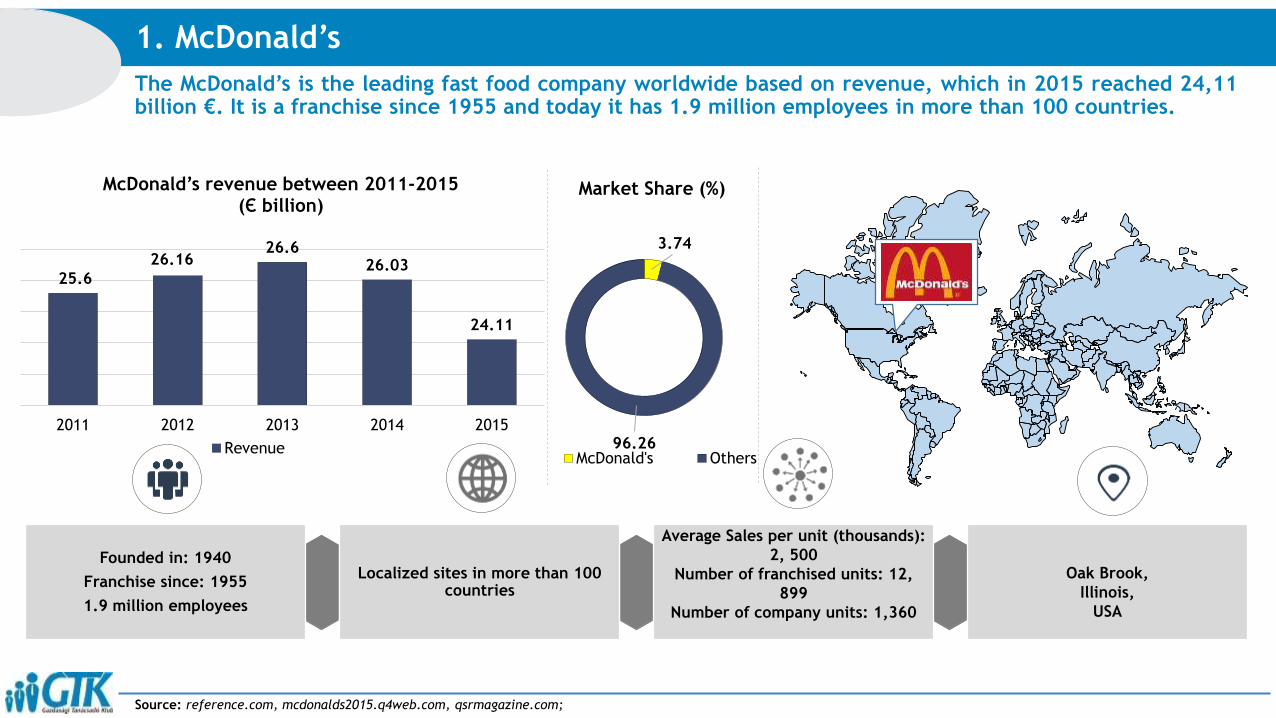
The McDonald’s is the leading fast food company worldwide based on revenue, which in 2015 reached 24,11billion €. It is a franchise since 1955 and today it has 1.9 million employees in more than 100 countries.
1. McDonald’s
Source: reference.com, mcdonalds2015.q4web.com, qsrmagazine.com;
Average Sales per unit (thousands):
2, 500
Number of franchised units: 12,
899
Number of company units: 1,360
Oak Brook,
Illinois,
USA
Founded in: 1940
Franchise since: 1955
1.9 million employees
Localized sites in more than 100 countries
k Brook, Illinois25.6
26.1626.6
26.03
24.11
2011 2012 2013 2014 2015
McDonald’s revenue between 2011-2015 (Є billion)
Revenue
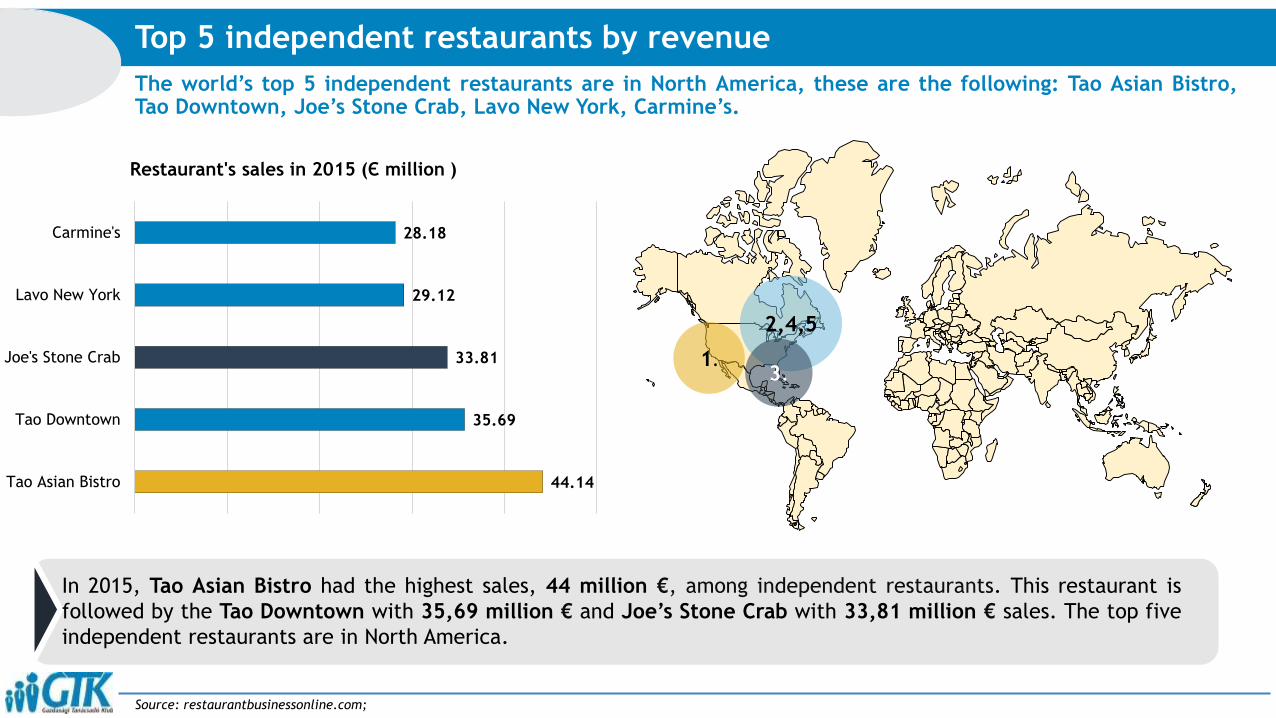
The world’s top 5 independent restaurants are in North America, these are the following: Tao Asian Bistro,Tao Downtown, Joe’s Stone Crab, Lavo New York, Carmine’s.
Top 5 independent restaurants by revenue
Source: restaurantbusinessonline.com;
1.
2,4,5
3.
44.14
35.69
33.81
29.12
28.18
Tao Asian Bistro
Tao Downtown
Joe's Stone Crab
Lavo New York
Carmine's
Restaurant's sales in 2015 (Є million )
In 2015, Tao Asian Bistro had the highest sales, 44 million €, among independent restaurants. This restaurant is
followed by the Tao Downtown with 35,69 million € and Joe’s Stone Crab with 33,81 million € sales. The top five
independent restaurants are in North America.
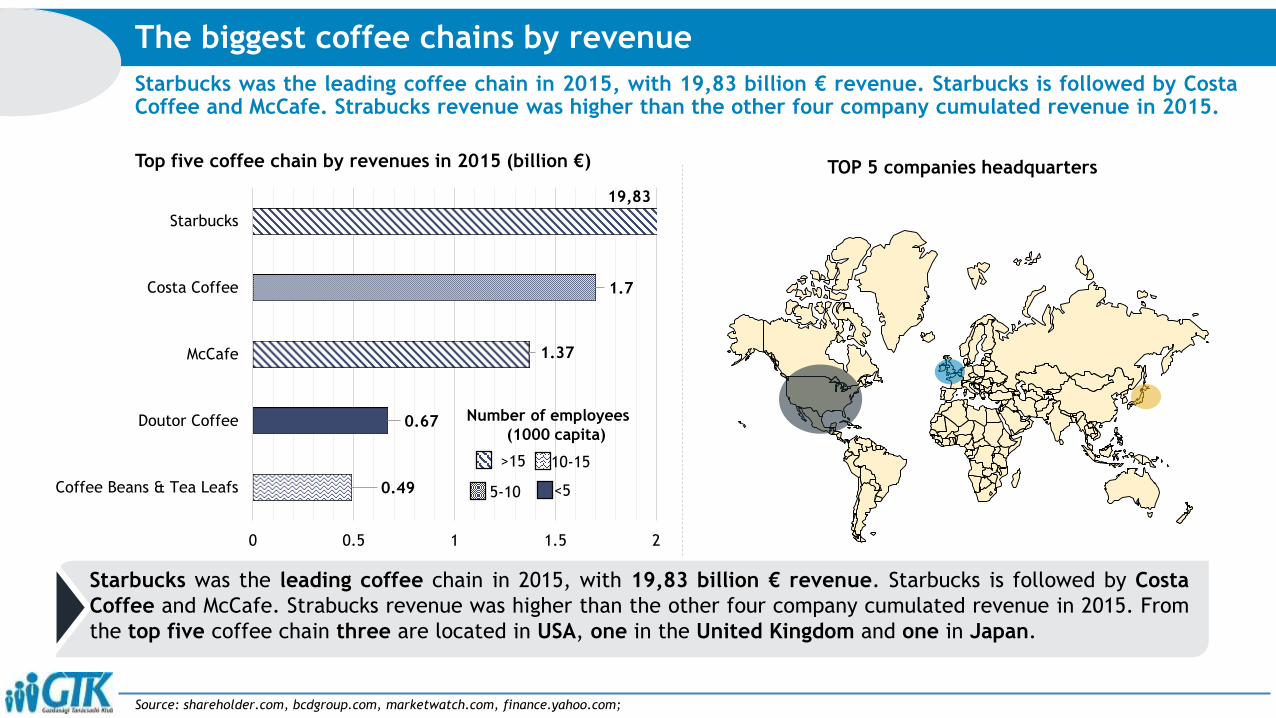
Starbucks was the leading coffee chain in 2015, with 19,83 billion € revenue. Starbucks is followed by CostaCoffee and McCafe. Strabucks revenue was higher than the other four company cumulated revenue in 2015.
The biggest coffee chains by revenue
Source: shareholder.com, bcdgroup.com, marketwatch.com, finance.yahoo.com;
TOP 5 companies headquarters
0.49
0.67
1.37
1.7
0 0.5 1 1.5 2
Coffee Beans & Tea Leafs
Doutor Coffee
McCafe
Costa Coffee
Starbucks
Top five coffee chain by revenues in 2015 (billion €)
>15
5-10
10-15
<5
Number of employees
(1000 capita)
19,83
Starbucks was the leading coffee chain in 2015, with 19,83 billion € revenue. Starbucks is followed by Costa
Coffee and McCafe. Strabucks revenue was higher than the other four company cumulated revenue in 2015. From
the top five coffee chain three are located in USA, one in the United Kingdom and one in Japan.
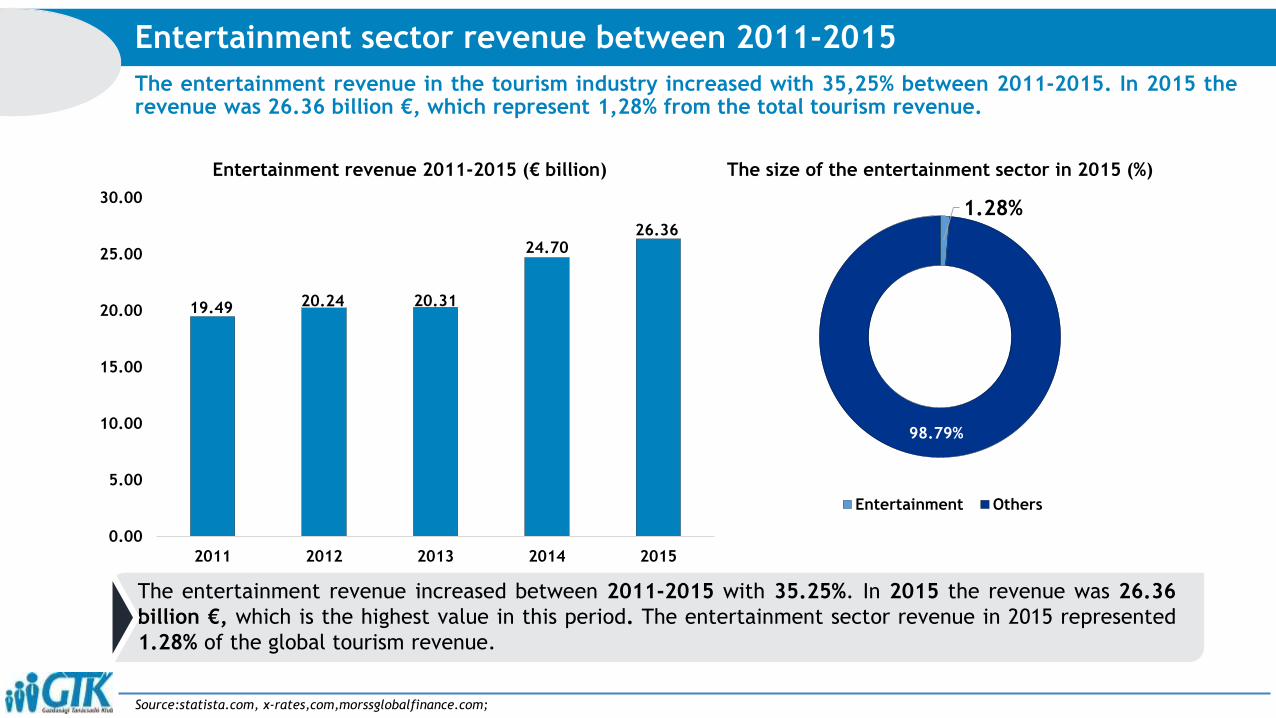
The entertainment revenue in the tourism industry increased with 35,25% between 2011-2015. In 2015 therevenue was 26.36 billion €, which represent 1,28% from the total tourism revenue.
Entertainment sector revenue between 2011-2015
Source:statista.com, x-rates,com,morssglobalfinance.com;
19.49 20.24 20.31
24.7026.36
0.00
5.00
10.00
15.00
20.00
25.00
30.00
2011 2012 2013 2014 2015
Entertainment revenue 2011-2015 (€ billion)
The entertainment revenue increased between 2011-2015 with 35.25%. In 2015 the revenue was 26.36
billion €, which is the highest value in this period. The entertainment sector revenue in 2015 represented
1.28% of the global tourism revenue.
1.28%
98.79%
The size of the entertainment sector in 2015 (%)
Entertainment Others
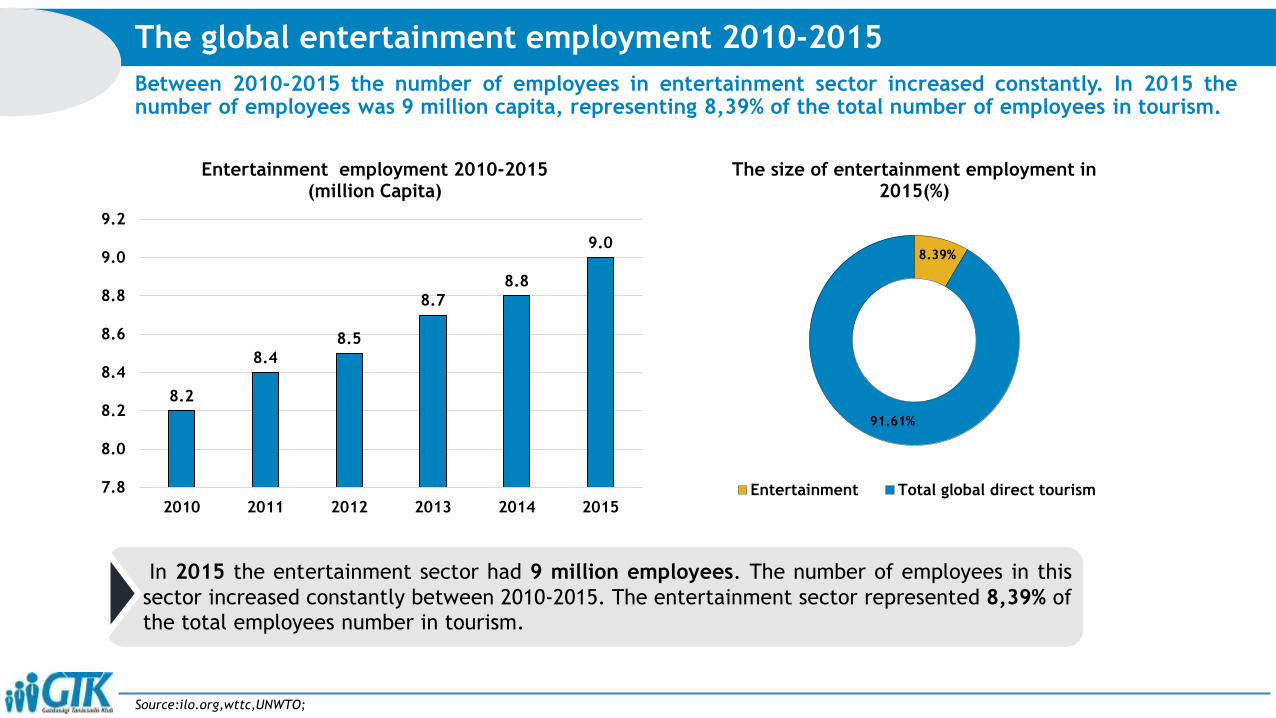
Between 2010-2015 the number of employees in entertainment sector increased constantly. In 2015 thenumber of employees was 9 million capita, representing 8,39% of the total number of employees in tourism.
The global entertainment employment 2010-2015
Source:ilo.org,wttc,UNWTO;
8.2
8.4
8.5
8.7
8.8
9.0
7.8
8.0
8.2
8.4
8.6
8.8
9.0
9.2
2010 2011 2012 2013 2014 2015
Entertainment employment 2010-2015(million Capita)
8.39%
91.61%
The size of entertainment employment in 2015(%)
Entertainment Total global direct tourism
In 2015 the entertainment sector had 9 million employees. The number of employees in this
sector increased constantly between 2010-2015. The entertainment sector represented 8,39% of
the total employees number in tourism.
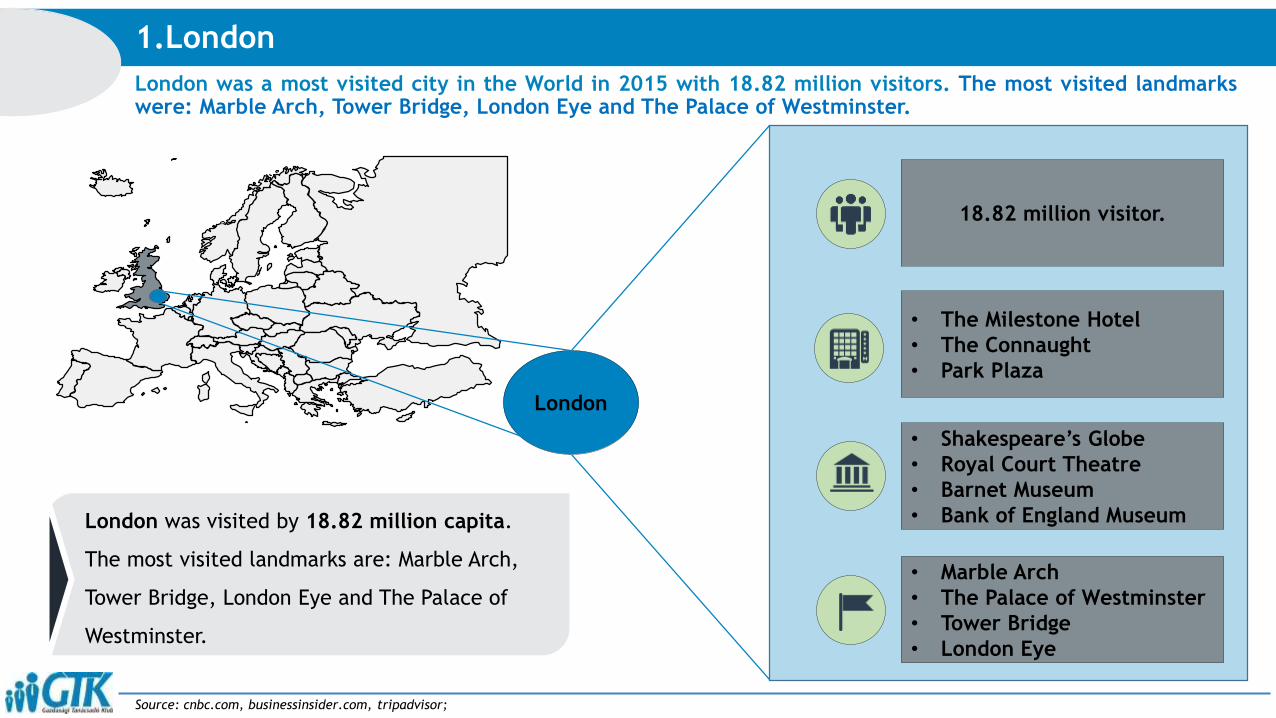
London was a most visited city in the World in 2015 with 18.82 million visitors. The most visited landmarkswere: Marble Arch, Tower Bridge, London Eye and The Palace of Westminster.
1.London
Source: cnbc.com, businessinsider.com, tripadvisor;
London
18.82 million visitor.
• Shakespeare’s Globe
• Royal Court Theatre
• Barnet Museum
• Bank of England Museum
• The Milestone Hotel
• The Connaught
• Park Plaza
• Marble Arch
• The Palace of Westminster
• Tower Bridge
• London Eye
London was visited by 18.82 million capita.
The most visited landmarks are: Marble Arch,
Tower Bridge, London Eye and The Palace of
Westminster.
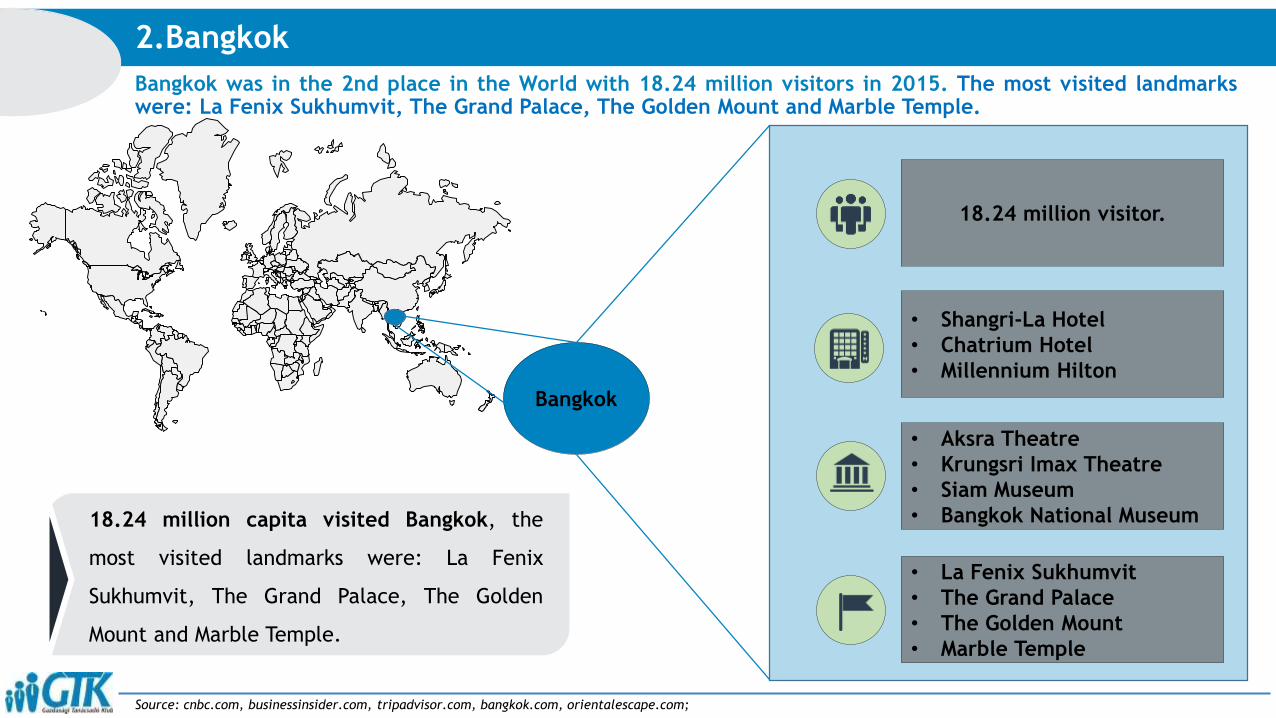
Bangkok was in the 2nd place in the World with 18.24 million visitors in 2015. The most visited landmarkswere: La Fenix Sukhumvit, The Grand Palace, The Golden Mount and Marble Temple.
2.Bangkok
Source: cnbc.com, businessinsider.com, tripadvisor.com, bangkok.com, orientalescape.com;
18.24 million visitor.
• Aksra Theatre
• Krungsri Imax Theatre
• Siam Museum
• Bangkok National Museum
• Shangri-La Hotel
• Chatrium Hotel
• Millennium Hilton
• La Fenix Sukhumvit
• The Grand Palace
• The Golden Mount
• Marble Temple
Bangkok
18.24 million capita visited Bangkok, the
most visited landmarks were: La Fenix
Sukhumvit, The Grand Palace, The Golden
Mount and Marble Temple.

The third in this world’s rank was Paris with 16.06 million visitors in 2015. The most visited landmarks andmuseums are: The Louvre, Eiffel Tour, Notre Dame Cathedral, Arc de Triomphe and Sainte-Chapelle.
3.Paris
Source: cnbc.com, businessinsider.com, tripadvisor.com, timeout.com;
16.06 million visitor.
• Paris Theatre
• The Louvre
• The Centre Pompidou
• Musée d’Orsay
• Regina Hotel
• Monge Hotel
• Le Six Hotel
• Eiffel Tour
• Notre Dame Cathedral
• Arc de Triomphe
• Sainte-Chapelle
Paris
In Paris were 16,06 million visitors in 2015, the
most visited landmarks and museums were: The
Louvre, Eiffel Tour, Notre Dame Cathedral, Arc de
Triomphe and Sainte-Chapelle.
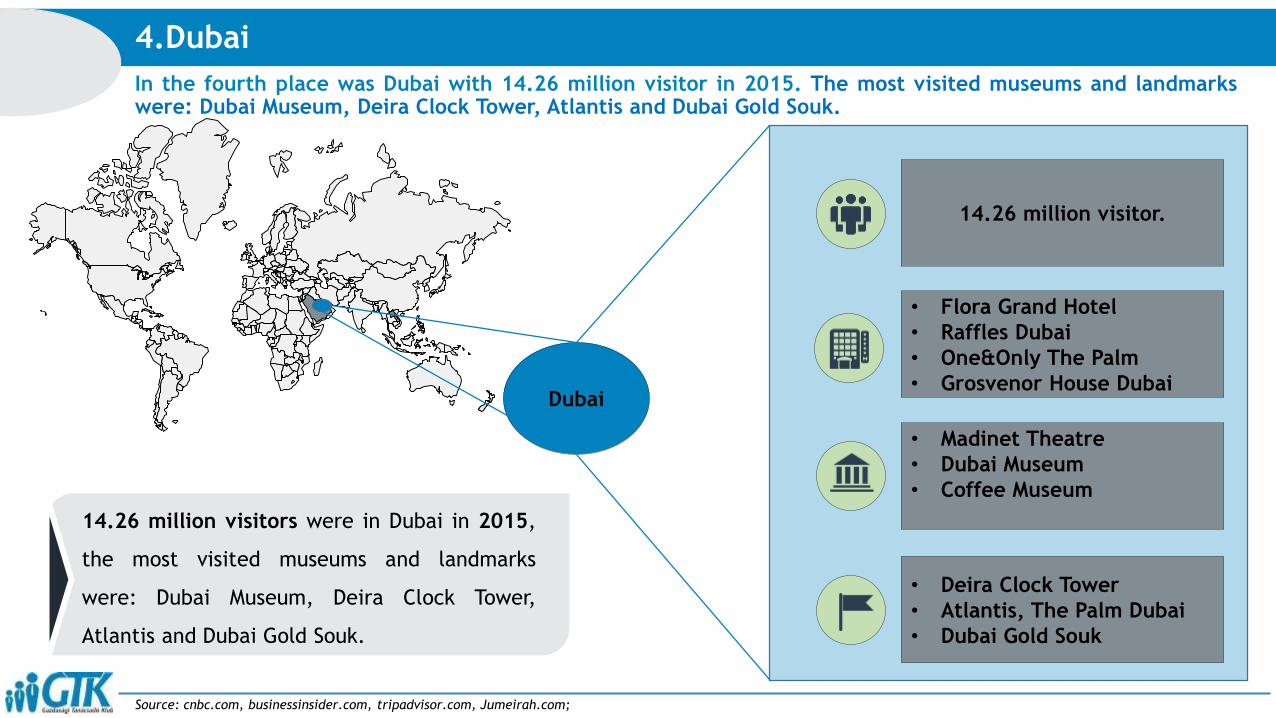
In the fourth place was Dubai with 14.26 million visitor in 2015. The most visited museums and landmarkswere: Dubai Museum, Deira Clock Tower, Atlantis and Dubai Gold Souk.
4.Dubai
Source: cnbc.com, businessinsider.com, tripadvisor.com, Jumeirah.com;
14.26 million visitor.
• Madinet Theatre
• Dubai Museum
• Coffee Museum
• Flora Grand Hotel
• Raffles Dubai
• One&Only The Palm
• Grosvenor House Dubai
• Deira Clock Tower
• Atlantis, The Palm Dubai
• Dubai Gold Souk
Dubai
14.26 million visitors were in Dubai in 2015,
the most visited museums and landmarks
were: Dubai Museum, Deira Clock Tower,
Atlantis and Dubai Gold Souk.
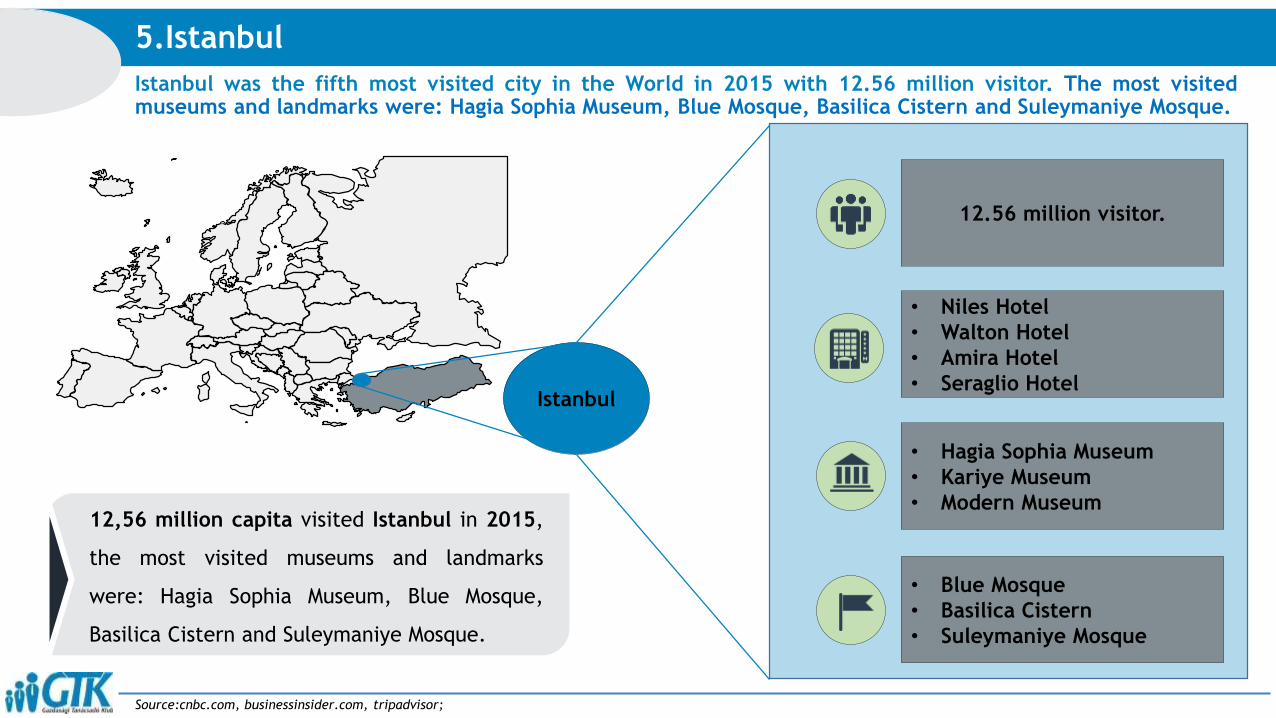
Istanbul was the fifth most visited city in the World in 2015 with 12.56 million visitor. The most visitedmuseums and landmarks were: Hagia Sophia Museum, Blue Mosque, Basilica Cistern and Suleymaniye Mosque.
5.Istanbul
Source:cnbc.com, businessinsider.com, tripadvisor;
12.56 million visitor.
• Hagia Sophia Museum
• Kariye Museum
• Modern Museum
• Niles Hotel
• Walton Hotel
• Amira Hotel
• Seraglio Hotel
• Blue Mosque
• Basilica Cistern
• Suleymaniye Mosque
Istanbul
12,56 million capita visited Istanbul in 2015,
the most visited museums and landmarks
were: Hagia Sophia Museum, Blue Mosque,
Basilica Cistern and Suleymaniye Mosque.
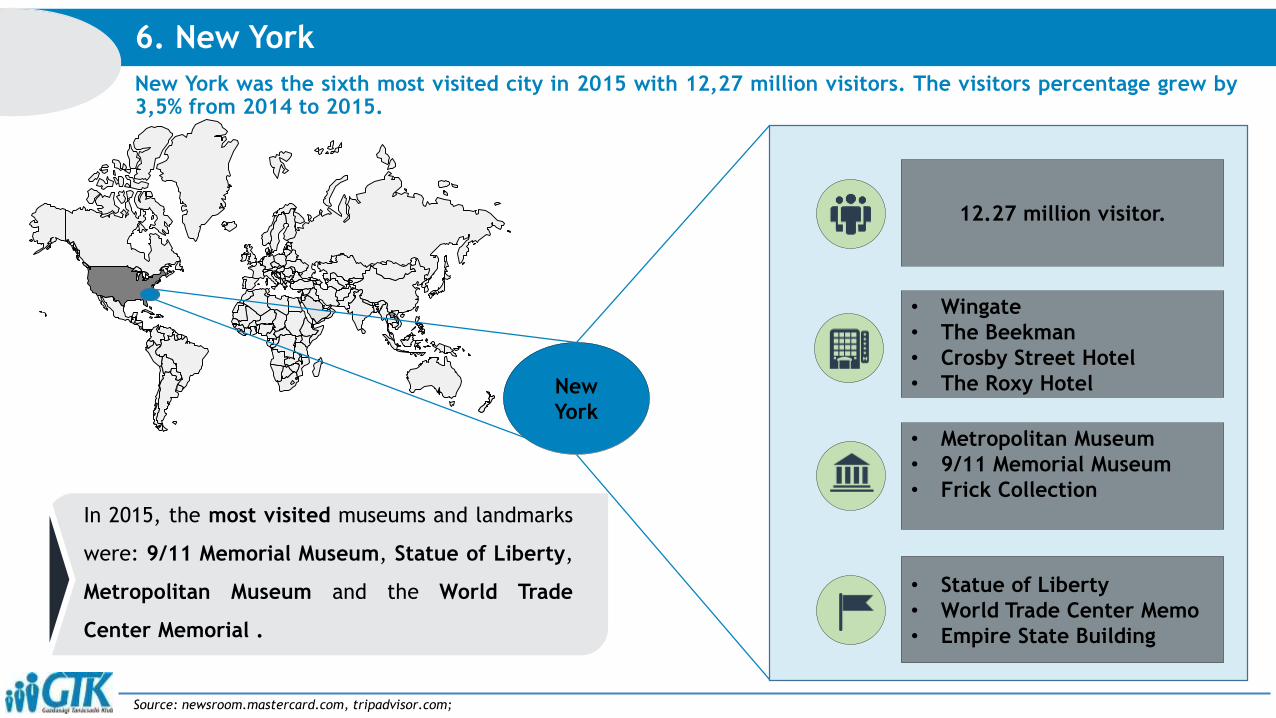
New York was the sixth most visited city in 2015 with 12,27 million visitors. The visitors percentage grew by3,5% from 2014 to 2015.
6. New York
Source: newsroom.mastercard.com, tripadvisor.com;
12.27 million visitor.
• Metropolitan Museum
• 9/11 Memorial Museum
• Frick Collection
• Wingate
• The Beekman
• Crosby Street Hotel
• The Roxy Hotel
• Statue of Liberty
• World Trade Center Memo
• Empire State Building
New
York
In 2015, the most visited museums and landmarks
were: 9/11 Memorial Museum, Statue of Liberty,
Metropolitan Museum and the World Trade
Center Memorial .
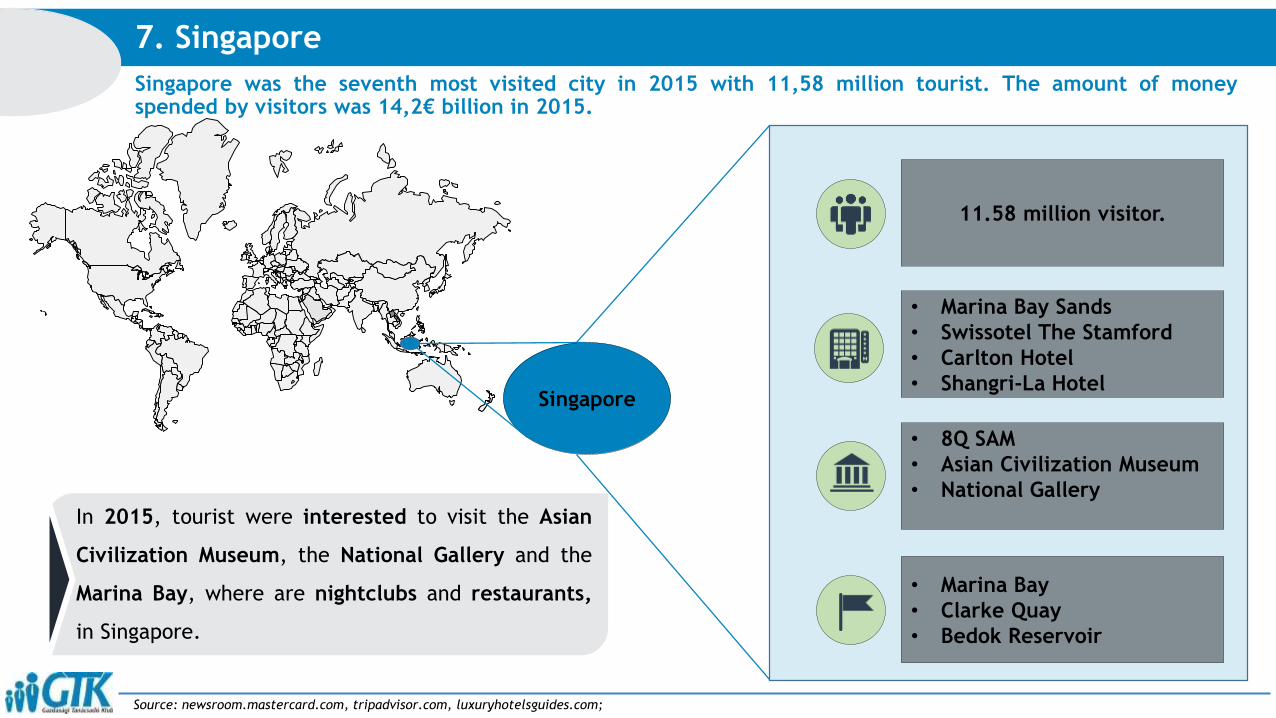
Singapore was the seventh most visited city in 2015 with 11,58 million tourist. The amount of moneyspended by visitors was 14,2€ billion in 2015.
7. Singapore
Source: newsroom.mastercard.com, tripadvisor.com, luxuryhotelsguides.com;
11.58 million visitor.
• 8Q SAM
• Asian Civilization Museum
• National Gallery
• Marina Bay Sands
• Swissotel The Stamford
• Carlton Hotel
• Shangri-La Hotel
• Marina Bay
• Clarke Quay
• Bedok Reservoir
Singapore
In 2015, tourist were interested to visit the Asian
Civilization Museum, the National Gallery and the
Marina Bay, where are nightclubs and restaurants,
in Singapore.

Kuala Lumpur was the eighth most visited city in 2015, with 11,12 million tourists. The percentage of visitorsis growing annually from 2012.
.
8. Kuala Lumpur
Source: newsroom.mastercard.com, tripadvisor.com, luxuryhotelsguides.com;
11.12 million visitor.
• Islamic Arts Museum
• Kuala Lumpur City Gallery
• National Museum
• Renaissance Hotel
• Mandarin Oriental
• Shangri-La Hotel
• Sunway Putra Hotel
• Petronas Twin Towers
• Thean Hou Temple
Kuala
Lumpur
The top 3 hotels in Kuala Lumpur are the
Renaissance Hotel, Mandarin Oriental and the
Shangri-La Hotel. Tourists preferd to visit the
Petronas Twin Towers and the Thean Hou Temple.

In 2015, Seoul was the ninth most visited city with 10,35 million tourists. The number of visitors increased by5,2% from 2014.
.
9. Seoul
Source: newsroom.mastercard.com, tripadvisor.com, luxuryhotelsguides.com;
10.35 million visitor.
• Trick Eye Museum
• Seoul Grevin Museum
• Gyeongbokgung Palace
• Lotte Hotel
• InterContinental
• Millennium Seoul Hilton
• Four Seasons Hotel
• Bukhansan National Park
• Hangang Park
• Seoul Tower
Seoul
Seoul’s most attractive places were the
Bukhansan National Park, and the Trick Eye
Museum. Tourist were also interested in seeing
the Seoul Tower and the Seoul Grevin Museum.
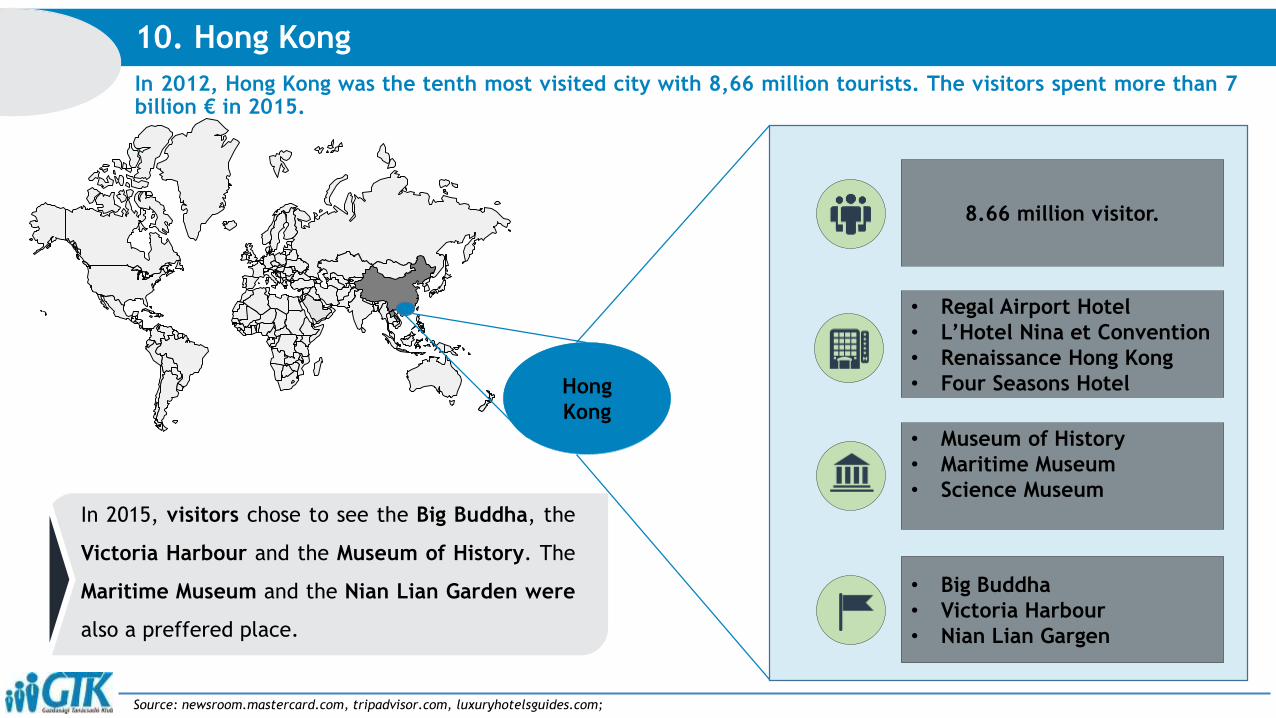
In 2012, Hong Kong was the tenth most visited city with 8,66 million tourists. The visitors spent more than 7billion € in 2015.
.
10. Hong Kong
Source: newsroom.mastercard.com, tripadvisor.com, luxuryhotelsguides.com;
8.66 million visitor.
• Museum of History
• Maritime Museum
• Science Museum
• Regal Airport Hotel
• L’Hotel Nina et Convention
• Renaissance Hong Kong
• Four Seasons Hotel
• Big Buddha
• Victoria Harbour
• Nian Lian Gargen
Hong
Kong
In 2015, visitors chose to see the Big Buddha, the
Victoria Harbour and the Museum of History. The
Maritime Museum and the Nian Lian Garden were
also a preffered place.
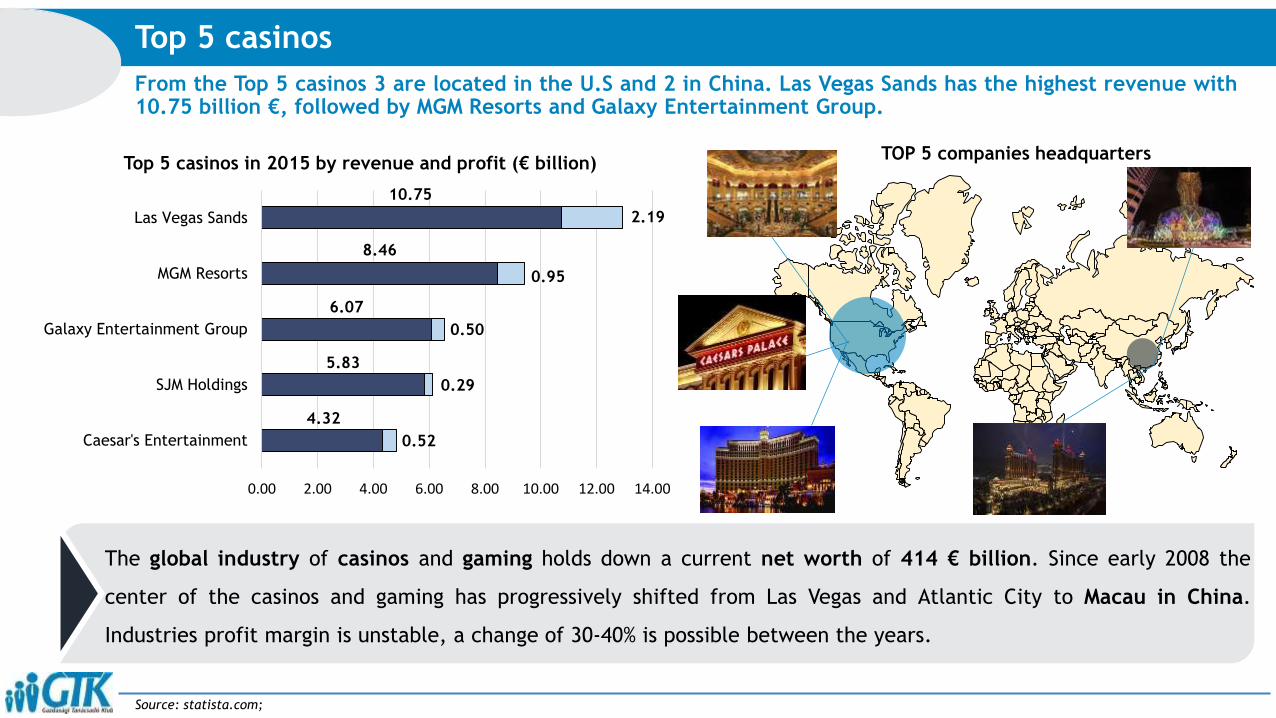
From the Top 5 casinos 3 are located in the U.S and 2 in China. Las Vegas Sands has the highest revenue with10.75 billion €, followed by MGM Resorts and Galaxy Entertainment Group.
Top 5 casinos
Source: statista.com;
TOP 5 companies headquarters
4.32
5.83
6.07
8.46
10.75
0.52
0.29
0.50
0.95
2.19
0.00 2.00 4.00 6.00 8.00 10.00 12.00 14.00
Caesar's Entertainment
SJM Holdings
Galaxy Entertainment Group
MGM Resorts
Las Vegas Sands
Top 5 casinos in 2015 by revenue and profit (€ billion)
The global industry of casinos and gaming holds down a current net worth of 414 € billion. Since early 2008 the
center of the casinos and gaming has progressively shifted from Las Vegas and Atlantic City to Macau in China.
Industries profit margin is unstable, a change of 30-40% is possible between the years.
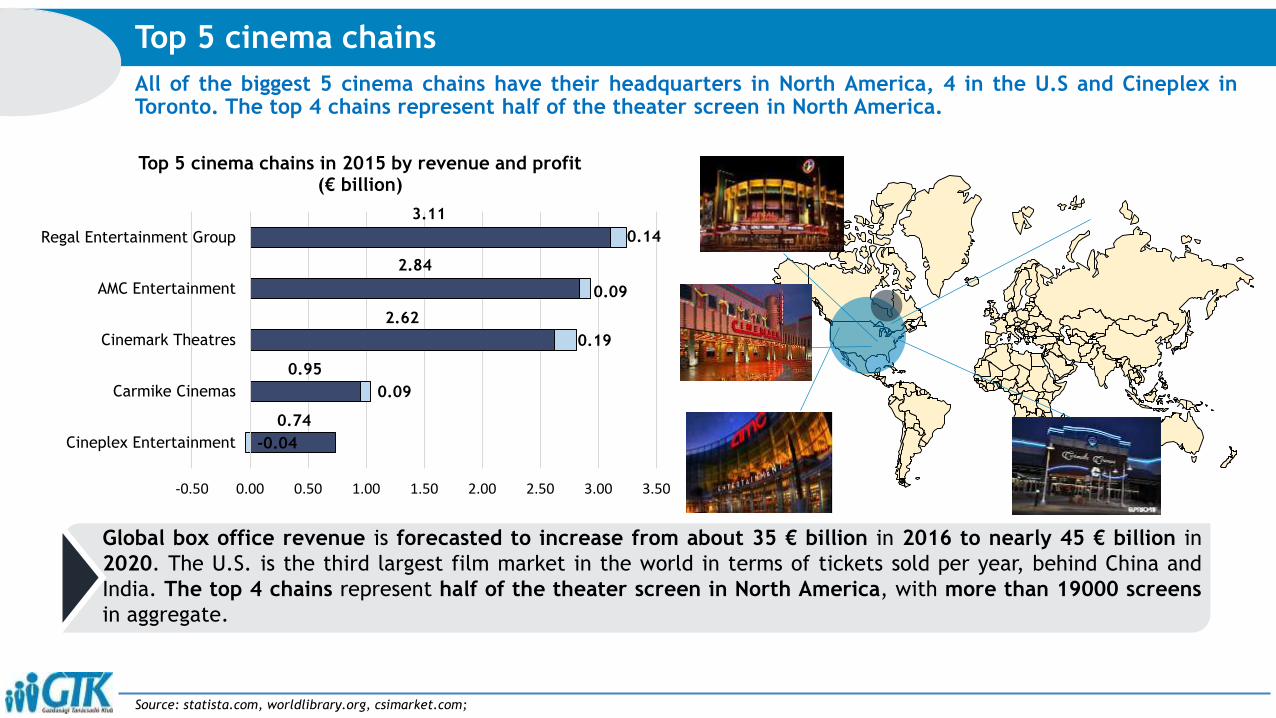
All of the biggest 5 cinema chains have their headquarters in North America, 4 in the U.S and Cineplex inToronto. The top 4 chains represent half of the theater screen in North America.
Top 5 cinema chains
Source: statista.com, worldlibrary.org, csimarket.com;
Global box office revenue is forecasted to increase from about 35 € billion in 2016 to nearly 45 € billion in
2020. The U.S. is the third largest film market in the world in terms of tickets sold per year, behind China and
India. The top 4 chains represent half of the theater screen in North America, with more than 19000 screens
in aggregate.
0.74
0.95
2.62
2.84
3.11
-0.04
0.09
0.19
0.09
0.14
-0.50 0.00 0.50 1.00 1.50 2.00 2.50 3.00 3.50
Cineplex Entertainment
Carmike Cinemas
Cinemark Theatres
AMC Entertainment
Regal Entertainment Group
Top 5 cinema chains in 2015 by revenue and profit(€ billion)

First 4 festivals on the list are located in the USA., while Bryonn Bay Festival is located in Australia. Coachellatops the list by a long way, grossing 77.6 million € from198,000 participants.
Top 5 festivals
Source: musictimes.com, forbes.com;
9.01
9.03
20.11
22.34
77.46
0.0010.0020.0030.0040.0050.0060.0070.0080.0090.00
Highest grossing music festivals(€ million)
105.00
105.00
70.00
70.00
198.00
0.00 50.00 100.00 150.00 200.00 250.00
Number of attendance( 1000 capita)
Coachella
Outside Lands
Stagecoach
Electric Daisy
Carnival
Byron Bay
Festival
The drop off from Coachella to the second highest grossing festival is huge. Coachella makes about three times more
than fellow California festival Outside Lands, who rakes in 22,34 million €, from 70,000 people. Coachella is leader also
in terms of participants with 198 thousand capita.
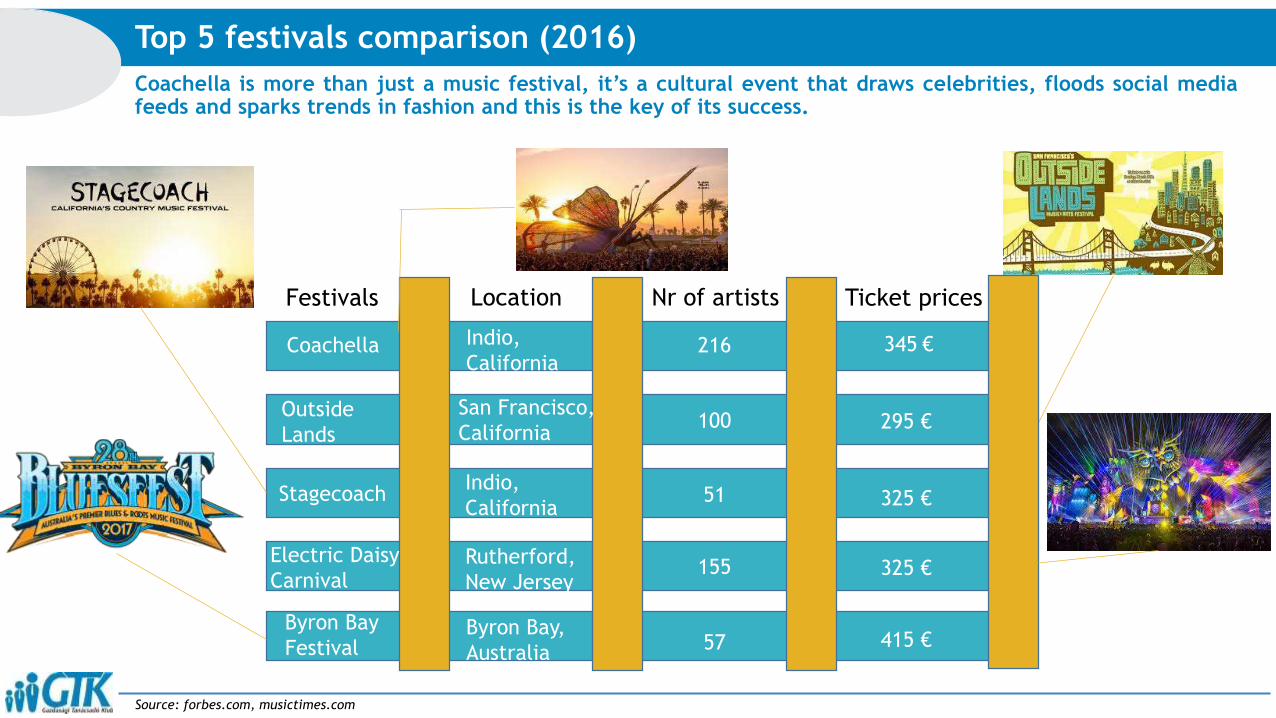
Coachella is more than just a music festival, it’s a cultural event that draws celebrities, floods social mediafeeds and sparks trends in fashion and this is the key of its success.
Top 5 festivals comparison (2016)
Source: forbes.com, musictimes.com
Festivals Location Nr of artists Ticket prices
Coachella
Outside
Lands
Stagecoach
Byron Bay
Festival
Indio,
California
San Francisco,
California
Rutherford,
New Jersey
Indio,
California
Byron Bay,
Australia
216
100
51
155
57
345 €
295 €
325 €
325 €
415 €
Electric Daisy
Carnival
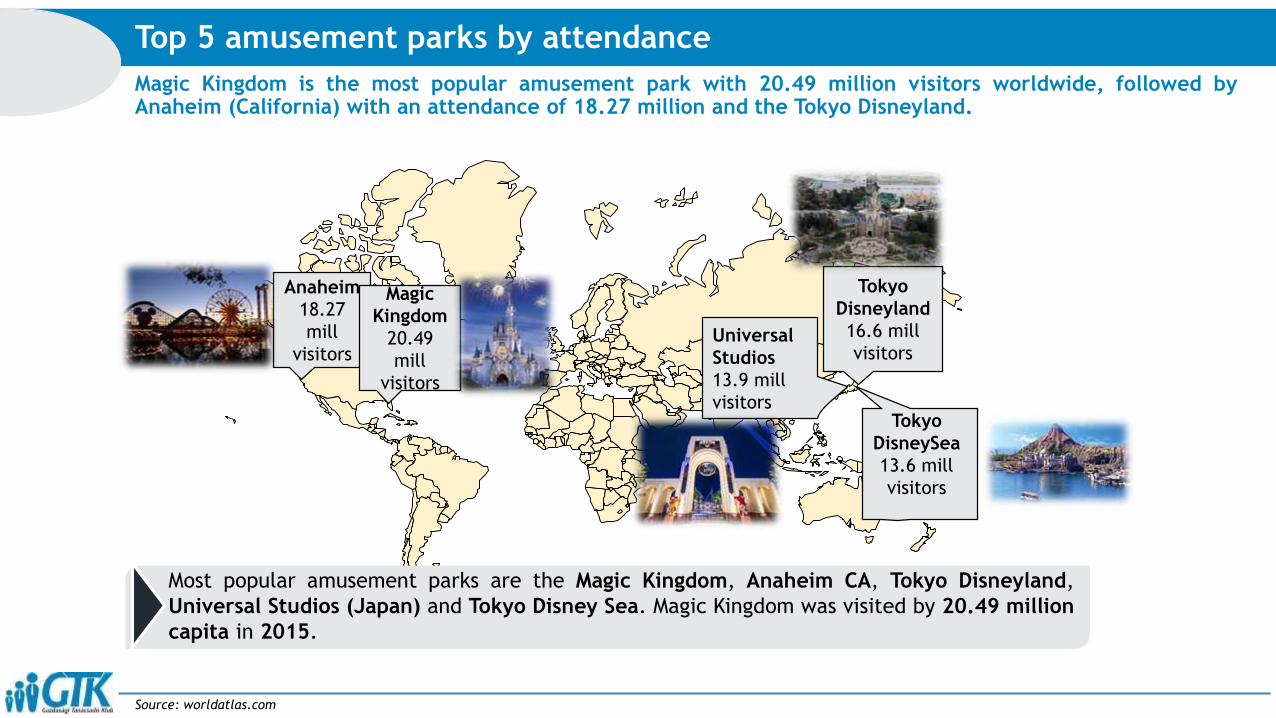
Top 5 amusement parks by attendance
Source: worldatlas.com
Tokyo
Disneyland
16.6 mill
visitors
Anaheim
18.27
mill
visitors
Tokyo
DisneySea
13.6 mill
visitors
Magic
Kingdom
20.49
mill
visitors
Universal
Studios
13.9 mill
visitors
Most popular amusement parks are the Magic Kingdom, Anaheim CA, Tokyo Disneyland,
Universal Studios (Japan) and Tokyo Disney Sea. Magic Kingdom was visited by 20.49 million
capita in 2015.
Magic Kingdom is the most popular amusement park with 20.49 million visitors worldwide, followed byAnaheim (California) with an attendance of 18.27 million and the Tokyo Disneyland.

Broadway is the most popular theatre among tourists, with 13.5 visitors in 2015, followed by the SydneyOpera House, with 8.2 million visitors and the London Royal Theatre.
Top 5 theatres by attendance
Source: operadeparis.fr, slippedisc.com, nationaltheatre.org.uk, sydneyoperahouse.com, broadwayleague.com
Broadway
13.5 mill
visitors
Sydney
Opera
8.2 million
visitors
London
Royal
Theatre
2.9 mill
visitors
Paris National
Opera
0.83 mill
visitors
Vienna National Opera
0.59 mill visitors
Broadway with 13,5 million, Sydney Opera with 5,2 million, London National Theatre
with 2,9 million, Paris National Opera with 0,83 million and Vienna National Opera with
0,59 million visitors are the world’s most visited theatres/operas.
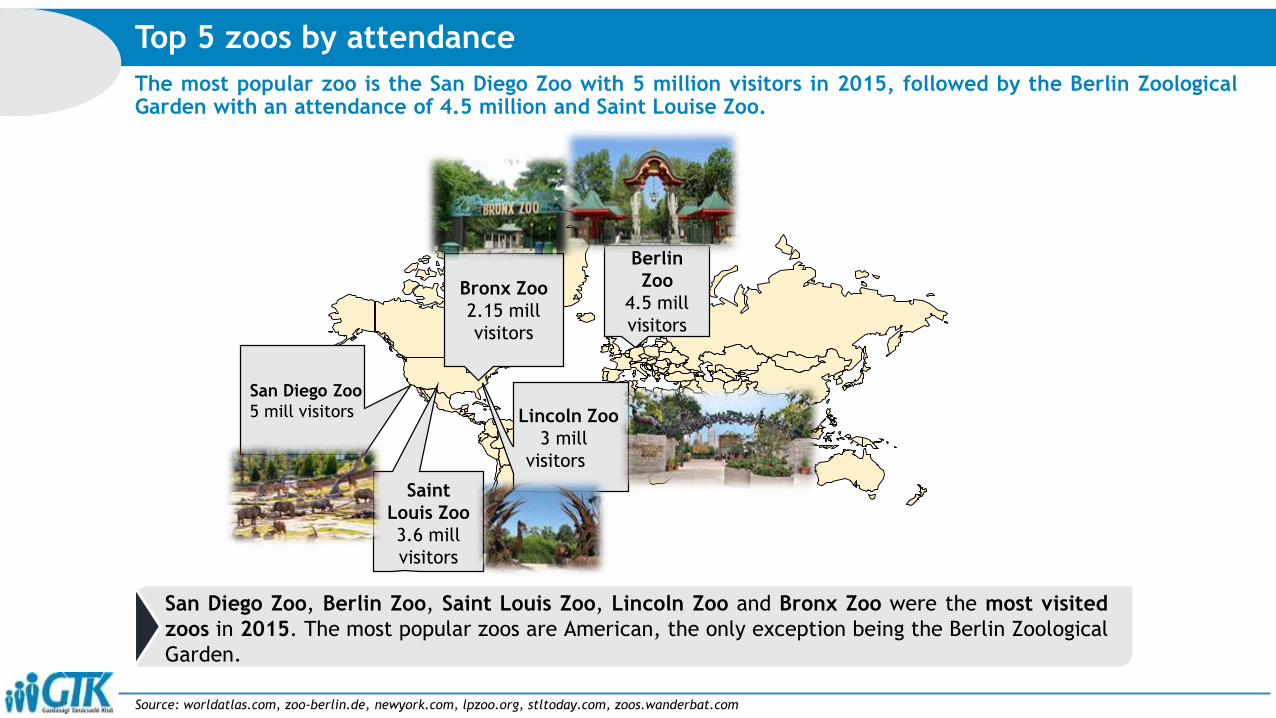
The most popular zoo is the San Diego Zoo with 5 million visitors in 2015, followed by the Berlin ZoologicalGarden with an attendance of 4.5 million and Saint Louise Zoo.
Top 5 zoos by attendance
Source: worldatlas.com, zoo-berlin.de, newyork.com, lpzoo.org, stltoday.com, zoos.wanderbat.com
Berlin
Zoo
4.5 mill
visitors
Bronx Zoo
2.15 mill
visitors
Lincoln Zoo
3 mill
visitors
San Diego Zoo
5 mill visitors
Saint
Louis Zoo
3.6 mill
visitors
San Diego Zoo, Berlin Zoo, Saint Louis Zoo, Lincoln Zoo and Bronx Zoo were the most visited
zoos in 2015. The most popular zoos are American, the only exception being the Berlin Zoological
Garden.
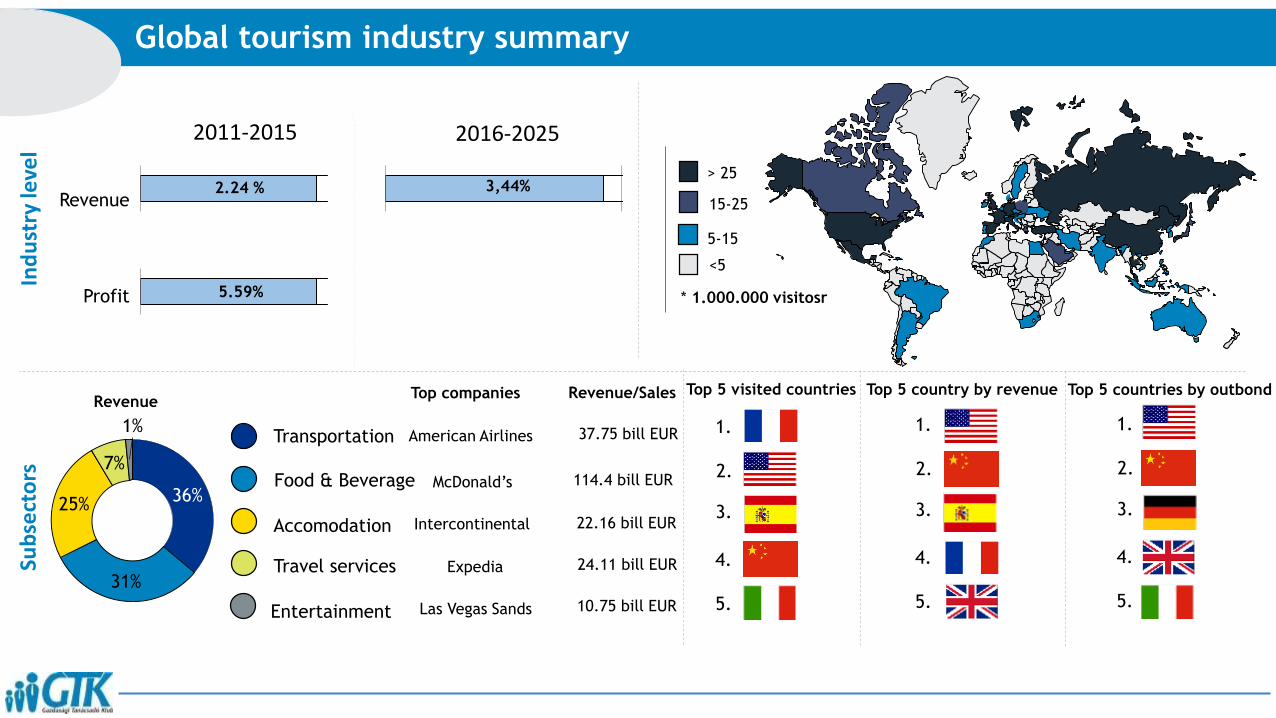
Global tourism industry summaryIn
du
stry
leve
l
2.24 %Revenue
Profit
2011-2015 2016-2025
3,44%
5.59%
> 25
15-25
5-15
<5
* 1.000.000 visitosr
Revenue
Sub
sect
ors Food & Beverage
Accomodation
Travel services
Entertainment
Top companies Revenue/Sales
American Airlines
Expedia
McDonald’s
Intercontinental
Las Vegas Sands
37.75 bill EUR
24.11 bill EUR
114.4 bill EUR
22.16 bill EUR
10.75 bill EUR
Transportation
Top 5 visited countries
1.
2.
3.
4.
5.
Top 5 country by revenue Top 5 countries by outbond
1.
2.
3.
4.
5.
1.
2.
3.
4.
5.
36%
31%
25%
7%
1%
AGENDA
[World] [Europe]
OverviewOverview
Subsectors

The economic activity that was generated by tourism was composed of mainly hotels, travel agencies, airlinesand it also includes the activities of the restaurant and leisure industries. The total contribution was 1.64billion €.
Tourism’ contribution to Europe’s GDP
Source: wttc.org,
The tourism industry’s economic activity is generated by direct (accommodation, transportation, entertainment,
attractions) indirect (government collective tourism spending, purchase from suppliers and induced (spending of
the tourism employees). By 2025 the total contribution will rise by 4%.
9.6
90.4
The size of the tourism industry in 2015, (% of Europe’s GDP)*
TourismIndustry
3.8 3.9 4.0
4.2 4.4 4.6
1.21.4 1.5
0.0
2.0
4.0
6.0
8.0
10.0
12.0
2014 2015 2025
Total contribution of tourism to GDP (%)
Direct Indirect Induced
1.800 €
billion
*direct+induced+indirect
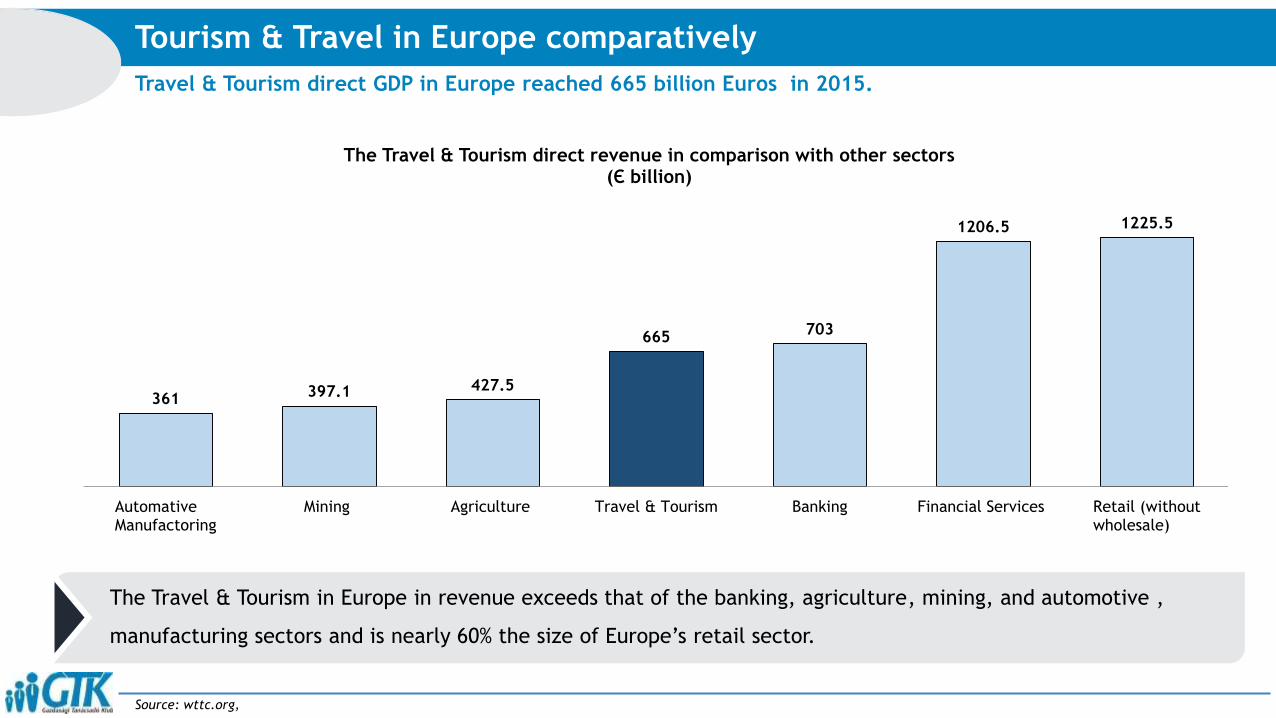
Travel & Tourism direct GDP in Europe reached 665 billion Euros in 2015.
Tourism & Travel in Europe comparatively
Source: wttc.org,
The Travel & Tourism in Europe in revenue exceeds that of the banking, agriculture, mining, and automotive ,
manufacturing sectors and is nearly 60% the size of Europe’s retail sector.
361 397.1 427.5
665703
1206.5 1225.5
AutomativeManufactoring
Mining Agriculture Travel & Tourism Banking Financial Services Retail (withoutwholesale)
The Travel & Tourism direct revenue in comparison with other sectors (Є billion)
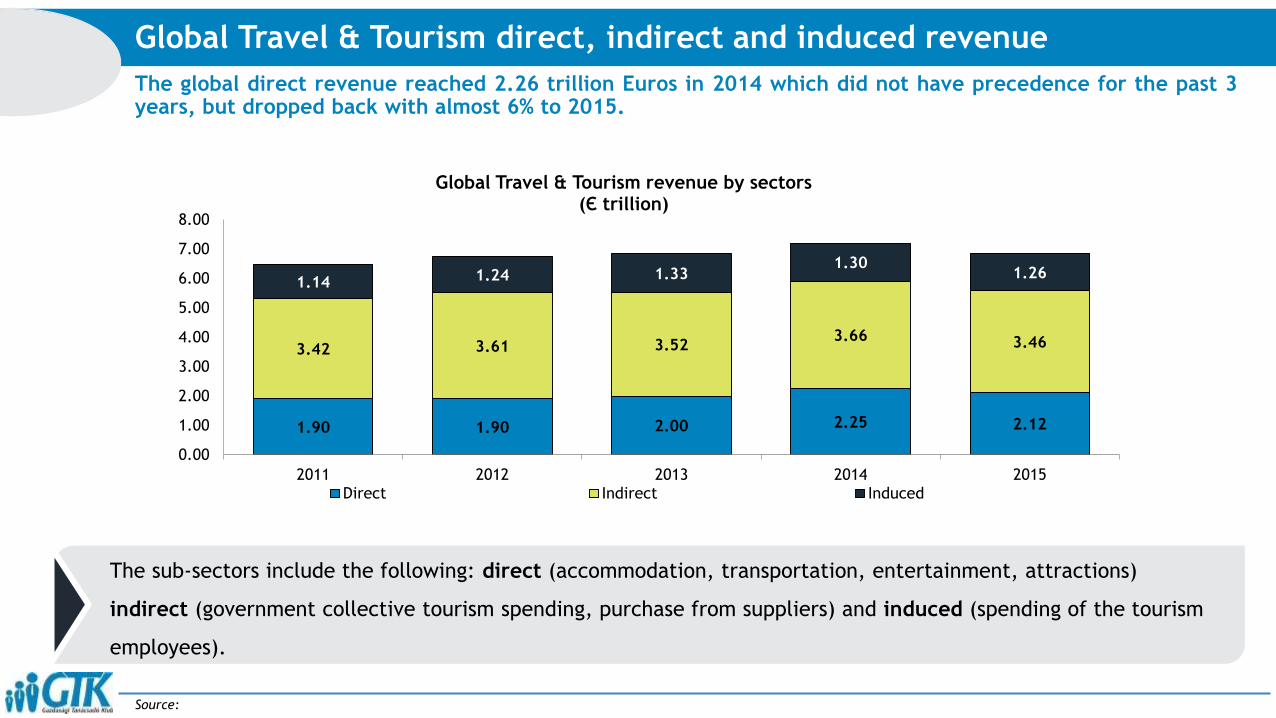
The global direct revenue reached 2.26 trillion Euros in 2014 which did not have precedence for the past 3years, but dropped back with almost 6% to 2015.
Global Travel & Tourism direct, indirect and induced revenue
Source:
1.90 1.90 2.00 2.25 2.12
3.42 3.61 3.523.66 3.46
1.14 1.24 1.331.30
1.26
0.00
1.00
2.00
3.00
4.00
5.00
6.00
7.00
8.00
2011 2012 2013 2014 2015
Global Travel & Tourism revenue by sectors(Є trillion)
Direct Indirect Induced
The sub-sectors include the following: direct (accommodation, transportation, entertainment, attractions)
indirect (government collective tourism spending, purchase from suppliers) and induced (spending of the tourism
employees).

In the past 5 years tourism realised an unstable revenue, it was increasing and decreasing too. The highestamount was in 2014, and it assumably will increase to € 739 million until 2020 with a CAGR of 0,2%.
Travel & Tourism revenue in Europe
596 596
627
706
665
-10%
-5%
0%
5%
10%
15%
500
550
600
650
700
750
800
2011 2012 2013 2014 2015
Tourism revenue between 2010-2015 (Є billion)
Revenue Growth
680694
709724
739
0%
1%
1%
2%
2%
3%
500
550
600
650
700
750
800
2016 2017 2018 2019 2020
Tourism revenue between 2016-2020(Є billion)
Revenue Growth
The European tourism’s revenue will be increasing in the next 5 years
and the analyzes show that in 2020 it will be 739 million EUR.

The subsector of the European tourism sector with the highest net profit margin is the Entertainment with its13,7%, followed by the accommodation subsector (13,2%).
The European tourism sector’s profit between 2011-2015
Sources: travelmarketreport.com; biz.yahoo.com; wttc.org; .e-unwto.org; http://monitor.icef.com
105 110 110 118 122
-6%
-4%
-2%
0%
2%
4%
6%
8%
10%
0
50
100
150
200
250
300
2011 2012 2013 2014 2015
The European tourism industry’s annual profit from 2011 to 2015 (Є billion)
Profit (billion EUR) Growth
The average net profit margin calculated in this sector is 17,37%.
The European tourism industry’s turnover and profit had an almost fluctuated
growth in the period of 2011-2015.
603.3
632.4 632.5
682.1700.0
-6%
-4%
-2%
0%
2%
4%
6%
8%
10%
500.0
550.0
600.0
650.0
700.0
750.0
2011 2012 2013 2014 2015
The tourism industry’s revenue (Є billion)
The Tourism industry's contribution to the GDP (billion…
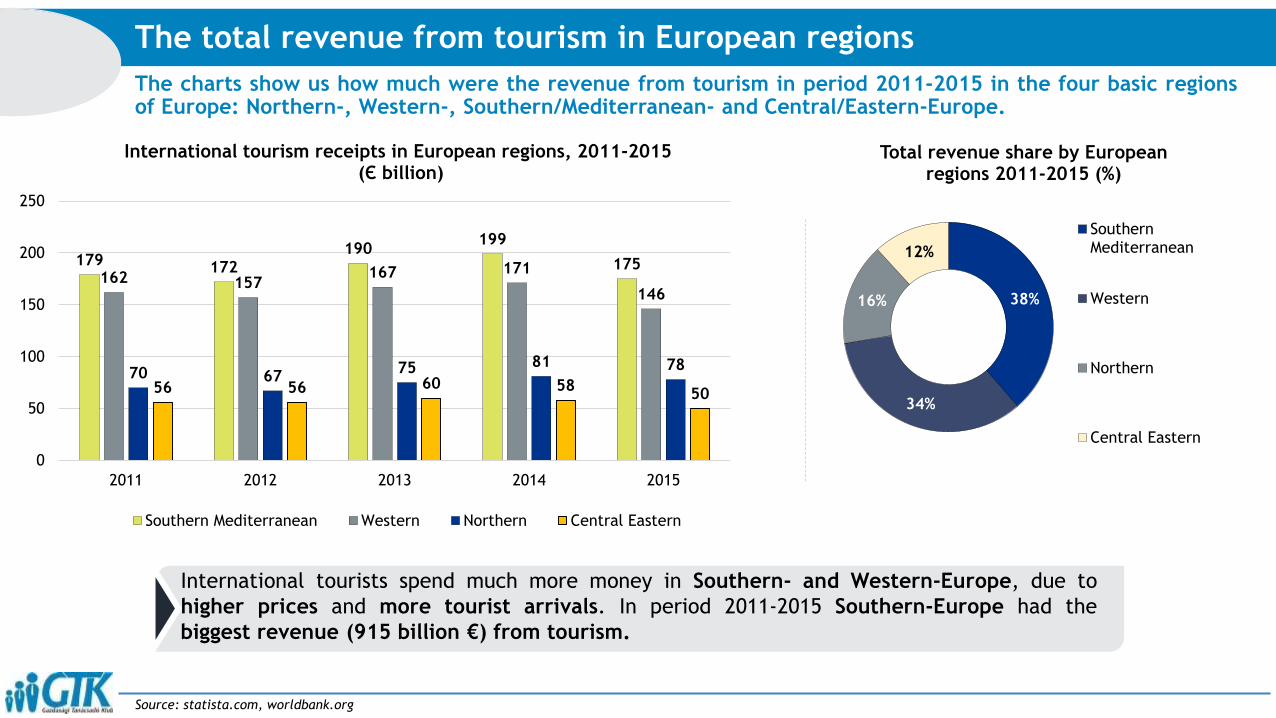
The charts show us how much were the revenue from tourism in period 2011-2015 in the four basic regionsof Europe: Northern-, Western-, Southern/Mediterranean- and Central/Eastern-Europe.
Source: statista.com, worldbank.org
38%
34%
16%
12%
Total revenue share by European regions 2011-2015 (%)
SouthernMediterranean
Western
Northern
Central Eastern
International tourists spend much more money in Southern- and Western-Europe, due to
higher prices and more tourist arrivals. In period 2011-2015 Southern-Europe had the
biggest revenue (915 billion €) from tourism.
The total revenue from tourism in European regions
179 172190
199
175162 157
167 171
146
70 6775 81 78
56 56 60 5850
0
50
100
150
200
250
2011 2012 2013 2014 2015
International tourism receipts in European regions, 2011-2015(Є billion)
Southern Mediterranean Western Northern Central Eastern

The number of employed persons has increased in the tourism industry in the EU since 2011 and this growthis expected to continue.
Employment in the tourism industry in the EU (millions/ year)
Source: ec.europa.eu; wttc.org
13.0413.1 13.07
13.4
13.92 13.94 13.97 13.99 14.02 14.04
2011 2012 2013 2014 2015 2016 2017 2018 2019 2020
The number of employed persons in the turism industry in the EU (millions/ year)
• From 2011 to 2015 the number of employed persons increased with 6% in the
tourism industry in the EU. This includes employment by hotels, travel
agents, airlines and other passanger transportation services.
• An increas of 1,6% is expected in the next ten years in this sector according
to the forecast of the WTTC.
From 2011 to 2015 the number of employed persons increased with 6% in the tourism industry in the EU.
This includes employment by hotels, travel agents, airlines and other passanger transportation services.
An increas of 1,6% is expected in the next ten years in this sector according to the forecast of the WTTC.
* * * * *
* Forecast
Source:
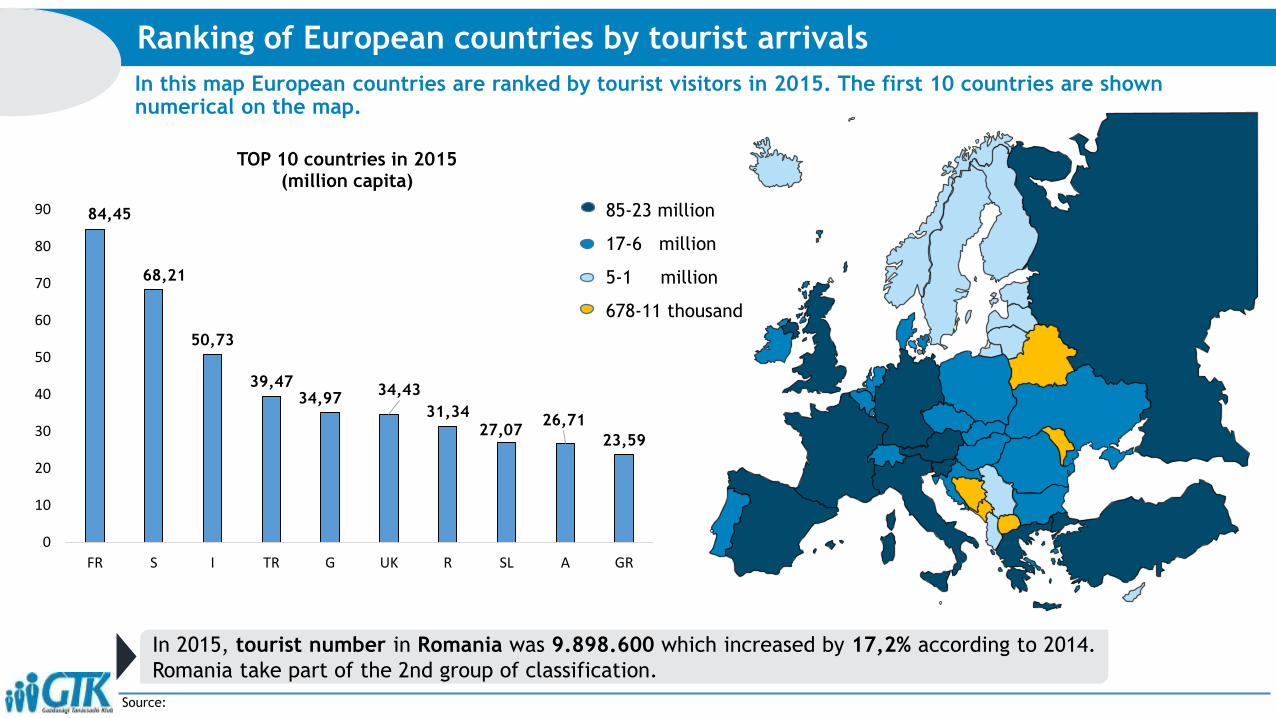
In this map European countries are ranked by tourist visitors in 2015. The first 10 countries are shown numerical on the map.
Ranking of European countries by tourist arrivals
85-23 million
17-6 million
5-1 million
678-11 thousand
In 2015, tourist number in Romania was 9.898.600 which increased by 17,2% according to 2014.
Romania take part of the 2nd group of classification.
84,45
68,21
50,73
39,4734,97
34,43
31,3427,07
26,71
23,59
0
10
20
30
40
50
60
70
80
90
FR S I TR G UK R SL A GR
TOP 10 countries in 2015(million capita)
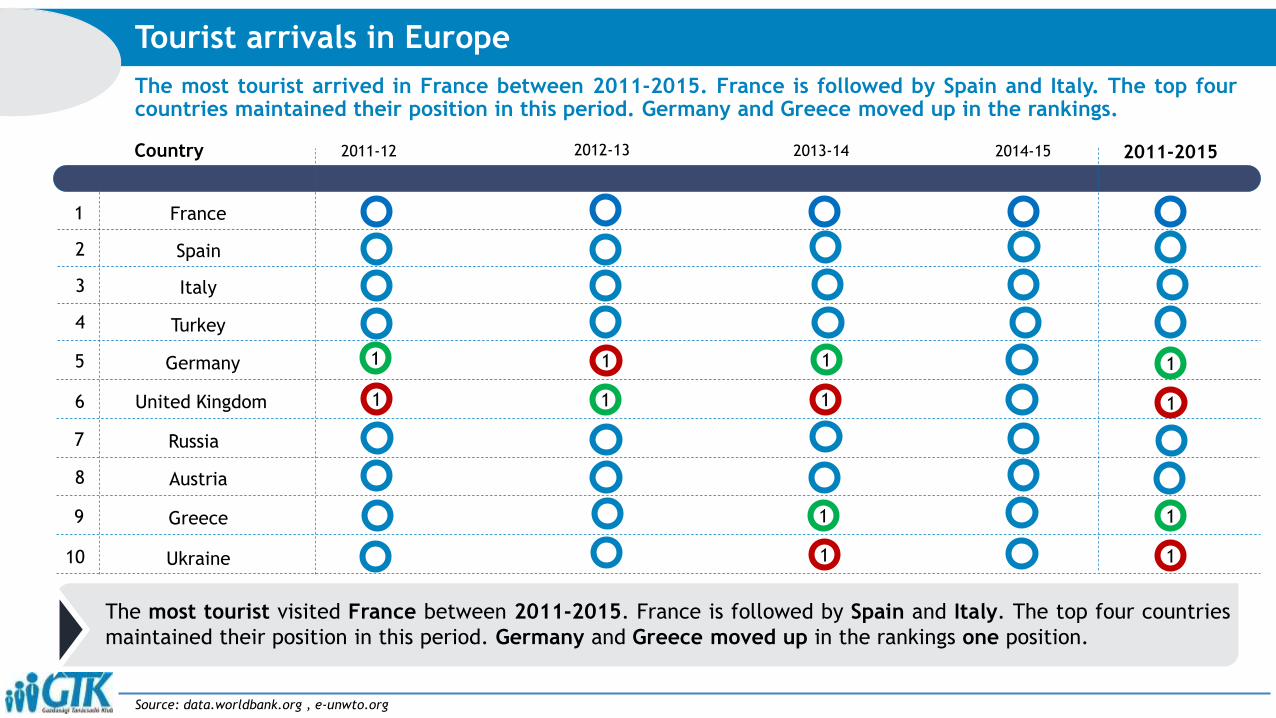
The most tourist arrived in France between 2011-2015. France is followed by Spain and Italy. The top fourcountries maintained their position in this period. Germany and Greece moved up in the rankings.
Tourist arrivals in Europe
Source: data.worldbank.org , e-unwto.org
2011-12 2012-13 2013-14 2014-15 2011-2015Country
1
2
3
4
5
6
7
8
9
10
France
Spain
Italy
Turkey
Germany
United Kingdom
Russia
Austria
Greece
Ukraine
11
1 1
1
1
1
1
1
1
1
1
The most tourist visited France between 2011-2015. France is followed by Spain and Italy. The top four countries
maintained their position in this period. Germany and Greece moved up in the rankings one position.
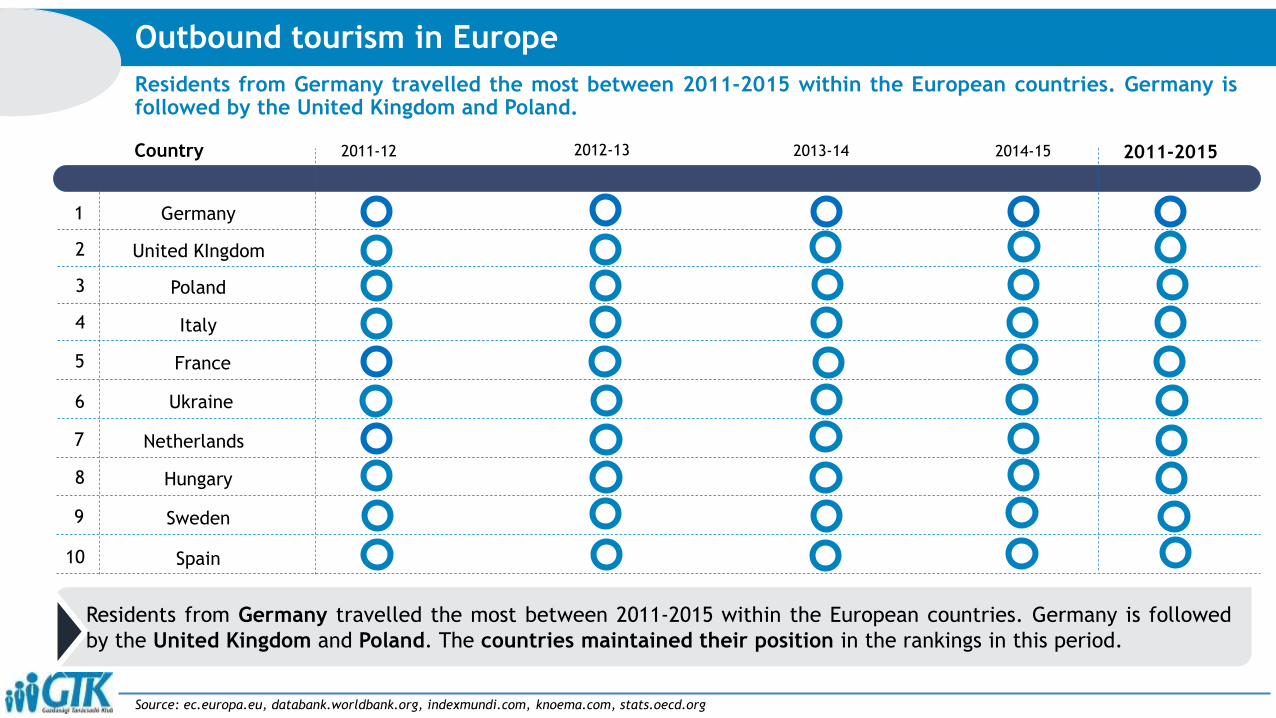
Residents from Germany travelled the most between 2011-2015 within the European countries. Germany isfollowed by the United Kingdom and Poland.
Outbound tourism in Europe
Source: ec.europa.eu, databank.worldbank.org, indexmundi.com, knoema.com, stats.oecd.org
2011-12 2012-13 2013-14 2014-15 2011-2015Country
1
2
3
4
5
6
7
8
9
10
Germany
United KIngdom
Poland
Italy
France
Ukraine
Netherlands
Hungary
Sweden
Spain
Residents from Germany travelled the most between 2011-2015 within the European countries. Germany is followed
by the United Kingdom and Poland. The countries maintained their position in the rankings in this period.
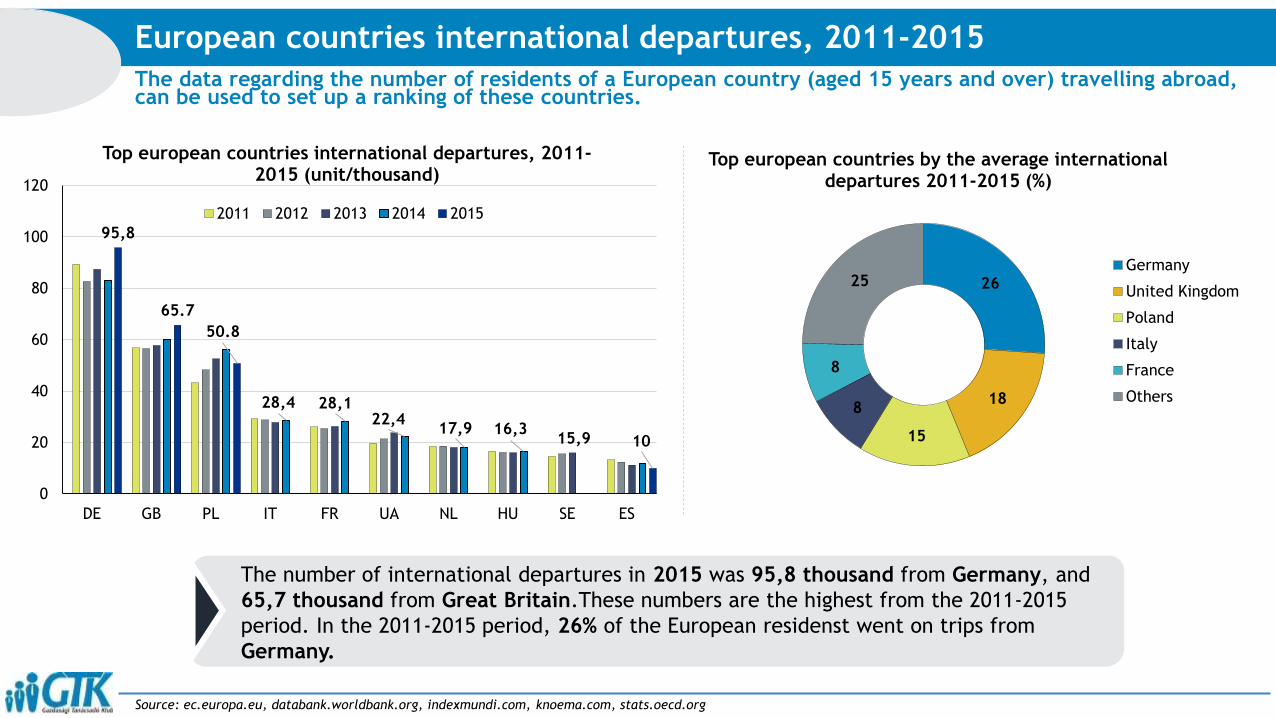
The data regarding the number of residents of a European country (aged 15 years and over) travelling abroad,can be used to set up a ranking of these countries.
European countries international departures, 2011-2015
Source: ec.europa.eu, databank.worldbank.org, indexmundi.com, knoema.com, stats.oecd.org
15,9
28,4 28,122,4
17,9 16,3
95,8
65.7
50.8
10
0
20
40
60
80
100
120
DE GB PL IT FR UA NL HU SE ES
Top european countries international departures, 2011-2015 (unit/thousand)
2011 2012 2013 2014 2015
26
18
15
8
8
25
Top european countries by the average international departures 2011-2015 (%)
Germany
United Kingdom
Poland
Italy
France
Others
The number of international departures in 2015 was 95,8 thousand from Germany, and
65,7 thousand from Great Britain.These numbers are the highest from the 2011-2015
period. In the 2011-2015 period, 26% of the European residenst went on trips from
Germany.

In this graph all the european countries are ranked by total tourist arrivals from period 2011-2015. The graphalso shows information divided by each year.
Source: data.worldbank.org , e-unwto.org
84.45
68.21
50.73
39.4734.97 34.43
31.3426.71
23.59
12.4216.72
0
10
20
30
40
50
60
70
80
90
France Spain Italy Turkey Germany UK Russia Austria Greece Ukraine Poland
Tourist arrivals in Europe TOP 10, 2011-2015(milion capita)
2011 2012 2013 2014 2015
22%
16%
12%10%
8%
32%
Tourist arrivals in european countries
France
Spain
Italy
Turkey
Germany
Others
According to the informations West-European countries, especially France are more popular
among tourists in numbers than East-European countries and there are big differences
between the countries.
Tourist arrivals in Europe
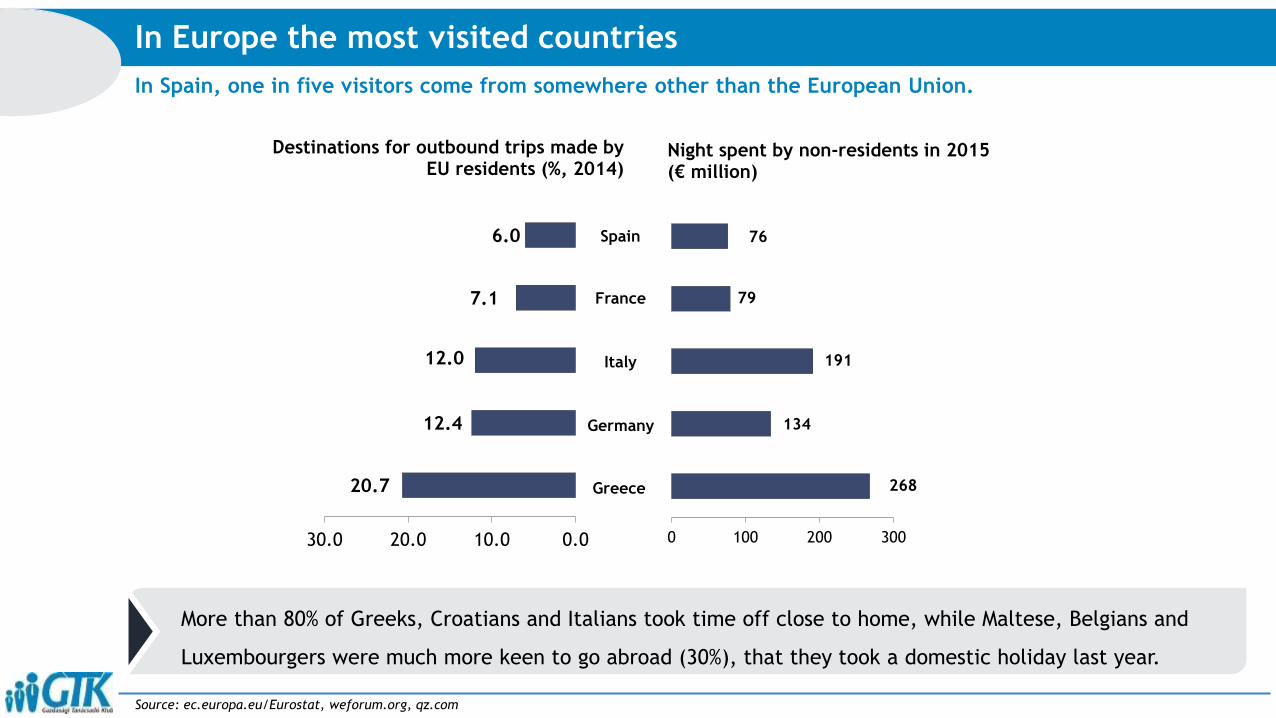
In Spain, one in five visitors come from somewhere other than the European Union.
In Europe the most visited countries
Source: ec.europa.eu/Eurostat, weforum.org, qz.com
20.7
12.4
12.0
7.1
6.0
0.010.020.030.0
Destinations for outbound trips made by EU residents (%, 2014)
268
134
191
79
76
0 100 200 300
Night spent by non-residents in 2015(€ million)
Spain
France
Italy
Germany
Greece
More than 80% of Greeks, Croatians and Italians took time off close to home, while Maltese, Belgians and
Luxembourgers were much more keen to go abroad (30%), that they took a domestic holiday last year.

France, the United States, Spain and China continue to top the rankings by the international arrivals andreceipts.
International tourist arrivals
Source: e-unwto.org
In Europe arrivals grew by 3%, welcoming 15 million more international tourists in 2014
to reach a total 582 million arrivals.
83.6
70
60.755.7
83.7
74.8
65
55.6
0
10
20
30
40
50
60
70
80
90
France United States Spain China
International tourist arrivals in 2013 and 2014 (million capita)
25%
23%20%
32%
Outbound holiday
Asia Pacific South America Noth America Other
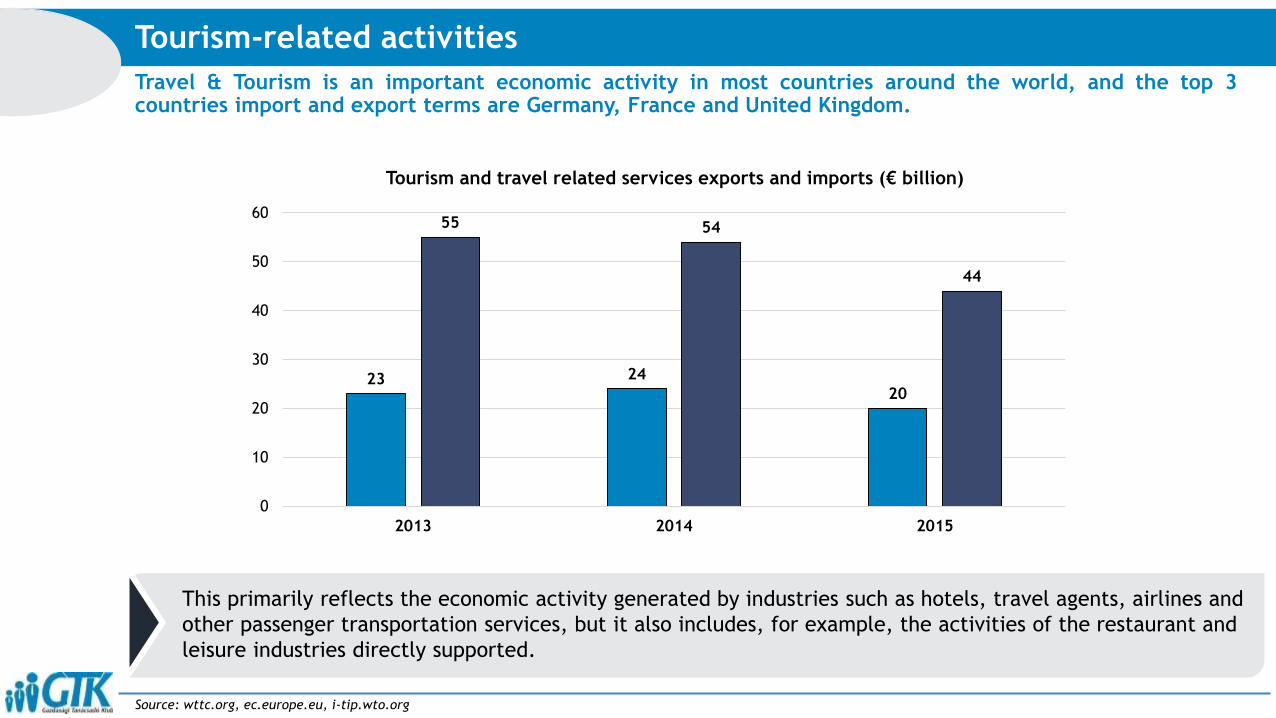
Travel & Tourism is an important economic activity in most countries around the world, and the top 3countries import and export terms are Germany, France and United Kingdom.
Tourism-related activities
Source: wttc.org, ec.europe.eu, i-tip.wto.org
This primarily reflects the economic activity generated by industries such as hotels, travel agents, airlines and
other passenger transportation services, but it also includes, for example, the activities of the restaurant and
leisure industries directly supported.
23 24
20
55 54
44
0
10
20
30
40
50
60
2013 2014 2015
Tourism and travel related services exports and imports (€ billion)
AGENDA
[World] [Europe]
Overview
Subsectors
Overview
Subsectors

The tourism industry has 5 sub sectors: accommodation, food and beverages, transportation, retail trade and cultural, sports and recreational services. In 2014 the division of their receipts is shown below.
Subsectors of European tourism industry
As the charts show the biggest receipt of tourism industry consist of food and beverage
(46 %), but accomodation and transportation also adds up a fairly big percentage (41 %).
Source: eurostat, e-unwto.org, wttc.org
51%
24%
12%
9%4%
Subsectors revenue in 2015 (%)
Food and beverages
Accommodation
Transportation
Entertainment
Travel services
366.3
168.0
88.5
63.0
31.6
Subsectors revenue in 2015 (€ billion)
Food and beverages
Accommodation
Transportation
Entertainment
Travel services
Source:
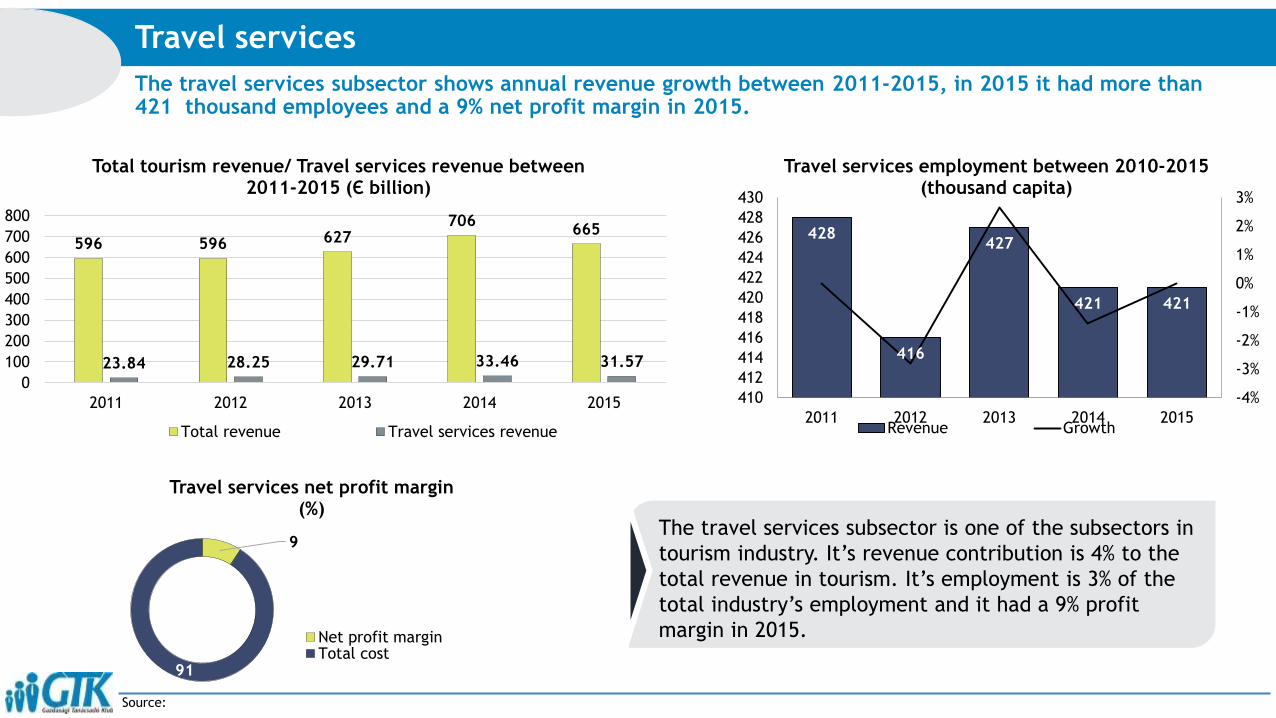
The travel services subsector shows annual revenue growth between 2011-2015, in 2015 it had more than 421 thousand employees and a 9% net profit margin in 2015.
Travel services
596 596 627706
665
23.84 28.25 29.71 33.46 31.57
0
100
200
300
400
500
600
700
800
2011 2012 2013 2014 2015
Total tourism revenue/ Travel services revenue between 2011-2015 (Є billion)
Total revenue Travel services revenue
428
416
427
421 421
-4%
-3%
-2%
-1%
0%
1%
2%
3%
410
412
414
416
418
420
422
424
426
428
430
2011 2012 2013 2014 2015
Travel services employment between 2010-2015 (thousand capita)
Revenue Growth
9
91
Travel services net profit margin(%)
Net profit marginTotal cost
The travel services subsector is one of the subsectors in
tourism industry. It’s revenue contribution is 4% to the
total revenue in tourism. It’s employment is 3% of the
total industry’s employment and it had a 9% profit
margin in 2015.
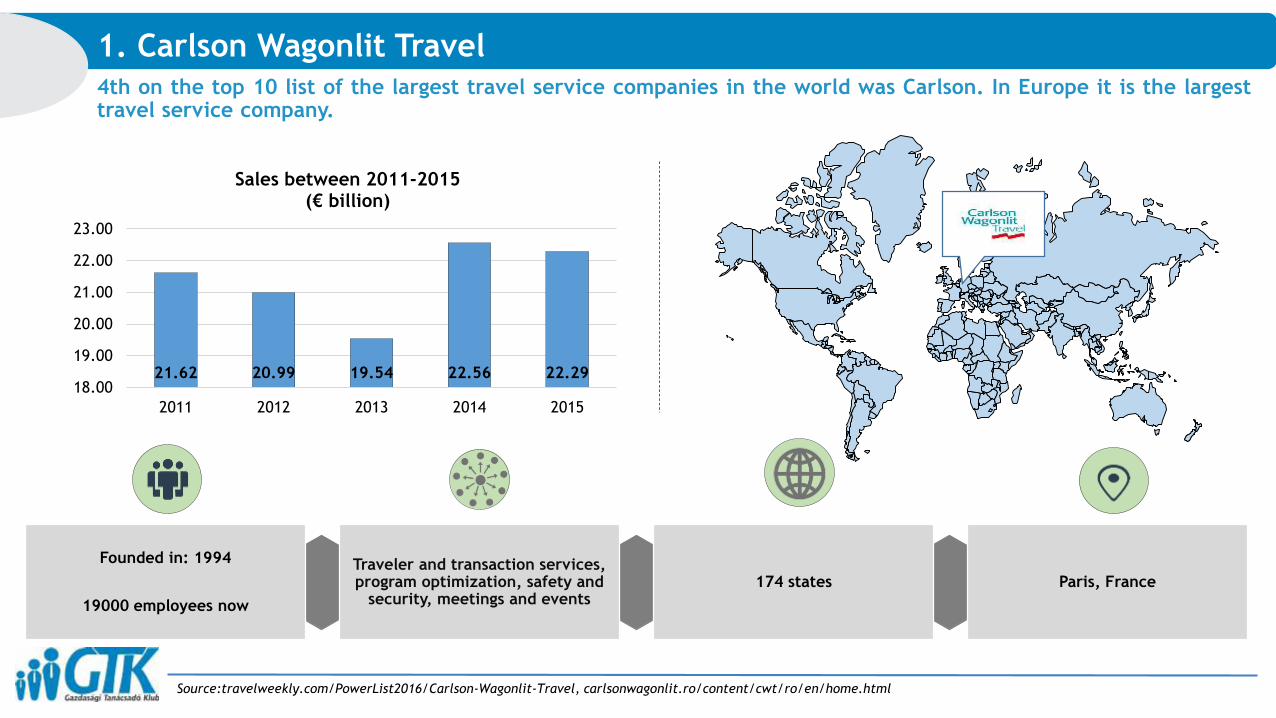
4th on the top 10 list of the largest travel service companies in the world was Carlson. In Europe it is the largesttravel service company.
Source:travelweekly.com/PowerList2016/Carlson-Wagonlit-Travel, carlsonwagonlit.ro/content/cwt/ro/en/home.html
1. Carlson Wagonlit Travel
21.62 20.99 19.54 22.56 22.2918.00
19.00
20.00
21.00
22.00
23.00
2011 2012 2013 2014 2015
Sales between 2011-2015(€ billion)
174 states Paris, FranceTraveler and transaction services, program optimization, safety and
security, meetings and events
Founded in: 1994
19000 employees now
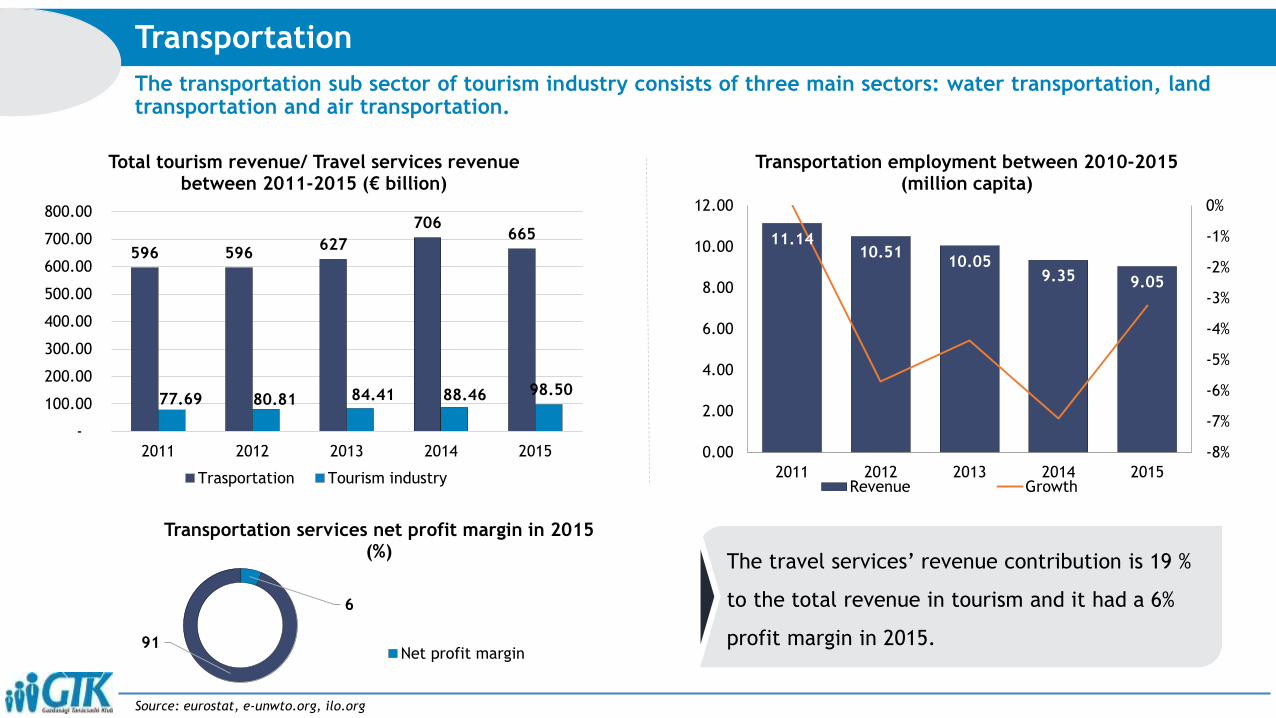
The transportation sub sector of tourism industry consists of three main sectors: water transportation, land transportation and air transportation.
Transportation
The travel services’ revenue contribution is 19 %
to the total revenue in tourism and it had a 6%
profit margin in 2015.
6
91
Transportation services net profit margin in 2015(%)
Net profit margin
Source: eurostat, e-unwto.org, ilo.org
596 596627
706665
77.69 80.81 84.41 88.46 98.50
-
100.00
200.00
300.00
400.00
500.00
600.00
700.00
800.00
2011 2012 2013 2014 2015
Total tourism revenue/ Travel services revenue between 2011-2015 (€ billion)
Trasportation Tourism industry
11.1410.51
10.059.35 9.05
-8%
-7%
-6%
-5%
-4%
-3%
-2%
-1%
0%
0.00
2.00
4.00
6.00
8.00
10.00
12.00
2011 2012 2013 2014 2015
Transportation employment between 2010-2015(million capita)
Revenue Growth
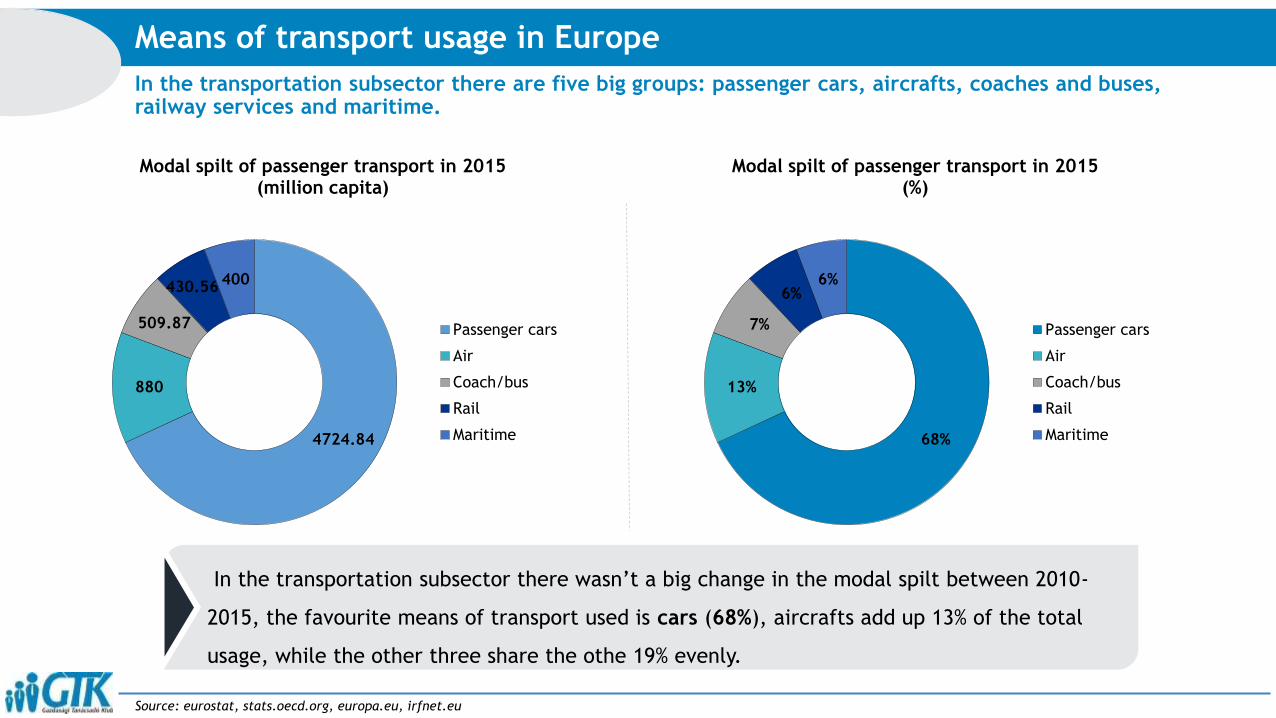
In the transportation subsector there are five big groups: passenger cars, aircrafts, coaches and buses, railway services and maritime.
Means of transport usage in Europe
68%
13%
7%
6%6%
Modal spilt of passenger transport in 2015 (%)
Passenger cars
Air
Coach/bus
Rail
Maritime4724.84
880
509.87
430.56400
Modal spilt of passenger transport in 2015 (million capita)
Passenger cars
Air
Coach/bus
Rail
Maritime
In the transportation subsector there wasn’t a big change in the modal spilt between 2010-
2015, the favourite means of transport used is cars (68%), aircrafts add up 13% of the total
usage, while the other three share the othe 19% evenly.
Source: eurostat, stats.oecd.org, europa.eu, irfnet.eu
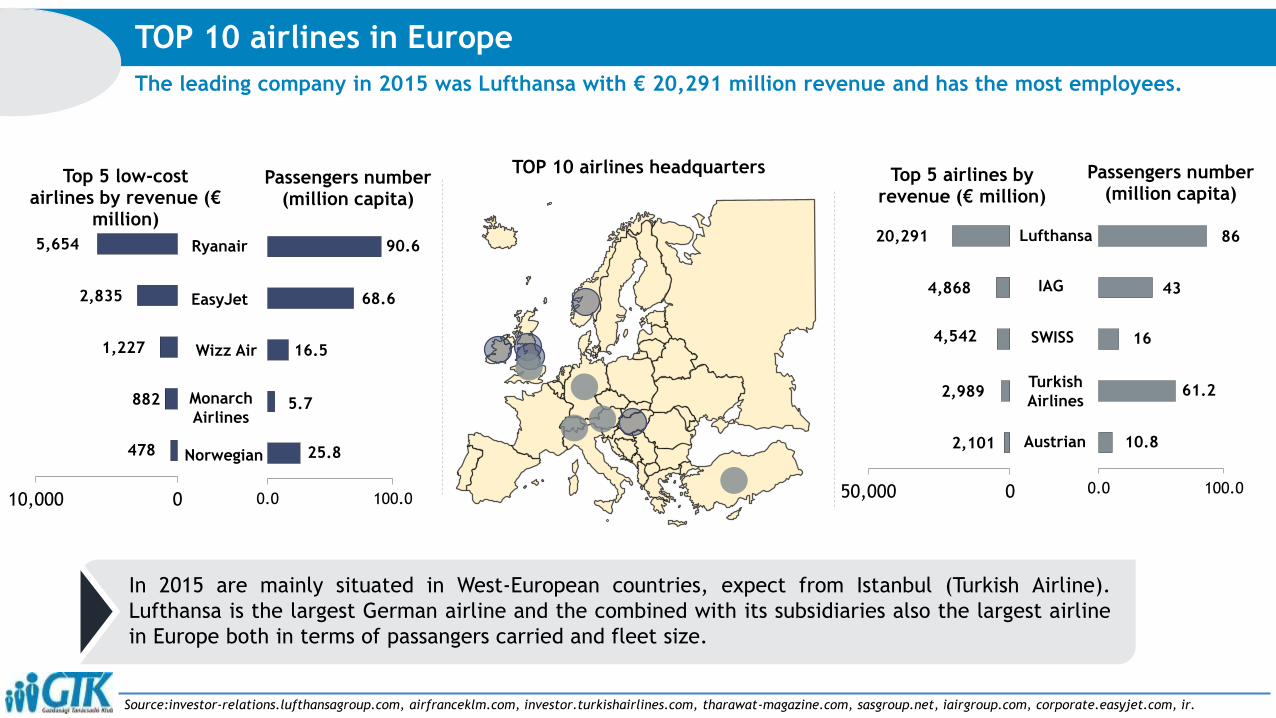
The leading company in 2015 was Lufthansa with € 20,291 million revenue and has the most employees.
TOP 10 airlines in Europe
Source:investor-relations.lufthansagroup.com, airfranceklm.com, investor.turkishairlines.com, tharawat-magazine.com, sasgroup.net, iairgroup.com, corporate.easyjet.com, ir.
478
882
1,227
2,835
5,654
010,000
Top 5 low-cost airlines by revenue (€
million)
25.8
5.7
16.5
68.6
90.6
0.0 100.0
Passengers number (million capita)
Ryanair
EasyJet
Wizz Air
Monarch
Airlines
Norwegian
In 2015 are mainly situated in West-European countries, expect from Istanbul (Turkish Airline).
Lufthansa is the largest German airline and the combined with its subsidiaries also the largest airline
in Europe both in terms of passangers carried and fleet size.
TOP 10 airlines headquarters
2,101
2,989
4,542
4,868
20,291
050,000
Top 5 airlines by revenue (€ million)
10.8
61.2
16
43
86
0.0 100.0
Passengers number (million capita)
Lufthansa
IAG
SWISS
Turkish
Airlines
Austrian
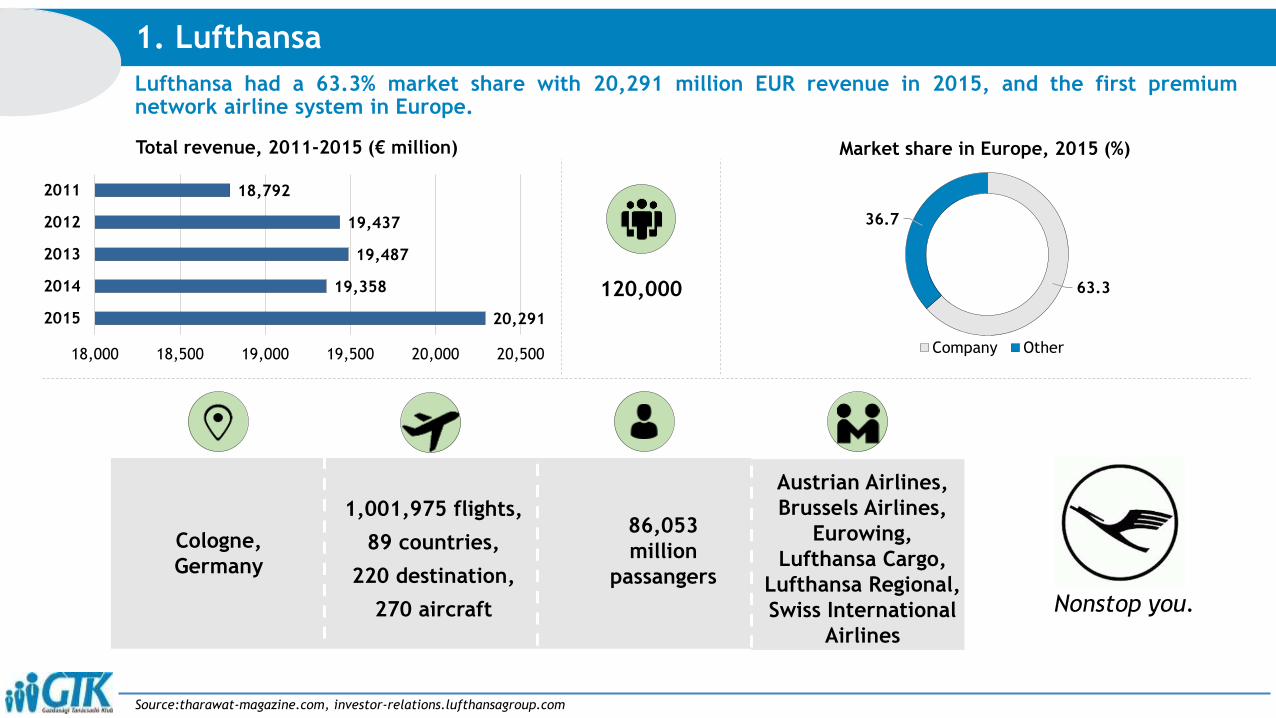
Lufthansa had a 63.3% market share with 20,291 million EUR revenue in 2015, and the first premiumnetwork airline system in Europe.
1. Lufthansa
Source:tharawat-magazine.com, investor-relations.lufthansagroup.com
1,001,975 flights,
89 countries,
220 destination,
270 aircraft
Cologne,
Germany
86,053
million
passangers
Austrian Airlines,
Brussels Airlines,
Eurowing,
Lufthansa Cargo,
Lufthansa Regional,
Swiss International
Airlines
Nonstop you.
20,291
19,358
19,487
19,437
18,792
18,000 18,500 19,000 19,500 20,000 20,500
2015
2014
2013
2012
2011
Total revenue, 2011-2015 (€ million)
63.3
36.7
Market share in Europe, 2015 (%)
Company Other
120,000

The accommodation sub-sector has a market share of 24% of the total tourism industry. It works with a NPMof 13,20%.
The accommodation sub-sector’s revenue in Europe
Source: ec.eruopa.eu/eurostat
145 152 152 164 168
603.3 632.4 632.48682.12 700
0
200
400
600
800
2011 2012 2013 2014 2015
The tourism industry’s turnover compared to the accommodation sub-sectors’ 2011-2015 (Є billion)
Accommodation Total industry
The sub-sector’s turnover remaind almost constant
between the years of 2011-2015, with a CAGR of 2,5%. The
number of employees in the accommodation sub-sector
makes 18,25% of the whole industry’s employee number.
13.2
86.8
Accommodation’s net profit margin(%)
Net profit marginTotal cost
2.39 2.382.40
2.45
2.53
-5%-4%-3%-2%-1%0%1%2%3%4%
2.30
2.35
2.40
2.45
2.50
2.55
2011 2012 2013 2014 2015
Number of employees between 2011-2015 (Є million)
Employees Growth
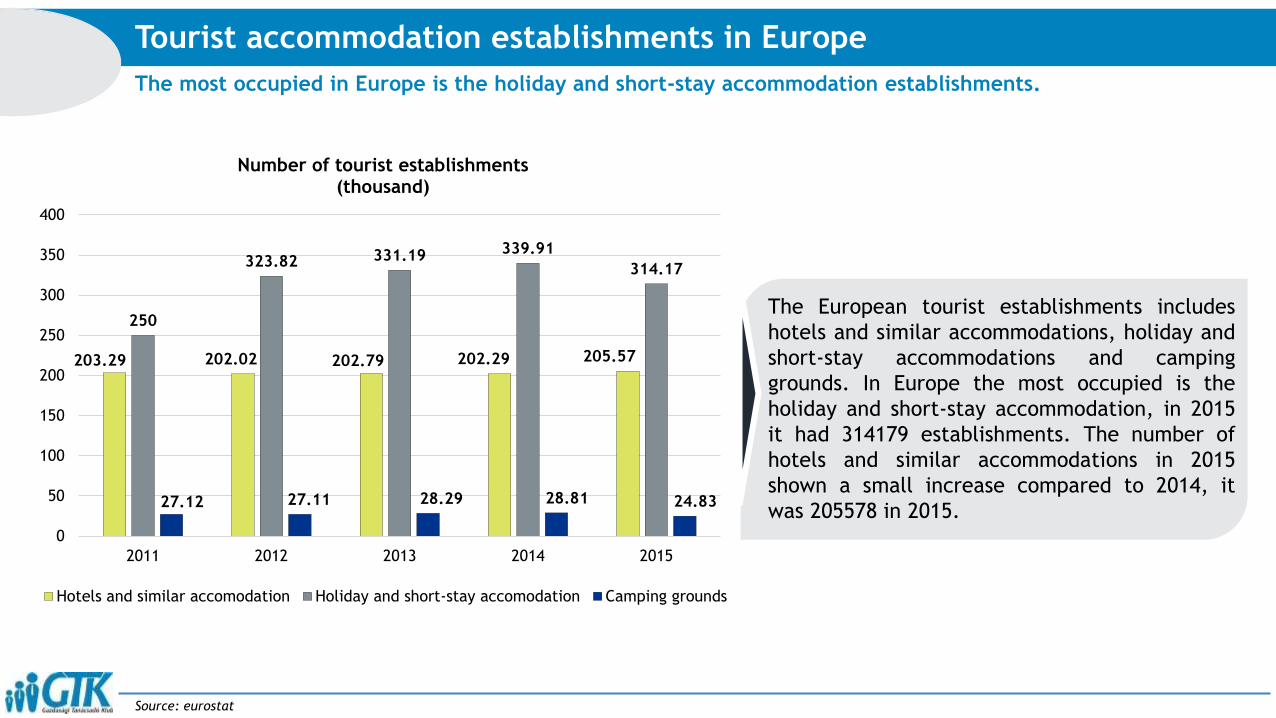
The most occupied in Europe is the holiday and short-stay accommodation establishments.
Tourist accommodation establishments in Europe
203.29 202.02 202.79 202.29 205.57
250
323.82 331.19 339.91
314.17
27.12 27.11 28.29 28.81 24.83
0
50
100
150
200
250
300
350
400
2011 2012 2013 2014 2015
Number of tourist establishments(thousand)
Hotels and similar accomodation Holiday and short-stay accomodation Camping grounds
The European tourist establishments includes
hotels and similar accommodations, holiday and
short-stay accommodations and camping
grounds. In Europe the most occupied is the
holiday and short-stay accommodation, in 2015
it had 314179 establishments. The number of
hotels and similar accommodations in 2015
shown a small increase compared to 2014, it
was 205578 in 2015.
Source: eurostat

The top 10 hotel chains have their headquarters in the following countries: United States, United Kingdom, Spainand France.The most of them are situated in the USA.
Source: hospitality-on.com
The top 10 hotel chains in Europe by number of rooms in 2015
133
82
67
61
59
43
43
36
36
32
0 20 40 60 80 100 120 140 160
Ibis Mega Brand
Best Western
Holiday Inn/ Holiday Inn Express
Mercure
Premier Inn
NH Hotels
Novotel / Suite Novotel
Hilton International
Travelodge
Radisson Blu
The Top 10 hotel chains in Europe by number of roomsin 2015 (thousand)
The 1st hotel chain by the number of rooms is the Ibis Mega Brand, who takes out more than 4
times the number of the last hotel chain’s in this ranking.
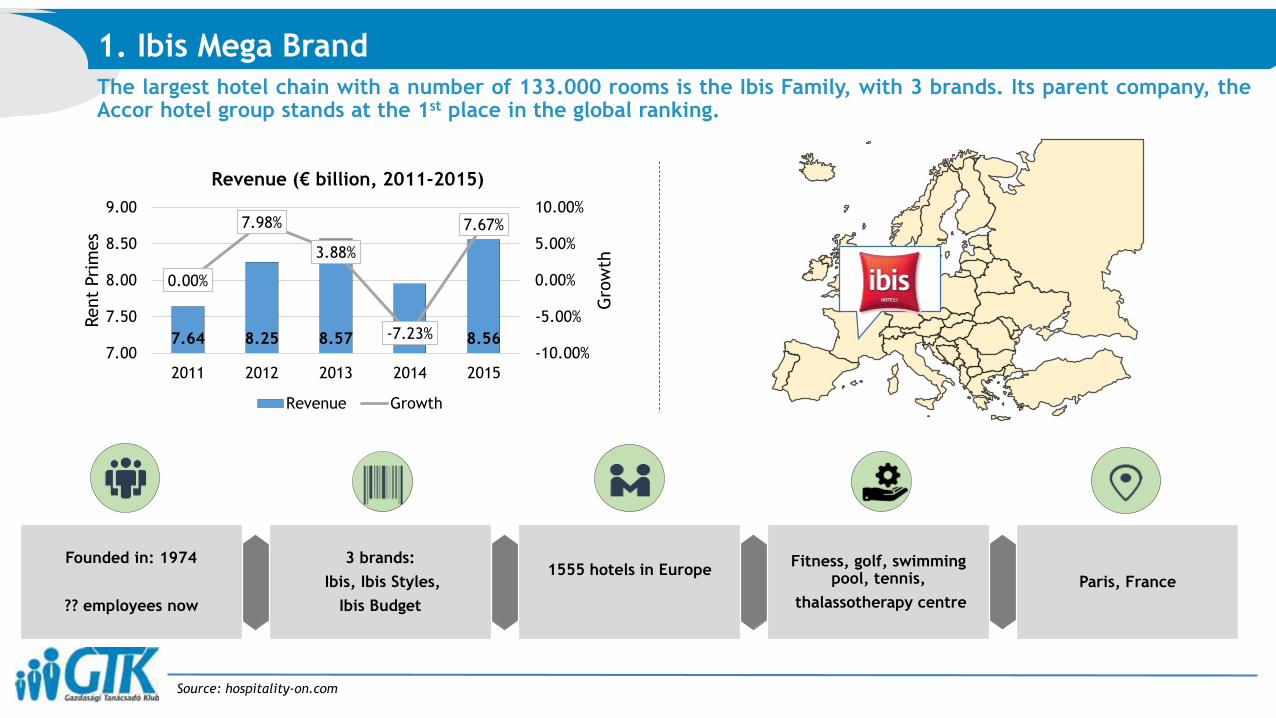
The largest hotel chain with a number of 133.000 rooms is the Ibis Family, with 3 brands. Its parent company, theAccor hotel group stands at the 1st place in the global ranking.
Source: hospitality-on.com
1. Ibis Mega Brand
7.64 8.25 8.57 7.95 8.56
0.00%
7.98%
3.88%
-7.23%
7.67%
-10.00%
-5.00%
0.00%
5.00%
10.00%
7.00
7.50
8.00
8.50
9.00
2011 2012 2013 2014 2015
Gro
wth
Rent
Pri
mes
Revenue (€ billion, 2011-2015)
Revenue Growth
1555 hotels in EuropeFitness, golf, swimming
pool, tennis,
thalassotherapy centre
Paris, France
3 brands:
Ibis, Ibis Styles,
Ibis Budget
Founded in: 1974
?? employees now
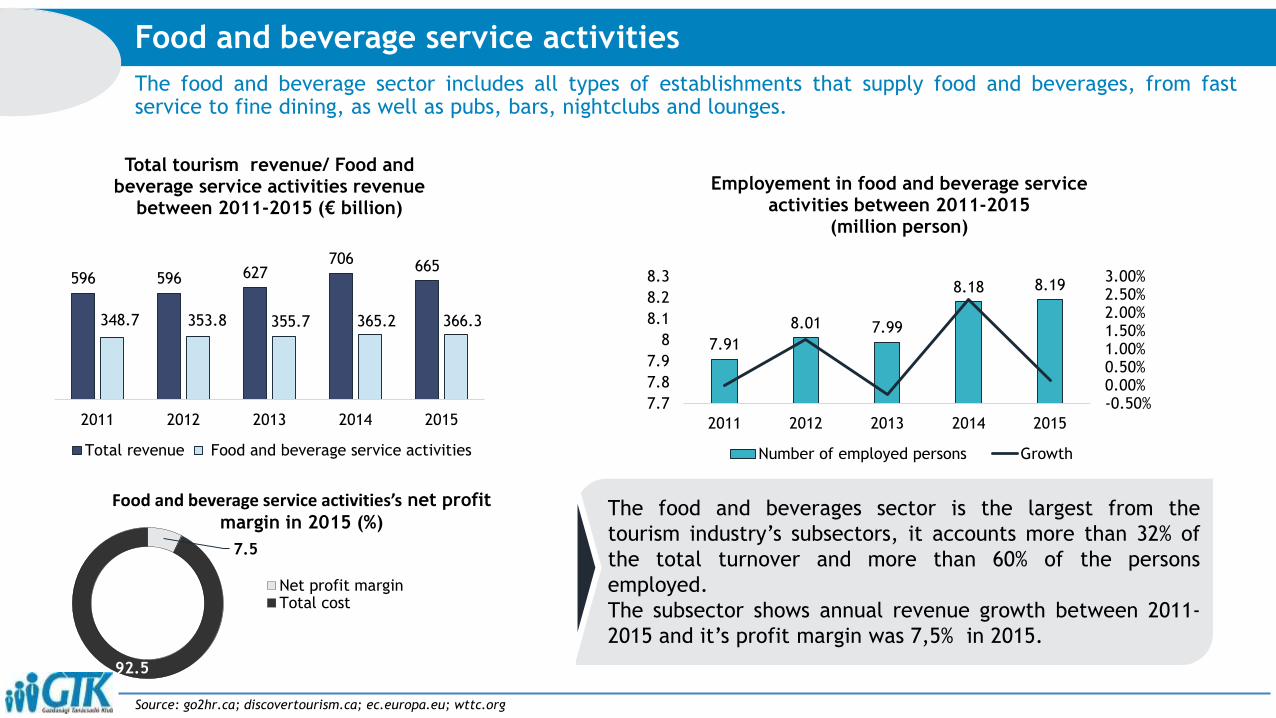
The food and beverage sector includes all types of establishments that supply food and beverages, from fastservice to fine dining, as well as pubs, bars, nightclubs and lounges.
Food and beverage service activities
Source: go2hr.ca; discovertourism.ca; ec.europa.eu; wttc.org
596 596 627706 665
348.7 353.8 355.7 365.2 366.3
2011 2012 2013 2014 2015
Total tourism revenue/ Food and beverage service activities revenue
between 2011-2015 (€ billion)
Total revenue Food and beverage service activities
7.91
8.01 7.99
8.18 8.19
-0.50%0.00%0.50%1.00%1.50%2.00%2.50%3.00%
7.7
7.8
7.9
8
8.1
8.2
8.3
2011 2012 2013 2014 2015
Employement in food and beverage serviceactivities between 2011-2015
(million person)
Number of employed persons Growth
7.5
92.5
Food and beverage service activities’s net profit
margin in 2015 (%)
Net profit marginTotal cost
The food and beverages sector is the largest from the
tourism industry’s subsectors, it accounts more than 32% of
the total turnover and more than 60% of the persons
employed.
The subsector shows annual revenue growth between 2011-
2015 and it’s profit margin was 7,5% in 2015.
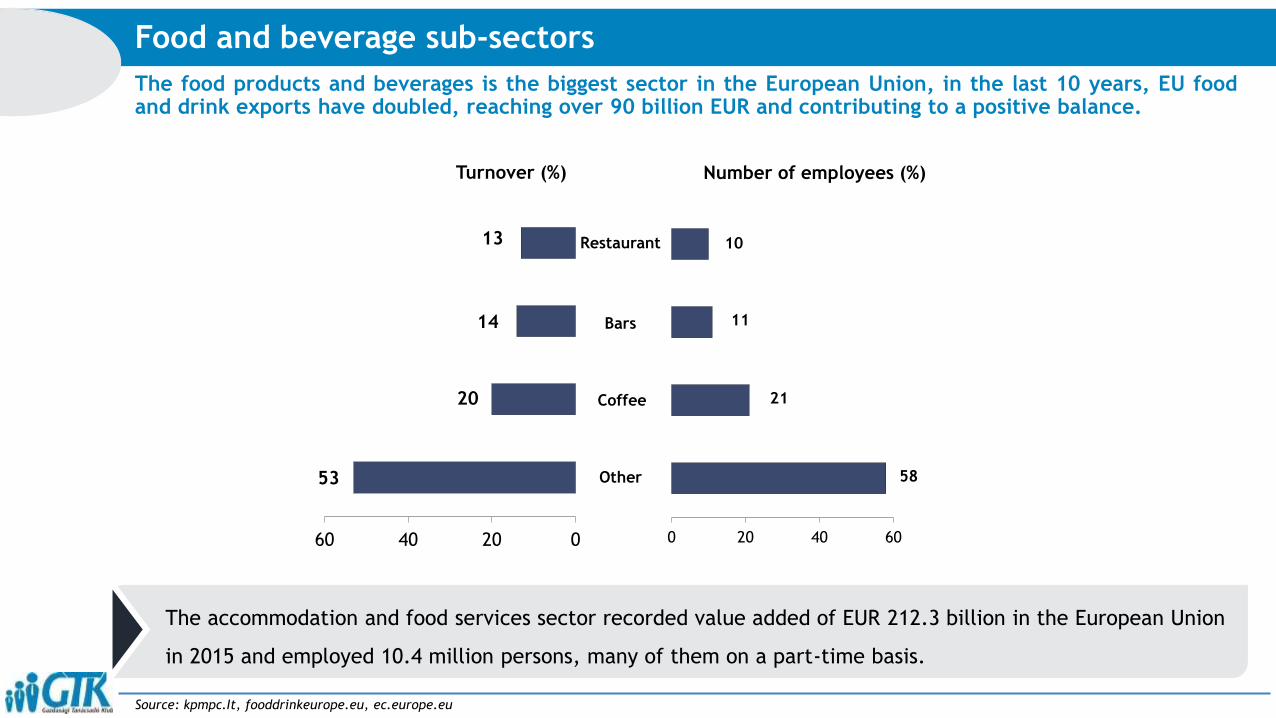
The food products and beverages is the biggest sector in the European Union, in the last 10 years, EU foodand drink exports have doubled, reaching over 90 billion EUR and contributing to a positive balance.
Food and beverage sub-sectors
Source: kpmpc.It, fooddrinkeurope.eu, ec.europe.eu
The accommodation and food services sector recorded value added of EUR 212.3 billion in the European Union
in 2015 and employed 10.4 million persons, many of them on a part-time basis.
53
20
14
13
0204060
Turnover (%)
58
21
11
10
0 20 40 60
Number of employees (%)
Restaurant
Bars
Coffee
Other
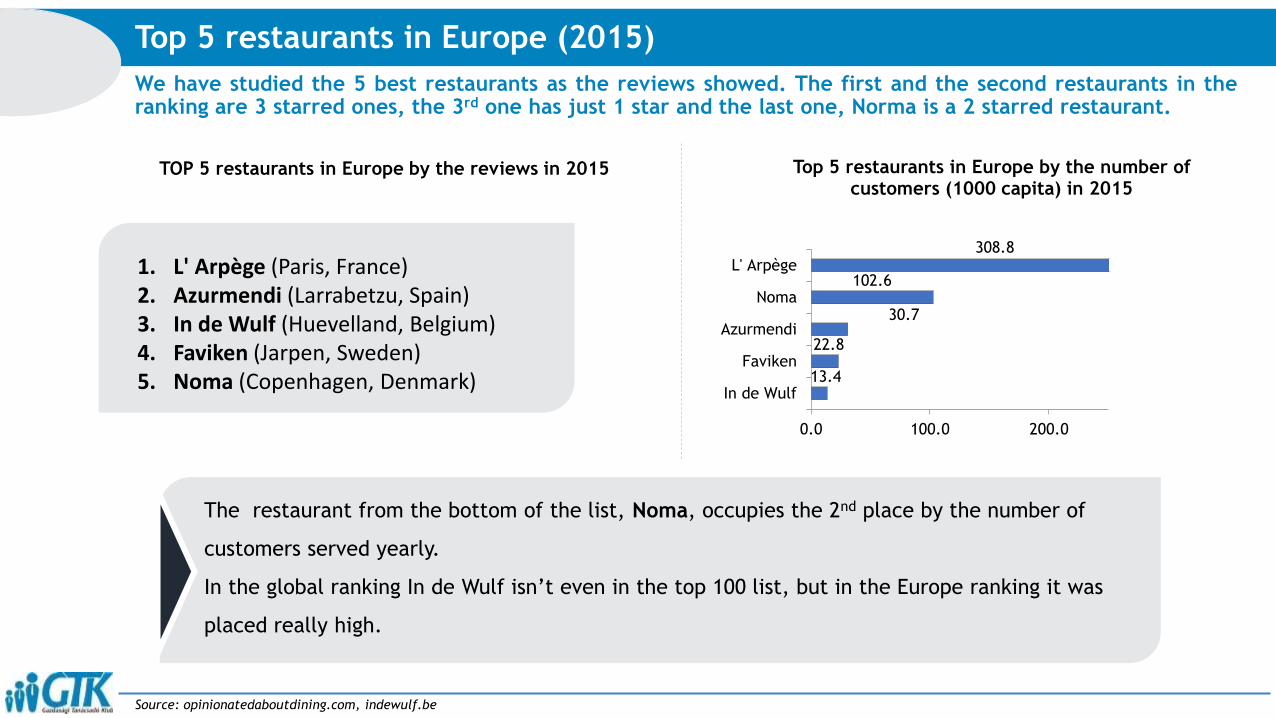
We have studied the 5 best restaurants as the reviews showed. The first and the second restaurants in theranking are 3 starred ones, the 3rd one has just 1 star and the last one, Norma is a 2 starred restaurant.
Top 5 restaurants in Europe (2015)
Source: opinionatedaboutdining.com, indewulf.be
13.4
22.8
30.7
102.6
308.8
0.0 100.0 200.0
In de Wulf
Faviken
Azurmendi
Noma
L' Arpège
Top 5 restaurants in Europe by the number of customers (1000 capita) in 2015
TOP 5 restaurants in Europe by the reviews in 2015
The restaurant from the bottom of the list, Noma, occupies the 2nd place by the number of
customers served yearly.
In the global ranking In de Wulf isn’t even in the top 100 list, but in the Europe ranking it was
placed really high.
1. L' Arpège (Paris, France)2. Azurmendi (Larrabetzu, Spain)3. In de Wulf (Huevelland, Belgium)4. Faviken (Jarpen, Sweden)5. Noma (Copenhagen, Denmark)
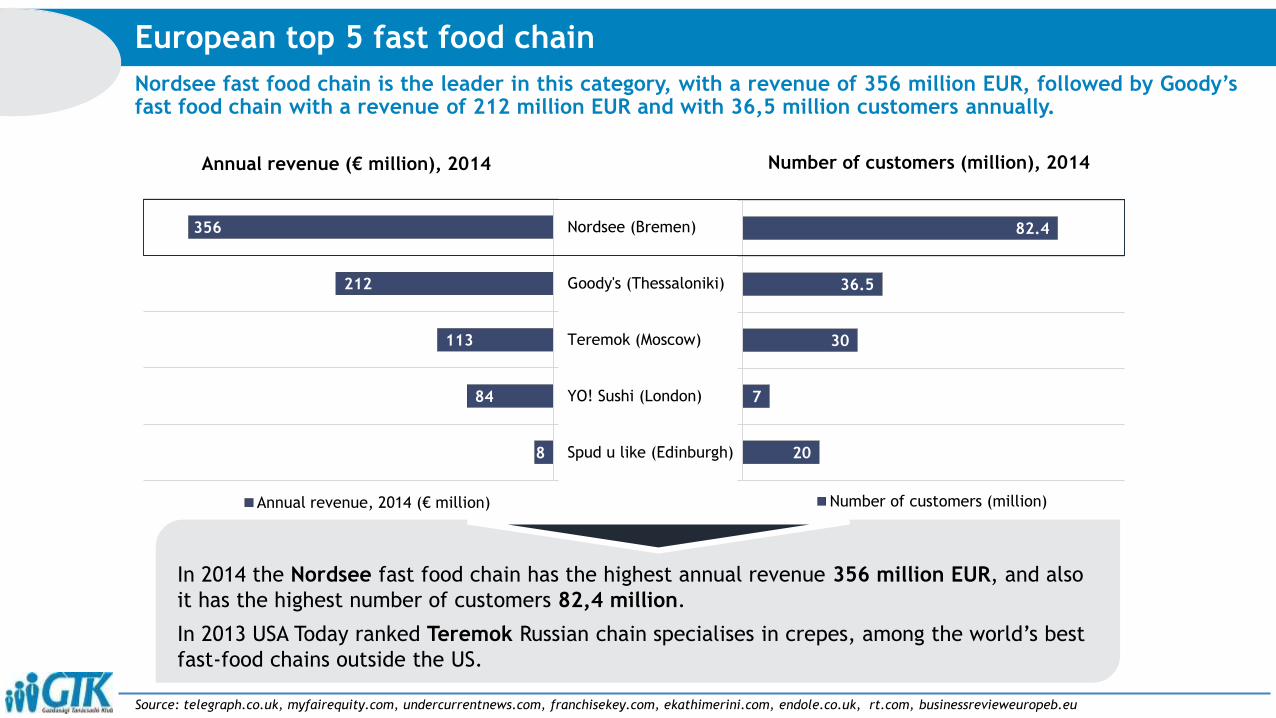
Nordsee fast food chain is the leader in this category, with a revenue of 356 million EUR, followed by Goody’sfast food chain with a revenue of 212 million EUR and with 36,5 million customers annually.
European top 5 fast food chain
Source: telegraph.co.uk, myfairequity.com, undercurrentnews.com, franchisekey.com, ekathimerini.com, endole.co.uk, rt.com, businessrevieweuropeb.eu
18
84
113
212
356
Spud u like (Edinburgh)
YO! Sushi (London)
Teremok (Moscow)
Goody's (Thessaloniki)
Nordsee (Bremen)
Annual revenue (€ million), 2014
Annual revenue, 2014 (€ million)
20
7
30
36.5
82.4
Number of customers (million), 2014
Number of customers (million)
In 2014 the Nordsee fast food chain has the highest annual revenue 356 million EUR, and also
it has the highest number of customers 82,4 million.
In 2013 USA Today ranked Teremok Russian chain specialises in crepes, among the world’s best
fast-food chains outside the US.
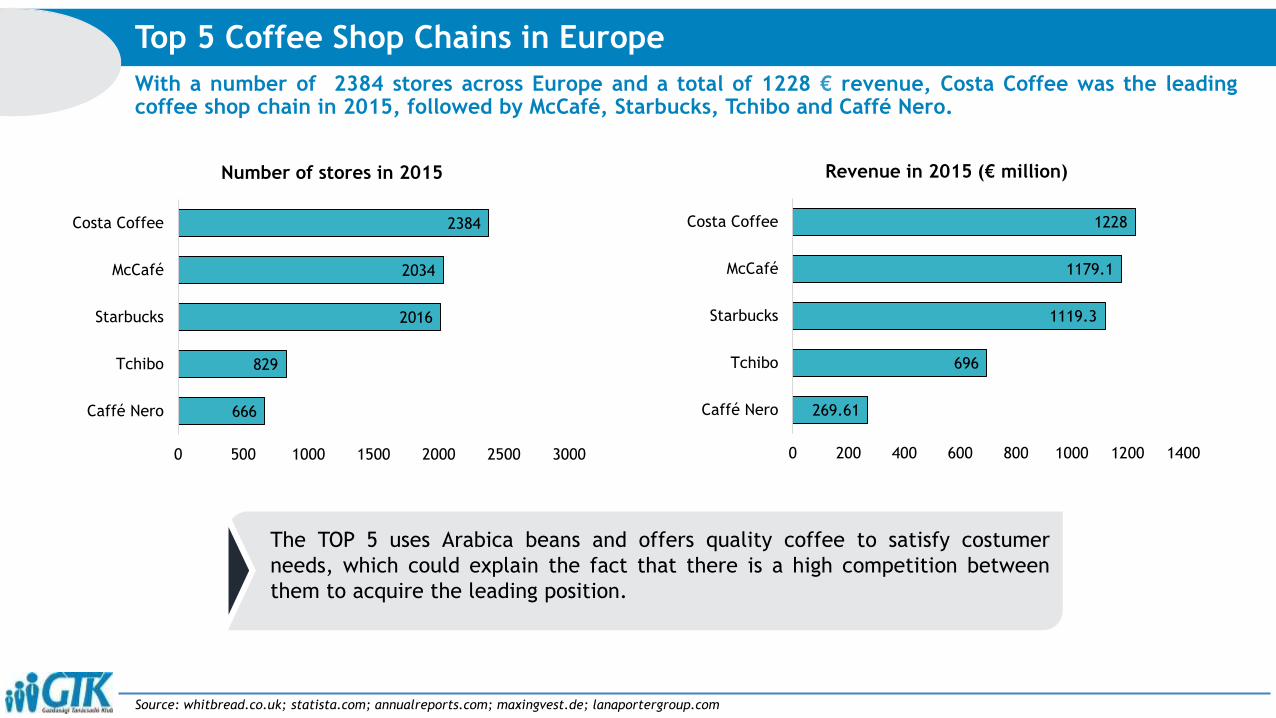
With a number of 2384 stores across Europe and a total of 1228 € revenue, Costa Coffee was the leadingcoffee shop chain in 2015, followed by McCafé, Starbucks, Tchibo and Caffé Nero.
Top 5 Coffee Shop Chains in Europe
Source: whitbread.co.uk; statista.com; annualreports.com; maxingvest.de; lanaportergroup.com
666
829
2016
2034
2384
0 500 1000 1500 2000 2500 3000
Caffé Nero
Tchibo
Starbucks
McCafé
Costa Coffee
Number of stores in 2015
269.61
696
1119.3
1179.1
1228
0 200 400 600 800 1000 1200 1400
Caffé Nero
Tchibo
Starbucks
McCafé
Costa Coffee
Revenue in 2015 (€ million)
The TOP 5 uses Arabica beans and offers quality coffee to satisfy costumer
needs, which could explain the fact that there is a high competition between
them to acquire the leading position.
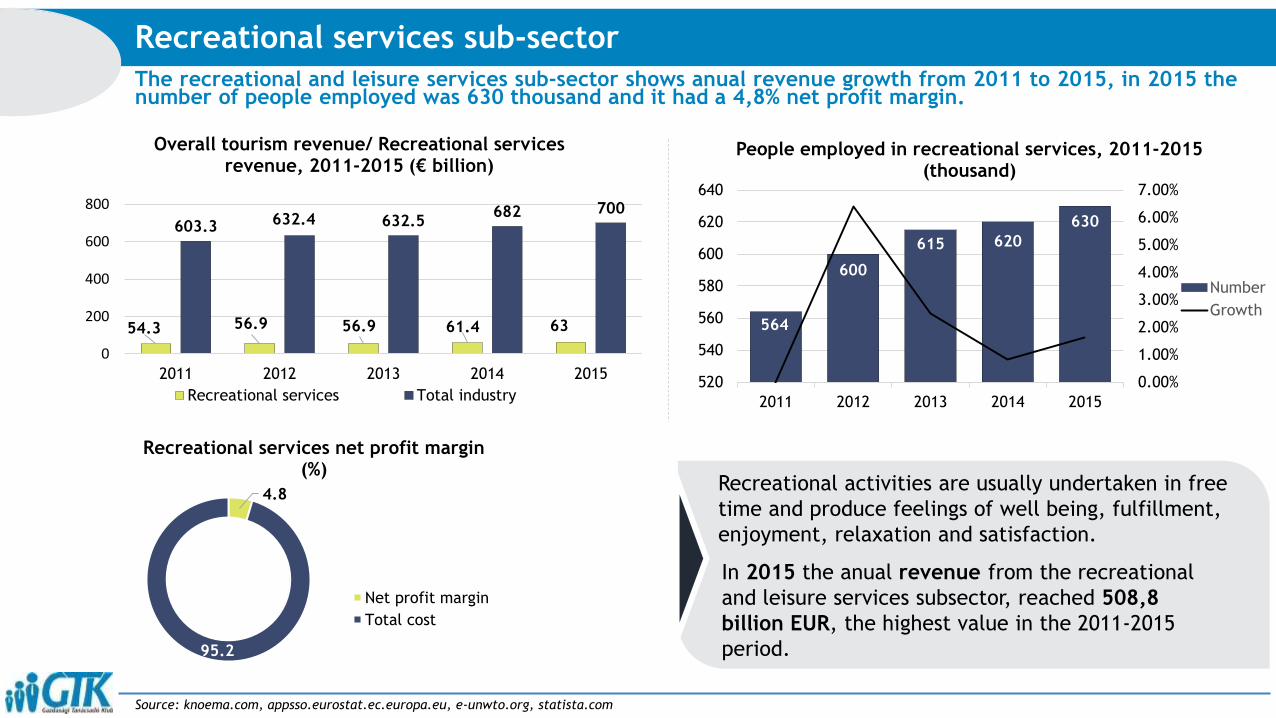
The recreational and leisure services sub-sector shows anual revenue growth from 2011 to 2015, in 2015 thenumber of people employed was 630 thousand and it had a 4,8% net profit margin.
Recreational services sub-sector
Source: knoema.com, appsso.eurostat.ec.europa.eu, e-unwto.org, statista.com
54.3 56.9 56.9 61.4 63
603.3 632.4 632.5682 700
0
200
400
600
800
2011 2012 2013 2014 2015
Overall tourism revenue/ Recreational services revenue, 2011-2015 (€ billion)
Recreational services Total industry
564
600
615 620
630
0.00%
1.00%
2.00%
3.00%
4.00%
5.00%
6.00%
7.00%
2011 2012 2013 2014 2015
520
540
560
580
600
620
640
People employed in recreational services, 2011-2015 (thousand)
Number
Growth
4.8
95.2
Recreational services net profit margin(%)
Net profit margin
Total cost
Recreational activities are usually undertaken in free
time and produce feelings of well being, fulfillment,
enjoyment, relaxation and satisfaction.
In 2015 the anual revenue from the recreational
and leisure services subsector, reached 508,8
billion EUR, the highest value in the 2011-2015
period.

In 2013 and 2014, 48% of the residents travelled because of holidays, leisure and recreation. The mostpopular destinations depend on the purpose of trips.
European residents trips made by purpose
Source: knoema.com, ec.europa.eu, ec.europa.eu
48,8 48
35,236,5
11,611
4,3 4,6
0%
10%
20%
30%
40%
50%
60%
2013 2014
Distribution of trips by purpose, 2013-2014 (%)
Holidays, leisure, recreation Visits to relatives and friends
Professional, business Other personal
37.76%
19.06%
18.94%
21.42%
7.51%
16.84%
8.54%
4.49%
6.14%
4.76%
4.11%
1.94%
17.00%
31.49%
Professional,business Personal
Germany
France
Spain
Italy
Finland
Austria
Others
Popular destinations by purpose, 2014 (%)
In 2014 European residents made almost half of their trips on the purpose of leisure
and recreation, these are followed by professional and business trips with 10,9%. The
facourite destination based on personal purpose is France with 21,5%, but 37,8% of
business trips destination is Germany.

Source:
The top 10 most visited cities have a GDP in proportion to the number of tourist, there are some exceptions because not every city is that much of an industrial one, while others are.
Most influencial cities in Europe
4.86
5.47
5.81
7.17
7.41
7.44
7.63
12.56
16.06
18.82
05101520
Munich
Prague
Vienna
Milan
Rome
Amsterdam
Barcelona
Istanbul
Paris
London
TOP 10 most visited cities in 2015(million capita)
208
51.87
126
198
161.2
115.71
214.9
371.54
642
617
0 200 400 600 800
GDP in 2015 (€ billion)
In the top 10 most visited cities in Europe tourism is one of the largest industries with
unique attractions, but every single one is standing out in other sectors too, generating a
high GDP.
Munich:
Marienplatz, automotives
Prague:
Castle, beer
Rome:
Colosseum, Vatican,
tourism, cinema
Vienna:
Schönbrunn, OMV, Siemens
Amsterdam:
Red Light District,
Heineken, Phillips
Milan:
Cathedral, fashion
London:
Buckingham, finance
Barcelona:
Camp Nou (FCB), beach
Paris:
Eiffel tower, restaurants
Istanbul:
Hagia Sophia, cotton,
tobacco, olive oil
Source: newsroom.mastercard.com, knoema.com, tradingeconomic.com

In Europe there are several well-known tourist attractions about which everybody has heard, most of them can be found western. Some of them are historical, some of them are religious.
The 10 most famous tourist attractions in Europe
The Eiffel Tower
Paris
6,7 million visitors
ticket: 17 €
1889
30 replicas
1 2
Acropolis
Athens
1,4 million visitors
ticket: 20 €
5th century BC
Sagrada Familia
Barcelona
3 million visitors
ticket: 15 €
1882- present days
3
Notre Dame
Paris
13,7 million visitors
entrance: free
1163-1345
4The Colosseum
Rome
6,9 million visitors
ticket: 12 €
70 AD
5
Buckingham Palace
London
0,5 million visitors
ticket: 47 €
1703
6
Vatican
Rome
7 million visitors
ticket: 16 €
AD 40
7
Edinburgh Castle
Edinburgh
1,4 million visitors
ticket: 20 €
12th century
8
Louvre
Paris
8,6 million visitors
ticket: 15 €
1793
9Stonehenge
United Kingdom
8,4 million visitors
ticket: 18,5 €
BC 3100
10
Source: explorra. com

There are 4 most well-known attractions in the group of the most visited ones. These are not the most important ones that attract tourists, these are the ones, where people go.
The 8 most visited tourist attractions in Europe
Grand bazaar
Istanbul
15 million visitors
15th century
locals too
shopping
1
Notre Dame
Paris
13,7 million visitors
entrance: free
1163-1345
religion
2
Disneyland park
Marne-la-Vallee
10,5 million visitors
ticket: 47-99 €
1992
amusement
3
Sacré Coeur
Paris
10,5 million visitors
entrance: free
1871
religion
3
Louvre
Paris
8,6 million visitors
ticket: 15 €
1793
art
5
St. Peter’s Basilica
Vatican city
7 million visitors
entrance: free
1506
religion
The Colosseum
Rome
6,9 million visitors
ticket: 12 €
70 AD
history
6 7
The Eiffel Tower
Paris
6,7 million visitors
ticket: 17 €
1889
architecture
8It is interesting that the most well-known and
the most visited tourist attractions aren’t all
the same. The most visited ones are mainly
free, religion connected, but there are some
too, where people go just because of the
experience.
Source: travelandleisure.com, statista.com
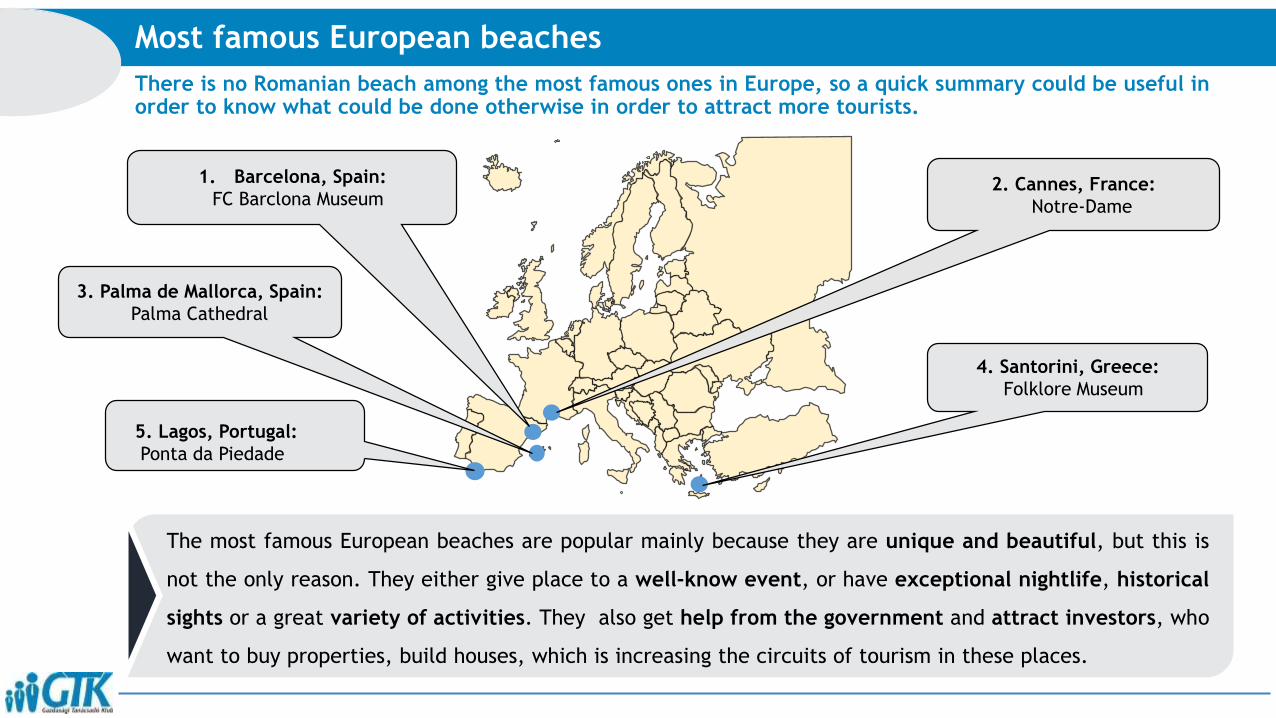
There is no Romanian beach among the most famous ones in Europe, so a quick summary could be useful in order to know what could be done otherwise in order to attract more tourists.
Most famous European beaches
The most famous European beaches are popular mainly because they are unique and beautiful, but this is
not the only reason. They either give place to a well-know event, or have exceptional nightlife, historical
sights or a great variety of activities. They also get help from the government and attract investors, who
want to buy properties, build houses, which is increasing the circuits of tourism in these places.
4. Santorini, Greece:
Folklore Museum
3. Palma de Mallorca, Spain:
Palma Cathedral
2. Cannes, France:
Notre-Dame
1. Barcelona, Spain:
FC Barclona Museum
5. Lagos, Portugal:
Ponta da Piedade
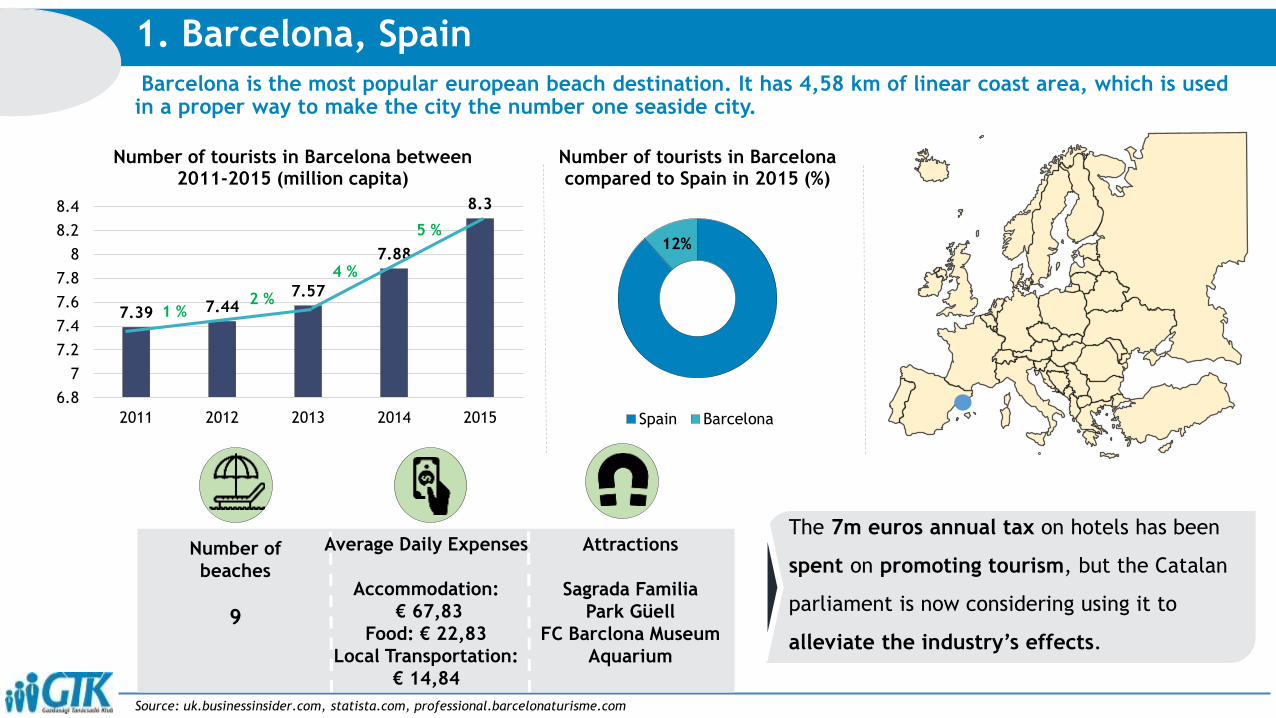
Barcelona is the most popular european beach destination. It has 4,58 km of linear coast area, which is used in a proper way to make the city the number one seaside city.
1. Barcelona, Spain
7.39 7.447.57
7.88
8.3
6.8
7
7.2
7.4
7.6
7.8
8
8.2
8.4
2011 2012 2013 2014 2015
Number of tourists in Barcelona between 2011-2015 (million capita)
4 %
5 %12%
Number of tourists in Barcelona compared to Spain in 2015 (%)
Spain Barcelona
Number of
beaches
9
Average Daily Expenses
Accommodation:
€ 67,83
Food: € 22,83
Local Transportation:
€ 14,84
Attractions
Sagrada Familia
Park Güell
FC Barclona Museum
Aquarium
The 7m euros annual tax on hotels has been
spent on promoting tourism, but the Catalan
parliament is now considering using it to
alleviate the industry’s effects.
Source: uk.businessinsider.com, statista.com, professional.barcelonaturisme.com
1 %2 %

France and Austria top the list of countries with the most lifts, with about 3 000 each. Only Austria andFrance have more than 10 resorts that generate over 1 million skier visits per season.
Ski resorts
Source: vanat.ch
Romania is an attractive destination for foreign visitors, as price are relatively low when compared to most of
Europe. The popular destination of Poiana Brasov, the region hosts several sporting events every year. Over the
last year, a new ski resort opened, called Star Trek Voineasa, the now official name is Transalpina. It feature's a 2
sector gondola, 1 quad chairlift and 2 surface lifts.
Romania
Lifts: 141
Ski areas: 45
National skiers: 653,714
Skier visits: 1,200 000
Lifts: 3,028
Ski areas: 254
National skiers: 2,959 793
Skier visits: 51,561 600
Austria
Lifts: 3,391
Ski areas: 325
National skiers: 8,573 709
Skier visits: 55,126 000
France
Lifts: 2,127
Ski areas: 349
National skiers: 4,918 584
Skier visits: 25,848 000
Italy

Austria is the European country with the largest hotel accommodation offering, and the resorts have a strongmarket positioning; skier visits reached 51.6 million in winter in 2014-2015, 1.6% up from the former season.
TOP 5 ski resorts in Europe
Source: vanat.ch, lechzuers.com, ski-resort.wanderbat.com , alphorn-zug.at, powderhounds.com, bergfex.com
TOP 5 ski resorts
The skiing area Zillertal Arena is the largest skiing area of the Zillertal valley and extends from the village Zell im
Zillertal, with more than 2,5 million overnight stays in the winter season 2015/2016, the second is Zell am See-Kaprun
with more 1,2 million.
0.13
0.61
1.009
1.26
2.78
Lech Zürs am Arlberg
Kitzbühel
St. Anton
Zell am See-Kaprun
Zell am Ziller
TOP 5 ski resorts by over night stay in winter season 2015/2016 (million)
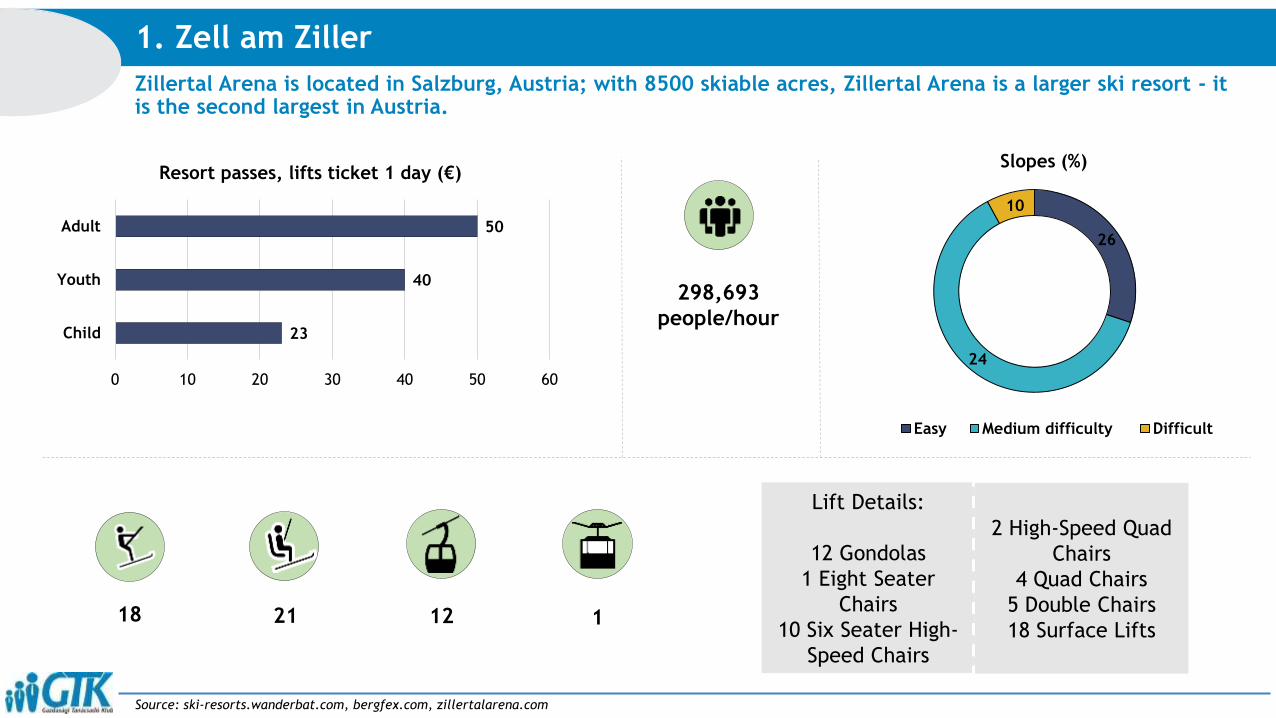
Zillertal Arena is located in Salzburg, Austria; with 8500 skiable acres, Zillertal Arena is a larger ski resort - it is the second largest in Austria.
1. Zell am Ziller
Source: ski-resorts.wanderbat.com, bergfex.com, zillertalarena.com
18 11221
298,693
people/hour
26
24
10
Slopes (%)
Easy Medium difficulty Difficult
23
40
50
0 10 20 30 40 50 60
Child
Youth
Adult
Resort passes, lifts ticket 1 day (€)
Lift Details:
12 Gondolas
1 Eight Seater
Chairs
10 Six Seater High-
Speed Chairs
2 High-Speed Quad
Chairs
4 Quad Chairs
5 Double Chairs
18 Surface Lifts
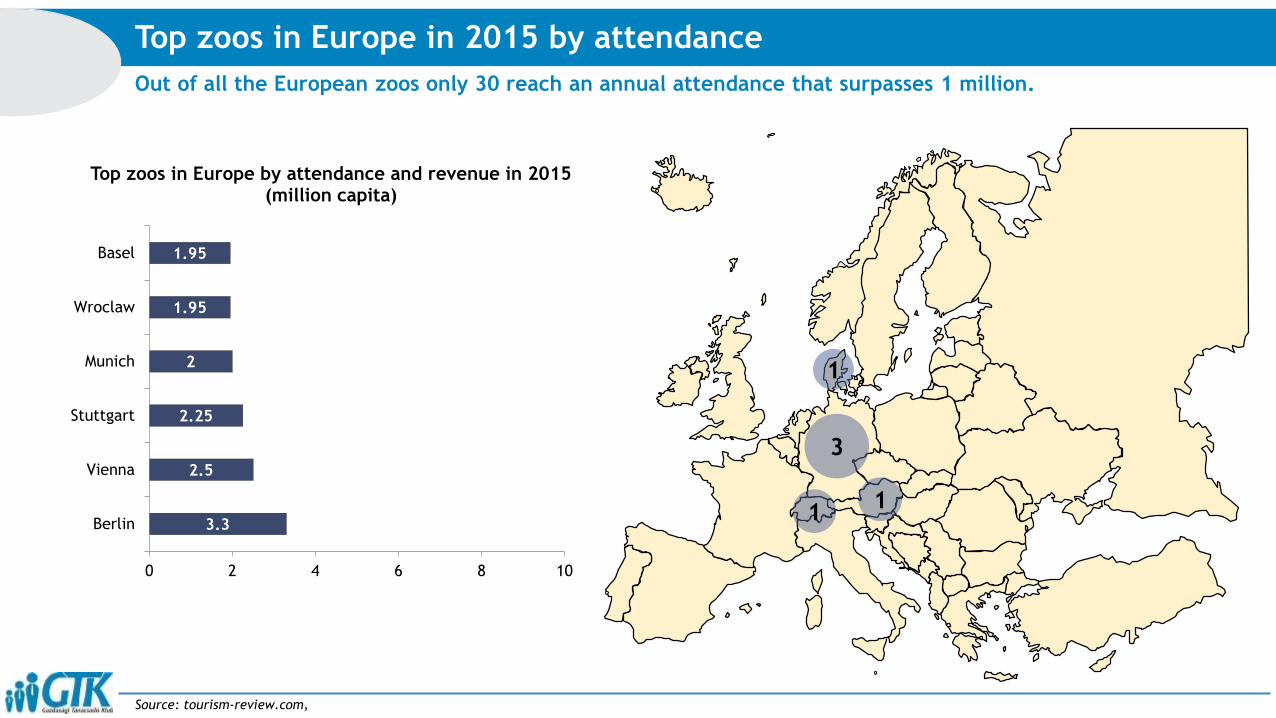
Out of all the European zoos only 30 reach an annual attendance that surpasses 1 million.
Top zoos in Europe in 2015 by attendance
Source: tourism-review.com,
3.3
2.5
2.25
2
1.95
1.95
0 2 4 6 8 10
Berlin
Vienna
Stuttgart
Munich
Wroclaw
Basel
Top zoos in Europe by attendance and revenue in 2015 (million capita)
1
3
1
1

The cumulated attendance in 2015 for top 20 amusement parks in Europe is above 6 million people. With thelowest being 1.4 million and the highest being 10.4 million people.
Top amusement parks in Europe in 2015 by attendance
Source: statista.com,
10.4
5.5
4.7
4.7
4.44
3.6
3.1
0.0 2.0 4.0 6.0 8.0 10.0
Disneyland Park
Europa Park
Tivoli Gardens
Efteling
Walt DisneyStudios Park
PortAventura
Leipzig
Top amusement parks in Europe by attendance and revenue in 2015 (million capita)
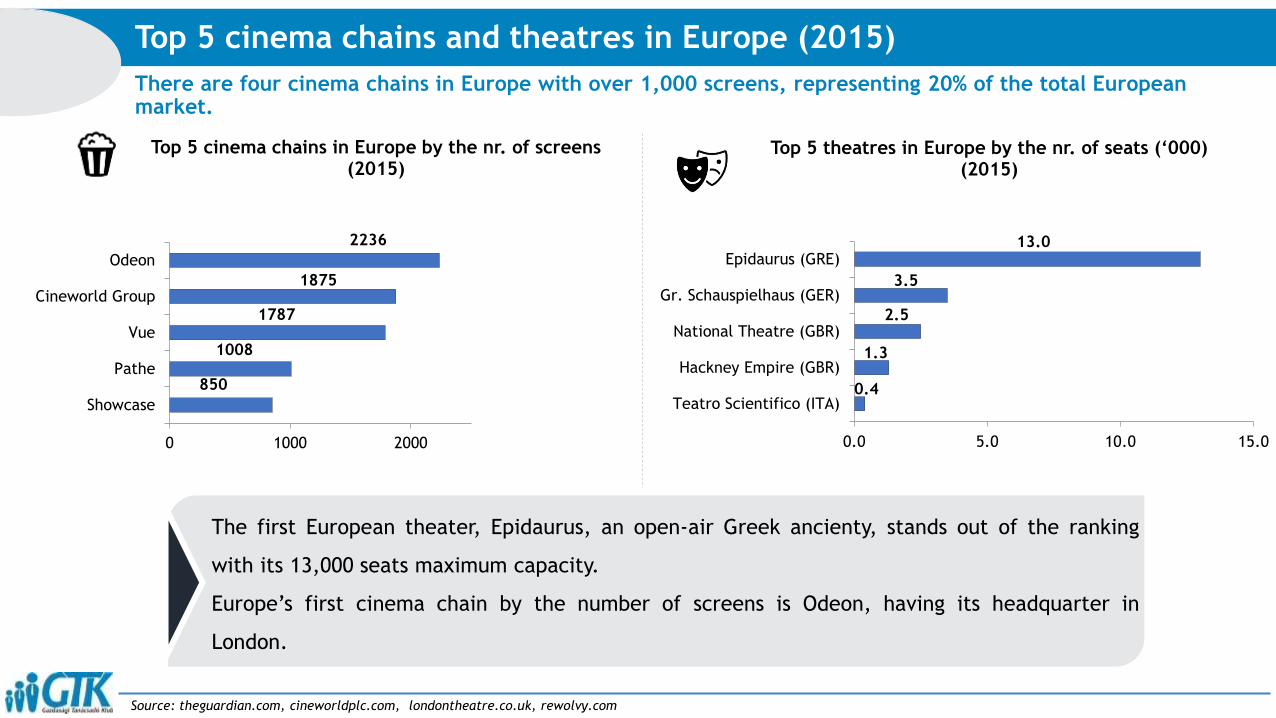
There are four cinema chains in Europe with over 1,000 screens, representing 20% of the total European market.
Top 5 cinema chains and theatres in Europe (2015)
850
1008
1787
1875
2236
0 1000 2000
Showcase
Pathe
Vue
Cineworld Group
Odeon
Top 5 cinema chains in Europe by the nr. of screens (2015)
0.4
1.3
2.5
3.5
13.0
0.0 5.0 10.0 15.0
Teatro Scientifico (ITA)
Hackney Empire (GBR)
National Theatre (GBR)
Gr. Schauspielhaus (GER)
Epidaurus (GRE)
Top 5 theatres in Europe by the nr. of seats (‘000)(2015)
The first European theater, Epidaurus, an open-air Greek ancienty, stands out of the ranking
with its 13,000 seats maximum capacity.
Europe’s first cinema chain by the number of screens is Odeon, having its headquarter in
London.
Source: theguardian.com, cineworldplc.com, londontheatre.co.uk, rewolvy.com
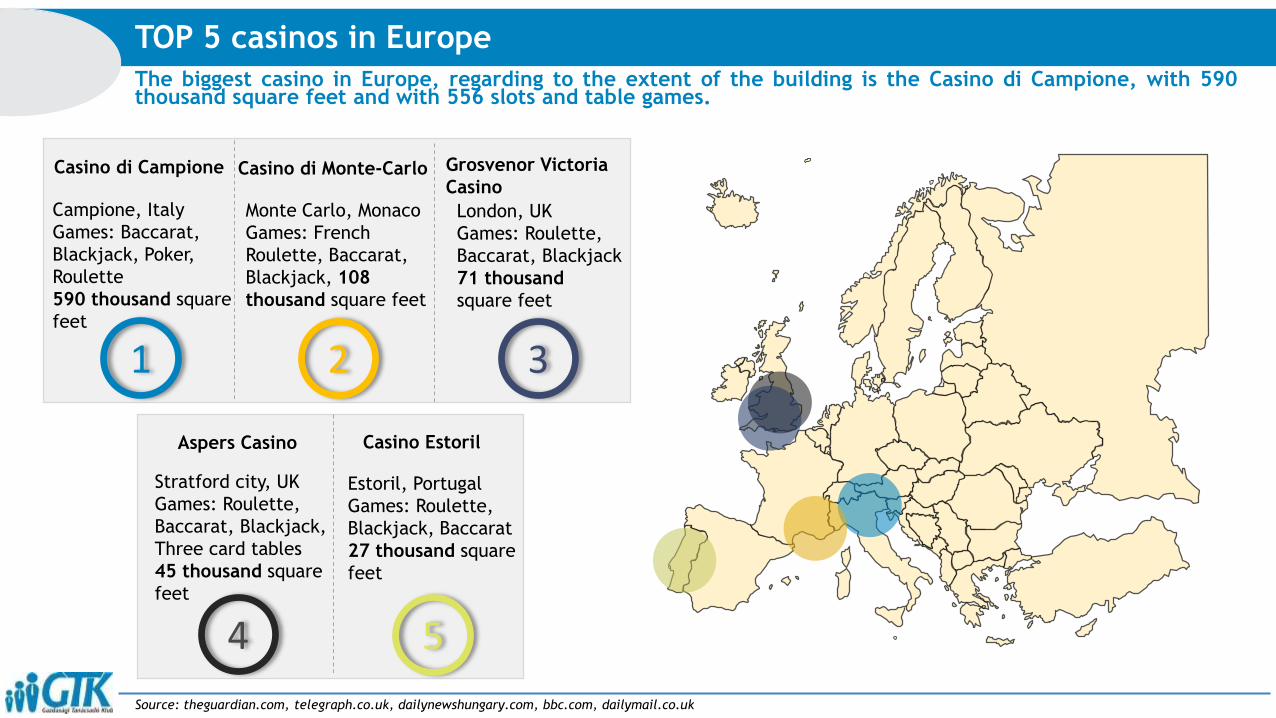
The biggest casino in Europe, regarding to the extent of the building is the Casino di Campione, with 590thousand square feet and with 556 slots and table games.
TOP 5 casinos in Europe
Source: theguardian.com, telegraph.co.uk, dailynewshungary.com, bbc.com, dailymail.co.uk
Aspers Casino Casino Estoril
Casino di Monte-Carlo Grosvenor Victoria
CasinoCasino di Campione
2 3
5
Estoril, Portugal
Games: Roulette,
Blackjack, Baccarat
27 thousand square
feet
Stratford city, UK
Games: Roulette,
Baccarat, Blackjack,
Three card tables
45 thousand square
feet
London, UK
Games: Roulette,
Baccarat, Blackjack
71 thousand
square feet
Monte Carlo, Monaco
Games: French
Roulette, Baccarat,
Blackjack, 108
thousand square feet
Campione, Italy
Games: Baccarat,
Blackjack, Poker,
Roulette
590 thousand square
feet
1
4
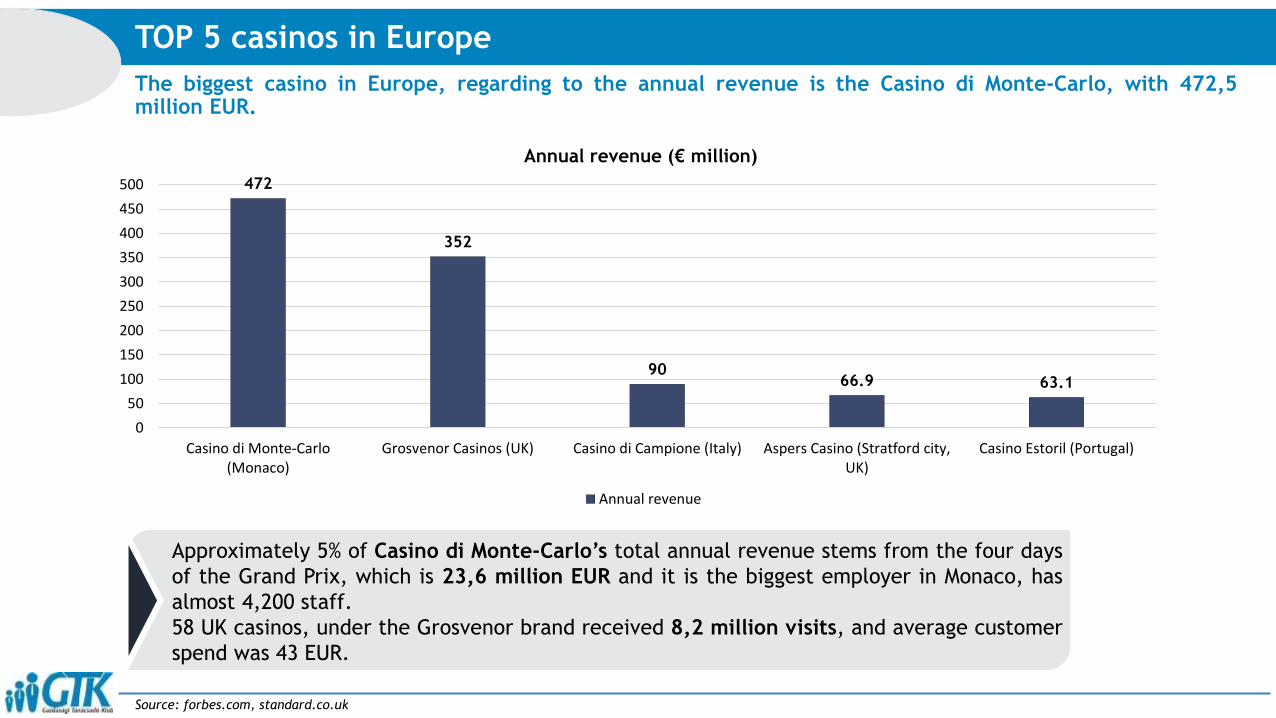
The biggest casino in Europe, regarding to the annual revenue is the Casino di Monte-Carlo, with 472,5million EUR.
TOP 5 casinos in Europe
Source: forbes.com, standard.co.uk
472
352
9066.9 63.1
0
50
100
150
200
250
300
350
400
450
500
Casino di Monte-Carlo(Monaco)
Grosvenor Casinos (UK) Casino di Campione (Italy) Aspers Casino (Stratford city,UK)
Casino Estoril (Portugal)
Annual revenue (€ million)
Annual revenue
Approximately 5% of Casino di Monte-Carlo’s total annual revenue stems from the four days
of the Grand Prix, which is 23,6 million EUR and it is the biggest employer in Monaco, has
almost 4,200 staff.
58 UK casinos, under the Grosvenor brand received 8,2 million visits, and average customer
spend was 43 EUR.

The largest festival in Europe, regarding to the number of visitors is the Sziget festival, with 441 thousand ofvisitors (2015) and with a revenue of 19 million EUR.
TOP 5 festivals in Europe
Source: maltatheguardian.com, telegraph.co.uk, dailynewshungary.com, bbc.com, dailymail.co.uk
Glastonbury
festival
Sziget
festival Exit festival
Tomorrowland
Secret Garden
Festival
30
135
190
360
441
0 200 400 600
SecretGarden…
Glastonbury…
Exitfestival
Tomorrowland
Szigetfestival
Number of visitors (thousand)
275
230
95
250
275
0100200300
Ticket price (€)
Top 5 festivals in Europe, 2015
The Sziget festival is the most visited festival in
Europe, and one 7-day pass ticket price is 275 €, one
Secret Garden Party ticket has the same price, but also
that festival it’s not as popular as the Sziget.
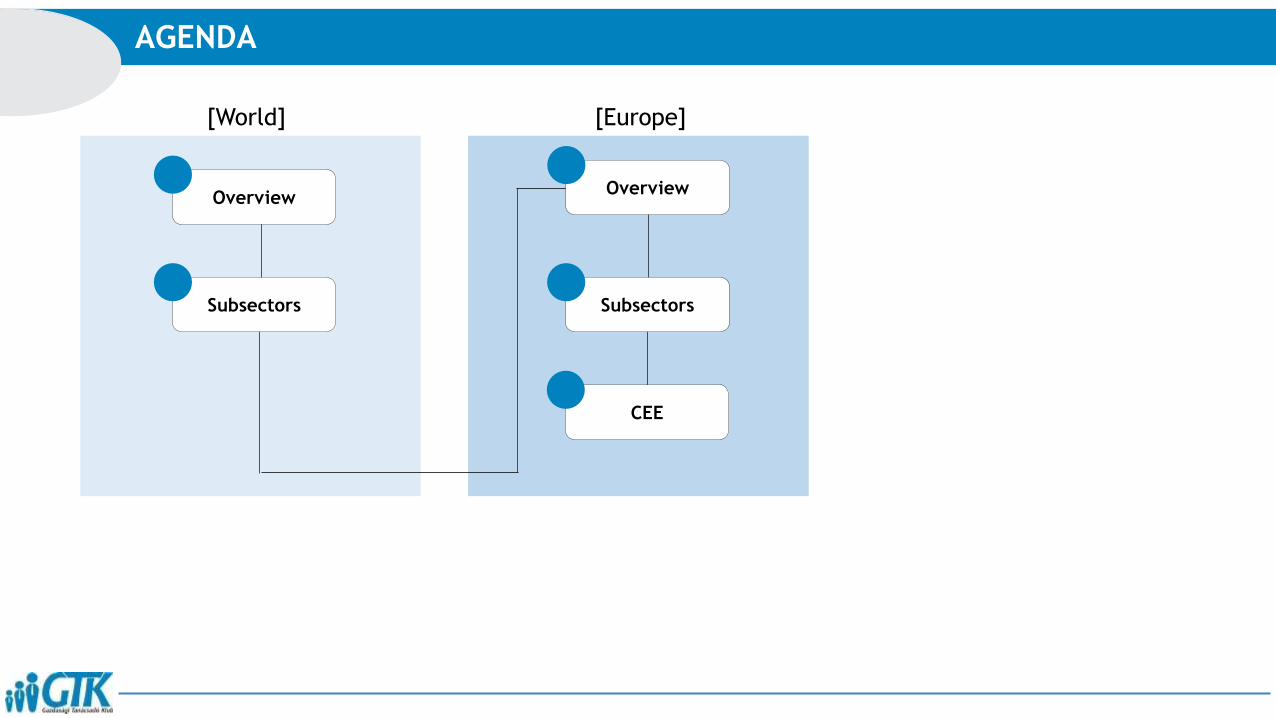
AGENDA
[World] [Europe]
Overview
Subsectors
CEE
Overview
Subsectors
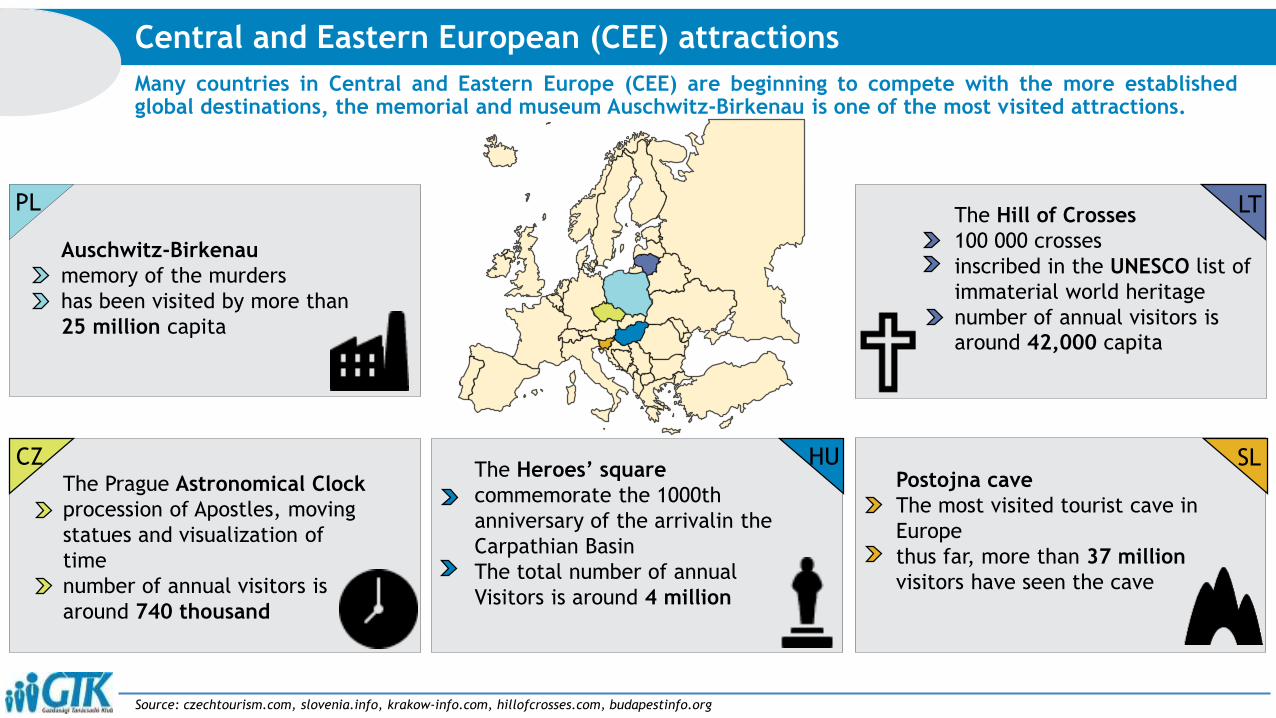
Many countries in Central and Eastern Europe (CEE) are beginning to compete with the more establishedglobal destinations, the memorial and museum Auschwitz-Birkenau is one of the most visited attractions.
Central and Eastern European (CEE) attractions
Source: czechtourism.com, slovenia.info, krakow-info.com, hillofcrosses.com, budapestinfo.org
HUThe Heroes’ square
commemorate the 1000th
anniversary of the arrivalin the
Carpathian Basin
The total number of annual
Visitors is around 4 million
The Hill of Crosses
100 000 crosses
inscribed in the UNESCO list of
immaterial world heritage
number of annual visitors is
around 42,000 capita
Auschwitz-Birkenau
memory of the murders
has been visited by more than
25 million capita
PL
The Prague Astronomical Clock
procession of Apostles, moving
statues and visualization of
time
number of annual visitors is
around 740 thousand
CZ
LT
SLPostojna cave
The most visited tourist cave in
Europe
thus far, more than 37 million
visitors have seen the cave

Budapest was the most popular Eastern European tourist destination with 9,8 million overnight stays in 2015an it’s followed by Dubrovnik, Tallin, Ljubljana and Kotor.
Eastern European tourist destinations
Source: visitljubljana.com; visittallin.ee; thedubrovniktimes.com;pro-pr.com; itthon.hu
0.35
1.19
2.8
3.3
9.8
0 2 4 6 8 10 12
Kotor
Ljubljana
Tallin
Dubrovnik
Budapest
Overnight stays in the top 5 Eastern European citys in 2015 (million)
Being a budget-friendly and culturally active tourist destination, Eastern European cities and attractions attract
more tourists every year, because of their intermediate price-to-quality ratio.

In the Central and Eastern European region the 2 most visited UNESCO World Heritage Sites are in Poland.
Source:worldofwanderlust.com/
The top 10 CEE UNESCO World Heritage Sites by visitors
Krakow Historic…
Warsaw Historic…
Prague Castle
Buda Castle
Plitvice Lakes
Lake Bled
Cesky Krumlov…
Historic centre of…
Mostar
Kutna Hora Centre
Top 10 Most visited Heritage Sites in categories
<1000000
5-8000000
1-5000000
>8000000

Kraków is a massive tourist drawcard in Poland as it is truly one of the most beautiful cities in the entire country,and it’s historical centre is UNESCO World Heritage.
Source:worldofwanderlust.com
1. Kraków Historic Centre
Mostly hotels:
~80-650 EUR/nightPolandVisitors/year: ~10.050.000First mentioned: 9th century
In the 14th century, over 40 streets in Kraków already
had their own names. Kraków, the most famous and
most wonderful city in the whole of Poland celebrated
in 2007 the 750th anniversary of obtaining city rights.
It is still one of the most magical cities of Europe.
Although visitor numbers are up, spending is down, as
while tourists spent over PLN 4.45 billion (EUR 1
billion), this was PLN 50 million less than in 2014. Of
the 10,050,000 visitors to Kraków, over 7.4 million
were Polish tourists, while over 2.6 million were from
abroad.
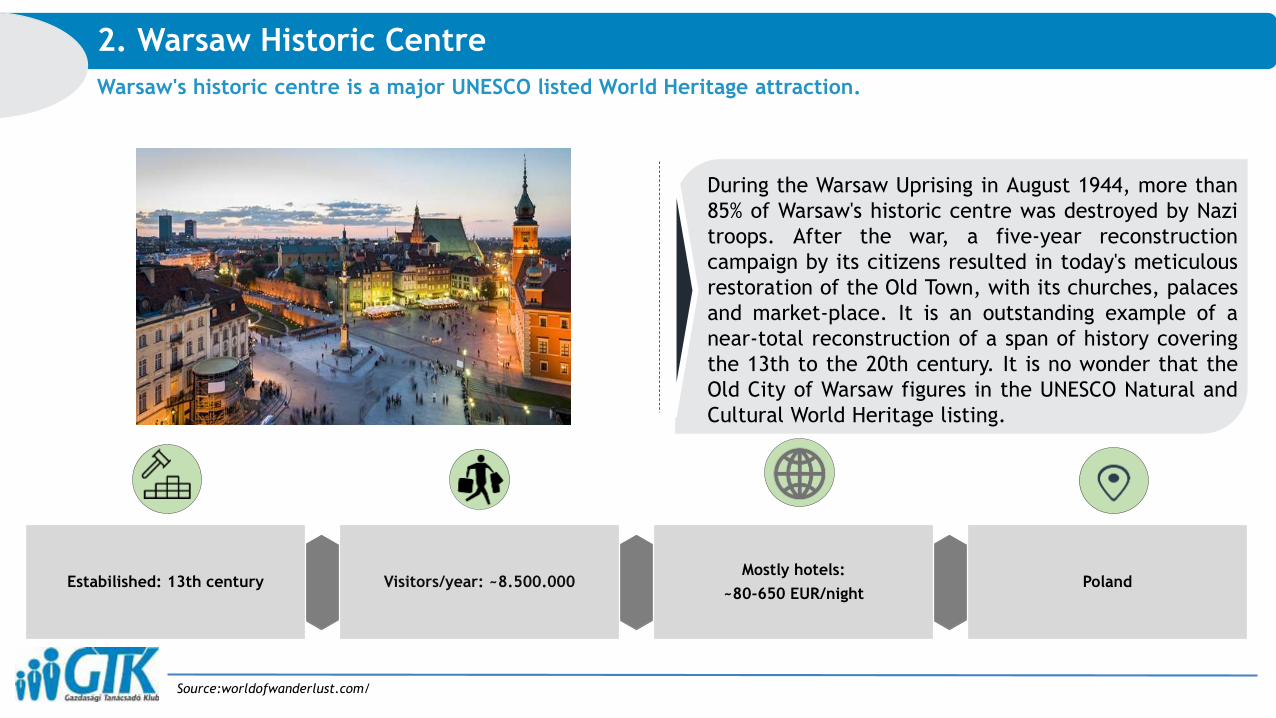
Warsaw's historic centre is a major UNESCO listed World Heritage attraction.
Source:worldofwanderlust.com/
2. Warsaw Historic Centre
Mostly hotels:
~80-650 EUR/nightPolandVisitors/year: ~8.500.000Estabilished: 13th century
During the Warsaw Uprising in August 1944, more than
85% of Warsaw's historic centre was destroyed by Nazi
troops. After the war, a five-year reconstruction
campaign by its citizens resulted in today's meticulous
restoration of the Old Town, with its churches, palaces
and market-place. It is an outstanding example of a
near-total reconstruction of a span of history covering
the 13th to the 20th century. It is no wonder that the
Old City of Warsaw figures in the UNESCO Natural and
Cultural World Heritage listing.
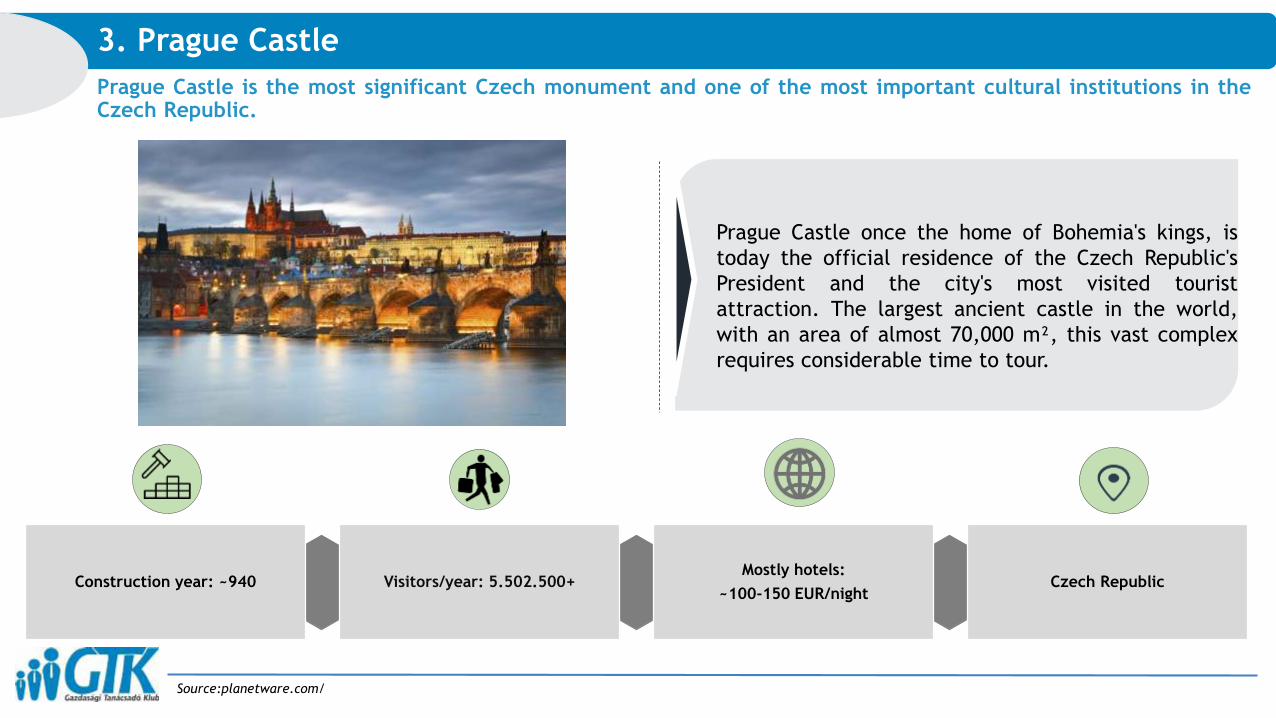
Prague Castle is the most significant Czech monument and one of the most important cultural institutions in theCzech Republic.
Source:planetware.com/
3. Prague Castle
Mostly hotels:
~100-150 EUR/nightCzech RepublicVisitors/year: 5.502.500+Construction year: ~940
Prague Castle once the home of Bohemia's kings, is
today the official residence of the Czech Republic's
President and the city's most visited tourist
attraction. The largest ancient castle in the world,
with an area of almost 70,000 m², this vast complex
requires considerable time to tour.
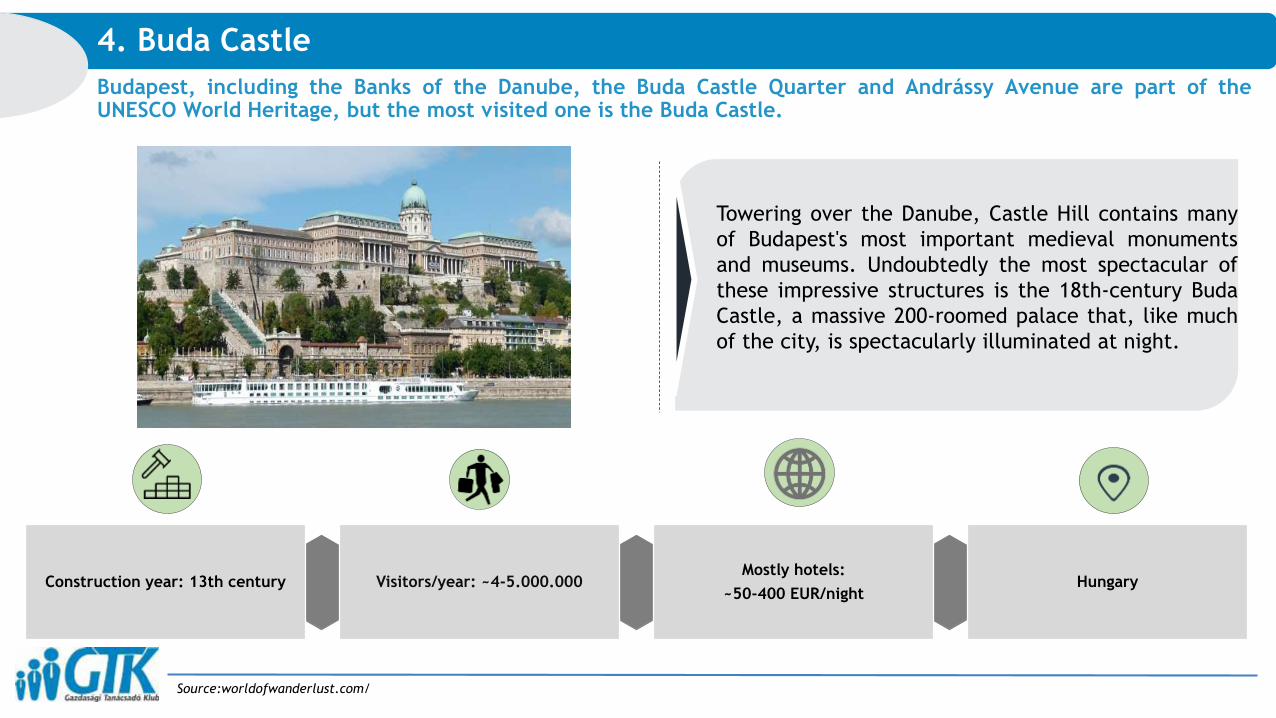
Budapest, including the Banks of the Danube, the Buda Castle Quarter and Andrássy Avenue are part of theUNESCO World Heritage, but the most visited one is the Buda Castle.
Source:worldofwanderlust.com/
4. Buda Castle
Mostly hotels:
~50-400 EUR/nightHungaryVisitors/year: ~4-5.000.000Construction year: 13th century
Towering over the Danube, Castle Hill contains many
of Budapest's most important medieval monuments
and museums. Undoubtedly the most spectacular of
these impressive structures is the 18th-century Buda
Castle, a massive 200-roomed palace that, like much
of the city, is spectacularly illuminated at night.
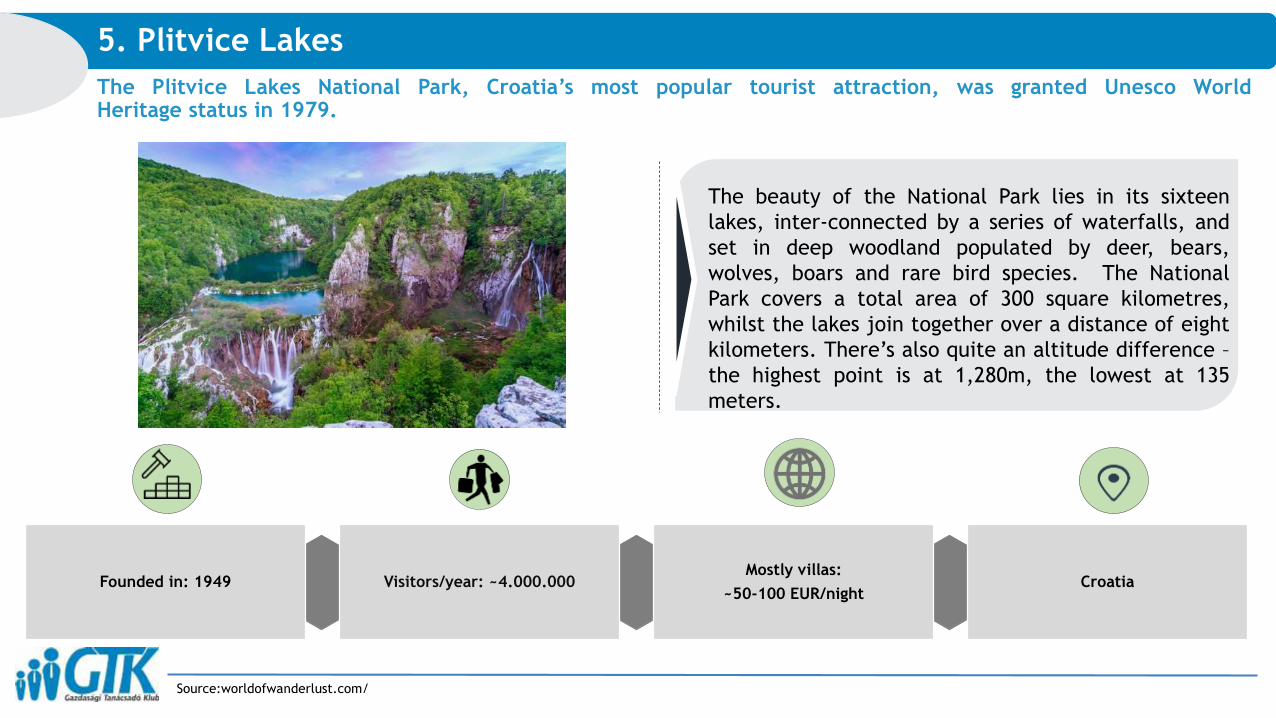
The Plitvice Lakes National Park, Croatia’s most popular tourist attraction, was granted Unesco WorldHeritage status in 1979.
Source:worldofwanderlust.com/
5. Plitvice Lakes
Mostly villas:
~50-100 EUR/nightCroatiaVisitors/year: ~4.000.000Founded in: 1949
The beauty of the National Park lies in its sixteen
lakes, inter-connected by a series of waterfalls, and
set in deep woodland populated by deer, bears,
wolves, boars and rare bird species. The National
Park covers a total area of 300 square kilometres,
whilst the lakes join together over a distance of eight
kilometers. There’s also quite an altitude difference –
the highest point is at 1,280m, the lowest at 135
meters.

The most visited was Tatra National Park with 3 million visitors, but Sumava National Park (2 million) andTriglav National Park (1,6 million) also had a high number of tourists.
TOP 10 natural attractions in Central and Eastern Europe
Source: poland.pl, sumava.com, index.hr, tnp.si, sloveniatimes.com, vraji.sk, wieliczka-saltminde.com, ghiduri-turistice.info, whc.unesco.org, wordpress.com,
TOP 5 natural attractions location
The most popular natural attractions from CEE are mainly situated in more visited countries, like
Poland, Czech Republic, Croatia. In Romania there are also places with lot of visitors, especially Salina
Turda and the Danube Delta.
0.3
0.36
0.37
0.6
0.7
1.29
1.36
1.6
2
3
0 1 2 3 4
Caves of Aggtelek Karst (HUN)
Danube Delta (ROU)
Salina Turda (ROU)
Postojna Cave (SVN)
Slovak Paradise (SVK)
Wieliczka Salt Mine (POL)
Plitvice Lakes (HRV)
Triglav National Park (SVN)
Sumava National Park (CZE)
Tatra National Park (POL)
Nr. of visitors in CEE TOP 10 natural attractions (milion capita)

Population: 3,51 mil.
GDP/capita : $5,000
Tourists/year: 11,000
Contribution to GDP: 0,9%
Accommodations : 2,712
Is analyzed Romania and his surrouindig countries based on imortant competitive data. Appear the populationnumber, th GDP, number of turists, contribution to GDP, accomodation and motorways.
Romanian surrounding countries analysis 2015
Source: flightradar24.com, indexmundi.com, nsi.bg, magyarorszag.autopalyan.hu, ksh.hu/stadat_annual_4_5,
BulgariaSerbia
Moldova
UkraineHungary Romania
Population: 9,87 mil.
GDP/capita : $26,200
Tourists/year: 14,32 mil.
Contribution to GDP: 3,9%
Accommodations : 3,927
Motorways: 206 15 16
2 1 4
Population: *7,14 mil.
GDP/capita : $13,700
Tourists/year: 1,13 mil.
Contribution to GDP: 2,1%
Accommodations : 1,802
Motorways: 7
Population: 7,14 mil.
GDP/capita: $19,100
Tourists/year: 7, 31 mil.
Contribution to GDP: 3,7%
Accommodations: 3,202
Motorways: 7
Population: 44,2 mil.
GDP/capita: $7,500
Tourists/year: 12,43 mil.
Contribution to GDP: 1,9%
Accommodations: 6,412
Motorways: 9
Population: 21,6 mil.
GDP/capita : $20,800
Tourists/year: 9,9 mil. (+17.2%)
Contribution to GDP: 1,6%
Accommodations : 6,800
Motorways: 4
*does not include the population of Kosovo
Motorways: 0
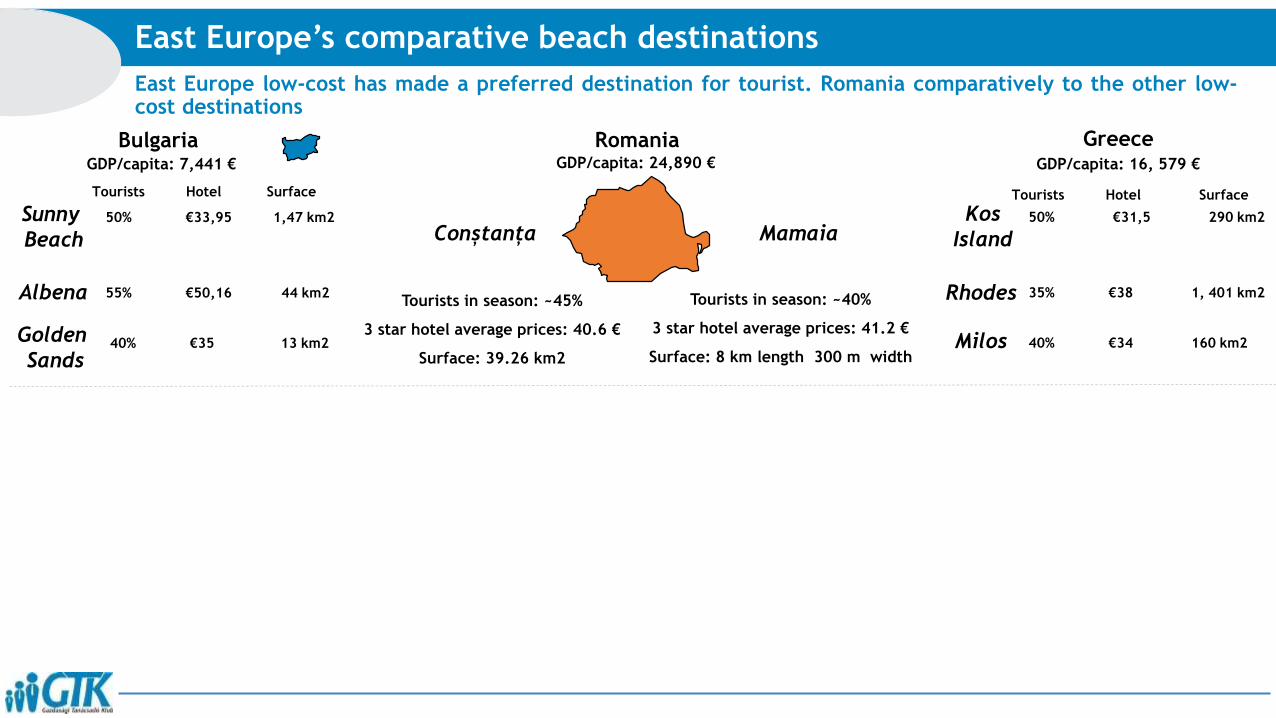
East Europe low-cost has made a preferred destination for tourist. Romania comparatively to the other low-cost destinations
East Europe’s comparative beach destinations
RomaniaGDP/capita: 24,890 €
Tourists in season: ~45%
3 star hotel average prices: 40.6 €
Surface: 39.26 km2
Tourists in season: ~40%
3 star hotel average prices: 41.2 €
Surface: 8 km length 300 m width
Conștanța Mamaia
Bulgaria GDP/capita: 7,441 €
Sunny
Beach
Albena
Golden
Sands
Tourists Hotel Surface
50% €33,95 1,47 km2
55% €50,16 44 km2
40% €35 13 km2
GreeceGDP/capita: 16, 579 €
Kos
Island
Rhodes
Milos
Tourists Hotel Surface
50% €31,5 290 km2
35% €38 1, 401 km2
40% €34 160 km2
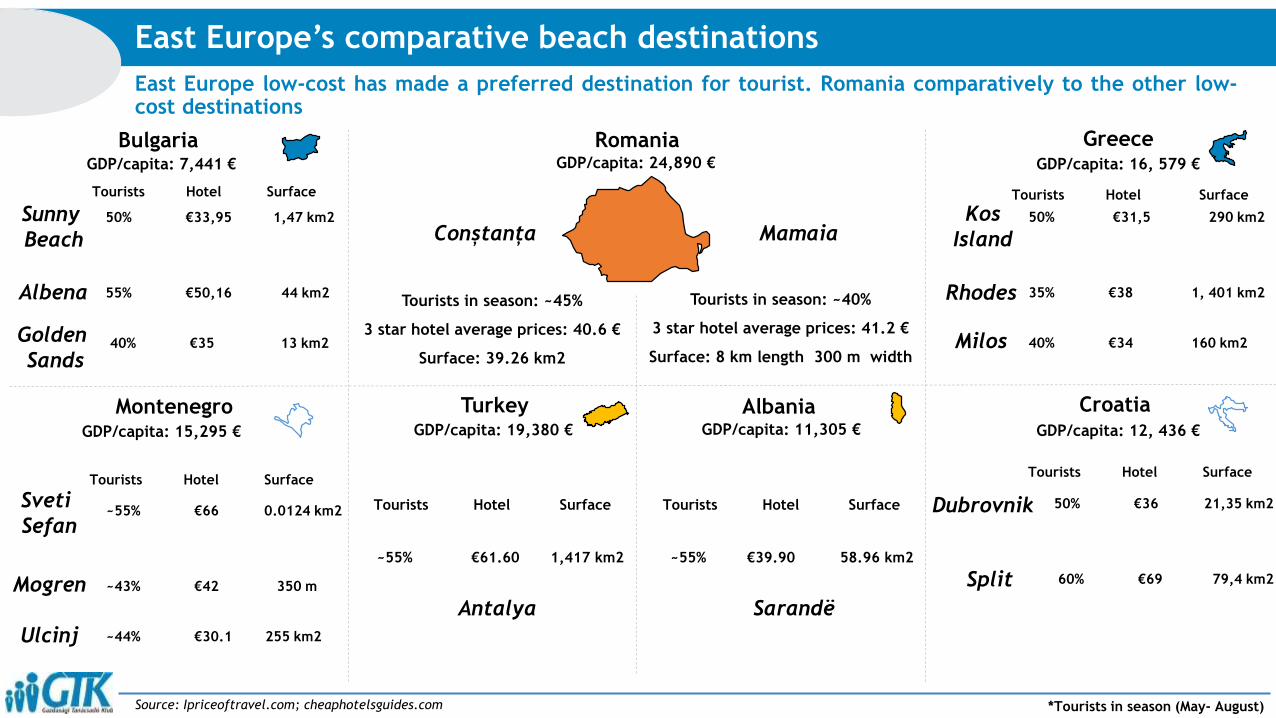
East Europe low-cost has made a preferred destination for tourist. Romania comparatively to the other low-cost destinations
East Europe’s comparative beach destinations
Source: Ipriceoftravel.com; cheaphotelsguides.com
RomaniaGDP/capita: 24,890 €
Tourists in season: ~45%
3 star hotel average prices: 40.6 €
Surface: 39.26 km2
Tourists in season: ~40%
3 star hotel average prices: 41.2 €
Surface: 8 km length 300 m width
*Tourists in season (May- August)
Conștanța Mamaia
SarandëAntalyaMogren
TurkeyGDP/capita: 19,380 €
Tourists Hotel Surface
~55% €61.60 1,417 km2
AlbaniaGDP/capita: 11,305 €
Tourists Hotel Surface
~55% €39.90 58.96 km2
MontenegroGDP/capita: 15,295 €
Sveti
Sefan
Ulcinj
~55% €66 0.0124 km2
~43% €42 350 m
~44% €30.1 255 km2
Tourists Hotel Surface
Bulgaria GDP/capita: 7,441 €
Sunny
Beach
Albena
Golden
Sands
Tourists Hotel Surface
50% €33,95 1,47 km2
55% €50,16 44 km2
40% €35 13 km2
GreeceGDP/capita: 16, 579 €
Kos
Island
Rhodes
Milos
Tourists Hotel Surface
50% €31,5 290 km2
35% €38 1, 401 km2
40% €34 160 km2
Croatia GDP/capita: 12, 436 €
Dubrovnik
Split
Tourists Hotel Surface
50% €36 21,35 km2
60% €69 79,4 km2
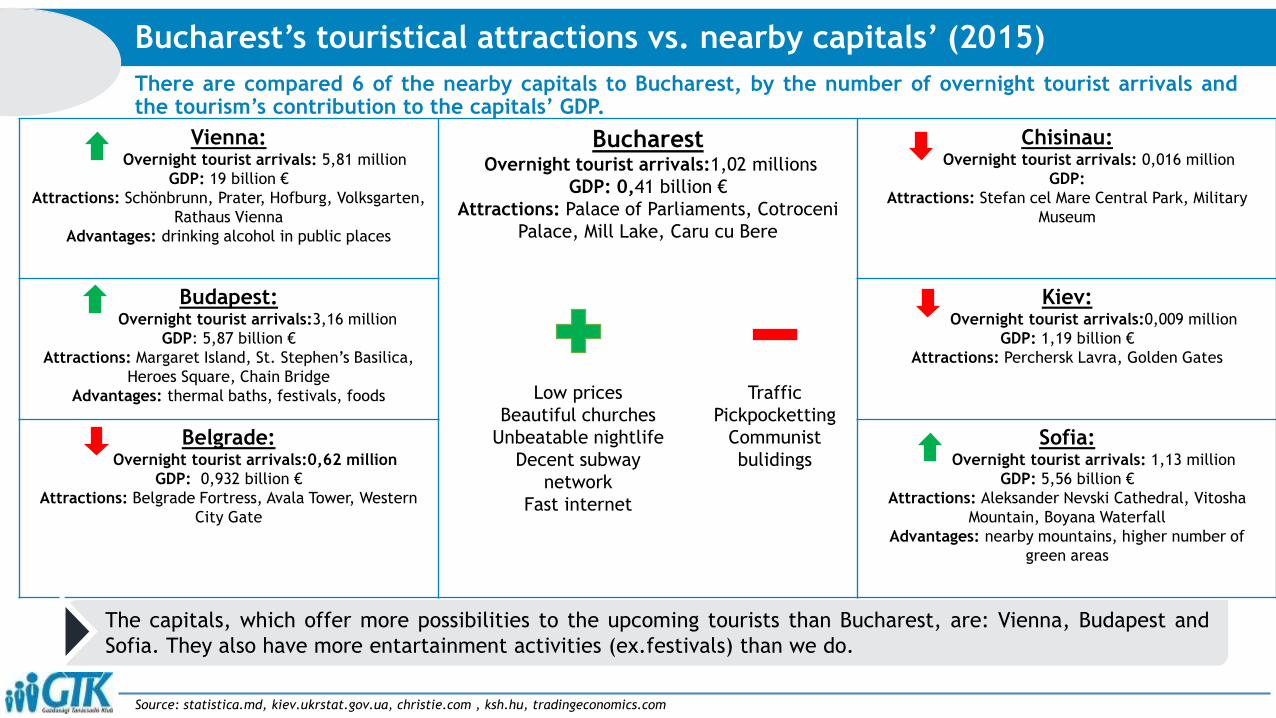
There are compared 6 of the nearby capitals to Bucharest, by the number of overnight tourist arrivals andthe tourism’s contribution to the capitals’ GDP.
Bucharest’s touristical attractions vs. nearby capitals’ (2015)
Source: statistica.md, kiev.ukrstat.gov.ua, christie.com , ksh.hu, tradingeconomics.com
Vienna:Overnight tourist arrivals: 5,81 million
GDP: 19 billion €
Attractions: Schönbrunn, Prater, Hofburg, Volksgarten,
Rathaus Vienna
Advantages: drinking alcohol in public places
BucharestOvernight tourist arrivals:1,02 millions
GDP: 0,41 billion €
Attractions: Palace of Parliaments, Cotroceni
Palace, Mill Lake, Caru cu Bere
Chisinau:Overnight tourist arrivals: 0,016 million
GDP:
Attractions: Stefan cel Mare Central Park, Military
Museum
Budapest:Overnight tourist arrivals:3,16 million
GDP: 5,87 billion €
Attractions: Margaret Island, St. Stephen’s Basilica,
Heroes Square, Chain Bridge
Advantages: thermal baths, festivals, foods
Kiev:Overnight tourist arrivals:0,009 million
GDP: 1,19 billion €
Attractions: Perchersk Lavra, Golden Gates
Belgrade:Overnight tourist arrivals:0,62 million
GDP: 0,932 billion €
Attractions: Belgrade Fortress, Avala Tower, Western
City Gate
Sofia:Overnight tourist arrivals: 1,13 million
GDP: 5,56 billion €
Attractions: Aleksander Nevski Cathedral, Vitosha
Mountain, Boyana Waterfall
Advantages: nearby mountains, higher number of
green areas
Low prices
Beautiful churches
Unbeatable nightlife
Decent subway
network
Fast internet
Traffic
Pickpocketting
Communist
bulidings
The capitals, which offer more possibilities to the upcoming tourists than Bucharest, are: Vienna, Budapest and
Sofia. They also have more entartainment activities (ex.festivals) than we do.
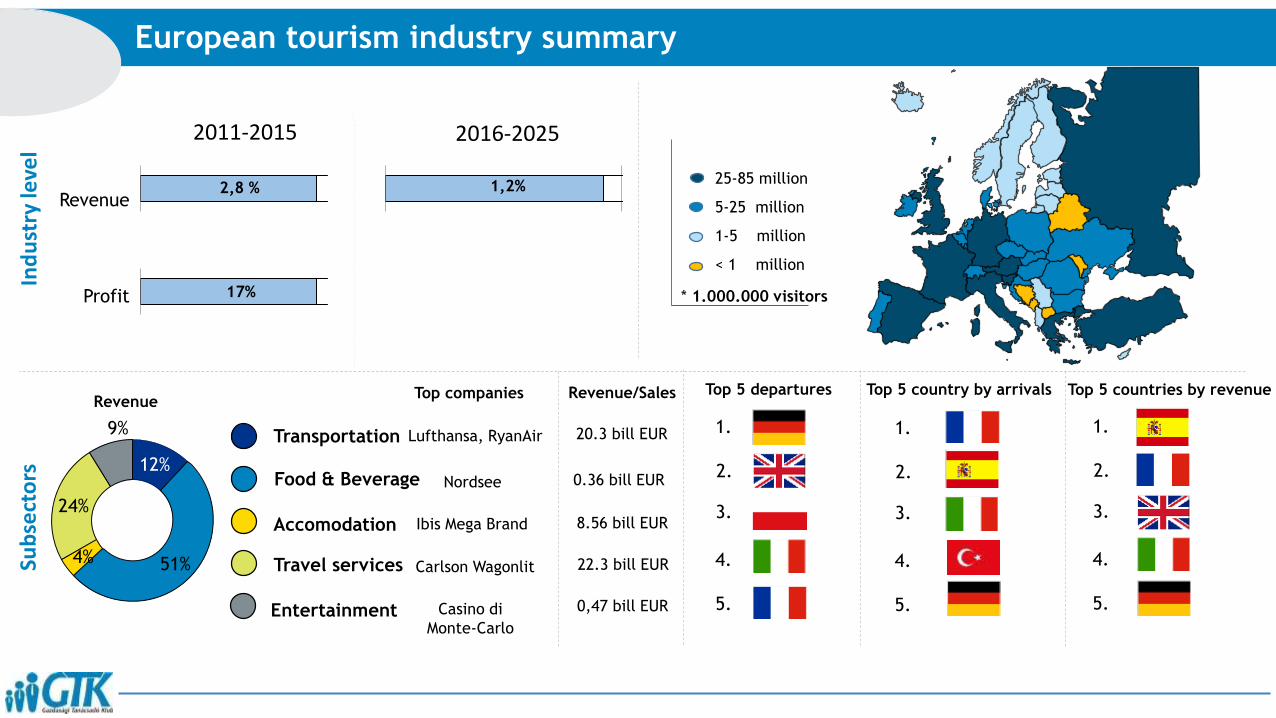
European tourism industry summaryIn
du
stry
leve
l
2,8 %Revenue
Profit
2011-2015 2016-2025
1,2%
17%
12%
51%4%
24%
9%
Revenue
Food & Beverage
Accomodation
Travel services
Entertainment
Top companies Revenue/Sales
Transportation
Sub
sect
ors
Top 5 departures Top 5 country by arrivals Top 5 countries by revenue
25-85 million
5-25 million
1-5 million
< 1 million
* 1.000.000 visitors
Lufthansa, RyanAir
Carlson Wagonlit
Nordsee
Ibis Mega Brand
Casino di
Monte-Carlo
20.3 bill EUR
22.3 bill EUR
0.36 bill EUR
8.56 bill EUR
0,47 bill EUR
1.
2.
3.
4.
5.
1.
2.
3.
4.
5.
1.
2.
3.
4.
5.
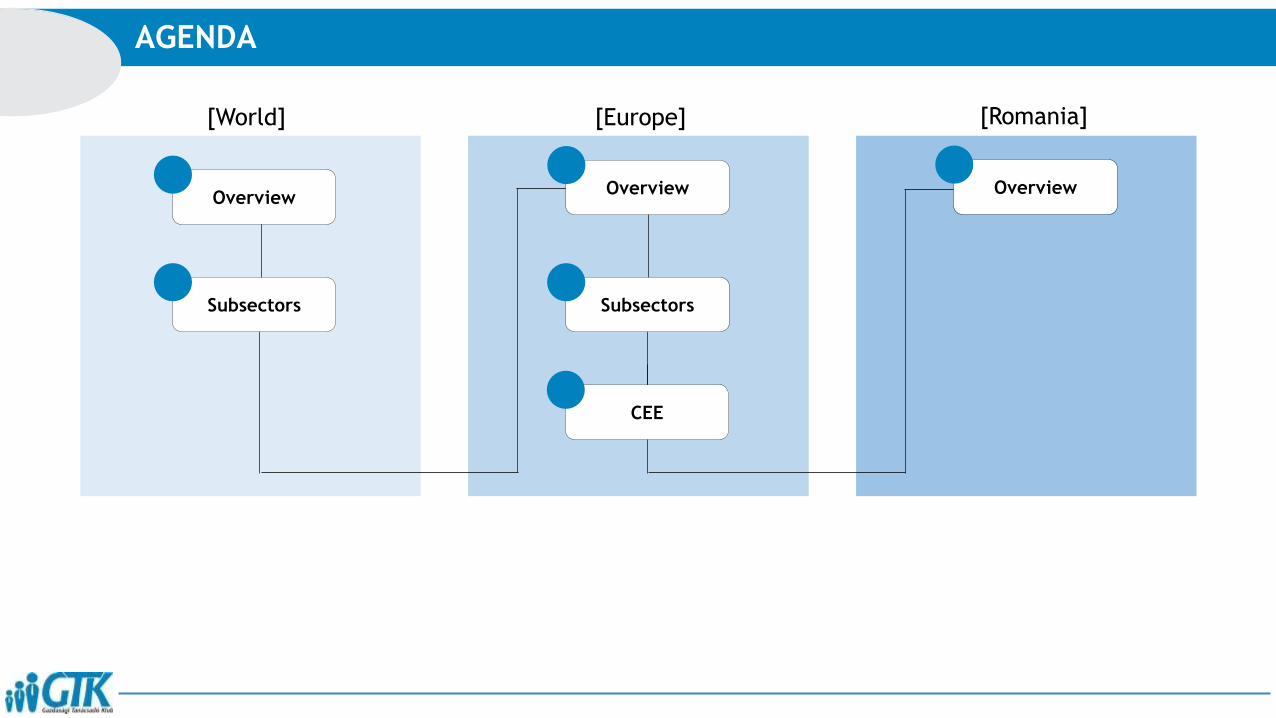
AGENDA
[World] [Europe] [Romania]
Overview
Subsectors
CEE
OverviewOverview
Subsectors

Source:
Compared to the main industries in Romania, tourism falls way back, but expectedly it will have a growing tendency following the next few years.
The total tourism turnover in Romania (2015)
Romania-Insider.ro, innse.ro, ec.europa.eu, knoema.com, outsourcing-today.com, europaproprety.com
Beside the other sectors the tourism sector is on the bottom of the list by the yearly revenue of 1.02 € billion
and compared to Romania’s GDP it is only 0,7 percent out of it.
22.5
18.7
12.46
6.23
5.051.02
The top industries by revenue in 2015(Є billion)
Industry Public administration
Construction Banking
Agriculture Tourism
1.02
160.4
The size of the Tourism industry in 2015(Є billion)
Tourism
Romania GDP
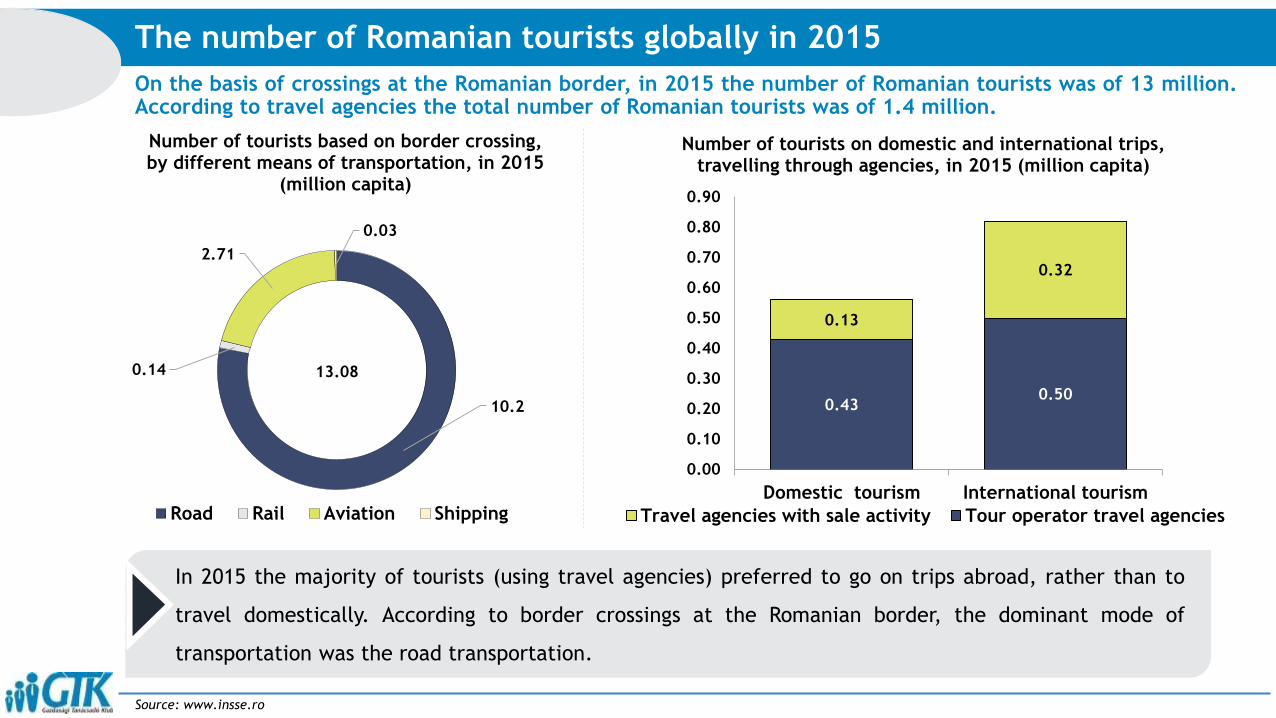
On the basis of crossings at the Romanian border, in 2015 the number of Romanian tourists was of 13 million.According to travel agencies the total number of Romanian tourists was of 1.4 million.
The number of Romanian tourists globally in 2015
Source: www.insse.ro
0.430.50
0.13
0.32
0.00
0.10
0.20
0.30
0.40
0.50
0.60
0.70
0.80
0.90
Domestic tourism International tourism
Number of tourists on domestic and international trips, travelling through agencies, in 2015 (million capita)
Travel agencies with sale activity Tour operator travel agencies
10.2
0.14
2.71
0.03
Number of tourists based on border crossing, by different means of transportation, in 2015
(million capita)
Road Rail Aviation Shipping
13.08
In 2015 the majority of tourists (using travel agencies) preferred to go on trips abroad, rather than to
travel domestically. According to border crossings at the Romanian border, the dominant mode of
transportation was the road transportation.
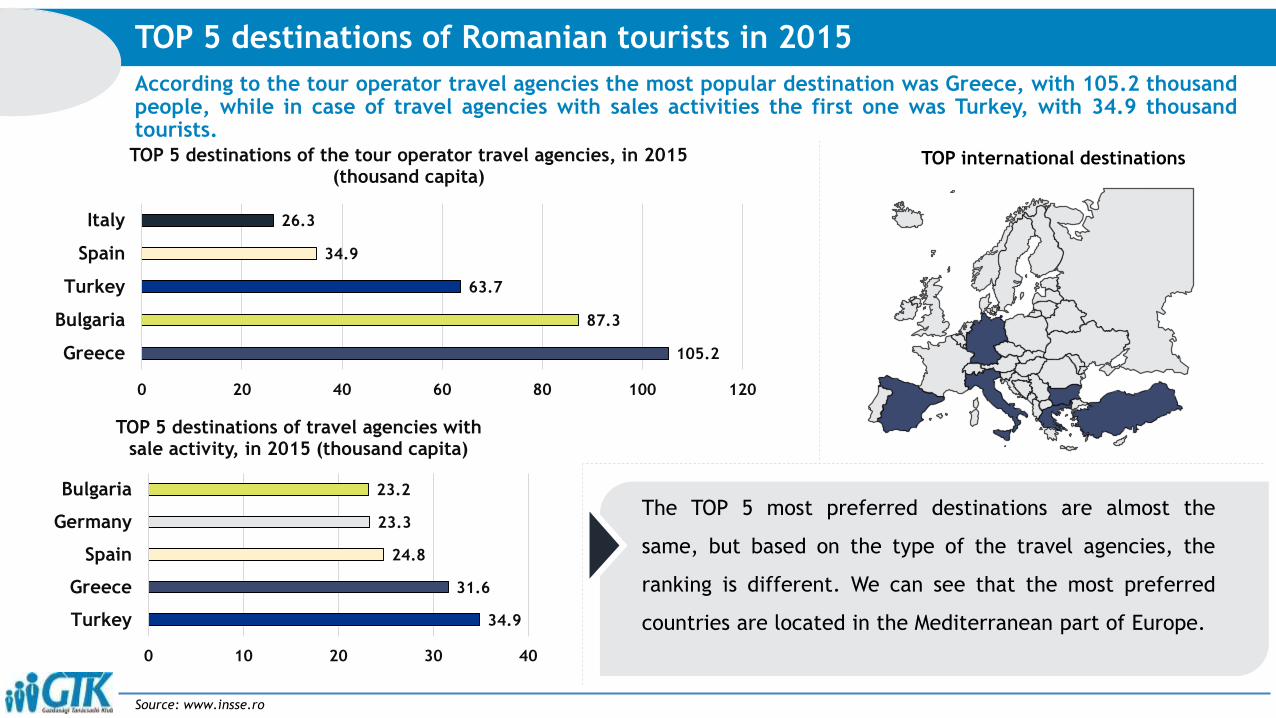
According to the tour operator travel agencies the most popular destination was Greece, with 105.2 thousandpeople, while in case of travel agencies with sales activities the first one was Turkey, with 34.9 thousandtourists.
TOP 5 destinations of Romanian tourists in 2015
Source: www.insse.ro
105.2
87.3
63.7
34.9
26.3
0 20 40 60 80 100 120
Greece
Bulgaria
Turkey
Spain
Italy
TOP 5 destinations of the tour operator travel agencies, in 2015 (thousand capita)
34.9
31.6
24.8
23.3
23.2
0 10 20 30 40
Turkey
Greece
Spain
Germany
Bulgaria
TOP 5 destinations of travel agencies with sale activity, in 2015 (thousand capita)
The TOP 5 most preferred destinations are almost the
same, but based on the type of the travel agencies, the
ranking is different. We can see that the most preferred
countries are located in the Mediterranean part of Europe.
TOP international destinations
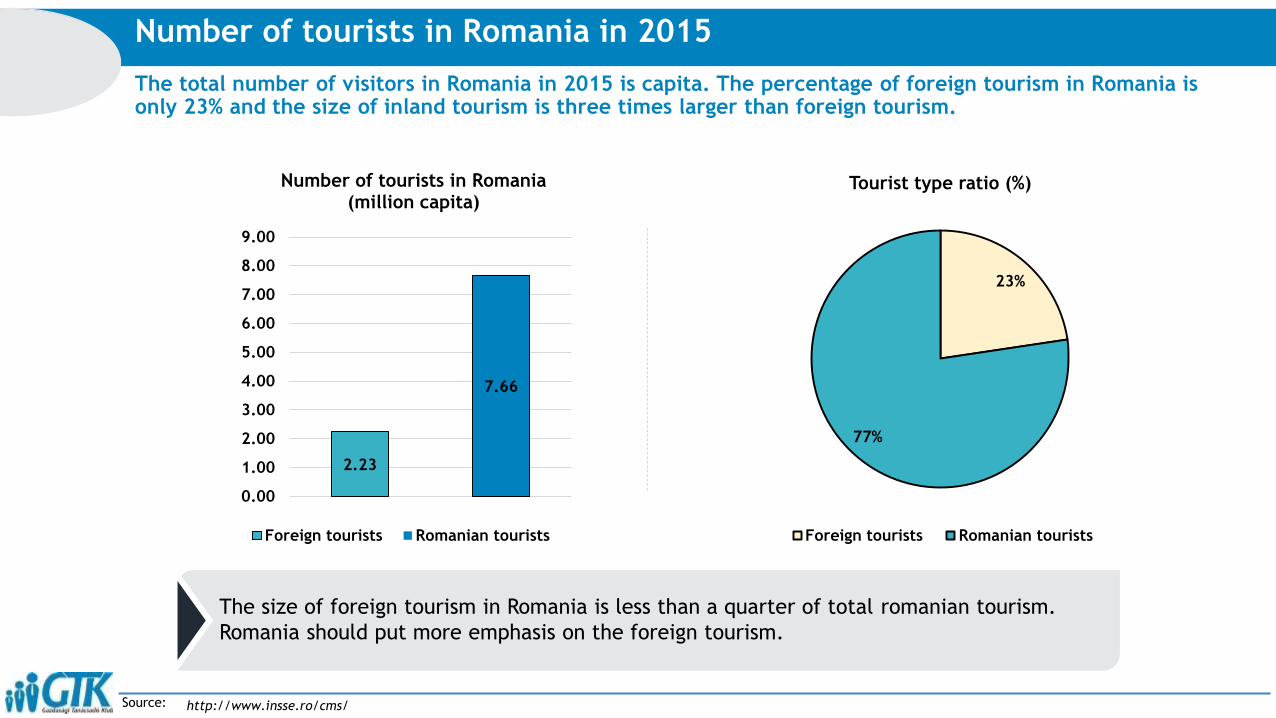
Source:
The total number of visitors in Romania in 2015 is capita. The percentage of foreign tourism in Romania is only 23% and the size of inland tourism is three times larger than foreign tourism.
Number of tourists in Romania in 2015
2.23
7.66
0.00
1.00
2.00
3.00
4.00
5.00
6.00
7.00
8.00
9.00
Number of tourists in Romania (million capita)
Foreign tourists Romanian tourists
23%
77%
Tourist type ratio (%)
Foreign tourists Romanian tourists
The size of foreign tourism in Romania is less than a quarter of total romanian tourism.
Romania should put more emphasis on the foreign tourism.
http://www.insse.ro/cms/
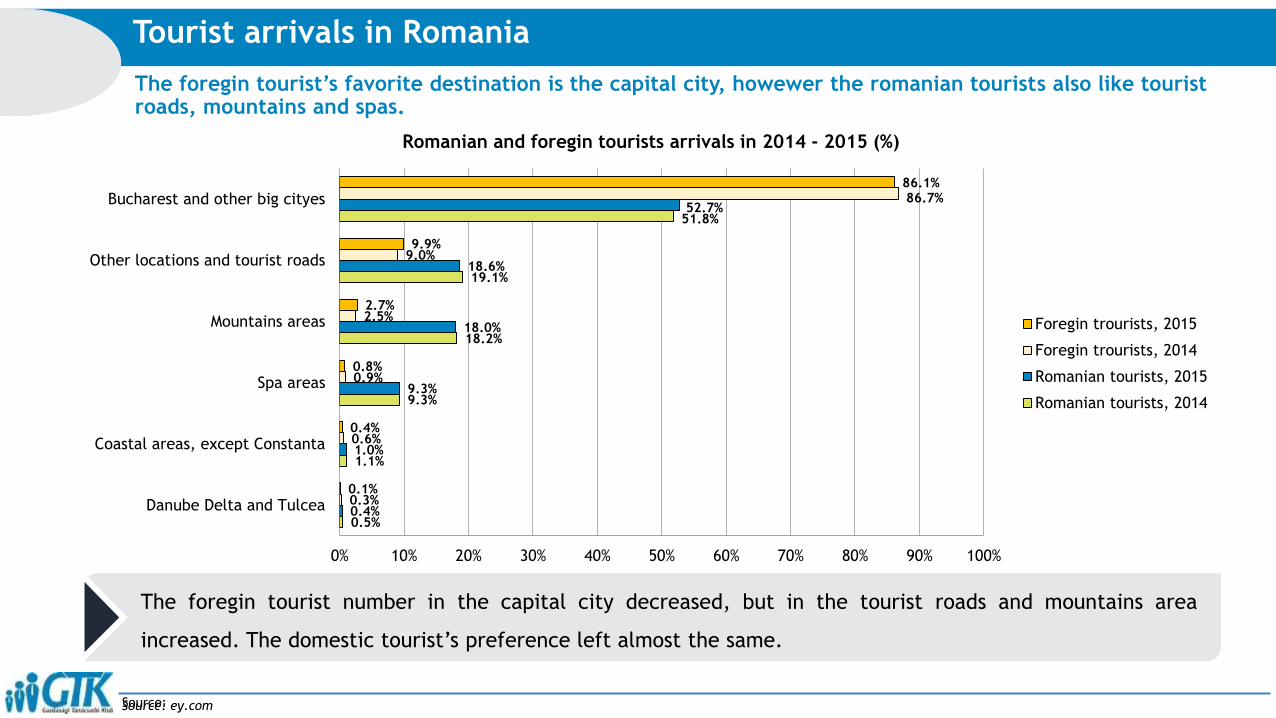
Source:
The foregin tourist’s favorite destination is the capital city, howewer the romanian tourists also like tourist roads, mountains and spas.
Tourist arrivals in Romania
0.5%
1.1%
9.3%
18.2%
19.1%
51.8%
0.4%
1.0%
9.3%
18.0%
18.6%
52.7%
0.3%
0.6%
0.9%
2.5%
9.0%
86.7%
0.1%
0.4%
0.8%
2.7%
9.9%
86.1%
0% 10% 20% 30% 40% 50% 60% 70% 80% 90% 100%
Danube Delta and Tulcea
Coastal areas, except Constanta
Spa areas
Mountains areas
Other locations and tourist roads
Bucharest and other big cityes
Romanian and foregin tourists arrivals in 2014 - 2015 (%)
Foregin trourists, 2015
Foregin trourists, 2014
Romanian tourists, 2015
Romanian tourists, 2014
The foregin tourist number in the capital city decreased, but in the tourist roads and mountains area
increased. The domestic tourist’s preference left almost the same.
Source: ey.com
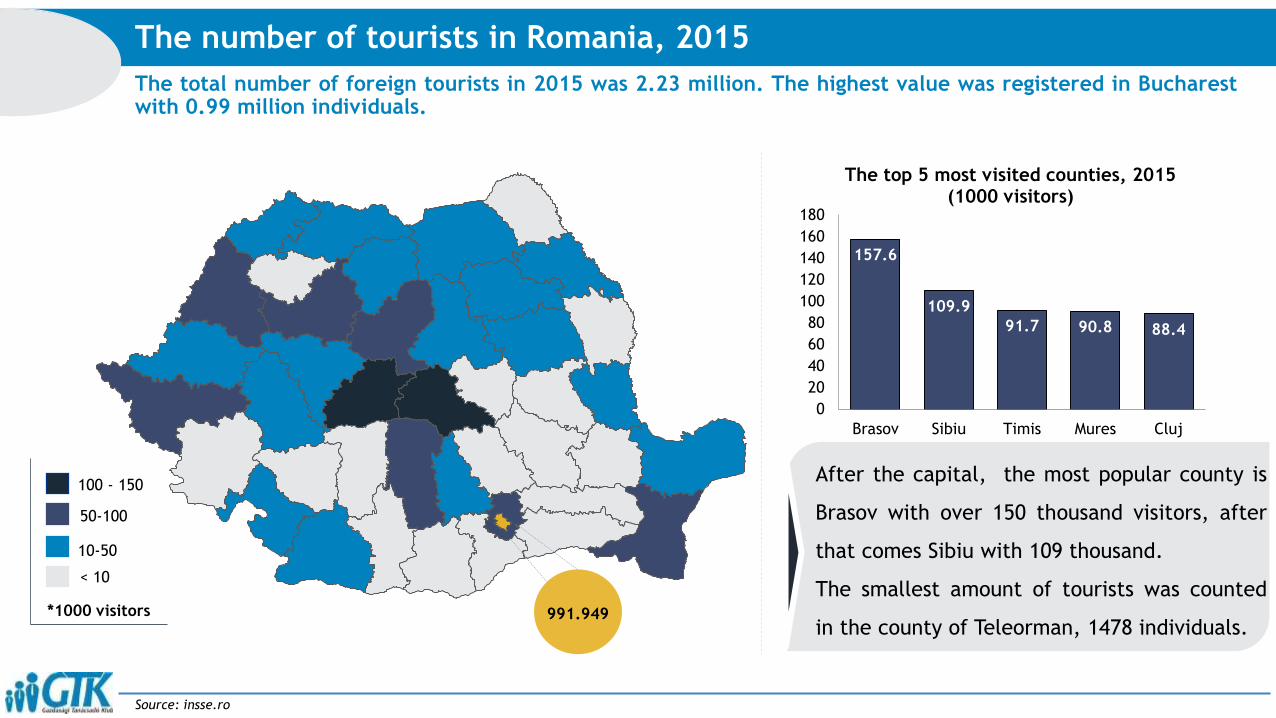
The total number of foreign tourists in 2015 was 2.23 million. The highest value was registered in Bucharestwith 0.99 million individuals.
The number of tourists in Romania, 2015
Source: insse.ro
100 - 150
50-100
10-50
< 10
991.949
157.6
109.9
91.7 90.8 88.4
0
20
40
60
80
100
120
140
160
180
Brasov Sibiu Timis Mures Cluj
The top 5 most visited counties, 2015 (1000 visitors)
After the capital, the most popular county is
Brasov with over 150 thousand visitors, after
that comes Sibiu with 109 thousand.
The smallest amount of tourists was counted
in the county of Teleorman, 1478 individuals.*1000 visitors
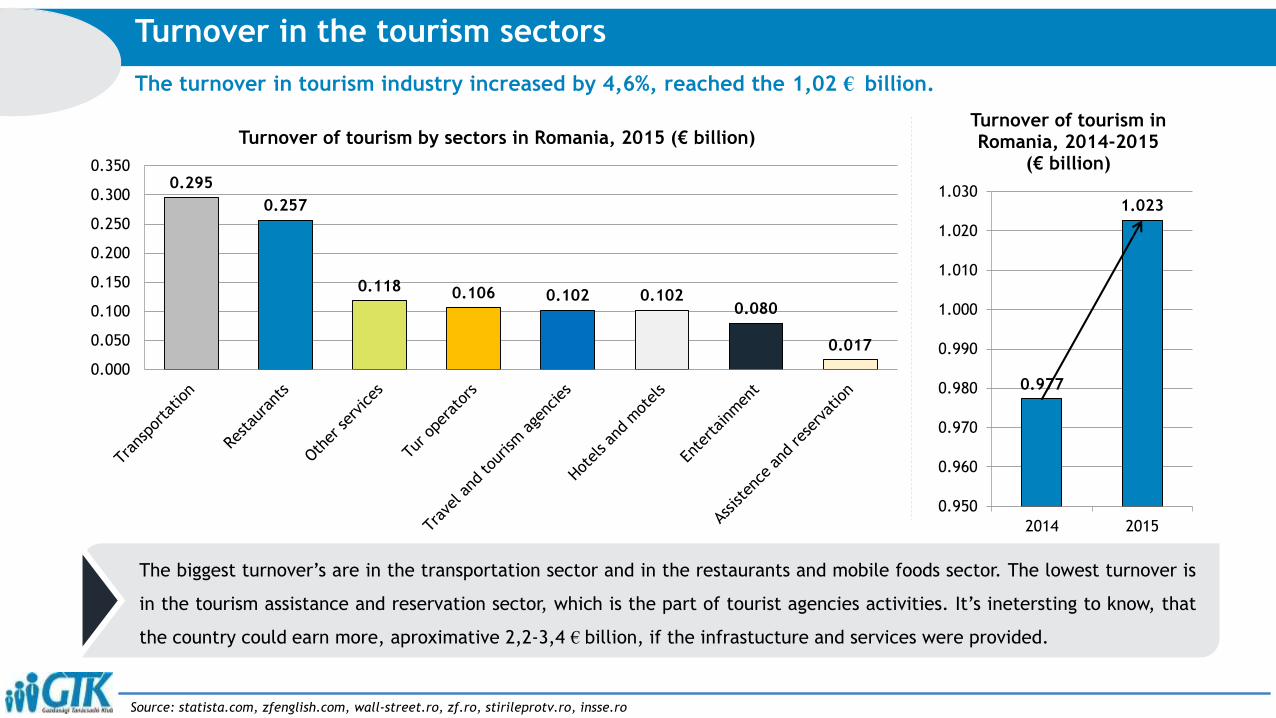
The turnover in tourism industry increased by 4,6%, reached the 1,02 € billion.
Turnover in the tourism sectors
The biggest turnover’s are in the transportation sector and in the restaurants and mobile foods sector. The lowest turnover is
in the tourism assistance and reservation sector, which is the part of tourist agencies activities. It’s inetersting to know, that
the country could earn more, aproximative 2,2-3,4 € billion, if the infrastucture and services were provided.
0.977
1.023
0.950
0.960
0.970
0.980
0.990
1.000
1.010
1.020
1.030
2014 2015
Turnover of tourism in Romania, 2014-2015
(€ billion)
Source: statista.com, zfenglish.com, wall-street.ro, zf.ro, stirileprotv.ro, insse.ro
0.295
0.257
0.118 0.106 0.102 0.1020.080
0.017
0.000
0.050
0.100
0.150
0.200
0.250
0.300
0.350
Turnover of tourism by sectors in Romania, 2015 (€ billion)
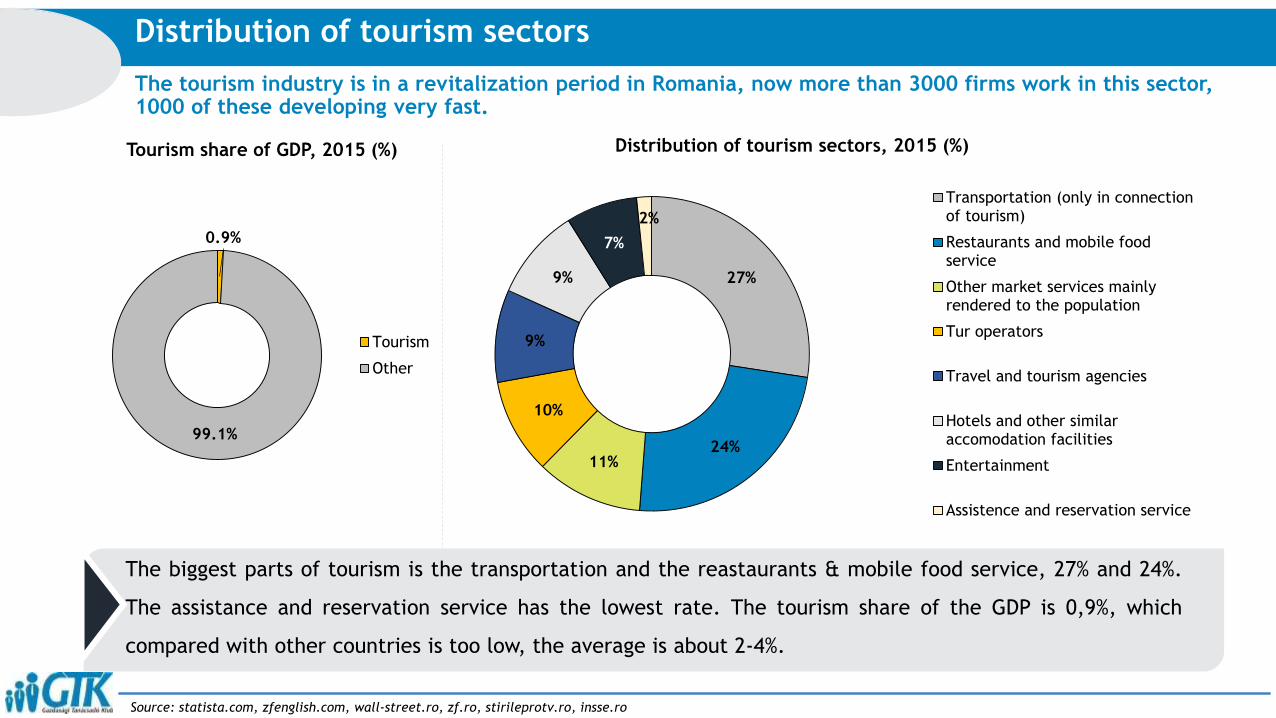
The tourism industry is in a revitalization period in Romania, now more than 3000 firms work in this sector, 1000 of these developing very fast.
Distribution of tourism sectors
The biggest parts of tourism is the transportation and the reastaurants & mobile food service, 27% and 24%.
The assistance and reservation service has the lowest rate. The tourism share of the GDP is 0,9%, which
compared with other countries is too low, the average is about 2-4%.
Source: statista.com, zfenglish.com, wall-street.ro, zf.ro, stirileprotv.ro, insse.ro
27%
24%11%
10%
9%
9%
7%
2%
Distribution of tourism sectors, 2015 (%)
Transportation (only in connectionof tourism)
Restaurants and mobile foodservice
Other market services mainlyrendered to the population
Tur operators
Travel and tourism agencies
Hotels and other similaraccomodation facilities
Entertainment
Assistence and reservation service
0.9%
99.1%
Tourism share of GDP, 2015 (%)
Tourism
Other
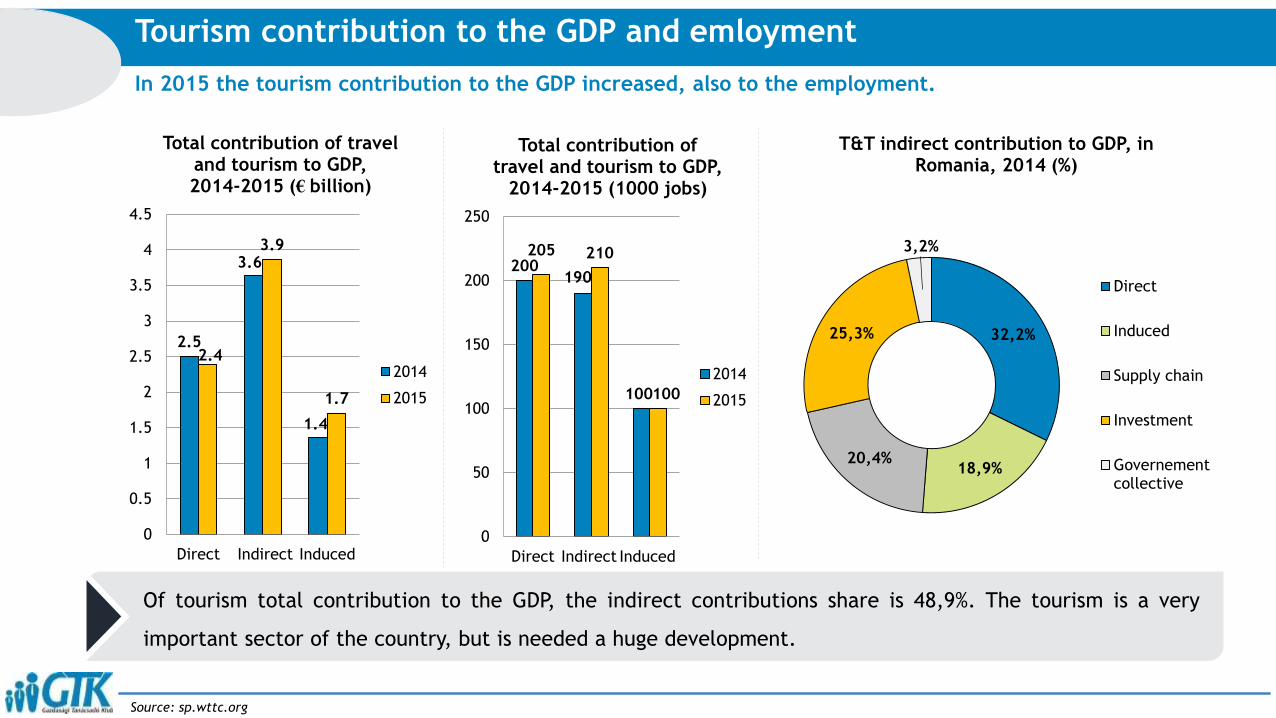
In 2015 the tourism contribution to the GDP increased, also to the employment.
Tourism contribution to the GDP and emloyment
32,2%
18,9%20,4%
25,3%
3,2%
T&T indirect contribution to GDP, in Romania, 2014 (%)
Direct
Induced
Supply chain
Investment
Governementcollective
Of tourism total contribution to the GDP, the indirect contributions share is 48,9%. The tourism is a very
important sector of the country, but is needed a huge development.
Source: sp.wttc.org
2.5
3.6
1.4
2.4
3.9
1.7
0
0.5
1
1.5
2
2.5
3
3.5
4
4.5
Direct Indirect Induced
Total contribution of travel and tourism to GDP, 2014-2015 (€ billion)
2014
2015
200190
100
205 210
100
0
50
100
150
200
250
Direct Indirect Induced
Total contribution of travel and tourism to GDP,
2014-2015 (1000 jobs)
2014
2015

The biggest rate of employees works in transport, 62,64% (around 3,8 million people), the least, only 2,28%(0,014 million ) works at travel agencies. A decrease can be identified in the number of employees inentertainment and travel subsegments, compared to the previous year (2014)
Employment in romanian tourism between 2011-2015
1.81 1.91 1.92 2.57 2.288.41 8.34 8.81 9.19 6.8
60.86 60.17 61.65 60.92 62.64
4.74 4.78 4.12 4.74 4.33
24.18 24.81 23.5 22.59 23.95
0%
10%
20%
30%
40%
50%
60%
70%
80%
90%
100%
2011 2012 2013 2014 2015
Travel ag. Accomodation Transport Entertainment Catering
ec.europa.eu/Eurostat
The distribution of employment in subsegments
between 2011-2015 (%)
Number of employees in subsegments between 2011-
2015 (thousand capita)
9.4 9.9 10.4 14.6 13.8
43.6 43.3 47.7 52.2 41.1
315.6 312.4 333.9 346 378.8
24.6 24.822.3
26.926.2125.4 128.8
127.3128.3
144.8
0
100
200
300
400
500
600
700
2011 2012 2013 2014 2015
Travel ag. Accomodation Transport Entertainment Catering
From 2011 to 2015 the number of employees in tourism subsegments shows a growing trend.
Between 2011-2015 the distribution ratio grows in travel, transport and catering, decreases in
entertainment and accomodation.
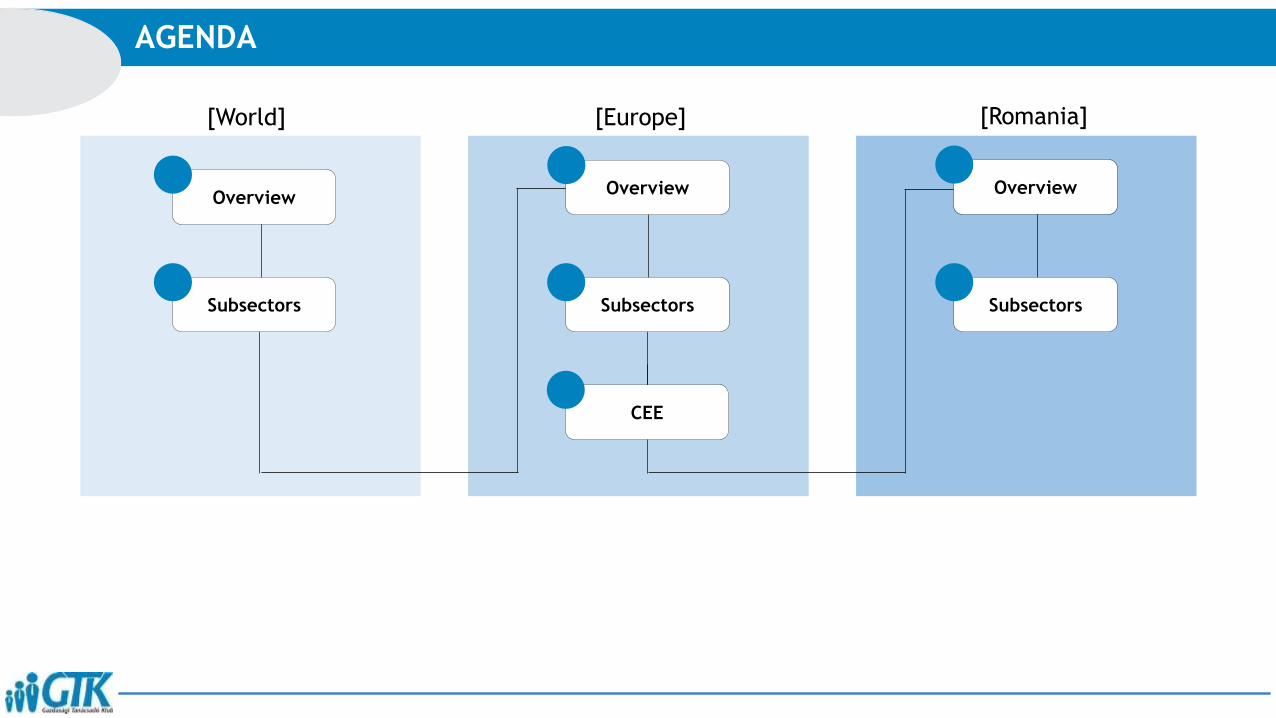
AGENDA
[World] [Europe] [Romania]
Overview
Subsectors
CEE
Overview
Subsectors
Overview
Subsectors
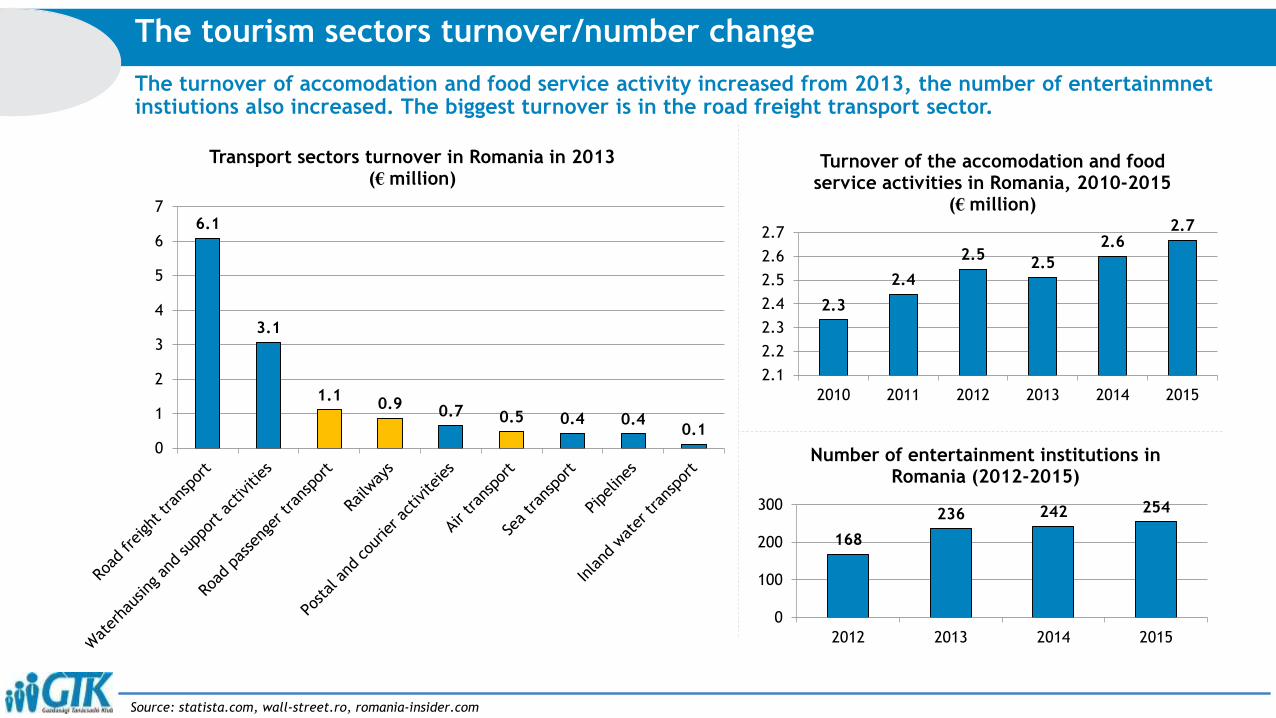
The turnover of accomodation and food service activity increased from 2013, the number of entertainmnet instiutions also increased. The biggest turnover is in the road freight transport sector.
The tourism sectors turnover/number change
6.1
3.1
1.10.9 0.7 0.5 0.4 0.4
0.10
1
2
3
4
5
6
7
Transport sectors turnover in Romania in 2013 (€ million)
2.3
2.4
2.52.5
2.62.7
2.1
2.2
2.3
2.4
2.5
2.6
2.7
2010 2011 2012 2013 2014 2015
Turnover of the accomodation and food service activities in Romania, 2010-2015
(€ million)
168
236 242 254
0
100
200
300
2012 2013 2014 2015
Number of entertainment institutions in Romania (2012-2015)
Source: statista.com, wall-street.ro, romania-insider.com

The arrival of tourists is in a continuous increase, with the highest growth rate of 17% in 2015. The numberof domestic tourists was much higher than foreign visitors, however the number of foreigners is growing.
Tourist arrivals in the period between 2011 and 2015
Source: www.insse.ro
7.037.68 7.94
8.46
9.93
0%
2%
4%
6%
8%
10%
12%
14%
16%
18%
20%
0
2
4
6
8
10
12
2011 2012 2013 2014 2015
Number of tourist arrivals and the growth rate between 2011-2015 (million capita)
Arrivals Growth
From 2011 until 2015 tourist arrivals have grown with 63.5%. The number of both domestic and foreign visitors is in
continuous increase. In 2015 the number of domestic tourists increased with 18%, while the number of foreign
visitors increased with 16%.
5.5 6.03 6.2 6.57.7
1.51.6 1.7
1.9
2.2
0
2
4
6
8
10
12
2011 2012 2013 2014 2015
Number of domestic and foreign visitors between 2011-2015 (million capita)
Domestic visitors Foreign visitors
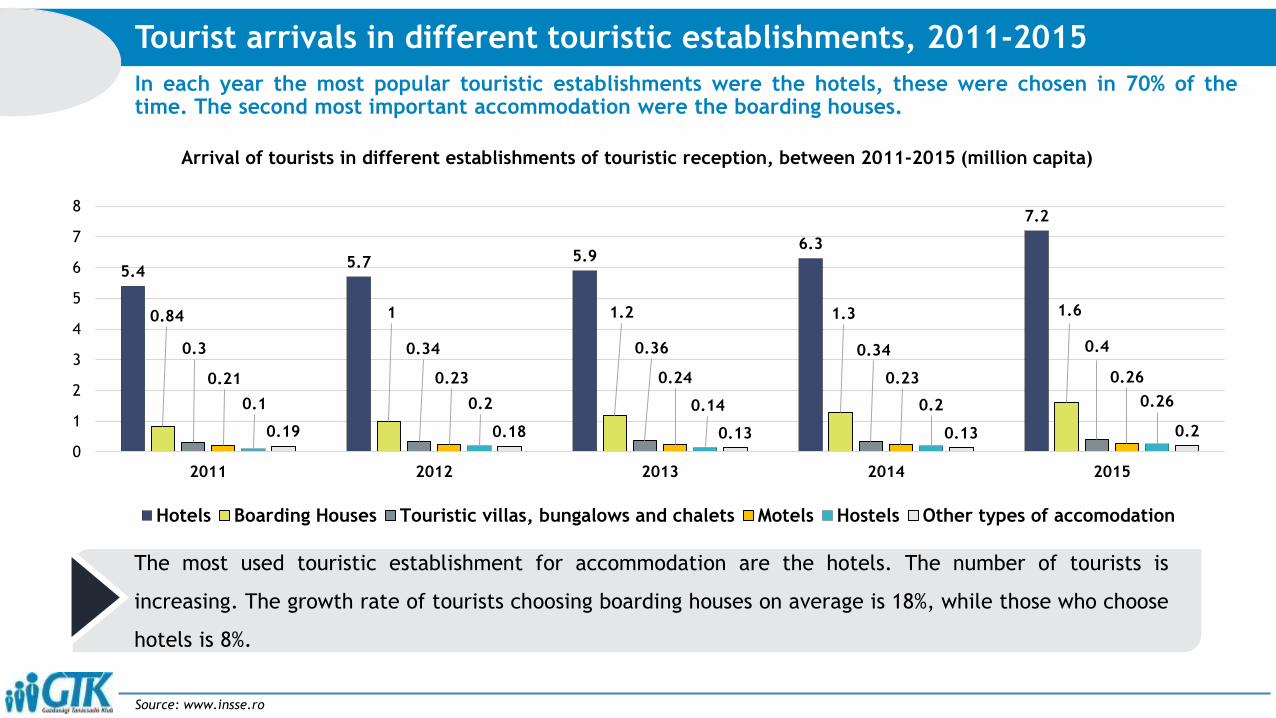
In each year the most popular touristic establishments were the hotels, these were chosen in 70% of thetime. The second most important accommodation were the boarding houses.
Tourist arrivals in different touristic establishments, 2011-2015
Source: www.insse.ro
The most used touristic establishment for accommodation are the hotels. The number of tourists is
increasing. The growth rate of tourists choosing boarding houses on average is 18%, while those who choose
hotels is 8%.
5.45.7 5.9
6.3
7.2
0.84 1 1.2 1.3 1.6
0.3 0.34 0.36 0.34 0.4
0.21 0.23 0.24 0.23 0.26
0.1 0.2 0.14 0.2 0.26
0.19 0.18 0.13 0.13 0.2
0
1
2
3
4
5
6
7
8
2011 2012 2013 2014 2015
Arrival of tourists in different establishments of touristic reception, between 2011-2015 (million capita)
Hotels Boarding Houses Touristic villas, bungalows and chalets Motels Hostels Other types of accomodation
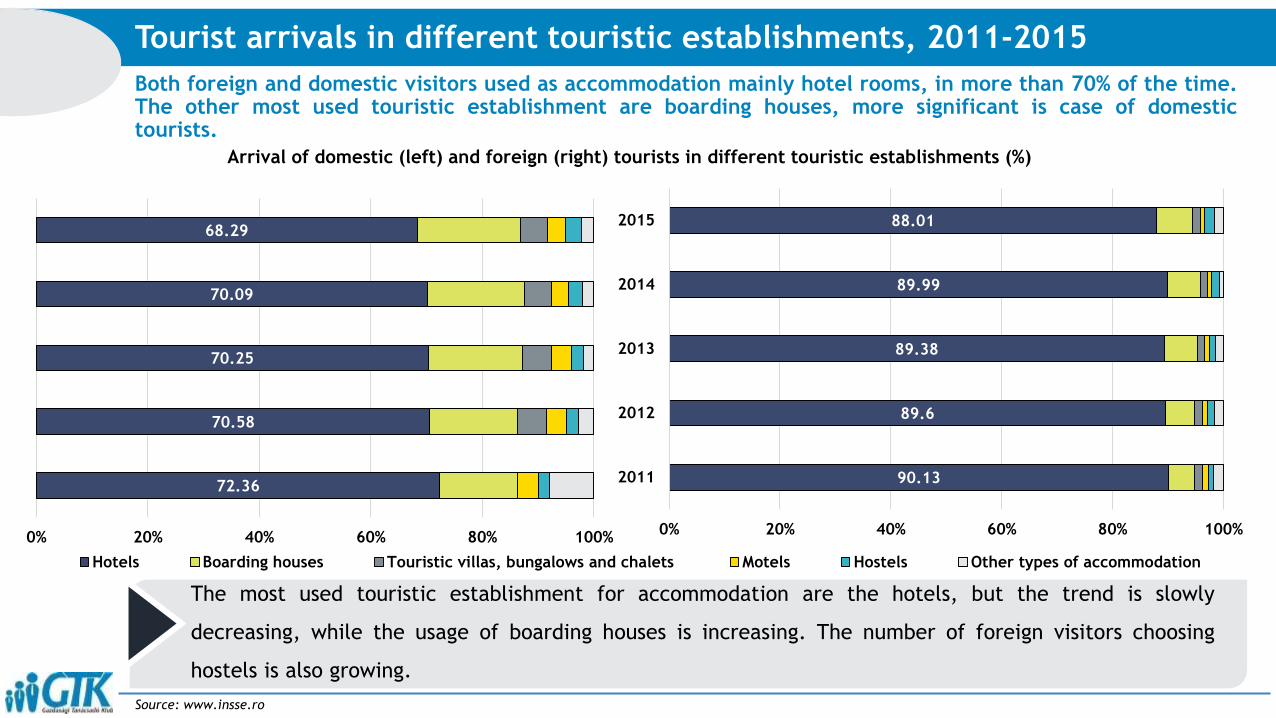
Both foreign and domestic visitors used as accommodation mainly hotel rooms, in more than 70% of the time.The other most used touristic establishment are boarding houses, more significant is case of domestictourists.
Tourist arrivals in different touristic establishments, 2011-2015
Source: www.insse.ro
72.36
70.58
70.25
70.09
68.29
0% 20% 40% 60% 80% 100%
Arrival of domestic (left) and foreign (right) tourists in different touristic establishments (%)
Hotels Boarding houses Touristic villas, bungalows and chalets Motels Hostels Other types of accommodation
90.13
89.6
89.38
89.99
88.01
0% 20% 40% 60% 80% 100%
2011
2012
2013
2014
2015
The most used touristic establishment for accommodation are the hotels, but the trend is slowly
decreasing, while the usage of boarding houses is increasing. The number of foreign visitors choosing
hostels is also growing.
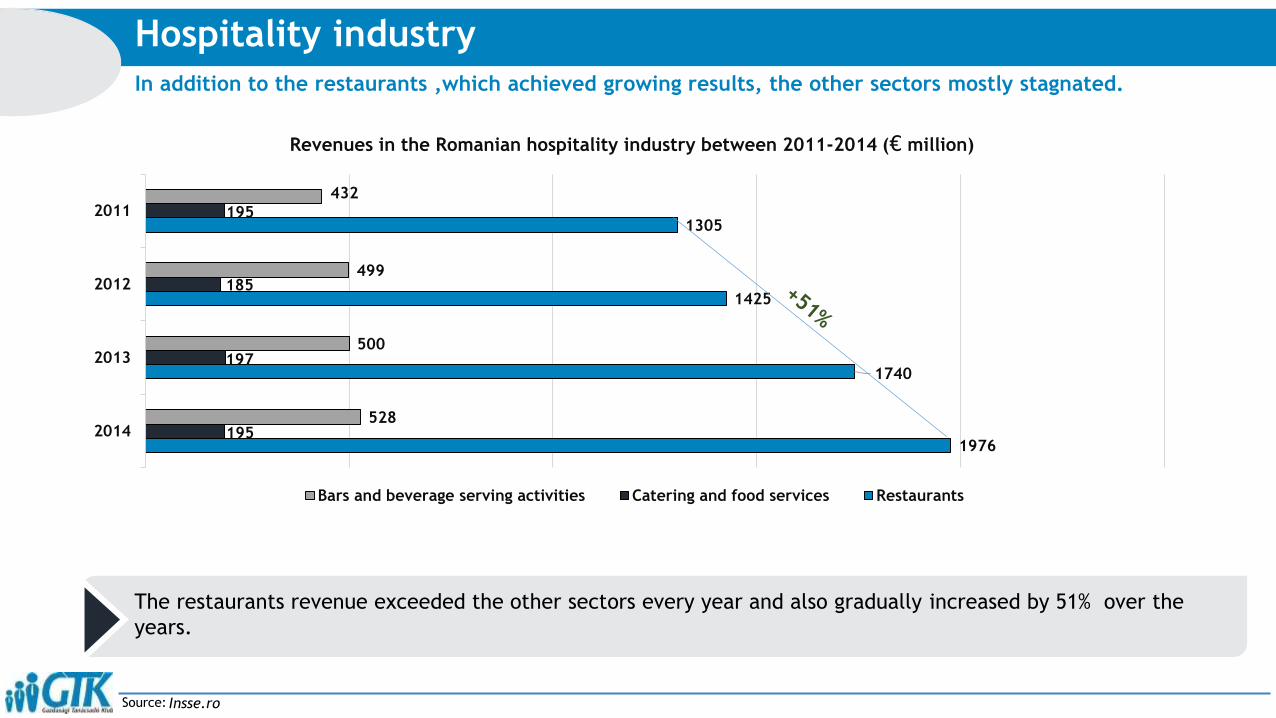
Source:
In addition to the restaurants ,which achieved growing results, the other sectors mostly stagnated.
Hospitality industry
1976
1740
1425
1305
195
197
185
195
528
500
499
432
2014
2013
2012
2011
Revenues in the Romanian hospitality industry between 2011-2014 (€ million)
Bars and beverage serving activities Catering and food services Restaurants
Insse.ro
The restaurants revenue exceeded the other sectors every year and also gradually increased by 51% over the
years.
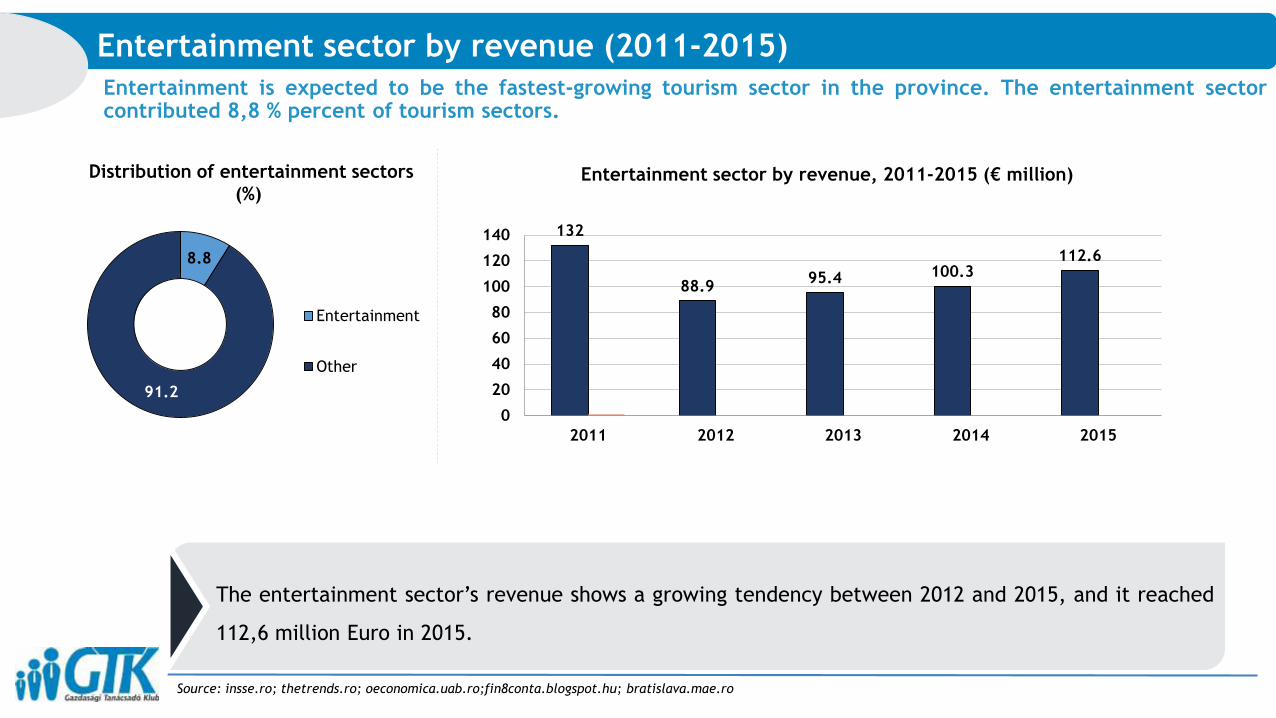
Entertainment is expected to be the fastest-growing tourism sector in the province. The entertainment sectorcontributed 8,8 % percent of tourism sectors.
Source: insse.ro; thetrends.ro; oeconomica.uab.ro;fin8conta.blogspot.hu; bratislava.mae.ro
Entertainment sector by revenue (2011-2015)
132
88.995.4 100.3
112.6
0
20
40
60
80
100
120
140
2011 2012 2013 2014 2015
Entertainment sector by revenue, 2011-2015 (€ million)
The entertainment sector’s revenue shows a growing tendency between 2012 and 2015, and it reached
112,6 million Euro in 2015.
8.8
91.2
Entertainment
Other
Distribution of entertainment sectors
(%)
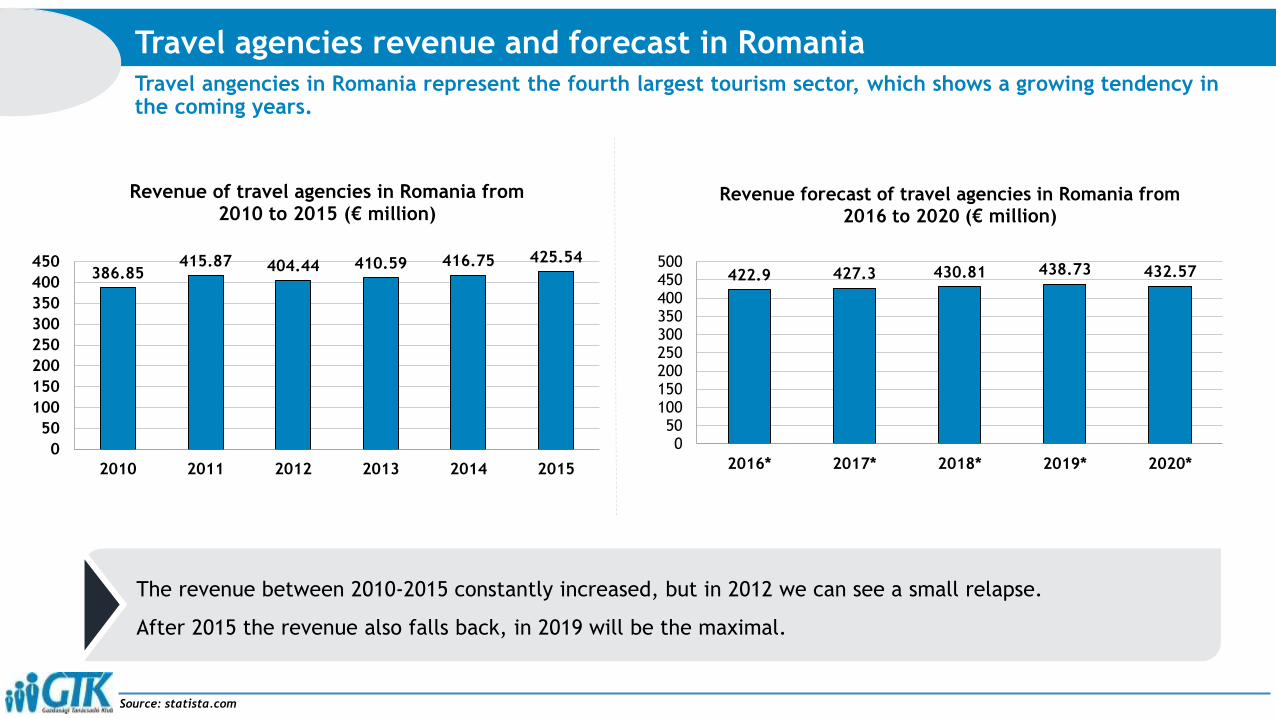
Travel angencies in Romania represent the fourth largest tourism sector, which shows a growing tendency in the coming years.
Travel agencies revenue and forecast in Romania
386.85415.87 404.44 410.59 416.75 425.54
0
50
100
150
200
250
300
350
400
450
2010 2011 2012 2013 2014 2015
Revenue of travel agencies in Romania from 2010 to 2015 (€ million)
422.9 427.3 430.81 438.73 432.57
050
100150200250300350400450500
2016* 2017* 2018* 2019* 2020*
Revenue forecast of travel agencies in Romania from
2016 to 2020 (€ million)
The revenue between 2010-2015 constantly increased, but in 2012 we can see a small relapse.
After 2015 the revenue also falls back, in 2019 will be the maximal.
Source: statista.com
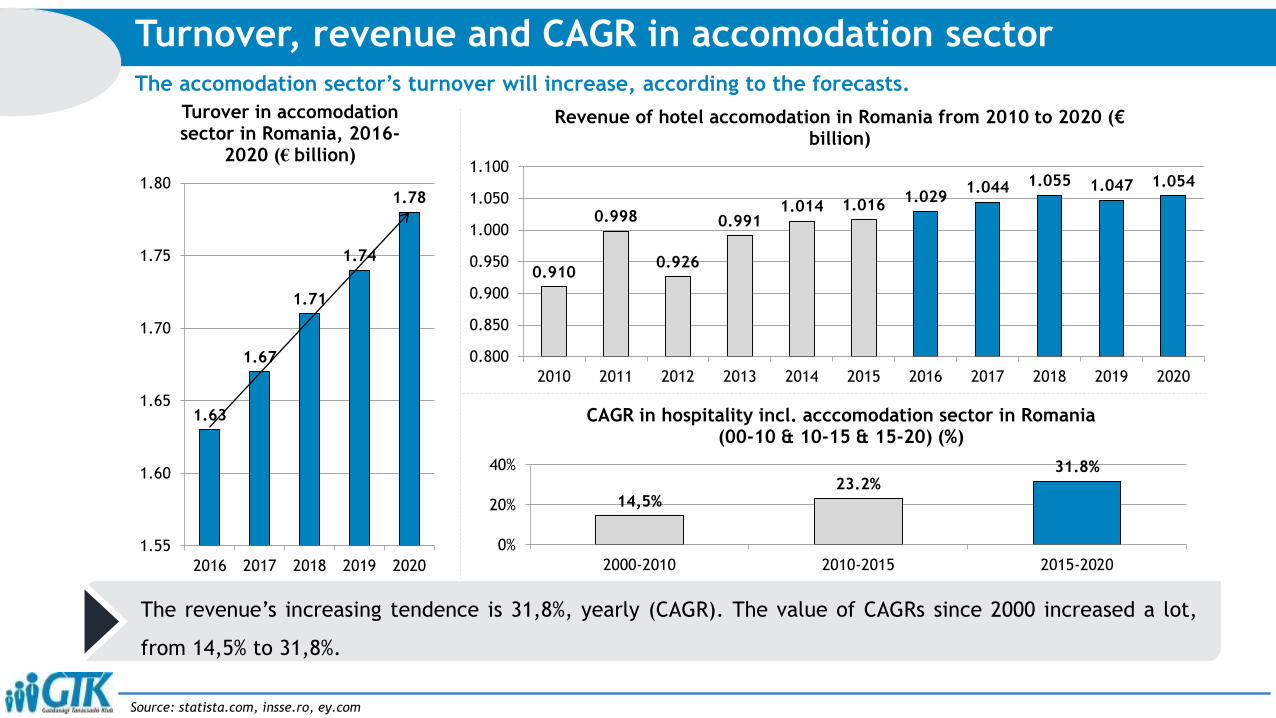
The accomodation sector’s turnover will increase, according to the forecasts.
Turnover, revenue and CAGR in accomodation sector
1.63
1.67
1.71
1.74
1.78
1.55
1.60
1.65
1.70
1.75
1.80
2016 2017 2018 2019 2020
Turover in accomodationsector in Romania, 2016-
2020 (€ billion)
14,5%23.2%
31.8%
0%
20%
40%
2000-2010 2010-2015 2015-2020
CAGR in hospitality incl. acccomodation sector in Romania(00-10 & 10-15 & 15-20) (%)
The revenue’s increasing tendence is 31,8%, yearly (CAGR). The value of CAGRs since 2000 increased a lot,
from 14,5% to 31,8%.
Source: statista.com, insse.ro, ey.com
0.910
0.998
0.926
0.9911.014 1.016
1.0291.044 1.055 1.047 1.054
0.800
0.850
0.900
0.950
1.000
1.050
1.100
2010 2011 2012 2013 2014 2015 2016 2017 2018 2019 2020
Revenue of hotel accomodation in Romania from 2010 to 2020 (€billion)
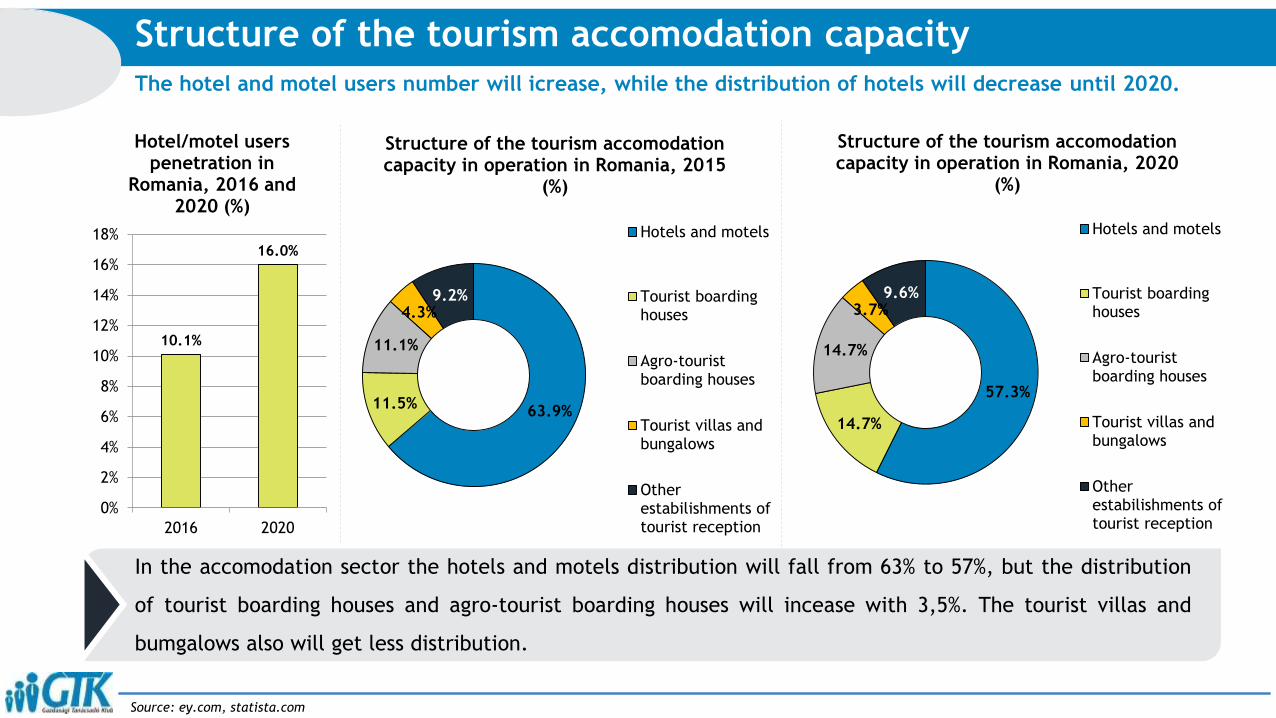
The hotel and motel users number will icrease, while the distribution of hotels will decrease until 2020.
Structure of the tourism accomodation capacity
63.9%11.5%
11.1%
4.3%9.2%
Structure of the tourism accomodationcapacity in operation in Romania, 2015
(%)
Hotels and motels
Tourist boardinghouses
Agro-touristboarding houses
Tourist villas andbungalows
Otherestabilishments oftourist reception
57.3%
14.7%
14.7%
3.7%9.6%
Structure of the tourism accomodationcapacity in operation in Romania, 2020
(%)
Hotels and motels
Tourist boardinghouses
Agro-touristboarding houses
Tourist villas andbungalows
Otherestabilishments oftourist reception
In the accomodation sector the hotels and motels distribution will fall from 63% to 57%, but the distribution
of tourist boarding houses and agro-tourist boarding houses will incease with 3,5%. The tourist villas and
bumgalows also will get less distribution.
Source: ey.com, statista.com
10.1%
16.0%
0%
2%
4%
6%
8%
10%
12%
14%
16%
18%
2016 2020
Hotel/motel userspenetration in
Romania, 2016 and 2020 (%)
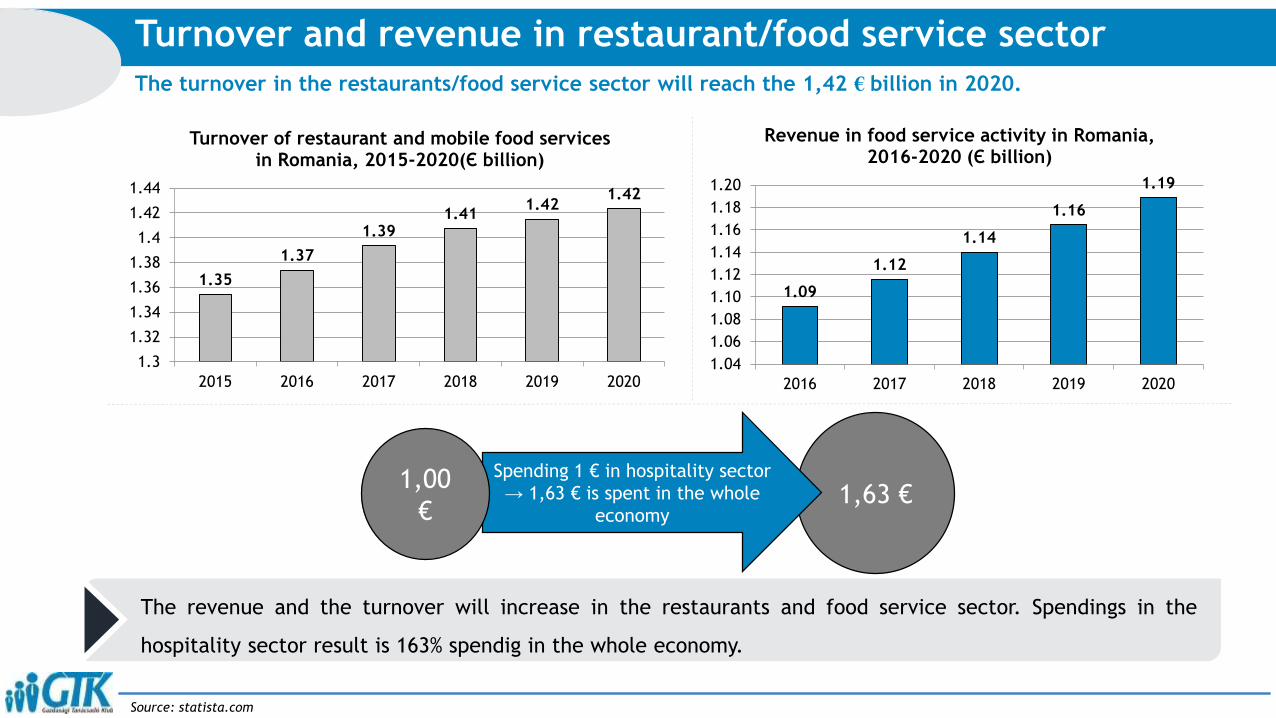
The turnover in the restaurants/food service sector will reach the 1,42 € billion in 2020.
Turnover and revenue in restaurant/food service sector
1.35
1.37
1.391.41
1.421.42
1.3
1.32
1.34
1.36
1.38
1.4
1.42
1.44
2015 2016 2017 2018 2019 2020
Turnover of restaurant and mobile food services in Romania, 2015-2020(Є billion)
1.09
1.12
1.14
1.16
1.19
1.04
1.06
1.08
1.10
1.12
1.14
1.16
1.18
1.20
2016 2017 2018 2019 2020
Revenue in food service activity in Romania, 2016-2020 (Є billion)
The revenue and the turnover will increase in the restaurants and food service sector. Spendings in the
hospitality sector result is 163% spendig in the whole economy.
Source: statista.com
1,63 €Spending 1 € in hospitality sector
→ 1,63 € is spent in the whole
economy
1,00
€
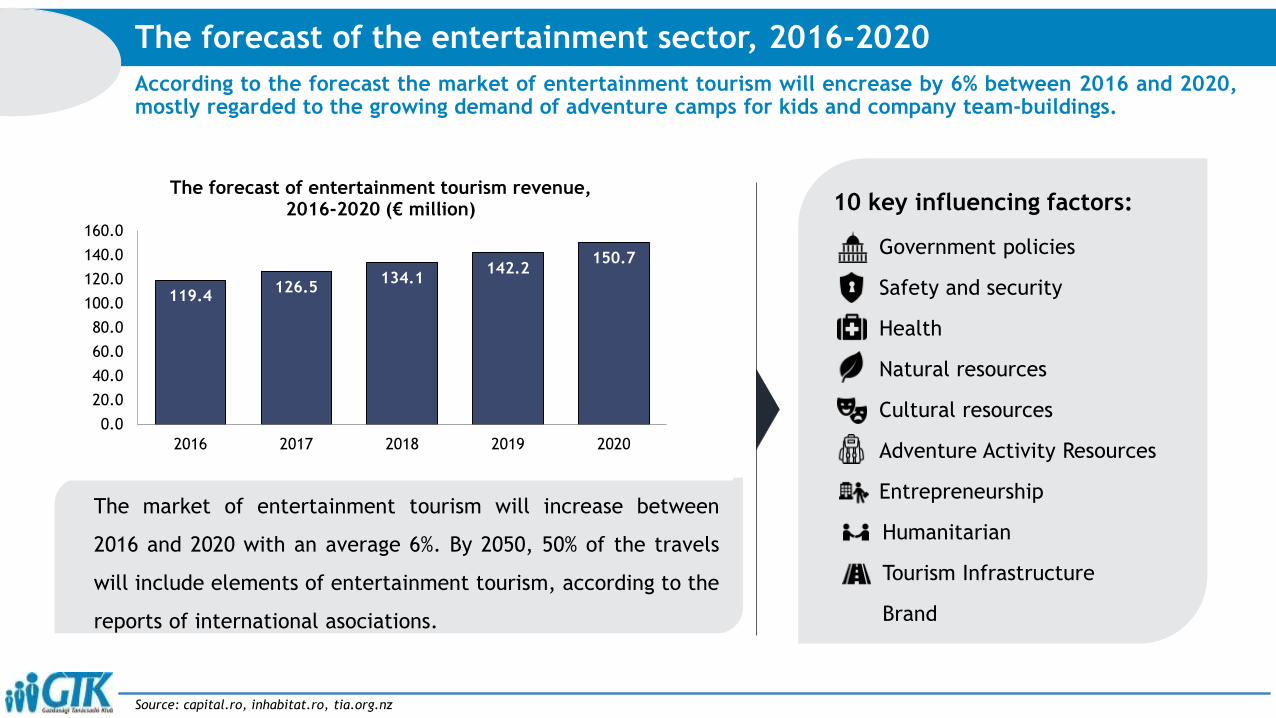
According to the forecast the market of entertainment tourism will encrease by 6% between 2016 and 2020,mostly regarded to the growing demand of adventure camps for kids and company team-buildings.
The forecast of the entertainment sector, 2016-2020
Source: capital.ro, inhabitat.ro, tia.org.nz
119.4126.5
134.1142.2
150.7
0.0
20.0
40.0
60.0
80.0
100.0
120.0
140.0
160.0
2016 2017 2018 2019 2020
The forecast of entertainment tourism revenue,2016-2020 (€ million)
The market of entertainment tourism will increase between
2016 and 2020 with an average 6%. By 2050, 50% of the travels
will include elements of entertainment tourism, according to the
reports of international asociations.
10 key influencing factors:
Government policies
Safety and security
Health
Natural resources
Cultural resources
Adventure Activity Resources
Entrepreneurship
Humanitarian
Tourism Infrastructure
Brand
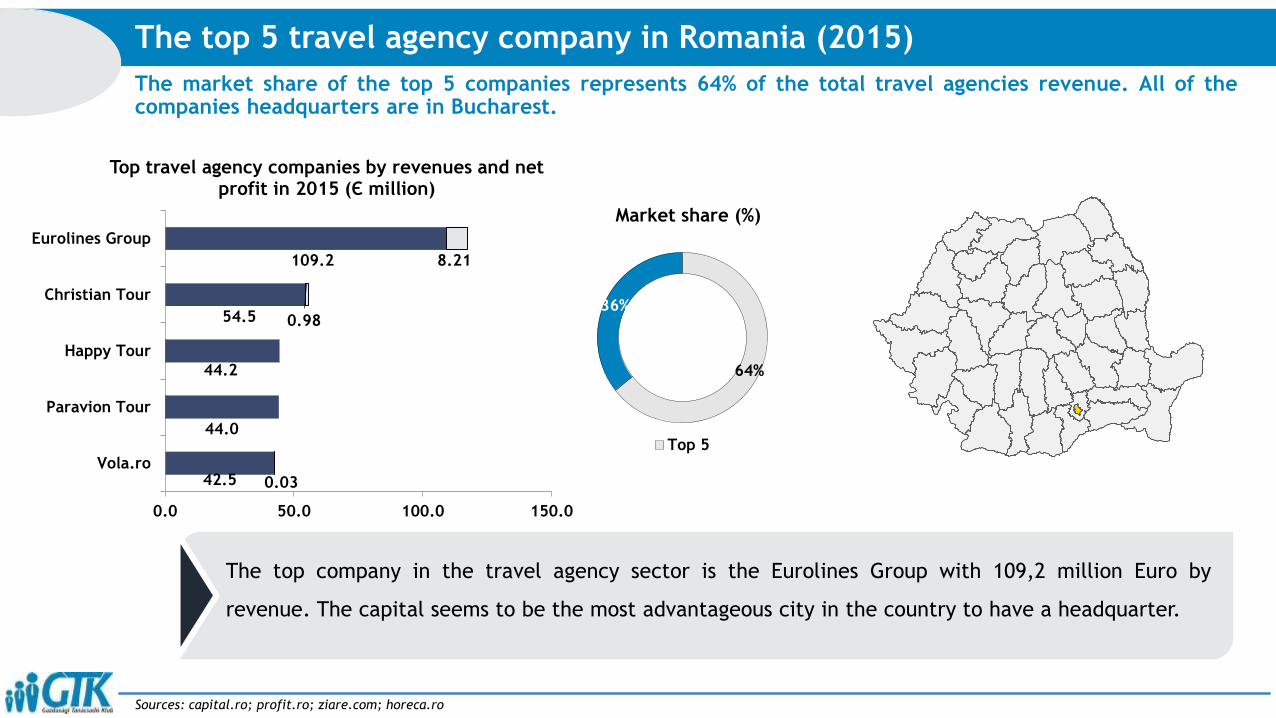
The market share of the top 5 companies represents 64% of the total travel agencies revenue. All of thecompanies headquarters are in Bucharest.
The top 5 travel agency company in Romania (2015)
Sources: capital.ro; profit.ro; ziare.com; horeca.ro
64%
36%
Market share (%)
Top 5
109.2
54.5
44.2
44.0
42.5
8.21
0.98
0.03
0.0 50.0 100.0 150.0
Eurolines Group
Christian Tour
Happy Tour
Paravion Tour
Vola.ro
Top travel agency companies by revenues and net profit in 2015 (Є million)
The top company in the travel agency sector is the Eurolines Group with 109,2 million Euro by
revenue. The capital seems to be the most advantageous city in the country to have a headquarter.
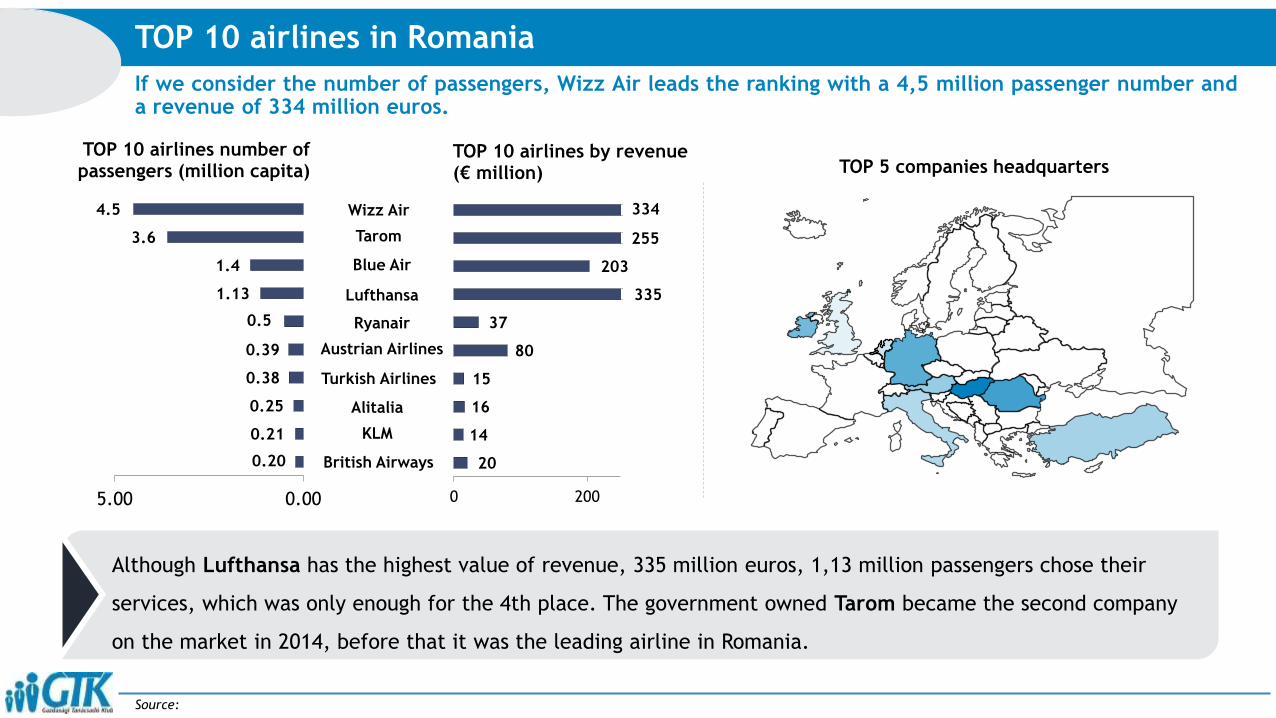
If we consider the number of passengers, Wizz Air leads the ranking with a 4,5 million passenger number anda revenue of 334 million euros.
TOP 10 airlines in Romania
Source:
TOP 5 companies headquarters
Although Lufthansa has the highest value of revenue, 335 million euros, 1,13 million passengers chose their
services, which was only enough for the 4th place. The government owned Tarom became the second company
on the market in 2014, before that it was the leading airline in Romania.
20
14
16
15
80
37
335
203
255
334
0 200
TOP 10 airlines by revenue (€ million)
0.20
0.21
0.25
0.38
0.39
0.5
1.13
1.4
3.6
4.5
0.005.00
TOP 10 airlines number of passengers (million capita)
Wizz Air
Tarom
Blue Air
Lufthansa
Ryanair
Austrian Airlines
Turkish Airlines
Alitalia
KLM
British Airways
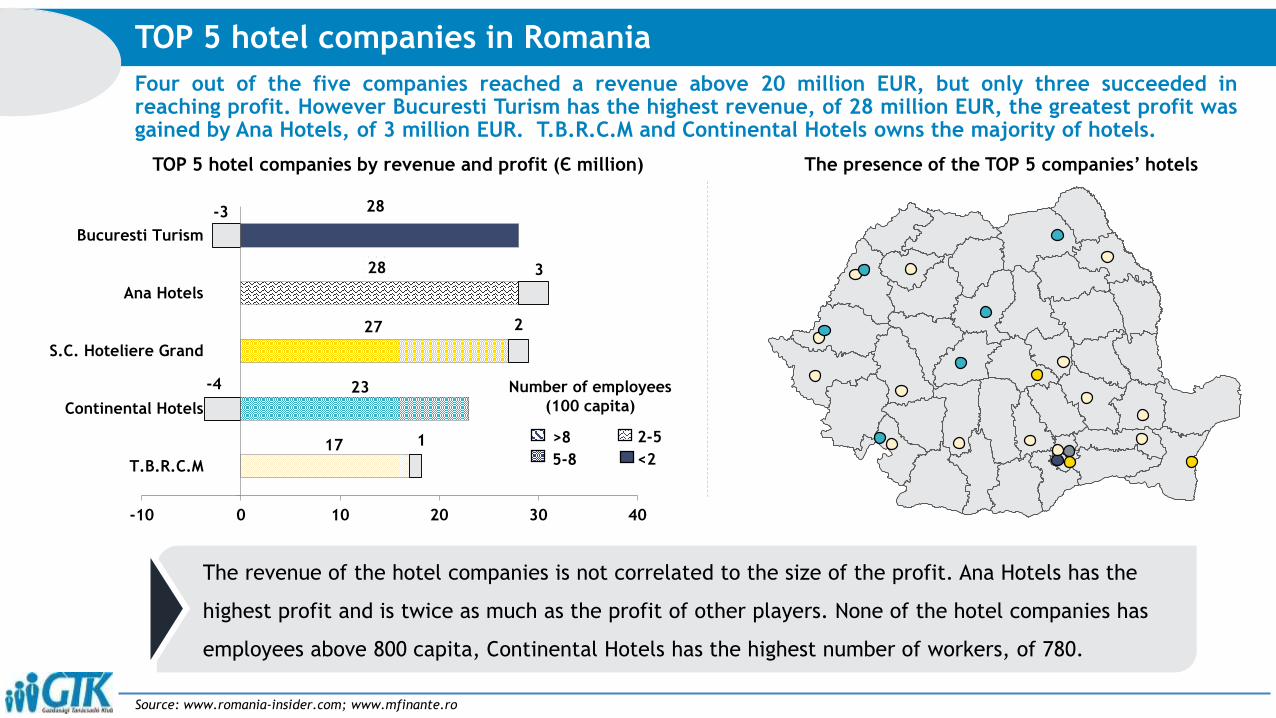
Four out of the five companies reached a revenue above 20 million EUR, but only three succeeded inreaching profit. However Bucuresti Turism has the highest revenue, of 28 million EUR, the greatest profit wasgained by Ana Hotels, of 3 million EUR. T.B.R.C.M and Continental Hotels owns the majority of hotels.
TOP 5 hotel companies in Romania
Source: www.romania-insider.com; www.mfinante.ro
17
23
27
28
28
1
-4
2
3
-3
-10 0 10 20 30 40
T.B.R.C.M
Continental Hotels
S.C. Hoteliere Grand
Ana Hotels
Bucuresti Turism
TOP 5 hotel companies by revenue and profit (Є million)
>8
5-8
2-5
<2
Number of employees
(100 capita)
The presence of the TOP 5 companies’ hotels
The revenue of the hotel companies is not correlated to the size of the profit. Ana Hotels has the
highest profit and is twice as much as the profit of other players. None of the hotel companies has
employees above 800 capita, Continental Hotels has the highest number of workers, of 780.
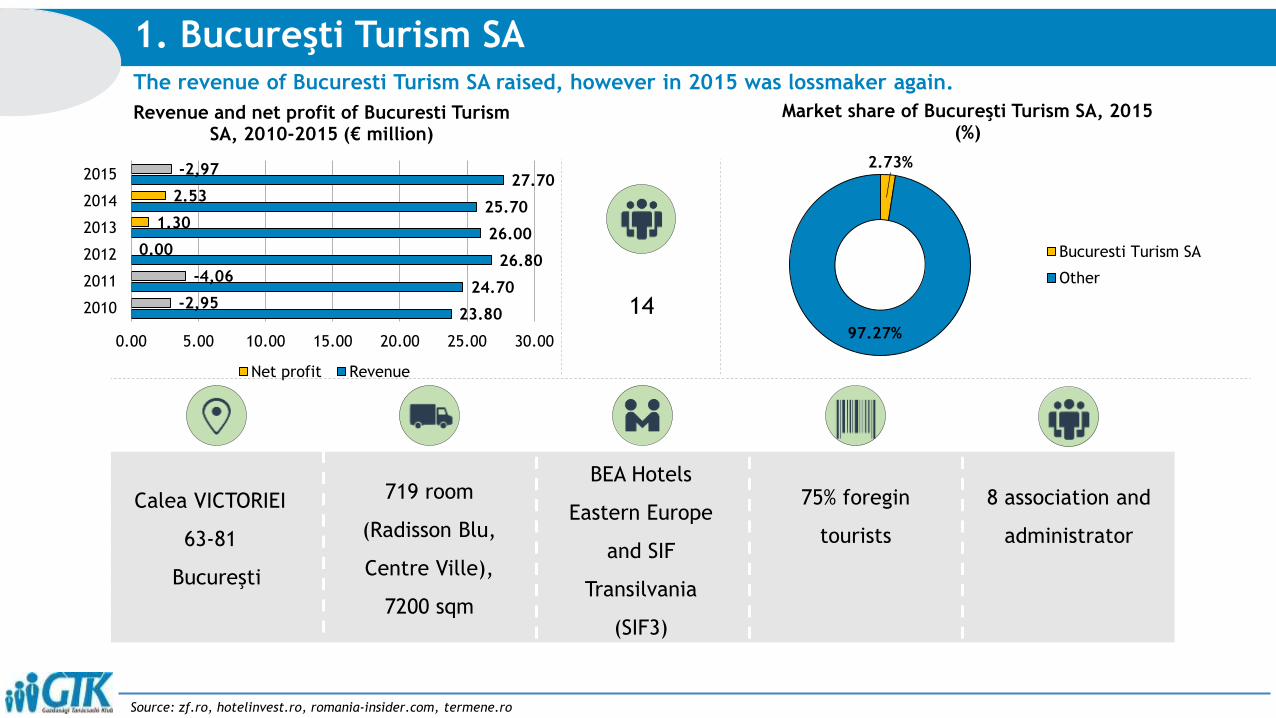
1. Bucureşti Turism SAThe revenue of Bucuresti Turism SA raised, however in 2015 was lossmaker again.
14
Calea VICTORIEI
63-81
Bucureşti
719 room
(Radisson Blu,
Centre Ville),
7200 sqm
75% foregin
tourists
BEA Hotels
Eastern Europe
and SIF
Transilvania
(SIF3)
8 association and
administrator
23.80
24.70
26.80
26.00
25.70
27.70
-2,95
-4,06
0.00
1.30
2.53
-2,97
0.00 5.00 10.00 15.00 20.00 25.00 30.00
2010
2011
2012
2013
2014
2015
Revenue and net profit of Bucuresti TurismSA, 2010-2015 (€ million)
Net profit Revenue
2.73%
97.27%
Market share of Bucureşti Turism SA, 2015 (%)
Bucuresti Turism SA
Other
Source: zf.ro, hotelinvest.ro, romania-insider.com, termene.ro
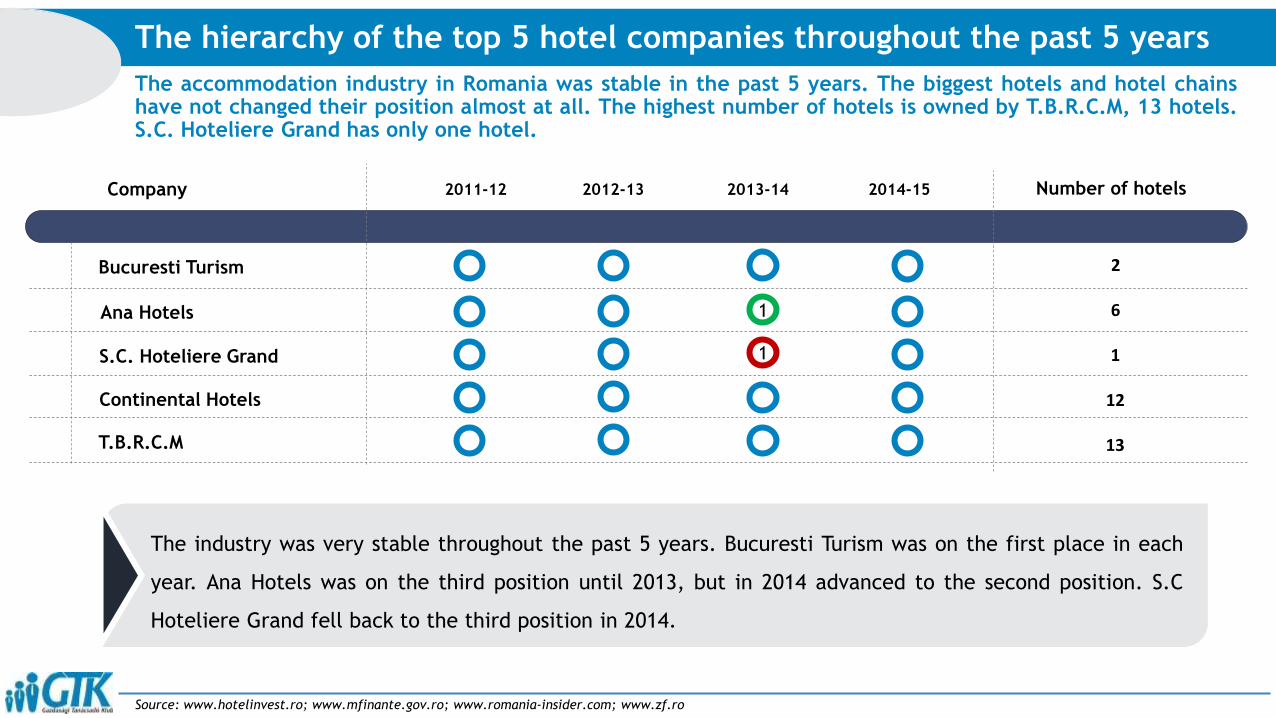
The accommodation industry in Romania was stable in the past 5 years. The biggest hotels and hotel chainshave not changed their position almost at all. The highest number of hotels is owned by T.B.R.C.M, 13 hotels.S.C. Hoteliere Grand has only one hotel.
The hierarchy of the top 5 hotel companies throughout the past 5 years
Source: www.hotelinvest.ro; www.mfinante.gov.ro; www.romania-insider.com; www.zf.ro
The industry was very stable throughout the past 5 years. Bucuresti Turism was on the first place in each
year. Ana Hotels was on the third position until 2013, but in 2014 advanced to the second position. S.C
Hoteliere Grand fell back to the third position in 2014.
2011-12 2012-13 2013-14 2014-15 Number of hotelsCompany
Bucuresti Turism
S.C. Hoteliere Grand
T.B.R.C.M
Continental Hotels
Ana Hotels
1
1
2
6
1
12
13

Restaurante Trattoria IL Calcio had the highest revenues throughout the last 5 years. In 2015 it had amaximum revenue of 7.8 million Euros. The company has 12 restaurants in Bucharest, 1 in Mamaia and 1 inTurnu Severin.
1. Restaurante Trattoria IL Calcio SRL
Source: www.trattoriailcalcio.com; www.zf.ro; www.mfinante.ro
• Headquarter:
Bucharest
• Number and location of
restaurants:
14
• Number of employees:
277
Further information Brands
3.80
5.405.90 5.90
7.80
0.00
0.10
0.20
0.30
0.40
0.50
0.60
0.70
0.80
0.90
1.00
0.00
1.00
2.00
3.00
4.00
5.00
6.00
7.00
8.00
9.00
2011 2012 2013 2014 2015
Revenue and profit from 2011 until 2015 (€million)
Revenue Profit
• Trattoria IL Calcio
• Ristorante IL Calcio
The revenue of the company have
been doubled from 2011 until 2015.
The highest increase was in 2015 of
33%. The highest profit was also in the
last year, of almost €9 thousand.
• Registration year: 2004
• Registration number (CUI): 16792110
• CAEN code: Restaurants
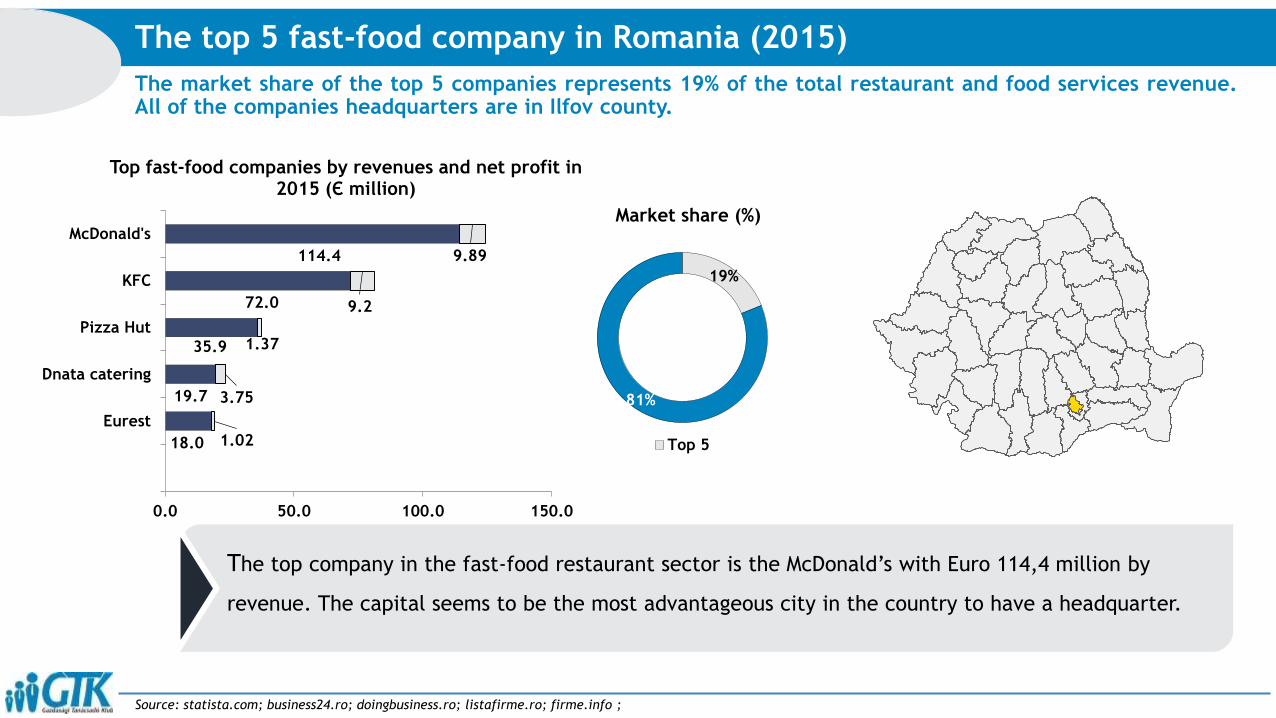
The market share of the top 5 companies represents 19% of the total restaurant and food services revenue.All of the companies headquarters are in Ilfov county.
The top 5 fast-food company in Romania (2015)
Source: statista.com; business24.ro; doingbusiness.ro; listafirme.ro; firme.info ;
19%
81%
Market share (%)
Top 5
114.4
72.0
35.9
19.7
18.0
9.89
9.2
1.37
3.75
1.02
0.0 50.0 100.0 150.0
McDonald's
KFC
Pizza Hut
Dnata catering
Eurest
Top fast-food companies by revenues and net profit in 2015 (Є million)
The top company in the fast-food restaurant sector is the McDonald’s with Euro 114,4 million by
revenue. The capital seems to be the most advantageous city in the country to have a headquarter.

McDonald's is the largest fast food restaurant chain in Romania with 67 restaurants in 21 cities. It can be said thatMcDonald’s has become synonymous with fast food in the eyes of many Romanians.
Source: emis.com; doingbusiness.ro; euromonitor.com; economica.net; franchising.info.ro; romania-insider.com;
1.McDonald’s
114.40
97.81
93.09
89.77
90.21
9.89
3.65
2.85
0.918
3.94
2015
2014
2013
2012
2011
Revenue and profit, 2011-2015 (Є million)
Profit Revenue 8.3
91.7
Market share (%)
Company Other
Franchise partners worldwide
The company owns 67 restaurants in 21 cities
BucharestFood Services and Drinking
places
Established in 1994
2892 employees
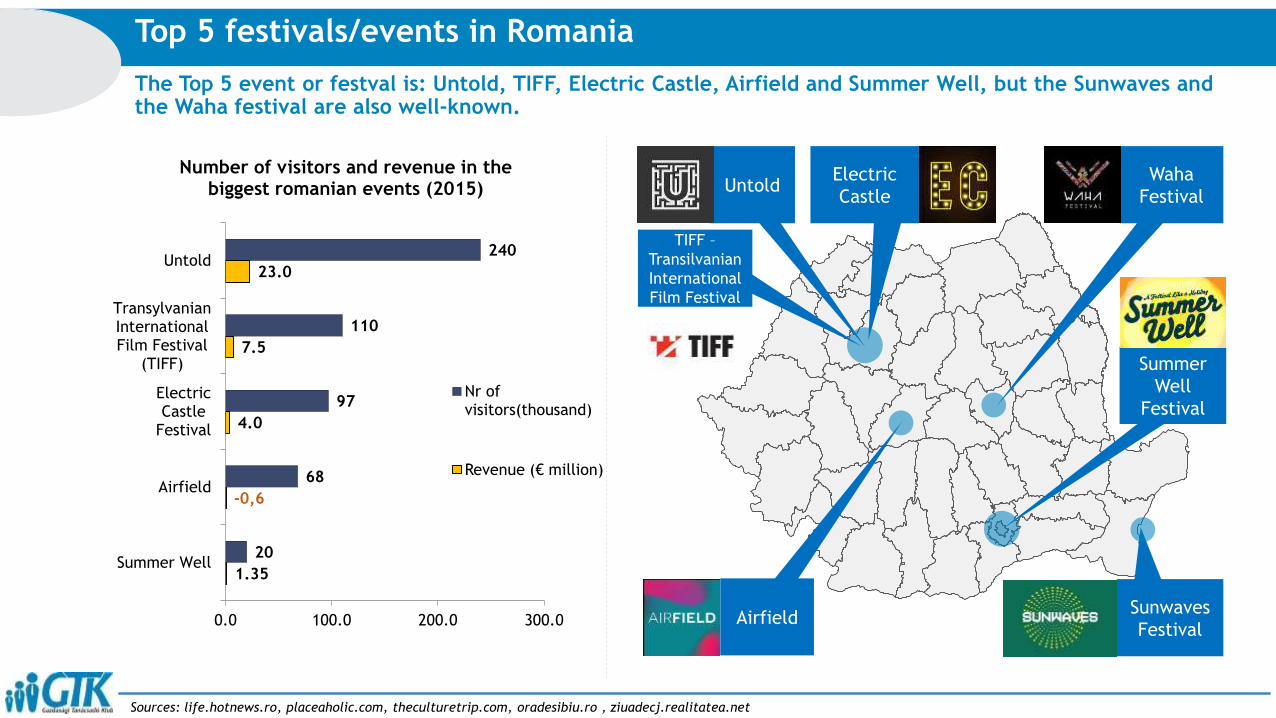
The Top 5 event or festval is: Untold, TIFF, Electric Castle, Airfield and Summer Well, but the Sunwaves and the Waha festival are also well-known.
Top 5 festivals/events in Romania
Sources: life.hotnews.ro, placeaholic.com, theculturetrip.com, oradesibiu.ro , ziuadecj.realitatea.net
240
110
97
68
20
23.0
7.5
4.0
-0,6
1.35
0.0 100.0 200.0 300.0
Untold
TransylvanianInternationalFilm Festival
(TIFF)
ElectricCastle
Festival
Airfield
Summer Well
Number of visitors and revenue in the biggest romanian events (2015)
Nr ofvisitors(thousand)
Revenue (€ million)
Airfield
UntoldElectric
Castle
Waha
Festival
Summer
Well
Festival
Sunwaves
Festival
TIFF –
Transilvanian
International
Film Festival
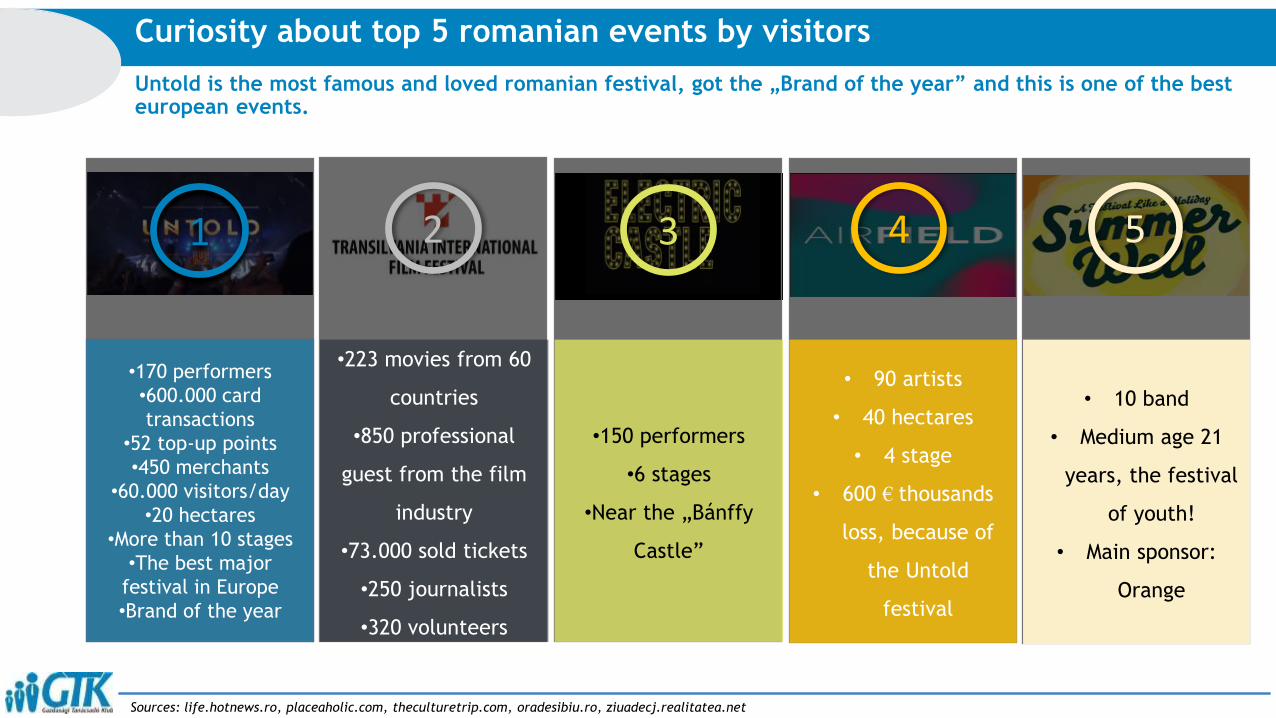
Untold is the most famous and loved romanian festival, got the „Brand of the year” and this is one of the best european events.
Curiosity about top 5 romanian events by visitors
Sources: life.hotnews.ro, placeaholic.com, theculturetrip.com, oradesibiu.ro, ziuadecj.realitatea.net
1
•170 performers
•600.000 card
transactions
•52 top-up points
•450 merchants
•60.000 visitors/day
•20 hectares
•More than 10 stages
•The best major
festival in Europe
•Brand of the year
•223 movies from 60
countries
•850 professional
guest from the film
industry
•73.000 sold tickets
•250 journalists
•320 volunteers
2 3
•150 performers
•6 stages
•Near the „Bánffy
Castle”
4
• 90 artists
• 40 hectares
• 4 stage
• 600 € thousands
loss, because of
the Untold
festival
• 10 band
• Medium age 21
years, the festival
of youth!
• Main sponsor:
Orange
5
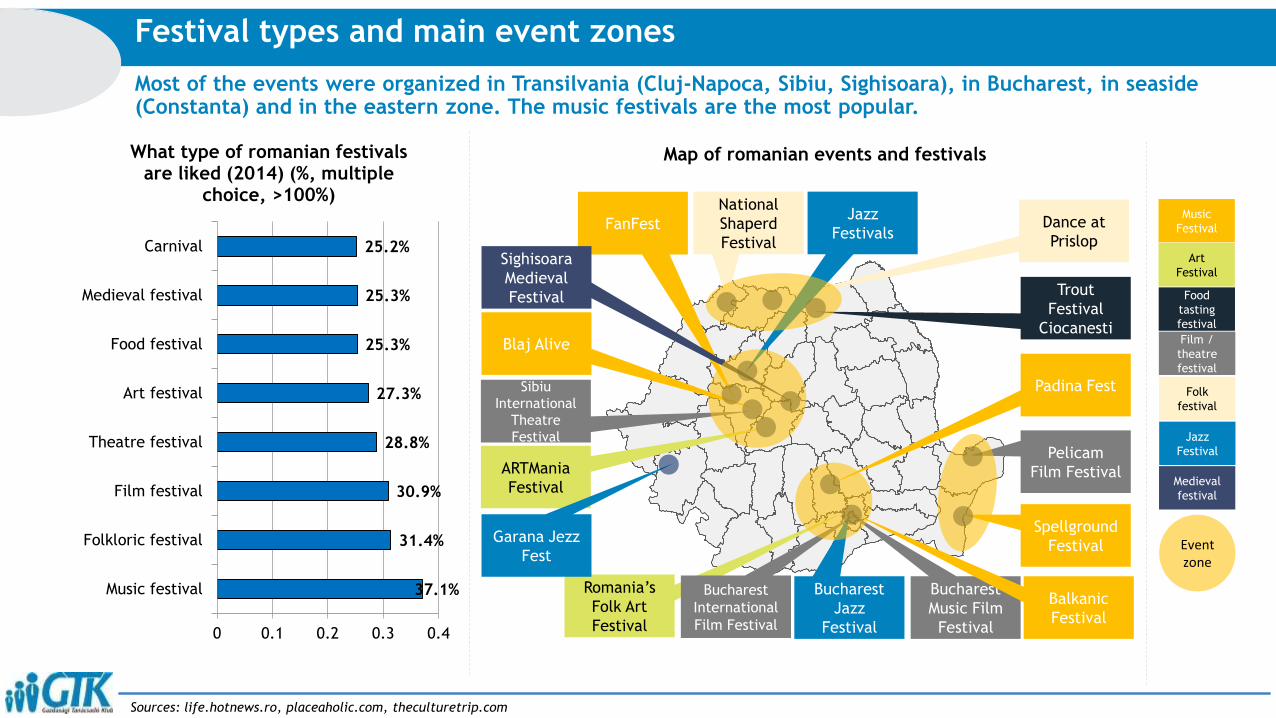
Most of the events were organized in Transilvania (Cluj-Napoca, Sibiu, Sighisoara), in Bucharest, in seaside (Constanta) and in the eastern zone. The music festivals are the most popular.
Festival types and main event zones
Sources: life.hotnews.ro, placeaholic.com, theculturetrip.com
Bucharest
Music Film
Festival
Pelicam
Film Festival
Bucharest
Jazz
Festival
FanFest
ARTMania
Festival
Sighisoara
Medieval
Festival
Sibiu
International
Theatre
Festival
Trout
Festival
Ciocanesti
Dance at
Prislop
Romania’s
Folk Art
Festival
National
Shaperd
Festival
Garana Jezz
Fest
Blaj Alive
Padina Fest
Balkanic
Festival
Spellground
Festival
Bucharest
International
Film Festival
Jazz
Festivals
Music
Festival
Art
Festival
Food
tasting
festival
Film /
theatre
festival
Folk
festival
Jazz
Festival
Medieval
festival
Event zone
37.1%
31.4%
30.9%
28.8%
27.3%
25.3%
25.3%
25.2%
0 0.1 0.2 0.3 0.4
Music festival
Folkloric festival
Film festival
Theatre festival
Art festival
Food festival
Medieval festival
Carnival
What type of romanian festivals are liked (2014) (%, multiple
choice, >100%)
Map of romanian events and festivals
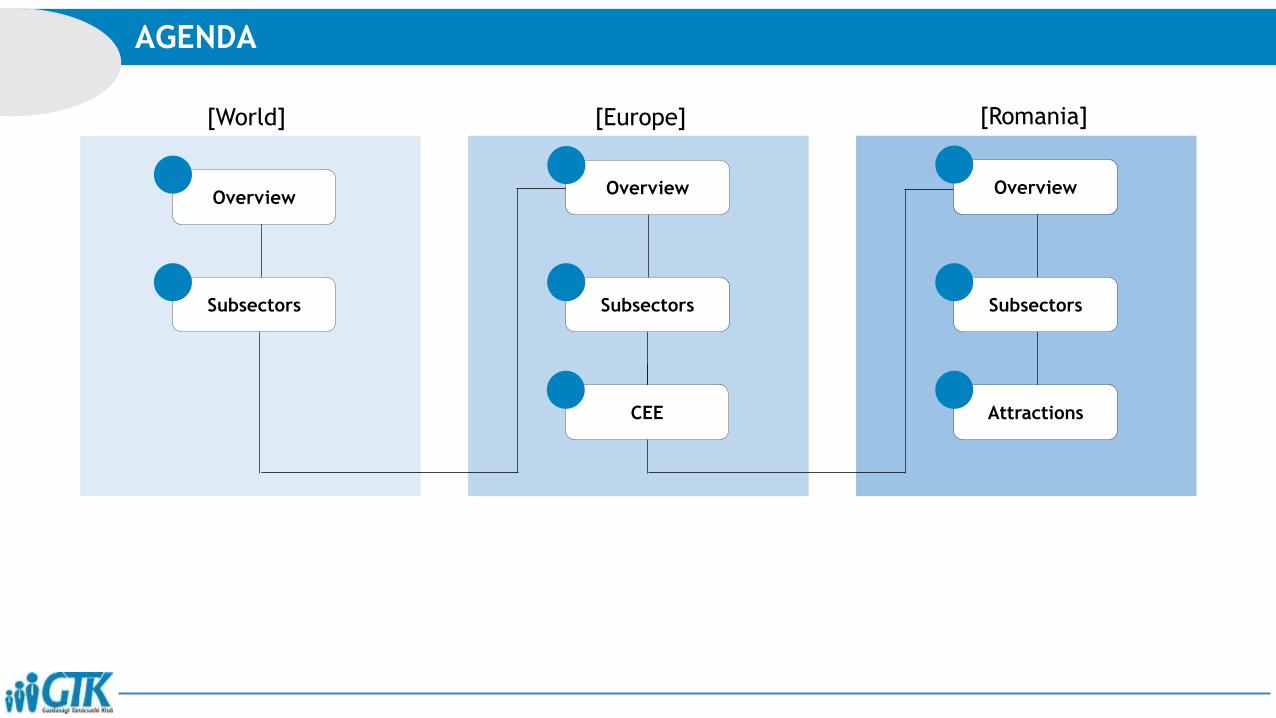
AGENDA
[World] [Europe] [Romania]
Overview
Subsectors
CEE
Overview
Subsectors
Attractions
Overview
Subsectors

The most developed region is Muntenia, but that is mainly because the capital, Bucharest is situated there. In thenumber of tourists and accommodations Transilvania is the second region, with almost 10 times more visitors than inOltenia.
Regions of Romania in 2015
Source: insse.ro, analizeeconomice.ro, infotravelromania.ro
Population
GDP/Capita
Tourists
GDP%
Accommod.
Motorways
Airports
Maramures,
Crisana & Banat
Bucovina
MoldovaOltenia Transilvania Muntenia Dobrogea
2,8 mil.
6 630 €
253k
2,16%
982
1
6
2 mil.
5 550 €
50k
1,5%
428
0
1
4 mil.
6 950 €
544k
1,92%
2548
2
3
4,1 mil.
5 326 €
130k
1,65%
915
0
2
6 mil.
7 127 €
1,1 mil.
3,77%
1053
3
2
0,8 mil.
7 487 €
74k
2,81%
895
1
2
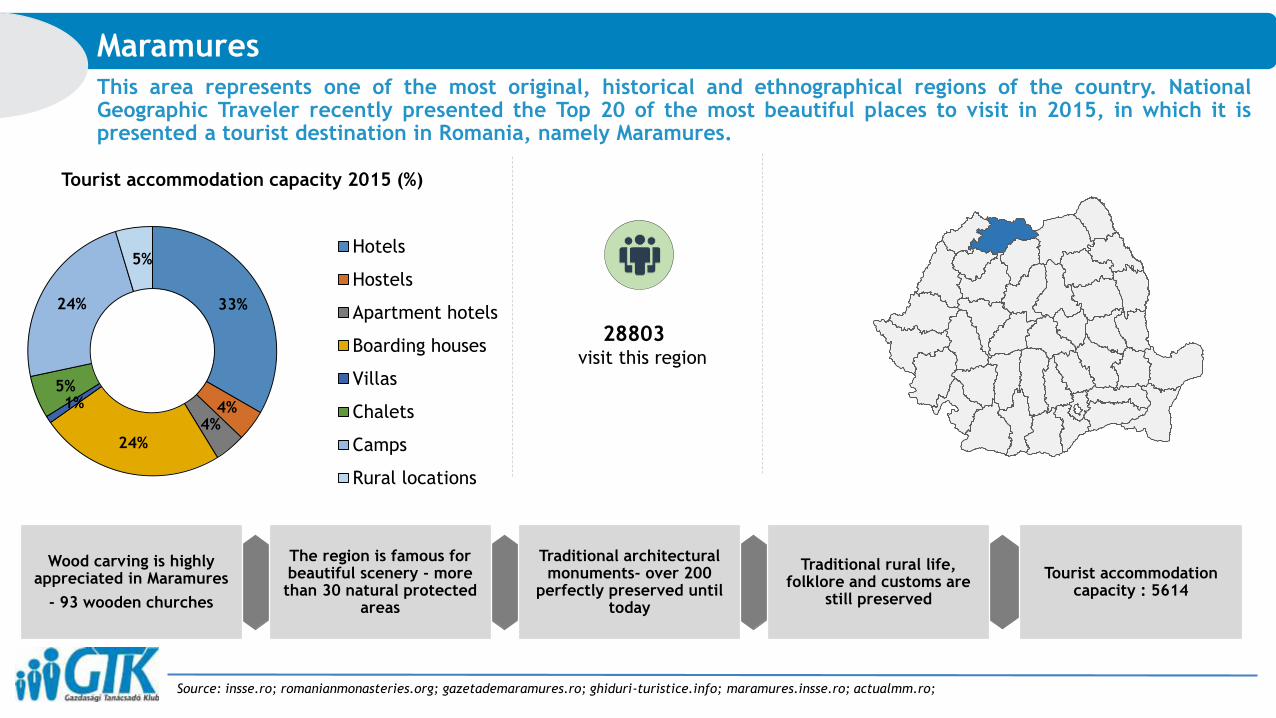
This area represents one of the most original, historical and ethnographical regions of the country. NationalGeographic Traveler recently presented the Top 20 of the most beautiful places to visit in 2015, in which it ispresented a tourist destination in Romania, namely Maramures.
Source: insse.ro; romanianmonasteries.org; gazetademaramures.ro; ghiduri-turistice.info; maramures.insse.ro; actualmm.ro;
Maramures
Traditional architectural monuments- over 200
perfectly preserved until today
Traditional rural life, folklore and customs are
still preserved
Tourist accommodation capacity : 5614
The region is famous for beautiful scenery - more than 30 natural protected
areas
Wood carving is highly appreciated in Maramures
- 93 wooden churches
28803visit this region
33%
4%4%
24%
1%5%
24%
5%
Tourist accommodation capacity 2015 (%)
Hotels
Hostels
Apartment hotels
Boarding houses
Villas
Chalets
Camps
Rural locations
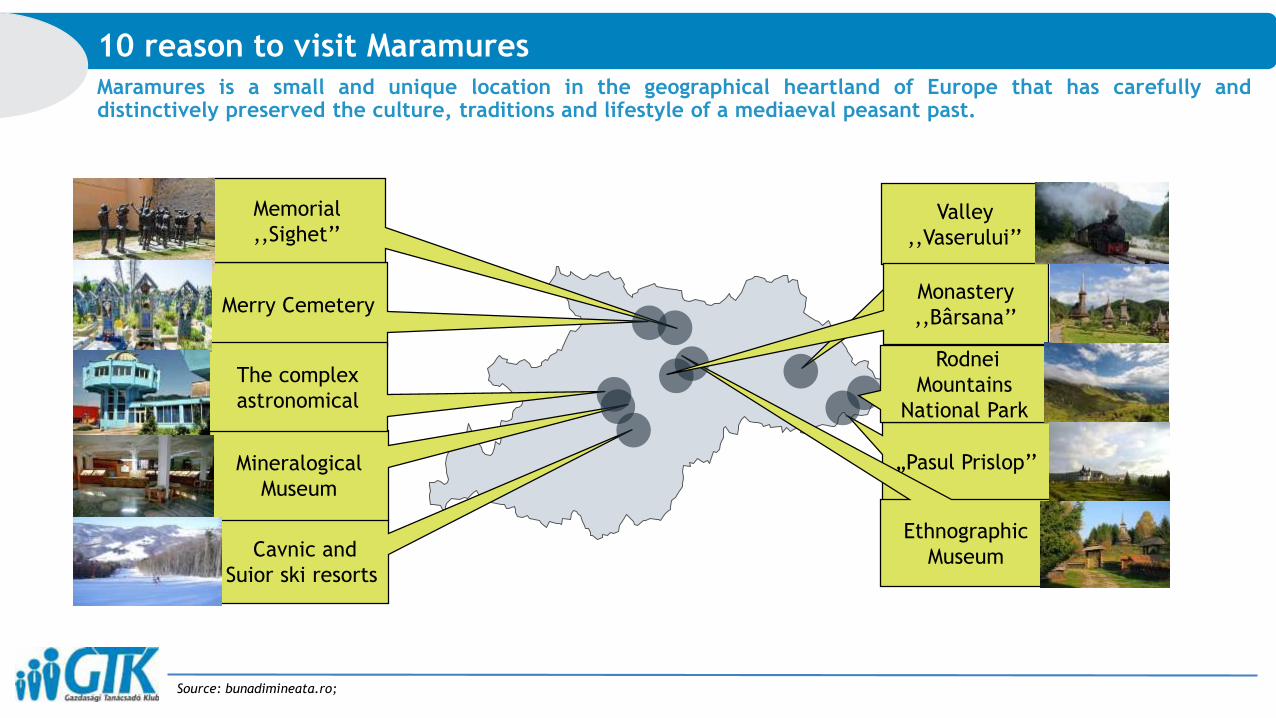
Maramures is a small and unique location in the geographical heartland of Europe that has carefully anddistinctively preserved the culture, traditions and lifestyle of a mediaeval peasant past.
Source: bunadimineata.ro;
10 reason to visit Maramures
Merry Cemetery
Cavnic and
Suior ski resorts
Valley
,,Vaserului’’
„Pasul Prislop’’
Memorial
,,Sighet’’
Ethnographic
Museum
Mineralogical
Museum
The complex
astronomical
Rodnei
Mountains
National Park
Monastery
,,Bârsana’’
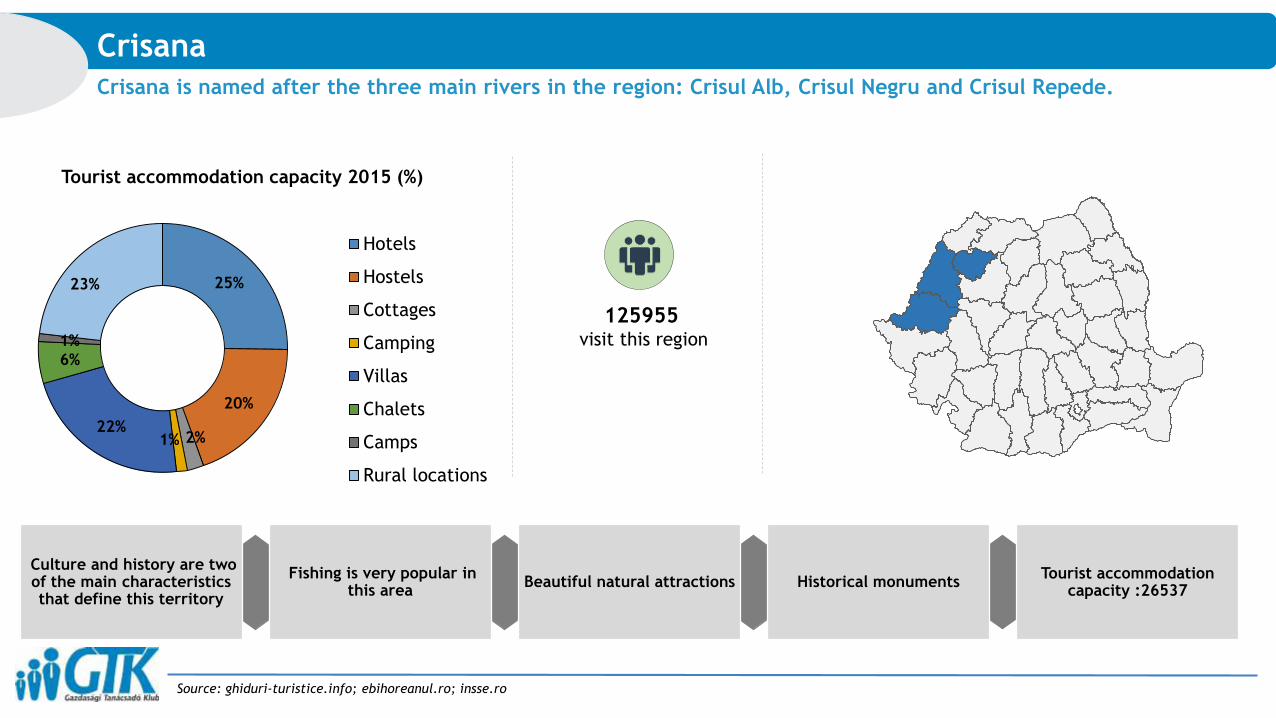
Crisana is named after the three main rivers in the region: Crisul Alb, Crisul Negru and Crisul Repede.
Source: ghiduri-turistice.info; ebihoreanul.ro; insse.ro
Crisana
Beautiful natural attractions Historical monumentsTourist accommodation
capacity :26537Fishing is very popular in
this area
Culture and history are two of the main characteristics that define this territory
125955visit this region
25%
20%
2%1%22%
6%
1%
23%
Tourist accommodation capacity 2015 (%)
Hotels
Hostels
Cottages
Camping
Villas
Chalets
Camps
Rural locations
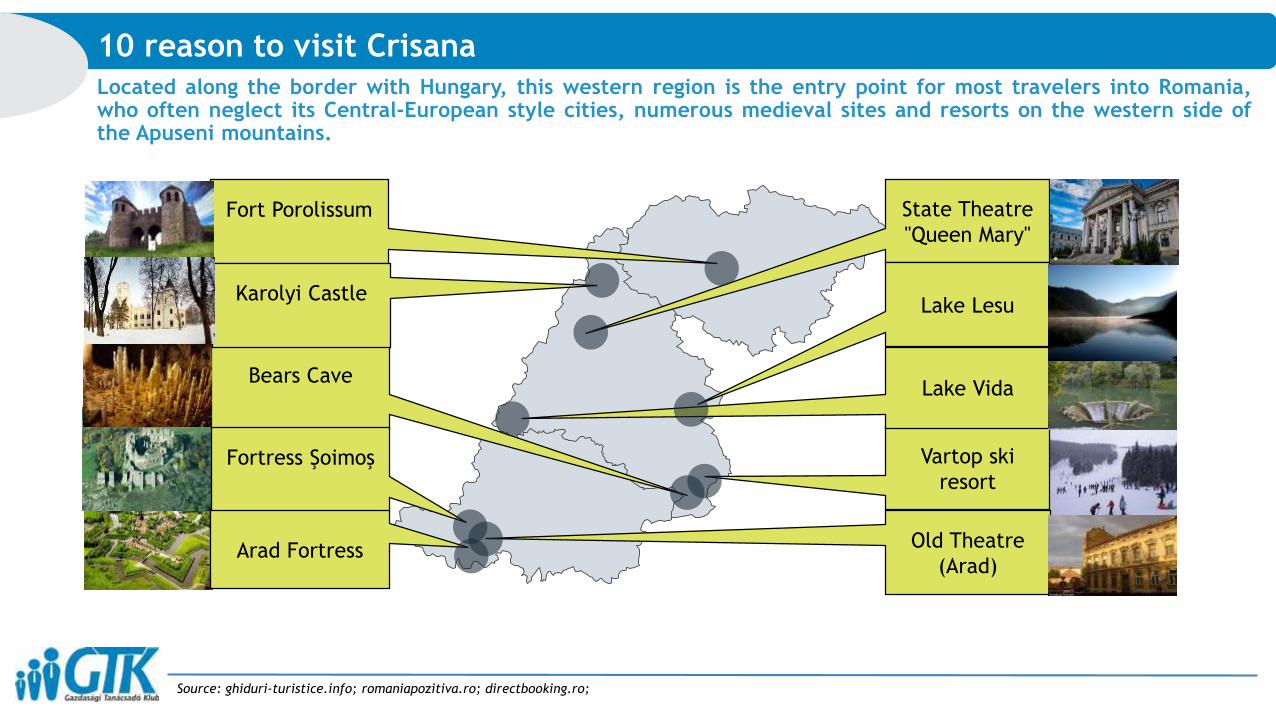
Located along the border with Hungary, this western region is the entry point for most travelers into Romania,who often neglect its Central-European style cities, numerous medieval sites and resorts on the western side ofthe Apuseni mountains.
Source: ghiduri-turistice.info; romaniapozitiva.ro; directbooking.ro;
10 reason to visit Crisana
Bears Cave
Fortress Şoimoş
Fort Porolissum
Karolyi Castle
Vartop ski
resort
State Theatre
"Queen Mary"
Lake Vida
Lake Lesu
Old Theatre
(Arad)Arad Fortress

This ancient habitation area and Romanian culture region, is situated in the South Eastern part of Romania,between the Danube, the Mures river and the Southern Carpathians chain.
Source: insse.ro; pressalert.ro;
Banat
Ethnography and folklore remained unaltered in this
region
The cuisine is very diverse and representative of the
Euroregion.
Tourist accommodation capacity : 17360
Specific architecture of heritage buildings
Historical monuments
101597visit this region
30%
42%
6%
2%4%1%1%
14%
Tourist accommodation capacity 2015 (%)
Hotels
Hostels
Cottages
Camping
Villas
Chalets
Camps
Rural locations
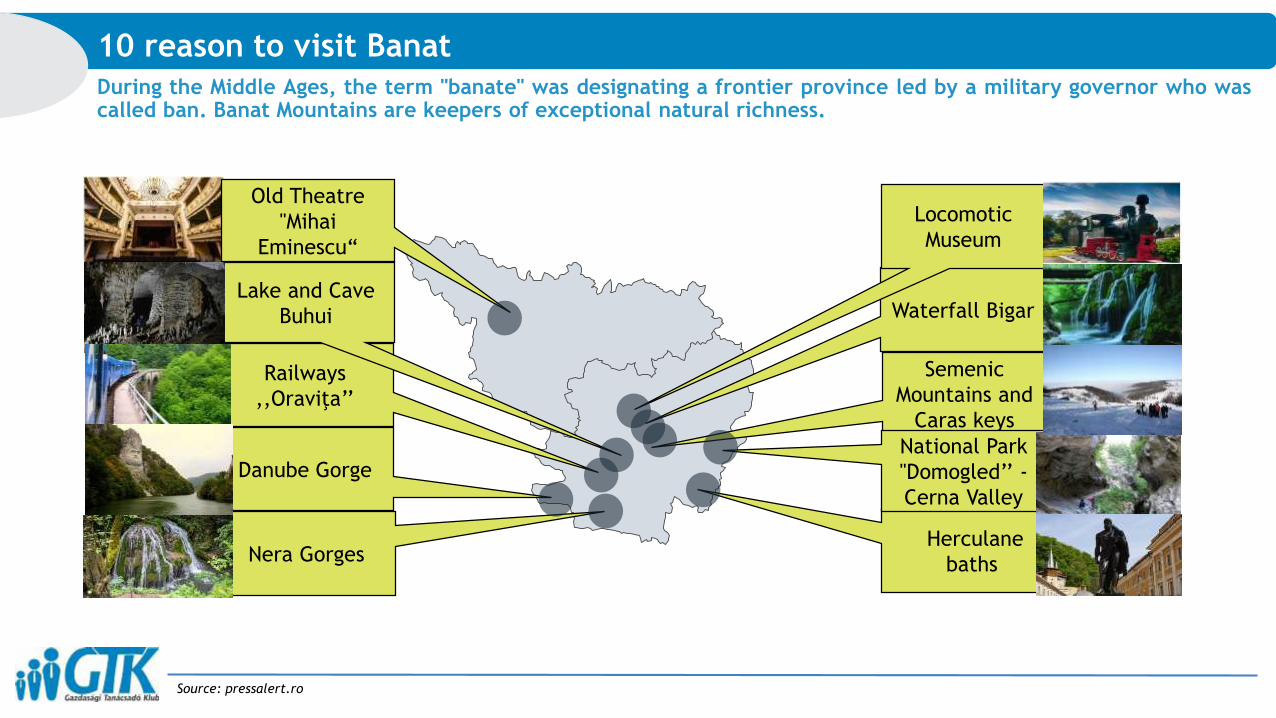
During the Middle Ages, the term "banate" was designating a frontier province led by a military governor who wascalled ban. Banat Mountains are keepers of exceptional natural richness.
Source: pressalert.ro
10 reason to visit Banat
Nera GorgesHerculane
baths
Waterfall Bigar
Semenic
Mountains and
Caras keys
Danube Gorge
Railways
,,Oraviţa’’
Lake and Cave
Buhui
Old Theatre
"Mihai
Eminescu“
Locomotic
Museum
National Park
"Domogled’’ -
Cerna Valley
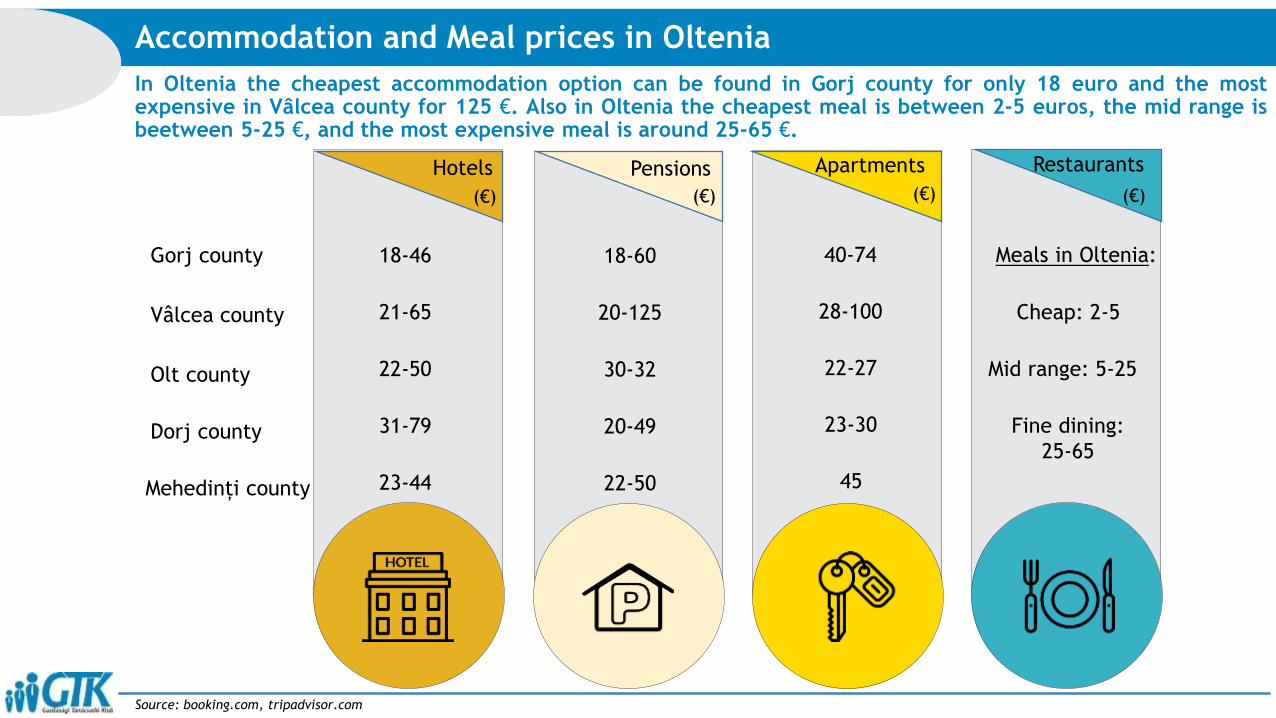
In Oltenia the cheapest accommodation option can be found in Gorj county for only 18 euro and the mostexpensive in Vâlcea county for 125 €. Also in Oltenia the cheapest meal is between 2-5 euros, the mid range isbeetween 5-25 €, and the most expensive meal is around 25-65 €.
Accommodation and Meal prices in Oltenia
Source: booking.com, tripadvisor.com
Hotels Pensions
18-46
21-65
22-50
31-79
23-44
18-60
20-125
30-32
20-49
22-50
40-74
28-100
22-27
23-30
45
Cheap: 2-5
Mid range: 5-25
Fine dining:
25-65
Apartments Restaurants
Gorj county
Vâlcea county
Olt county
Dorj county
Mehedinți county
Meals in Oltenia:
(€) (€) (€) (€)
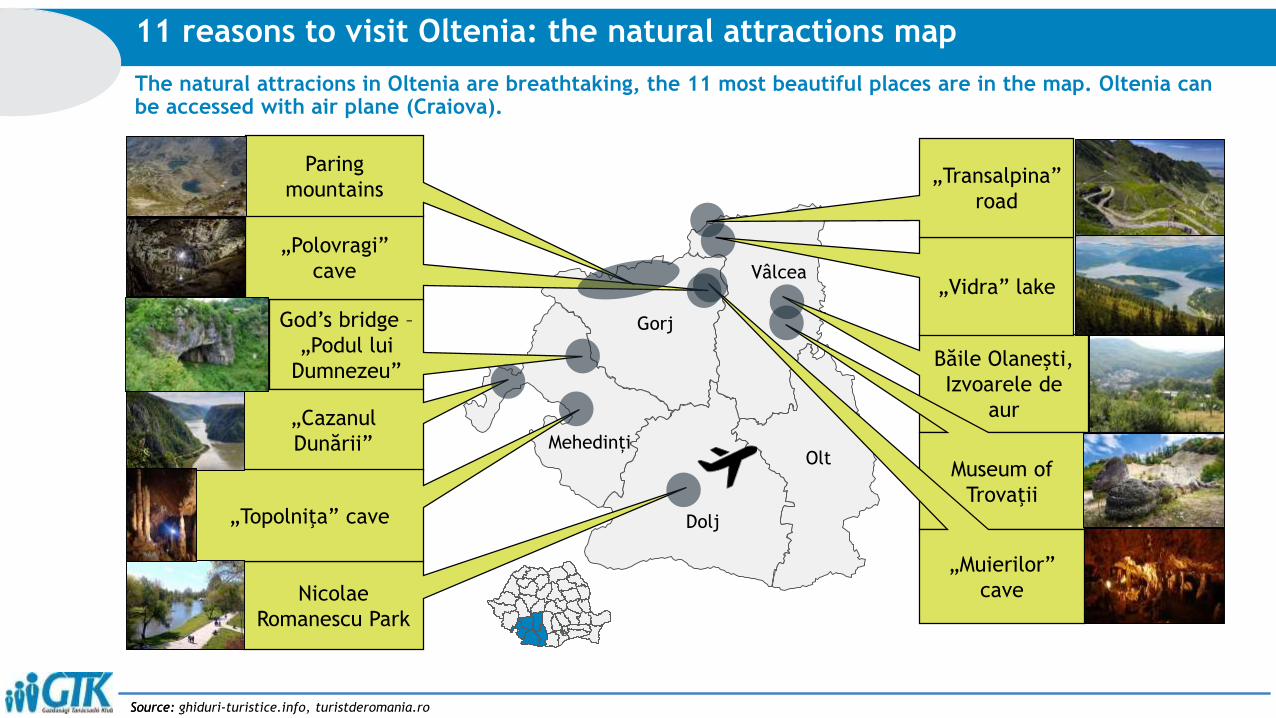
Source: ghiduri-turistice.info, turistderomania.roSource:
The natural attracions in Oltenia are breathtaking, the 11 most beautiful places are in the map. Oltenia can be accessed with air plane (Craiova).
11 reasons to visit Oltenia: the natural attractions map
God’s bridge –
„Podul lui
Dumnezeu”
Nicolae
Romanescu Park
„Polovragi”
cave
Băile Olaneşti,
Izvoarele de
aur
Museum of
Trovaţii
„Muierilor”
cave
„Cazanul
Dunării”
Paring
mountains
„Vidra” lake
„Transalpina”
road
„Topolniţa” cave
Vâlcea
Gorj
Olt
Dolj
Mehedinți
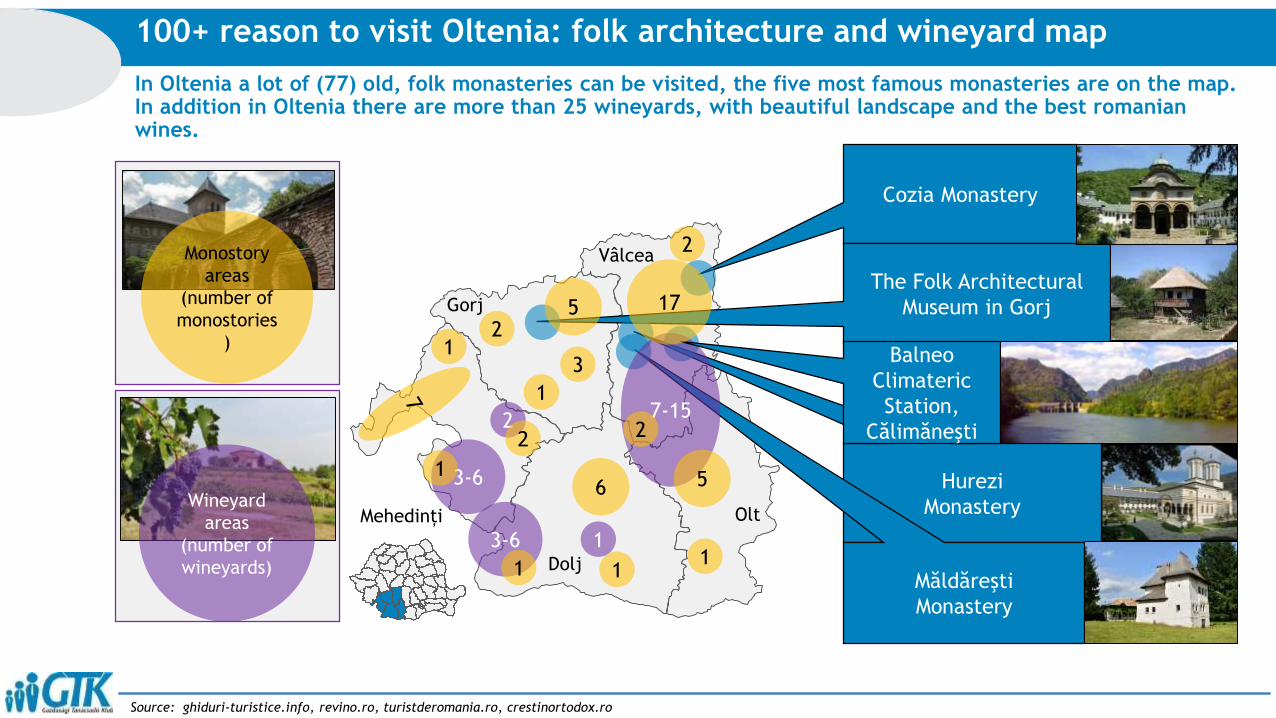
In Oltenia a lot of (77) old, folk monasteries can be visited, the five most famous monasteries are on the map. In addition in Oltenia there are more than 25 wineyards, with beautiful landscape and the best romanian wines.
100+ reason to visit Oltenia: folk architecture and wineyard map
Source: ghiduri-turistice.info, revino.ro, turistderomania.ro, crestinortodox.ro
Hurezi
Monastery
Măldăreşti
Monastery
Cozia Monastery
The Folk Architectural
Museum in Gorj
2
3-6
7-15
1
3-6
Balneo
Climateric
Station,
Călimăneşti
2
2
56
5 17
111
1
3
2
21
1
000Wineyard
areas
(number of
wineyards)
Monostory
areas
(number of
monostories
)
Vâlcea
Gorj
Olt
Dolj
Mehedinți
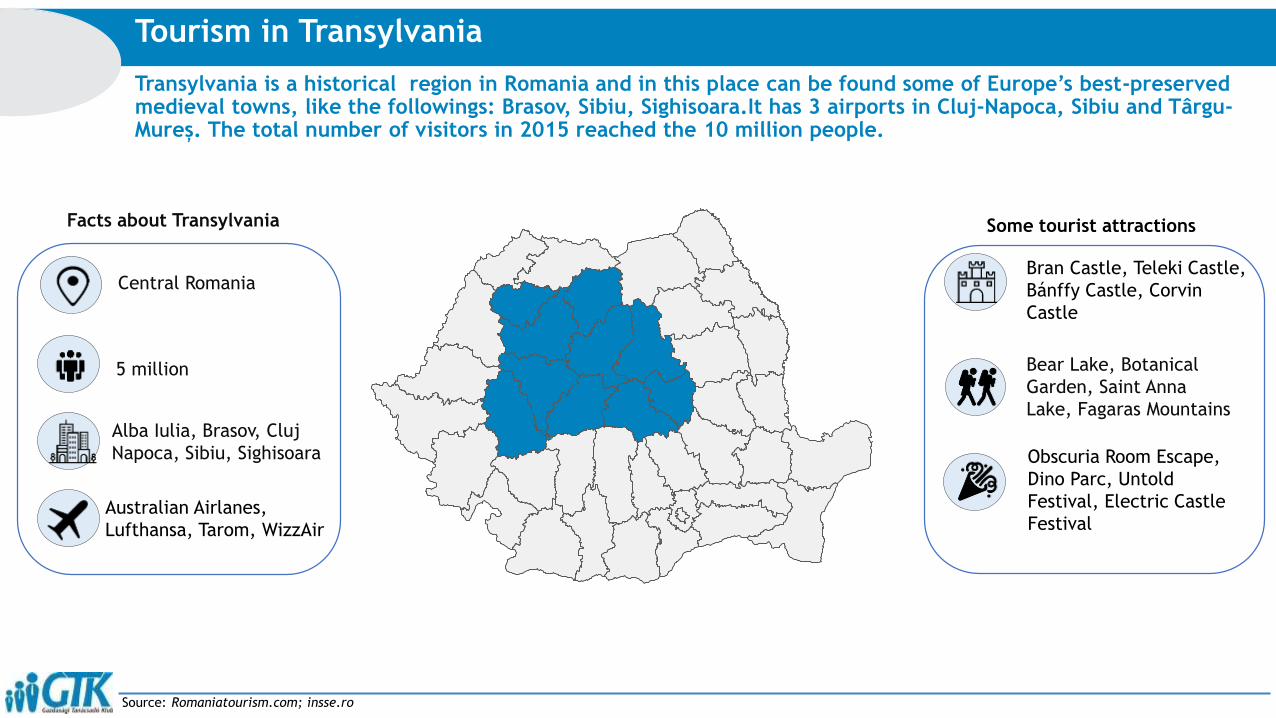
Source:
Transylvania is a historical region in Romania and in this place can be found some of Europe’s best-preserved medieval towns, like the followings: Brasov, Sibiu, Sighisoara.It has 3 airports in Cluj-Napoca, Sibiu and Târgu-Mureș. The total number of visitors in 2015 reached the 10 million people.
Tourism in Transylvania
Facts about Transylvania
Central Romania
5 million
Alba Iulia, Brasov, Cluj
Napoca, Sibiu, Sighisoara
Australian Airlanes,
Lufthansa, Tarom, WizzAir
Some tourist attractions
Bran Castle, Teleki Castle,
Bánffy Castle, Corvin
Castle
Bear Lake, Botanical
Garden, Saint Anna
Lake, Fagaras Mountains
Obscuria Room Escape,
Dino Parc, Untold
Festival, Electric Castle
Festival
Romaniatourism.com; insse.ro

Source:
In 2015 the most visited cities in Transylvania were Alba Iulia,Brașov, Cluj-Napoca, Sighișoara and Sibiu.The total number of visitors reached the 1,31 million capita.Totally 516 hotels in theese cities, 38 museums, 11 cinemas and 5 theatres.
Characteristics of TOP 5 tourist cities in Transylvania in 2015
Number of tourists
(thousand capita)
Alba Iulia: 62
Brașov: 514
Sighișoara: 94
Cluj Napoca: 319
Sibiu: 320
Number of hotels
Alba Iulia: 30
Brașov: 194
Sighișoara: 69
Cluj Napoca: 86
Sibiu: 137
Number of museums
Alba Iulia: 2
Brașov: 16
Sighișoara: 4
Cluj Napoca: 9
Sibiu: 7
Cinema and theatre
Alba Iulia: 1 cinema
1 theatre
Brașov: 2 cinema
1 theatre
Sighișoara: 1 cinema
no theatre
Cluj Napoca: 6 cinema
2 theatre
Sibiu: 1 cinema
1 theatre
Statistici.insse.ro, tripadvisor.co.uk;

Source:
In Transylvania there are innumerable wonderful places to visit. The best places by tourists are presented onthe map. Transylvania can be accessed with airplane (Cluj-Napoca, Targu-Mures, Sibiu)
TOP 10 tourist attractions in Transylvania
Bran Castle
Brasov Historical
CenterAlba
Iulia
Sibiu
Historical
Center
Tripadvisor.com
Sighisoara
SovataTurda Gorge
Corvin Castle
CulturePalace
Predeal

Bucovina was one of the most visited region in Romania in 2015 with 2.2 million visitor of which only 400thousand was the foreign visitor.
Bucovina region in Romania 2015
Source:intotourism.ro, tourismbucovina.ro, obiectivdesuceava.ro, romanialibera.ro;
2.2 million visitor.
400 thousand foreign visitor.
Bucovina
• Continental Suceava
• Hotel Residenz
• Hotel Sonnenhof
• Etnographic museum
• “Arta Lemnului” museum
• National museum - Bucovina
Monesteries:
Humor, Moldovita, Arbore,
Voronet, Sucevita
Vatra Dornei
Gura Humorului
Campulung Moldovenesc
The number of tourist visited Bucovina region
was 400 thousand which was only 18% of the
total visitor in 2015. In this region has a lot of
UNESCO heritage, monasteries: Humor,
Arbore, Voronet, Moldovita, Sucevita.
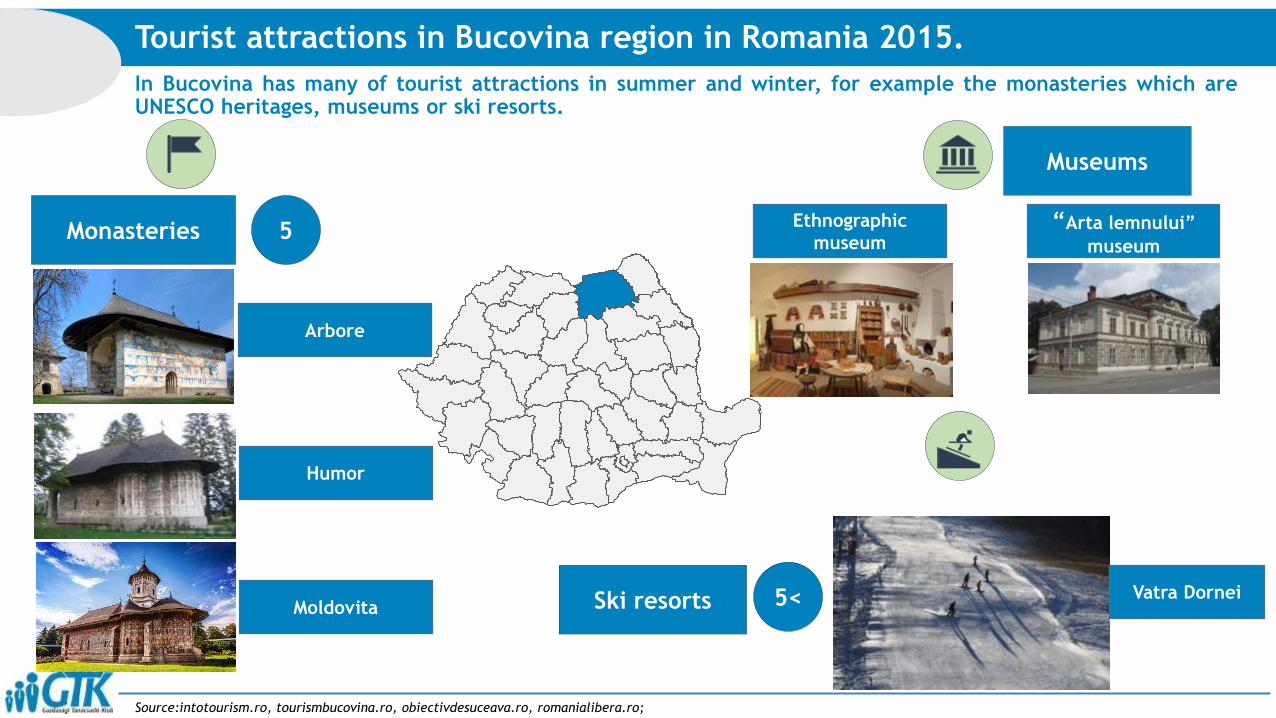
In Bucovina has many of tourist attractions in summer and winter, for example the monasteries which areUNESCO heritages, museums or ski resorts.
Tourist attractions in Bucovina region in Romania 2015.
Source:intotourism.ro, tourismbucovina.ro, obiectivdesuceava.ro, romanialibera.ro;
5Monasteries
5<Ski resorts
Ethnographic
museum“Arta lemnului”
museum
Arbore
Humor
MoldovitaVatra Dornei
Museums
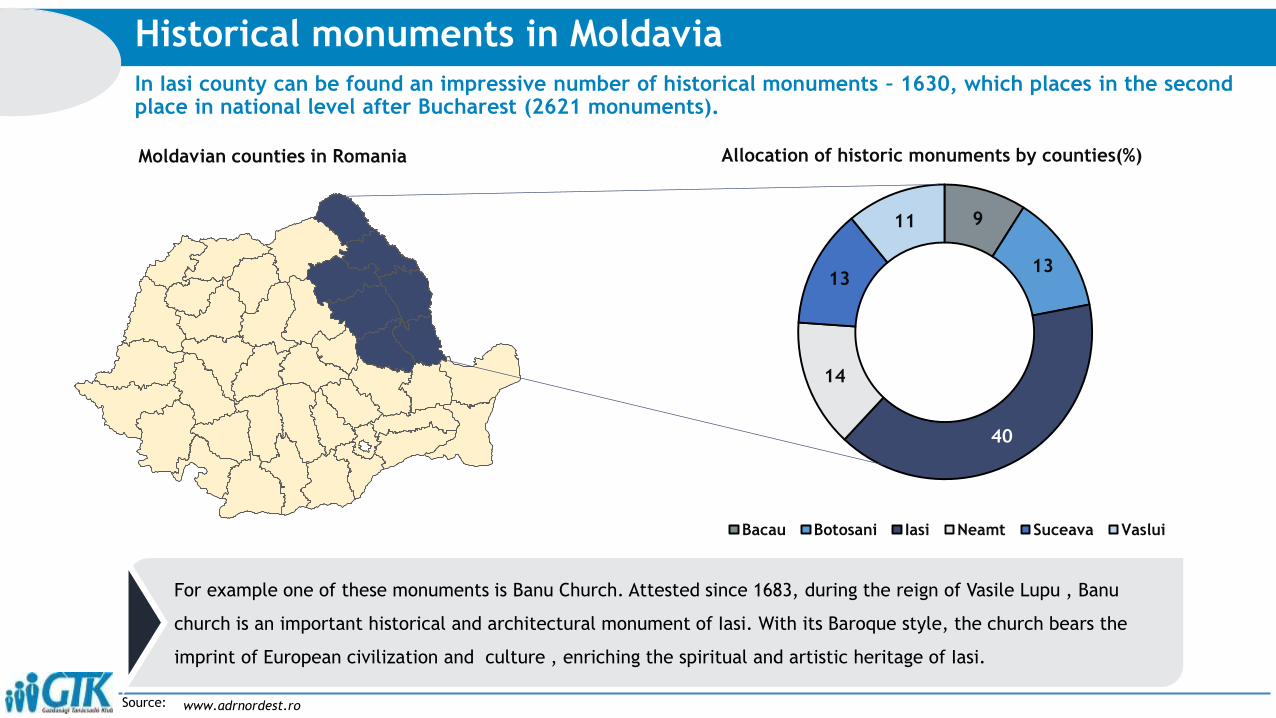
Source:
In Iasi county can be found an impressive number of historical monuments – 1630, which places in the second place in national level after Bucharest (2621 monuments).
Historical monuments in Moldavia
9
13
40
14
13
11
Allocation of historic monuments by counties(%)
Bacau Botosani Iasi Neamt Suceava Vaslui
For example one of these monuments is Banu Church. Attested since 1683, during the reign of Vasile Lupu , Banu
church is an important historical and architectural monument of Iasi. With its Baroque style, the church bears the
imprint of European civilization and culture , enriching the spiritual and artistic heritage of Iasi.
Moldavian counties in Romania
www.adrnordest.ro
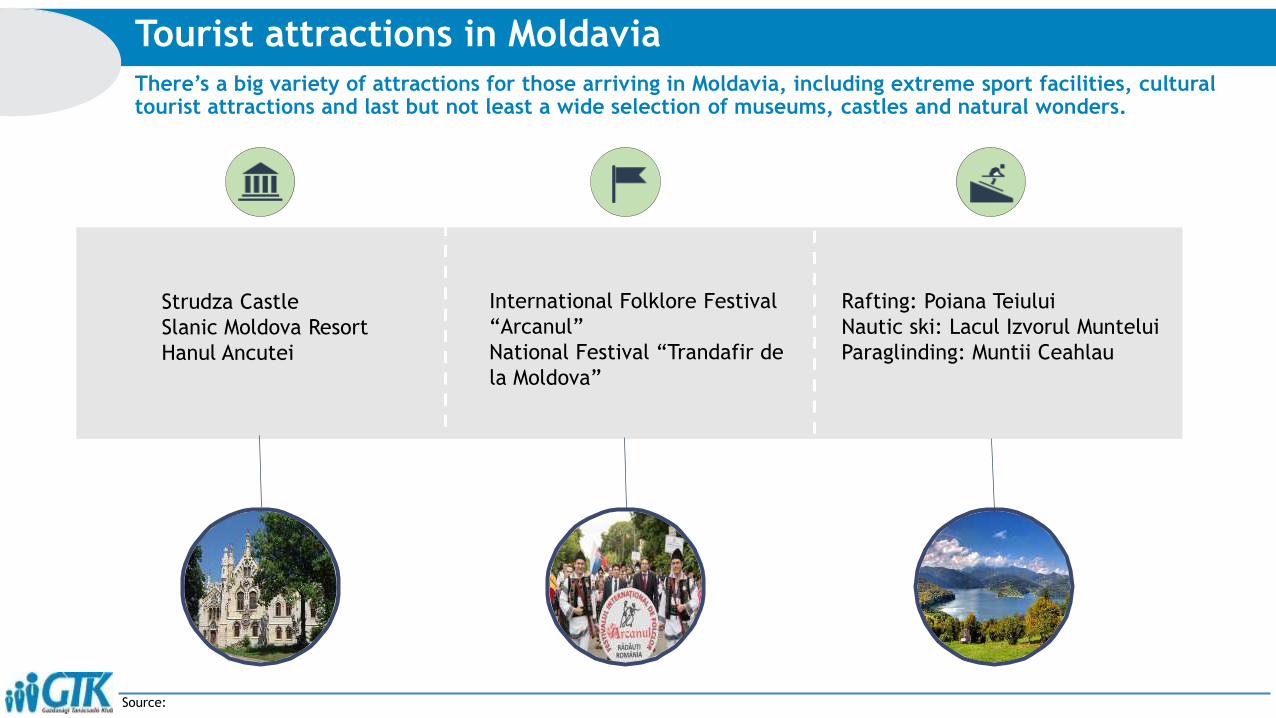
Source:
There’s a big variety of attractions for those arriving in Moldavia, including extreme sport facilities, cultural tourist attractions and last but not least a wide selection of museums, castles and natural wonders.
Tourist attractions in Moldavia
Rafting: Poiana Teiului
Nautic ski: Lacul Izvorul Muntelui
Paraglinding: Muntii Ceahlau
Strudza Castle
Slanic Moldova Resort
Hanul Ancutei
International Folklore Festival
“Arcanul”
National Festival “Trandafir de
la Moldova”

Number of existing places in the Muntenian region shows an average annual growth of 4% between 2011 and2015.
Tourist accommodation establishments 2011-2015
Source: insse.ro
646 706770 786
881
164184
191 189
198
0
200
400
600
800
1000
1200
2011 2012 2013 2014 2015
Tourist reception establishments in Muntenia 2011-2015(no.)
Total Hotels
29
32 33 34 35
0
5
10
15
20
25
30
35
40
2011 2012 2013 2014 2015
Tourists can be accomodated 2011-2015( thousand no.)
Muntenia has a variety of tourism form manifestations: natural landscapes and parks, religious tourism, winter
tourism. This potential helps the region to grow with 1% faster, than national average.
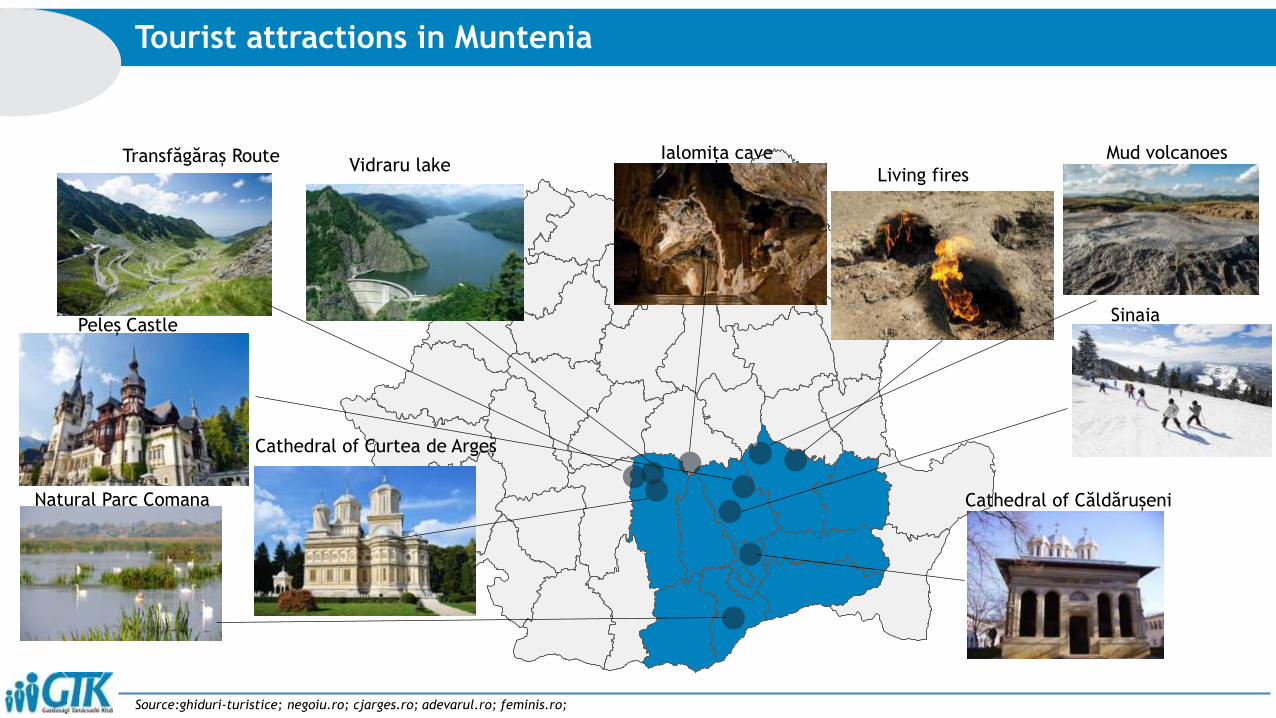
Tourist attractions in Muntenia
Source:ghiduri-turistice; negoiu.ro; cjarges.ro; adevarul.ro; feminis.ro;
Natural Parc Comana Cathedral of Căldărușeni
Sinaia
Ialomița cave Mud volcanoesVidraru lake
Cathedral of Curtea de Argeș
Transfăgăraș Route
Peleș Castle
Living fires
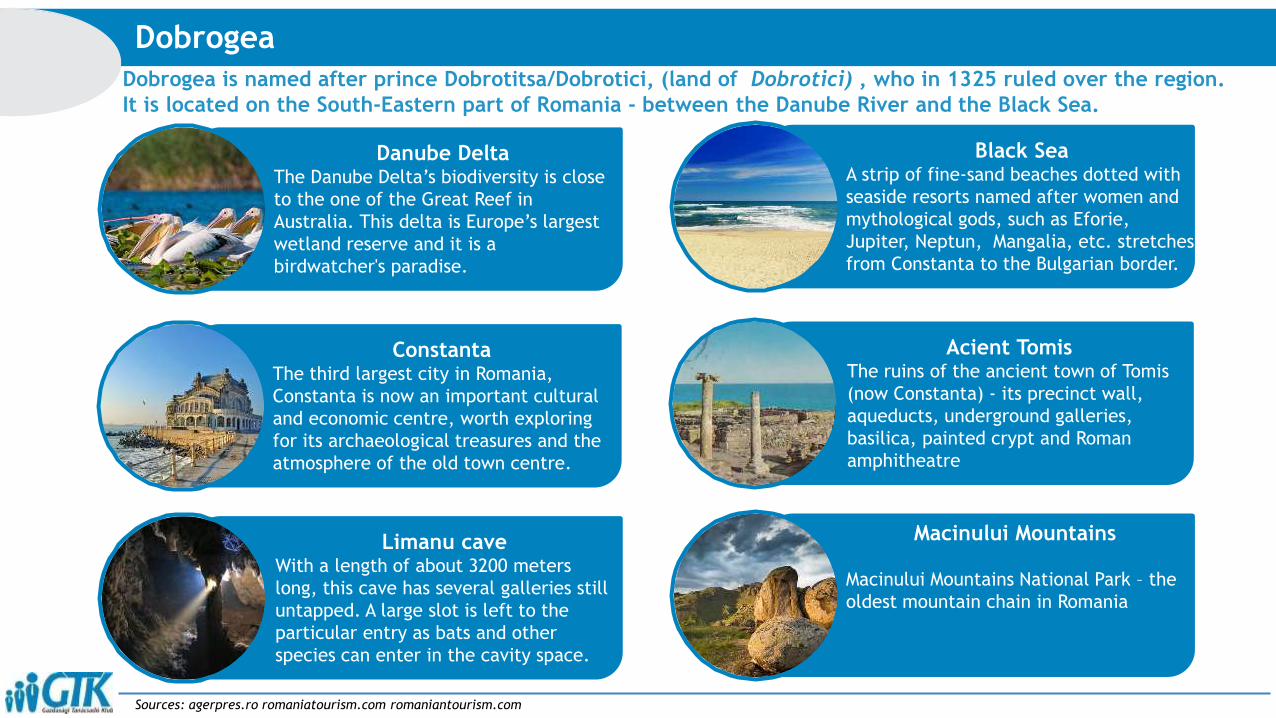
Dobrogea is named after prince Dobrotitsa/Dobrotici, (land of Dobrotici) , who in 1325 ruled over the region.
It is located on the South-Eastern part of Romania - between the Danube River and the Black Sea.
Dobrogea
Danube DeltaThe Danube Delta’s biodiversity is close
to the one of the Great Reef in
Australia. This delta is Europe’s largest
wetland reserve and it is a
birdwatcher's paradise.
Sources: agerpres.ro romaniatourism.com romaniantourism.com
ConstantaThe third largest city in Romania,
Constanta is now an important cultural
and economic centre, worth exploring
for its archaeological treasures and the
atmosphere of the old town centre.
Limanu caveWith a length of about 3200 meters
long, this cave has several galleries still
untapped. A large slot is left to the
particular entry as bats and other
species can enter in the cavity space.
Black SeaA strip of fine-sand beaches dotted with
seaside resorts named after women and
mythological gods, such as Eforie,
Jupiter, Neptun, Mangalia, etc. stretches
from Constanta to the Bulgarian border.
Macinului Mountains
Macinului Mountains National Park – the
oldest mountain chain in Romania
Acient TomisThe ruins of the ancient town of Tomis
(now Constanta) - its precinct wall,
aqueducts, underground galleries,
basilica, painted crypt and Roman
amphitheatre
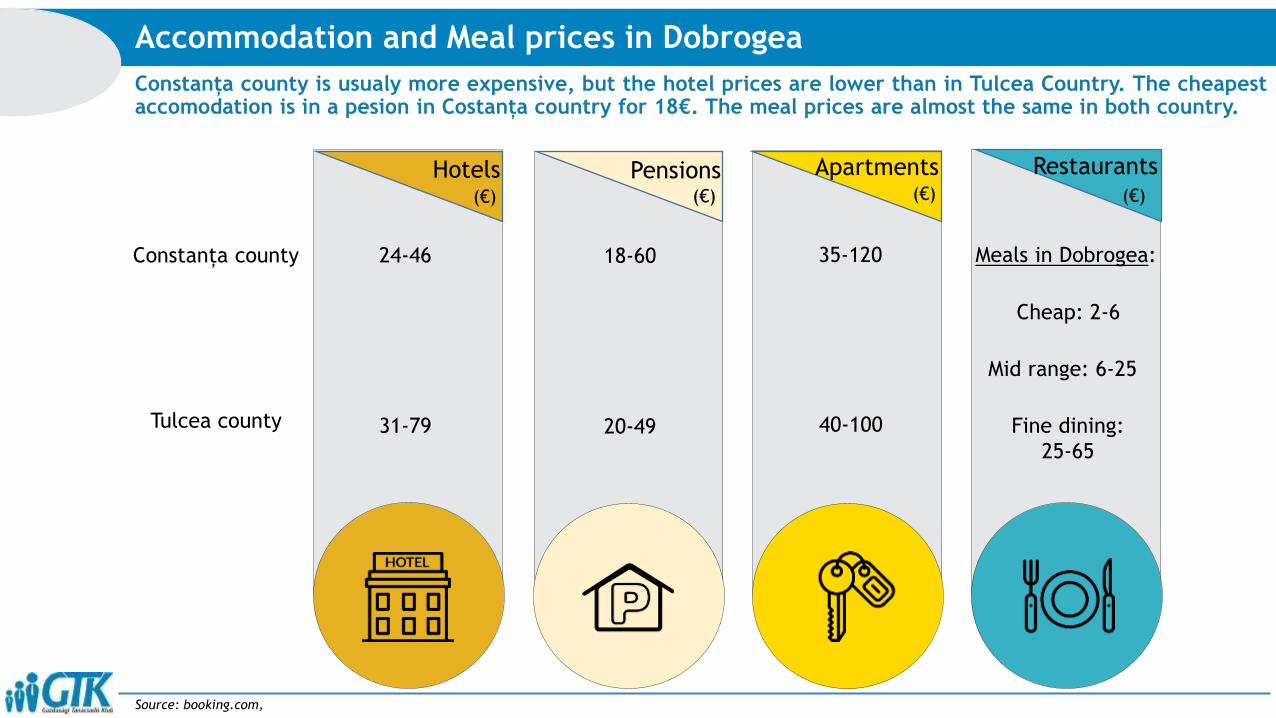
Constanța county is usualy more expensive, but the hotel prices are lower than in Tulcea Country. The cheapestaccomodation is in a pesion in Costanța country for 18€. The meal prices are almost the same in both country.
Accommodation and Meal prices in Dobrogea
Source: booking.com,
Hotels Pensions
24-46
31-79
18-60
20-49
35-120
40-100
Cheap: 2-6
Mid range: 6-25
Fine dining:
25-65
Apartments Restaurants
Constanța county
Tulcea county
Meals in Dobrogea:
(€) (€) (€) (€)
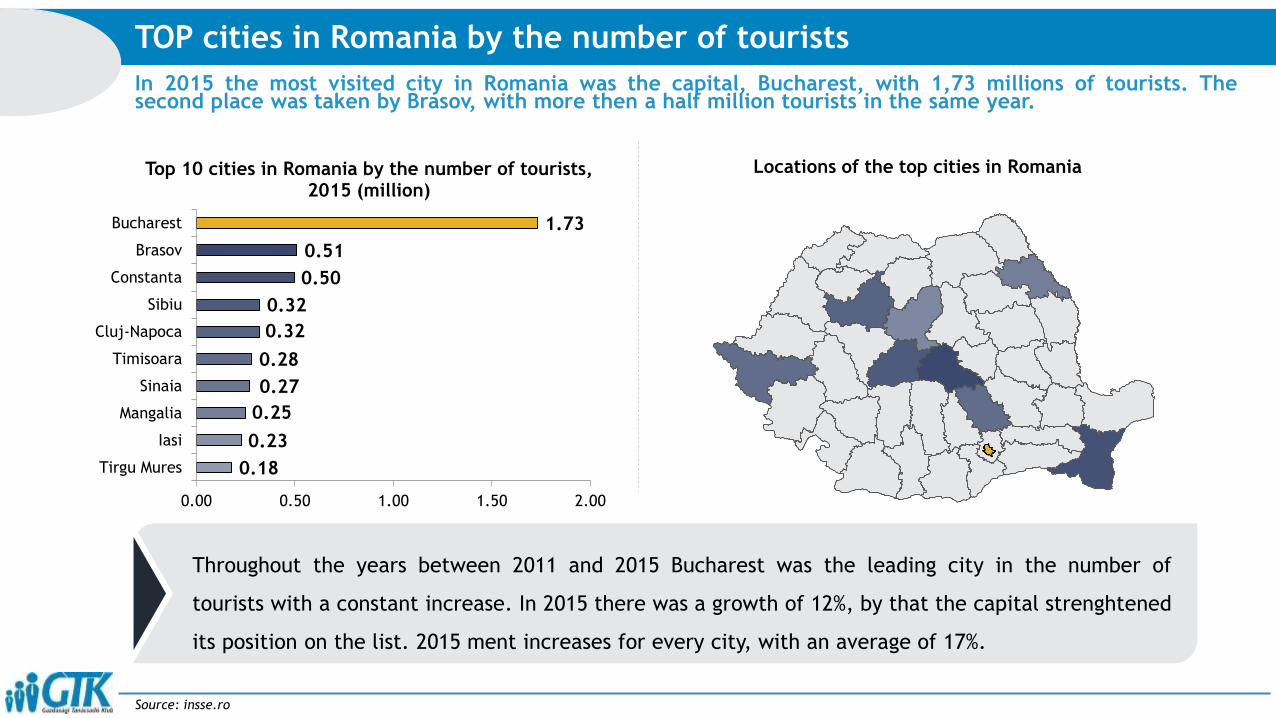
In 2015 the most visited city in Romania was the capital, Bucharest, with 1,73 millions of tourists. Thesecond place was taken by Brasov, with more then a half million tourists in the same year.
TOP cities in Romania by the number of tourists
Source: insse.ro
0.18
0.23
0.25
0.27
0.28
0.32
0.32
0.50
0.51
1.73
0.00 0.50 1.00 1.50 2.00
Tirgu Mures
Iasi
Mangalia
Sinaia
Timisoara
Cluj-Napoca
Sibiu
Constanta
Brasov
Bucharest
Top 10 cities in Romania by the number of tourists, 2015 (million)
Throughout the years between 2011 and 2015 Bucharest was the leading city in the number of
tourists with a constant increase. In 2015 there was a growth of 12%, by that the capital strenghtened
its position on the list. 2015 ment increases for every city, with an average of 17%.
Locations of the top cities in Romania
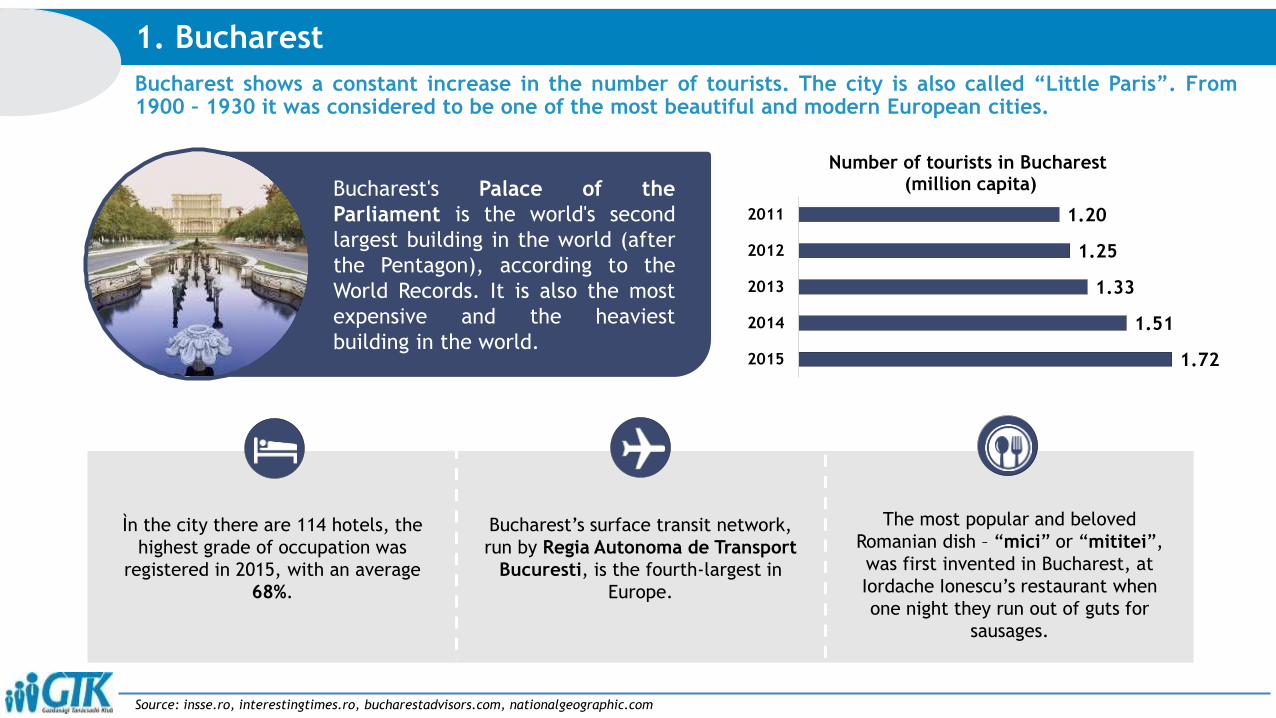
Bucharest shows a constant increase in the number of tourists. The city is also called “Little Paris”. From1900 – 1930 it was considered to be one of the most beautiful and modern European cities.
1. Bucharest
Source: insse.ro, interestingtimes.ro, bucharestadvisors.com, nationalgeographic.com
Bucharest's Palace of the
Parliament is the world's second
largest building in the world (after
the Pentagon), according to the
World Records. It is also the most
expensive and the heaviest
building in the world.
Ìn the city there are 114 hotels, the
highest grade of occupation was
registered in 2015, with an average
68%.
Bucharest’s surface transit network,
run by Regia Autonoma de Transport
Bucuresti, is the fourth-largest in
Europe.
The most popular and beloved
Romanian dish – “mici” or “mititei”,
was first invented in Bucharest, at
Iordache Ionescu’s restaurant when
one night they run out of guts for
sausages.
1.72
1.51
1.33
1.25
1.20
2015
2014
2013
2012
2011
Number of tourists in Bucharest(million capita)
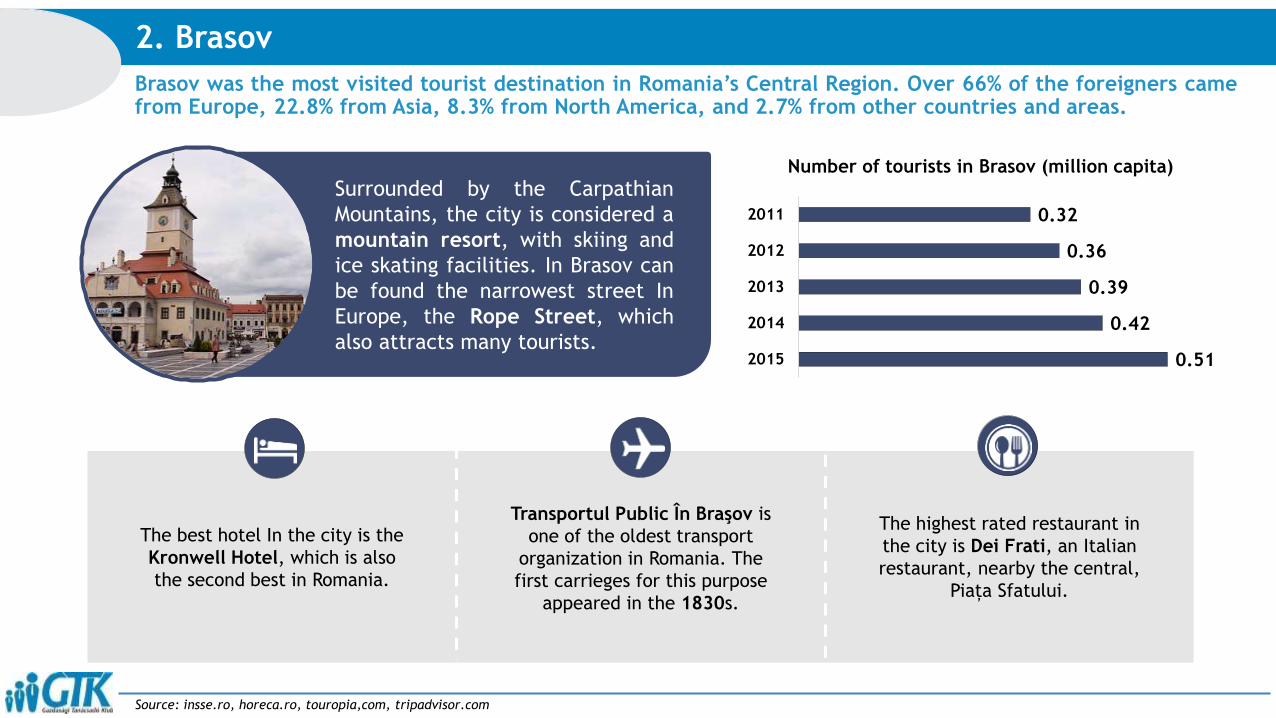
Brasov was the most visited tourist destination in Romania’s Central Region. Over 66% of the foreigners camefrom Europe, 22.8% from Asia, 8.3% from North America, and 2.7% from other countries and areas.
2. Brasov
Source: insse.ro, horeca.ro, touropia,com, tripadvisor.com
0.51
0.42
0.39
0.36
0.32
2015
2014
2013
2012
2011
Number of tourists in Brasov (million capita)
Surrounded by the Carpathian
Mountains, the city is considered a
mountain resort, with skiing and
ice skating facilities. In Brasov can
be found the narrowest street In
Europe, the Rope Street, which
also attracts many tourists.
Transportul Public În Braşov is
one of the oldest transport
organization in Romania. The
first carrieges for this purpose
appeared in the 1830s.
The best hotel In the city is the
Kronwell Hotel, which is also
the second best in Romania.
The highest rated restaurant in
the city is Dei Frati, an Italian
restaurant, nearby the central,
Piața Sfatului.

Not only Romanians visit the city in big numbers, but also foreigners. The number of tourists who arrive bycruise ships to the city is constantly growing, mostly American, French, Italian and German passengers.
3. Constanta
Source: insse.ro
0.50
0.44
0.44
0.46
0.43
2015
2014
2013
2012
2011
Number of tourists in Constanta(million capita)
Originally founded by the Greeks,
Constanta is over two and a half
millennia old. The city is full of
buildings with fascinatingly diverse
styles, and of course the Black Sea
beach is another big draw.
Constanta is the busiest port on
the Black Sea coast, and the
11th busiest port in Europe.
Splendid Hotel is the highest
rated hotel in the city, taking
the 10th place in Romania.
In the city you can taste one of
the Romanian traditional dishes,
the Dobrogeana Pancake, a
registered brand of the country.

Regarded to the city’s past and future titles, more tourists visit it every year, with an average growth of 12%.In 2015 25% of the visitors arrived from foreign countries.
4. Sibiu
Source: insse.ro
0.32
0.26
0.22
0.20
0.19
2015
2014
2013
2012
2011
Number of tourists in Sibiu(million capita)
In Sibiu county is located one of
the worlds ice hotels. Since 2005
every winter the Hotel of Ice is
rebuilt, namely from the materials
offered by nature.
Sibiu was designated European
Capital of Culture in 2007.
The historic center of Sibiu is still
partially enclosed by its original
12th-century medieval walls.
The city has its own airport, the
Sibiu Airport, where 5 airlines
operate flying to 9 different
locations. The number of passengers
in 2015 was 307 thousand.
The title of European Region of
Gastronomy 2019 has been
awarded to Sibiu. The city will host
gastronomy-related events
throughout 2019 that will showcase
regional culture and innovation.

After an decrease in the number of tourists in 2014, 2015 showed growth again. 20% of the visitors wereforeigners, mostly from Hungary, Germany, Italy, France, Poland.
5. Cluj-Napoca
Source: insse.ro, cluj.ro, ziuadecj.realitatea.net
0.32
0.26
0.27
0.24
0.22
2015
2014
2013
2012
2011
Number of tourists in Cluj-Napoca (million capita)
After Bucharests airport the Avram
Iancu Cluj International Airport has
the most wizzair destinations in
Romania
Home to the country’s largest
university, Cluj-Napoca is
considered the unofficial capital of
the historical region of
Transylvania. Cluj-Napoca is one
of Romania’s arts and cultural
centers. In 2015 it was European
Youth Capital.
The first street food festival in
Romania took place in Cluj, in the
summer of 2015. Over 50 vendors
were cooking over fires continuously
from morning till night over 200
recipes for dishes and drinks.
The hotel Hampton by Hilton Cluj is
one of the best Romanian hotels,
occupying the 24th place on the list.

The number of tourists visiting the Peleș Castle in Sinaia is growing year after year, in 2015 it was 300thousand. The Bran Castle is the most visited castle in Romania with 540.000 visitors per year.
Source: www.gandul.ro; www.financiarul.ro; www.tripadvisor.com;
-Bran Castle-
Location: Middle part of Romania,
Bran, Brașov County
Accessibility: European route E81,
A1 motorway
Seasons: All year
Visitors: 540 thousand
Location: Souteast part of Romania,
Sinaia, Prahova County
Accessibility: National roads- DN1
and DN71
Seasons: All year
Visitors: 300 thousand
Top 10 most popular atrractions in Romania
-Peleș Castle-
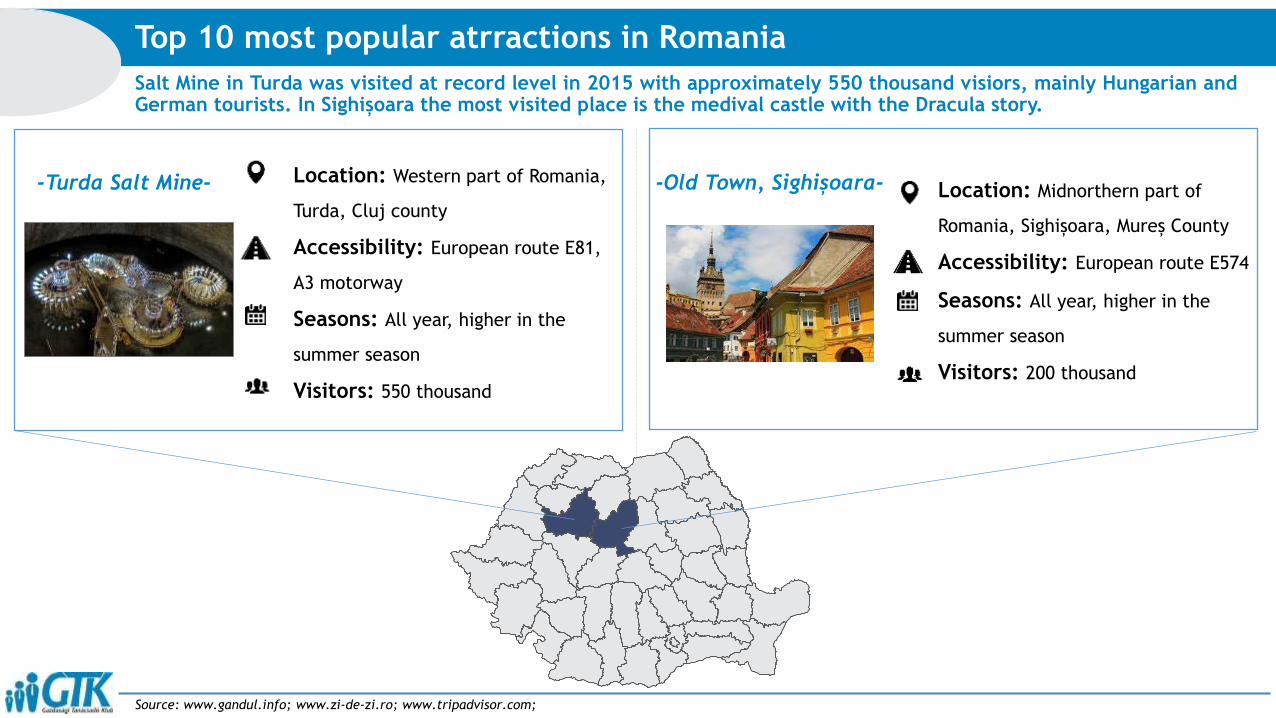
Salt Mine in Turda was visited at record level in 2015 with approximately 550 thousand visiors, mainly Hungarian andGerman tourists. In Sighișoara the most visited place is the medival castle with the Dracula story.
Source: www.gandul.info; www.zi-de-zi.ro; www.tripadvisor.com;
-Old Town, Sighișoara- Location: Midnorthern part of
Romania, Sighișoara, Mureș County
Accessibility: European route E574
Seasons: All year, higher in the
summer season
Visitors: 200 thousand
Location: Western part of Romania,
Turda, Cluj county
Accessibility: European route E81,
A3 motorway
Seasons: All year, higher in the
summer season
Visitors: 550 thousand
Top 10 most popular atrractions in Romania
-Turda Salt Mine-
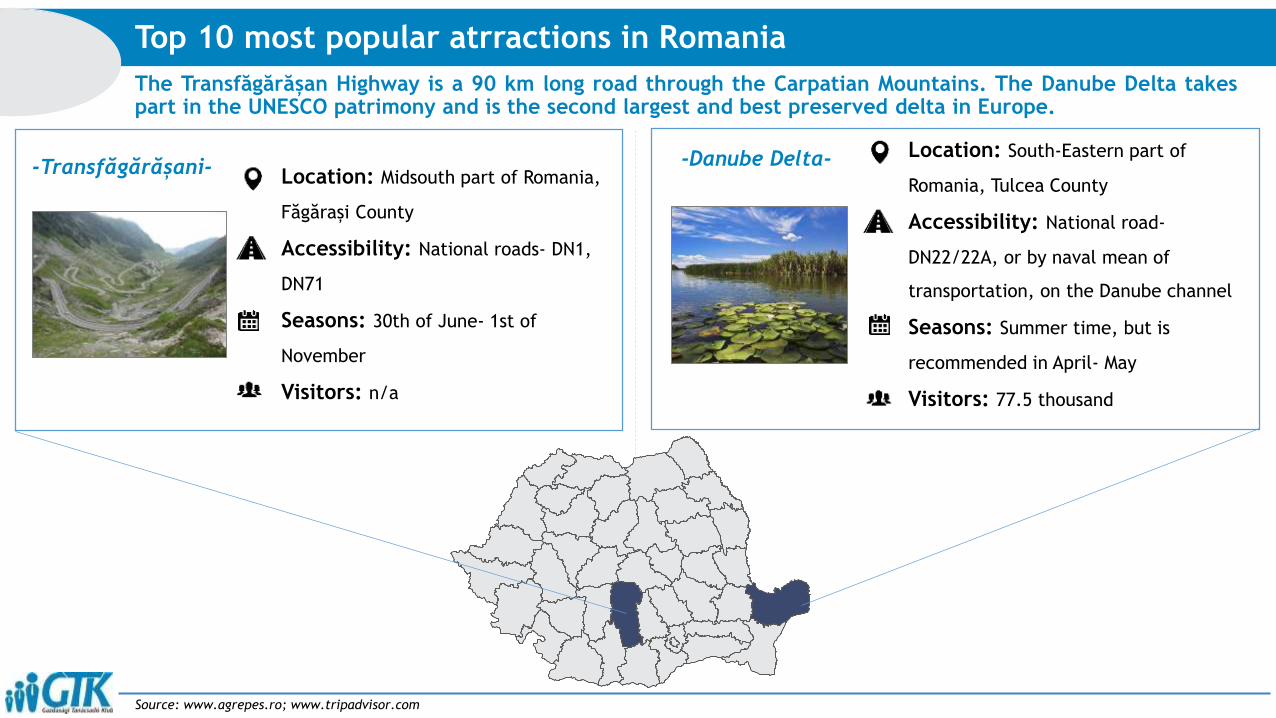
The Transfăgărășan Highway is a 90 km long road through the Carpatian Mountains. The Danube Delta takespart in the UNESCO patrimony and is the second largest and best preserved delta in Europe.
Top 10 most popular atrractions in Romania
Source: www.agrepes.ro; www.tripadvisor.com
-Transfăgărășani- -Danube Delta- Location: South-Eastern part of
Romania, Tulcea County
Accessibility: National road-
DN22/22A, or by naval mean of
transportation, on the Danube channel
Seasons: Summer time, but is
recommended in April- May
Visitors: 77.5 thousand
Location: Midsouth part of Romania,
Făgărași County
Accessibility: National roads- DN1,
DN71
Seasons: 30th of June- 1st of
November
Visitors: n/a
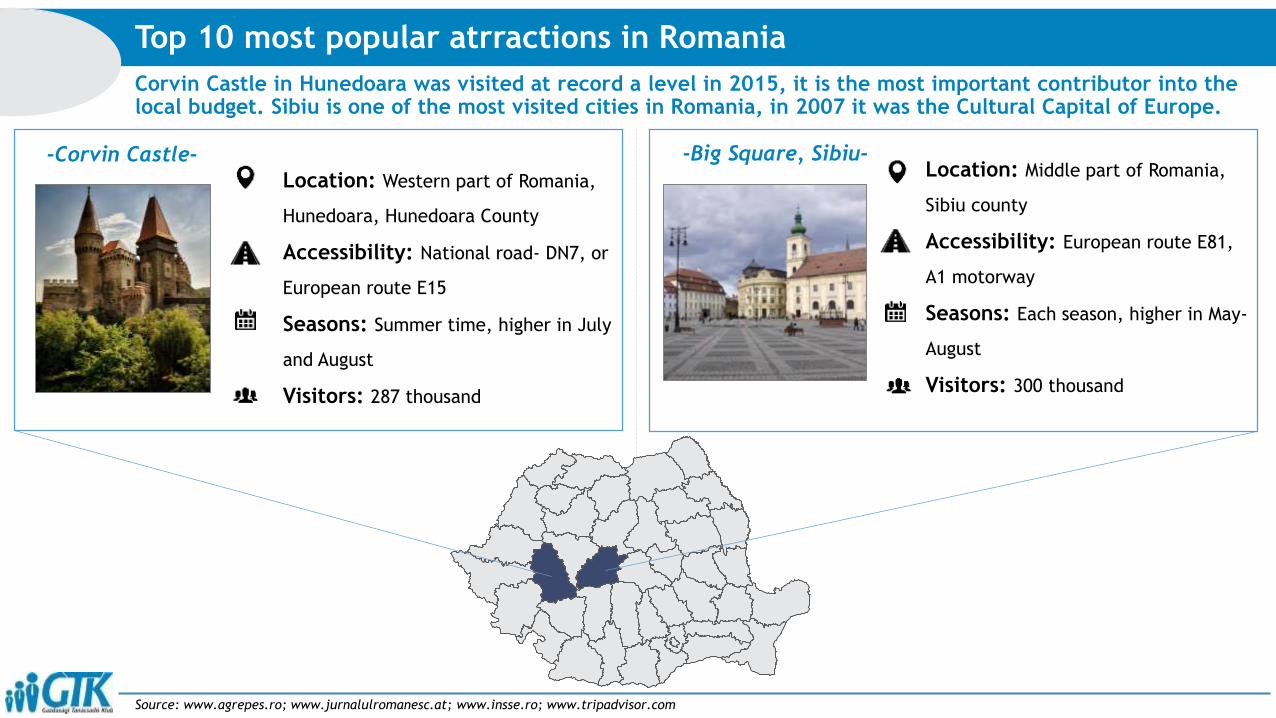
Corvin Castle in Hunedoara was visited at record a level in 2015, it is the most important contributor into thelocal budget. Sibiu is one of the most visited cities in Romania, in 2007 it was the Cultural Capital of Europe.
Source: www.agrepes.ro; www.jurnalulromanesc.at; www.insse.ro; www.tripadvisor.com
-Big Square, Sibiu-Location: Middle part of Romania,
Sibiu county
Accessibility: European route E81,
A1 motorway
Seasons: Each season, higher in May-
August
Visitors: 300 thousand
-Corvin Castle-
Location: Western part of Romania,
Hunedoara, Hunedoara County
Accessibility: National road- DN7, or
European route E15
Seasons: Summer time, higher in July
and August
Visitors: 287 thousand
Top 10 most popular atrractions in Romania

The Merry Cemetery takes part in the UNESCO patrimony and it is famous for its beautiful, painted graves. ThePalace of Parliament is the number one attraction in Bucharest, it is the second biggest building in the world.
Source: www.agrepes.ro; www.libertatea.ro; www.tripadvisor.com
-Palace of Parliament- Location: Southeast part of Romania,
Bucharest
Accessibility: European route E81,
A3 motorway
Seasons: Each season, higher in June
and July
Visitors: 172 thousand
-Merry Cemetery-
Location: Northern part of Romania,
Săpânța, Maramureș County
Accessibility: National road- DN19
Seasons: Summer time, higher in
June and July
Visitors: ten thousands
Top 10 most popular atrractions in Romania
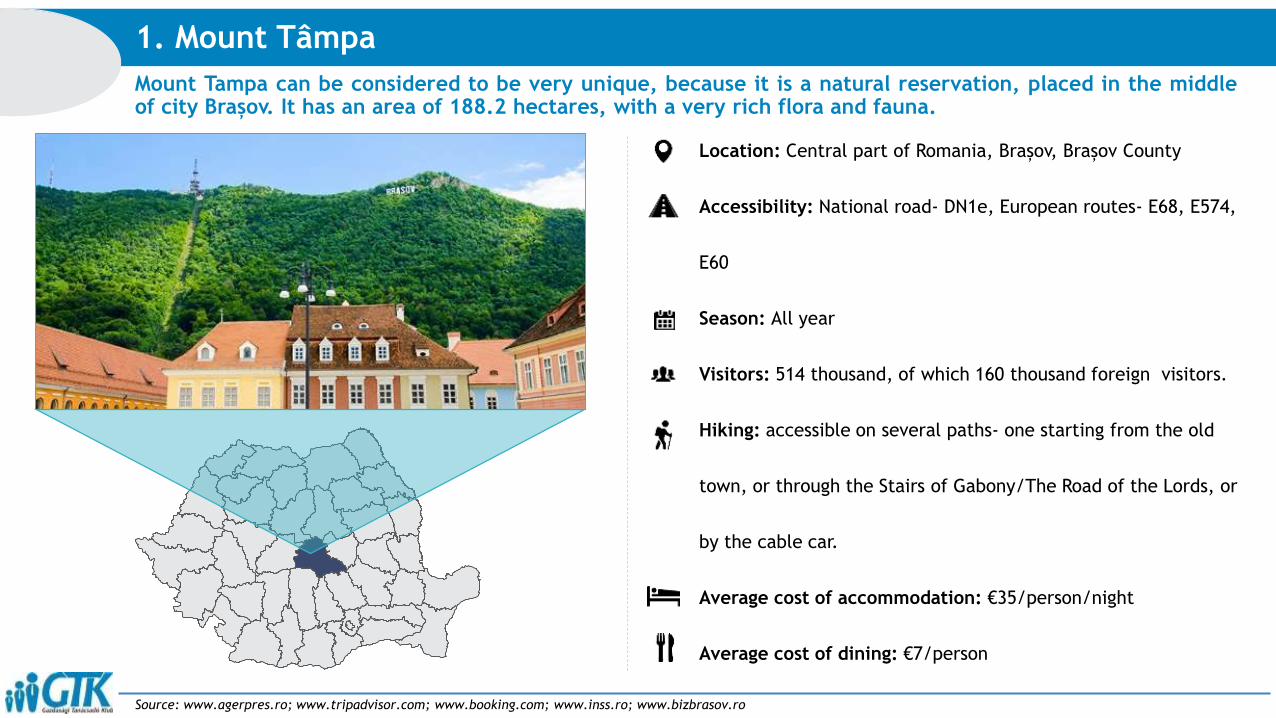
Mount Tampa can be considered to be very unique, because it is a natural reservation, placed in the middleof city Brașov. It has an area of 188.2 hectares, with a very rich flora and fauna.
1. Mount Tâmpa
Source: www.agerpres.ro; www.tripadvisor.com; www.booking.com; www.inss.ro; www.bizbrasov.ro
Location: Central part of Romania, Brașov, Brașov County
Accessibility: National road- DN1e, European routes- E68, E574,
E60
Season: All year
Visitors: 514 thousand, of which 160 thousand foreign visitors.
Hiking: accessible on several paths- one starting from the old
town, or through the Stairs of Gabony/The Road of the Lords, or
by the cable car.
Average cost of accommodation: €35/person/night
Average cost of dining: €7/person

Poiana Brașov is the most famouse ski resort in Romania. It is situated at an altitude of 1030 m, it has 12 skislopes. On average a three-day trip costs €250 per person.
2. Poiana Brașov
Source: www.agerpres.ro; www.tripadvisor.com; www.booking.com; www.poiana.info.ro; www.ski-in-romania.ro; www.digi24.ro
Location: Central part of Romania, 13 km from Brașov,
Brașov County
Accessibility: National road- DN1E
Season: Winter season in December- April
Visitors: 1.5 million visitors (number registered at the turnstiles)
Ski-slopes: 12 ski-slopes, with different difficulty levels. The ticket
for ski lifts costs €32 for adults and €18 for children, per day.
Average cost of accommodation: €40/person/night
Average cost of dining: €10/person
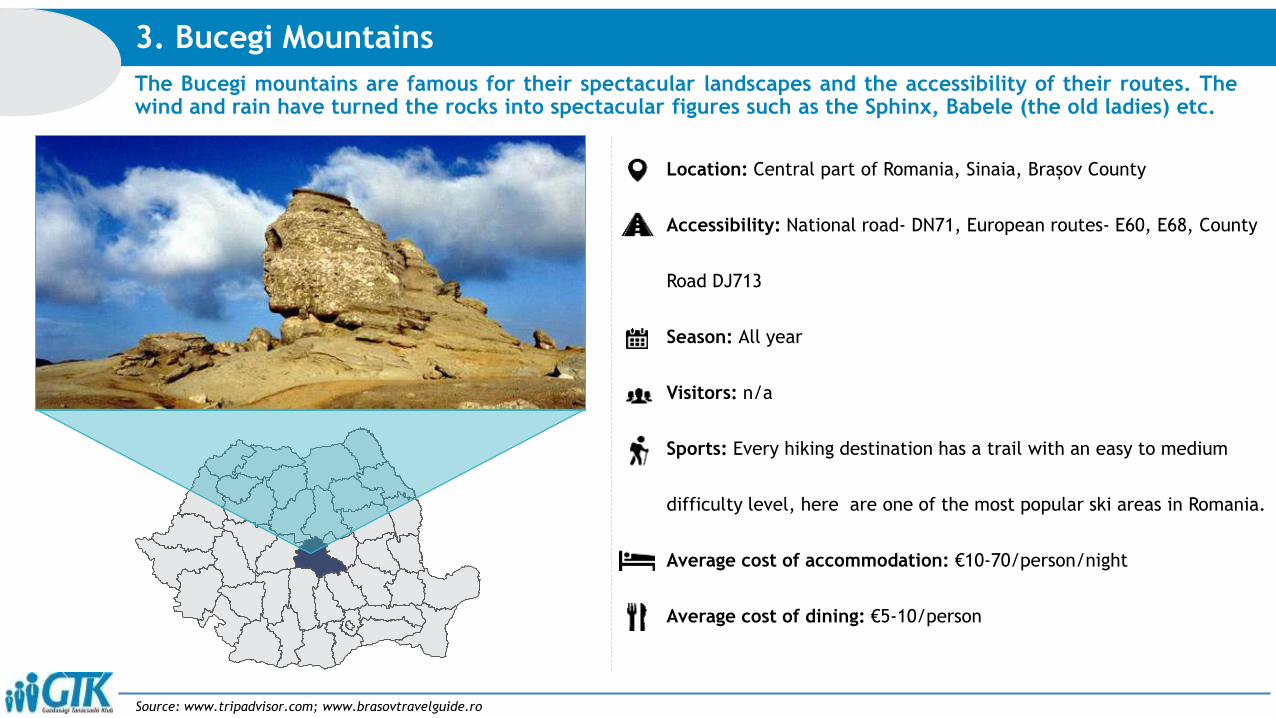
The Bucegi mountains are famous for their spectacular landscapes and the accessibility of their routes. Thewind and rain have turned the rocks into spectacular figures such as the Sphinx, Babele (the old ladies) etc.
3. Bucegi Mountains
Source: www.tripadvisor.com; www.brasovtravelguide.ro
Location: Central part of Romania, Sinaia, Brașov County
Accessibility: National road- DN71, European routes- E60, E68, County
Road DJ713
Season: All year
Visitors: n/a
Sports: Every hiking destination has a trail with an easy to medium
difficulty level, here are one of the most popular ski areas in Romania.
Average cost of accommodation: €10-70/person/night
Average cost of dining: €5-10/person
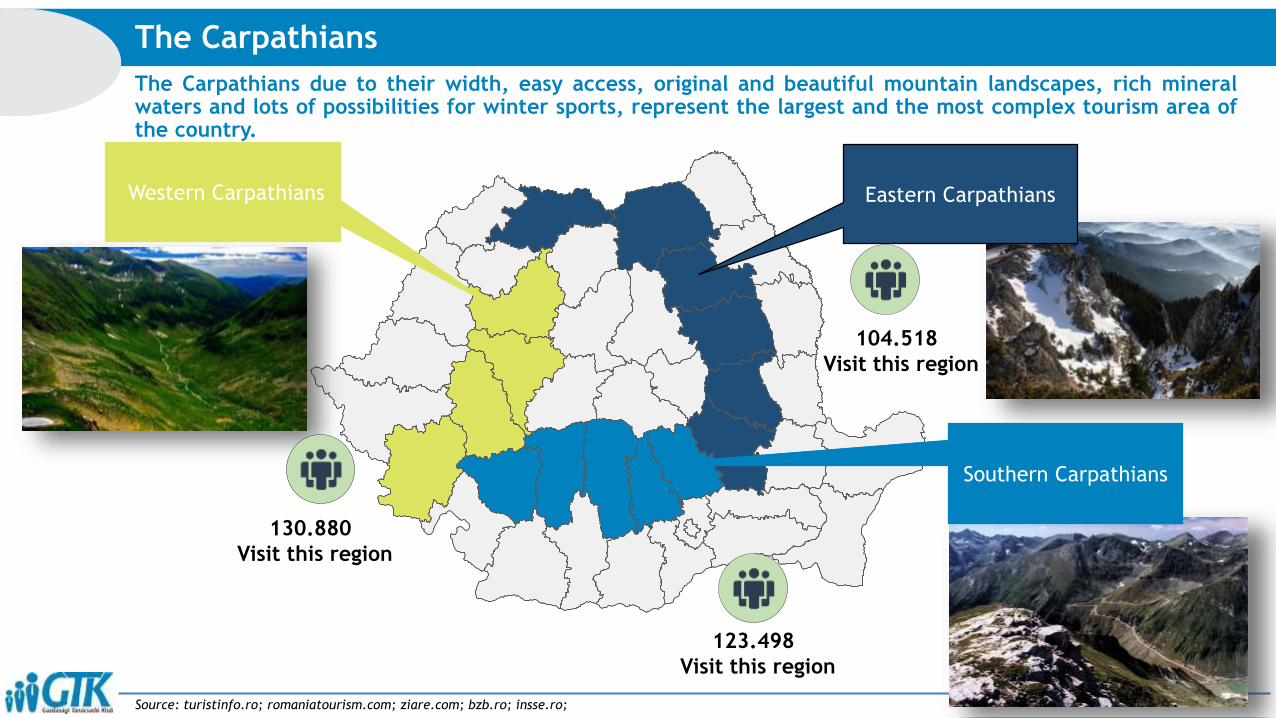
The Carpathians due to their width, easy access, original and beautiful mountain landscapes, rich mineralwaters and lots of possibilities for winter sports, represent the largest and the most complex tourism area ofthe country.
The Carpathians
Source: turistinfo.ro; romaniatourism.com; ziare.com; bzb.ro; insse.ro;
Eastern CarpathiansWestern Carpathians
Southern Carpathians
123.498
Visit this region
104.518
Visit this region
130.880
Visit this region
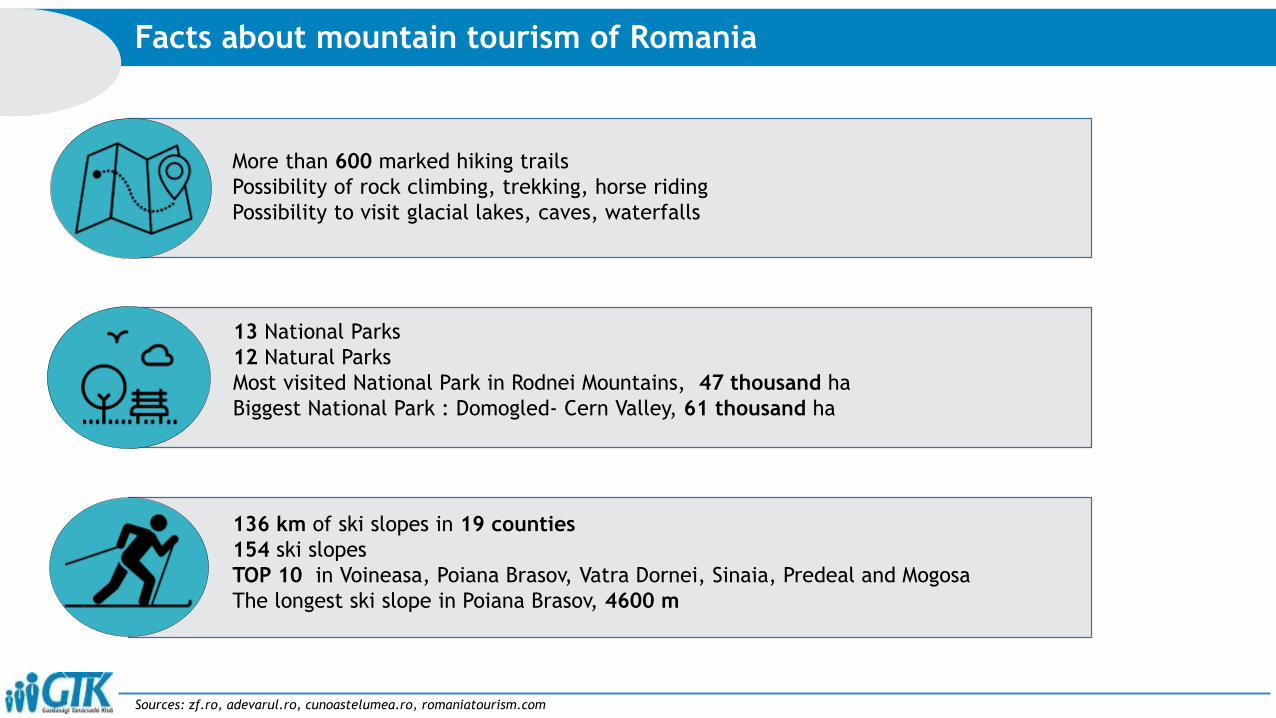
Facts about mountain tourism of Romania
136 km of ski slopes in 19 counties
154 ski slopes
TOP 10 in Voineasa, Poiana Brasov, Vatra Dornei, Sinaia, Predeal and Mogosa
The longest ski slope in Poiana Brasov, 4600 m
13 National Parks
12 Natural Parks
Most visited National Park in Rodnei Mountains, 47 thousand ha
Biggest National Park : Domogled- Cern Valley, 61 thousand ha
More than 600 marked hiking trails
Possibility of rock climbing, trekking, horse riding
Possibility to visit glacial lakes, caves, waterfalls
Sources: zf.ro, adevarul.ro, cunoastelumea.ro, romaniatourism.com
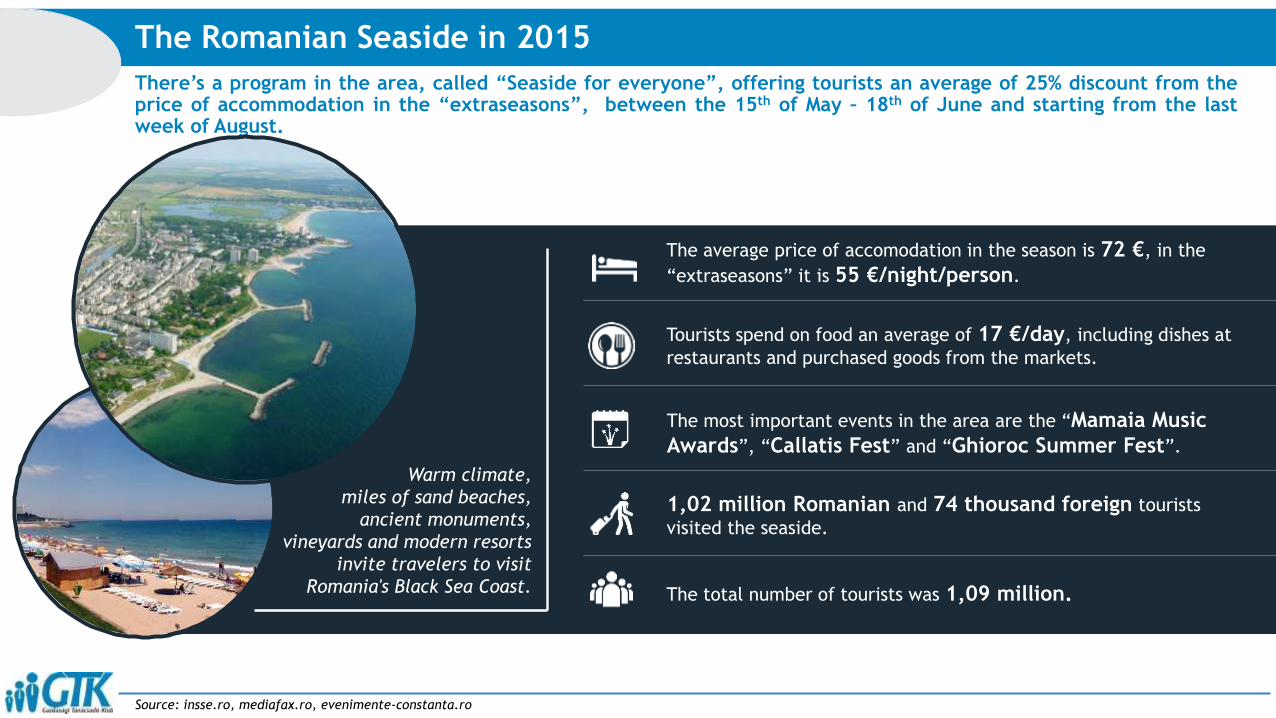
There’s a program in the area, called “Seaside for everyone”, offering tourists an average of 25% discount from theprice of accommodation in the “extraseasons”, between the 15th of May – 18th of June and starting from the lastweek of August.
The Romanian Seaside in 2015
Source: insse.ro, mediafax.ro, evenimente-constanta.ro
The average price of accomodation in the season is 72 €, in the
“extraseasons” it is 55 €/night/person.
Tourists spend on food an average of 17 €/day, including dishes at
restaurants and purchased goods from the markets.
The most important events in the area are the “Mamaia Music
Awards”, “Callatis Fest” and “Ghioroc Summer Fest”.
1,02 million Romanian and 74 thousand foreign tourists
visited the seaside.
The total number of tourists was 1,09 million.
Warm climate,
miles of sand beaches,
ancient monuments,
vineyards and modern resorts
invite travelers to visit
Romania's Black Sea Coast.
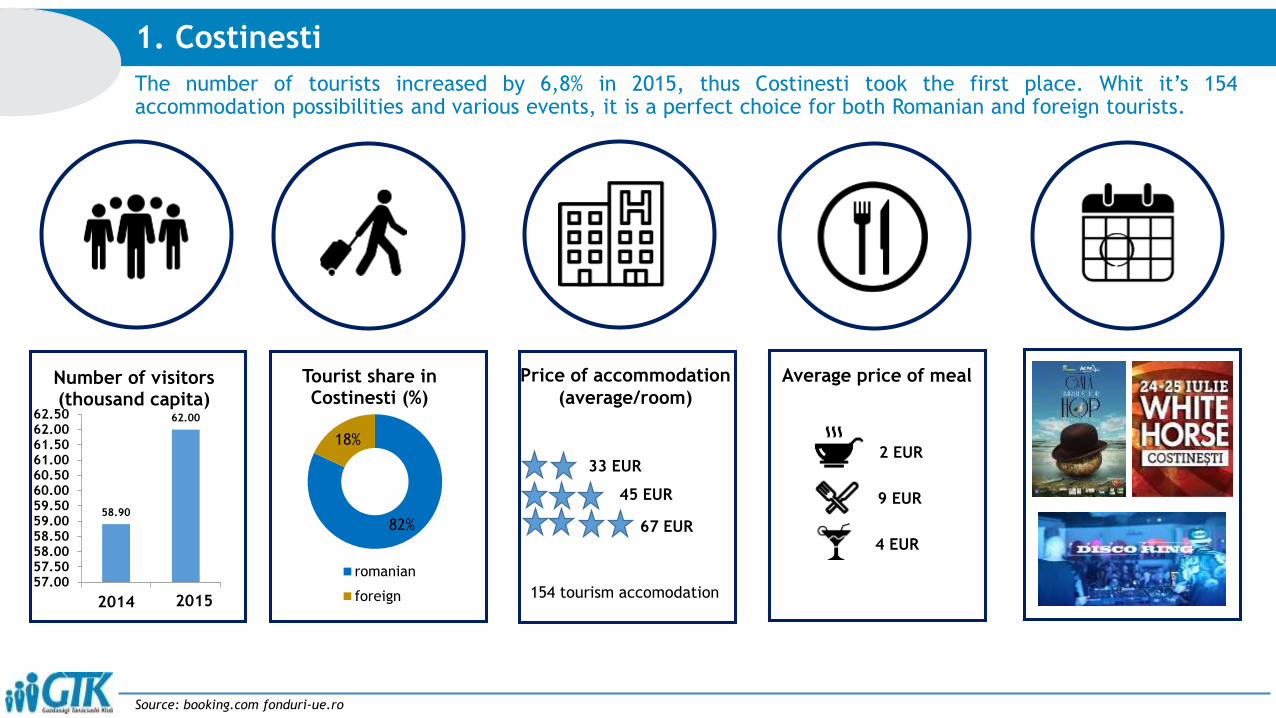
The number of tourists increased by 6,8% in 2015, thus Costinesti took the first place. Whit it’s 154accommodation possibilities and various events, it is a perfect choice for both Romanian and foreign tourists.
1. Costinesti
Source: booking.com fonduri-ue.ro
82%
18%
Tourist share in Costinesti (%)
romanian
foreign
58.90
62.00
57.0057.5058.0058.5059.0059.5060.0060.5061.0061.5062.0062.50
2014
Number of visitors(thousand capita)
2015
45 EUR
67 EUR
33 EUR
Price of accommodation
(average/room)
Average price of meal
2 EUR
9 EUR
4 EUR
154 tourism accomodation
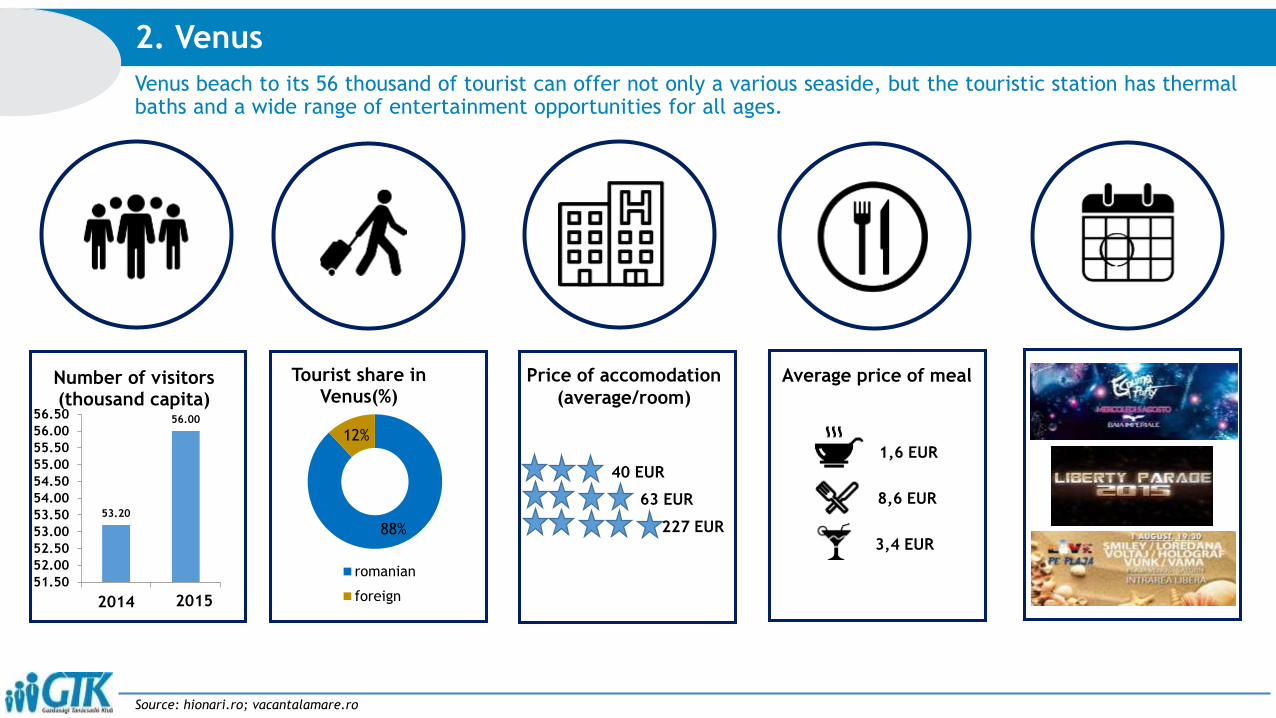
Venus beach to its 56 thousand of tourist can offer not only a various seaside, but the touristic station has thermalbaths and a wide range of entertainment opportunities for all ages.
2. Venus
Source: hionari.ro; vacantalamare.ro
88%
12%
Tourist share in Venus(%)
romanian
foreign
53.20
56.00
51.50
52.00
52.50
53.00
53.50
54.00
54.50
55.00
55.50
56.00
56.50
2014
Number of visitors(thousand capita)
2015
40 EUR
63 EUR
227 EUR
Price of accomodation
(average/room)
Average price of meal
1,6 EUR
8,6 EUR
3,4 EUR
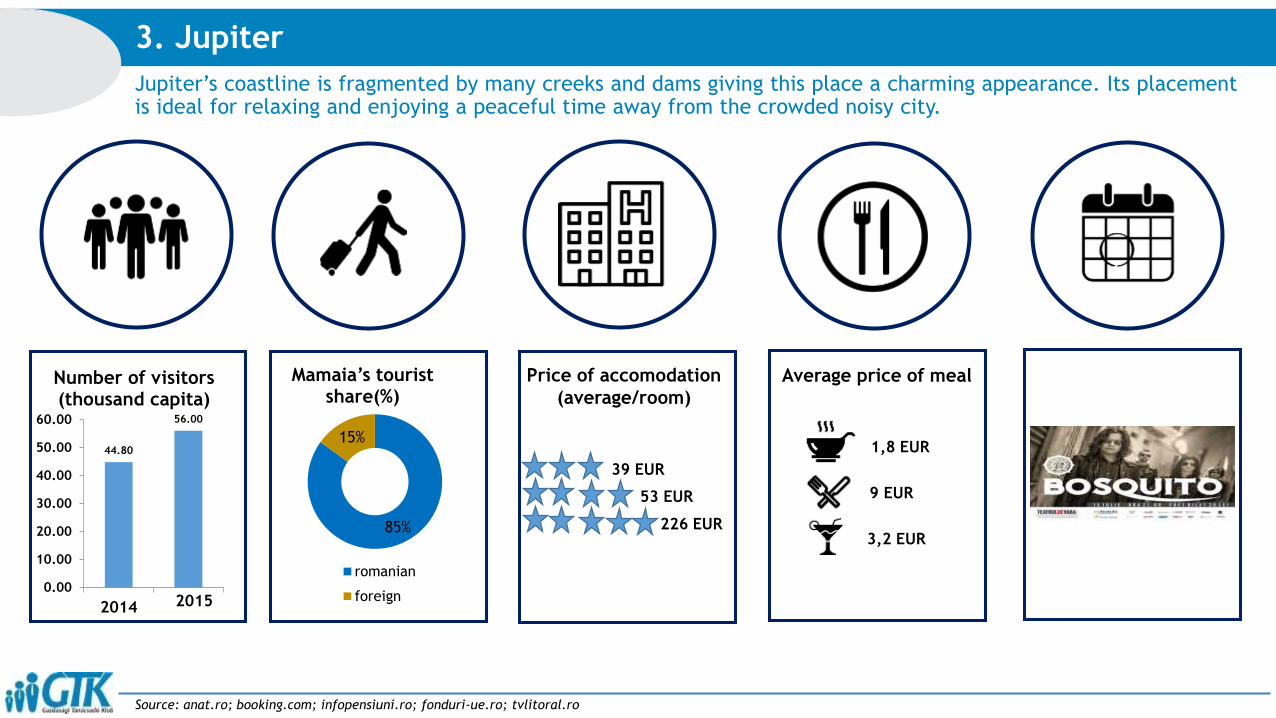
Jupiter’s coastline is fragmented by many creeks and dams giving this place a charming appearance. Its placementis ideal for relaxing and enjoying a peaceful time away from the crowded noisy city.
3. Jupiter
Source: anat.ro; booking.com; infopensiuni.ro; fonduri-ue.ro; tvlitoral.ro
85%
15%
Mamaia’s tourist share(%)
romanian
foreign
44.80
56.00
0.00
10.00
20.00
30.00
40.00
50.00
60.00
2014
Number of visitors(thousand capita)
2015
39 EUR
53 EUR
226 EUR
Price of accomodation
(average/room)
Average price of meal
1,8 EUR
9 EUR
3,2 EUR
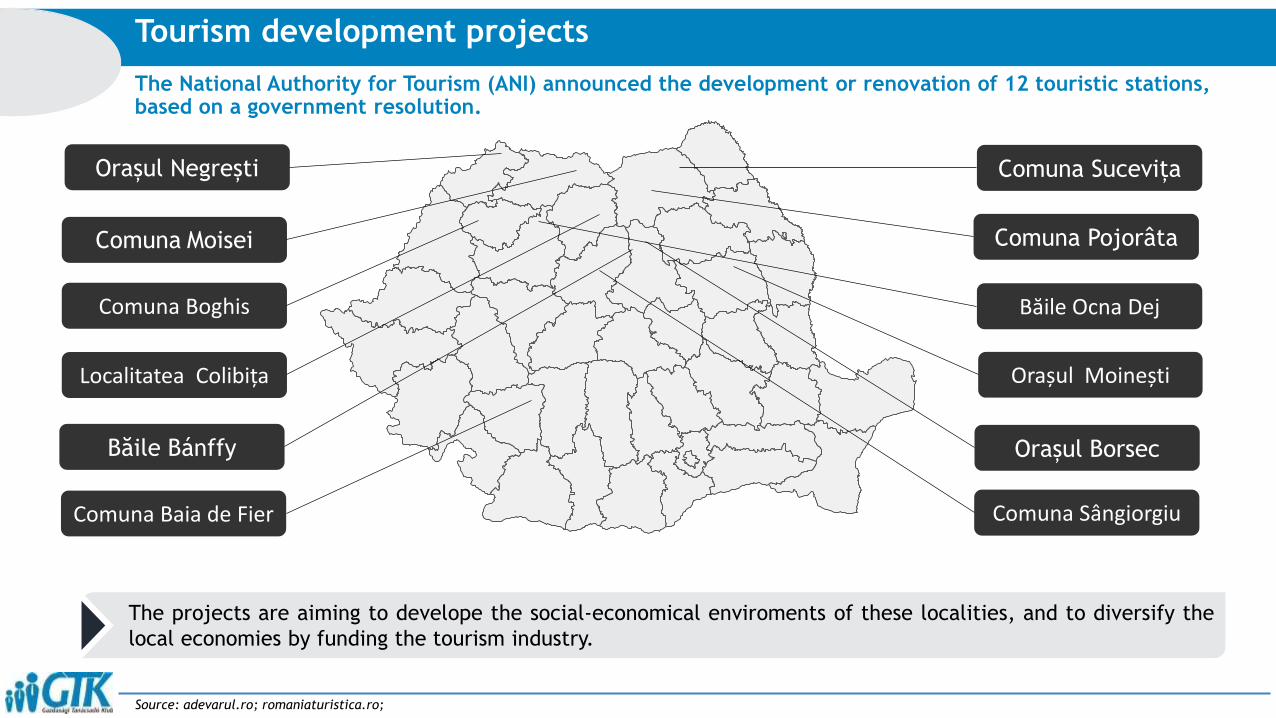
The National Authority for Tourism (ANI) announced the development or renovation of 12 touristic stations, based on a government resolution.
Tourism development projects
The projects are aiming to develope the social-economical enviroments of these localities, and to diversify the
local economies by funding the tourism industry.
Comuna Sucevița
Comuna Pojorâta
Băile Bánffy Orașul Borsec
Orașul Negrești
Comuna Moisei
Băile Ocna Dej
Comuna Sângiorgiu
Localitatea Colibița Orașul Moinești
Comuna Baia de Fier
Comuna Boghis
Source: adevarul.ro; romaniaturistica.ro;
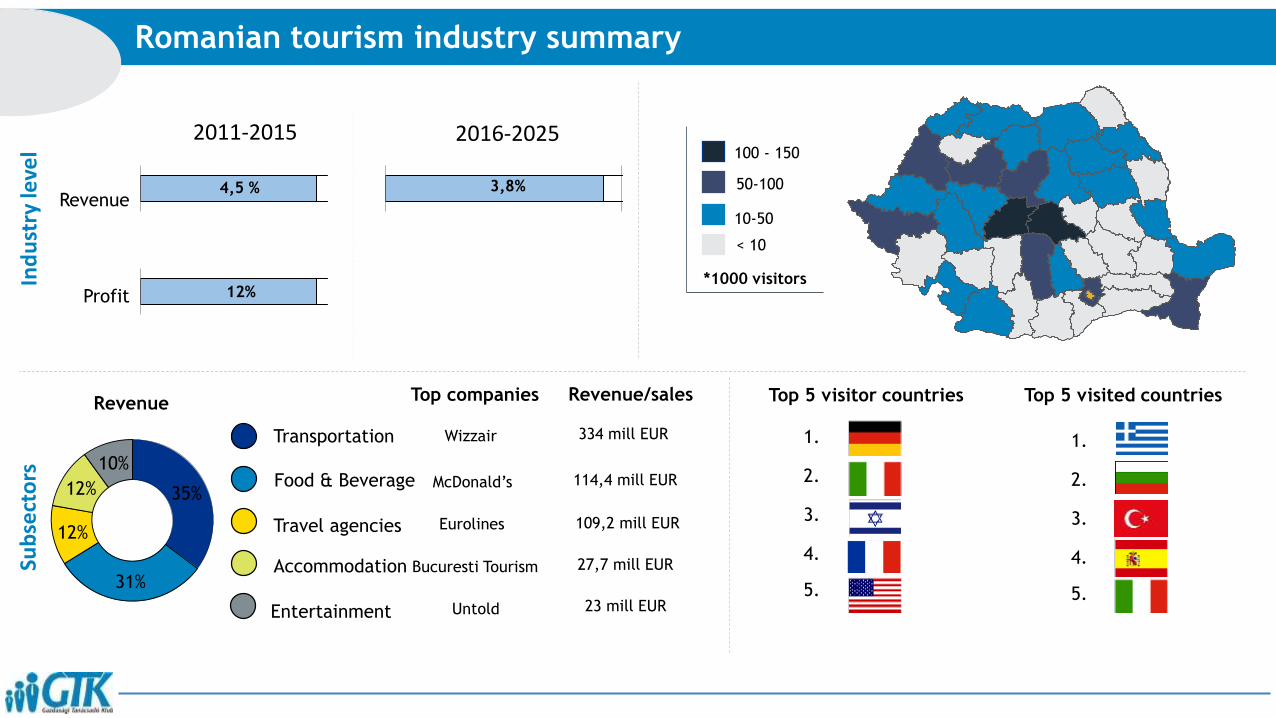
Romanian tourism industry summary
Revenue
Ind
ust
ry le
vel
Sub
sect
ors Food & Beverage
Travel agencies
Accommodation
Entertainment
4,5 %Revenue
Profit
Top companies Revenue/sales
2011-2015 2016-2025
3,8%
12%
Wizzair
Bucuresti Tourism
McDonald’s
Eurolines
Untold
334 mill EUR
27,7 mill EUR
114,4 mill EUR
109,2 mill EUR
23 mill EUR
100 - 150
50-100
10-50
< 10
*1000 visitors
Transportation
Top 5 visitor countries
1.
2.
3.
4.
5.
Top 5 visited countries
1.
2.
3.
4.
5.
35%
31%
12%
12%
10%
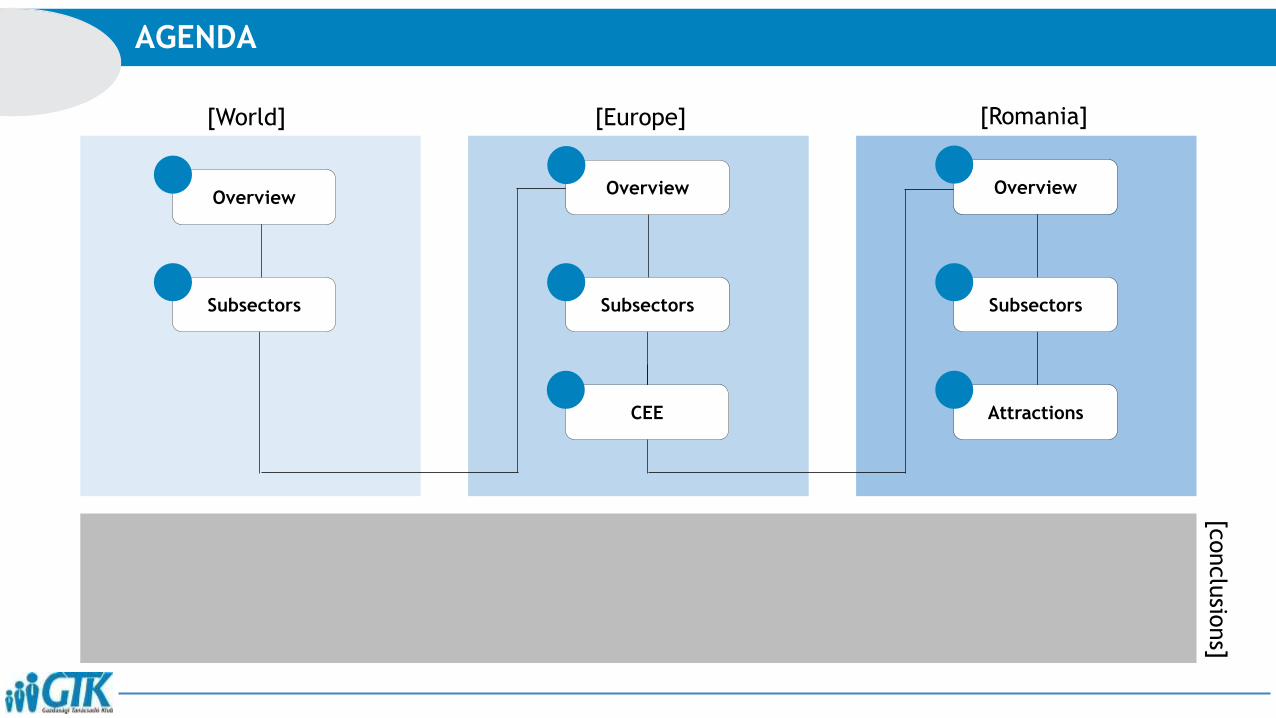
AGENDA
[World] [Europe] [Romania]
[conclu
sions]
Overview
Subsectors
CEE
Overview
Subsectors
Attractions
Overview
Subsectors

Promotion and infrastructure in Romania
5.8
94.2
Are you satisfied with the promotion of tourism?
(%)
Yes No
2.2-3.4
Є
billion
Effect of infrastructure and marketing on
tourism
1.02 Є
billion
Current revenue Potential revenue
Small
investment
Medium
investment
Large
investment

Investment strategy
Small
investor€ <1 mill.
€ 1-3 mill.
€ 3-5 mill.
Medium
investor
Large
investor
Accommodation
Accommodation
Entertainment
Accommodation
Entertainment
Travel services
Food & Beverage
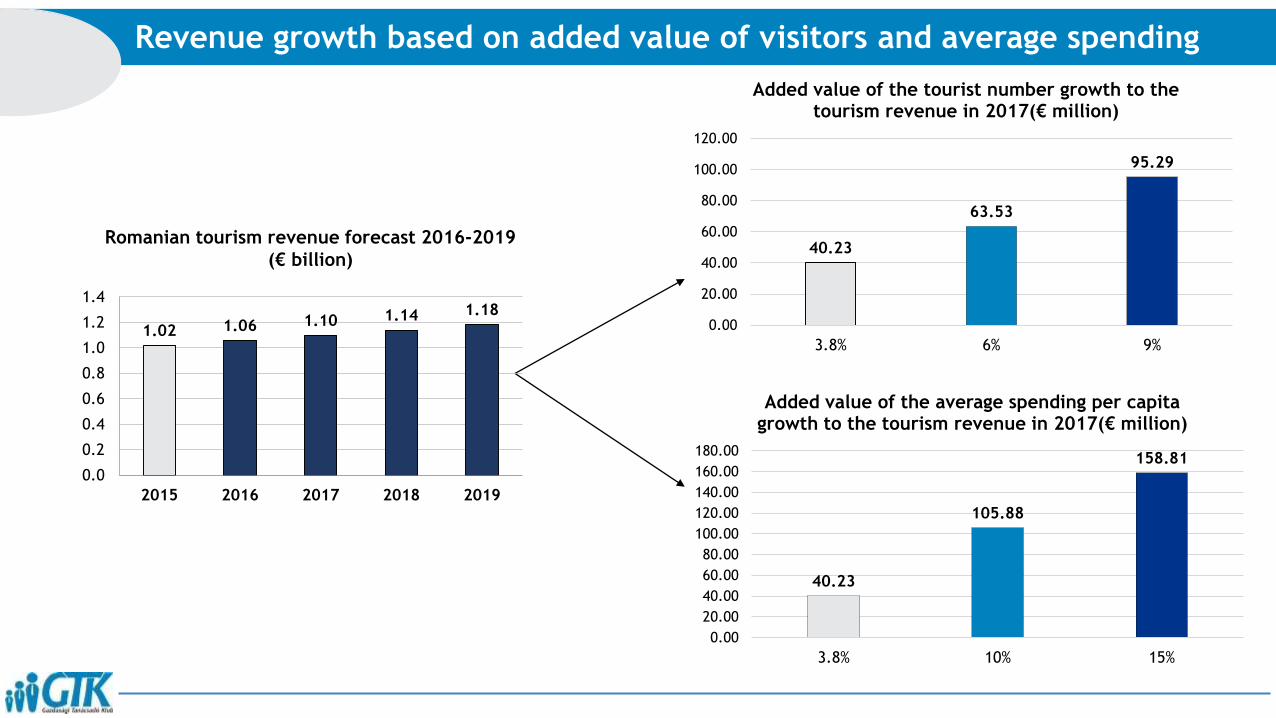
Revenue growth based on added value of visitors and average spending
40.23
63.53
95.29
0.00
20.00
40.00
60.00
80.00
100.00
120.00
3.8% 6% 9%
Added value of the tourist number growth to the tourism revenue in 2017(€ million)
1.02 1.06 1.10 1.14 1.18
0.0
0.2
0.4
0.6
0.8
1.0
1.2
1.4
2015 2016 2017 2018 2019
Romanian tourism revenue forecast 2016-2019
(€ billion)
40.23
105.88
158.81
0.00
20.00
40.00
60.00
80.00
100.00
120.00
140.00
160.00
180.00
3.8% 10% 15%
Added value of the average spending per capita growth to the tourism revenue in 2017(€ million)