Embed Size (px)
Citation preview
A Forrester Total Economic
Impact™ Study
Commissioned By Cisco Systems
Project Director:
Michelle S. Bishop
July 2014
The Total Economic
Impact™ Of Cisco Unified
Computing System Cost Savings And Business Benefits Enabled By Cisco UCS
Table Of Contents
Executive Summary .................................................................................... 3
Disclosures .................................................................................................. 4
TEI Framework And Methodology ............................................................ 6
Analysis ........................................................................................................ 7
Financial Summary ................................................................................... 19
Cisco UCS: Overview ................................................................................ 20
Appendix A: Composite Organization Description .............................. 22
Appendix B: Total Economic Impact™ Overview ................................. 23
Appendix C: Glossary ............................................................................... 24
Appendix D: Endnotes .............................................................................. 24
ABOUT FORRESTER CONSULTING
Forrester Consulting provides independent and objective research-based
consulting to help leaders succeed in their organizations. Ranging in scope from a
short strategy session to custom projects, Forrester’s Consulting services connect
you directly with research analysts who apply expert insight to your specific
business challenges. For more information, visit forrester.com/consulting.
© 2014, Forrester Research, Inc. All rights reserved. Unauthorized reproduction is strictly prohibited.
Information is based on best available resources. Opinions reflect judgment at the time and are subject to
change. Forrester®, Technographics
®, Forrester Wave, RoleView, TechRadar, and Total Economic Impact
are trademarks of Forrester Research, Inc. All other trademarks are the property of their respective
companies. For additional information, go to www.forrester.com.
3
Executive Summary
In March 2014, Cisco Systems commissioned Forrester
Consulting to conduct a Total Economic Impact™ (TEI) study
and examine the potential return on investment (ROI)
enterprises may realize by deploying Cisco Unified Computing
System (UCS). The purpose of this study is to provide readers
with a framework to evaluate the potential financial impact of
the Cisco UCS on their organizations.
To better understand the benefits, costs, and risks associated
with a Cisco UCS implementation, Forrester interviewed
several customers with multiple years of experience using
Cisco UCS. Cisco Unified Computing System and servers
unify computing, networking, management, virtualization, and
storage access into a single integrated architecture.
Prior to Cisco UCS, customers were facing IT management and cost challenges in their legacy environments as a result of
data and server growth. These customers looked to Cisco UCS to reduce their operational and capital costs as well as
increase the scalability of their environment to meet their business objectives. As one chief technology officer stated,
“Without having a product like Cisco UCS, we would never have gotten the company off the ground. Our costs would have
dramatically increased [without it].” Cost to switch is an important consideration for customers considering Cisco UCS. None
of the organizations interviewed had any professional services fees with their implementation of Cisco UCS, and they did not
report any significant training costs.
CISCO UCS REDUCES IT ADMINISTRATIVE COSTS AND HARDWARE COSTS
Our interviews with four existing customers and subsequent financial analysis found that a composite organization based on
these companies experienced the risk-adjusted ROI, benefits, and costs shown in Figure 1.1 See Appendix A for a
description of the composite organization.
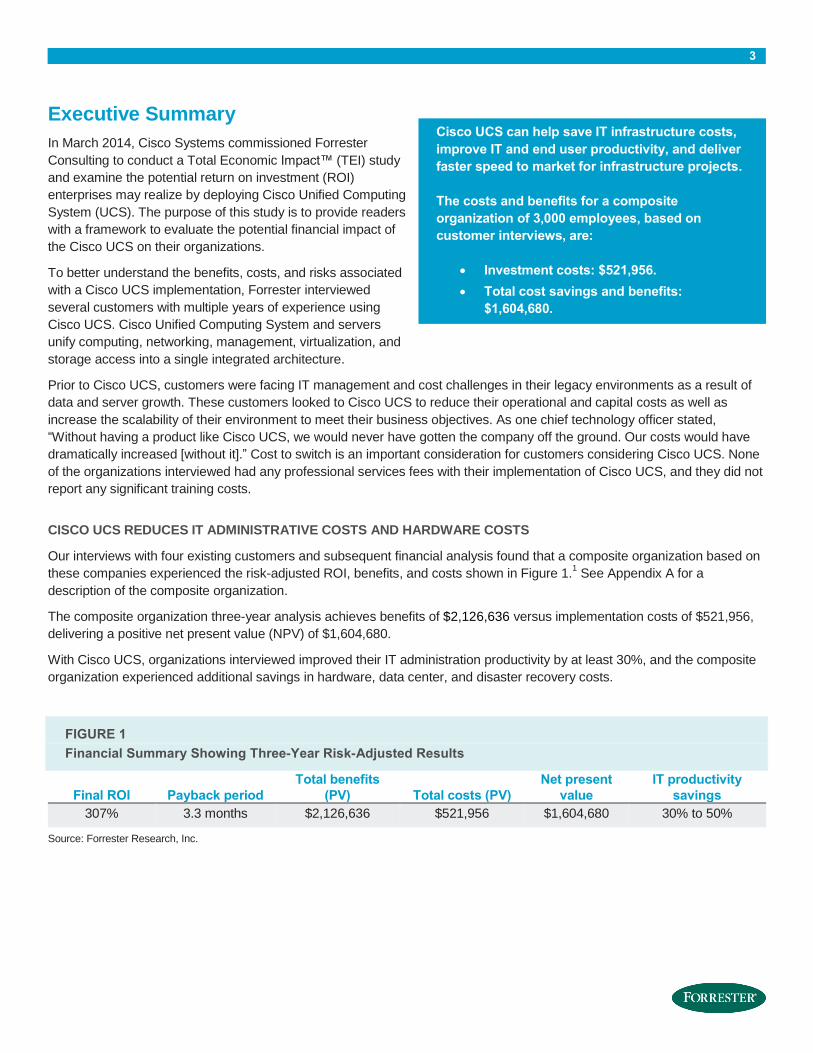
The composite organization three-year analysis achieves benefits of $2,126,636 versus implementation costs of $521,956,
delivering a positive net present value (NPV) of $1,604,680.
With Cisco UCS, organizations interviewed improved their IT administration productivity by at least 30%, and the composite
organization experienced additional savings in hardware, data center, and disaster recovery costs.
FIGURE 1
Financial Summary Showing Three-Year Risk-Adjusted Results
Final ROI Payback period
Total benefits
(PV) Total costs (PV)
Net present
value
IT productivity
savings
307% 3.3 months $2,126,636 $521,956 $1,604,680 30% to 50%
Source: Forrester Research, Inc.
Cisco UCS can help save IT infrastructure costs,
improve IT and end user productivity, and deliver
faster speed to market for infrastructure projects.
The costs and benefits for a composite
organization of 3,000 employees, based on
customer interviews, are:
Investment costs: $521,956.
Total cost savings and benefits:
$1,604,680.
4
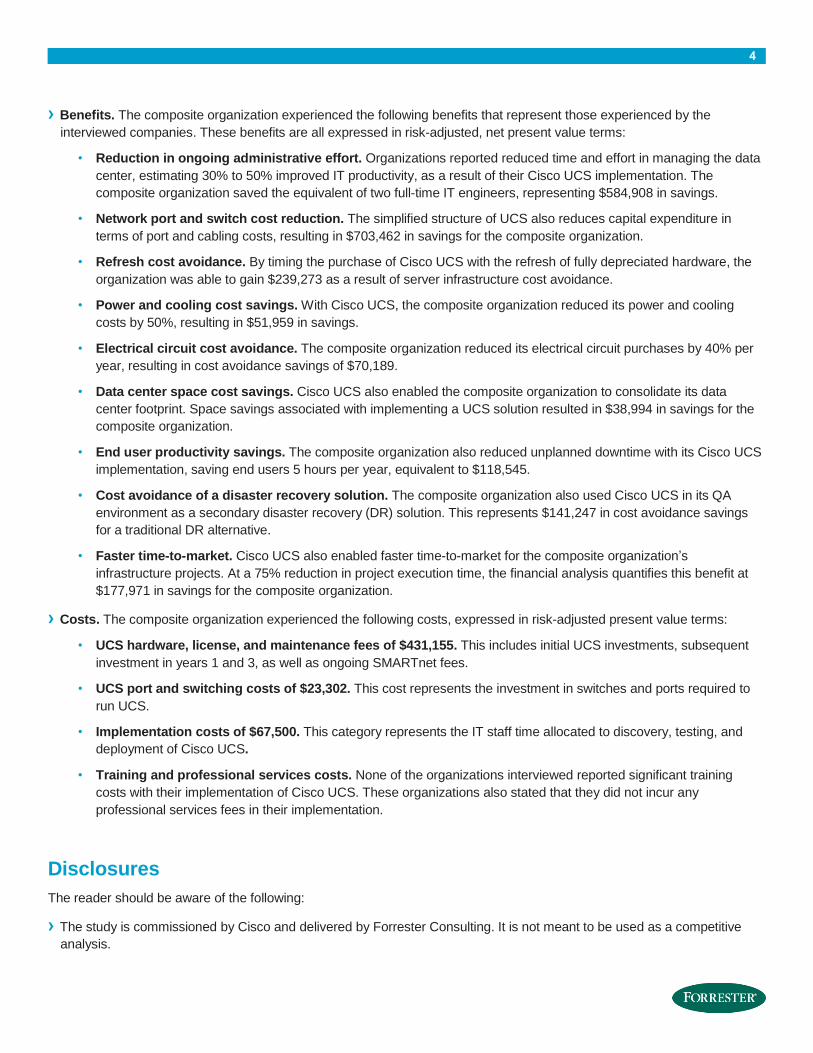
› Benefits. The composite organization experienced the following benefits that represent those experienced by the
interviewed companies. These benefits are all expressed in risk-adjusted, net present value terms:
• Reduction in ongoing administrative effort. Organizations reported reduced time and effort in managing the data
center, estimating 30% to 50% improved IT productivity, as a result of their Cisco UCS implementation. The
composite organization saved the equivalent of two full-time IT engineers, representing $584,908 in savings.
• Network port and switch cost reduction. The simplified structure of UCS also reduces capital expenditure in
terms of port and cabling costs, resulting in $703,462 in savings for the composite organization.
• Refresh cost avoidance. By timing the purchase of Cisco UCS with the refresh of fully depreciated hardware, the
organization was able to gain $239,273 as a result of server infrastructure cost avoidance.
• Power and cooling cost savings. With Cisco UCS, the composite organization reduced its power and cooling
costs by 50%, resulting in $51,959 in savings.
• Electrical circuit cost avoidance. The composite organization reduced its electrical circuit purchases by 40% per
year, resulting in cost avoidance savings of $70,189.
• Data center space cost savings. Cisco UCS also enabled the composite organization to consolidate its data
center footprint. Space savings associated with implementing a UCS solution resulted in $38,994 in savings for the
composite organization.
• End user productivity savings. The composite organization also reduced unplanned downtime with its Cisco UCS
implementation, saving end users 5 hours per year, equivalent to $118,545.
• Cost avoidance of a disaster recovery solution. The composite organization also used Cisco UCS in its QA
environment as a secondary disaster recovery (DR) solution. This represents $141,247 in cost avoidance savings
for a traditional DR alternative.
• Faster time-to-market. Cisco UCS also enabled faster time-to-market for the composite organization’s
infrastructure projects. At a 75% reduction in project execution time, the financial analysis quantifies this benefit at
$177,971 in savings for the composite organization.
› Costs. The composite organization experienced the following costs, expressed in risk-adjusted present value terms:
• UCS hardware, license, and maintenance fees of $431,155. This includes initial UCS investments, subsequent
investment in years 1 and 3, as well as ongoing SMARTnet fees.
• UCS port and switching costs of $23,302. This cost represents the investment in switches and ports required to
run UCS.
• Implementation costs of $67,500. This category represents the IT staff time allocated to discovery, testing, and
deployment of Cisco UCS.
• Training and professional services costs. None of the organizations interviewed reported significant training
costs with their implementation of Cisco UCS. These organizations also stated that they did not incur any
professional services fees in their implementation.
Disclosures
The reader should be aware of the following:
› The study is commissioned by Cisco and delivered by Forrester Consulting. It is not meant to be used as a competitive
analysis.

5
› Forrester makes no assumptions as to the potential return on investment that other organizations will receive. Forrester
strongly advises that readers use their own estimates within the framework provided in the report to determine the
appropriateness of an investment in Cisco UCS.
› The customer names for the interviews were provided by Cisco.
› Customer interviews were conducted privately by Forrester, Cisco did not participate in any of the interviews, and no
customer attribution of quotes or feedback were provided to Cisco.
› Forrester maintained editorial control over this study and its findings, and did not accept changes to the study that
contradicted Forrester’s findings or obscured the meaning of the study. Cisco did review this study and provide feedback
to Forrester.
6
TEI Framework And Methodology
INTRODUCTION
From the information provided in the interviews, Forrester has constructed a Total Economic Impact (TEI) framework for
those organizations considering implementing Cisco UCS. The objective of the framework is to identify the cost, benefit,
flexibility, and risk factors that affect the investment decision.
APPROACH AND METHODOLOGY
Forrester took a multistep approach to evaluate the impact that Cisco UCS can have on an organization (see Figure 2).
Specifically, we:
› Interviewed Cisco marketing and sales personnel, along with Forrester analysts, to gather data relative to Cisco UCS and
the marketplace for Cisco UCS.
› Interviewed four additional organizations currently using Cisco UCS to obtain data with respect to costs, benefits, and risks
in addition to the five original organizations interviewed for the August 2011 TEI case study “The Total Economic Impact™
Of The Cisco Unified Computing System” by Sadaf Bellord.
› Designed a composite organization based on characteristics of the interviewed organizations (see Appendix A).
› Constructed a financial model representative of the interviews using the TEI methodology. The financial model is
populated with the cost and benefit data obtained from the interviews as applied to the composite organization.
› Risk-adjusted the financial model based on issues and concerns the interviewed organizations highlighted in interviews.
Risk adjustment is a key part of the TEI methodology. While interviewed organizations provided cost and benefit
estimates, some categories included a broad range of responses or had a number of outside forces that might have
impacted it higher or lower. For that reason, some cost and benefit totals have been risk-adjusted, and are detailed in each
relevant section.
Forrester employed four fundamental elements of TEI in modeling Cisco UCS’s service: benefits, costs, flexibility, and
risks.
Given the increasing sophistication that enterprises have regarding ROI analyses related to IT investments, Forrester’s TEI
methodology serves to provide a complete picture of the total economic impact of purchase decisions. Please see Appendix
B for additional information on the TEI methodology.
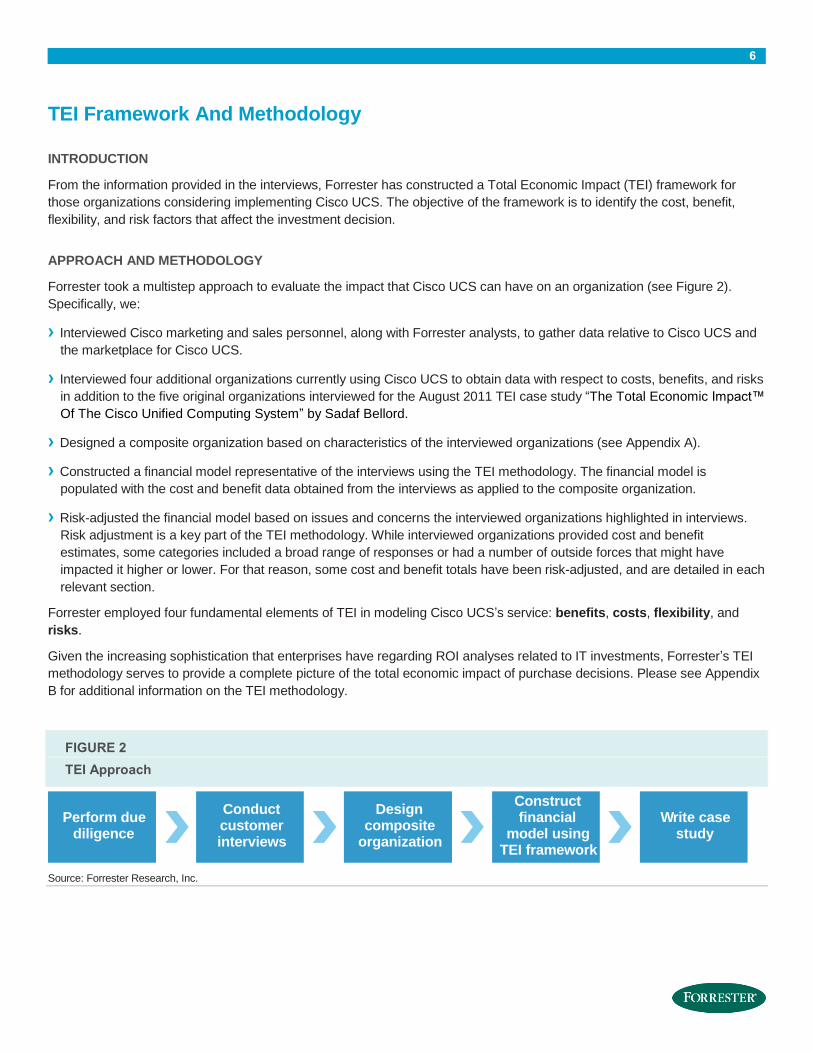
FIGURE 2
TEI Approach
Source: Forrester Research, Inc.
Perform duediligence
Conductcustomerinterviews
Designcomposite
organization
Constructfinancial
model usingTEI framework
Write casestudy
7
Analysis
COMPOSITE ORGANIZATION
For this study, we gathered data from nine interviews with representatives from the following companies, which are Cisco
customers based in the US:
› A global fast food corporation with a network of franchises covering 50 states and over 50 international markets. This
organization with two data centers saw huge growth of its eCommerce environment in the past years.
› A privately owned transportation provider with over $400 million per year in revenue and 3,000 employees. Cisco UCS
was implemented as part of this company’s virtualization strategy.
› A healthcare organization focused on providing low-cost healthcare to low-income individuals with approximately 2,500
employees. It consolidated its data centers to a single footprint and virtualized the majority of its infrastructure.
› An IT services subsidiary of a public corporation in the medical services industry with over $700 million in annual revenue
and 2,600 employees.
› A provider of critical communication and compliance solutions.
The firm has about 150 employees and 3,500 customers. The
firm’s innovation and growth has resulted in a number of industry
recognitions.
› A regional medical center that has 400 beds and serves nearly
500,000 outpatients annually.
› An energy management and conservation organization that was
formed in 2008. As a midstage startup, the organization’s IT
department has to cater to a constantly changing and expanding
business environment.
› A university that serves a growing adult education business
online and on campus. The IT department supports 5,000
employees and 55,000 students.
› An Ivy League university with a large undergraduate and graduate population.
Based on the interviews, Forrester constructed a TEI framework, a composite company, and an associated ROI analysis that
illustrates the areas financially affected. The composite organization that Forrester synthesized from these results represents
an organization with the following characteristics:
› A US-based medical services provider with a global footprint.
› 3,000 employees.
› $500 million in annual revenue.
› One data center.
The composite company, also known as Organization A, was roughly 40% through a virtualization project when it decided to
look at other options for server consolidation. After evaluating multiple vendors and approaches, Organization A chose Cisco
UCS driven by Cisco’s design approach with Unified Fabric, its integrated “one pane of glass” management, and cabling
consolidation.
“Being able to scale was
critical. Cisco UCS provided
the means to quickly meet the
needs of the business.”
~Director, IT infrastructure engineering services,
healthcare organization
8
INTERVIEW HIGHLIGHTS
The organizations interviewed all experienced capital and
operational savings with their Cisco UCS deployment, with cost
reduction and improved scalability as the main factors in their
decision to choose Cisco UCS. Other highlights from the interviews
include the following:
› One organization implemented Cisco UCS as an alternative to its
legacy environment with complex cabling structure and firmware.
With the growth of its eCommerce environment and big data
strategy, and a compute footprint growing at 70% per year, it
needed to find a solution that gave it operational savings and a
strategic advantage in expanding its digital footprint
internationally. In the bake-off that was part of the organization’s
preselection process, one of its employees noted, “The way
Cisco has integrated their compute in their networking components allowed us to divide network from compute support.
They were the most progressive option tied to the solutions overall.”
› A director of data center operations noted, “We could not have gotten the results from data center consolidation and
virtualization without UCS.” Data growth and server growth was a primary factor in the organization’s decision to virtualize
and implement Cisco UCS. Data was growing at an unmanageable rate, from 200 terabytes in 2009 to seven petabytes in
2013. Its cabling and network infrastructure costs were also growing at an average of 20% per year.
› After considering alternative solutions, one organization chose Cisco UCS because it considered Unified Fabric a better
design and “Cisco UCS also made sense with its additional horsepower and elimination of cabling.” While the organization
was concerned about the complexity and “doing everything in one basket”, it noted the skilled Cisco engineering and
support it received during its project planning and deployment mitigated its concerns.
› One organization needed a virtualization strategy as it
consolidated about 40 companies and planned for future
expansion. When asked why it chose Cisco UCS as part of its
strategy, the CTO said, “We didn’t know how many ports we
would need, or how we were going to grow. With Cisco we could
efficiently leverage less connections. This contributed a world of
difference to the environment for growing quickly.” The CTO was
also impressed by how easy Cisco UCS was to configure, with
one tool that allowed for complete provisioning (firmware,
network continuity, etc.).
Composite Organization
Solution
The composite organization selected Cisco UCS for its ability to
provide a cost-effective and scalable solution as well as the
strength of its design and capabilities.
“UCS has become the central
strategy for everything that
we do. It is the platform for
what we want to provide
moving forward.”
~Project manager, large transportation services
provider
“We are heavily reliant on Cisco
UCS technology. The integration
is so seamless and so
transparent, it makes sense not
to introduce something else. And
Cisco UCS continues to keep
pace. We’re getting denser and
denser and we have not retired a
single blade.”
~CTO, IT services subsidiary of a large medical
service enterprise
9
Benefits
The composite organization experienced a number of
quantified benefits in this case study:
› Reduction in ongoing administrative effort.
› Network port and switch cost reduction.
› Refresh cost avoidance.
› Power and cooling cost savings.
› Electrical circuit cost avoidance.
› Data center space cost savings.
› End user productivity savings.
› Cost avoidance of a disaster recovery solution.
› Faster time-to-market.
Another important benefit mentioned by interviewed organizations was an increase in flexibility as a result of their Cisco UCS
implementation. This flexibility meant that the IT team was more agile and responsive. They could deploy UCS in step with
the development team requirements, ensuring that infrastructure deployment was no longer a roadblock to project delivery.
Reduction In Ongoing IT Administrative Effort
All organizations interviewed reported a reduction in IT engineering time and effort for managing the data center as a result
of deploying Cisco UCS. One company reported that it was 75% faster to install, manage, and provision hardware with Cisco
UCS when compared with its legacy server environment, stating “it used to be a process that involved three teams and
several days and now it’s a single person.” Another company reported that Cisco UCS has enabled it to cut its project
onboarding time in half. One healthcare organization whose data growth grew from 200 terabytes to 7 petabytes over four
years estimated that it has seen and will continue to see savings from 30% to 50% in IT administration time by implementing
Cisco UCS. One organization framed these savings in terms of not hiring additional IT staff even when its company size
grew by 420%.
With its Cisco UCS implementation, the composite organization significantly reduced its time allocated to repetitive
management tasks by 50%. In this analysis, we are only measuring the benefit associated with the UCS implementation and
not Organization A’s virtualization project. From a headcount perspective, Organization A was able to avoid the cost of hiring
two additional IT engineers to manage its data and server growth requirements due to Cisco UCS. At an average annual fully
loaded compensation of $120,000 per IT operations FTE, the benefit of reduction in ongoing IT administrative effort is
quantified at $240,000 per year.
Interviewed organizations provided a broad range of IT administration productivity improvements, since there are a variety of
outside forces that might also affect this. To compensate, this benefit was risk-adjusted and reduced by 2%. The risk-
adjusted benefit was $235,200. See the section on Risks for more detail.
“[With Cisco UCS], we can easily
see who is doing what, where,
when, and how on the network.
We can now determine the best
times to do testing and
maintenance windows.”
~CTO, IT services subsidiary of a large medical
service enterprise
10
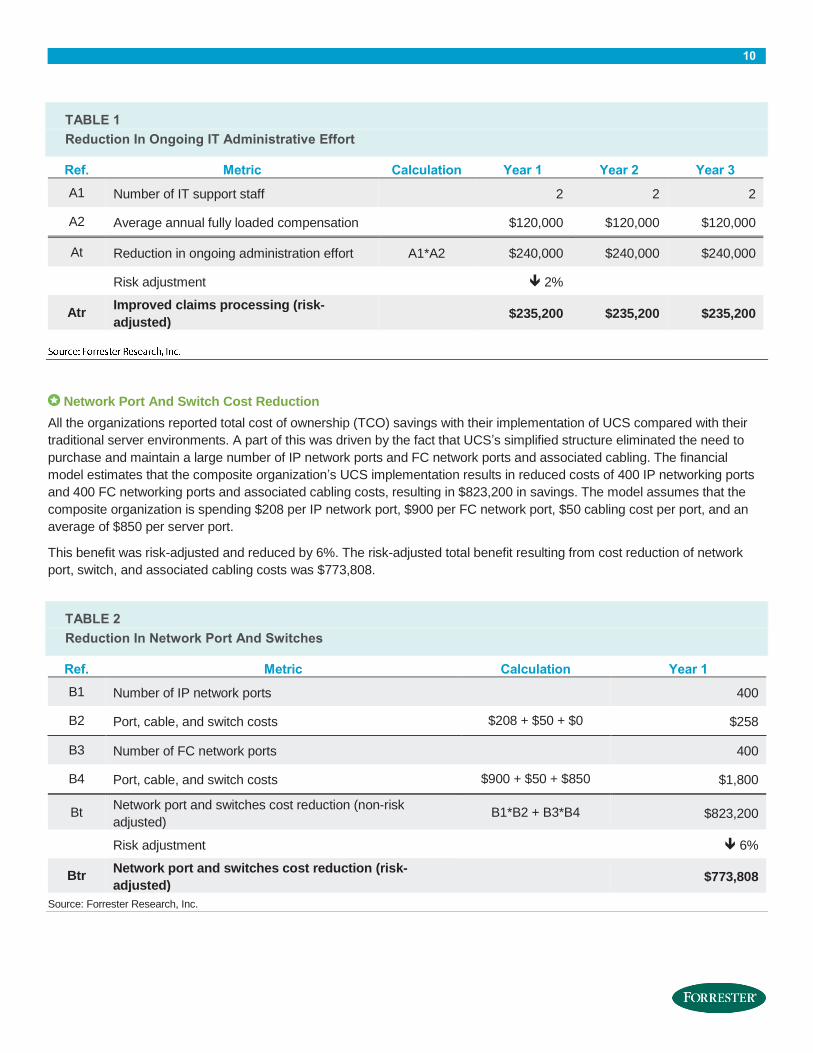
TABLE 1
Reduction In Ongoing IT Administrative Effort
Ref. Metric Calculation Year 1 Year 2 Year 3
A1 Number of IT support staff 2 2 2
A2 Average annual fully loaded compensation $120,000 $120,000 $120,000
At Reduction in ongoing administration effort A1*A2 $240,000 $240,000 $240,000
Risk adjustment 2%
Atr Improved claims processing (risk-
adjusted) $235,200 $235,200 $235,200
Network Port And Switch Cost Reduction
All the organizations reported total cost of ownership (TCO) savings with their implementation of UCS compared with their
traditional server environments. A part of this was driven by the fact that UCS’s simplified structure eliminated the need to
purchase and maintain a large number of IP network ports and FC network ports and associated cabling. The financial
model estimates that the composite organization’s UCS implementation results in reduced costs of 400 IP networking ports
and 400 FC networking ports and associated cabling costs, resulting in $823,200 in savings. The model assumes that the
composite organization is spending $208 per IP network port, $900 per FC network port, $50 cabling cost per port, and an
average of $850 per server port.
This benefit was risk-adjusted and reduced by 6%. The risk-adjusted total benefit resulting from cost reduction of network
port, switch, and associated cabling costs was $773,808.
TABLE 2
Reduction In Network Port And Switches
Ref. Metric Calculation Year 1
B1 Number of IP network ports 400
B2 Port, cable, and switch costs $208 + $50 + $0 $258
B3 Number of FC network ports 400
B4 Port, cable, and switch costs $900 + $50 + $850 $1,800
Bt Network port and switches cost reduction (non-risk
adjusted) B1*B2 + B3*B4 $823,200
Risk adjustment 6%
Btr Network port and switches cost reduction (risk-
adjusted) $773,808
Source: Forrester Research, Inc.
11
Refresh Cost Avoidance
A number of the organizations interviewed had timed their purchase decision of Cisco UCS with their hardware refresh cycle
and shifted their investment budget to replace traditional hardware with Cisco UCS. The composite organization avoided
$280,000 in hardware refresh costs for ancillary environments with its Cisco UCS implementation. This benefit was risk-
adjusted and reduced by 6%. The risk-adjusted total benefit was $263,200.
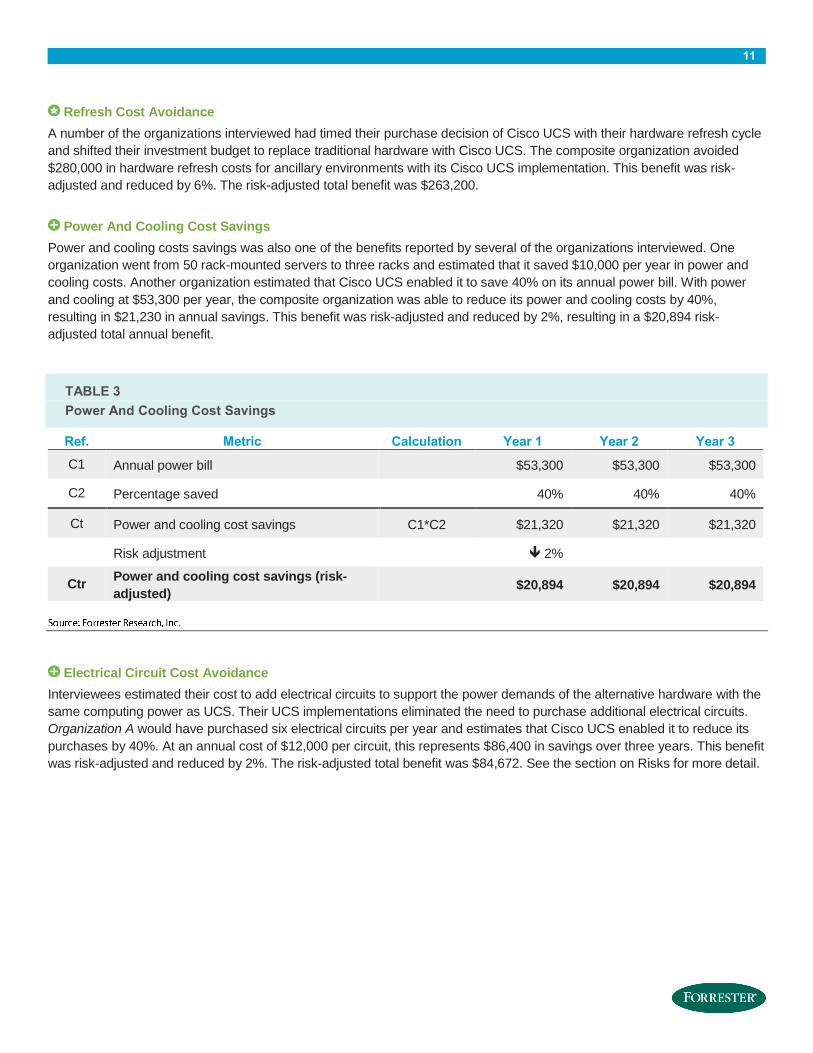
Power And Cooling Cost Savings
Power and cooling costs savings was also one of the benefits reported by several of the organizations interviewed. One
organization went from 50 rack-mounted servers to three racks and estimated that it saved $10,000 per year in power and
cooling costs. Another organization estimated that Cisco UCS enabled it to save 40% on its annual power bill. With power
and cooling at $53,300 per year, the composite organization was able to reduce its power and cooling costs by 40%,
resulting in $21,230 in annual savings. This benefit was risk-adjusted and reduced by 2%, resulting in a $20,894 risk-
adjusted total annual benefit.
TABLE 3
Power And Cooling Cost Savings
Ref. Metric Calculation Year 1 Year 2 Year 3
C1 Annual power bill $53,300 $53,300 $53,300
C2 Percentage saved 40% 40% 40%
Ct Power and cooling cost savings C1*C2 $21,320 $21,320 $21,320
Risk adjustment 2%
Ctr Power and cooling cost savings (risk-
adjusted) $20,894 $20,894 $20,894
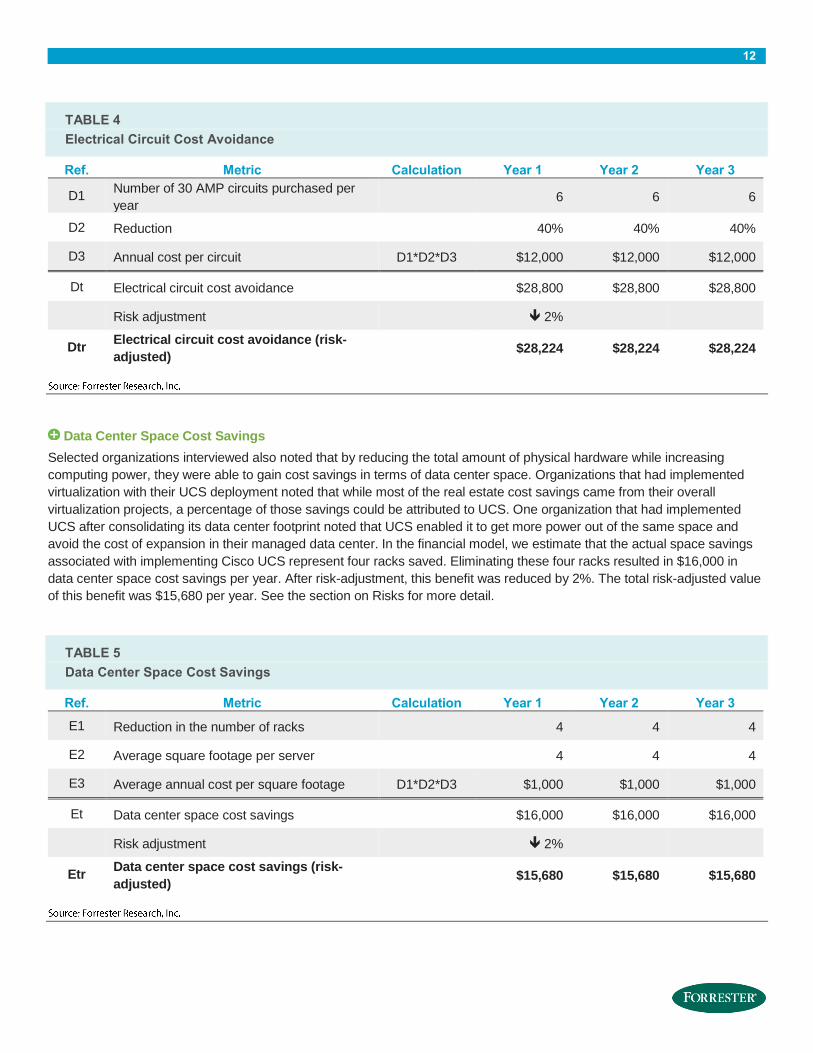
Electrical Circuit Cost Avoidance
Interviewees estimated their cost to add electrical circuits to support the power demands of the alternative hardware with the
same computing power as UCS. Their UCS implementations eliminated the need to purchase additional electrical circuits.
Organization A would have purchased six electrical circuits per year and estimates that Cisco UCS enabled it to reduce its
purchases by 40%. At an annual cost of $12,000 per circuit, this represents $86,400 in savings over three years. This benefit
was risk-adjusted and reduced by 2%. The risk-adjusted total benefit was $84,672. See the section on Risks for more detail.
12
TABLE 4
Electrical Circuit Cost Avoidance
Ref. Metric Calculation Year 1 Year 2 Year 3
D1 Number of 30 AMP circuits purchased per
year 6 6 6
D2 Reduction 40% 40% 40%
D3 Annual cost per circuit D1*D2*D3 $12,000 $12,000 $12,000
Dt Electrical circuit cost avoidance $28,800 $28,800 $28,800
Risk adjustment 2%
Dtr Electrical circuit cost avoidance (risk-
adjusted) $28,224 $28,224 $28,224
Data Center Space Cost Savings
Selected organizations interviewed also noted that by reducing the total amount of physical hardware while increasing
computing power, they were able to gain cost savings in terms of data center space. Organizations that had implemented
virtualization with their UCS deployment noted that while most of the real estate cost savings came from their overall
virtualization projects, a percentage of those savings could be attributed to UCS. One organization that had implemented
UCS after consolidating its data center footprint noted that UCS enabled it to get more power out of the same space and
avoid the cost of expansion in their managed data center. In the financial model, we estimate that the actual space savings
associated with implementing Cisco UCS represent four racks saved. Eliminating these four racks resulted in $16,000 in
data center space cost savings per year. After risk-adjustment, this benefit was reduced by 2%. The total risk-adjusted value
of this benefit was $15,680 per year. See the section on Risks for more detail.
TABLE 5
Data Center Space Cost Savings
Ref. Metric Calculation Year 1 Year 2 Year 3
E1 Reduction in the number of racks 4 4 4
E2 Average square footage per server 4 4 4
E3 Average annual cost per square footage D1*D2*D3 $1,000 $1,000 $1,000
Et Data center space cost savings $16,000 $16,000 $16,000
Risk adjustment 2%
Etr Data center space cost savings (risk-
adjusted) $15,680 $15,680 $15,680
13
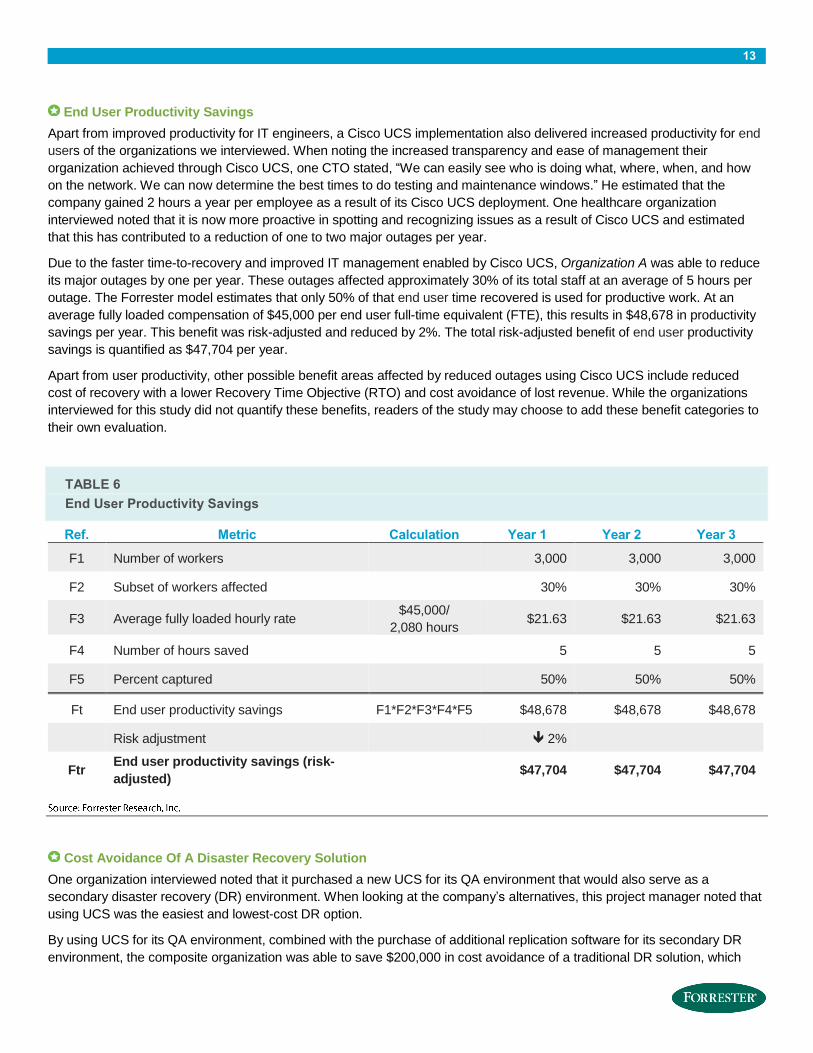
End User Productivity Savings
Apart from improved productivity for IT engineers, a Cisco UCS implementation also delivered increased productivity for end
users of the organizations we interviewed. When noting the increased transparency and ease of management their
organization achieved through Cisco UCS, one CTO stated, “We can easily see who is doing what, where, when, and how
on the network. We can now determine the best times to do testing and maintenance windows.” He estimated that the
company gained 2 hours a year per employee as a result of its Cisco UCS deployment. One healthcare organization
interviewed noted that it is now more proactive in spotting and recognizing issues as a result of Cisco UCS and estimated
that this has contributed to a reduction of one to two major outages per year.
Due to the faster time-to-recovery and improved IT management enabled by Cisco UCS, Organization A was able to reduce
its major outages by one per year. These outages affected approximately 30% of its total staff at an average of 5 hours per
outage. The Forrester model estimates that only 50% of that end user time recovered is used for productive work. At an
average fully loaded compensation of $45,000 per end user full-time equivalent (FTE), this results in $48,678 in productivity
savings per year. This benefit was risk-adjusted and reduced by 2%. The total risk-adjusted benefit of end user productivity
savings is quantified as $47,704 per year.
Apart from user productivity, other possible benefit areas affected by reduced outages using Cisco UCS include reduced
cost of recovery with a lower Recovery Time Objective (RTO) and cost avoidance of lost revenue. While the organizations
interviewed for this study did not quantify these benefits, readers of the study may choose to add these benefit categories to
their own evaluation.
TABLE 6
End User Productivity Savings
Ref. Metric Calculation Year 1 Year 2 Year 3
F1 Number of workers 3,000 3,000 3,000
F2 Subset of workers affected 30% 30% 30%
F3 Average fully loaded hourly rate $45,000/
2,080 hours $21.63 $21.63 $21.63
F4 Number of hours saved 5 5 5
F5 Percent captured 50% 50% 50%
Ft End user productivity savings F1*F2*F3*F4*F5 $48,678 $48,678 $48,678
Risk adjustment 2%
Ftr End user productivity savings (risk-
adjusted) $47,704 $47,704 $47,704
Cost Avoidance Of A Disaster Recovery Solution
One organization interviewed noted that it purchased a new UCS for its QA environment that would also serve as a
secondary disaster recovery (DR) environment. When looking at the company’s alternatives, this project manager noted that
using UCS was the easiest and lowest-cost DR option.
By using UCS for its QA environment, combined with the purchase of additional replication software for its secondary DR
environment, the composite organization was able to save $200,000 in cost avoidance of a traditional DR solution, which
14
includes storage and replication. This project was implemented in Year 3 after the organization’s initial UCS deployment. The
DR cost avoidance savings were risk-adjusted and reduced by 6%, resulting in a $188,000 total benefit recognized in Year 3
of the implementation.
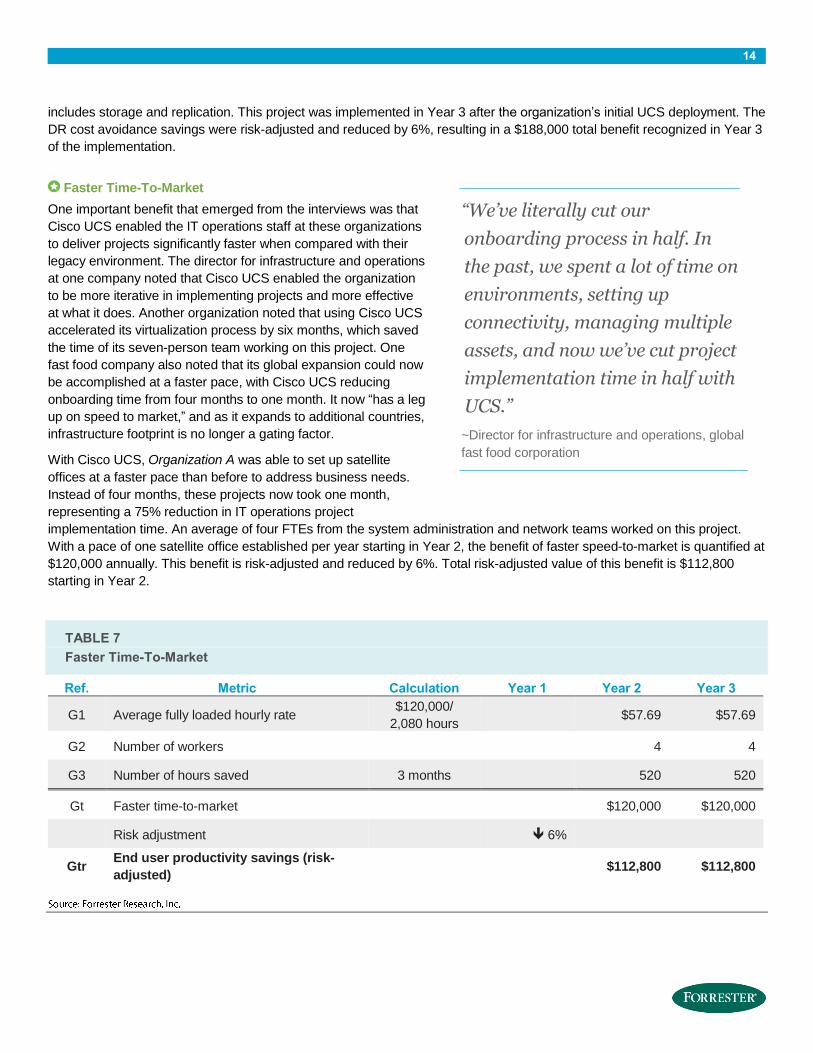
Faster Time-To-Market
One important benefit that emerged from the interviews was that
Cisco UCS enabled the IT operations staff at these organizations
to deliver projects significantly faster when compared with their
legacy environment. The director for infrastructure and operations
at one company noted that Cisco UCS enabled the organization
to be more iterative in implementing projects and more effective
at what it does. Another organization noted that using Cisco UCS
accelerated its virtualization process by six months, which saved
the time of its seven-person team working on this project. One
fast food company also noted that its global expansion could now
be accomplished at a faster pace, with Cisco UCS reducing
onboarding time from four months to one month. It now “has a leg
up on speed to market,” and as it expands to additional countries,
infrastructure footprint is no longer a gating factor.
With Cisco UCS, Organization A was able to set up satellite
offices at a faster pace than before to address business needs.
Instead of four months, these projects now took one month,
representing a 75% reduction in IT operations project
implementation time. An average of four FTEs from the system administration and network teams worked on this project.
With a pace of one satellite office established per year starting in Year 2, the benefit of faster speed-to-market is quantified at
$120,000 annually. This benefit is risk-adjusted and reduced by 6%. Total risk-adjusted value of this benefit is $112,800
starting in Year 2.
TABLE 7
Faster Time-To-Market
Ref. Metric Calculation Year 1 Year 2 Year 3
G1 Average fully loaded hourly rate $120,000/
2,080 hours $57.69 $57.69
G2 Number of workers 4 4
G3 Number of hours saved 3 months 520 520
Gt Faster time-to-market $120,000 $120,000
Risk adjustment 6%
Gtr End user productivity savings (risk-
adjusted) $112,800 $112,800
“We’ve literally cut our
onboarding process in half. In
the past, we spent a lot of time on
environments, setting up
connectivity, managing multiple
assets, and now we’ve cut project
implementation time in half with
UCS.”
~Director for infrastructure and operations, global
fast food corporation
15
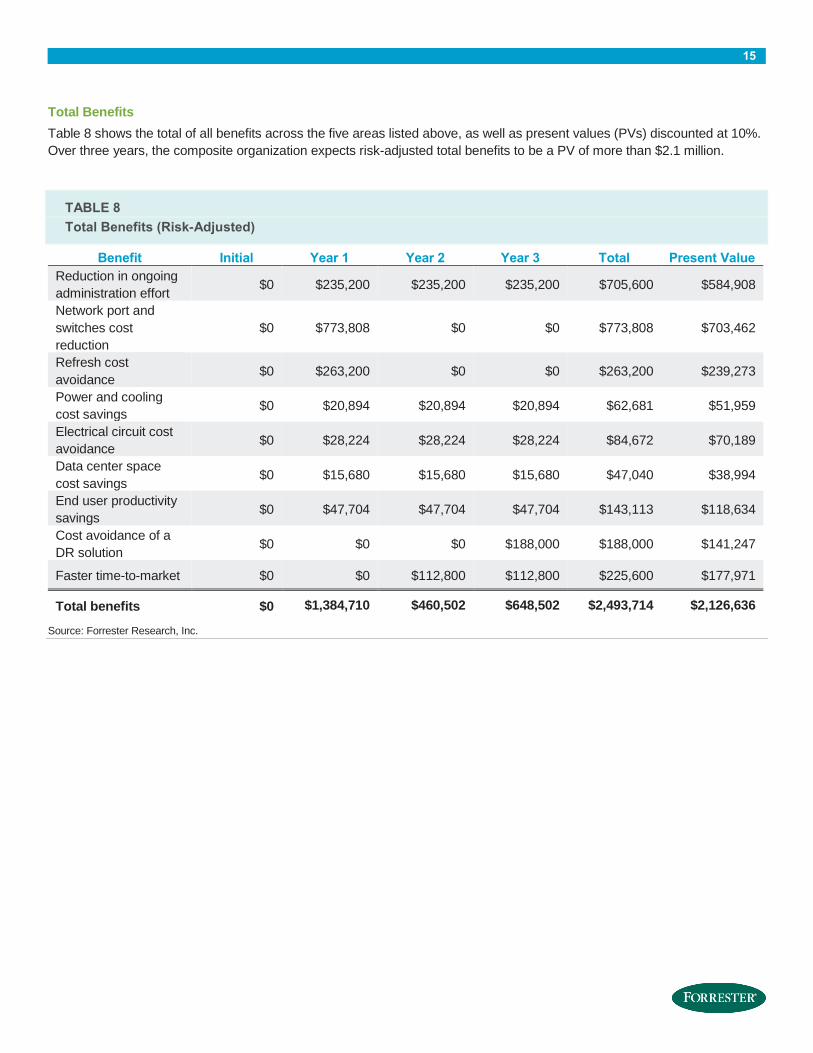
Total Benefits
Table 8 shows the total of all benefits across the five areas listed above, as well as present values (PVs) discounted at 10%.
Over three years, the composite organization expects risk-adjusted total benefits to be a PV of more than $2.1 million.
TABLE 8
Total Benefits (Risk-Adjusted)
Benefit Initial Year 1 Year 2 Year 3 Total Present Value
Reduction in ongoing
administration effort $0 $235,200 $235,200 $235,200 $705,600 $584,908
Network port and
switches cost
reduction
$0 $773,808 $0 $0 $773,808 $703,462
Refresh cost
avoidance $0 $263,200 $0 $0 $263,200 $239,273
Power and cooling
cost savings $0 $20,894 $20,894 $20,894 $62,681 $51,959
Electrical circuit cost
avoidance $0 $28,224 $28,224 $28,224 $84,672 $70,189
Data center space
cost savings $0 $15,680 $15,680 $15,680 $47,040 $38,994
End user productivity
savings $0 $47,704 $47,704 $47,704 $143,113 $118,634
Cost avoidance of a
DR solution $0 $0 $0 $188,000 $188,000 $141,247
Faster time-to-market $0 $0 $112,800 $112,800 $225,600 $177,971
Total benefits $0 $1,384,710 $460,502 $648,502 $2,493,714 $2,126,636
Source: Forrester Research, Inc.
16
COSTS
The composite organization experienced a number of costs associated with the Cisco UCS solution:
› UCS hardware, license, and maintenance fees.
› UCS port and switching costs.
› Internal labor implementation costs.
These represent the mix of internal and external costs experienced by the composite organization for initial planning,
implementation, and ongoing maintenance associated with the solution.
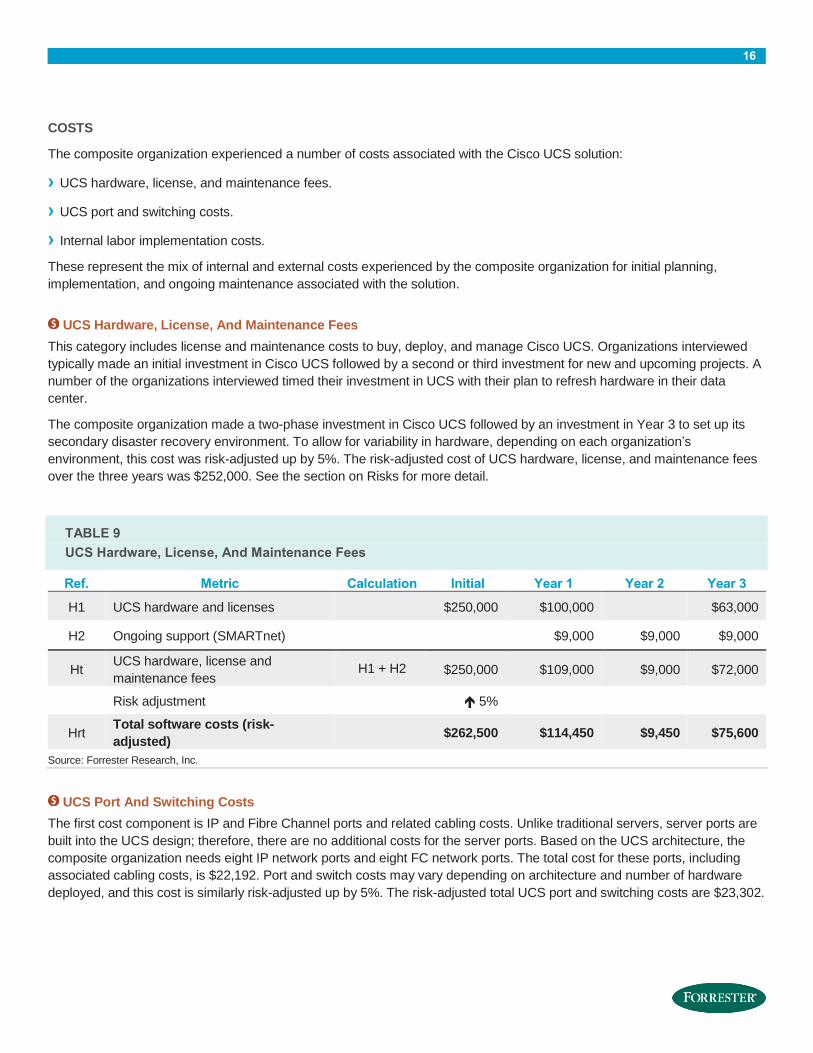
UCS Hardware, License, And Maintenance Fees
This category includes license and maintenance costs to buy, deploy, and manage Cisco UCS. Organizations interviewed
typically made an initial investment in Cisco UCS followed by a second or third investment for new and upcoming projects. A
number of the organizations interviewed timed their investment in UCS with their plan to refresh hardware in their data
center.
The composite organization made a two-phase investment in Cisco UCS followed by an investment in Year 3 to set up its
secondary disaster recovery environment. To allow for variability in hardware, depending on each organization’s
environment, this cost was risk-adjusted up by 5%. The risk-adjusted cost of UCS hardware, license, and maintenance fees
over the three years was $252,000. See the section on Risks for more detail.
TABLE 9
UCS Hardware, License, And Maintenance Fees
Ref. Metric Calculation Initial Year 1 Year 2 Year 3
H1 UCS hardware and licenses $250,000 $100,000 $63,000
H2 Ongoing support (SMARTnet) $9,000 $9,000 $9,000
Ht UCS hardware, license and
maintenance fees H1 + H2 $250,000 $109,000 $9,000 $72,000
Risk adjustment 5%
Hrt Total software costs (risk-
adjusted) $262,500 $114,450 $9,450 $75,600
Source: Forrester Research, Inc.
UCS Port And Switching Costs
The first cost component is IP and Fibre Channel ports and related cabling costs. Unlike traditional servers, server ports are
built into the UCS design; therefore, there are no additional costs for the server ports. Based on the UCS architecture, the
composite organization needs eight IP network ports and eight FC network ports. The total cost for these ports, including
associated cabling costs, is $22,192. Port and switch costs may vary depending on architecture and number of hardware
deployed, and this cost is similarly risk-adjusted up by 5%. The risk-adjusted total UCS port and switching costs are $23,302.
17
Implementation Costs — Internal Labor
The composite organization enlisted three IT engineers to implement Cisco UCS for approximately 30 servers and 900
virtual machines (VMs). These engineers spent 30% of their time over six months, or 312 man-hours each, for the
deployment. At an annual fully loaded compensation of $120,000, the total internal labor for implementation cost
Organization A $54,000. As implementation costs may vary by organization, this cost was risk-adjusted by 25%. The total
risk-adjusted cost of the internal labor for the composite organization’s Cisco UCS implementation was $67,500.
Training And Professional Fees
All of the organizations interviewed noted that they did not incur any significant training costs or professional fees in their
Cisco UCS implementation. “It’s been so intuitive,” noted one CTO. One transportation company noted that its engineers
“have been able to teach themselves,” thus the organization did not require any outside professional services for its Cisco
UCS deployment. This creates an indirect cost savings for customers since they can add UCS servers as and when they
need them, without the requirement of scheduling a professional services engagement and the associated fees.
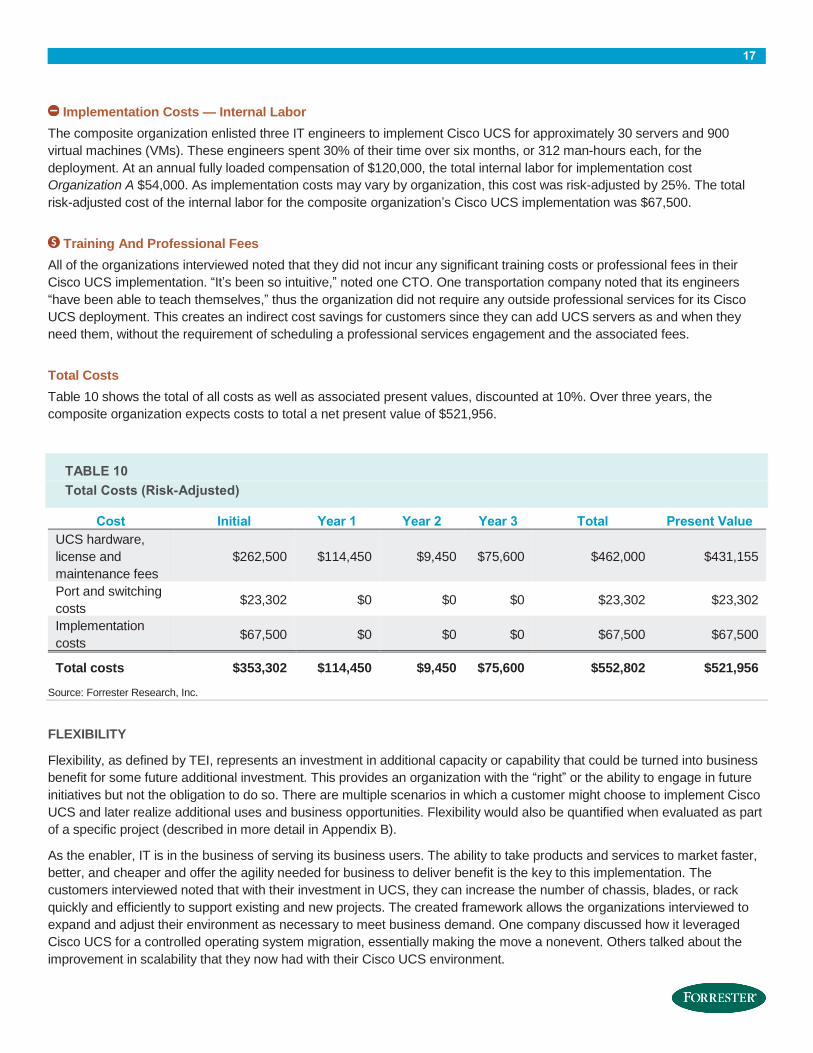
Total Costs
Table 10 shows the total of all costs as well as associated present values, discounted at 10%. Over three years, the
composite organization expects costs to total a net present value of $521,956.
TABLE 10
Total Costs (Risk-Adjusted)
Cost Initial Year 1 Year 2 Year 3 Total Present Value
UCS hardware,
license and
maintenance fees
$262,500 $114,450 $9,450 $75,600 $462,000 $431,155
Port and switching
costs $23,302 $0 $0 $0 $23,302 $23,302
Implementation
costs $67,500 $0 $0 $0 $67,500 $67,500
Total costs $353,302 $114,450 $9,450 $75,600 $552,802 $521,956
Source: Forrester Research, Inc.
FLEXIBILITY
Flexibility, as defined by TEI, represents an investment in additional capacity or capability that could be turned into business
benefit for some future additional investment. This provides an organization with the “right” or the ability to engage in future
initiatives but not the obligation to do so. There are multiple scenarios in which a customer might choose to implement Cisco
UCS and later realize additional uses and business opportunities. Flexibility would also be quantified when evaluated as part
of a specific project (described in more detail in Appendix B).
As the enabler, IT is in the business of serving its business users. The ability to take products and services to market faster,
better, and cheaper and offer the agility needed for business to deliver benefit is the key to this implementation. The
customers interviewed noted that with their investment in UCS, they can increase the number of chassis, blades, or rack
quickly and efficiently to support existing and new projects. The created framework allows the organizations interviewed to
expand and adjust their environment as necessary to meet business demand. One company discussed how it leveraged
Cisco UCS for a controlled operating system migration, essentially making the move a nonevent. Others talked about the
improvement in scalability that they now had with their Cisco UCS environment.
18
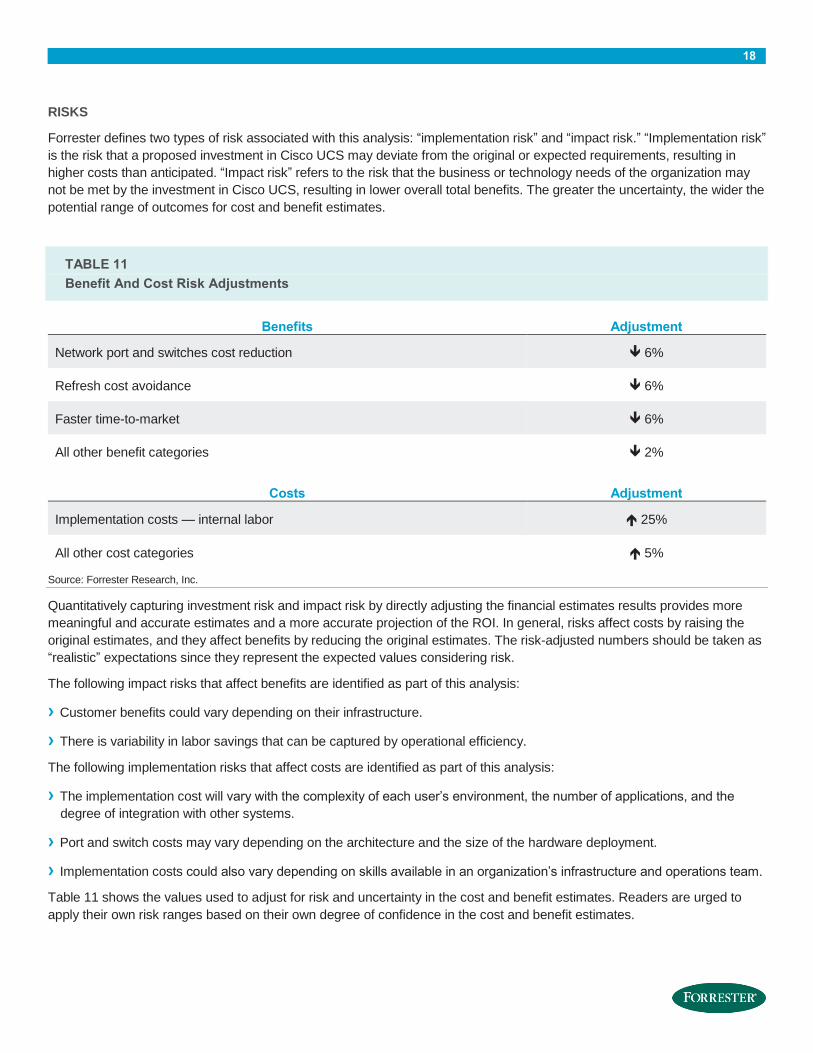
RISKS
Forrester defines two types of risk associated with this analysis: “implementation risk” and “impact risk.” “Implementation risk”
is the risk that a proposed investment in Cisco UCS may deviate from the original or expected requirements, resulting in
higher costs than anticipated. “Impact risk” refers to the risk that the business or technology needs of the organization may
not be met by the investment in Cisco UCS, resulting in lower overall total benefits. The greater the uncertainty, the wider the
potential range of outcomes for cost and benefit estimates.
TABLE 11
Benefit And Cost Risk Adjustments
Benefits Adjustment
Network port and switches cost reduction 6%
Refresh cost avoidance 6%
Faster time-to-market 6%
All other benefit categories 2%
Costs Adjustment
Implementation costs — internal labor 25%
All other cost categories 5%
Source: Forrester Research, Inc.
Quantitatively capturing investment risk and impact risk by directly adjusting the financial estimates results provides more
meaningful and accurate estimates and a more accurate projection of the ROI. In general, risks affect costs by raising the
original estimates, and they affect benefits by reducing the original estimates. The risk-adjusted numbers should be taken as
“realistic” expectations since they represent the expected values considering risk.
The following impact risks that affect benefits are identified as part of this analysis:
› Customer benefits could vary depending on their infrastructure.
› There is variability in labor savings that can be captured by operational efficiency.
The following implementation risks that affect costs are identified as part of this analysis:
› The implementation cost will vary with the complexity of each user’s environment, the number of applications, and the
degree of integration with other systems.
› Port and switch costs may vary depending on the architecture and the size of the hardware deployment.
› Implementation costs could also vary depending on skills available in an organization’s infrastructure and operations team.
Table 11 shows the values used to adjust for risk and uncertainty in the cost and benefit estimates. Readers are urged to
apply their own risk ranges based on their own degree of confidence in the cost and benefit estimates.
19
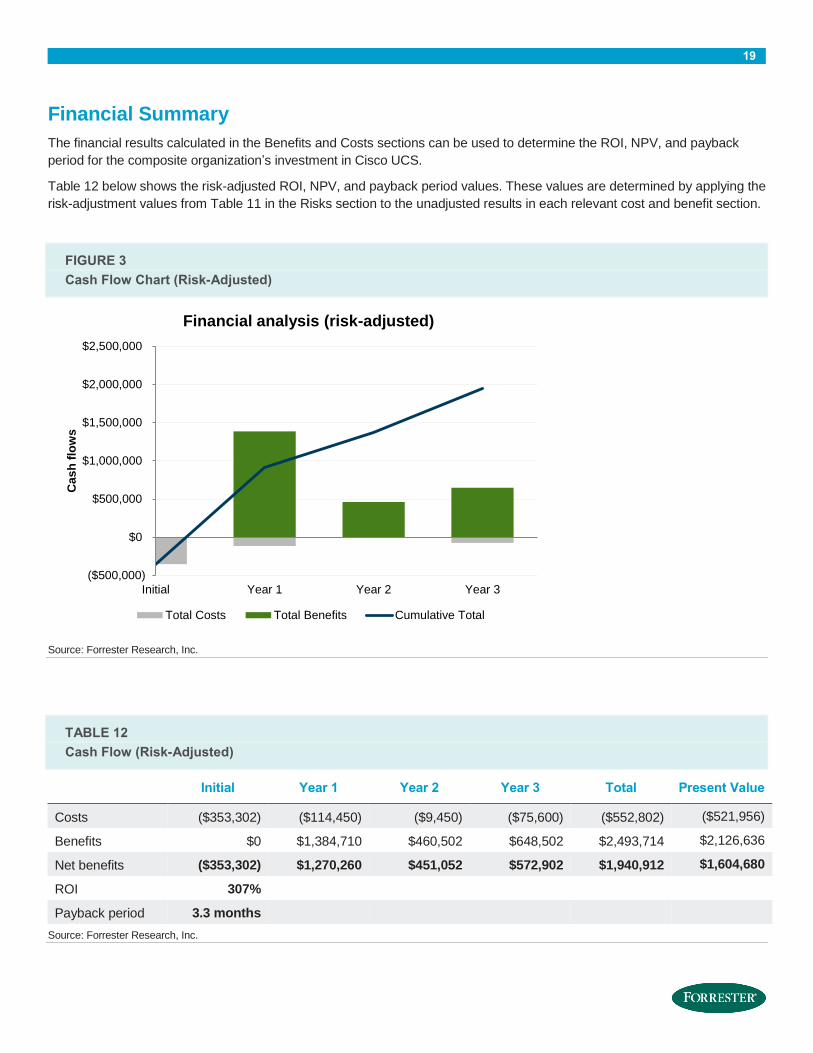
Financial Summary
The financial results calculated in the Benefits and Costs sections can be used to determine the ROI, NPV, and payback
period for the composite organization’s investment in Cisco UCS.
Table 12 below shows the risk-adjusted ROI, NPV, and payback period values. These values are determined by applying the
risk-adjustment values from Table 11 in the Risks section to the unadjusted results in each relevant cost and benefit section.
FIGURE 3
Cash Flow Chart (Risk-Adjusted)
Source: Forrester Research, Inc.
TABLE 12
Cash Flow (Risk-Adjusted)
Initial Year 1 Year 2 Year 3 Total Present Value
Costs ($353,302) ($114,450) ($9,450) ($75,600) ($552,802) ($521,956)
Benefits $0 $1,384,710 $460,502 $648,502 $2,493,714 $2,126,636
Net benefits ($353,302) $1,270,260 $451,052 $572,902 $1,940,912 $1,604,680
ROI 307%
Payback period 3.3 months
Source: Forrester Research, Inc.
($500,000)
$0
$500,000
$1,000,000
$1,500,000
$2,000,000
$2,500,000
Initial Year 1 Year 2 Year 3
Cas
h f
low
s
Financial analysis (risk-adjusted)
Total Costs Total Benefits Cumulative Total
20
Cisco UCS: Overview
The following information is provided by Cisco. Forrester has not validated any claims and does not endorse Cisco or its
offerings.
Cisco UCS unites computing, network, storage access, and virtualization into a cohesive system designed to reduce TCO and increase business agility. The Cisco UCS is built from the following components:
› Cisco UCS Manager: Included with UCS Fabric Interconnects, manage up to 160 blade and rack servers and thousands
of Cisco UCS components including multiple blade chassis with a single tool.
› Cisco UCS Central: Cisco UCS Central manages multiple, globally distributed Cisco UCS domains with thousands of
servers from a single pane, using Global templates and policies.
› Cisco UCS 6200 Series Fabric Interconnects: line-rate, low-latency, lossless interconnect switches.
› Cisco UCS B-Series Blade Servers: enhanced support for application demands, energy use, and virtualization.
› Cisco UCS 5100 Series Blade Server Chassis: support for up to eight blade servers and up to two Fabric Extenders in a
6-rack unit (RU) enclosure.
› Cisco UCS 2200 Series Fabric Extenders: two per 5100 Series blade chassis, provide unified fabric in the Blade Server
Chassis, and up to eight 10 Gbps connections on each Fabric Extender.
› Cisco UCS B-Series Network Adapters: a range of adapters optimized for virtualization, compatibility with existing driver
stacks, or efficient, high-performance Ethernet.
› Cisco UCS C-Series Rack-Mount Servers: the benefits of the UCS in a rack-mount form factor that can be fully
integrated with UCS Blade servers in UCS Manager domains.
› Cisco UCS C-Series Network Adapters: a choice of four types of PCI Express (PCIe) adapters, including Cisco Virtual
Interface Card (VIC).
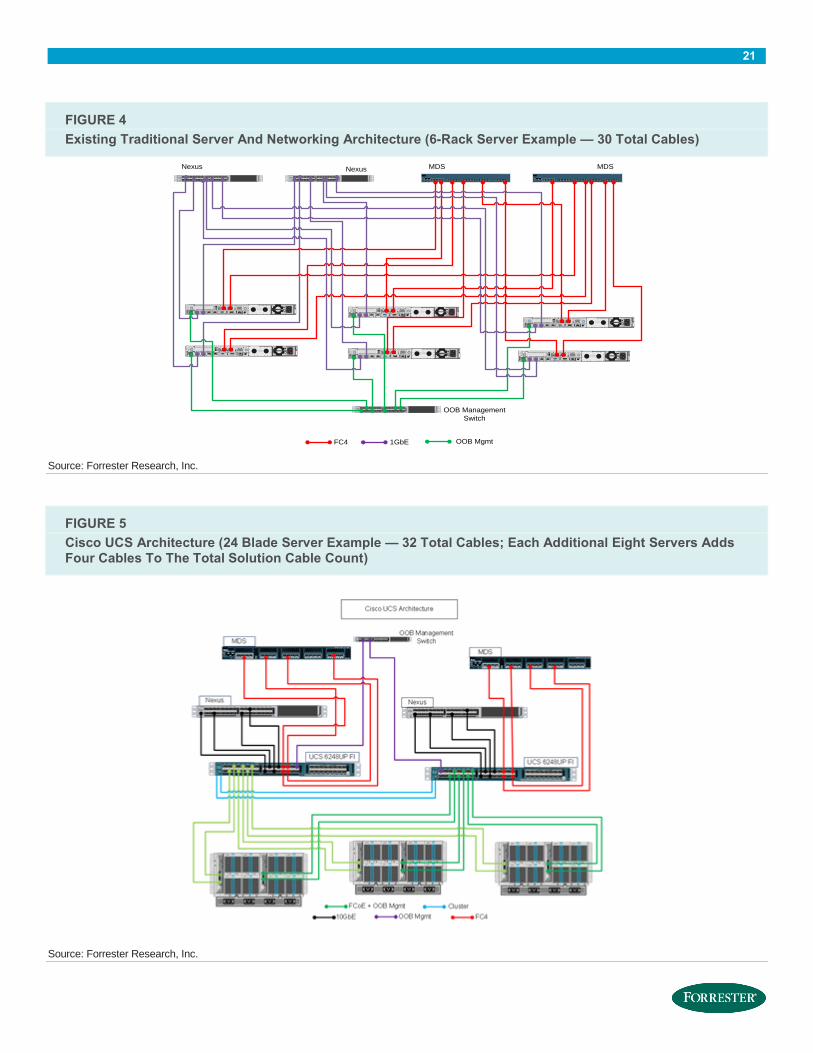
Figures 4 and 5 illustrate the difference between traditional server and networking architecture and Cisco UCS design. The reader should note that adding more UCS blade servers does not necessarily require additional network switches.
21
FIGURE 4
Existing Traditional Server And Networking Architecture (6-Rack Server Example — 30 Total Cables)
Source: Forrester Research, Inc.
FIGURE 5
Cisco UCS Architecture (24 Blade Server Example — 32 Total Cables; Each Additional Eight Servers Adds Four Cables To The Total Solution Cable Count)
Source: Forrester Research, Inc.
UID iLO
TOP
UID iLO
TOP
PO
RT
PO
RT
CIM
C
PO
RT
PO
RT
CIM
C
3
CISCO NEXUS N5548P 1 2 3 4 5 6 7 8 9 10 11 12 13 14 15 16 17 18 19 20 21 22 23 24 25 26 27 28 29 30 31 32
STAT
ID
STATUS
P/S
FAN
LINK ACT
CONSOLEMGMT10/100
RESET
1 4
LN- -SP
5 8
LN- -SP
9 12
LN- -SP
13 16
LN- -SP
17 20
LN- -SP
DS - C9120 - K9
MDS 9120 MULTILAYER INTELLIGENT FC SWITCH
Nexus MDS
STATUS
P/S
FAN
LINK ACT
CONSOLEMGMT10/100
RESET
1 4
LN- -SP
5 8
LN- -SP
9 12
LN- -SP
13 16
LN- -SP
17 20
LN- -SP
DS - C9120 - K9
MDS 9120 MULTILAYER INTELLIGENT FC SWITCH
MDS
3
CISCO NEXUS N5548P 1 2 3 4 5 6 7 8 9 10 11 12 13 14 15 16 17 18 19 20 21 22 23 24 25 26 27 28 29 30 31 32
STAT
ID
Nexus
UID iLO
TOP
UID iLO
TOP
PO
RT
PO
RT
CIM
C
PO
RT
PO
RT
CIM
C
UID iLO
TOP
UID iLO
TOP
PO
RT
PO
RT
CIM
C
PO
RT
PO
RT
CIM
C
OOB Management
Switch
3
CISCO NEXUS N5548P 1 2 3 4 5 6 7 8 9 10 11 12 13 14 15 16 17 18 19 20 21 22 23 24 25 26 27 28 29 30 31 32
STAT
ID
FC4 1GbE OOB Mgmt
22
Appendix A: Composite Organization Description
For this TEI study, Forrester has created a composite organization to illustrate the quantifiable benefits and costs of
implementing Cisco UCS. The composite company is intended to represent a US-based medical services provider with
3,000 employees and is based on characteristics of the interviewed customers.
The composite organization that Forrester synthesized from these results represents an organization with $500 million in
annual revenue. It is based in the US but also maintains a global footprint. The purchase of Cisco UCS was also aligned with
the composite organization’s refresh schedule to maximize the investment and reduce migration effort.
In purchasing Cisco UCS, the composite company has the following objectives:
› Reduce the time and effort associated with ongoing data care management with the aim of limiting IT personnel costs
even as the organization is growing at a rapid pace.
› Reduce costs of cabling and network infrastructure and manage other data center costs such as power and cooling and
real estate even as the business requires data growth.
› Incorporate Cisco UCS as part of its overall virtualization strategy.
For the purpose of the analysis, Forrester assumes that the organization had virtualized 40% of its data center prior to its
implementation of UCS.
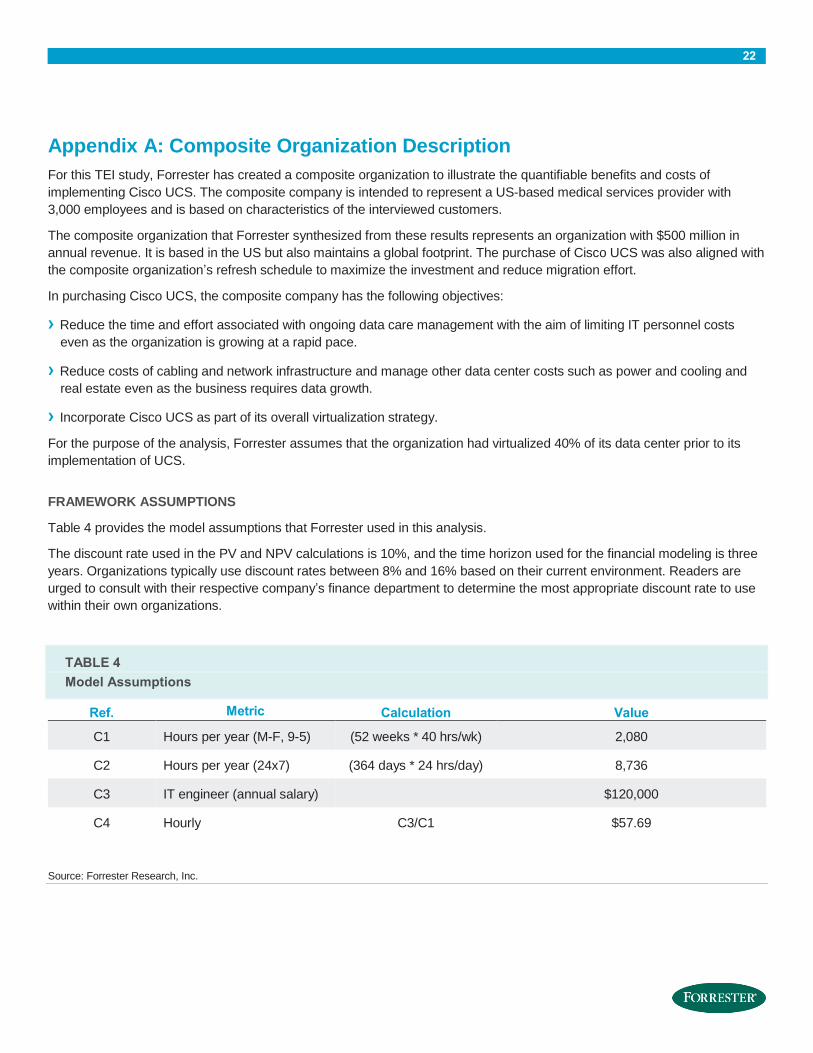
FRAMEWORK ASSUMPTIONS
Table 4 provides the model assumptions that Forrester used in this analysis.
The discount rate used in the PV and NPV calculations is 10%, and the time horizon used for the financial modeling is three
years. Organizations typically use discount rates between 8% and 16% based on their current environment. Readers are
urged to consult with their respective company’s finance department to determine the most appropriate discount rate to use
within their own organizations.
TABLE 4
Model Assumptions
Ref. Metric Calculation Value
C1 Hours per year (M-F, 9-5) (52 weeks * 40 hrs/wk) 2,080
C2 Hours per year (24x7) (364 days * 24 hrs/day) 8,736
C3 IT engineer (annual salary) $120,000
C4 Hourly C3/C1 $57.69
Source: Forrester Research, Inc.
23
Appendix B: Total Economic Impact™ Overview
Total Economic Impact is a methodology developed by Forrester Research that enhances a company’s technology decision-
making processes and assists vendors in communicating the value proposition of their products and services to clients. The
TEI methodology helps companies demonstrate, justify, and realize the tangible value of IT initiatives to both senior
management and other key business stakeholders.
The TEI methodology consists of four components to evaluate investment value: benefits, costs, flexibility, and risks.
BENEFITS
Benefits represent the value delivered to the user organization — IT and/or business units — by the proposed product or
project. Often, product or project justification exercises focus just on IT cost and cost reduction, leaving little room to analyze
the effect of the technology on the entire organization. The TEI methodology and the resulting financial model place equal
weight on the measure of benefits and the measure of costs, allowing for a full examination of the effect of the technology on
the entire organization. Calculation of benefit estimates involves a clear dialogue with the user organization to understand
the specific value that is created. In addition, Forrester also requires that there be a clear line of accountability established
between the measurement and justification of benefit estimates after the project has been completed. This ensures that
benefit estimates tie back directly to the bottom line.
COSTS
Costs represent the investment necessary to capture the value, or benefits, of the proposed project. IT or the business units
may incur costs in the form of fully burdened labor, subcontractors, or materials. Costs consider all the investments and
expenses necessary to deliver the proposed value. In addition, the cost category within TEI captures any incremental costs
over the existing environment for ongoing costs associated with the solution. All costs must be tied to the benefits that are
created.
FLEXIBILITY
Within the TEI methodology, direct benefits represent one part of the investment value. While direct benefits can typically be
the primary way to justify a project, Forrester believes that organizations should be able to measure the strategic value of an
investment. Flexibility represents the value that can be obtained for some future additional investment building on top of the
initial investment already made. For instance, an investment in an enterprisewide upgrade of an office productivity suite can
potentially increase standardization (to increase efficiency) and reduce licensing costs. However, an embedded collaboration
feature may translate to greater worker productivity if activated. The collaboration can only be used with additional
investment in training at some future point. However, having the ability to capture that benefit has a PV that can be
estimated. The flexibility component of TEI captures that value.
RISKS
Risks measure the uncertainty of benefit and cost estimates contained within the investment. Uncertainty is measured in two
ways: 1) the likelihood that the cost and benefit estimates will meet the original projections and 2) the likelihood that the
estimates will be measured and tracked over time. TEI applies a probability density function known as “triangular distribution”
to the values entered. At a minimum, three values are calculated to estimate the underlying range around each cost and
benefit.
24
Appendix C: Glossary
Discount rate: The interest rate used in cash flow analysis to take into account the time value of money. Companies set
their own discount rate based on their business and investment environment. Forrester assumes a yearly discount rate of
10% for this analysis. Organizations typically use discount rates between 8% and 16% based on their current environment.
Readers are urged to consult their respective organizations to determine the most appropriate discount rate to use in their
own environment.
Net present value (NPV): The present or current value of (discounted) future net cash flows given an interest rate (the
discount rate). A positive project NPV normally indicates that the investment should be made, unless other projects have
higher NPVs.
Present value (PV): The present or current value of (discounted) cost and benefit estimates given at an interest rate (the
discount rate). The PV of costs and benefits feed into the total NPV of cash flows.
Payback period: The breakeven point for an investment. This is the point in time at which net benefits (benefits minus costs)
equal initial investment or cost.
Return on investment (ROI): A measure of a project’s expected return in percentage terms. ROI is calculated by dividing
net benefits (benefits minus costs) by costs.
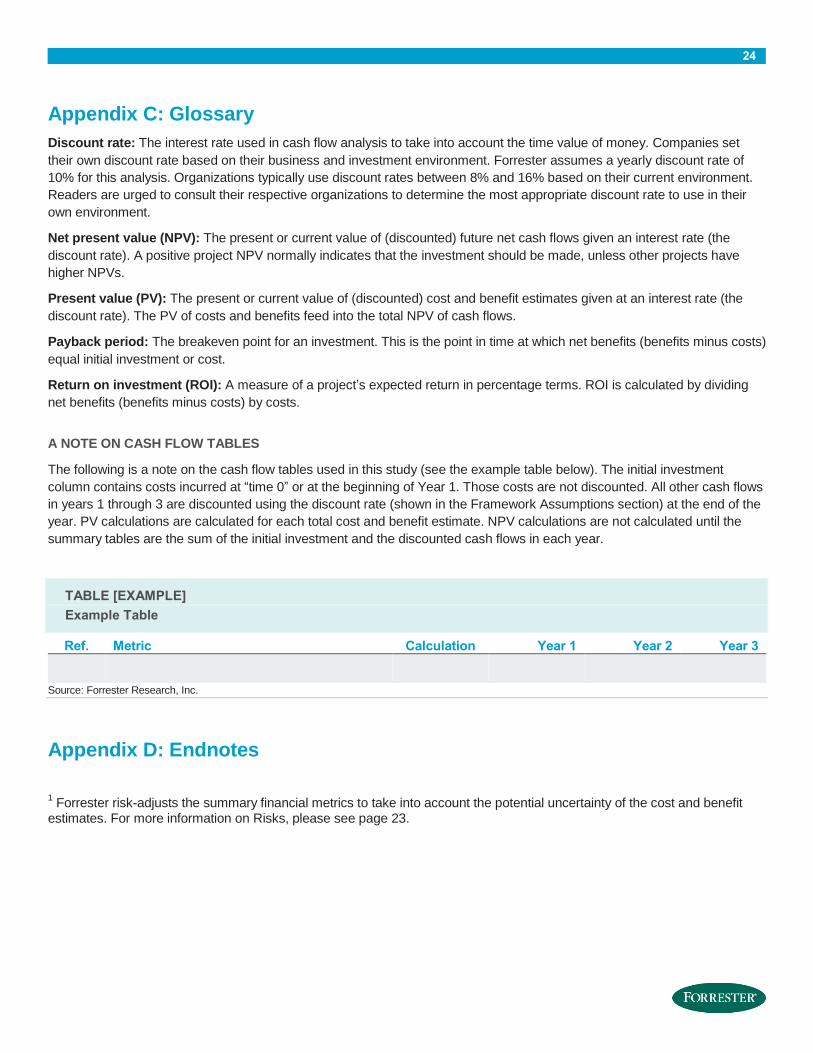
A NOTE ON CASH FLOW TABLES
The following is a note on the cash flow tables used in this study (see the example table below). The initial investment
column contains costs incurred at “time 0” or at the beginning of Year 1. Those costs are not discounted. All other cash flows
in years 1 through 3 are discounted using the discount rate (shown in the Framework Assumptions section) at the end of the
year. PV calculations are calculated for each total cost and benefit estimate. NPV calculations are not calculated until the
summary tables are the sum of the initial investment and the discounted cash flows in each year.
TABLE [EXAMPLE]
Example Table
Ref. Metric Calculation Year 1 Year 2 Year 3
Source: Forrester Research, Inc.
Appendix D: Endnotes
1 Forrester risk-adjusts the summary financial metrics to take into account the potential uncertainty of the cost and benefit
estimates. For more information on Risks, please see page 23.