Embed Size (px)
Citation preview
A Forrester Total Economic Impact™
Study Commissioned By ADP
October 2017
The Total Economic Impact™ Of ADP Workforce Now
Cost Savings And Business Benefits Enabled By Workforce Now

Table Of Contents Executive Summary 1
Key Findings 1
TEI Framework And Methodology 4
The Workforce Now Customer Journey 5
Interviewed Organizations 5
Key Challenges 5
Key Results 6
Financial Analysis 7
Administration Time Savings 7
Payroll And Time And Attendance Time Savings 8
Benefit Administration Time Savings 8
Recruitment Time Savings 9
Performance Management Time Savings 10
Printing And Shipping Cost Savings 11
End User Time Savings 11
Reduced Tax And Compliance Penalties 12
Prior Solution Cost Savings 12
Costs 15
Financial Summary 18
ADP Workforce Now: Overview 19
Calculation Tables 21
Project Director:
Kathleen Byrne
October 2017
ABOUT FORRESTER CONSULTING
Forrester Consulting provides independent and objective research-based
consulting to help leaders succeed in their organizations. Ranging in scope from a
short strategy session to custom projects, Forrester’s Consulting services connect
you directly with research analysts who apply expert insight to your specific
business challenges. For more information, visit forrester.com/consulting.
© 2017, Forrester Research, Inc. All rights reserved. Unauthorized reproduction
is strictly prohibited. Information is based on best available resources.
Opinions reflect judgment at the time and are subject to change. Forrester®,
Technographics®, Forrester Wave, RoleView, TechRadar, and Total Economic
Impact are trademarks of Forrester Research, Inc. All other trademarks are the
property of their respective companies. For additional information, go to
forrester.com.
1 | The Total Economic Impact™ Of ADP Workforce Now
Executive Summary
In the digital age, workforces expect a technology-driven employee
experience that reflects the level of innovation in consumer-grade
customer experiences. Simultaneously, businesses are constantly being
asked to do more with less. This presents a unique challenge to HR
managers — how do they deliver a seamless and enriched experience to
employees while increasing efficiency and decreasing costs across HR
processes?
ADP Workforce Now® provides a cloud-based human capital
management solution that helps its HR customers streamline and simplify
management of the complex employee lifecycle while saving time, budget,
and resources. ADP commissioned Forrester Consulting to conduct a
Total Economic Impact™ (TEI) study and examine the potential return on
investment (ROI) companies may realize by deploying Workforce Now.
To better understand the benefits, costs, and risks associated with this
investment, Forrester interviewed five customers with several years of
experience using Workforce Now. The solution includes several modules:
HR Administration, Benefits Administration, Payroll, Time and Attendance,
and Talent Management. Together these modules provided customers
with technology to manage back-office HR processes as well as tax,
regulations, and Affordable Care Act (ACA) compliance.
Prior to using Workforce Now, these customers leveraged combinations of
earlier versions of ADP software or competitive solutions with several
manual HR processes.
Key Findings
Quantified benefits. The following risk-adjusted quantified benefits are
representative of those experienced by the companies interviewed.
› HR teams automated key processes and provided employees with
self-service functionality, such as updating employee addresses,
reducing the time spent on general HR administrative tasks.
Streamlining and offloading once manual, one-off tasks, such as
changing an address, changing a beneficiary, or looking up vacation
balances, saved an average of 200 hours each year for HR managers.
› Fully automated payroll and time and attendance processes saved
HR resource time. Interviewees’ previous solutions provided some
digital support for payroll, but Workforce Now fully automated the
process, removing all manual steps and providing the checks and
balances that eliminated time-consuming errors. Payroll automation
saved an average of 350 hours per year.
› Moving from paper-based benefit enrollment to digital self-service
tools saved time for HR staff. Previous benefit enrollment processes
required thousands of printed pages, hand-written form completion, and
repetitive manual entry into multiple systems. Workforce Now provided
digital tools to automate these processes and carrier connections that
updated each insurance provider with all the necessary details,
eliminating duplicate entries. Between open enrollment and new hire
benefit enrollment, HR managers saved an average of more than 600
hours per year.
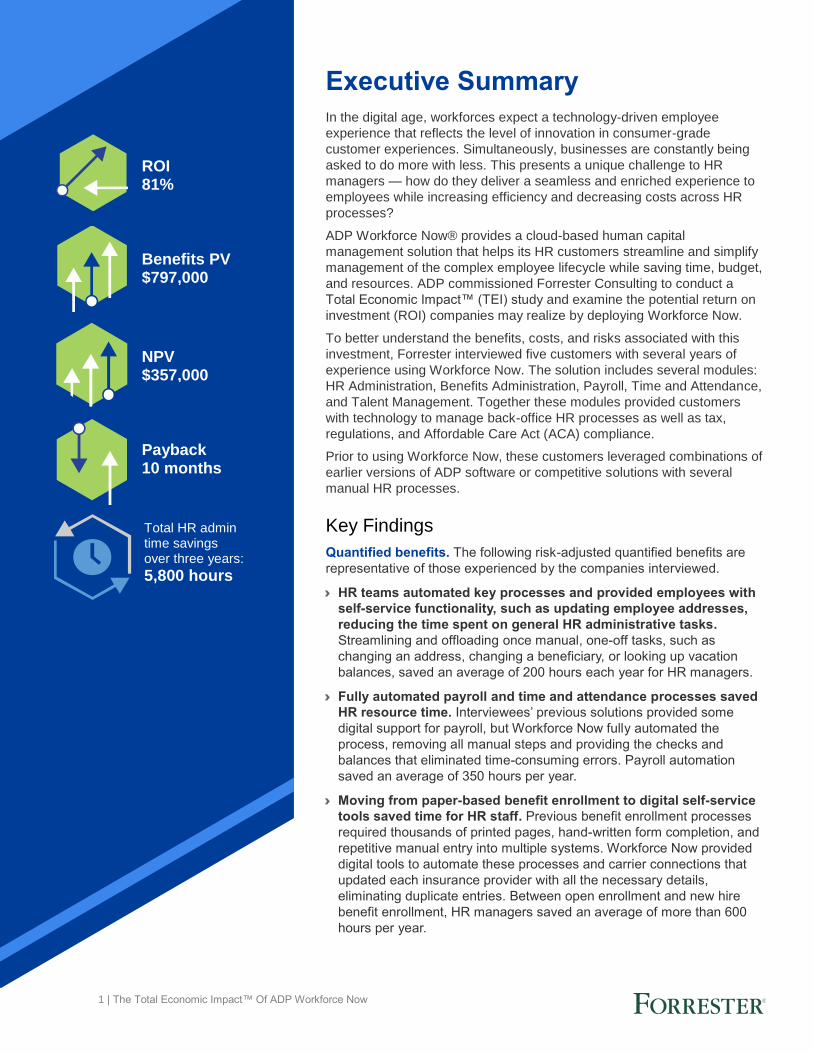
ROI 81%
Benefits PV $797,000
NPV $357,000
Payback 10 months
Total HR admin time savings over three years:
5,800 hours

2 | The Total Economic Impact™ Of ADP Workforce Now
› Streamlining and digitizing recruitment processes reduced
resource time required to hire new employees. Prior to implementing
Workforce Now, interviewees managed the entire hiring process
manually, with paper resumes shuttled to hiring managers. Workforce
Now’s Talent Management functionality digitized resume sharing,
removing over 1,040 hours of effort each year.
› Formalizing annual goal setting and moving it from paper to digital
reduced HR and manager effort during performance reviews.
3 | The Total Economic Impact™ Of ADP Workforce Now
› admins and managers pulling files and shuffling papers around each
year, looking for edits, feedback, and changes. Moving everything to a
digital system standardized the process and removed over 300 hours of
manual effort and enabled managers to track employee progress against
goals throughout the year.
› Shifting process from manual to digital saved thousands in printing
and shipping costs. Open enrollment, new hire enrollment, time cards,
paychecks, and resumes were all moved from hard copies to digital,
eliminating thousands of printed sheets and hundreds of mailings each
year.
› The self-service aspect of digitized processes saved end users
several hours each year. Employees saved time filling out benefit
forms and reduced wait time for completing HR admin tasks, such as
changing their dependents or beneficiaries.
› Tax management and compliance features eliminated missed
deadlines and errors, reducing fines. Interviewees eliminated
previous struggles with differing state tax laws, saving thousands in late
fees and reducing expensive administrative fees from their certified
public accountants (CPAs).
› Moving onto Workforce Now allowed interviewees to retire their
previous solution, saving annual licensing costs. Retiring their
previous HCM solution saved $35,000 per year.
Unquantified benefits. The interviewed organizations experienced the
following benefits, which are not quantified for this study:
› Enhanced talent management processes allowed hiring managers
to find the right candidate, hire them faster, and keep them focused
on company goals. Without shuffling paper resumes around, HR
managers and hiring managers found and interviewed qualified
candidates faster, which reduced the time to hire, delivering value to the
business sooner. Then once the new employees were hired, the
performance management module allowed interviewed companies to
introduce performance goals that kept employees focused on company
priorities and helped them develop their own skill sets.
› Self-service offerings improved the employee experience. End users
no longer had to wait for HR managers to update addresses, change
401(k) deductions, or complete any other administrative items, improving
their perception of internal employee services.
› Access to insights enabled data-driven business decisions.
Workforce Now’s system of record and analytics feature delivered
insights into benefits usage, labor costs, compensation, and attrition,
which interviewees used to make strategic business decisions.
Costs. The interviewed organizations experienced the following risk-
adjusted costs:
› Technology fees. Interviewees paid annual fees to ADP for the use of
Workforce Now. Fees were determined by the number of users and the
modules implemented.
› Implementation and customization. HR team members collaborated
with ADP to implement Workforce Now and paid ADP a nominal
implementation fee. Once the solution was implemented, it spent several
weeks setting up key processes.
Benefits And Costs
ROI
81% Payback Period
10 months Total HR admin time savings over three years:
5,800 hours
4 | The Total Economic Impact™ Of ADP Workforce Now
› Training. Both HR team members and employees attended trainings on
how to execute the programs and leverage the self-service tools.
› Ongoing management. HR team members spend minimal time each
week liaising with ADP and ensuring that the tools are functioning as
expected.
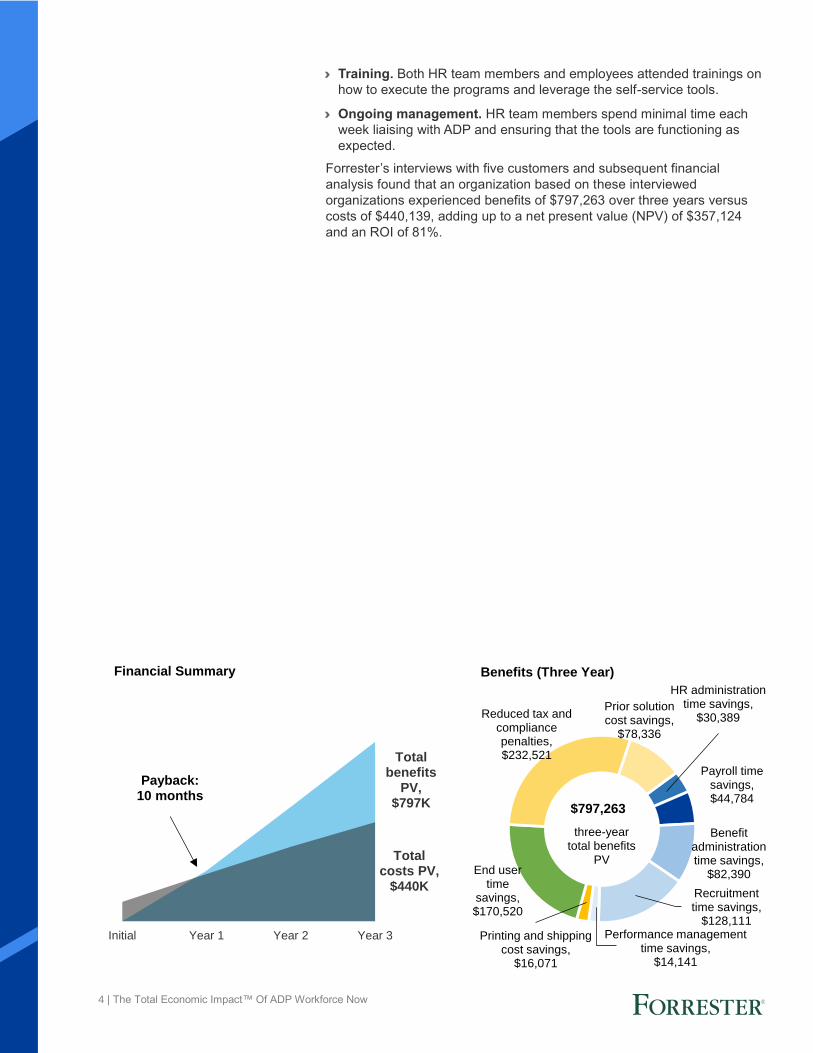
Forrester’s interviews with five customers and subsequent financial
analysis found that an organization based on these interviewed
organizations experienced benefits of $797,263 over three years versus
costs of $440,139, adding up to a net present value (NPV) of $357,124
and an ROI of 81%.
Total benefits
PV, $797K
Total costs PV,
$440K
Initial Year 1 Year 2 Year 3
Financial Summary
Payback:10 months
HR administration time savings,
$30,389
Payroll time savings, $44,784
Benefit administration time savings,
$82,390
Recruitment time savings,
$128,111 Performance management
time savings, $14,141
Printing and shipping cost savings,
$16,071
End user time
savings, $170,520
Reduced tax and compliance penalties, $232,521
Prior solution cost savings,
$78,336
Benefits (Three Year)
three-year total benefits
PV
$797,263

4 | The Total Economic Impact™ Of ADP Workforce Now
TEI Framework And Methodology
From the information provided in the interviews, Forrester has constructed
a Total Economic Impact™ (TEI) framework for those organizations
considering implementing ADP Workforce Now.
The objective of the framework is to identify the cost, benefit, flexibility, and
risk factors that affect the investment decision. Forrester took a multistep
approach to evaluate the impact that ADP Workforce Now can have on an
organization:
DUE DILIGENCE Interviewed ADP stakeholders and Forrester analysts to gather data relative to Workforce Now.
CUSTOMER INTERVIEWS Interviewed five organizations using Workforce Now to obtain data with respect to costs, benefits, and risks.
COMPOSITE ORGANIZATION Designed a composite organization based on characteristics of the interviewed organizations.
FINANCIAL MODEL FRAMEWORK Constructed a financial model representative of the interviews using the TEI methodology and risk-adjusted the financial model based on issues and concerns of the interviewed organizations.
CASE STUDY Employed four fundamental elements of TEI in modeling ADP Workforce Now’s impact: benefits, costs, flexibility, and risks. Given the increasing sophistication that enterprises have regarding ROI analyses related to IT investments, Forrester’s TEI methodology serves to provide a complete picture of the total economic impact of purchase decisions. Please see Appendix A for additional information on the TEI methodology.
The TEI methodology
helps companies
demonstrate, justify,
and realize the
tangible value of IT
initiatives to both
senior management
and other key
business
stakeholders.
DISCLOSURES
Readers should be aware of the following:
This study is commissioned by ADP and delivered by Forrester Consulting. It is
not meant to be used as a competitive analysis.
Forrester makes no assumptions as to the potential ROI that other
organizations will receive. Forrester strongly advises that readers use their own
estimates within the framework provided in the report to determine the
appropriateness of an investment in ADP Workforce Now.
ADP reviewed and provided feedback to Forrester, but Forrester maintains
editorial control over the study and its findings and does not accept changes to
the study that contradict Forrester’s findings or obscure the meaning of the
study.
ADP provided the customer names for the interviews but did not participate in
the interviews.
5 | The Total Economic Impact™ Of ADP Workforce Now
The Workforce Now Customer Journey
BEFORE AND AFTER THE WORKFORCE NOW INVESTMENT
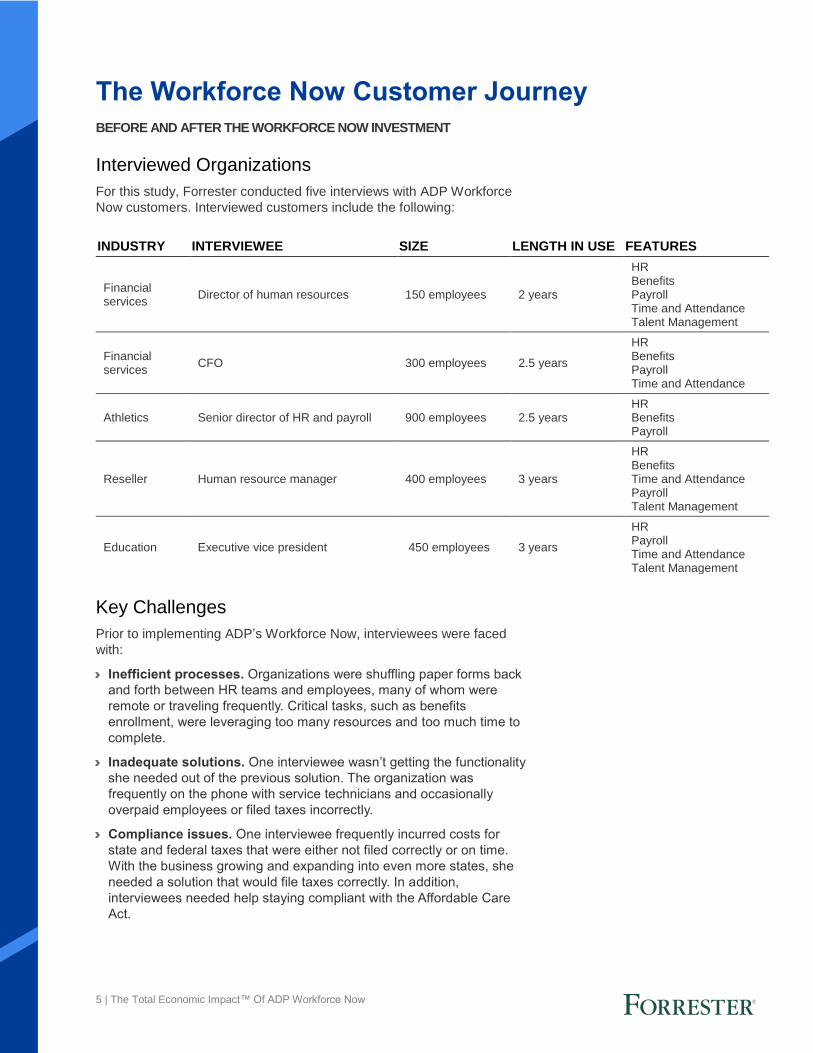
Interviewed Organizations
For this study, Forrester conducted five interviews with ADP Workforce
Now customers. Interviewed customers include the following:
Key Challenges
Prior to implementing ADP’s Workforce Now, interviewees were faced
with:
› Inefficient processes. Organizations were shuffling paper forms back
and forth between HR teams and employees, many of whom were
remote or traveling frequently. Critical tasks, such as benefits
enrollment, were leveraging too many resources and too much time to
complete.
› Inadequate solutions. One interviewee wasn’t getting the functionality
she needed out of the previous solution. The organization was
frequently on the phone with service technicians and occasionally
overpaid employees or filed taxes incorrectly.
› Compliance issues. One interviewee frequently incurred costs for
state and federal taxes that were either not filed correctly or on time.
With the business growing and expanding into even more states, she
needed a solution that would file taxes correctly. In addition,
interviewees needed help staying compliant with the Affordable Care
Act.
INDUSTRY INTERVIEWEE SIZE LENGTH IN USE FEATURES
Financial services
Director of human resources 150 employees 2 years
HR Benefits Payroll Time and Attendance Talent Management
Financial services
CFO 300 employees 2.5 years
HR Benefits Payroll Time and Attendance
Athletics Senior director of HR and payroll 900 employees 2.5 years HR Benefits Payroll
Reseller Human resource manager 400 employees 3 years
HR Benefits Time and Attendance Payroll Talent Management
Education Executive vice president 450 employees 3 years
HR Payroll Time and Attendance Talent Management
6 | The Total Economic Impact™ Of ADP Workforce Now
Key Results
After an extensive search, interviewees chose to invest in Workforce
Now based on peer recommendations and functionality. Their adoptions
of the solution delivered:
› The digitization of key processes. Interviewees shifted several
manual processes to digital self-service processes, including payroll
and benefits enrollment. Not only did this remove bulky paper forms,
but it also ensured tasks were completed faster and with greater
accuracy.
› A holistic system of record. Workforce Now consolidated several
different systems onto one database, allowing HR managers to access
all employee records and pull comprehensive reports from the same
place.
› HR manager and end user efficiencies. With the removal of slow,
paper-based processes and the ensuing errors, HR managers
eliminated hours of administrative work.They could funnel this time
back into strategic initiatives, such as budgeting.
› Tax expertise and management. Interviewees welcomed Workforce
Now’s built-in knowledge of US state and federal tax regulations and
its ability to prepare and file employee taxes.
Composite Organization Based on the interviews, Forrester constructed a TEI framework, a
composite company, and an associated ROI analysis that illustrates the
areas financially affected. The composite organization is representative
of the five companies that Forrester interviewed and is used to present
the aggregate financial analysis in the next section. The composite
organization that Forrester synthesized from the customer interviews has
the following characteristics:
The regional business is headquartered in one US state but has several
local offices across state lines. It employees 400 people, many of whom
travel frequently and four of whom comprise the HR department. The
average fully-loaded salary for the HR team is $120,000.
The organization is growing at a rate of 10% each year and sees about
15% attrition each year. Prior to implementing Workforce Now, the
composite organization leveraged another HCM software solution that
provided some payroll automation, but the company still conducted many
HR-related tasks by hand.
The organization implemented HR, Benefits, Payroll, and Time and
Attendance for Year 1 and then expanded with Talent Management in
Year 2. As part of its Talent Management expansion, it started using
recruitment features in Year 2 and performance management features in
Year 3.
Key assumptions
Regional organization
Offices in several states
400 employees
10% growth rate
15% attrition rate
“We are not just buying
software from ADP; we’re
buying competence and
experience and expertise
backing up the software.”
Director of human resources,
financial services firm

7 | The Total Economic Impact™ Of ADP Workforce Now
Financial Analysis
QUANTIFIED BENEFIT AND COST DATA AS APPLIED TO THE COMPOSITE
Administration Time Savings
Prior to implementing Workforce Now, the HR team completed all HR-
related administrative tasks by hand. For example, when an employee
needed to change an address, he emailed HR. An HR staff member
then had to update that address with each carrier and within the
company’s own system of record. The process was time-consuming
and prone to errors.
› Interviewed organizations eliminated these timely processes by
leveraging Workforce Now’s HR Administration module and its
comprehensive system of record. The module allowed them to offer
employees self-service tools, eliminating time required from HR staff.
› Interviewees cited significant time savings, ranging from 20 minutes
per employee per year to an hour for each requested change (such
as a beneficiary or address).
For the composite organization, Forrester assumes that:
› The HR team saved 150 hours in Year 1 as employees adjusted to
using the self-service tool. This number increased to 225 hours in
Year 2 and 350 in Year 3 as more employees adopted the tools and
the company grew.
The table above shows the total of all benefits across the areas listed below, as well as present values (PVs) discounted at 10%. Over three years, the composite organization expects risk-adjusted total benefits to be a PV of more than $797,000.
Automating HR
management freed up an
average of 300 hours per
year.
Total Benefits
REF. BENEFIT YEAR 1 YEAR 2 YEAR 3 TOTAL PRESENT VALUE
Atr HR administration time savings
$7,788 $11,683 $18,173 $37,644 $30,389
Btr Payroll and Time and Attendance time savings
$15,577 $18,173 $20,769 $54,519 $44,784
Ctr Benefit administration time savings
$30,210 $33,231 $36,554 $99,994 $82,390
Dtr Recruitment time savings $0 $79,962 $82,558 $162,519 $128,111
Etr Performance management time savings
$0 $0 $18,822 $18,822 $14,141
Ftr Printing and shipping cost savings
$5,525 $6,800 $7,225 $19,550 $16,071
Gtr End user time savings $62,524 $68,776 $75,654 $206,955 $170,520
Htr Reduced tax and compliance penalties
$93,500 $93,500 $93,500 $280,500 $232,521
Itr Prior solution cost savings $31,500 $31,500 $31,500 $94,500 $78,336
Total benefits (risk-adjusted) $246,624 $343,625 $384,755 $975,004 $797,263
8 | The Total Economic Impact™ Of ADP Workforce Now
An organization’s ability to achieve these benefits will vary based on:
› Whether its previous HCM software solution offered digital features
for HR admin tasks.
› Employee adoption of the self-service functionality.
› The average fully loaded salaries of its HR staff.
To account for these risks, Forrester adjusted this benefit downward
by 10%, yielding a three-year risk-adjusted total PV of $30,389. See
appendices for calculation tables.
Payroll And Time And Attendance Time Savings
The organization’s previous HCM solution offered some payroll
functionality, but many components were manual, and the system
lacked checks and balances, which led to frequent mistakes. When the
company migrated off that solution and onto Workforce Now, HR
managers gained a centralized processing center for payroll that
managed time off, delivered paychecks digitally, and, when integrated
with Time and Attendance, allowed for digitized time cards.
› Interviewees cited time savings of 15% to 20% per year, which
equates to about 400 hours or 52 working days. This estimate
includes moving off batch entries and eliminating timely errors. A
senior director of HR and payroll also noted that payroll used to take
6 hours per week but now requires only 10 minutes.
› The human resources manager from a reseller estimated that she
saved 78 days per year between payroll and time cards.
For the composite organization, Forrester assumes that:
› It saved an average of 300 hours per year.
An organization’s ability to achieve these benefits will vary based on:
› The payroll features offered in its previous HCM solution.
› The average fully loaded salaries of its HR staff.
To account for these risks, Forrester adjusted this benefit downward by
10%, yielding a three-year risk-adjusted total PV of $44,784. See
appendices for calculation tables.
Benefit Administration Time Savings
Prior to implementing Workforce Now, interviewees managed paper-
based benefit enrollment, both for new hire enrollment and annual open
enrollment for existing employees. With offices in multiple locations and
employees traveling for business, this meant lengthy forms shipped
through the mail and extensive wait periods. As with any manual
process, there was plenty of room for data entry errors. For the HR
managers, benefits enrollment took hours each year to plan and execute.
Workforce Now allowed interviewees to completely digitize the process.
Employees logged into a portal to add or change selections, and data
was passed to the right systems and carriers. Interviewees cited the
following time savings associated with the improvement:
Impact risk is the risk that the business or technology needs of the organization may not be met by the investment, resulting in lower overall total benefits. The greater the uncertainty, the wider the potential range of outcomes for benefit estimates.
Workforce Now managed
the entire payroll process,
avoiding an additional 300
hours of effort each year.

9 | The Total Economic Impact™ Of ADP Workforce Now
› The director of human resources at a financial services organization,
claiming benefit administration was “the single biggest benefit,” saw an
hour savings for each employee, both new hire and open enrollment.
› Interviewees noted that open enrollment periods prior to ADP were
often three to five weeks long, allowing ample time to mail the forms to
remote employees and wait for traveling employees to have time to get
home, complete them, and return them. With Workforce Now and the
ability to access and complete forms digitally, interviewees reduced
this period to 10 to 14 days.
› In addition to reducing the length of open enrollment, interviewees
estimated that they saved an hour per employee now that they don’t
have to enter each form by hand.
› Workforce Now’s benefits administration feature also simplifies new
hire enrollment, eliminating lengthy forms and manual entry processes
for each new hire, saving 3 hours per new employee.
For the composite organization, Forrester assumes that:
› HR administrators save 1 hour per existing employee and 3 hours per
new employee on benefits enrollment.
› The composite organization started with 400 employees and grew at a
rate of 10% each year.
› Attrition is 15%, with each position being backfilled.
An organization’s ability to achieve these benefits will vary based on:
› The current effort required for its new hire and open enrollment
processes.
› End user (employee) adoption of the new processes.
› The average fully loaded salaries of its HR staff.
To account for these risks, Forrester adjusted this benefit downward by
10%, yielding a three-year risk-adjusted total PV of $82,390. See
appendices for calculation tables.
Recruitment Time Savings
The recruitment feature within Talent Management module allowed
interviewees to digitize their efforts to fill open jobs. Previously HR
managers would post jobs and receive resumes, then print them and
share them with hiring managers. Not only was it time-consuming, but
resumes would get lost, risking the loss of highly qualified candidates.
Interviewees shared a variety of estimates for the time savings. The
director of human resources at a 150-person financial services firm said
it saved 5 hours per week, while the human resource manager at a 400-
person reseller said she’d have to hire a fulltime talent management
associate. Both said hiring managers save 4 to 5 hours per open req.
For the composite organization, Forrester assumes that:
› The HR team saved 20 hours per week.
› Hiring managers saved 4 hours for each open position.
› The organization grew at 10% each year, opening 40 roles in Year 2
and 44 roles in Year 3 from growth.
› The organization saw 15% attrition and backfilled each role.
The benefits
administration system
removed an average of
over 600 hours from the
new hire and open
enrollment processes
each year.
HR and hiring managers
filled positions more
quickly and with
reduced effort by adding
automated reviews and
sharing of resumes.

10 | The Total Economic Impact™ Of ADP Workforce Now
› The average fully loaded salary for the hiring managers was $150,000.
› Benefits began in Year 2.
An organization’s ability to achieve these benefits will vary based on:
› The number of open position it fills each year.
› The efficiency of its hiring process prior to implementing Workforce
Now.
› The average fully loaded salaries of its management and HR teams.
To account for these risks, Forrester adjusted this benefit downward by
10%, yielding a three-year risk-adjusted total PV of $128,111. See
appendices for calculation tables.
Performance Management Time Savings
Interviewees who used the performance management features within the
Talent Management module brought standardization and efficiency to
their annual performance review processes. Previously, managers
drafted goals, printed hard copies, reviewed them with HR, edited them,
shared them with employees, edited them again, printed them again, and
finally gave them back to HR to file for next year, possibly with a few
more time-consuming rounds of edits in between. It was an arduous
process that left goals sitting away in a cabinet for the year.
Workforce Now removed the back-and-forth with paper, eliminating
hours from the process. The CFO and director of HR at an education firm
that employs 50 full-time employees said his HR team saved 10 hours
per year and his hiring managers saved 30 minutes for each direct
report.
For the composite organization, Forrester assumes that:
› The HR team saved 60 hours per year.
› The hiring managers saved 30 minutes per employee.
› There are 484 employees in Year 3.
› The average fully loaded salary for the hiring managers was $150,000.
› Benefits began in Year 3.
An organization’s ability to achieve these benefits will vary based on:
› The efficiency of the performance review process prior to Workforce
Now.
› Manager adoption of the new functionality.
› The size of the organization.
› The average fully loaded salaries for HR and the management team.
To account for these risks, Forrester adjusted this benefit downward by
10%, yielding a three-year risk-adjusted total PV of $14,141. See
appendices for calculation tables.
The performance
management feature
within Talent
Management
standardized and
digitized annual
performance reviews,
saving close to 300
hours between HR and
hiring managers.

11 | The Total Economic Impact™ Of ADP Workforce Now
21%
three-year benefit PV
$170,520
Printing And Shipping Cost Savings
Eliminating manual processes removed paper forms from several
processes, hiring benefits administration, payroll, recruiting, and
performance management. Interviewees shared a variety of estimates,
up to $8,000 per year for payroll and benefits.
For the composite organization, Forrester assumes:
› It saved $6,000 in Year 1 when using just Payroll and Benefits.
› It saved $8,000 in Year 2 when it eliminated the paper associated with
Talent Management’s recruiting features and $8,500 in Year 3 when it
incorporated Talent Management’s performance management
features.
While not experienced in years 1 through 3, the composite organization can expect to save on storage costs in the future.
An organization’s ability to achieve these benefits will vary based on:
› The amount of paper it required for its previous processes.
› How many forms were shipped to employees’ homes.
› Its adoption of Workforce Now modules.
› Its size.
To account for these risks, Forrester adjusted this benefit downward by
15%, yielding a three-year risk-adjusted total PV of $16,071. See
appendices for calculation tables.
End User Time Savings
The digitization of key HR processes also benefited employees.
Interviewees noted that:
› Employees could now use self-service tools to look up paid time off
(PTO) balances, change addresses, change deductions, and more,
saving between 15 minutes and an hour per employee each year.
› Employees no longer had to complete lengthy paper benefit forms
during new hire and open enrollment, saving an average of an hour
per employee per year.
› Employees could review paystubs and/or clock in and out digitally,
saving up to 30 minutes per month.
For the composite organization, Forrester assumes that:
› Each employee saved 15 minutes per year on HR admin tasks.
› Each employee saved 3 hours per year between payroll and time and
attendance.
› Each employee saved an hour a year on benefits enrollment.
› The average salary for the entire employee base is $90,000.
An organization’s ability to achieve these benefits will vary based on:
› The amount of time employees dedicated to each process prior to
Workforce Now.
› The success of change management efforts to change employee
behavior and drive adoption.
By moving off hardcopy
benefit forms and
payroll, organizations
saved over $6,500 each
year in printing and
shipping costs.
End user time savings: 21% of total benefits
12 | The Total Economic Impact™ Of ADP Workforce Now
› The modules implemented.
› The average fully loaded salary of employees.
To account for these risks, Forrester adjusted this benefit downward by
15%, yielding a three-year risk-adjusted total PV of $170,520. See
appendices for calculation tables.
Reduced Tax And Compliance Penalties
Prior to implementing Workforce Now, several interviewees struggled to
file state taxes correctly, suffering steep fines. The senior director of HR
and payroll at an athletics organization noted that, with her previous
payroll software, her firm often received notices from the state and
federal government that they had not paid the correct amount for
employees and that they had not filed on time. These errors were costly
to correct and, for the HR managers, impossible to avoid without hiring
someone with tax expertise.
With the switch to Workforce Now, these organizations gained the
expertise built into the software. Taxes were now filed in the right states
at the right time with the correct amounts paid.
For the composite organization, Forrester assumes that:
› It saved $10,000 each year in late fees, incorrect payments, and effort
to fix errors.
› It avoided incremental billing with their CPA to administer taxes, saving
$100,000 per year.
An organization’s ability to achieve these benefits will vary based on:
› Its size.
› The number of states in which it operates.
› Whether or not it has tax expertise in house.
› The ability of its existing solution to manage tax filings correctly.
To account for these risks, Forrester adjusted this benefit downward by
15%, yielding a three-year risk-adjusted total PV of $232,531. See
appendices for calculation tables.
Prior Solution Cost Savings
When organizations began using Workforce Now, they stopped using a
previous solution and therefore stopped paying for it. Interviewees
estimated the fees for that solution to be approximately one-third of the
Workforce Now fees.
For the composite organization, that equates to $35,000 per year.
Readers are encouraged to consider the costs they are paying for their
current solution.
To account for some variance, Forrester adjusted this benefit downward
by 10%, yielding a three-year risk-adjusted total PV of $78,336. See
appendices for calculation tables.
Organizations reduced
errors in tax filings and
associated fines with
Workforce Now.
13 | The Total Economic Impact™ Of ADP Workforce Now
Enhanced Talent Management The digitization of the recruitment and performance management
processes drove efficiencies, as the time savings outlined above show.
However, these efficiencies also led to faster hiring and more focused
goal setting, which allowed the interviewed organizations to fill key
positions faster with more qualified candidates and focus employees on
company goals and personal growth. When discussing recruiting, a
director of human resources noted, “Having a shorter time to hire helps
us get the qualified candidates we want and need, before they go
somewhere else.”
Speaking to performance management, a CFO and director of HR
remarked: “More people are doing self-appraisals. It’s allowing us to
move to a goal-oriented organization that measures and tracks
performance.” This aligns with a current trend in employee performance
that Forrester has identified in its HR technology research.i Modern
performance management is moving from periodic to continuous,
enabling more frequent feedback and better tracking of progress
against goals.
The sooner candidates start working, the more qualified they are, the
more focused they are, and the more value they deliver to the business.
Improved Employee Satisfaction The elimination of manual tasks for HR admin processes and the
ensuing time savings removed hassle from employees in their day-to-day
and, in turn, changed their perception of the HR team. Feeling better
supported and reducing wait time and errors improved their satisfaction
with HR and, as a result, the organizations themselves. One interviewee
said: “Taking full advantage of the technology to make my employees’
lives easier has greatly improved the customer service that HR is able to
deliver to our employees. They no longer see emails from HR and think,
‘This is going to create a lot of work for me.’”
Insights And Analytics Workforce Now’s system of record and analytics feature delivered
insights into benefits usage, labor costs, compensation, and attrition,
which interviewees used to make strategic business decisions.
One interviewee used the data to analyze the profitability of several
different product lines. He found some to be profitable while others
operated at a loss. For example, in 2015 one line of business was
operating at a $26,000 loss. After his product-level analysis with
Workforce Now insights, his organization dropped a product from the
business. They lost nearly half their revenue but turned that $26,000 loss
into a $70,000 gain – nearly a $100,000 improvement.
With Workforce Now,
Organizations delivered
value to the business
faster and more effectively
by hiring the right
candidates sooner and
focusing them on
company goals and
personal development.
14 | The Total Economic Impact™ Of ADP Workforce Now
Flexibility The value of flexibility is clearly unique to each customer, and the
measure of its value varies from organization to organization. There
are multiple scenarios in which a customer might choose to implement
Workforce Now and later realize additional uses and business
opportunities, including:
› Bandwidth to focus on strategic initiatives. With HR admin,
manager, and director time freed up from manual processes, they
have more time to focus on value-add projects for the business,
such as culture change, employee engagement, wellness, and
leadership.
› Access to benchmarking. Interviewees expressed interest in
implementing and using ADP’s benchmarking feature. They noted it
would provide key insights for strategic planning.
Flexibility would also be quantified when evaluated as part of a specific
project (described in more detail in Appendix A).
Flexibility, as defined by TEI, represents an investment in additional capacity or capability that could be turned into business benefit for a future additional investment. This provides an organization with the "right" or the ability to engage in future initiatives but not the obligation to do so.

15 | The Total Economic Impact™ Of ADP Workforce Now
Costs
Technology Fees
Fees to ADP for Workforce Now are based on the number of
employees in a company’s HR database and the number of modules
installed. The composite organization started with HR, Payroll,
Benefits, and Time and Attendance for 400 employees. In Year 2, it
added Talent Management and grew its employee base to 440 people.
By Year 3, its employee count was up to 484.
The model assumes that it paid $100,000 in Year 1, $120,000 in Year
2, and $130,000 in Year 3.
The fees will vary based on the size of the organization and the modules
installed. ADP provided realistic quotes for this study, so the costs have
not been adjusted for risk.
The three-year total PV is $287,754. See appendices for calculation
tables.
Implementation And Customization
To take advantage of the Workforce Now solution, interviewees had to
partner with ADP to install the software and then spend time customizing
the processes to fit their business.
› Implementation required installing the software, cleaning up data,
uploading data, and integrating with other systems. Interviewees noted
that this process took about a month and required nearly full-time
support from one or two employees.
› Customization, defined as setting up payroll, new hire enrollment, open
enrollment, HR admin, etc., required several additional months and
support from a part-time resource. Interviewees estimated that
customization could take anywhere from three to nine months.
› Interviewees had to pay for carrier connections, either with custom built
APIs or in annual fees. These fees ranged from $500 a month to
$20,000 in upfront fees.
For the composite organization, Forrester assumes that:
› It installed the HR, Payroll, and Benefits modules prior to launch (in
Year 0). One and half full-time equivalents (FTEs) were dedicated to
the four-week task.
Total Costs
The table above shows the total of all costs across the areas listed below, as well as present values (PVs) discounted at 10%. Over three years, the composite organization expects risk-adjusted total costs to be a PV of more than $440,000.
Five months
Total implementation
and customization time
REF. COST INITIAL YEAR 1 YEAR 2 YEAR 3 TOTAL PRESENT VALUE
Jtr Technology fees $0 $100,000 $120,000 $130,000 $350,000 $287,754
Ktr Implementation and customization
$65,904 $12,738 $2,654 $0 $81,296 $79,678
Ltr Training $20,112 $11,500 $10,805 $2,499 $44,916 $41,374
Mtr Ongoing use $0 $12,600 $12,600 $12,600 $37,800 $31,334
Total costs (risk-adjusted)
$86,015 $136,838 $146,059 $145,099 $514,012 $440,139
16 | The Total Economic Impact™ Of ADP Workforce Now
› Also in Year 0, it spent 14 weeks with one resource dedicating half its
time to customization.
› At the end of Year 1, when it added Talent Management in preparation
for a Year 2 launch, the implementation required one FTE for two
weeks.
› Customization for the recruitment features took place immediately after
the implementation of Talent Management and required half an FTE for
three weeks.
› At the end of Year 2, it customized the Performance Management
features (which had been installed the previous year as part of the
Talent Management Module), which required half an FTE for two
weeks.
› It paid $10,000 to ADP upfront for the initial implementation and $3,000
in Year 1 to add Talent Management.
› It spent $15,000 upfront to build out API connections with its carriers.
These costs will vary based on an organization’s:
› Size.
› Use of different modules.
› Requirements for carrier connections.
› Experience of HR resources to support implementation and
customization.
› Average fully loaded salaries.
To account for these risks, Forrester adjusted this cost upward by 15%,
yielding a three-year risk-adjusted total PV of $79,678. See appendices
for calculation tables.
Training
Interviews often cited the importance of training, stating that HR staff and
employees had to know how to use the solution to extract the expected
benefit from it. Most interviewees encouraged their HR staff to participate
in online courses offered by ADP and delivered training to their
managers and employees to encourage adoption and proper use of self-
service tools.
For the composite organization, Forrester assumes that:
› The four HR resources each spent a day in training in years 1 and 2.
In Year 3, two resources each spent 2 hours in training.
› Managers each spent 2 hours in training in Year 1, preparing to use
the recruiting module, and 2 hours in Year 2, preparing to use the
performance management module. There were 66 managers in Year 1
and 73 managers in Year 2, with an average fully loaded salary of
$150,000.
› Existing employees spent an hour in the upfront period learning how to
use the HR, Benefit, and Payroll self-service tools. New hires spent 30
minutes of their new hire training on the self-service tools. The average
fully loaded salary for all employees is $90,000.
These costs will vary based on an organization’s:
Implementation risk is the risk that a proposed investment may deviate from the original or expected requirements, resulting in higher costs than anticipated. The greater the uncertainty, the wider the potential range of outcomes for cost estimates.
HR admins spend
about a day each year
learning how to use
Workforce Now.
17 | The Total Economic Impact™ Of ADP Workforce Now
› Size.
› Use of the different modules.
› Average fully loaded salaries.
To account for these risks, Forrester adjusted this cost upward by 5%,
yielding a three-year risk-adjusted total PV of $41,374. See appendices
for calculation tables.
Ongoing Management
To ensure the solution continued to function properly and deliver the
expected outcomes, interviewees dedicated part of a resource’s time to
managing Workforce Now. That resource’s responsibilities included
managing the system itself, answering end user queries, and running
reports. Interviewees estimated this effort required between 1 and 5
hours per week.
For the composite organization, Forrester assumes a resource dedicated
4 hours per week.
These costs will vary based on an organization’s:
› Size.
› Average fully loaded salaries for HR.
› Employee’s adoption and follow-up support required.
To account for these risks, Forrester adjusted this cost upward by 5%,
yielding a three-year risk-adjusted total PV of $31,334. See appendices
for calculation tables.
One FTE
spent 10% of her time
on ongoing
management of
Workforce Now
18 | The Total Economic Impact™ Of ADP Workforce Now
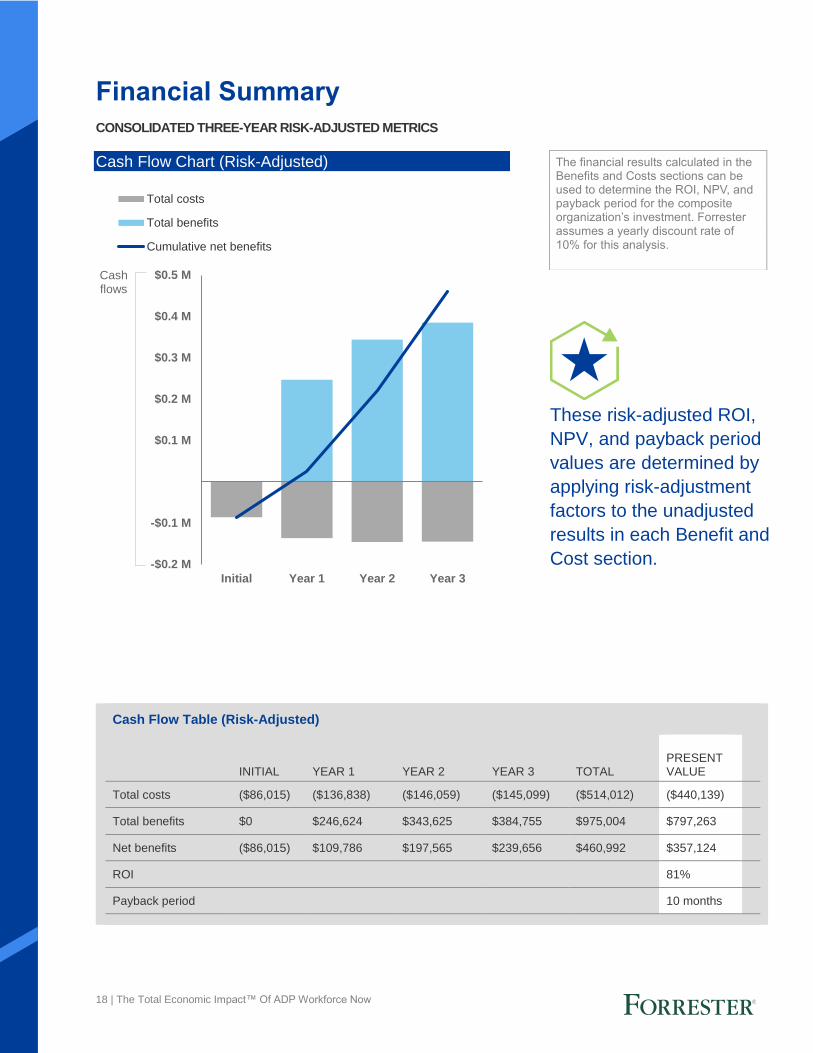
Financial Summary
CONSOLIDATED THREE-YEAR RISK-ADJUSTED METRICS
Cash Flow Chart (Risk-Adjusted)
-$0.2 M
-$0.1 M
$0.1 M
$0.2 M
$0.3 M
$0.4 M
$0.5 M
Initial Year 1 Year 2 Year 3
Cashflows
Total costs
Total benefits
Cumulative net benefits
The financial results calculated in the Benefits and Costs sections can be used to determine the ROI, NPV, and payback period for the composite organization’s investment. Forrester assumes a yearly discount rate of 10% for this analysis.
These risk-adjusted ROI,
NPV, and payback period
values are determined by
applying risk-adjustment
factors to the unadjusted
results in each Benefit and
Cost section.
Cash Flow Table (Risk-Adjusted)
INITIAL YEAR 1 YEAR 2 YEAR 3 TOTAL PRESENT VALUE
Total costs ($86,015) ($136,838) ($146,059) ($145,099) ($514,012) ($440,139)
Total benefits $0 $246,624 $343,625 $384,755 $975,004 $797,263
Net benefits ($86,015) $109,786 $197,565 $239,656 $460,992 $357,124
ROI 81%
Payback period 10 months

19 | The Total Economic Impact™ Of ADP Workforce Now
ADP Workforce Now: Overview
The following information is provided by ADP. Forrester has not validated any claims and does not endorse ADP
or its offerings.
ADP Workforce Now® is a human capital management suite built to help reduce administrative chores and
compliance, allowing its customers to free themselves from the mundane and focus on its people to help drive
business results. ADP gives customers the tools not just to track information, but to help manage the workforce
and make data-driven decisions. These tools include the recruiting, compensation, and talent management tools;
the software and unique data analytics; and the power to shape a workforce matched to business strategies and
needs. As businesses grow, HR managers, finance leaders, and business owners can add the functionality they
need to more effectively manage their workforces.
› Human resources. People are the lifeblood of organizations’ successes. With configurable workflows and
online document storage, HR managers can reduce the time spent with paperwork and increase the time
managing and transforming their people. Self-service functions empower employees and managers alike to be
efficient with their tasks so they can be more productive and collaborative.
› Benefits administration. Administer benefit plans and collect the data required to be compliant with the ACA.
Easy-to-use dashboards keep ACA compliance front and center. Easily create eligibility rules and make online
open enrollment available to employees. Manage benefits budget by easily monitoring billing discrepancies to
help stop premium overages.
› Payroll. Quickly and accurately process payroll. ADP Workforce Now is engineered to help support
compliance obligations and is ready to scale as businesses grow.
› Talent. With a solid recruiting strategy, branded career sites, and intuitive dashboards, organizations can make
hiring decisions in a snap. Create a pay-for-performance culture by aligning employees to goals and tracking
progress. Spot trends, and identify candidates for career growth. Reward high performers with a simplified
merit and bonus process, complete with compensation guidelines to help enforce your policies.
› Time and attendance. Manage labor costs, boost productivity, and simplify compliance by automating
timekeeping, attendance tracking, and scheduling. Fast and convenient online and mobile access improves
visibility, saves time, makes it easier to manage coverage, expedites approvals, and improves timecard and
payroll accuracy.
› Analytics. With Payroll, Human Resources, Benefits, Time, and Talent information in one system,
organizations can gain real insight and make data-driven business decisions. ADP benchmarks lets
organizations see how they compare to similar companies so they can confidently make strategic decisions.

20 | The Total Economic Impact™ Of ADP Workforce Now
Appendix A: Total Economic Impact Total Economic Impact is a methodology developed by Forrester
Research that enhances a company’s technology decision-making
processes and assists vendors in communicating the value proposition
of their products and services to clients. The TEI methodology helps
companies demonstrate, justify, and realize the tangible value of IT
initiatives to both senior management and other key business
stakeholders.
Total Economic Impact Approach
Benefits represent the value delivered to the business by the
product. The TEI methodology places equal weight on the
measure of benefits and the measure of costs, allowing for a
full examination of the effect of the technology on the entire
organization.
Costs consider all expenses necessary to deliver the
proposed value, or benefits, of the product. The cost category
within TEI captures incremental costs over the existing
environment for ongoing costs associated with the solution.
Flexibility represents the strategic value that can be
obtained for some future additional investment building on
top of the initial investment already made. Having the ability
to capture that benefit has a PV that can be estimated.
Risks measure the uncertainty of benefit and cost estimates
given: 1) the likelihood that estimates will meet original
projections and 2) the likelihood that estimates will be
tracked over time. TEI risk factors are based on “triangular
distribution.”
The initial investment column contains costs incurred at “time 0” or at the
beginning of Year 1 that are not discounted. All other cash flows are discounted
using the discount rate at the end of the year. PV calculations are calculated for
each total cost and benefit estimate. NPV calculations in the summary tables are
the sum of the initial investment and the discounted cash flows in each year.
Sums and present value calculations of the Total Benefits, Total Costs, and
Cash Flow tables may not exactly add up, as some rounding may occur.
PRESENT VALUE (PV)
The present or current value of (discounted) cost and benefit estimates given at an interest rate (the discount rate). The PV of costs and benefits feed into the total NPV of cash flows.
NET PRESENT VALUE (NPV)
The present or current value of (discounted) future net cash flows given an interest rate (the discount rate). A positive project NPV normally indicates that the investment should be made, unless other projects have higher NPVs.
RETURN ON INVESTMENT (ROI)
A project’s expected return in percentage terms. ROI is calculated by dividing net benefits (benefits less costs) by costs.
DISCOUNT RATE
The interest rate used in cash flow analysis to take into account the time value of money. Organizations typically use discount rates between 8% and 16%.
PAYBACK PERIOD
The breakeven point for an investment. This is the point in time at which net benefits (benefits minus costs) equal initial investment or cost.
21 | The Total Economic Impact™ Of ADP Workforce Now
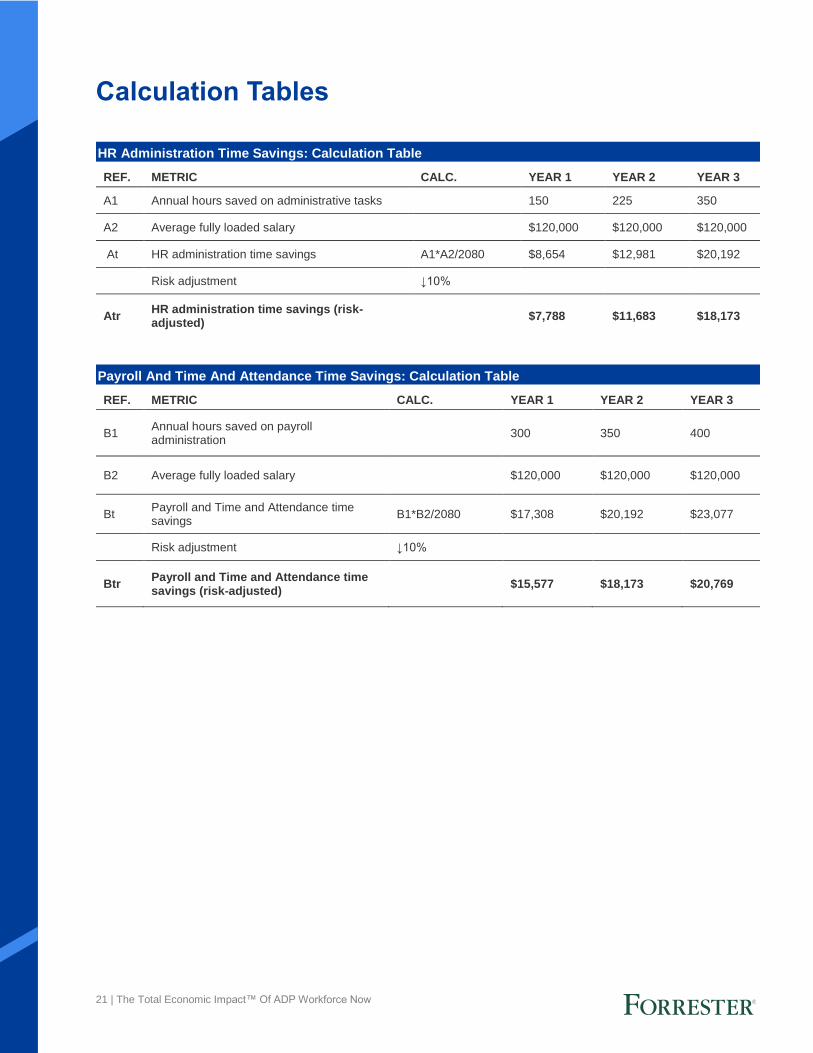
Calculation Tables
HR Administration Time Savings: Calculation Table
REF. METRIC CALC. YEAR 1 YEAR 2 YEAR 3
A1 Annual hours saved on administrative tasks 150 225 350
A2 Average fully loaded salary $120,000 $120,000 $120,000
At HR administration time savings A1*A2/2080 $8,654 $12,981 $20,192
Risk adjustment ↓10%
Atr HR administration time savings (risk-adjusted)
$7,788 $11,683 $18,173
Payroll And Time And Attendance Time Savings: Calculation Table
REF. METRIC CALC. YEAR 1 YEAR 2 YEAR 3
B1 Annual hours saved on payroll administration
300 350 400
B2 Average fully loaded salary $120,000 $120,000 $120,000
Bt Payroll and Time and Attendance time savings
B1*B2/2080 $17,308 $20,192 $23,077
Risk adjustment ↓10%
Btr Payroll and Time and Attendance time savings (risk-adjusted)
$15,577 $18,173 $20,769
22 | The Total Economic Impact™ Of ADP Workforce Now
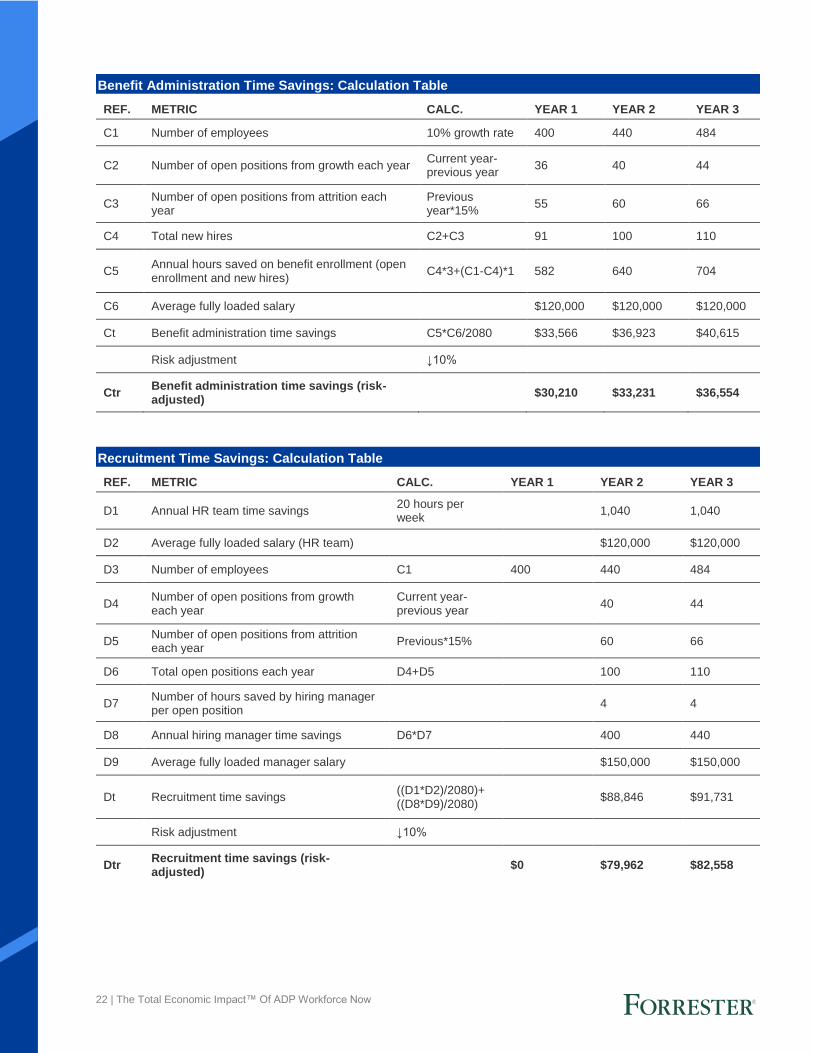
Benefit Administration Time Savings: Calculation Table
REF. METRIC CALC. YEAR 1 YEAR 2 YEAR 3
C1 Number of employees 10% growth rate 400 440 484
C2 Number of open positions from growth each year Current year-previous year
36 40 44
C3 Number of open positions from attrition each year
Previous year*15%
55 60 66
C4 Total new hires C2+C3 91 100 110
C5 Annual hours saved on benefit enrollment (open enrollment and new hires)
C4*3+(C1-C4)*1 582 640 704
C6 Average fully loaded salary $120,000 $120,000 $120,000
Ct Benefit administration time savings C5*C6/2080 $33,566 $36,923 $40,615
Risk adjustment ↓10%
Ctr Benefit administration time savings (risk-adjusted)
$30,210 $33,231 $36,554
Recruitment Time Savings: Calculation Table
REF. METRIC CALC. YEAR 1 YEAR 2 YEAR 3
D1 Annual HR team time savings 20 hours per week
1,040 1,040
D2 Average fully loaded salary (HR team) $120,000 $120,000
D3 Number of employees C1 400 440 484
D4 Number of open positions from growth each year
Current year-previous year
40 44
D5 Number of open positions from attrition each year
Previous*15% 60 66
D6 Total open positions each year D4+D5 100 110
D7 Number of hours saved by hiring manager per open position
4 4
D8 Annual hiring manager time savings D6*D7 400 440
D9 Average fully loaded manager salary $150,000 $150,000
Dt Recruitment time savings ((D1*D2)/2080)+ ((D8*D9)/2080)
$88,846 $91,731
Risk adjustment ↓10%
Dtr Recruitment time savings (risk-adjusted)
$0 $79,962 $82,558
23 | The Total Economic Impact™ Of ADP Workforce Now
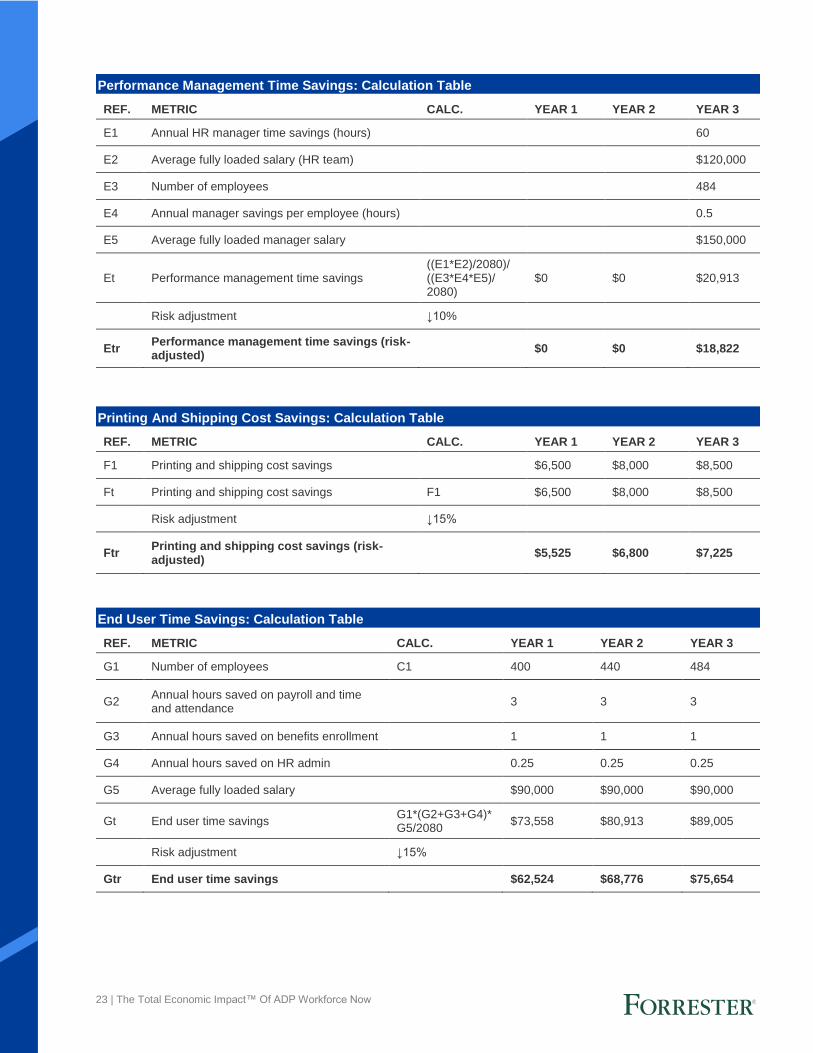
Performance Management Time Savings: Calculation Table
REF. METRIC CALC. YEAR 1 YEAR 2 YEAR 3
E1 Annual HR manager time savings (hours) 60
E2 Average fully loaded salary (HR team) $120,000
E3 Number of employees 484
E4 Annual manager savings per employee (hours) 0.5
E5 Average fully loaded manager salary $150,000
Et Performance management time savings ((E1*E2)/2080)/ ((E3*E4*E5)/ 2080)
$0 $0 $20,913
Risk adjustment ↓10%
Etr Performance management time savings (risk-adjusted)
$0 $0 $18,822
Printing And Shipping Cost Savings: Calculation Table
REF. METRIC CALC. YEAR 1 YEAR 2 YEAR 3
F1 Printing and shipping cost savings $6,500 $8,000 $8,500
Ft Printing and shipping cost savings F1 $6,500 $8,000 $8,500
Risk adjustment ↓15%
Ftr Printing and shipping cost savings (risk-adjusted)
$5,525 $6,800 $7,225
End User Time Savings: Calculation Table
REF. METRIC CALC. YEAR 1 YEAR 2 YEAR 3
G1 Number of employees C1 400 440 484
G2 Annual hours saved on payroll and time and attendance
3 3 3
G3 Annual hours saved on benefits enrollment 1 1 1
G4 Annual hours saved on HR admin 0.25 0.25 0.25
G5 Average fully loaded salary $90,000 $90,000 $90,000
Gt End user time savings G1*(G2+G3+G4)*G5/2080
$73,558 $80,913 $89,005
Risk adjustment ↓15%
Gtr End user time savings $62,524 $68,776 $75,654
24 | The Total Economic Impact™ Of ADP Workforce Now
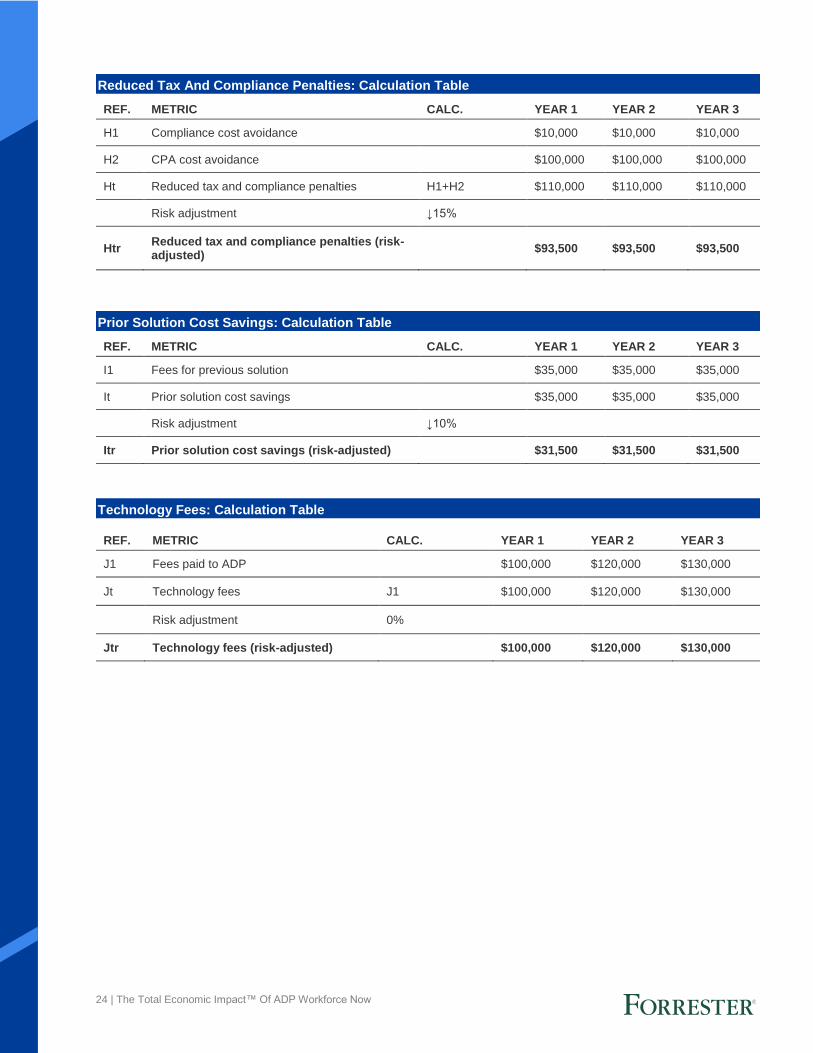
Reduced Tax And Compliance Penalties: Calculation Table
REF. METRIC CALC. YEAR 1 YEAR 2 YEAR 3
H1 Compliance cost avoidance $10,000 $10,000 $10,000
H2 CPA cost avoidance $100,000 $100,000 $100,000
Ht Reduced tax and compliance penalties H1+H2 $110,000 $110,000 $110,000
Risk adjustment ↓15%
Htr Reduced tax and compliance penalties (risk-adjusted)
$93,500 $93,500 $93,500
Prior Solution Cost Savings: Calculation Table
REF. METRIC CALC. YEAR 1 YEAR 2 YEAR 3
I1 Fees for previous solution $35,000 $35,000 $35,000
It Prior solution cost savings $35,000 $35,000 $35,000
Risk adjustment ↓10%
Itr Prior solution cost savings (risk-adjusted) $31,500 $31,500 $31,500
Technology Fees: Calculation Table
REF. METRIC CALC. YEAR 1 YEAR 2 YEAR 3
J1 Fees paid to ADP $100,000 $120,000 $130,000
Jt Technology fees J1 $100,000 $120,000 $130,000
Risk adjustment 0%
Jtr Technology fees (risk-adjusted) $100,000 $120,000 $130,000
25 | The Total Economic Impact™ Of ADP Workforce Now
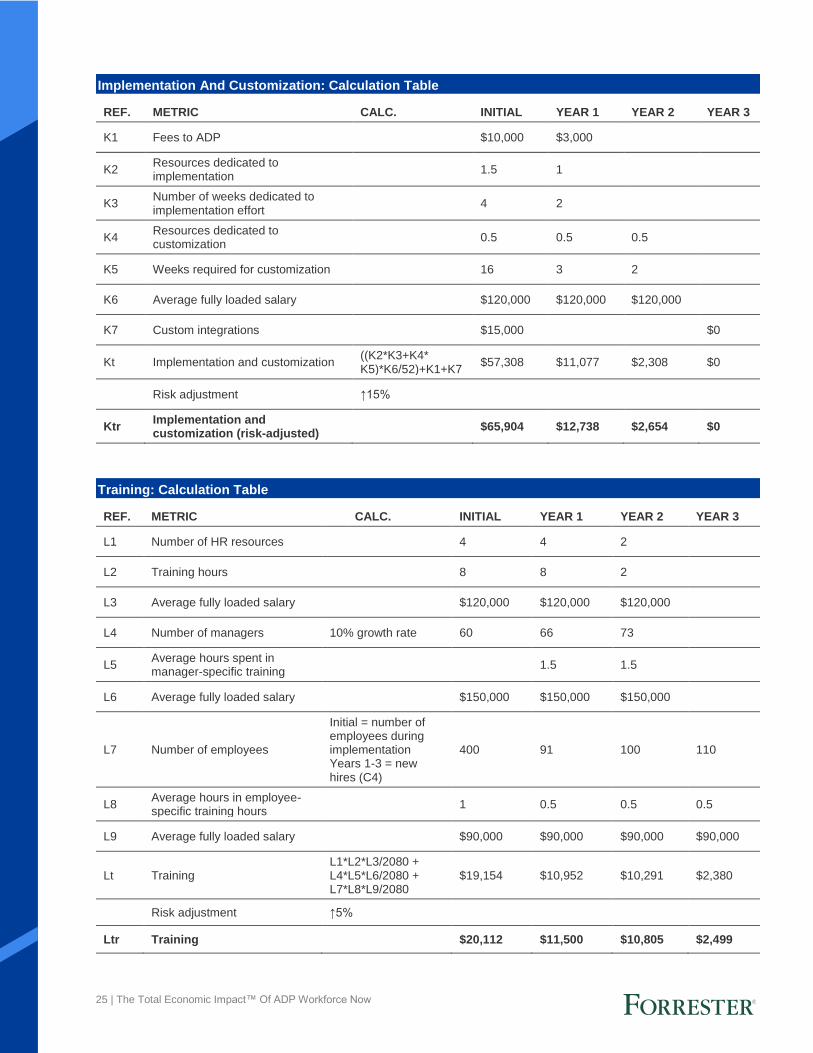
Implementation And Customization: Calculation Table
REF. METRIC CALC. INITIAL YEAR 1 YEAR 2 YEAR 3
K1 Fees to ADP $10,000 $3,000
K2 Resources dedicated to implementation
1.5 1
K3 Number of weeks dedicated to implementation effort
4 2
K4 Resources dedicated to customization
0.5 0.5 0.5
K5 Weeks required for customization 16 3 2
K6 Average fully loaded salary $120,000 $120,000 $120,000
K7 Custom integrations $15,000 $0
Kt Implementation and customization ((K2*K3+K4* K5)*K6/52)+K1+K7
$57,308 $11,077 $2,308 $0
Risk adjustment ↑15%
Ktr Implementation and customization (risk-adjusted)
$65,904 $12,738 $2,654 $0
Training: Calculation Table
REF. METRIC CALC. INITIAL YEAR 1 YEAR 2 YEAR 3
L1 Number of HR resources 4 4 2
L2 Training hours 8 8 2
L3 Average fully loaded salary $120,000 $120,000 $120,000
L4 Number of managers 10% growth rate 60 66 73
L5 Average hours spent in manager-specific training
1.5 1.5
L6 Average fully loaded salary $150,000 $150,000 $150,000
L7 Number of employees
Initial = number of employees during implementation Years 1-3 = new hires (C4)
400 91 100 110
L8 Average hours in employee-specific training hours
1 0.5 0.5 0.5
L9 Average fully loaded salary $90,000 $90,000 $90,000 $90,000
Lt Training L1*L2*L3/2080 + L4*L5*L6/2080 + L7*L8*L9/2080
$19,154 $10,952 $10,291 $2,380
Risk adjustment ↑5%
Ltr Training $20,112 $11,500 $10,805 $2,499
26 | The Total Economic Impact™ Of ADP Workforce Now
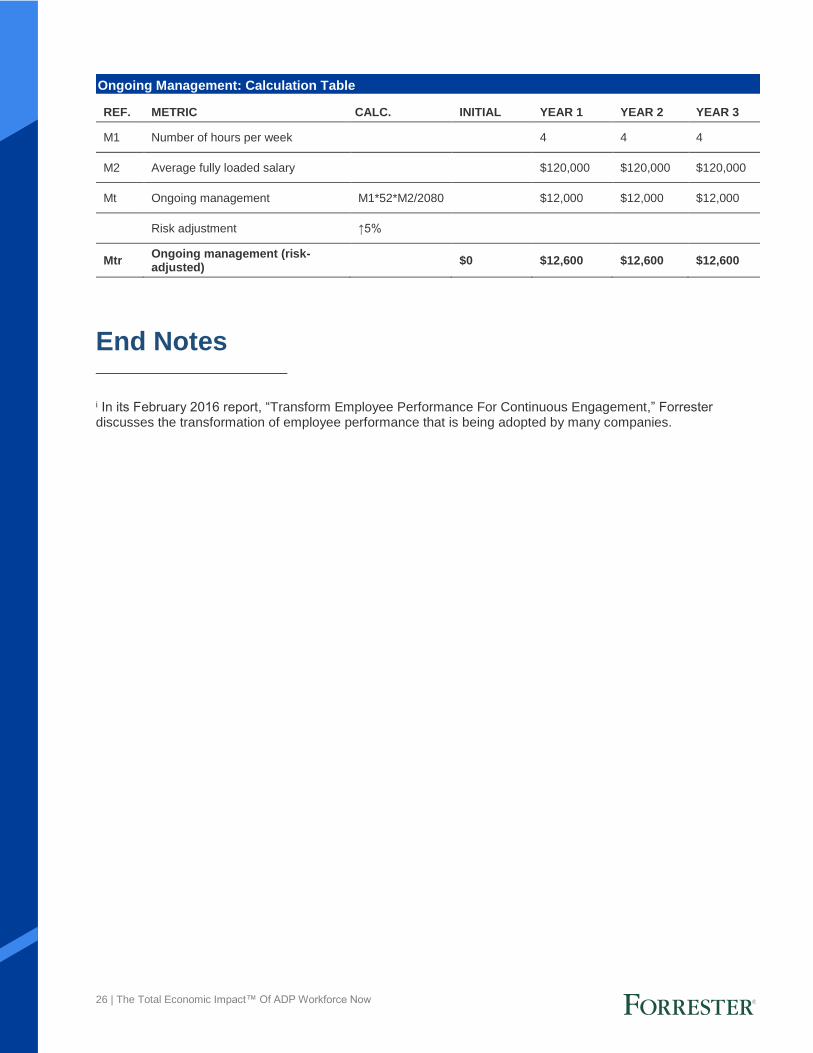
End Notes
i In its February 2016 report, “Transform Employee Performance For Continuous Engagement,” Forrester discusses the transformation of employee performance that is being adopted by many companies.
Ongoing Management: Calculation Table
REF. METRIC CALC. INITIAL YEAR 1 YEAR 2 YEAR 3
M1 Number of hours per week 4 4 4
M2 Average fully loaded salary $120,000 $120,000 $120,000
Mt Ongoing management M1*52*M2/2080 $12,000 $12,000 $12,000
Risk adjustment ↑5%
Mtr Ongoing management (risk-adjusted)
$0 $12,600 $12,600 $12,600