Embed Size (px)
Citation preview
A Forrester Total Economic Impact™
Study Commissioned By Sage
August 2017
The Total Economic Impact™ Of Sage X3 For Manufacturing
Cost Savings And Business Benefits Enabled By Sage X3
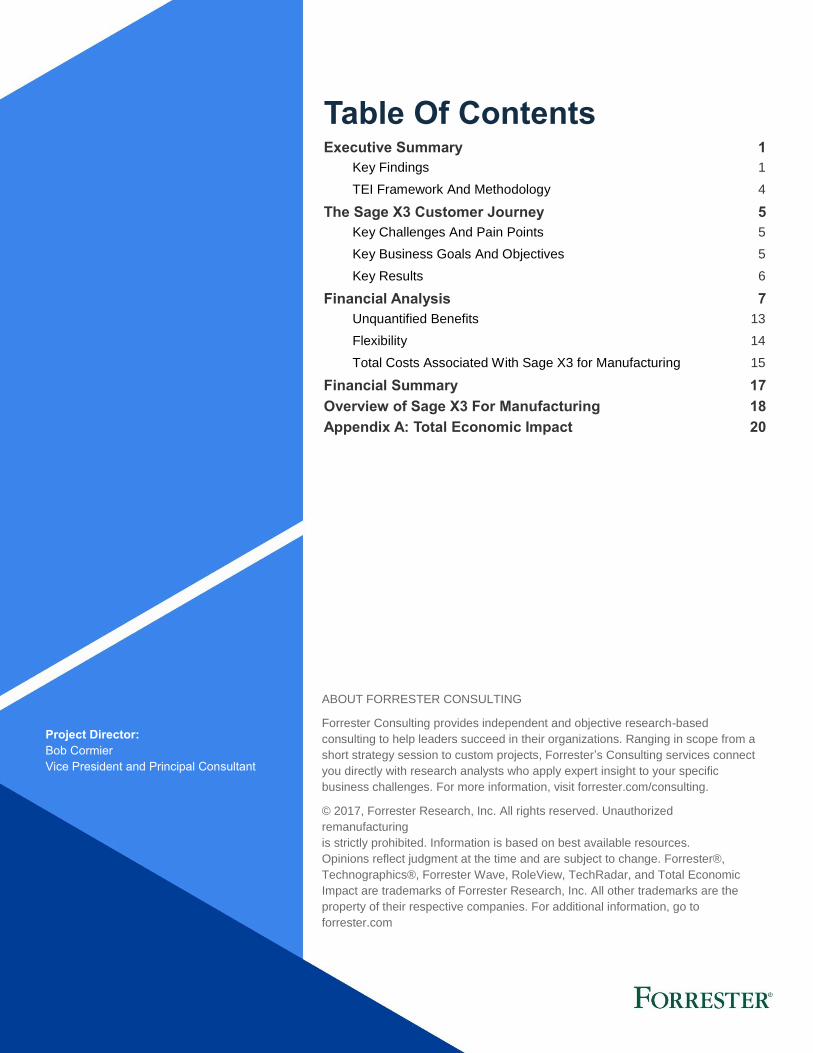
Table Of Contents Executive Summary 1
Key Findings 1
TEI Framework And Methodology 4
The Sage X3 Customer Journey 5
Key Challenges And Pain Points 5
Key Business Goals And Objectives 5
Key Results 6
Financial Analysis 7
Unquantified Benefits 13
Flexibility 14
Total Costs Associated With Sage X3 for Manufacturing 15
Financial Summary 17
Overview of Sage X3 For Manufacturing 18
Appendix A: Total Economic Impact 20
Project Director:
Bob Cormier
Vice President and Principal Consultant
ABOUT FORRESTER CONSULTING
Forrester Consulting provides independent and objective research-based
consulting to help leaders succeed in their organizations. Ranging in scope from a
short strategy session to custom projects, Forrester’s Consulting services connect
you directly with research analysts who apply expert insight to your specific
business challenges. For more information, visit forrester.com/consulting.
© 2017, Forrester Research, Inc. All rights reserved. Unauthorized
remanufacturing
is strictly prohibited. Information is based on best available resources.
Opinions reflect judgment at the time and are subject to change. Forrester®,
Technographics®, Forrester Wave, RoleView, TechRadar, and Total Economic
Impact are trademarks of Forrester Research, Inc. All other trademarks are the
property of their respective companies. For additional information, go to
forrester.com
1 | The Total Economic Impact™ Of Sage X3 For Manufacturing
Executive Summary
Sage provides an enterprise-level business management solution for
manufacturing operations that assists customers with the entire process:
from financial management to supply chain management and production
management. Sage commissioned Forrester Consulting to conduct a Total
Economic Impact™ (TEI) study and objectively examine the potential
return on investment (ROI) enterprises may realize by deploying its Sage
X3 solutions. The purpose of this study is to provide readers and
prospects with a framework to evaluate the potential financial impact of the
Sage X3 solutions on their manufacturing organizations.
To better understand the benefits, costs, and risks associated with this
investment, Forrester conducted in-depth interviews with four Sage X3
manufacturing customers, each with at least three years of experience
using Sage X3. For this TEI study, Forrester has created a composite
Organization to illustrate the quantifiable benefits and costs of investing in
Sage X3 for Manufacturing. Based on characteristics of the interviewed
customers, the Organization is a global, midsize enterprise in the discrete
and process manufacturing industry. It has major operations in North
America, Europe, and Africa, with minor multisite operations globally. It
has been using Sage X3 for three years to enable its business process
activities. For more information, see the section titled: The Composite
Organization.
Key Findings
Quantified benefits. The composite Organization experienced the
following risk-adjusted present value quantified benefits totaling
$1,971,860 (see the Financial Analysis section for more details):
› Financial management — labor savings for reporting: $149,211.
› Purchasing — materials and productivity savings: $355,122.
› Sales management — sales discount savings: $492,397.
› Inventory management — reduced inventory levels: $348,159.
› Customer service — productivity improvements: $125,870.
› Manufacturing management –— production cost reductions: $302,153.
› New features –— production, supply chain, and financial management
productivity savings: $198,948.
Unquantified benefits. The interviewed customers experienced the
following benefits; however, they were not able to quantify these benefits
for this study:
› Interviewed customers reported that the workflow automation and alerts
functionality within Sage X3 encourages users to adhere to policies and
speeds up processes. In the past, an employee would have to chase
somebody down to approve a purchase order. With Sage X3, the
automated workflow alerts notify the appropriate staff, and approvals are
done in a more reasonable amount of time.
Selected Key Metrics
Total headcount saved:
4.6 FTEs
Sales discounts savings:
$198,000 annually
Reduction in inventory levels:
10% Total quantified benefits: $1,971,860 (risk- and PV-adjusted)
2 | The Total Economic Impact™ Of Sage X3 For Manufacturing
› With documentation and office collaboration functionality in Sage X3,
every vendor invoice is scanned into a document management system
and PDFs are uploaded into Sage X3 and attached to the records.
Invoices are now accessible by anyone who needs to see them,
including business units and purchasing, receiving dock, and accounts
payable employees. With Sage X3, employees don’t have to search
physical file cabinets anymore; they just access Sage X3 on their
computers.
Costs. The Organization experienced the following present value costs
totaling $620,870 (see the Financial Analysis section for more details):
› Internal labor to plan and deploy Sage X3: $50,000.
› Incremental hardware, database and operating system license, and
maintenance: $0.* The Organization incurred none of these costs with
the Sage X3 cloud solution.
› Sage X3 fees for professional services and cloud subscription:
$327,794.
› Ongoing internal administrative labor for Sage X3: $330,000.
*Note: For an on-premises deployment of Sage X3, the Organization will
incur an additional $24,000 in hardware, database, and operating system
fees, and additional Sage X3 license fees of $63,000 over three years. In
this on-premise scenario, the present value of costs is calculated to be
$697,094, or an additional $76,224 over three years, with an expected ROI
of 183%.
Forrester’s interviews and subsequent financial analysis found that the
Organization experienced benefits of $1,971,860 over three years versus
costs of $620,870, adding up to a net present value (NPV) of $1,350,990,
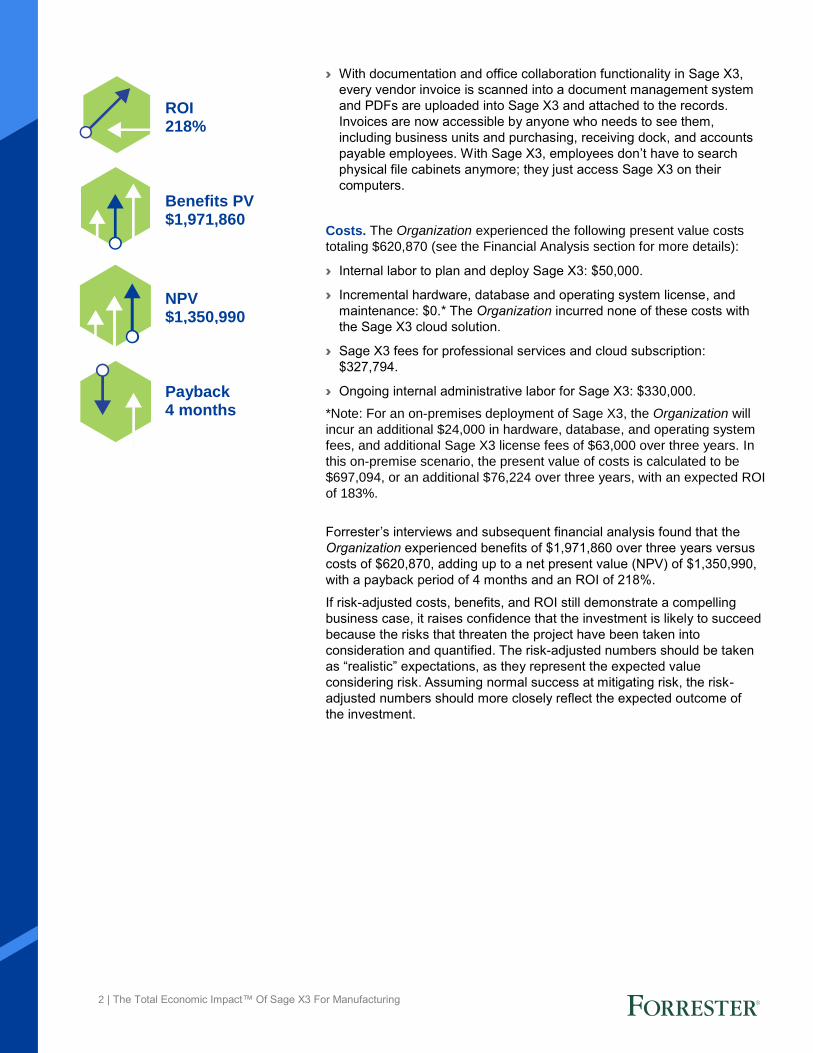
with a payback period of 4 months and an ROI of 218%.
If risk-adjusted costs, benefits, and ROI still demonstrate a compelling
business case, it raises confidence that the investment is likely to succeed
because the risks that threaten the project have been taken into
consideration and quantified. The risk-adjusted numbers should be taken
as “realistic” expectations, as they represent the expected value
considering risk. Assuming normal success at mitigating risk, the risk-
adjusted numbers should more closely reflect the expected outcome of
the investment.
ROI 218%
Benefits PV $1,971,860
NPV $1,350,990
Payback 4 months
3 | The Total Economic Impact™ Of Sage X3 For Manufacturing
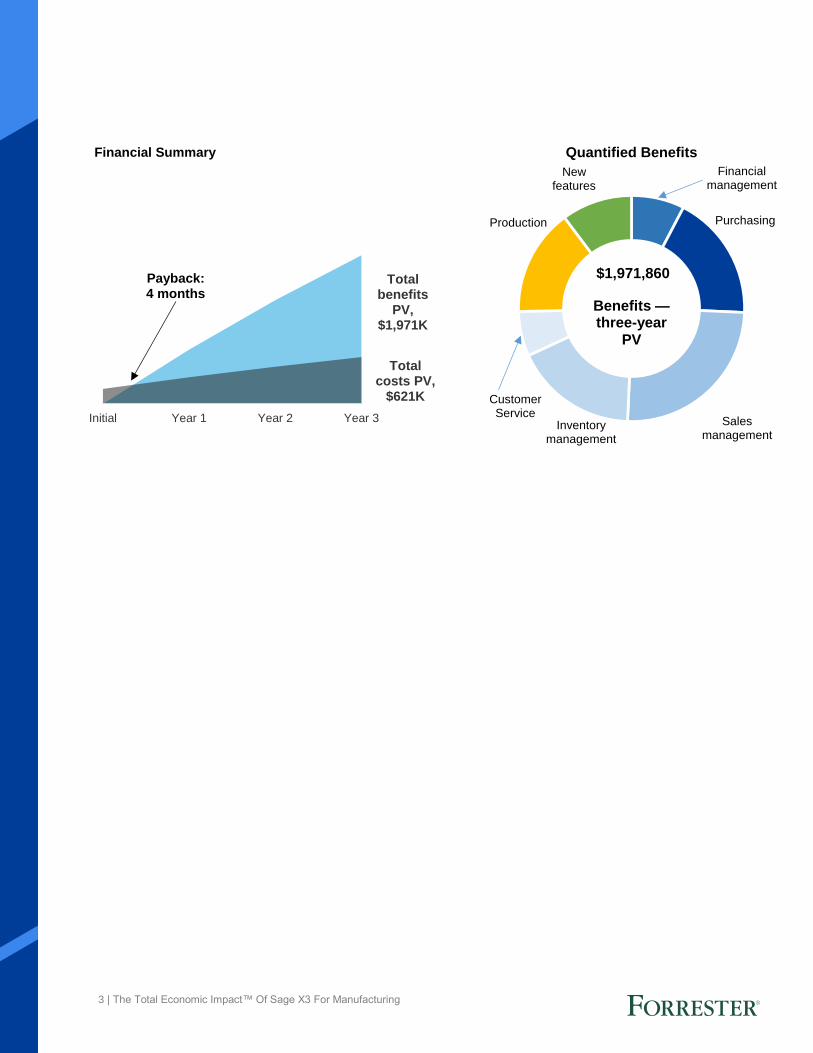
Total benefits
PV, $1,971K
Total costs PV,
$621K
Initial Year 1 Year 2 Year 3
Financial Summary
Payback:4 months
Financial management
Purchasing
Sales management
Inventory management
Customer Service
Production
New features
Quantified Benefits
Benefits —three-year
PV
$1,971,860
4 | The Total Economic Impact™ Of Sage X3 For Manufacturing
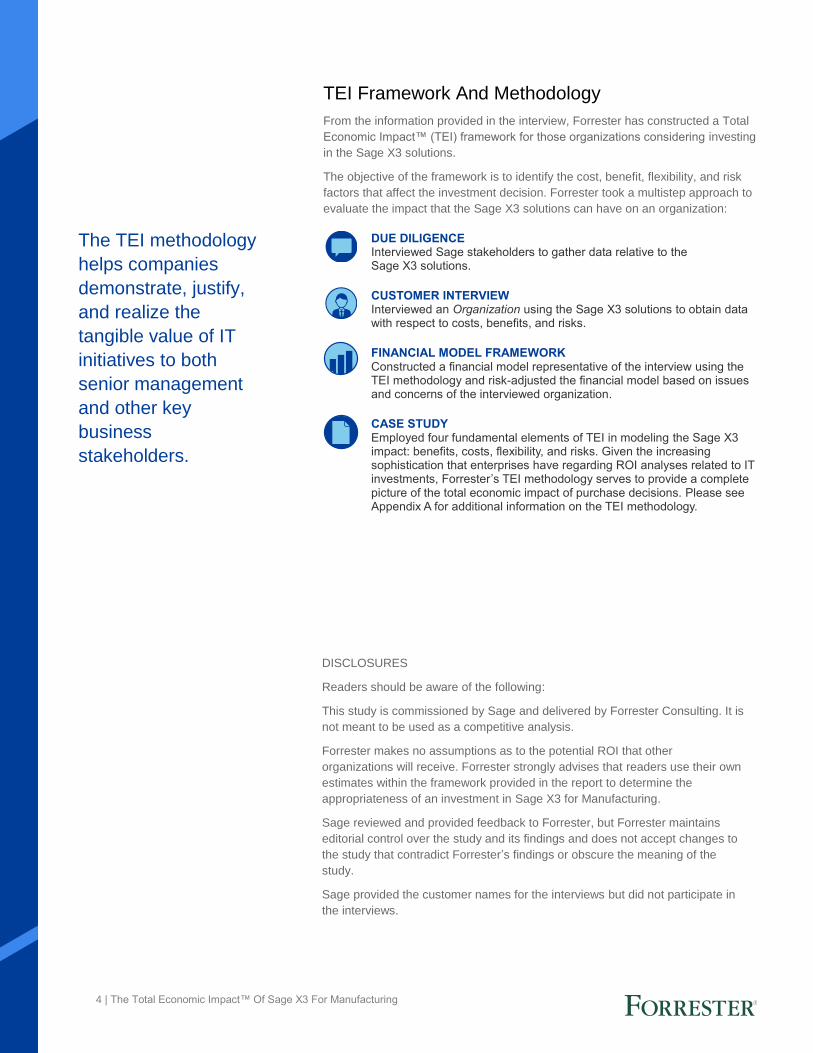
TEI Framework And Methodology
From the information provided in the interview, Forrester has constructed a Total
Economic Impact™ (TEI) framework for those organizations considering investing
in the Sage X3 solutions.
The objective of the framework is to identify the cost, benefit, flexibility, and risk
factors that affect the investment decision. Forrester took a multistep approach to
evaluate the impact that the Sage X3 solutions can have on an organization:
DUE DILIGENCE Interviewed Sage stakeholders to gather data relative to the Sage X3 solutions.
CUSTOMER INTERVIEW Interviewed an Organization using the Sage X3 solutions to obtain data with respect to costs, benefits, and risks.
FINANCIAL MODEL FRAMEWORK Constructed a financial model representative of the interview using the TEI methodology and risk-adjusted the financial model based on issues and concerns of the interviewed organization.
CASE STUDY Employed four fundamental elements of TEI in modeling the Sage X3 impact: benefits, costs, flexibility, and risks. Given the increasing sophistication that enterprises have regarding ROI analyses related to IT investments, Forrester’s TEI methodology serves to provide a complete picture of the total economic impact of purchase decisions. Please see Appendix A for additional information on the TEI methodology.
The TEI methodology
helps companies
demonstrate, justify,
and realize the
tangible value of IT
initiatives to both
senior management
and other key
business
stakeholders.
DISCLOSURES
Readers should be aware of the following:
This study is commissioned by Sage and delivered by Forrester Consulting. It is
not meant to be used as a competitive analysis.
Forrester makes no assumptions as to the potential ROI that other
organizations will receive. Forrester strongly advises that readers use their own
estimates within the framework provided in the report to determine the
appropriateness of an investment in Sage X3 for Manufacturing.
Sage reviewed and provided feedback to Forrester, but Forrester maintains
editorial control over the study and its findings and does not accept changes to
the study that contradict Forrester’s findings or obscure the meaning of the
study.
Sage provided the customer names for the interviews but did not participate in
the interviews.
5 | The Total Economic Impact™ Of Sage X3 For Manufacturing
The Sage X3 Customer Journey
BEFORE AND AFTER THE SAGE X3 INVESTMENT
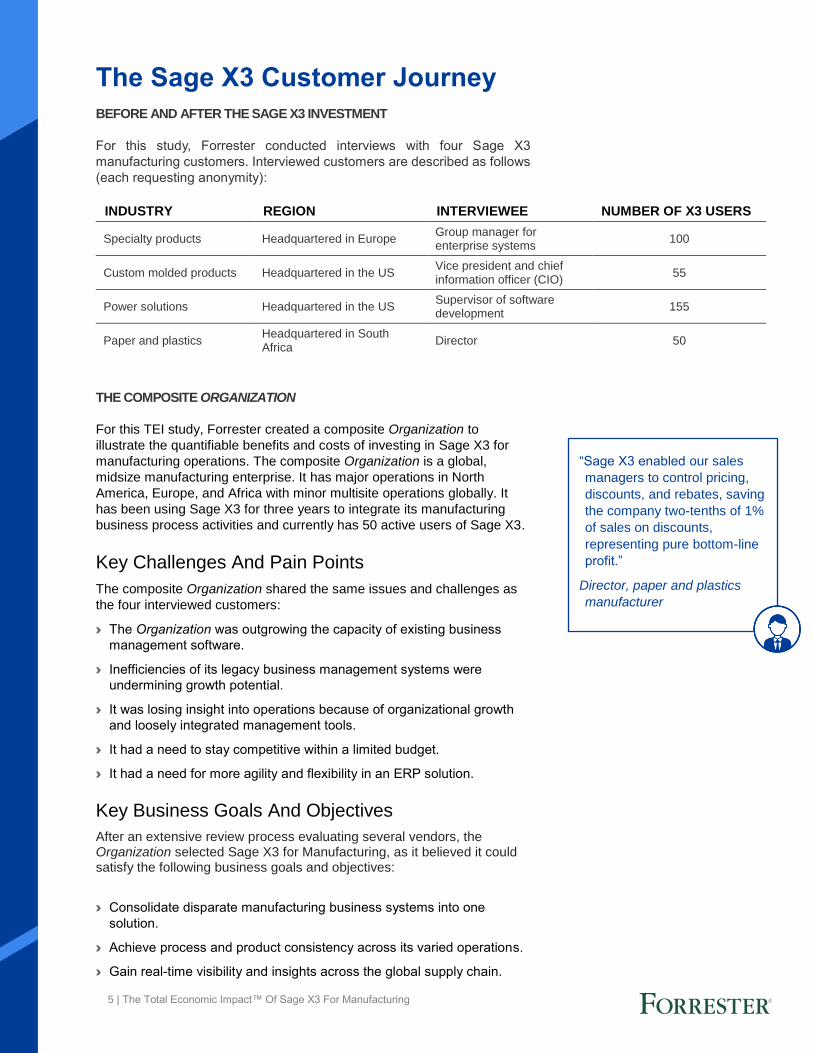
For this study, Forrester conducted interviews with four Sage X3
manufacturing customers. Interviewed customers are described as follows
(each requesting anonymity):
THE COMPOSITE ORGANIZATION
For this TEI study, Forrester created a composite Organization to
illustrate the quantifiable benefits and costs of investing in Sage X3 for
manufacturing operations. The composite Organization is a global,
midsize manufacturing enterprise. It has major operations in North
America, Europe, and Africa with minor multisite operations globally. It
has been using Sage X3 for three years to integrate its manufacturing
business process activities and currently has 50 active users of Sage X3.
Key Challenges And Pain Points
The composite Organization shared the same issues and challenges as
the four interviewed customers:
› The Organization was outgrowing the capacity of existing business
management software.
› Inefficiencies of its legacy business management systems were
undermining growth potential.
› It was losing insight into operations because of organizational growth
and loosely integrated management tools.
› It had a need to stay competitive within a limited budget.
› It had a need for more agility and flexibility in an ERP solution.
Key Business Goals And Objectives
After an extensive review process evaluating several vendors, the Organization selected Sage X3 for Manufacturing, as it believed it could satisfy the following business goals and objectives:
› Consolidate disparate manufacturing business systems into one
solution.
› Achieve process and product consistency across its varied operations.
› Gain real-time visibility and insights across the global supply chain.
INDUSTRY REGION INTERVIEWEE NUMBER OF X3 USERS
Specialty products Headquartered in Europe Group manager for enterprise systems
100
Custom molded products Headquartered in the US Vice president and chief information officer (CIO)
55
Power solutions Headquartered in the US Supervisor of software development
155
Paper and plastics Headquartered in South Africa
Director 50
“Sage X3 enabled our sales
managers to control pricing,
discounts, and rebates, saving
the company two-tenths of 1%
of sales on discounts,
representing pure bottom-line
profit.”
Director, paper and plastics
manufacturer
6 | The Total Economic Impact™ Of Sage X3 For Manufacturing
› Accommodate future merger and acquisition activity.
› Promote a more lean and agile organization.
› Have web access support for its mobile sales force.
Key Results
The customer interviews revealed several key and beneficial results
attributed to their investment in Sage X3 for Manufacturing. Here are the
composite Organization results (more detail is available in the Financial
Analysis section):
› Financial management. The Sage X3 financial management module
produced labor and time savings in the following areas and tasks:
▪ The ability to report monthly company financials using multiple
local currencies, along with consolidated financials using its HQ’s
local currency.
▪ The ability to adjust inventory levels and allow production control
and manufacturing groups to monitor processes on a daily basis.
▪ Better cash management insight and practices.
› Purchasing. The Organization now has the ability to standardize
purchasing processes globally, with purchasing managers adhering to
standards to ensure the best possible prices and volume discounts
from suppliers. In addition, Sage X3 facilitates a more streamlined,
less labor-intensive purchasing process.
› Sale management. Sage X3 promotes standardized sales processes,
allowing account managers worldwide to operate under the same
guidelines and within the same sales database. The Organization can
review customer activity globally and monitor, manage, and adjust
discount levels.
› Inventory management. The Organization now has visibility into its
entire production inventory for all global sites. The Organization
has experienced a reduction in average levels of certain inventory,
using Sage X3 inventory management functionality to increase
inventory turns.
› Customer service. Customer service functionality in Sage X3
provides the Organization with more visibility into customer service
and accounts receivable issues. There has been customer service
productivity and customer satisfaction improvements in the way
relationships are managed.
› Manufacturing management. The investment in Sage X3 allowed the
Organization to move to a completely automated manufacturing
process at most sites. Prior to Sage X3, manufacturing analysts would
record production transactions once per month and do a physical
inventory at the end of each month. With Sage X3, the Organization’s
manufacturing transactions and inventory are accessed in real time
with more accurate inventories and production schedules.
› New features. The Organization is achieving production, supply chain,
and financial reporting productivity by using the new Sage X3 features.
“Inefficiencies with our legacy
business management
systems were undermining our
growth potential. We were
losing insight into operations
because of growth and loosely
integrated management tools.
Sage X3 allowed us to achieve
process and product
consistency across our
operations, and gain real-time
visibility and insights across
our global supply chain.”
Group manager for enterprise
systems, specialty product
manufacturer
7 | The Total Economic Impact™ Of Sage X3 For Manufacturing
Financial Analysis
QUANTIFIED BENEFIT AND COST DATA
Sage X3 Financial Management Module — Labor Savings For Reporting
According to the interviewed customers, the implementation of the
Sage X3 financial management module resulted in labor and time
savings in the following areas and tasks.
The Organization is now able to report monthly company financials
using multiple local currencies, along with consolidated financials using
its HQ’s local currency. Prior to Sage X3, there were no attempts to
produce interim reporting during the month, as it had been deemed too
labor intensive. With Sage X3, real-time reporting allows purchasing and
inventory management groups to review and adjust inventory levels. It
allows the production control and manufacturing groups to monitor
processes on a daily basis, and the Organization has better cash
management insight and practices.
Modeling and assumptions. Based on customer interviews, our
Organization would have needed to add 1.25 full-time equivalents (FTEs)
to produce real-time reports with the legacy ERP environment and to
match the current reporting capabilities of Sage X3. Forrester used a
fully loaded annual cost of $60,000 for the 1.25 FTEs (financial analyst).
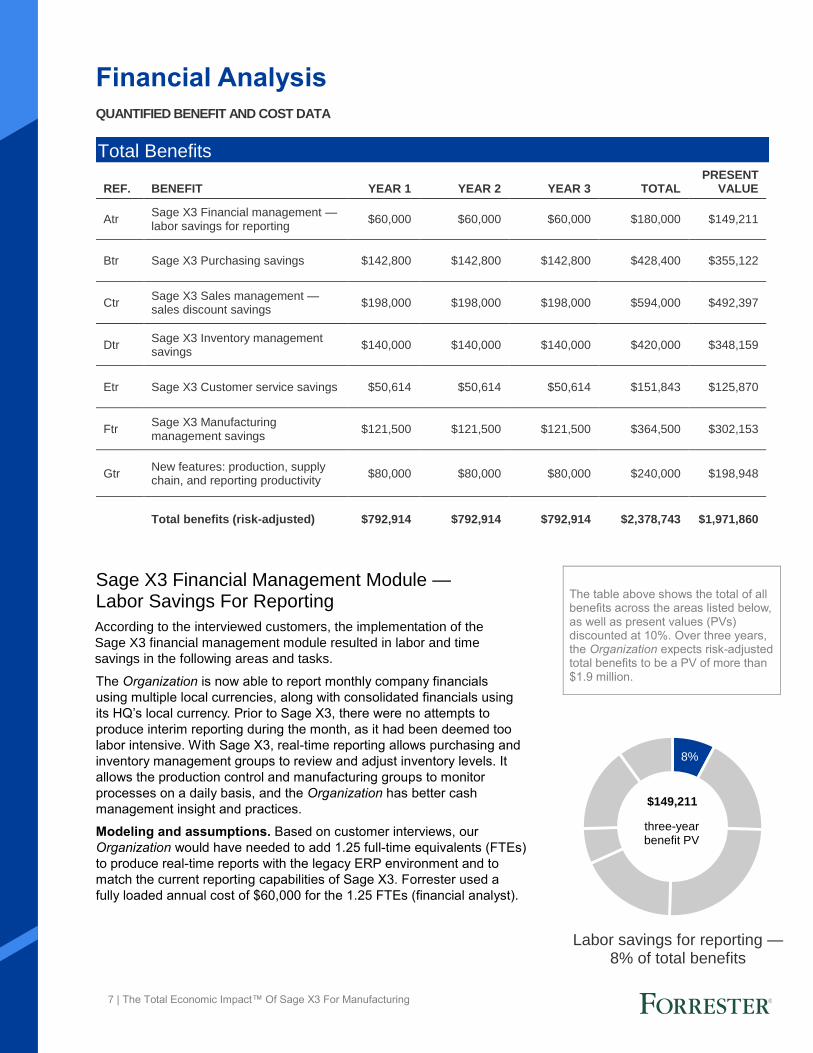
The table above shows the total of all benefits across the areas listed below, as well as present values (PVs) discounted at 10%. Over three years, the Organization expects risk-adjusted total benefits to be a PV of more than $1.9 million.
Total Benefits
REF. BENEFIT YEAR 1 YEAR 2 YEAR 3 TOTAL PRESENT
VALUE
Atr Sage X3 Financial management — labor savings for reporting
$60,000 $60,000 $60,000 $180,000 $149,211
Btr Sage X3 Purchasing savings $142,800 $142,800 $142,800 $428,400 $355,122
Ctr Sage X3 Sales management — sales discount savings
$198,000 $198,000 $198,000 $594,000 $492,397
Dtr Sage X3 Inventory management savings
$140,000 $140,000 $140,000 $420,000 $348,159
Etr Sage X3 Customer service savings $50,614 $50,614 $50,614 $151,843 $125,870
Ftr Sage X3 Manufacturing management savings
$121,500 $121,500 $121,500 $364,500 $302,153
Gtr New features: production, supply chain, and reporting productivity
$80,000 $80,000 $80,000 $240,000 $198,948
Total benefits (risk-adjusted) $792,914 $792,914 $792,914 $2,378,743 $1,971,860
Labor savings for reporting — 8% of total benefits
8%
three-year benefit PV
$149,211
8 | The Total Economic Impact™ Of Sage X3 For Manufacturing
Risks. Forrester considered the following potential risks when assigning
a risk adjustment. The labor savings have been risk-adjusted (reduced)
by 20% in the table below because the Organization never hired the
financial analyst, so there’s some uncertainty as to the benefit amount.
To account for these risks, Forrester adjusted this benefit downward by
20%, yielding a three-year risk-adjusted total PV of $149,211.
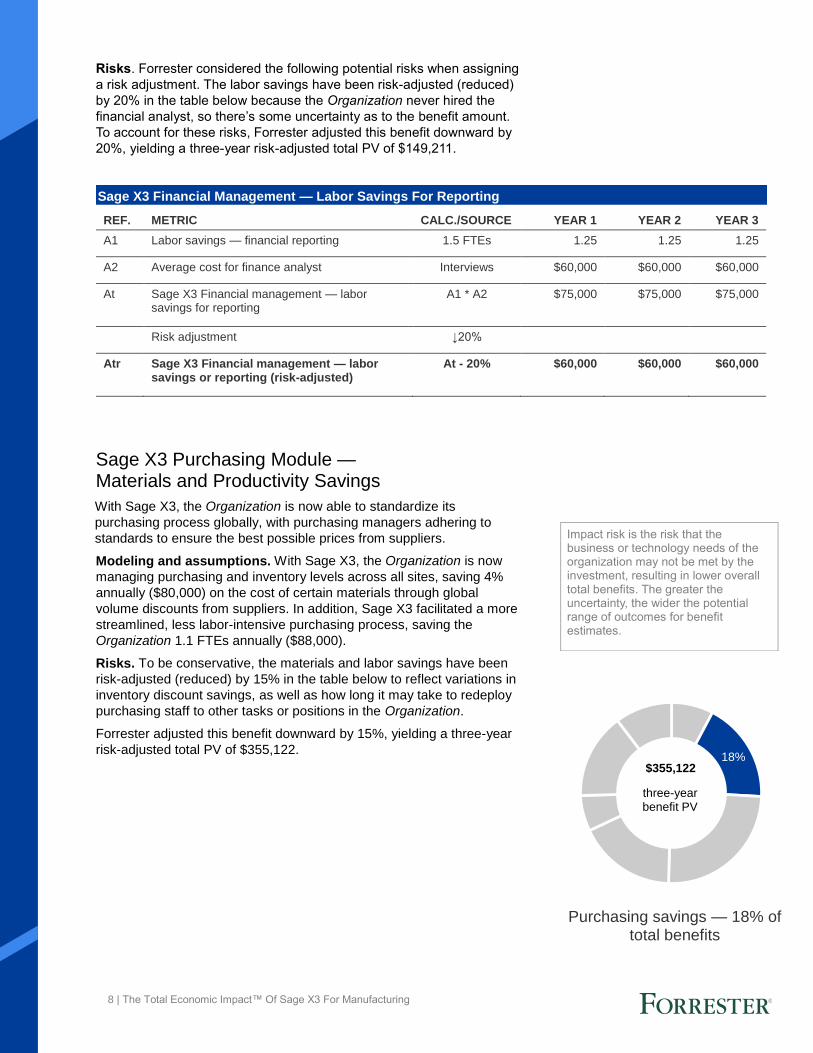
Sage X3 Purchasing Module — Materials and Productivity Savings
With Sage X3, the Organization is now able to standardize its
purchasing process globally, with purchasing managers adhering to
standards to ensure the best possible prices from suppliers.
Modeling and assumptions. With Sage X3, the Organization is now
managing purchasing and inventory levels across all sites, saving 4%
annually ($80,000) on the cost of certain materials through global
volume discounts from suppliers. In addition, Sage X3 facilitated a more
streamlined, less labor-intensive purchasing process, saving the
Organization 1.1 FTEs annually ($88,000).
Risks. To be conservative, the materials and labor savings have been
risk-adjusted (reduced) by 15% in the table below to reflect variations in
inventory discount savings, as well as how long it may take to redeploy
purchasing staff to other tasks or positions in the Organization.
Forrester adjusted this benefit downward by 15%, yielding a three-year
risk-adjusted total PV of $355,122.
Impact risk is the risk that the business or technology needs of the organization may not be met by the investment, resulting in lower overall total benefits. The greater the uncertainty, the wider the potential range of outcomes for benefit estimates.
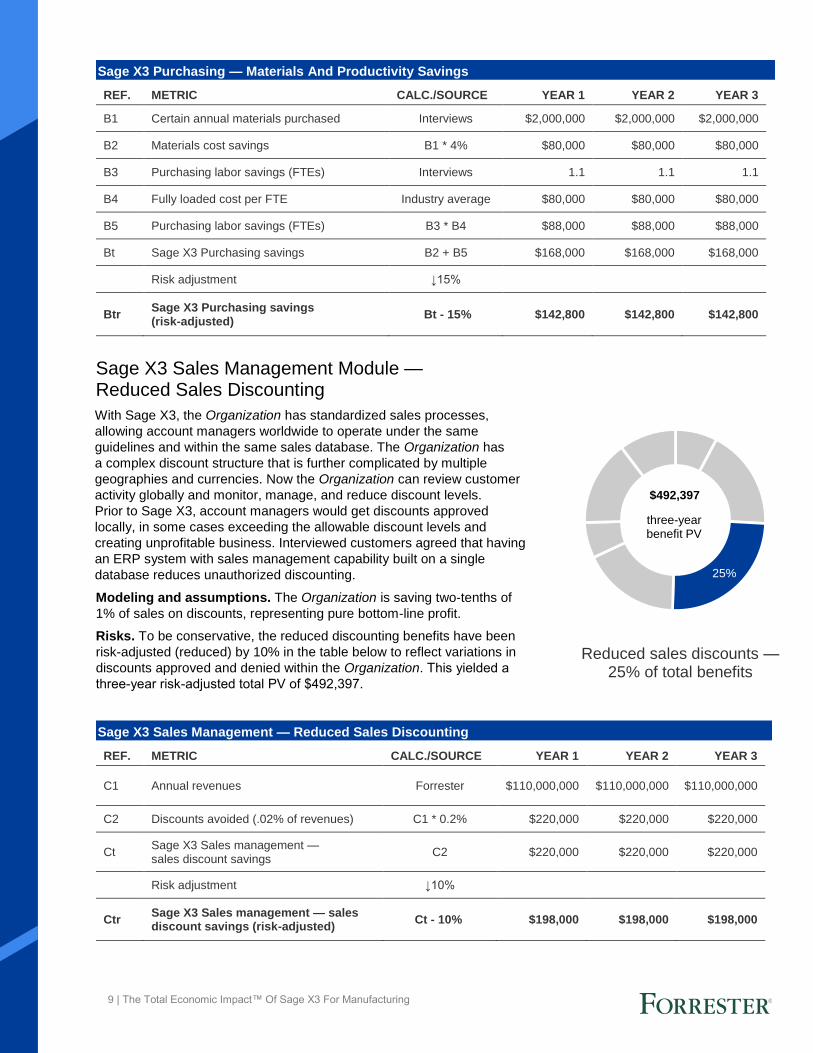
Sage X3 Financial Management — Labor Savings For Reporting
REF. METRIC CALC./SOURCE YEAR 1 YEAR 2 YEAR 3
A1 Labor savings — financial reporting 1.5 FTEs 1.25 1.25 1.25
A2 Average cost for finance analyst Interviews $60,000 $60,000 $60,000
At Sage X3 Financial management — labor savings for reporting
A1 * A2 $75,000 $75,000 $75,000
Risk adjustment ↓20%
Atr Sage X3 Financial management — labor savings or reporting (risk-adjusted)
At - 20% $60,000 $60,000 $60,000
18%
three-year benefit PV
$355,122
Purchasing savings — 18% of total benefits
9 | The Total Economic Impact™ Of Sage X3 For Manufacturing
Sage X3 Sales Management Module — Reduced Sales Discounting
With Sage X3, the Organization has standardized sales processes,
allowing account managers worldwide to operate under the same
guidelines and within the same sales database. The Organization has
a complex discount structure that is further complicated by multiple
geographies and currencies. Now the Organization can review customer
activity globally and monitor, manage, and reduce discount levels.
Prior to Sage X3, account managers would get discounts approved
locally, in some cases exceeding the allowable discount levels and
creating unprofitable business. Interviewed customers agreed that having
an ERP system with sales management capability built on a single
database reduces unauthorized discounting.
Modeling and assumptions. The Organization is saving two-tenths of
1% of sales on discounts, representing pure bottom-line profit.
Risks. To be conservative, the reduced discounting benefits have been
risk-adjusted (reduced) by 10% in the table below to reflect variations in
discounts approved and denied within the Organization. This yielded a
three-year risk-adjusted total PV of $492,397.
Sage X3 Purchasing — Materials And Productivity Savings
REF. METRIC CALC./SOURCE YEAR 1 YEAR 2 YEAR 3
B1 Certain annual materials purchased Interviews $2,000,000 $2,000,000 $2,000,000
B2 Materials cost savings B1 * 4% $80,000 $80,000 $80,000
B3 Purchasing labor savings (FTEs) Interviews 1.1 1.1 1.1
B4 Fully loaded cost per FTE Industry average $80,000 $80,000 $80,000
B5 Purchasing labor savings (FTEs) B3 * B4 $88,000 $88,000 $88,000
Bt Sage X3 Purchasing savings B2 + B5 $168,000 $168,000 $168,000
Risk adjustment ↓15%
Btr Sage X3 Purchasing savings (risk-adjusted)
Bt - 15% $142,800 $142,800 $142,800
Sage X3 Sales Management — Reduced Sales Discounting
REF. METRIC CALC./SOURCE YEAR 1 YEAR 2 YEAR 3
C1 Annual revenues Forrester $110,000,000 $110,000,000 $110,000,000
C2 Discounts avoided (.02% of revenues) C1 * 0.2% $220,000 $220,000 $220,000
Ct Sage X3 Sales management — sales discount savings
C2 $220,000 $220,000 $220,000
Risk adjustment ↓10%
Ctr Sage X3 Sales management — sales discount savings (risk-adjusted)
Ct - 10% $198,000 $198,000 $198,000
Reduced sales discounts — 25% of total benefits
25%
three-year benefit PV
$492,397
10 | The Total Economic Impact™ Of Sage X3 For Manufacturing
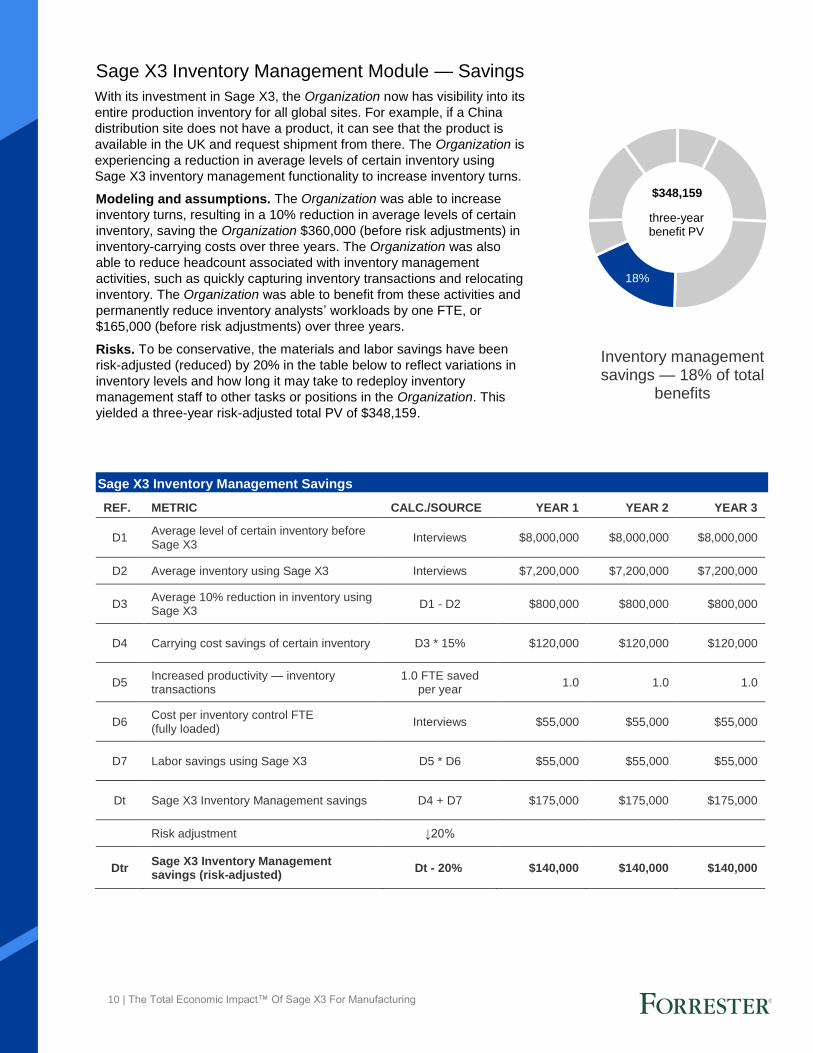
Sage X3 Inventory Management Module — Savings
With its investment in Sage X3, the Organization now has visibility into its
entire production inventory for all global sites. For example, if a China
distribution site does not have a product, it can see that the product is
available in the UK and request shipment from there. The Organization is
experiencing a reduction in average levels of certain inventory using
Sage X3 inventory management functionality to increase inventory turns.
Modeling and assumptions. The Organization was able to increase
inventory turns, resulting in a 10% reduction in average levels of certain
inventory, saving the Organization $360,000 (before risk adjustments) in
inventory-carrying costs over three years. The Organization was also
able to reduce headcount associated with inventory management
activities, such as quickly capturing inventory transactions and relocating
inventory. The Organization was able to benefit from these activities and
permanently reduce inventory analysts’ workloads by one FTE, or
$165,000 (before risk adjustments) over three years.
Risks. To be conservative, the materials and labor savings have been
risk-adjusted (reduced) by 20% in the table below to reflect variations in
inventory levels and how long it may take to redeploy inventory
management staff to other tasks or positions in the Organization. This
yielded a three-year risk-adjusted total PV of $348,159.
Sage X3 Inventory Management Savings
REF. METRIC CALC./SOURCE YEAR 1 YEAR 2 YEAR 3
D1 Average level of certain inventory before Sage X3
Interviews $8,000,000 $8,000,000 $8,000,000
D2 Average inventory using Sage X3 Interviews $7,200,000 $7,200,000 $7,200,000
D3 Average 10% reduction in inventory using Sage X3
D1 - D2 $800,000 $800,000 $800,000
D4 Carrying cost savings of certain inventory D3 * 15% $120,000 $120,000 $120,000
D5 Increased productivity — inventory transactions
1.0 FTE saved per year
1.0 1.0 1.0
D6 Cost per inventory control FTE (fully loaded)
Interviews $55,000 $55,000 $55,000
D7 Labor savings using Sage X3 D5 * D6 $55,000 $55,000 $55,000
Dt Sage X3 Inventory Management savings D4 + D7 $175,000 $175,000 $175,000
Risk adjustment ↓20%
Dtr Sage X3 Inventory Management savings (risk-adjusted)
Dt - 20% $140,000 $140,000 $140,000
Inventory management savings — 18% of total
benefits
18%
three-year benefit PV
$348,159
11 | The Total Economic Impact™ Of Sage X3 For Manufacturing
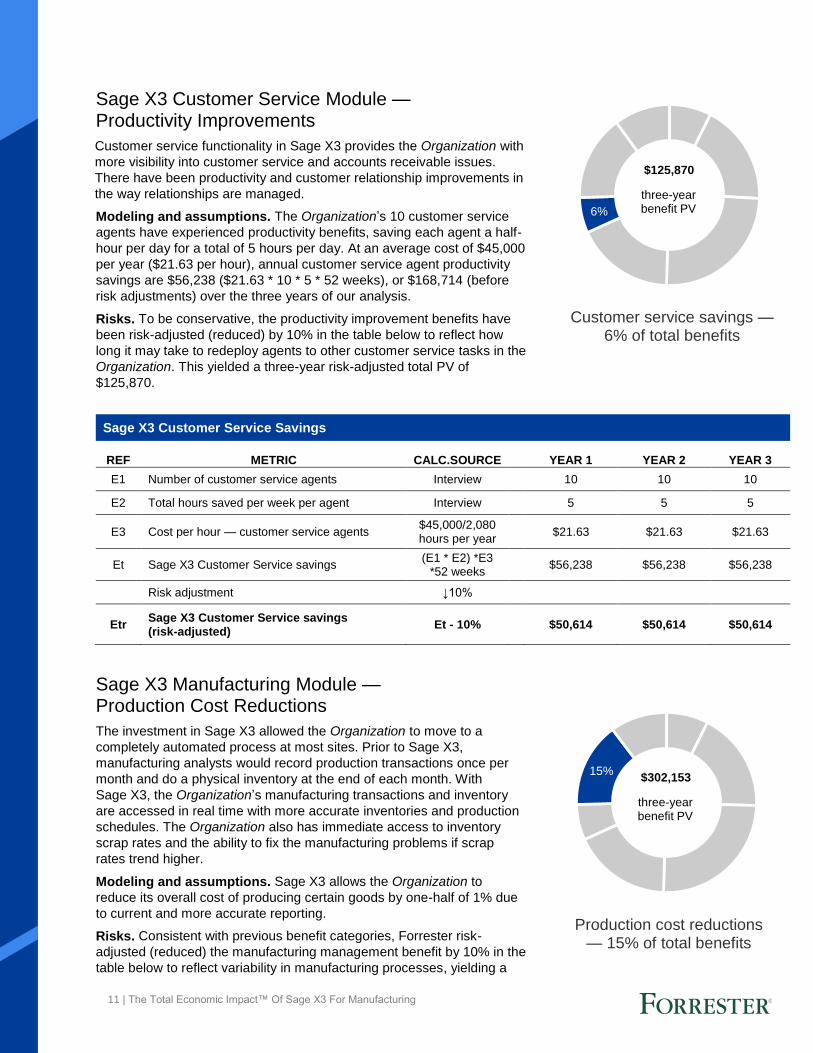
Sage X3 Customer Service Module — Productivity Improvements
Customer service functionality in Sage X3 provides the Organization with
more visibility into customer service and accounts receivable issues.
There have been productivity and customer relationship improvements in
the way relationships are managed.
Modeling and assumptions. The Organization’s 10 customer service
agents have experienced productivity benefits, saving each agent a half-
hour per day for a total of 5 hours per day. At an average cost of $45,000
per year ($21.63 per hour), annual customer service agent productivity
savings are $56,238 ($21.63 * 10 * 5 * 52 weeks), or $168,714 (before
risk adjustments) over the three years of our analysis.
Risks. To be conservative, the productivity improvement benefits have
been risk-adjusted (reduced) by 10% in the table below to reflect how
long it may take to redeploy agents to other customer service tasks in the
Organization. This yielded a three-year risk-adjusted total PV of
$125,870.
Sage X3 Manufacturing Module — Production Cost Reductions
The investment in Sage X3 allowed the Organization to move to a
completely automated process at most sites. Prior to Sage X3,
manufacturing analysts would record production transactions once per
month and do a physical inventory at the end of each month. With
Sage X3, the Organization’s manufacturing transactions and inventory
are accessed in real time with more accurate inventories and production
schedules. The Organization also has immediate access to inventory
scrap rates and the ability to fix the manufacturing problems if scrap
rates trend higher.
Modeling and assumptions. Sage X3 allows the Organization to
reduce its overall cost of producing certain goods by one-half of 1% due
to current and more accurate reporting.
Risks. Consistent with previous benefit categories, Forrester risk-
adjusted (reduced) the manufacturing management benefit by 10% in the
table below to reflect variability in manufacturing processes, yielding a
Sage X3 Customer Service Savings
REF METRIC CALC.SOURCE YEAR 1 YEAR 2 YEAR 3
E1 Number of customer service agents Interview 10 10 10
E2 Total hours saved per week per agent Interview 5 5 5
E3 Cost per hour — customer service agents $45,000/2,080 hours per year
$21.63 $21.63 $21.63
Et Sage X3 Customer Service savings (E1 * E2) *E3
*52 weeks $56,238 $56,238 $56,238
Risk adjustment ↓10%
Etr Sage X3 Customer Service savings (risk-adjusted)
Et - 10% $50,614 $50,614 $50,614
Customer service savings — 6% of total benefits
6%
three-year benefit PV
$125,870
15%
three-year benefit PV
$302,153
Production cost reductions — 15% of total benefits
12 | The Total Economic Impact™ Of Sage X3 For Manufacturing
three-year risk-adjusted total PV of $302,153.
Sage X3 Manufacturing — Production Cost Reductions
REF. METRIC CALC./SOURCE YEAR 1 YEAR 2 YEAR 3
F1 Costs of producing certain goods before Sage X3
Interviews 27,000,000 27,000,000 27,000,000
F2 Savings with Sage X3 One-half of 1%
of costs 0.50% 0.50% 0.50%
Ft Sage X3 Manufacturing –— production cost reductions
F1 * F2 $135,000 $135,000 $135,000
Risk adjustment ↓10%
Ftr Sage X3 Manufacturing –— production cost reductions (risk-adjusted)
Ft - 10% $121,500 $121,500 $121,500
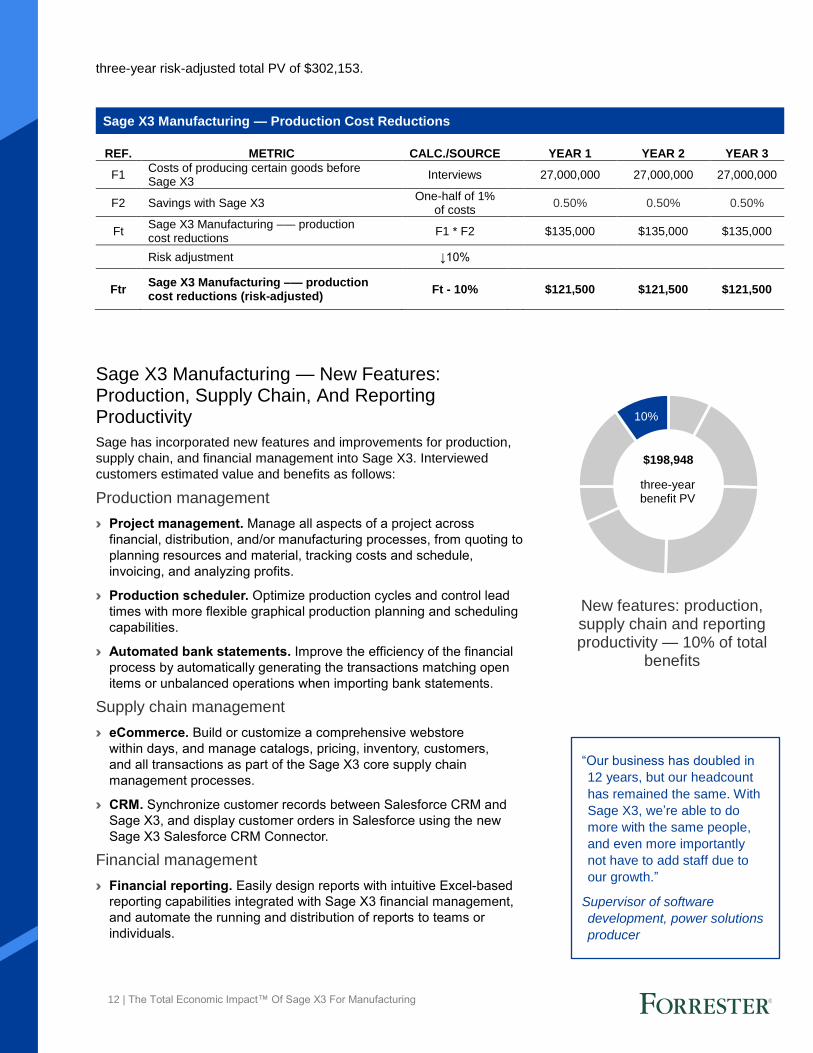
Sage X3 Manufacturing — New Features: Production, Supply Chain, And Reporting Productivity
Sage has incorporated new features and improvements for production,
supply chain, and financial management into Sage X3. Interviewed
customers estimated value and benefits as follows:
Production management
› Project management. Manage all aspects of a project across
financial, distribution, and/or manufacturing processes, from quoting to
planning resources and material, tracking costs and schedule,
invoicing, and analyzing profits.
› Production scheduler. Optimize production cycles and control lead
times with more flexible graphical production planning and scheduling
capabilities.
› Automated bank statements. Improve the efficiency of the financial
process by automatically generating the transactions matching open
items or unbalanced operations when importing bank statements.
Supply chain management
› eCommerce. Build or customize a comprehensive webstore
within days, and manage catalogs, pricing, inventory, customers,
and all transactions as part of the Sage X3 core supply chain
management processes.
› CRM. Synchronize customer records between Salesforce CRM and
Sage X3, and display customer orders in Salesforce using the new
Sage X3 Salesforce CRM Connector.
Financial management
› Financial reporting. Easily design reports with intuitive Excel-based
reporting capabilities integrated with Sage X3 financial management,
and automate the running and distribution of reports to teams or
individuals.
10%
three-year benefit PV
$198,948
New features: production, supply chain and reporting productivity — 10% of total
benefits
“Our business has doubled in
12 years, but our headcount
has remained the same. With
Sage X3, we’re able to do
more with the same people,
and even more importantly
not have to add staff due to
our growth.”
Supervisor of software
development, power solutions
producer
13 | The Total Economic Impact™ Of Sage X3 For Manufacturing
Modeling and assumptions. Interviewed customers estimated the new
features of Sage X3 would improve productivity by 0.25 FTEs for
financial reporting, and 0.5 FTEs each for production and supply chain
management.
Risks. Consistent with previous benefit categories, Forrester risk-
adjusted (reduced) the new features benefit by 20% to reflect some
uncertainty in achieving the productivity gains for this relatively new
functionality. This yielded a three-year risk-adjusted total PV of
$198,948.
Unquantified Benefits
Unquantified benefits. The interviewed customers experienced the
following benefits; however, they were not able to quantify them for this
study:
› Interviewed customers reported that the workflow automation and
alerts functionality within Sage X3 encourages users to adhere to
policies and speeds up processes. In the past, an employee would
have to chase somebody down to approve a purchase order. With
Sage X3, the automated workflow alerts notify the appropriate staff,
and approvals are done in a more reasonable amount of time.
› With the documentation and office collaboration functionality in
Sage X3, every vendor invoice is scanned into a document
management system and PDFs are uploaded into Sage X3 and
attached to the records. Invoices are now accessible by anyone who
needs to see them, including business units and purchasing, receiving
dock, and accounts payable employees. With Sage X3, employees
don’t have to search physical file cabinets anymore; they just access
Sage X3 on their computers.
New Features: Production, Supply Chain, And Reporting Productivity
REF. METRIC CALC./SOURCE YEAR 1 YEAR 2 YEAR 3
G1 Production management savings One-half FTE 0.5 0.5 0.5
G2 Supply chain management savings One-half FTE 0.5 0.5 0.5
G3 Financial management savings One-quarter FTE 0.25 0.25 0.25
G4 Average fully loaded cost of FTEs Interviews $80,000 $80,000 $80,000
Gt New features: production, supply chain, and reporting productivity
(G1+G2+G3) * G4 $100,000 $100,000 $100,000
Risk adjustment ↓20%
Gtr New Features: production, supply chain, and reporting productivity (risk-adjusted)
Gt - 20% $80,000 $80,000 $80,000
14 | The Total Economic Impact™ Of Sage X3 For Manufacturing
Flexibility
The value of flexibility is clearly unique to each customer, and the
measure of its value varies from organization to organization. There are
scenarios in which a customer might choose to implement Sage X3’s
solution and later realize additional uses and business opportunities.
There are two future flexibility options that the Organization is
considering:
› Mobile. Sage X3 can be used on any familiar web browser or mobile
device.
› Mergers and acquisitions. According to two of the interviewed
customers, having Sage X3 allowed them to acquire companies and
move them onto the company ERP model much faster and easier.
One interviewed customer commented: “We just had an acquisition
two months ago, and they’re already assimilated into the Sage X3
system. We couldn’t have done that before with our previous system.
With Sage X3, we have policies and procedures so acquired
companies get turned on and up and running very quickly. From a
flexibility standpoint, we can acquire a business and assimilate it much
faster than we could before.”
The value of Flexibility would be quantified when evaluated as part of a
specific project (described in more detail in Appendix A).
Flexibility, as defined by TEI, represents an investment in additional capacity or capability that could be turned into business benefit for a future additional investment. This provides an organization with the "right" or the ability to engage in future initiatives but not the obligation to do so.
15 | The Total Economic Impact™ Of Sage X3 For Manufacturing
Total Costs Associated With Sage X3 for
Manufacturing
The internal labor associated with planning and deploying Sage X3
equated to one FTE across three staff members over six months. The
average annual fully loaded cost of an FTE is $100,000. Three FTEs
spent about one-third of their time over six months (in aggregate) for
planning and deployment of Sage X3 at a cost of $50,000 as an initial
investment period expense. Preplanning and deployment tasks included:
› Sharing documentation with Sage or Sage partners.
› Working with Sage or Sage partner professional services on
requirements, configuration setups, data conversion, analysis and
modeling, and training.
› Training employees to use Sage X3.
› Incremental hardware, database, and operating system license and
maintenance ($0). The Organization incurred none of these costs
with the Sage X3 cloud solution.
*Note: For an on-premises deployment of Sage X3, the Organization
will incur an additional $24,000 in hardware, database, and operating
system fees, and additional Sage X3 license fees of $63,000 over three
years.
Sage X3 fees are $327,794. Sage X3 cloud solution fees include the
following:
› Sage or partner professional services. This includes software
installation in a cloud environment, post-installation support,
configuration setup, data conversion, analysis and modeling, testing,
and training.
› Sage cloud subscription fees.
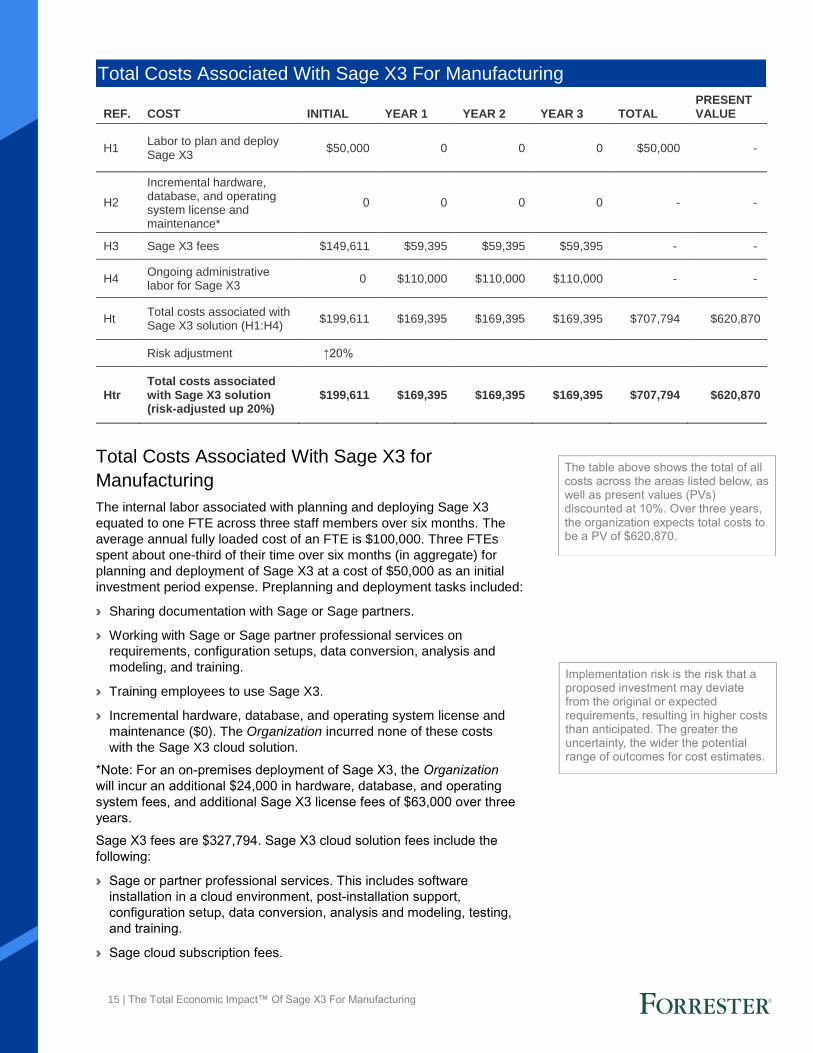
Total Costs Associated With Sage X3 For Manufacturing
The table above shows the total of all costs across the areas listed below, as well as present values (PVs) discounted at 10%. Over three years, the organization expects total costs to be a PV of $620,870.
Implementation risk is the risk that a proposed investment may deviate from the original or expected requirements, resulting in higher costs than anticipated. The greater the uncertainty, the wider the potential range of outcomes for cost estimates.
REF. COST INITIAL YEAR 1 YEAR 2 YEAR 3 TOTAL PRESENT VALUE
H1 Labor to plan and deploy Sage X3
$50,000 0 0 0 $50,000 -
H2
Incremental hardware, database, and operating system license and maintenance*
0 0 0 0 - -
H3 Sage X3 fees $149,611 $59,395 $59,395 $59,395 - -
H4 Ongoing administrative labor for Sage X3
0 $110,000 $110,000 $110,000 - -
Ht Total costs associated with Sage X3 solution (H1:H4)
$199,611 $169,395 $169,395 $169,395 $707,794 $620,870
Risk adjustment ↑20%
Htr Total costs associated with Sage X3 solution (risk-adjusted up 20%)
$199,611 $169,395 $169,395 $169,395 $707,794 $620,870
16 | The Total Economic Impact™ Of Sage X3 For Manufacturing
Ongoing administrative labor for Sage X3 is $330,000. This includes
ongoing labor to operate and maintain the integration points with other
systems and applications, along with help desk support and training
new users.
Risks. Forrester chose not to risk-adjust costs because the Organization
received fixed price quotes for Sage X3 fees, and other costs are actual
costs incurred by the interviewed customers. The Organization’s total
costs for the Sage X3 solution are $707,794, with a present value of
$620,870.
17 | The Total Economic Impact™ Of Sage X3 For Manufacturing
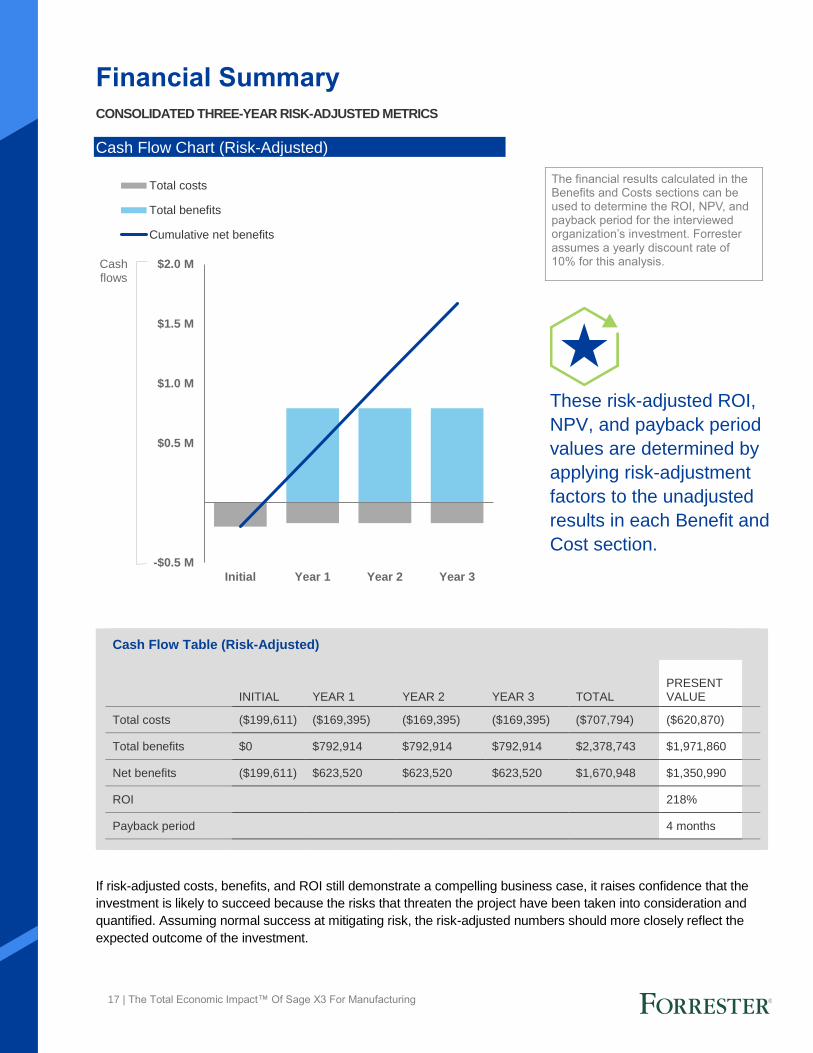
Financial Summary
CONSOLIDATED THREE-YEAR RISK-ADJUSTED METRICS
Cash Flow Chart (Risk-Adjusted)
If risk-adjusted costs, benefits, and ROI still demonstrate a compelling business case, it raises confidence that the
investment is likely to succeed because the risks that threaten the project have been taken into consideration and
quantified. Assuming normal success at mitigating risk, the risk-adjusted numbers should more closely reflect the
expected outcome of the investment.
-$0.5 M
$0.5 M
$1.0 M
$1.5 M
$2.0 M
Initial Year 1 Year 2 Year 3
Cashflows
Total costs
Total benefits
Cumulative net benefits
These risk-adjusted ROI,
NPV, and payback period
values are determined by
applying risk-adjustment
factors to the unadjusted
results in each Benefit and
Cost section.
The financial results calculated in the Benefits and Costs sections can be used to determine the ROI, NPV, and payback period for the interviewed organization’s investment. Forrester assumes a yearly discount rate of 10% for this analysis.
Cash Flow Table (Risk-Adjusted)
INITIAL YEAR 1 YEAR 2 YEAR 3 TOTAL PRESENT VALUE
Total costs ($199,611) ($169,395) ($169,395) ($169,395) ($707,794) ($620,870)
Total benefits $0 $792,914 $792,914 $792,914 $2,378,743 $1,971,860
Net benefits ($199,611) $623,520 $623,520 $623,520 $1,670,948 $1,350,990
ROI 218%
Payback period 4 months
18 | The Total Economic Impact™ Of Sage X3 For Manufacturing
Overview of Sage X3 For Manufacturing
The following information is provided by Sage. Forrester has not validated any claims and does not endorse Sage
or its offerings.
ADOPT A FAST, SIMPLE, FLEXIBLE BUSINESS MANAGEMENT SOLUTION
Sage X3 is the next generation of business management solutions for enterprises to grow faster and stay agile.
Sage X3 takes the complexity out of running a business. It simplifies every part of operations, leaving the business
lean and ready for whatever comes next. With Sage X3, you are choosing the next-generation business
management solution for your enterprise to grow faster and run an agile organization.
FAST
Sage X3 runs businesses fast, with a cohesive, enterprise-class solution to manage all core business processes —
from purchasing to manufacturing, inventory management, sales, customer service, and financials — locally and
internationally. It also accelerates collaboration and reporting and delivers real-time insight into all costs and
operational performance.
FLEXIBLE
Sage X3 is ready for various industries. Built-in functionality for process manufacturing, other manufacturing,
distribution, and services tasks adjusts to accommodate a company’s unique rules and processes. It’s also easily
scalable — never running out of capacity again — and quickly adapts to changing needs, growing with the business
as it expands to new markets or geographies, and makes it simple to manage a global business.
SIMPLE
Sage X3 is easy to use in a familiar web browser and on mobile devices, providing the freedom to work where it’s
needed. It is also simple to manage and highly configurable to adapt to unique processes, roles, and preferences.
Sage X3 is a versatile solution — use it as a service in the cloud and reduce demand on in-house teams to
maintain the system, or deploy the solution on a choice of infrastructures.
Sage X3 offers rich and integrated functionality to support all core business processes with minimal IT investment
and resources. Below are brief descriptions of the Sage X3 modules:
FINANCES
Control the bottom line. Sage X3 covers financial, personnel, cost and budget accounting, commitments, and fixed
assets. In addition, it easily handles transfers from one country to another and between subsidiaries and
headquarters. The flexible accounting structure (multiledger and multichart of accounts) promotes a real-time global
vision while accommodating local operational requirements.
REPORTING AND ANALYTICS
Provide the entire team with the information they need to make faster and more strategic decisions. Real-time
analytics, alerts, and notifications empower each role in the organization to respond quickly to changing business
conditions.
19 | The Total Economic Impact™ Of Sage X3 For Manufacturing
MANUFACTURING
Get to market quickly by managing all manufacturing processes with one complete system. Sage X3 supports
planning, scheduling, and production control activities for both process and discrete manufacturing. It is also flexible
enough to adapt to unique or mixed manufacturing modes.
INVENTORY
Keep up with demand and ensure optimal efficiency through real-time monitoring of inventory status. Inventory
control is configurable by site with the application of the multisite, multi-warehouse, and multi-location management.
Incorporate powerful quality control functions, including total traceability of inventory quantities and lot and serial
numbers in real time, both upstream and downstream, through material flow management.
PURCHASING
Seamlessly manage the purchasing process from beginning to end, starting with management of requests for
quotes (RFQs), input and follow-up of replies, and integration into the price list database. Sage X3 helps to buy
smarter by tracking purchase requests, orders created, deliveries, subcontract orders, and buyer workloads, and by
managing the approval process from order through receipt and invoicing.
SALES
Provide the best experience possible for customers while improving the topline performance. Sage X3 provides
quick and easy access to information concerning products, price lists, discounts, and carriers. Issue customer
quotations and book orders, transmit order acknowledgements, manage contracts, view and allocate goods from
stock, and manage the dispatch and loan of goods prior to invoicing.
CUSTOMER SERVICE
Delight customers with exceptional service. Full integration with sales, inventory, purchasing, finance, and
manufacturing provides a 360-degree understanding of customer activity — all within a single business
management system.
20 | The Total Economic Impact™ Of Sage X3 For Manufacturing
Appendix A: Total Economic Impact
Total Economic Impact is a methodology developed by Forrester
Research that enhances a company’s technology decision-making
processes and assists vendors in communicating the value proposition
of their products and services to clients. The TEI methodology helps
companies demonstrate, justify, and realize the tangible value of IT
initiatives to both senior management and other key business
stakeholders.
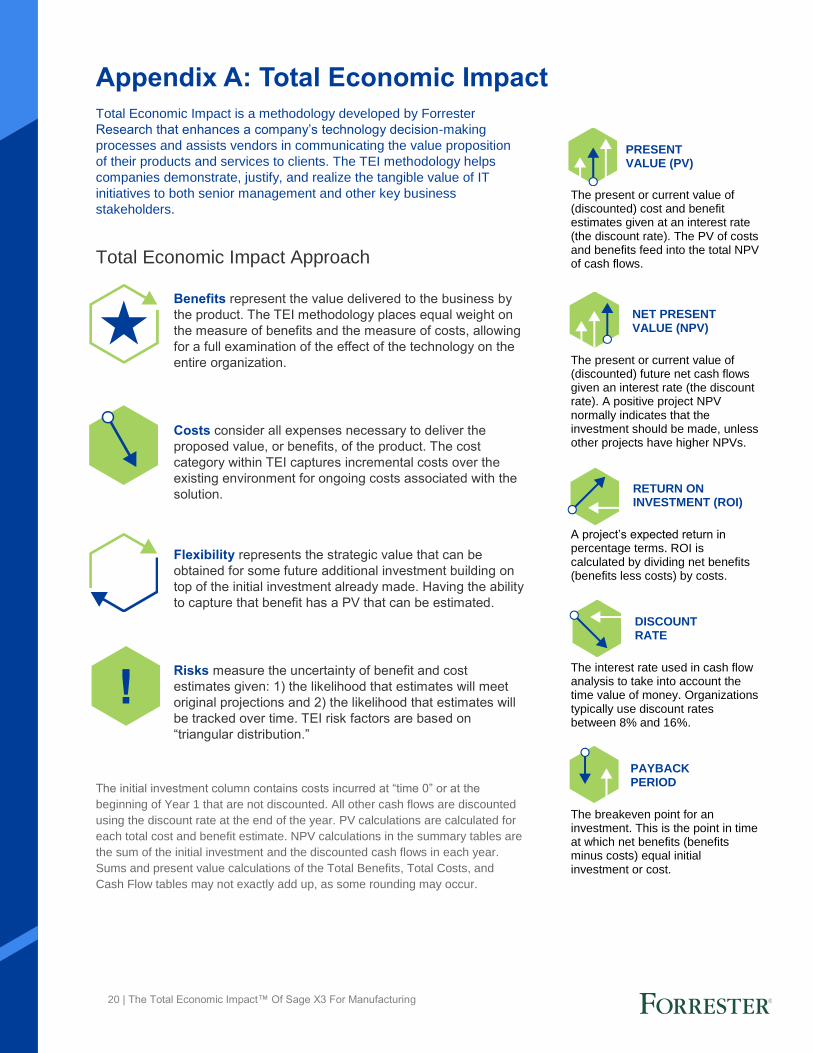
Total Economic Impact Approach
Benefits represent the value delivered to the business by
the product. The TEI methodology places equal weight on
the measure of benefits and the measure of costs, allowing
for a full examination of the effect of the technology on the
entire organization.
Costs consider all expenses necessary to deliver the
proposed value, or benefits, of the product. The cost
category within TEI captures incremental costs over the
existing environment for ongoing costs associated with the
solution.
Flexibility represents the strategic value that can be
obtained for some future additional investment building on
top of the initial investment already made. Having the ability
to capture that benefit has a PV that can be estimated.
Risks measure the uncertainty of benefit and cost
estimates given: 1) the likelihood that estimates will meet
original projections and 2) the likelihood that estimates will
be tracked over time. TEI risk factors are based on
“triangular distribution.”
The initial investment column contains costs incurred at “time 0” or at the
beginning of Year 1 that are not discounted. All other cash flows are discounted
using the discount rate at the end of the year. PV calculations are calculated for
each total cost and benefit estimate. NPV calculations in the summary tables are
the sum of the initial investment and the discounted cash flows in each year.
Sums and present value calculations of the Total Benefits, Total Costs, and
Cash Flow tables may not exactly add up, as some rounding may occur.
PRESENT VALUE (PV)
The present or current value of (discounted) cost and benefit estimates given at an interest rate (the discount rate). The PV of costs and benefits feed into the total NPV of cash flows.
NET PRESENT VALUE (NPV)
The present or current value of (discounted) future net cash flows given an interest rate (the discount rate). A positive project NPV normally indicates that the investment should be made, unless other projects have higher NPVs.
RETURN ON INVESTMENT (ROI)
A project’s expected return in percentage terms. ROI is calculated by dividing net benefits (benefits less costs) by costs.
DISCOUNT RATE
The interest rate used in cash flow analysis to take into account the time value of money. Organizations typically use discount rates between 8% and 16%.
PAYBACK PERIOD
The breakeven point for an investment. This is the point in time at which net benefits (benefits minus costs) equal initial investment or cost.