Embed Size (px)
Citation preview
THE TITRATION CURVES OF OXYGENATED AND REDUCED HEMOGLOBIN
BY BERNARD GERMAN AND JEFFRIES WYMAN, JR.
(From the Biological Laboratories, Harvard University, Cambridge)
(Received for publication, October 29, 1936)
In 1904 Bohr, Hasselbalch, and Krogh (1) found that changes in the pressure of CO2 influenced the oxygen dissociation curves of hemoglobin-as pCOZ was increased the affinity of hemoglobin for O2 was diminished. In 1914 Christiansen, Douglas, and Haldane (2) discovered that the reciprocal effect also occurs- reduced blood absorbs more COZ than oxygenated blood. Hen- derson (11) pointed out that this was to be expected in conse- quence of the equation
(1) (COz) + 7.7 = 0%) (CW’
0.014 (HbO,)
which summarized the results. Henderson explained this effect by assuming that the combination with oxygen increases the dis- sociation constant of a single monovalent acid group in the hemoglobin molecule, so that oxyhemoglobin is a stronger acid than reduced hemoglobin, and binds more base at a given pH.
Hastings, Van Slyke, Neill, Heidelberger, and Harington (10) determined the titration curves of oxygenated and reduced horse hemoglobin by the CO2 method; i.e., estimating the pH from the BHCOa:H&03 ratio on the basis of the Henderson-Hasselbalch equation, for of course direct measurements of pH with a hydro- gen electrode are technically impossible in the case of oxyhemo- globin. Their titration curves extended over the pH range 6.8 to 7.6, and they calculated the change in the dissociation constant of the oxylabile acid group, assuming that it is a single mono- valent group which is affected by oxygenation. Hastings, Sendroy, Murray, and Heidelberger (9) found by the same method that carboxyhemoglobin binds as much base as oxyhemoglobin,
533
by guest on June 17, 2018http://w
ww
.jbc.org/D
ownloaded from
534 Titration Curves of Hemoglobin
and they subsequently conducted a series of direct electrometric titrations on reduced and carboxyhemoglobin, over the pH range 6.2 to 8.6. Their results were of the same order of magnitude as those obtained previously by the CO2 method. These experi- ments confirm Henderson’s hypothesis that oxygenation makes hemoglobin a stronger acid.
The perfection of the glass electrode has made it possible to obtain titration curves of oxygenated hemoglobin directly, and to reinvestigate the oxygenation-reduction effect. This paper describes a series of titration experiments on oxygenated and reduced hemoglobin, made with the glass electrode over a range of pH from about 4.3 to 9.8 at various ionic strengths.
Methods
Hemoglobin-The horse hemoglobin was crystallized by the method of Ferry and Green (7). Concentrated cells from horse blood, kindly furnished by the Massachusetts Antitoxin and Vaccine Laboratory, were diluted with 3 times their volume of cold 1.5 per cent NaCl, and the resulting suspension run through a Sharples centrifuge. The concentrated hemoglobin solution so obtained was crystallized by adding cold 0.1 N HCl until rhom- boidal plates appeared close to the isoelectric point, pH 6.6. The crystals were washed twice with cold distilled water. Each washing lasted 6 hours, long enough to remove most of the salt. They were then dissolved by slowly adding the minimum quan- tity of cold 1.0 N NaOH. The resulting solution was centrifuged to remove stroma, and then recrystallized.
These final crystals were washed twice with distilled water, stirred with cold NaCl solution, centrifuged, and the super- natant solution was used in the experiments. All the operations were carried on in the cold room at a temperature of 2’ so as to minimize methemoglobin formation. The hemoglobin was stirred while acid or base was being added to prevent accumulation of local excess, and also to keep it oxygenated. The preparations were always completed 2 or 3 days after the cells were obtained. Comparison of the total nitrogen (Kjeldahl) with the 02 capacity (Van Slyke constant volume apparatus) showed that the hemo- globin was only slightly inactivated after being twice crystallized.
by guest on June 17, 2018http://w
ww
.jbc.org/D
ownloaded from
B. German and J. Wyman, Jr. 535
Glass Electrode and Measuring Circuit-The determinations of pH were based on the E.M.F. of the following combination.
Ag 1 AgCl 1 HCl (0.1 N) 11 unknown solution 11 saturated calomel half cell
Glass Liquid membrane junction
The glass electrode was similar to the one designed by Mac- Innes (12), except that the glass was thinner. The E.M.F. of the combination was opposed by the E.M.F. drawn from a Leeds and Northrup type K potentiometer, the point of balance being determined by an electron tube bridge similar to the circuit de- scribed by Du Bridge (6).
Manipulations-A known amount of 0.100 N HCl or of 0.105 N NaOH was added with stirring to a known amount of the cold stock hemoglobin solution. The resulting solution was then di- vided into two parts and placed in separate tonometers, both of which were evacuated to remove gases. One portion was oxy- genated by equilibrating it in the rotating tonometer with cylinder 02 previously washed with NaOH solution to remove COz. The other portion was reduced by repeated evacuation and rotation in an atmosphere of cylinder Nz previously bubbled through wash towers containing a solution of anthrahydroquinone sul- fonate and NazSz04, made up as described by Fieser (8), to remove 02. Both equilibrations were continued for 10 minutes at room temperature (23-25’) and the measureinents were made immedi- ately afterwards. Except in the extreme acid range methemo- globin formation during the course of the measurements was slight or negligible. This was apparent, since, when an oxygen- ated portion was reduced and then reoxygenated the pH of this reoxygenated hemoglobin solution was the same as that of the original oxygenated solution.
In the extreme acid range where methemoglobin formation was fairly rapid the oxygenated and reduced portions were treated separately in order to avoid standing. They were equilibrated rapidly and the pH measured within 3 to 5 minutes after the addi- tion of acid.
At least three determinations were made upon each portion, and a fresh liquid junction used for each. Over the greater part
by guest on June 17, 2018http://w
ww
.jbc.org/D
ownloaded from
536 Titration Curves of Hemoglobin
of the pH range (4 to 8) the readings were steady and showed a maximum deviation from the mean of 0.15 millivolt (correspond- ing to 0.0025 pH unit). In the more alkaline range (pH 8.0) there was a drift in E.M.F., sometimes leading to a steady value, sometimes not. In these cases the procedure adopted was to take the average of several readings obtained at the end of 3 minutes after the formation of a fresh liquid junction. For these cases the maximum deviation from the mean was 0.5 millivolt, or 0.008 pH unit.
The electrode was standardized by acetate, phosphate, and borate buffers, made up from tables in Clark (3). The graph of E.M.F. against pH was linear over the range studied. The elec- trode was checked with the buffers throughout the determina- tions so as to take account of any changes in the calibration. Results showed a maximum deviation of 0.1 millivolt or 0.0016 pH unit from the mean. All measurements were made at room temperature (23-25’) and the pH of buffers determined by linear interpolation between data given at nearby temperatures.
Results
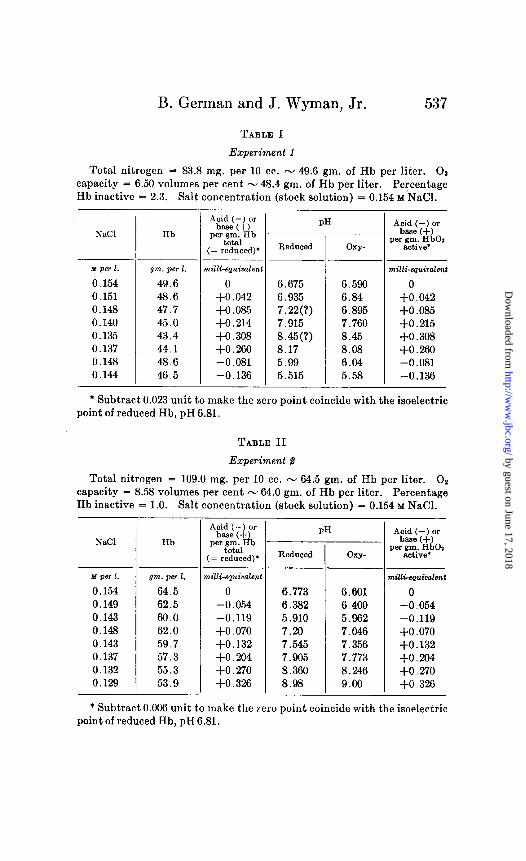
The results of five experiments are given in detail in Tables I to V. Experiments 2 and 3 are on the same hemoglobin prepara- tion. The amounts of acid or base added are expressed in terms of milli-equivalents per gm. of hemoglobin. In the case of re- duced hemoglobin no correction is made for any inactive protein present, since this is assumed to be methemoglobin, which is known to bind the same amount of base as reduced hemoglobin (9). In the case of oxyhemoglobin, on the other hand, it is necessary to take account of the amount of the inactive material in calculating the base bound. This was done by the following equation
(2) B’. = B. - x B,
l-x
where B, = total amount of base bound per gm. of Hb (in all forms) in the oxygenated solution; B’, = amount of base bound per gm. of active oxygenated Hb; B, = amount of base bound by 1 gm. of reduced Hb (assumed to be the same as for the inactive hemoglobin) at the same pH, determined from the data for the
by guest on June 17, 2018http://w
ww
.jbc.org/D
ownloaded from
B. German and J. Wyman, Jr. 537
TABLE I
Experiment 1
Total nitrogen = 83.8 mg. per 10 cc. - 49.6 gm. of Hb per liter. 01 capacity = 6.50 volumes per cent - 48.4 gm. of Hb per liter. Percentage Hb inactive = 2.3. Salt concentration (stock solution) = 0.154 M’NaCl.
NaCl Hb
UPe71.
0.154 0.151 0.148 0.140 0.135 0.137 0.148 0.144
gnz. per 1.
49.6 48.6 47.7 45.0 43.4 44.1 48.6 46.5
-
,
n
Acid (-) or base (+)
per gm. Hb total
:= reduced)*
dlli-quiwlen
0 +0 ,042 +0 ,085 +0.214 +o ,308 +0.260 -0.081 -0.136
t
PH
Reduced oxy-
6.675 6.596 6.935 6.84 7.22(?) 6.895 7.915 7.760 8.45(?) 8.45 8.17 8.08 5.99 6.04 5.515 5.58
-
1
r
-
Acid (-) or base (+)
xr sm. HbOz active’
nilli-equivalent
+:.042 +o ,085 +0.215 +o ,308 +0 ,260 -0.081 -0.136
* Subtract 0.023 unit to make the zero point coincide with the isoelectric point of reduced Hb, pH 6.81.
TABLE II
Experiment 2
Total nitrogen = 109.0 mg. per 10 cc. - 64.5 gm. of Hb per liter. O2 capacity = 8.58 volumes per cent - 64.0 gm. of Hb per liter. Percentage Hb inactive = 1.0. Salt concentration (stock solution) = 0.154 M NaCl.
NaCl Hb
PH At:,’ T j p
Reduced oxy- per gm. HbOs
active’
Y per 2. gm. per 1. milli-equivalent milli-equivalent
0.154 64.5 0 6.773 6.601 0 0.149 62.5 -0.054 6.382 6.400 -0.054 0.143 60.0 -0.119 5.910 5.962 -0.119 0.148 62.0 +o ,070 7.26 7.046 +o ,070 0.143 59.7 +0.132 7.545 7.356 +0.132 0.137 57.3 +0.264 7.905 7.773 +0.264 0.132 55.3 +o.no 8.360 8.246 +0 ,270 0.129 53.9 +0.326 8.98 9.00 +0.326
* Subtract 0.006 unit to make the zero point coincide with the isoelectric point of reduced Hb, pH 6.81.
by guest on June 17, 2018http://w
ww
.jbc.org/D
ownloaded from
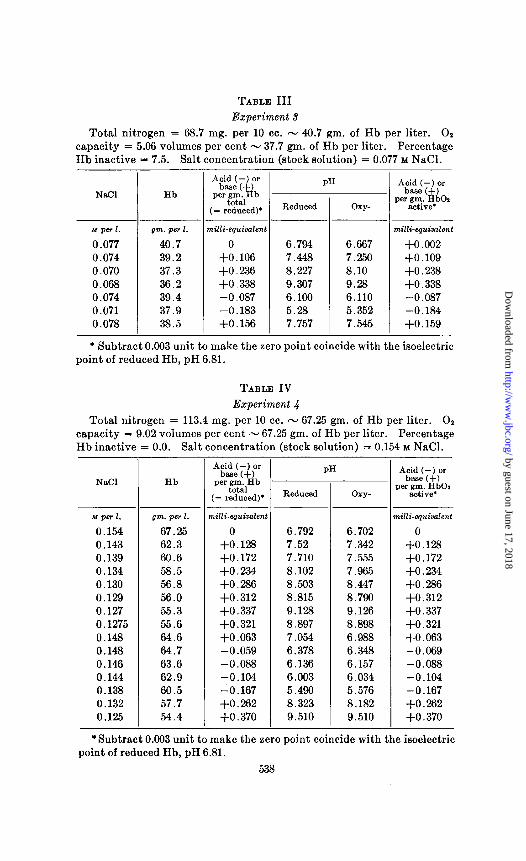
TABLE III Experiment d
Total nitrogen = 68.7 mg. per 10 cc. - 40.7 gm. of Hb per liter. 01 capacity = 5.06 volumes per cent - 37.7 gm. of Hb per liter. Percentage Hb inactive = 7.5. Salt concentration (stock solution) = 0.077 M NaCl.
NaCl Hb
Afp&-I. qm. per 1.
0.077 40.7 0.074 39.2 0.070 37.3 0.068 36.2 0.074 39.4 0.071 37.9 0.078 38.5
Acid (-) or base (+I
~ey;lHb
(= reduced)*
milli-equimlen1
+:.106 +0 ,236 +o ,338 -0.087 -0.183 +0 .156
PH
Reduced oxy-
6.794 6.667 7.448 7.250 8.227 8.10 9.307 9.28 6.100 6.110 5.28 5.352 7.757 7.545
milli-equivalent
+o .002
+0.109 +0 ,238 +0 ,338 -0.087 -0.184 +o. 159
* Subtract 0.003 unit to make the zero point coincide with the isoelectric point of reduced Hb, pH 6.81.
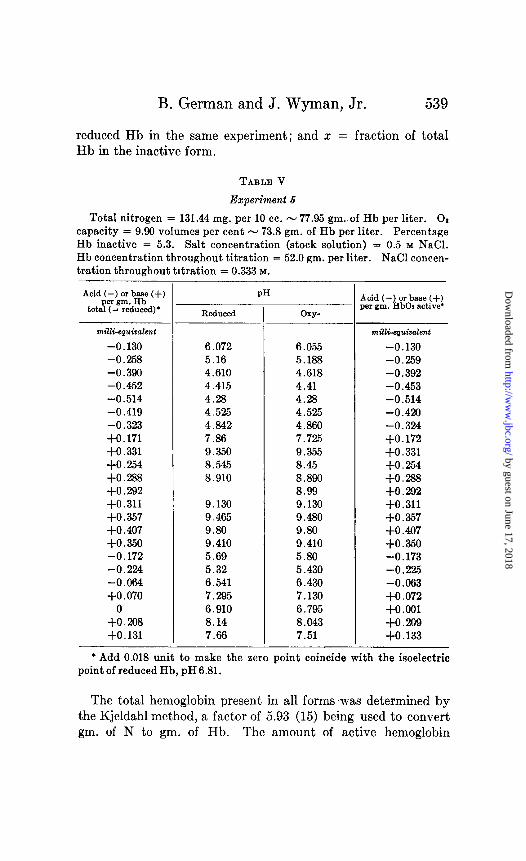
TABLE IV Experiment 4
Total nitrogen = 113.4 mg. per 10 cc. - 67.25 gm. of Hb per liter. 02 capacity = 9.02 volumes per cent - 67.25 gm. of Hb per liter. Percentage Hb inactive = 0.0. Salt concentration (stock solution) = 0.154 M NaCl. -
- It
PH Acid (-) or NaCl Hb base (f)
Reduced oxy- P= wyi.$bO~
._ MPWl. gm. per 1. nilli-equivalent 0.154 67.25 6.792 6.702 0.143 62.3 7.52 7.342 +L3 0.139 60.6 7.710 7.555 +0.172 0.134 58.5 8.102 7.965 +0.234 0.130 56.8 8.503 8.447 +0.286 0.129 56.0 8.815 8.796 +0.312 0.127 55.3 9.128 9.126 +0.337 0.1275 55.6 8.897 8.898 +0.321 0.148 64.6 7.054 6.988 +0.063 0.148 64.7 6.378 6.348 -0.069 0.146 63.6 6.136 6.157 -0.088 0.144 62.9 6.003 6.034 -0.104 0.138 60.5 5.490 5.576 -0.167 0.132 57.7 8.323 8.182 +0.262 0.125 54.4 9.510 9.510 +o ,370
*Subtract 0.003 unit to make the zero point coincide with the isoelectric point of reduced Hb, pH 6.81.
538
nil&equbaler
0
+0.128 +0.172 +0.234 +0.286 +0.312 +0.337 +0.321 +0.063 -0.059 -0.088 -0.104 -0.167 +0 .262 +o ,370
by guest on June 17, 2018http://w
ww
.jbc.org/D
ownloaded from
B. German and J. Wyman, Jr. 539
reduced Hb in the same experiment; and x = fraction of total Hb in the inactive form.
TABLE V
Experiment 6
Total nitrogen = 131.44 mg. per 10 cc. - 77.95 gm. of Hb per liter. 02 capacity = 9.90 volumes per cent - 73.8 gm. of Hb per liter. Percentage Hb inactive = 5.3. Salt concentration (stock solution) = 0.5 M NaCl. Hb concentration throughout titration = 52.0 gm. per liter. NaCl concen- tration throughout titration = 0.333 M.
Acid ‘,‘,A bmg (+) tot s (- re&d)*
nizzi-equivalent
-0.130 -0.258 -0.390 -0.452 -0.514 -0.419 -0.323 +0.171 +o .331 +0.254 +0.288 +0.292 +0.311 +0.357 +0.407 +0.350 -0.172 -0.224 -0.064 +o .070
0 +0.208 +o. 131
PH
RedUCed
6.072 5.16 4.610 4.415 4.23 4.525 4.842 7.86 9.350 8.545 8.910
9.130 9.465 9.80 9.410 5.69 5.32 6.541 7.295 6.910 8.14 7.66
Ory-
6.055 5.188 4.618 4.41 4.28 4.525 4.860 7.725 9.355 8.45 8.896 8.99 9.130 9.480 9.80 9.410 5.80 5.430 6.430 7.130 6.795 8.043 7.51
4cid (-) or base (+) er gm. HbOt active*
mitzi-equioazent
-0.130 -0.259 -0.392 -0.453 -0.514 -0.426 -0.324 +0.172 +0.331 +0.254 +0.238 +0.292 +0.311 +o ,357 +0.407 +0.350 -0.173 -0.225 -0.063 +0.072 +o .OOl +0.209 +0.133
* Add 0.018 unit to make the zero point coincide with the isoelectric point of reduced Hb, pH6.81.
The total hemoglobin present in all forms ,was determined by the Kjeldahl method, a factor of 5.93 (15) being used to convert gm. of N to gm. of Hb. The amount of active hemoglobin
by guest on June 17, 2018http://w
ww
.jbc.org/D
ownloaded from
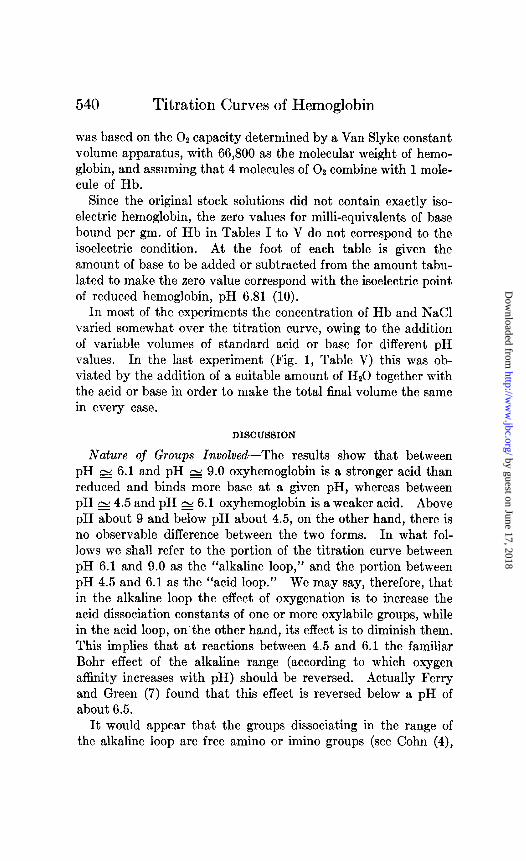
540 Titration Curves of Hemoglobin
was based on the 02 capacity determined by a Van Slyke constant volume apparatus, with 66,800 as the molecular weight of hemo- globin, and assuming that 4 molecules of 02 combine with 1 mole- cule of Hb.
Since the original stock solutions did not contain exactly iso- electric hemoglobin, the zero values for milli-equivalents of base bound per gm. of Hb in Tables I to V do not correspond to the isoelectric condition. At the foot of each table is given the amount of base to be added or subtracted from the amount tabu- lated to make the zero value correspond with the isoelectric point of reduced hemoglobin, pH 6.81 (10).
In most of the experiments the concentration of Hb and NaCl varied somewhat over the titration curve, owing to the addition of variable volumes of standard acid or base for different pH values. In the last experiment (Fig. 1, Table V) this was ob- viated by the addition of a suitable amount of Hz0 together with the acid or base in order to make the total final volume the same in every case.
DISCUSSION
Nature of Groups Involved-The results show that between pH s 6.1 and pH E 9.0 oxyhemoglobin is a stronger acid than reduced and binds more base at a given pH, whereas between pH g 4.5 and pH G 6.1 oxyhemoglobin is a weaker acid. Above pH about 9 and below pH about 4.5, on the other hand, there is no observable difference between the two forms. In what fol- lows we shall refer to the portion of the titration curve between pH 6.1 and 9.0 as the “alkaline loop,” and the portion between pH 4.5 and 6.1 as the “acid loop.” We may say, therefore, that in the alkaline loop the effect of oxygenation is to increase the acid dissociation constants of one or more oxylabile groups, while in the acid loop, on the other hand, its effect is to diminish them. This implies that at reactions between 4.5 and 6.1 the familiar Bohr effect of the alkaline range (according to which oxygen afllnity increases with pH) should be reversed. Actually Ferry and Green (7) found that this effect is reversed below a pH of about 6.5.
It would appear that the groups dissociating in the range of the alkaline loop are free amino or imino groups (see Cohn (4),
by guest on June 17, 2018http://w
ww
.jbc.org/D
ownloaded from
B. German and J. Wyman, Jr. 541
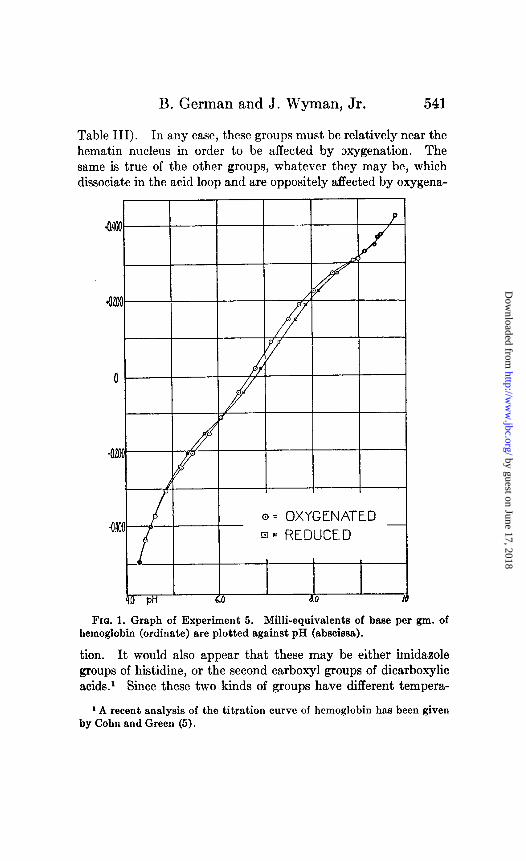
Table III). In any case, these groups must be relatively near the hematin nucleus in order to be affected by oxygenation. The same is true of the other groups, whatever they may be, which dissociate in the acid loop and are oppositely affected by oxygena-
o = OXYGENATED o = OXYGENATED
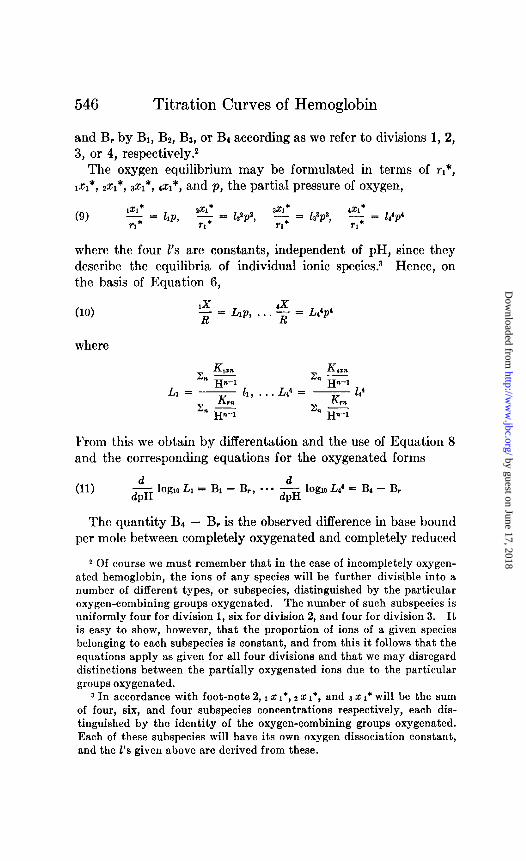
I
Fro. 1. Graph of Experiment 5. Milli-equivalents of base per gm. of hemoglobin (ordinate) are plotted against pH (abscissa).
tion. It would also appear that these may be either imidazole groups of histidine, or the second carboxyl groups of dicarboxylic acids.’ Since these two kinds of groups have different tempera-
1 A recent analysis of the titration curve of hemoglobin has been given by Cohn and Green (5).
by guest on June 17, 2018http://w
ww
.jbc.org/D
ownloaded from
542 Titration Curves of Hemoglobin
ture coefficients, it would be of interest in this connection to know the effect of temperature on the phenomenon. Certainly it is reasonable to expect that the groups affected in the alkaline loop are of a different nature from those in the acid loop, since oxygena- tion affects them oppositely and because of the range of pH.
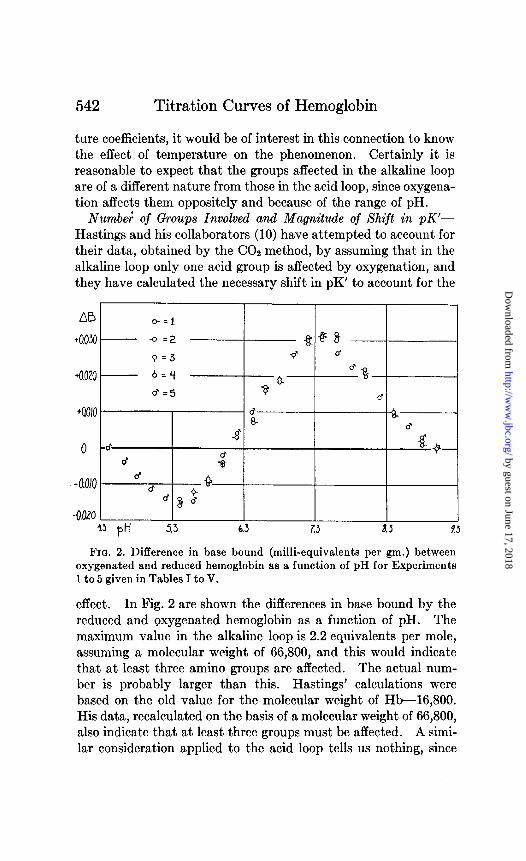
Numbe; of Groups Involved and Magnitude of Shift in pK’- Hastings and his collaborators (10) have attempted to account for their data, obtained by the CO2 method, by assuming that in the alkaline loop only one acid group is affected by oxygenation, and they have calculated the necessary shift in pK’ to account for the
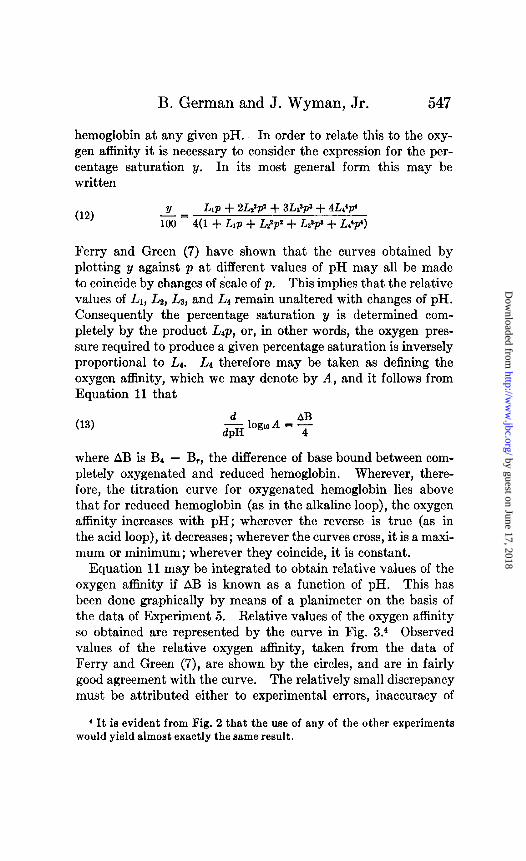
A0
+0050
+a020
‘QOIO
0
- O.Q/O
-O.Of?O
l-
I-
J $3 pH 5.3 63 23 a.3 L3
FIQ. 2. Difference in base bound (milli-equivalents per pm.) between oxygenated and reduced hemoglobin as a function of pH for Experiments 1 to 5 given in Tables I to V.
effect. In Fig. 2 are shown the differences in base bound by the reduced and oxygenated hemoglobin as a function of pH. The maximum value in the alkaline loop is 2.2 equivalents per mole, assuming a molecular weight of 66,800, and this would indicate that at least three amino groups are affected. The actual num- ber is probably larger than this. Hastings’ calculations were based on the old value for the molecular weight of Hb-16,800. His data, recalculated on the basis of a molecular weight of 66,800, also indicate that at least three groups must be affected. A simi- lar consideration applied to the acid loop tells us nothing, since
by guest on June 17, 2018http://w
ww
.jbc.org/D
ownloaded from
B. German and J. Wyman, Jr. 543
the maximum difference is 1 equivalent per mole of Hb, and we know that in any case at least one group must be involved. In view of the complications of the situation-the overlapping of effects of different groups, the number of groups possibly affected, and pK’ shifts of different magnitudes-it seems futile to attempt any further analysis of this sort.
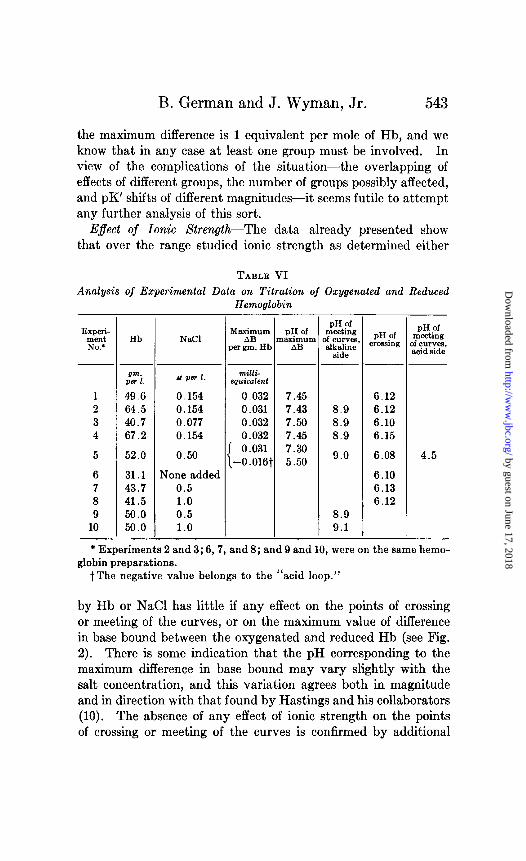
E$ect of Ionic Strength-The data already presented show that over the range studied ionic strength as determined either
TABLE VI Analysis of Experimental Data on Titration of Oxygenated and Reduced
Hemoglobin
Experi- ment No.’
am. pm 1.
49.6 64.5 40.7 67.2
5 52.0
6 31.1 7 43.7 8 41.5 9 50.0
10 50.0
-
Hb NaCl
Afpetl.
0.154 0.154 0.077 0.154
0.50
gone added 0.5 1.0 0.5 1.0
Maximum pH of AB maximun
per gm. Hb AB
~~ milli-
equimlent
0.032 7.45 0.031 7.43 0.032 7.50 0.032 7.45
r 0.031 7.30 (-0.016t 5.50
pH of meeting f c”*YeE alkaline
side
8.9 8.9 8.9
9.0
8.9 9.1
-
-
pH of crossing
6.12 6.12 6.10 6.15
6.08
6.10 6.13 6.12
-
0
1
-
-
* Experiments 2 and 3; 6,7, and 8; and 9 and 10, were on the same hemo- globin preparations.
t The negative value belongs to the “acid loop.”
by Hb or NaCl has little if any effect on the points of crossing or meeting of the curves, or on the maximum value of difference in base bound between the oxygenated and reduced Hb (see Fig. 2). There is some indication that the pH corresponding to the maximum difference in base bound may vary slightly with the salt concentration, and this variation agrees both in magnitude and in direction with that found by Hastings and his collaborators (10). The absence of any effect of ionic strength on the points of crossing or meeting of the curves is confirmed by additional
by guest on June 17, 2018http://w
ww
.jbc.org/D
ownloaded from
Titration Curves of Hemoglobin
observations (Experiments 6 to 10) over a narrower pH range, but extending up to greater values of ionic strength. An analysis of the entire situation is presented in Table VI.
It is probably to be expected that the points of crossing and of meeting of the curves should be independent of ionic strength, since wherever the amounts of base bound are the same, the numbers of charges are likewise the same for the oxygenated and reduced hemoglobin molecules, and the effect of salts on their activities should therefore be very nearly the same also.
Theoretical Interpretation-As we have seen, it was pointed out by Henderson on the basis of Equation 1 that the effect of oxy- genation in increasing the acid dissociation constant of hemo- globin in the alkaline loop implies a reciprocal effect involving a decrease of oxygen affinity with hydrogen ion concentration in the same region. In the acid loop, where the effect of oxygena- tion is reversed, we should expect the effect of hydrogen ion concentration on the oxygen affinity to be reversed also. At the pH of the point of crossing, therefore, the oxygen affinity should be a minimum.
This result may be derived in more exact form on the basis of a general treatment. We may regard all the dissociable groups in the hemoglobin molecules as acid groups and express their disso- ciation in terms of acid dissociation constants. Further, we may separate the molecules into five main divisions designated 0, 1, 2, 3, 4, according to the number of oxygen molecules with which they are combined. We will consider first division 0, comprising the completely reduced hemoglobin molecules. These will be represented by a variety of ionic forms whose relative proportions are determined at any given pH. We may class these ions ac- cording to the number of hydrogen ions dissociated, or equivalents of base bound, by each: for members of the first class the number is 0; for members of the second class, 1; for members of the nth class, n - 1. In general in any class there will be a number of different ionic species characterized by the identity of the par- ticular groups ionized. Members of any particular species of the nth class will be in equilibrium with the members of a correspond- ing species of the (n - 1) class in accordance with a relation
(3) kr,-t
r. = - H
by guest on June 17, 2018http://w
ww
.jbc.org/D
ownloaded from
B. German and J. Wyman, Jr. 545
where r, and T,,-~ denote the concentrations of the ions of the two species, H refers to hydrogen ion activity, and k is a constant. It is convenient to express the concentration of the ions of every species in terms of the concentration of the ions of an arbitrarily chosen species of the first class, rl*
(4)
The concentration of all ions of the nth class is then
(51
where the summation extends over all species of this class and K,, = Zk,,; and the total concentration of ions of all species and all classes is
03
Since the concentration of base bound by ions of the nth class is (n - l)R,, it follows that the total number of equivalents of base bound per mole of reduced hemoglobin is
z (n-1)Km n
(7) B, = Hn-1
2” 55 H”-’
This may be alternatively written as
(8)
Exactly the same treatment is applicable to each of the other four divisions, and we may use the same expression for the base bound, if we replace r (R) by G(~X), zr(zX), &3X), or 45(4X)
by guest on June 17, 2018http://w
ww
.jbc.org/D
ownloaded from
546 Titration Curves of Hemoglobin
and B, by B1, Bz, Ba, or Bq according as we refer to divisions 1, 2, 3, or 4, respectively.2
The oxygen equilibrium may be formulated in terms of Q*, 1z1*, 2~1*, 3~1*, GQ*, and p, the partial pressure of oxygen,
(9)
where the four l’s are constants, independent of pH, since they describe the equilibria of individual ionic species.3 Hence, on the basis of Equation 6,
(10) IX - = L,p, . . . $f R
= L4’p’
where
K 2, Lz!!
11, . . . L2 = Hn-1
2: Km 14’
“H”-1
From this we obtain by differentation and the use af Equation 8 and the corresponding equations for the oxygenated forms
(11) dlog,,L1=B1-B,,-.. dpH
cH logto L1’ = B4 - B,
The quantity Bh - B, is the observed difference in base bound per mole between completely oxygenated and completely reduced
2 Of course we must remember that in the case of incompletely oxygen- ated hemoglobin, the ions of any species will be further divisible into a number of different types, or subspecies, distinguished by the particular oxygen-combining groups oxygenated. The number of such subspecies is uniformly four for division 1, six for division 2, and four for division 3. It is easy to show, however, that the proportion of ions of a given species belonging to each subspecies is constant, and from this it follows that the equations apply as given for all four divisions and that we may disregard distinctions between the partially oxygenated ions due to the particular groups oxygenated.
3 In accordance with foot-note 2,1 x I*, 2 x I*, and 3 x I* will be the sum of four, six, and four subspecies concentrations respectively, each dis- tinguished by the identity of the oxygen-combining groups oxygenated. Each of these subspecies will have its own oxygen dissociation constant, and the l’s given above are derived from these.
by guest on June 17, 2018http://w
ww
.jbc.org/D
ownloaded from
B. German and J. Wyman, Jr. 547
hemoglobin at any given pH. In order to relate this to the oxy- gen aflinity it is necessary to consider the expression for the per- centage saturation y. In its most general form this may be written
(12) !J Lip + 2Ls2p~ + 3L9PS + 4L44P4
loo = 4(1 + LIP + L&l* + L2P8 + UP’)
Ferry and Green (7) have shown that the curves obtained by plotting y against p at different values of pH may all be made to coincide by changes of scale of p. This implies that the relative values of L,, Lz, Ls, and Ld remain unaltered with changes of pH. Consequently the percentage saturation y is determined com- pletely by the product L4p, or, in other words, the oxygen pres- sure required to produce a given percentage saturation is inversely proportional to La. La therefore may be taken as defining the oxygen afhnity, which we may denote by A, and it follows from Equation 11 that
where AB is Bd - B,, the difference of base bound between com- pletely oxygenated and reduced hemoglobin. Wherever, there- fore, the titration curve for oxygenated hemoglobin lies above that for reduced hemoglobin (as in the alkaline loop), the oxygen affinity increases with pH; wherever the reverse is true (as in the acid loop), it decreases; wherever the curves cross, it is a maxi- mum or minimum; wherever they coincide, it is constant.
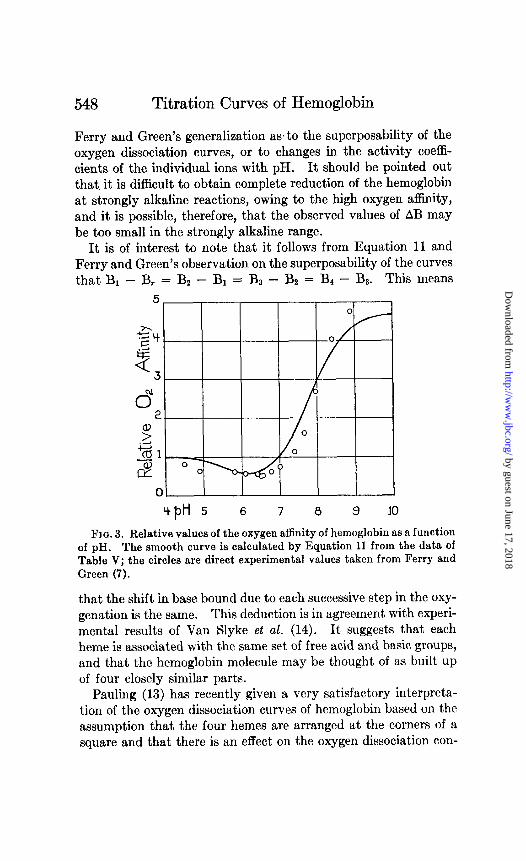
Equation 11 may be integrated to obtain relative values of the oxygen affinity if AB is known as a function of pH. This has been done graphically by means of a planimeter on the basis of the data of Experiment 5. Relative values of the oxygen affinity so obtained are represented by the curve in Fig. 3.4 Observed values of the relative oxygen affinity, taken from the data of Ferry and Green (7), are shown by the circles, and are in fairly good agreement with the curve. The relatively small discrepancy must be attributed either to experimental errors, inaccuracy of
4 It is evident from Fig. 2 that the use of any of the other experiments would yield almost exactly the same result.
by guest on June 17, 2018http://w
ww
.jbc.org/D
ownloaded from
548 Titration Curves of Hemoglobin
Ferry and Green’s generalization as to the superposability of the oxygen dissociation curves, or to changes in the activity coefli- cients of the individual ions with pH. It should be pointed out that it is difficult to obtain complete reduction of the hemoglobin at strongly alkaline reactions, owing to the high oxygen affiity, and it is possible, therefore, that the observed values of AB may be too small in the strongly alkaline range.
It is of interest to note that it follows from Equation 11 and Ferry and Green’s observation on the superposability of the curves that B1 - B, = Bz - B1 = BD - Bz = Bk - B3. This means
+pH 5 6 7 8 3 IO
Fro. 3. Relative values of the oxygen affinity of hemoglobin as a function of pH. The smooth curve is calculated by Equation 11 from the data of Table V; the circles are direct experimental values taken from Ferry and Green (7).
that the shift in base bound due to each successive step in the oxy- genation is the same. This deduction is in agreement with experi- mental results of Van Slyke et al. (14). It suggests that each heme is associated with the same set of free acid and basic groups, and that the hemoglobin molecule may be thought of as built up of four closely similar parts.
Pauling (13) has recently given a very satisfactory interpreta- tion of the oxygen dissociation curves of hemoglobin based on the assumption that the four hemes are arranged at the corners of a square and that there is an effect on the oxygen dissociation con-
by guest on June 17, 2018http://w
ww
.jbc.org/D
ownloaded from
B. German and J. Wyman, Jr. 549
stant of each due to the oxygenation of an adjacent heme but not to that of the one situated at the opposite corner. This leads to the equation
(14) 31 Lp + (2.x + l)L2pa + 3oiLL’pS + dLdp4
iKi= 1 + 4Lp + (4a + 2)LZpZ + 4aZLJp3 + c+Ldp”
where L denotes the oxygen dissociation constant of a single heme when the adjacent hemes are unoxygenated and (Y (inde- pendent of pH) measures the effect on L of the oxygenation of one adjacent heme. This equation fits the facts very exactly. It is of course a special case of Equation 12 and is in accordance with Ferry and Green’s observation on the superposability of the curves at different pH values. L corresponds to L,/4 in Equation 11, and its change with pH is therefore given by
AB ?- log,, L = 4 dpH
If we denote by AF the free energy increase accompanying the oxygenation of a single heme, then
dAF - = -2.3()26Ay dpH
By graphical integration on the basis of the data of Experiment 5 we find that AF decreases (at 25”) by 1190 calories between pH 6.05, the point of crossing of the curves, and pH 9.13, the point at which the curves come together on the alkaline side; and by 330 calories between pH 6.05 and 4.58, the point at which the curves come together on the acid side.
SUMMARY
By the use of the glass electrode titration curves of oxygenated and reduced hemoglobin have been obtained over a range of pH from about 4.3 to 9.5. Between pH 6.08 to 6.15 and pH 4.5 re- duced hemoglobin is a stronger acid than oxyhemoglobin; between pH 6.08 to 6.15 and pH 8.9 to 9.1 the opposite is true. The difference in base bound between reduced and oxyhemoglobin at a given pH is little if at all affected by ionic strength in the range studied. An expression has been developed by which it is possible
by guest on June 17, 2018http://w
ww
.jbc.org/D
ownloaded from
550 Titration Curves of Hemoglobin
to predict with fair success the relative values of the oxygen affinity as a function of pH from the data giving the two titration curves. The derivation of this expression presupposes only the most general feature of the oxygen dissociation curves; namely, that the curves obtained at different values of pH may all be made to coincide by a change of scale of the partial pressure of oxygen. If we accept Pauling’s interpretation of the oxygen dissociation curve, this expression makes it possible to calculate from the present data the change with pH of the free energy of oxygenation of a single heme group in the hemoglobin molecule.
BIBLIOGRAPHY
1. Bohr, C., Hasselbalch, K., and Krogh, A., Skand. Arch. Physiol., 16,402 (1904).
2. Christiansen, J., Douglas, C. G., and Haldane, J. S., J. Physiol., 46, 244 (1914).
3. Clark, W. M., The determination of hydrogen ions, Baltimore, 3rd edition, 210-212 (1928).
4. Cohn, E. J., Ergebn. Physiol., 33,781 (1931). 5. Cohn, E. J., and Green, A. A., J. Am. Chem. Sot., in press. 6. Du Bridge, L. A., Rev. Scient. Instruments, 4,532 (1933). 7. Ferry, R. M., and Green, A. A., J. Biol. Chem., 61,175 (1929). 8. Fieser, L. F., J. Am. Chem. Sot., 46,2639 (1924). 9. Hastings, A. B., Sendroy, J., Jr., Murray, C. D., and Heidelberger, M.,
J. Biol. Chem., 61,317 (1924). 10. Hastings, A. B., Van Slyke, D. D., Neill, J. M., Heidelberger, M., and
Harington, C. R., J. BioZ. Chem., 60,89 (1924). 11. Henderson, L. J., J. BioZ. Chem., 41,401 (1920). 12. MacInnes, D. A., and Dole, M. J., J. Am. Chem. Sot., 62,29 (1930). 13. Pauling, L., Proc. Nat. Acad. SC., 21,186 (1935). 14. Van Slyke, D. D., Hastings, A. B., and Neill, J. M., J. BioZ. Chem., 64,
507 (1922). 15. Vickery, H. B., and Leavenworth, C. S., J. Biol. Chem., 79, 377 (1928).
by guest on June 17, 2018http://w
ww
.jbc.org/D
ownloaded from
Bernard German and Jeffries Wyman, Jr.HEMOGLOBIN
OXYGENATED AND REDUCED THE TITRATION CURVES OF
1937, 117:533-550.J. Biol. Chem.
http://www.jbc.org/content/117/2/533.citation
Access the most updated version of this article at
Alerts:
When a correction for this article is posted•
When this article is cited•
alerts to choose from all of JBC's e-mailClick here
tml#ref-list-1
http://www.jbc.org/content/117/2/533.citation.full.haccessed free atThis article cites 0 references, 0 of which can be
by guest on June 17, 2018http://w
ww
.jbc.org/D
ownloaded from