Embed Size (px)
Citation preview
The Timing of Promotion to Top Management in the U.S. and Japan: A Duration Analysis
Takao Kate* Larry W. Taylor**
Working Paper No. 12 1
July 1994
*Resident Scholar, The Jerome Levy Economics Institute and Associate Professor of Economics, Colgate University **Associate Professor of Economics, Lehigh University
Correspondence: Takao Kato The Jerome Levy Economics Institute
of Bard College PO Box 5000 Annandale-on-Hudson, NY 12504-5000 Phone: 914-758-7700 Fax: 914-758-l 149 Internet: [email protected]
ABSTRACT
This paper first develops a simple search model of the fhm seeking to choose a new CEO by using the promotion tournament. We then use the model to derive two empirical hypotheses concerning the duration of the tournament and its relationships to fkm size and observable signals of the contenders’ ability such as educational credentials. These hypotheses are tested by using unique micro data on recently completed tournaments of 695 leading corporations in the U.S. and 819 leading corporations in Japan. Further, the comparative nature of the data set allows us to contrast the relevance of the search model between the two nations. The estimates from our preferred specifications of a Weibull duration model provide evidence for the hypotheses in both the U.S. and Japan. Specifically, (i) larger firms are more likely to prolong the promotion tournament; (ii) when CEO contenders have less outside experience, the fkn is more likely to prolong the tournament; and (iii) when CEO contenders are not college graduates, the firm is more likely to prolong the tournament. Furthermore, contrary to the popular view, CEO contenders having strong college credentials (e.g., graduating from the University of Tokyo) do not significantly alter the fixm’s optimal stopping mle of the tournament in Japan, whereas, strong credentials do matter in the U.S.
1
THE TIMING OF PROMOTION TO TOP MANAGEMENT IN THE U.S. AND JAPAN: A Duration Analysis
I. Introduction
We develop a simple search model of the firm seeking to select its new CEO by using
the promotion tournament. We then use the model to derive two empirical hypotheses
concerning the duration of the tournament and its relationships to f7r-m size and observable signals
of the contenders’ ability such as educational credentials. These hypotheses are tested by using
unique micro data containing information on recently completed tournaments of 695 leading
corporations in the U.S. and 819 leading corporations in Japan.
The paper makes three distinct contributions. For the first time, we analyze the CEO
promotion tournament in .the U.S. and Japan using a duration model.’ Second, we generalize
the Weibull hazard so that the regressors need not have the same proportional effect at all dates.
A likelihood ratio statistic is then applied to determine whether the proportional hazard is
appropriate. Third, on our reading of the literature, the paper represents one of the first attempts
to model the tournament in the search theoretic i?amework.2
Our findings are of particular relevance concerning the Japanese economy. While diverse
theories as to the determinants of the postwar success of the Japanese economy have been
advanced, the matter remains controversial with competing views of alleged unique human
‘In the last few years we have witnessed a rather impressive emergence of econometric studies of top management compensation and turnover in Japan such as Anderson, Jayaraman, and Mandelker (1993), Ang and Constand (I 993), Kaplan (1992), Kaplan and Minton (1993), Kato and Rockel (1992), and Merck and Nakamura (1992). However, the focus of these studies has been on the incentive structure of top management compensation and turnover, and the influence of main banks and other firms in the same corporate group. None of these studies has examined promotion tournaments in Japanese firms.
‘A notable e xce p tion is O’Flaherty and Siow (1992).
2
resource management practices, superior industrial policy, and innovative production methods.
Recently Koike (1991) stresses the positive role played by the promotion policy of Japanese fimrs
in accounting for their competitiveness. He argues that Japanese firms tend to prolong the
promotion tournament longer than U.S. firms, resulting in more competition among employees
and more accumulation of firm-specific human capital.
We contribute to this important controversy by providing the first rigorous econometric
and comparative evidence on the promotion policy of top management. As emphasized by Koike
(1991), we find that Japanese firms do tend to prolong the promotion tournament relative to U.S.
firms. Furthermore, our search model of the tournament suggests that the difference in the
promotion policy between the two nations may be caused by the difference in: (i) time discount
rates; (ii) incentive effects of the promotion tournament; and (iii) adjustment costs of replacing
the incumbent CEOs.
The paper is organized as follows. In the next section, we develop a simple search model
of the promotion tournament, which wilI be used to guide our empirical analysis. Sections III
and IV derive two empirically testable hypotheses, while section V provides the basic empirical
strategy and describes the data. In section VI we present our main empirical results, and we
follow with concluding remarks.
Consider the firm seeking to choose its new CEO by using the promotion toumament.3
The firm acquires additional information on the ability of each contender by observing him in
“For the promotion tournament in general, see Milgrom and Roberts (1992; chapter 11) for instance. For recent applications of the idea of the promotion tournament to Japanese promotion policy, see Itoh (1991) and Prendergast (1992).
3
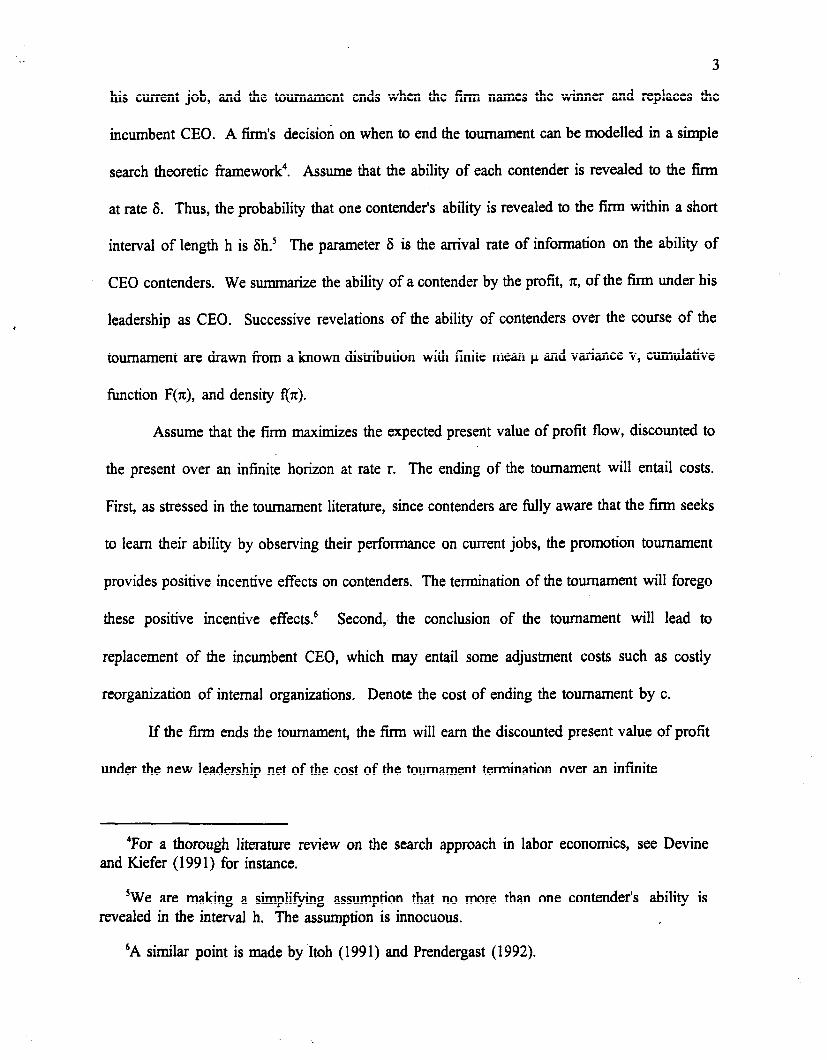
his current job, and the tournament ends when the firm names the winner and replaces the
incumbent CEO. A firms decision on when to end the tournament can be modelled in a simple
search theoretic framework4. Assume that the ability of each contender is revealed to the firm
at rate 6. Thus, the probability that one contender’s ability is revealed to the firm within a short
interval of length h is 6h.’ The parameter 6 is the arrival rate of information on the ability of
CEO contenders. We summariz e the ability of a contender by the profit, II, of the firm under his
leadership as CEO. Successive revelations of the ability of contenders over the course of the
tournament are drawn from a known distribution with finite mean p and variance v, cumulative
function F(z), and density f(x).
Assume that the firm maximizes the expected present value of profit flow, discounted to
the present over an infinite horizon at rate r. The ending of the tournament will entail costs.
First, as stressed in the tournament literature, since contenders are fully aware that the firm seeks
to learn their ability by observing their performance on current jobs, the promotion tournament
provides positive incentive effects on contenders. The termination of the tournament will forego
these positive incentive effects6 Second, the conclusion of the tournament will lead to
replacement of the incumbent CEO, which may entail some adjustment costs such as costly
reorganization of internal organizations. Denote the cost of ending the tournament by c.
If the firm ends the tournament, the firm will earn the discounted present value of profit
under the new leadership net of the cost of the tournament termination over an infinite
4For a thorough literature review on the search approach in labor economics, see Devine and Kiefer (1991) for instance.
‘We are making a simplifying assumption that no more than one contender’s ability is revealed in the interval h. The assumption is innocuous.
6A similar point is made by Itoh (199 1) and Prendergast (1992).
4
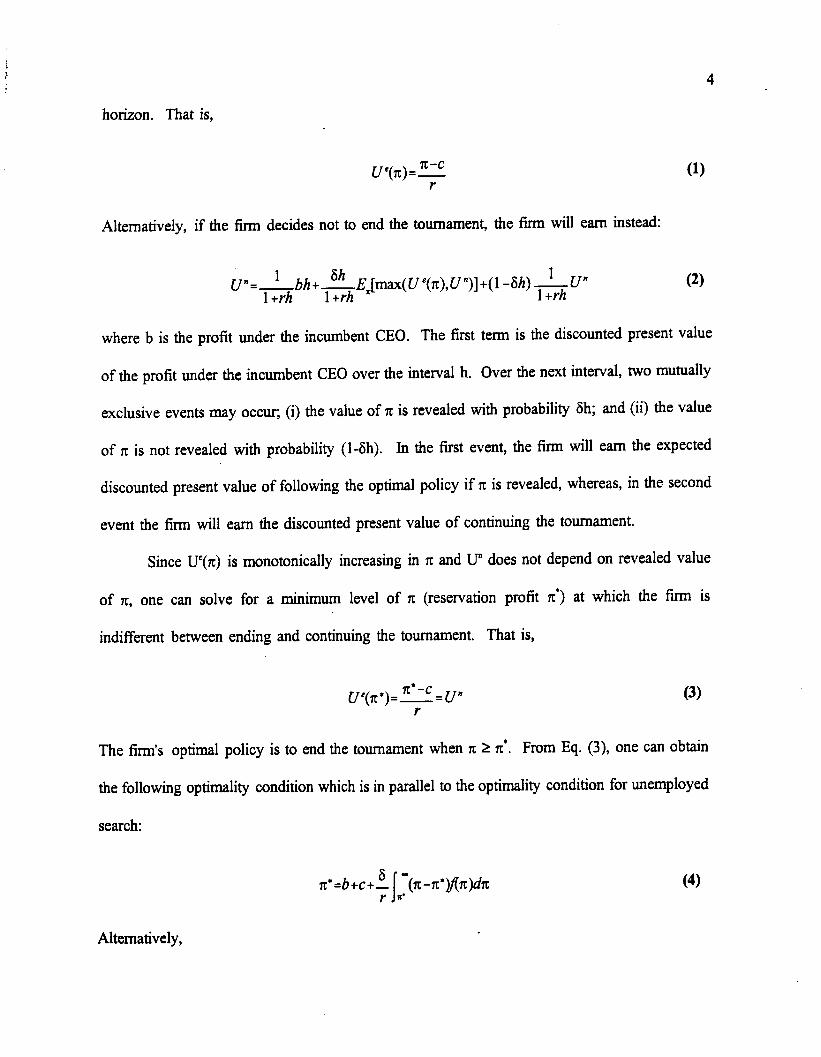
horizon. That is,
uyx)=y (1)
Alternatively, if the firm decides not to end the tournament, the f%m will earn instead:
’ U”=_ bh+ lib ~~Jm~(WO,Wl+(l -sh)-$-$J” l+rh +
(2)
where b is the profit under the incumbent CEO. The first term is the discounted present value
of the profit under the incumbent CEO over the interval h. Over the next interval, two mutually
exclusive events may occur; (i) the value of x is revealed with probability 6h; and (ii) the value
of n: is not revealed with probability (l-6h). In the first event, the firm will earn the expected
discounted present value of following the optimal policy if x is revealed, whereas, in the second
event the lirm will earn the discounted present value of continuing the tournament.
Since UC(X) is monotonically increasing in rt and u” does not depend on revealed value
of IL, one can solve for a minimum level of rr (reservation profit II*) at which the firm is
indifferent between ending and continuing the tournament. That is,
Uyn’)=q_P (3)
The firm’s optimal policy is to end the tournament when n: 2 x*. From Eq. (3), one can obtain
the following optimality condition which is in parallel to the optimaiity condition for unemployed
search:
(4)
Alternatively,
5
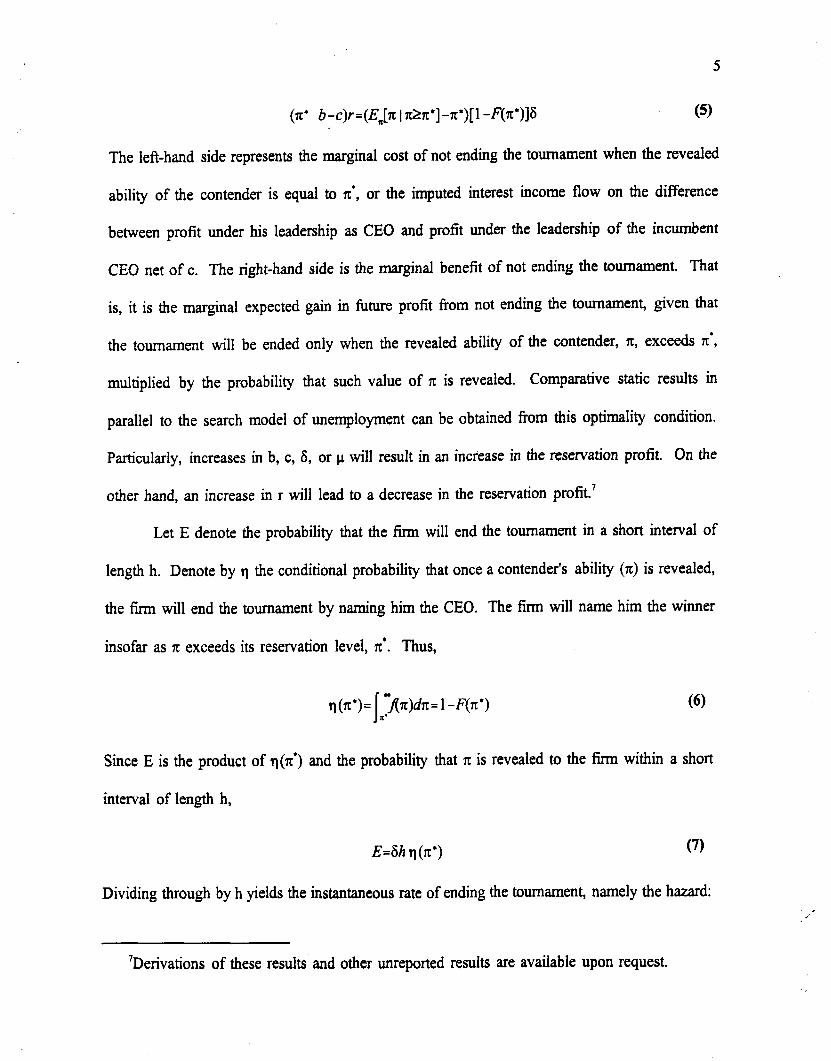
(TC’ b-c)r=(E,[n 1 rr&r*]-~*)[l -F(rr*)]6 (5)
The left-hand side represents the marginal cost of not ending the tournament when the revealed
ability of the contender is equal to x1, or the imputed interest income flow on the difference
between profit under his leadership as CEO and profit under the leadership of the incumbent
CEO net of c. The right-hand side is the marginal benefit of not ending the tournament. That
is, it is the marginal expected gain in future profit from not ending the tournament, given that
the tournament will be ended only when the revealed ability of the contender, II, exceeds 5c’,
multiplied by the probability that such value of 5c is revealed. Comparative static results in
parallel to the search model of unemployment can be obtained from this optimality condition.
Particularly, increases in b, c, 6, or u will result in an increase in the reservation profit. On the
other hand, an increase in r will lead to a decrease in the reservation profit.’
Let E denote the probability that the firm will end the tournament in a short interval of
length h. Denote by n the conditional probability that once a contender’s ability (x) is revealed,
the firm will end the tournament by naming him the CEO. The fitm will name him the winner
insofar as x exceeds its reservation level, 7c*. Thus,
(6)
Since E is the product of rt (z*) and the probability that x is revealed to the firm within a short
interval of length h,
E=6h q(d) (7)
Dividing through by h yields the instantaneous rate of ending the tournament, namely the hazard:
2,’
‘Derivations of these results and other unreported results are available upon request.
6
B=bq(zc’) (8)
Using Eq. (8) and Eq. (4), again one can obtain comparative statics results in close
analogy to those in the search model of unemployment. Specifically, an increase in b or c will
lead to a decrease in the hazard rate whereas an increase in r will result in an increase in the
hazard rate.
III. Firm Size and Hazard
By using the above search model, one can develop an empirically testable hypothesis
between firm size and the hazard rate. First, one can argue (ceteris paribus) that the cost of
ending the tournament, c, is greater for larger firms. The reasoning is that positive incentive
effects of the promotion tournament are less relevant for smaller firms since direct monitoring
(as opposed to indirect incentive devices such as the promotion tournament and deferred
payments) may be more feasible for these fitms8 The termination of the tournament may not
forego much of the incentive effects for those smaller firms. The replacement of the CEO can
also be carried out more smoothly in smaller firms where the internal organization of the firm
is less complex and less hierarchical.
Moreover, for Japanese firms, recent theoretical contributions in the literature of Japanese
corporate governance suggest that the system of financial corporate grouping (that is, grouping
of firms linked by their relationships to a main bank and by cross-holding of equity) allows large
Japanese firms to be relatively free from pressure from individual shareholders who are mostly
interested in short-term returns. It follows that large Japanese firms affiliated with financial
‘Similar arguments are developed for the incentive effects of profit sharing by Cable and Wilson (1990) and &use (1993).
7
corporate groups are more likely to pursue longer-term goals, thereby having a lower discount
rate, r.’ Since larger c and lower r results in a lower hazard
one can predict,
rate (as shown in the prior section),
H, (Firm Size and Hazard): the hazard will fall as fum size rises.
IV. SiPnals and Hazard
While a strict interpretation of our model implies random search, it is clear that firms will
most likely use some observable signals to decide which employees to include in the promotion
toumament.*o For example, educational qualifications and prior work experience may be used
to identify suitable candidates. Indeed, the firm may assume correctly that those with stronger
credentials and/or previous work experience will tend to be in the right-hand tail of f(x). Since
the firm knows who has stronger credentials and greater prior experience, it will be optimal for
the firm to closely monitor the progress of these talented individuals. In other words, when one
has a sample of tournament winners with varying educational credentials and prior work
experience,
H, (Signals and hazard): stronger educational credentials and greater prior experience wiIl
result in higher hazards.”
vor Japanese corporate groups, see Aoki (1988; chapter 4) for instance.
“On the issue of systematic versus random search, see for instance Salop (1973) and Kahn and Low (1988).
‘IOne can envision a more general model in which the firm’s decision is made in two stages. First, as modelled in the paper, given observable signals, the firm decides the optimal promotion policy. Second, given the optimal promotion policy, the firm selects the optimal pool of CEO promotion contenders in terms of their observable signals such as educational credentials and experiences by balancing the cost and benefit of selecting the pool with strong signals. One can view our analysis in the paper as a study of the optimal promotion policy, given the pool of optimally chosen contenders.
8
V. Data and Empirical Strategy
The Business Week CEO 1000 Special Issue (October 23, 1987) provides information
on the most recently completed CEO promotional tournament of 1,000 leading corporations in
the U.S., which were selected on the basis of their market equity values (share price multiplied
by number of shares outstanding) as of stock-market close, September 11,1987. The information
includes detailed personal characteristics of winners of the most recently completed tournaments
(or the current CEOs) such as educational credentials, experience prior to joining the present
firm, experience within the present firm prior to winning the promotion tournament, and
experience after winning the tournament. Merging the data with the usual accounting data that
we assembled from Moody’s and Standard and Poor’s, and eliminating observations with
missing data and those firms that chose the current CEO @ by the promotion tournament,‘2
we created a data base containing information of 695 leading U.S. corporations on the most
recently completed CEO promotional toumament and various company characteristics.
To create a comparable data set for Japan, we began calculating the market equity value
of all Japanese companies listed on Japan’s eight Stock Exchanges (there were nearly 2,000
companies listed in 1986), multiplying share price as of stock-market close, July 3 1, 1986, by
number of shares outstanding as of August 1, 1986. Data on share prices were taken from the
Weekly Toyo Keizai 1987 KABUKA SOR4N Special Issue (February 6, 1987), and data on
number of shares outstanding were taken from the Fall 1986 KAISHA SHIKJ HO, published
by the Oriental Economist. Based on these calculations, we selected the 1,000 most valuable
Japanese companies, and compiled biographical data on their current chief executives (shacho or
12We consider “not by promotion tournament” those firms that chose the current CEO by having the firm fo&d by the CEO or by bringing in an outsider as CEO. In either case, the tournament duration is zero.
9
todori)13, or winners of the most recently completed CEO tournaments, from the 1987 KAISHA
SHOKUIN ROKU (published by the Diamond) and
by the Oriental Economist). The resulting data
accounting data that we collected from the Weekly
the 1987 YAKUIN SHIKI HO (published
were further merged with the corporate
Toyo Keizai KABUKA SORAN Special
Issue (February 6, 1987), the Fall 1986 KAISHA SHIKI HO (published by the Oriental
Economist), and a computer tape DATA MAX prepared by the Oriental Economist. After
eliminating observations with missing data and founders and external recruits, our final sample
contains 8 19 observations.
Our data enable us to model the duration of tournaments defined as the time between the
year in which the tournament winner (or the current CEO) joined the firm and the year in which
he was selected as the CEO. Deducting backward from the fact that he did indeed eventually
become the CEO, we assume that the tournament resulting in selecting him must have begun
when he joined the firm_14
For this purpose, we specify the hazard function as Weibull, such that,
e(f) =aA”t ‘-I (9)
where the hazard, e(t), is time dependent unless a=l, in which case we have the Exponential
model (see Lancaster, 1990: 36). Moreover, we can allow for a heteroskedastic hazard by
allowing a and/or 1 to depend on time-invariant regressors. To date, almost all empirical
13Japanese banks call their chief executives “todori” whereas other Japanese companies call them “shacho”.
“This assumption is clearly consistent with institutional accounts of the Japanese promotion policy that employees are formally and informally categorized by the year in which they joined the firm and are subject to the same promotion process (See, for instance, Itoh, 199 1 and Prendergast, 1992). Note that the assumption is not valid for founders and external recruits that are excluded from the data.
10
applications that use the heteroskedastic Weibull hazard have allowed A (but not a) to vary with
the explanatory variables. The implication of this specification is that the proportionate effect
of each of the regressors on the hazard is the same regardless of the value of t. In this paper,
we test the latter specification by allowing both a and A. to depend upon regressors, and then we
test whether a is homoskedastic. If so, then we determine whether the Exponential reduction,
a= 1, appears valid.”
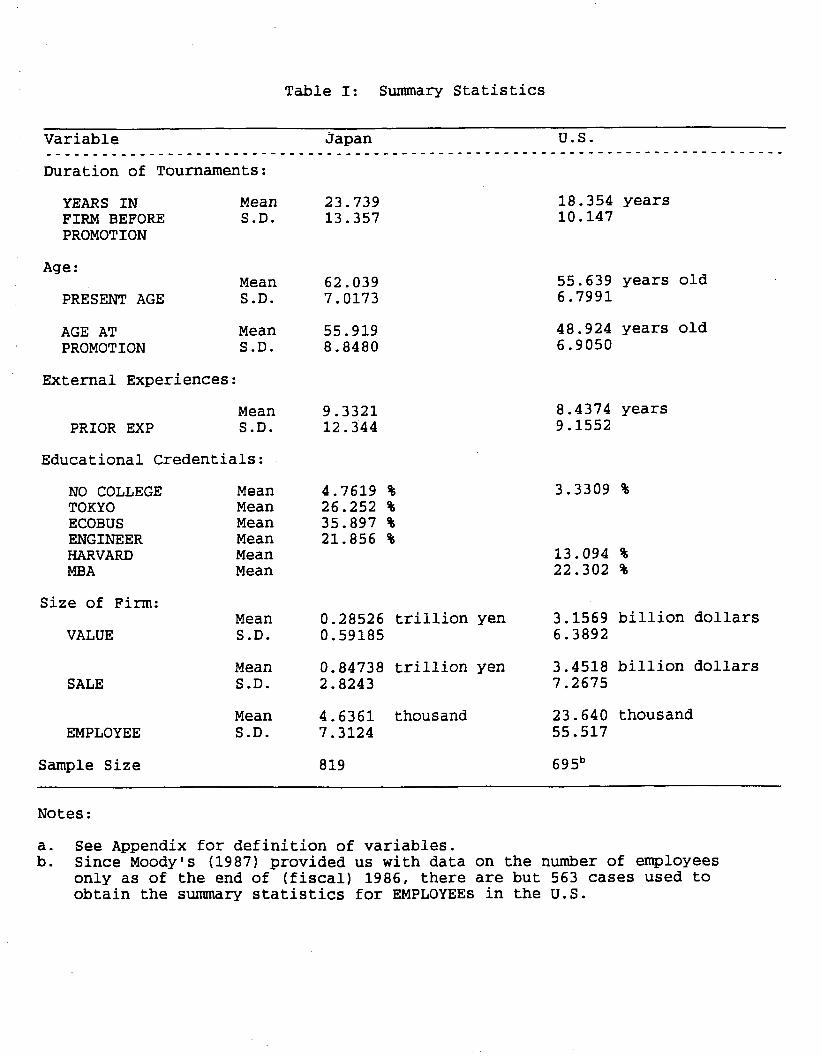
To test the first hypothesis concerning the relationship between rirm size and hazard, we
consider three alternative size variables: total sales (SALE), number of employees (EMPLOYEE),
and market value of the firm (VALUE). As shown in Table I, the average firm in our US sample
is significantly larger than the average firm in our Japanese sample. In fact, the average US firm
employs about five times more employees than the average Japanese firm.
For the second hypothesis concerning signals and hazard, the data allow us to consider
several variables. First, we create a dummy variable, NO COLLEGE, that equals unity if the
winner of the tournament holds no college degree and zero otherwise. Not too surprisingly, as
shown in Table I, nearly all winners in both nations are college graduates (95.2 percent of the
winners in the Japanese sample and 96.7 percent in the U.S. sample). This suggests that what
makes the difference among those CEO tournament contenders may not be whether they attended
college, but rather which college they attended. To capture this aspect of educational credential
“It is quite plausible that the incentive effects of the tournament, c will diminish as the tournament progresses, or c=c(t): c’c 0. As the tournament progresses, the size of the contender pool may decrease because a contender whose ability is revealed to the firm and is not chosen to be the winner will exit from the tournament. The incentive effects of the tournament will apply only to those who are still in the tournament. Second, the productivity of the incumbent CEO may well decline as time goes by due to the depreciation of his human capital, or b=b(t); b’< 0. Since it has been shown that the hazard is a decreasing function of c and b, it follows that increasing hazard (or positive duration dependence) is likely. In fact, that is what we find.
11
signal, we create a dummy variable, TOKYO (HARVARD for the U.S. sample), that equals to
unity if the winner of the tour&rent holds a college degree from the University of Tokyo
(Harvard University for the U.S. sample), and zero otherwise. As shown in Table I, 26.3 % of
all winners in the Japanese sample received their highest degrees from the University of Tokyo,
while 13.1% in the U.S. sample received their highest degrees from Harvard. Furthermore, the
data enable us to create for the Japanese sample two additional dummy variables - ECOBUS and
ENGINEER - where ECOBUS (ENGINEER) equals to unity if the winner of the tournament
holds a degree in Economics and/or business (in engineering), zero otherwise. Likewise, the data
allow us to create for the U.S. sample an additional dummy variable, MBA, that equals to unity
if the winner hoIds a degree of MBA, zero otherwise. Finally, for prior experience, the data
enable us to calculate the number of years spent after finishing an undergraduate degree (or
completing high school for those without college degrees) and before joining the present
company (PRIOR EXP).
Where possible, we employ a simple difference-in-means test to determine whether the
average value of a given variable in Japan is equal to that in the U.S. As is almost self-evident
from a casual reading of Table I, we reject the null hypothesis of equality in most cases. For
example, the average age at promotion is statistically different (and, in fact, higher) in Japan than
in the U.S. One notable exception to the rule, however, is prior experience. We do not reject
the null hypothesis (at the 10% significance level) that the average prior experience of Japanese
contenders is equal to the average prior experience of U.S. contenders. While it is tempting to
conclude from this finding that Japanese and American firms equahy value years of experience
outside the firm, the duration results presented in the next section lead to a different point of
view.
12
VI. Empirical Results
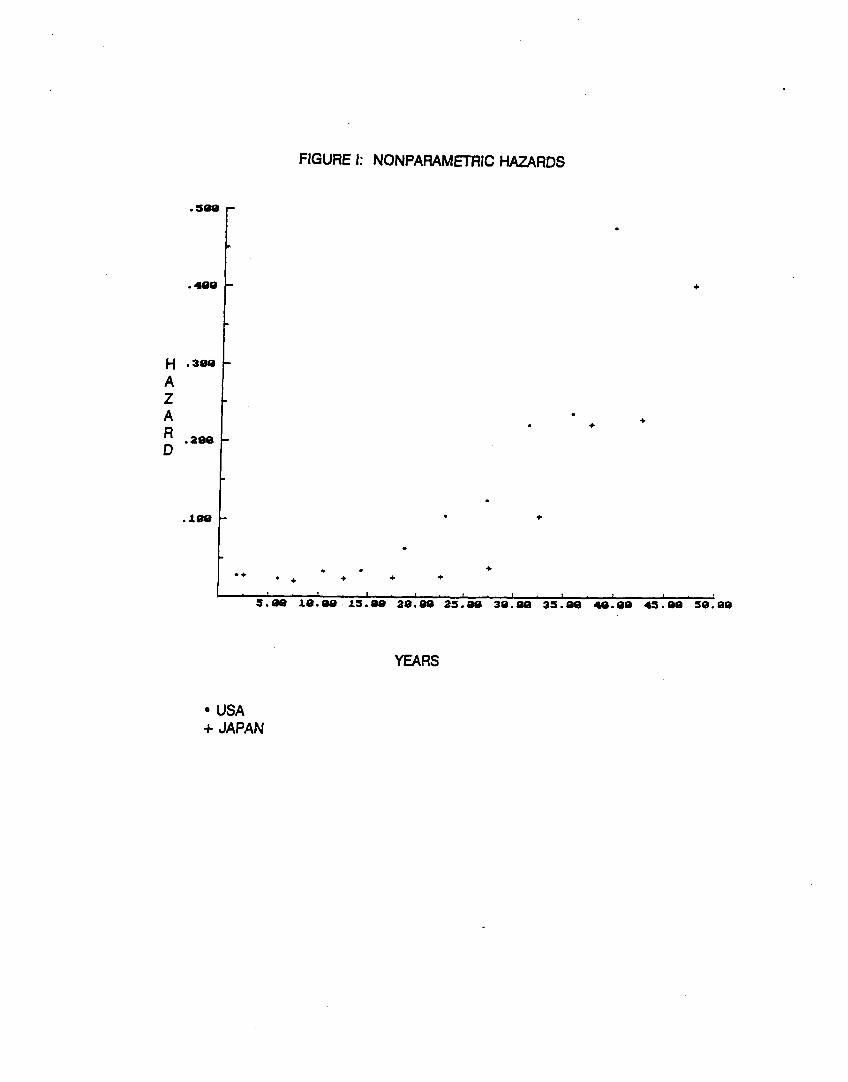
Our duration analysis begins with nonparametric estimation of the hazard functions for
the U.S. and Japan. We first estimated the survival curves (without regressors) by using
LIMDEP (1989). The nonparametric point estimates of the hazards at various durations are
summarized in Figure I. We immediately see that the hazards in both Japan and the U.S.
generally increase with duration, thereby indicating that the Weibull distribution (with a
monotonic hazard function) might be appropriate. As expected, the nonparametric z-test
proposed by Mudambi and Taylor (1991, eq. 3) has realized values of 22.24 and 2 1.3 1 for Japan
and the U.S., respectively, and we therefore reject constant transition probabilities at conventional
levels of significance. Indeed, our search model suggests that while firms will prolong
tournaments up to a point to enhance work effort and to reap quasi-rents from prior investments
in the incumbent CEO, eventually they must announce a new winner. The implication is for
eventual positive duration dependence. We also note that the hazard rates are generally higher
in the U.S. than in Japan at any given duration, which concurs with our prior
Because there is no censoring of our data, we are able to formulate
Weibull model in linear form (see Lancaster, 1990: 35),
expectation.
our (parametric)
where T is the completed duration and exp(U) follows the exponential distribution. As is
typically the case, we specify I = exp(-P’X) so that consistent estimates of fl can be obtained
by using ordinary least squares (OLS). Efficient estimates, however, are obtained only by using
maximum likelihood (ML) since the disturbances are non-normal.
The WeibuIl hazard is said to be heteroskedastic if l-varies with X; see Lancaster (1990).
13
However, it is clear that the above linear model will have heteroskedastic disturbances if a is
a function of a set of regressors, Z. Moreover, there appears no a priori reason to exclude the
possibility that the disturbances are indeed heteroskedastic. We therefore initially specify that
a = 1 /(a exp(yZ)“) and then test whether y=O. As discussed in the prior section,
homoskedastic disturbances (a=&) imply that the proportionate effect of each regressor on the
hazard is independent of duration. Furthermore, the constant-hazard Exponential model results
from the restriction that a=o=l.
Our preferred empirical model for the U.S. is found in Table II, while our results for
Japan are found in Table III.‘” For both countries, we present unrestricted maximum likelihood
estimates of 13
goodness-of-fit
observation in
and y, as well as those where y is restricted to be a vector of zeros. Our
measure, ?, is constructed by first calculating the expected duration for each
the sample [(see Lancaster (1990, p. 37)], and then correlating the expected
duration with the observed duration. This measure of fit is completely analogous to R* in the
classical linear regression model.
For the unrestricted models, we employed a general-to-specific modelling strategy to
determine which variables were important in the regression and skedastic functions for Japan and
the U.S., respectively. Likelihood ratio tests were used to determine which variables could be
dropped without affecting the validity of the empirical model. Since likelihood ratio tests also
strongly reject the restricted specification for both the U.S. and Japan, it appears that the
proportional Weibull model is inappropriate for these data. Rather, we find that VALUE and
PRIOR EXP are important variables for the U.S. skedastic function (i.e., the function that
16Due to extreme values, the variables VALUE, (VALUE)*, PRIOR EXP, (PRIOR EXP)*, SALE and (SALE)* have been resealed in order to condition the data for maximum likelihood estimation. Our conclusions are unchanged by the variable transformations.
describes movement in a), while SALE, EMPLOYEE,
dominant variables in the Japanese skedastic function.”
PRIOR EXP and ENGINEER
The variables VALUE, SALE
14
are
and
EMPLOYEE each measure the size of the fnm, and it is easy to believe that the distribution of
(log) durations around the conditional mean are different for smaller firms than for larger firms.
Furthermore, we find that the distribution of durations depends upon years of experience outside
the firm. For both the U.S. and Japan, we find that larger f%ms have smaller dispersion of’(log)
durations, and that (ceteris paribus) prior experience of the new CEO leads to greater uncertainty
as to the end of the promotion tournament. Finally, in Japan we find that it is easier to predict
the end of the promotion tournament for engineers than for others.
To ensure that our reduced unrestricted models (in Tables II and III) are congruent with
the data, we constructed residual plots and performed a diagnostic check on the integrated hazard
as described by Lancaster (1990, pp. 308-3 13). We found an exceptionally good fit for the U.S.,
and a good fit for Japan once we interacted the variable EMPLOYEE with a dummy to indicate
whether the tournament winner had prior experience.‘* Additionally, an influential data analysis
[see Taylor (1993)] revealed that those observations that have a larger impact on the estimated
coefficients and standard errors appear to be legitimate. Conditional upon the information set,
“The details of these tests and other unreported regression results are available from the authors upon request.
‘8The dummy variable to indicate whether the tournament winner had prior experience captures discrete differences between those who adhere strictly to the “lifetime employment ideal (working for the same firm for the entire working life) and the others. That the dummy variable is relevant to Japan yet not to the U.S. appears to be consistent with the importance that Japanese firms are alleged to place on the system of-lifetime employment, whereby the firm provides its employees with lifetime employment security and in tum employees offer lifetime commitment and loyalty to the firm for the entire working life.
15
our final model specifications thus seem to be quite adequate.19
The estimated regression functions for the U.S. and Japan are qualitatively similar. We
find, for example, that larger firms tend to have longer tournaments, and this coincides with our
first hypothesis that the hazard will fall as the firm size rises. Because the coefficients on
(VALUE)2 in the U.S. regression and (SALE)2 in the Japanese regression are negative, we see
that the impact of marginally increasing the size of the firm is less for large firms than for small
firms. Such an empirical result is intuitive. On the other hand, we find that the size variable
EMPLOYEE infhrences the Japanese regression function only for those contenders with no prior
experience. In this respect, Japanese firms with more employees typically require that contenders
with no prior experience spend additional time preparing for the CEO position.
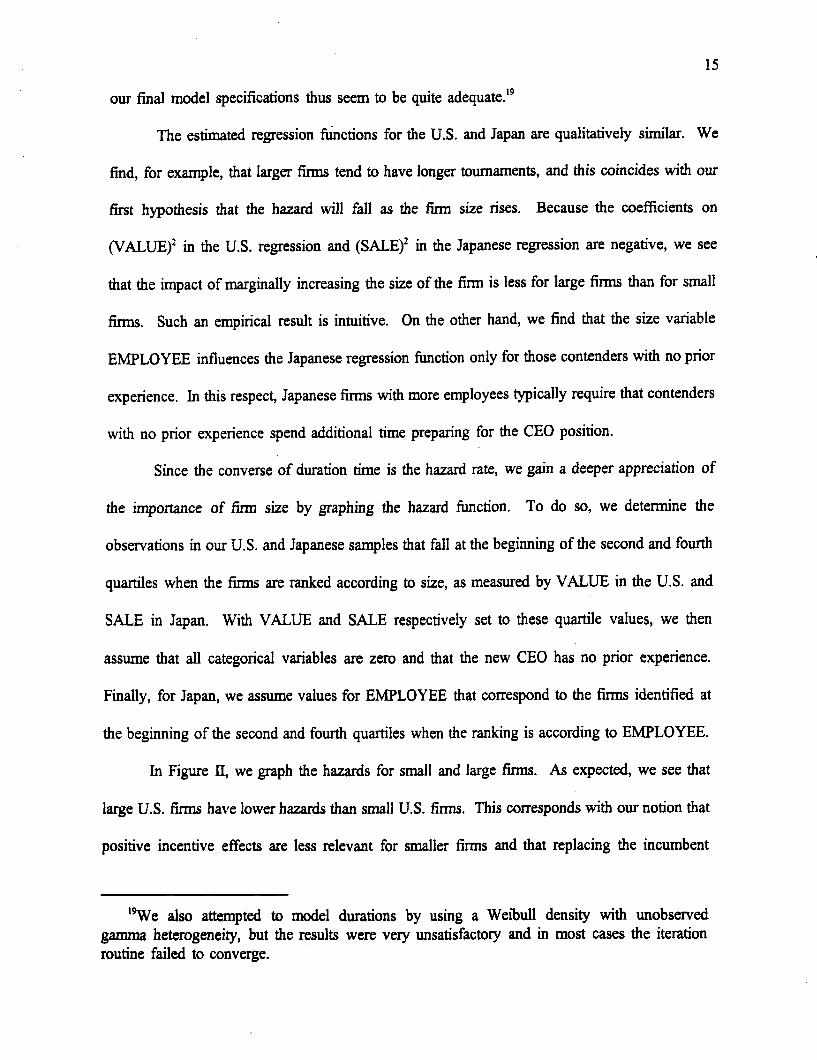
Since the converse of duration time is the hazard rate, we gain a deeper appreciation of
the importance of firm size by graphing the hazard function. To do so, we determine the
observations in our U.S. and Japanese samples that fall at the beginning of the second and fourth
quartiles when the firms are ranked according to size, as measured by VALUE in the U.S. and
SALE in Japan. With VALUE and SALE respectively set to these quartile values, we then
assume that all categorical variables are zero and that the new CEO has no prior experience.
Finally, for Japan, we assume values for EMPLOYEE that correspond to the firms identified at
the beginning of the second and fourth quartiles when the ranking is according to EMPLOYEE.
In Figure II, we graph the hazards for smal1 and large firms. As expected, we see that
large U.S. firms have lower hazards than small U.S. firms. This corresponds with our notion that
positive incentive effects are less relevant for smaller firms and that replacing the incumbent
‘we also attempted to model durations by using a Weibull density with unobserved gamma heterogeneity, but the results were very unsatisfactory and in most cases the iteration routine failed to converge.
16
CEOs entails less adjustment cost for smaller firms. Jn Japan, we see that the hazards are
initially lower for large ti than for small firms, but the relative positions reverse at a duration
of about 27 years. While seemingly counter-intuitive, this result can be explained. Larger
Japanese firms are more inclined to pursue long term goals (which implies a lower hazard), but
there is less uncertainty among larger fhms (which implies a hazard with greater curvature). The
observed hazards are as expected if large Japanese firms are more bound to tradition and thus
less discretionary than small Japanese firms. Furthermore, we see that U.S. firms have
substantially steeper hazards than Japanese firms after a duration of about 15 years (note that the
scale of the Japanese axis is half that of the U.S.). As discussed above, this is perhaps due to
the hypothesized lower time discount rates and higher costs of terminating the promotion
tournament in Japan.
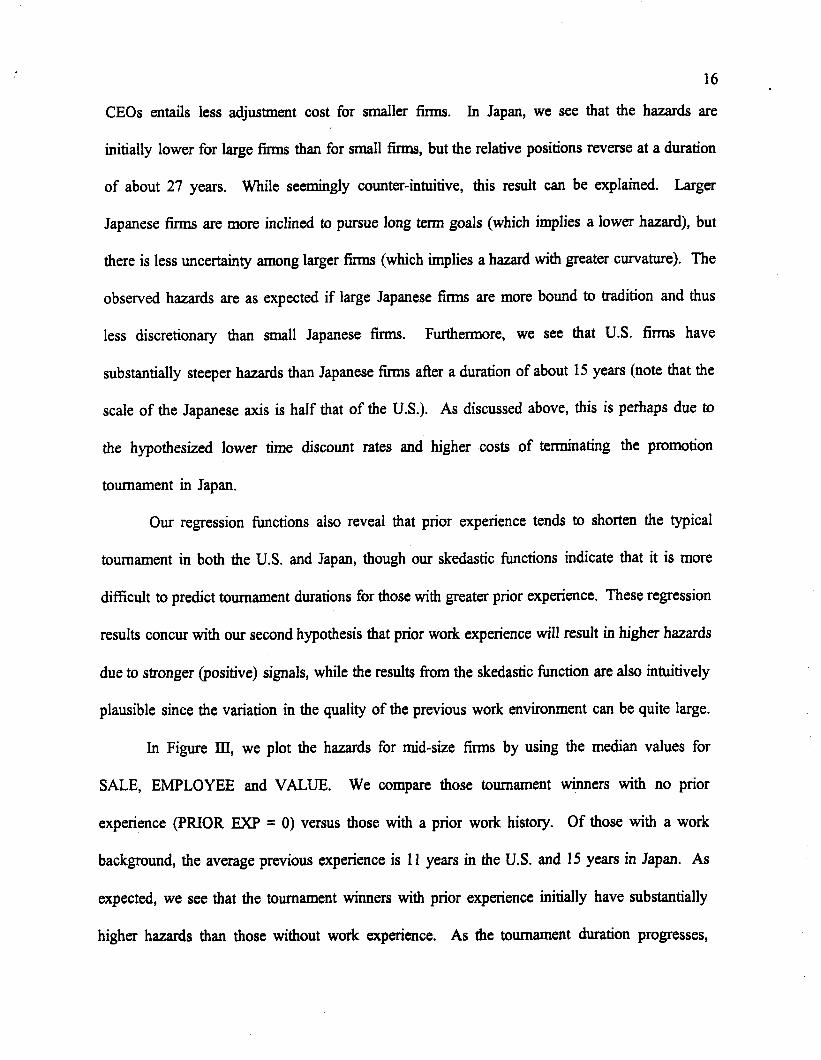
Our regression functions
tournament in both the U.S. and
also reveal that prior experience tends to shorten the typical
Japan, though our skedastic functions indicate that it is more
difficult to predict tournament durations for those with greater prior experience. These regression
results concur with our second hypothesis that prior work experience will result in higher hazards
due to stronger (positive) signals, while the results from the skedastic function are also intuitively
plausible since the variation in the quality of the previous work environment can be quite large.
In Figure III, we plot the hazards for mid-size firms by using the median values for
SALE, EMPLOYEE and VALUE. We compare those tournament winners with no prior
experience (PRIOR EXP = 0) versus those with a prior work history. Of those with a work
background, the average previous experience is 11 years in the U.S. and 15 years in Japan. As
expected, we see that the tournament winners with prior experience initially have substantially
higher hazards than those without work experience. As the tournament duration progresses,
17
however, we see that the relative positions of these hazards will switch, reflecting the fact that
there is less promotion uncertainty for those with no experience. Interestingly, we see that this
switch does not occur for the U.S. until about 43 years, and sometime after 50 years for Japan.
Therefore we conclude that prior work experience is usually interpreted as a strong positive
signal in favor of the tournament winner. The gap in the hazard between those with and without
prior experience is greater for the U.S. than for Japan, supporting a popular notion that previous
work experience is more valuable in the U.S. than in Japan.
Except for the industrial dummies, all of the other variables included in our model
measure the academic credentials of the new CEO. As predicted by the second hypothesis, the
lack of a college degree leads to a decrease in the hazard in both countries, whereas, a degree
from Harvard or having an MBA diploma in the U.S. increases the hazard function. Surprisingly,
having a degree from the University of Tokyo will not significantly change the average
tournament duration in Japan. This result is unexpected since Japanese culture is usually thought
to place extreme emphasis on credentials.20 Nor will having a degree in economics or business
influence the hazard function. Interestingly, however, having a technical background does appear
to prolong the promotion decision, and from the skedastic function we see that there is less
uncertainty about the (longer) toumament durations for engineers. Such a result is not entirely
surprising since the different job skills are needed in managerial as opposed to technical careers.
VII. Concluding Remarks
The paper began with developing a simple search model of the firm seeking to select its
‘We note that in the proportional Weibull unrestricted Weibull model), the coefficient on supports our a priori view.
model (which was rejected in favor of the TOKYO is negative and significant. This
18
new CEO by using the promotion tournament. The model was then used to guide our empirical
analysis. We derived and tested two empirical hypotheses concerning the duration of the
tournament and its relationships to firm size and observable signals of the contenders’ ability
such as educational credentials. In summary, our preferred specifications of the Weibull duration
model for the Japanese and U.S. samples provided much evidence for both hypotheses.
Specifically, (i) larger firms are more likely to prolong the promotion tournament, (ii) when CEO
contenders have less outside experience, the f%m is more likely to prolong the tournament; and
(iii) when CEO contenders are not college graduates, the firm is more likely to prolong the
tournament. Furthermore, contrary to popular view, we find that strong college credentials (such
as graduating from the University of Tokyo) do not significantly alter the firm’s optimal stopping
rule of the tournament in Japan, whereas, they do in the U.S.
Our results contribute to an important controversy over the determinants of the postwar
success of the Japanese economy by providing the first rigorous econometric evidence on the
difference in the promotion policy between Japanese and U.S. firms. Specifically, our duration
analysis supports Koike’s recent hypothesis that Japanese firms tend to prolong the promotion
tournament longer than U.S. firms, resulting in more competition among employees and more
accumulation of firm-specific human capital and thus more overall competitiveness of Japanese
firms. Furthermore, our search model of the promotion tournament suggests that the difference
in the promotion policy between the two nations may be caused by the difference in: (i) time
discount rates; (ii) incentive effects of promotion tournaments; and (iii) adjustment costs of
replacing the incumbent CEOs.”
*‘One can use a standard human capital theory to explain the difference between the Japanese and U.S. promotion policy. For instance, Kato (1993) cites Kagono, Nonaka, Okumura, Sakakibara, Komatsu, and Sakashita (1984) reporting that Japanese chief executives
19
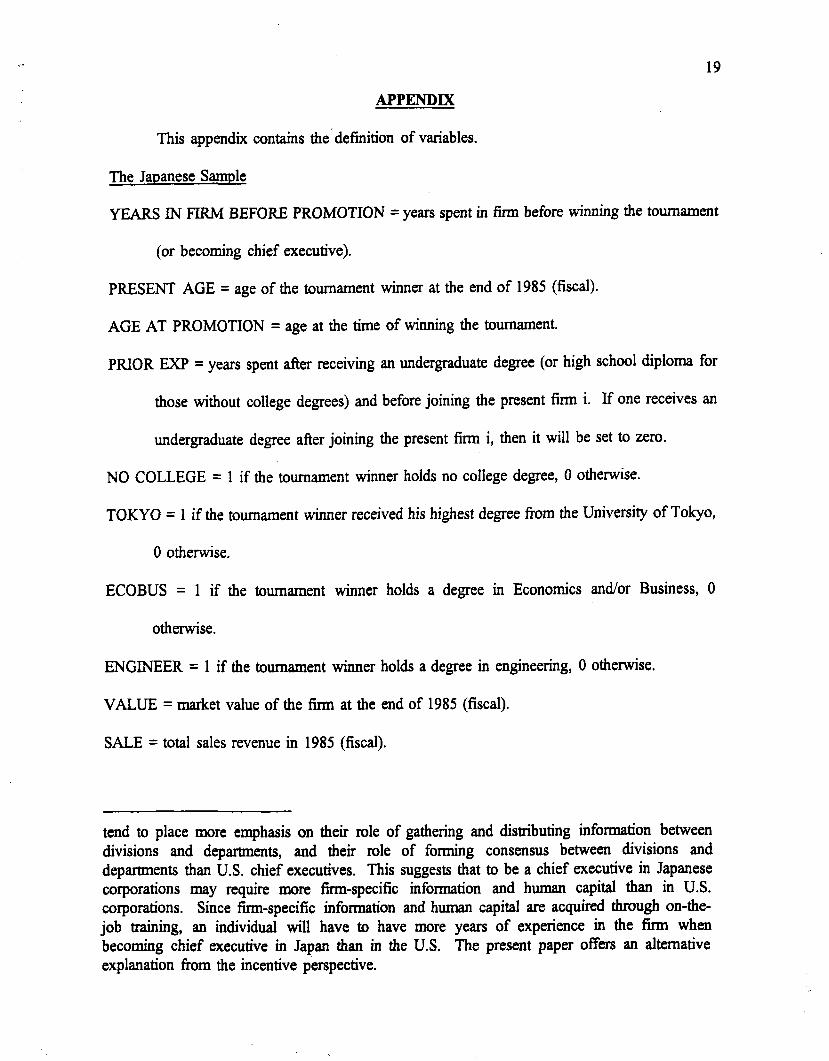
APPENDIX
This appendix contains the-definition of variables.
The Japanese Sample
YEARS IN FIRM BEFORE PROMOTION = years spent in firm before winning the tournament
(or becoming chief executive).
PRESENT AGE = age of the tournament winner at the end of 1985 (fiscal).
AGE AT PROMOTION = age at the time of winning the tournament.
PRIOR EXP = years spent afler receiving an undergraduate degree (or high school diploma for
those without college degrees) and before joining the present fim~ i. If one receives an
undergraduate degree after joining the present firm i, then it will be set to zero.
NO COLLEGE = 1 if the tournament winner holds no college degree, 0 otherwise.
TOKYO = 1 if the tournament winner received his highest degree from the University of Tokyo,
0 otherwise.
ECOBUS = 1 if the
otherwise.
tournament winner holds a degree in Economics and/or Business, 0
ENGINEER = 1 if the tournament winner holds a degree in engineering, 0 otherwise.
VALUE = market value of the fhm at the end of 1985 (fiscal).
SALE = total sales revenue in 1985 (fiscal).
tend to place more emphasis on their role of gathering and distributing information between divisions and departments, and their role of forming consensus between divisions and departments than U.S. chief executives. This suggests that to be a chief executive in Japanese corporations may require more firm-specific information and human capital than in U.S. corporations. Since firm-specific information and human capital are acquired through on-the- job training, an individual will have to have more years of experience in the firm when becoming chief executive in Japan than in the U.S. The present paper offers an alternative explanation from the incentive perspective.
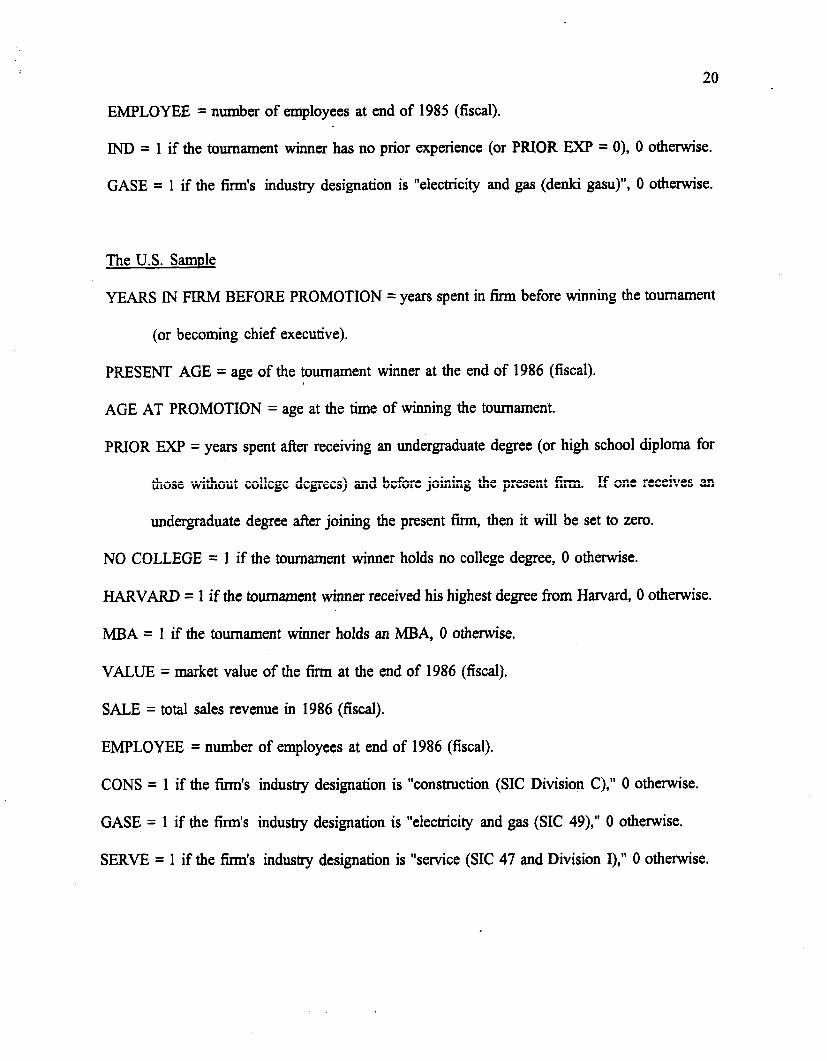
20
EMPLOYEE = number of employees at end of 1985 (fiscal).
IND = 1 if the tournament winner has no prior experience (or PRIOR EXP = 0), 0 otherwise.
GASE = 1 if the firm’s industry designation is “electricity and gas (denki gasu)“, 0 otherwise.
The U.S. Sample
YEARS lN FlRM BEFORE PROMOTION = years spent in firm before winning the tournament
(or becoming chief executive).
PRESENT AGE = age of the tournament winner at the end of 1986 (fiscal).
AGE AT PROMOTION = age at the time of winning the tournament.
PRIOR EXP = years spent after receiving an undergraduate degree (or high school diploma for
those without college degrees) and before joining the present firm. If one receives an
undergraduate degree after joining the present firm, then it will be set to zero.
NO COLLEGE = 1 if the tournament winner holds no college degree, 0 otherwise.
HARVARD = 1 if the tournament winner received his highest degree from Harvard, 0 otherwise.
MBA = 1 if the tournament winner holds an MBA, 0 otherwise.
VALUE = market value of the firm at the end of 1986 (fiscal).
SALE = total sales revenue in 1986 (fiscal).
EMPLOYEE = number of employees at end of 1986 (fiscal).
CONS = 1 if the firm’s industry designation is “construction (SIC Division C),” 0 otherwise.
GASE = 1 if the firm’s industry designation is “electricity and gas (SIC 49),” 0 otherwise.
SERVE = 1 if the firm’s industry designation is “service (SIC 47 and Division I),” 0 otherwise.
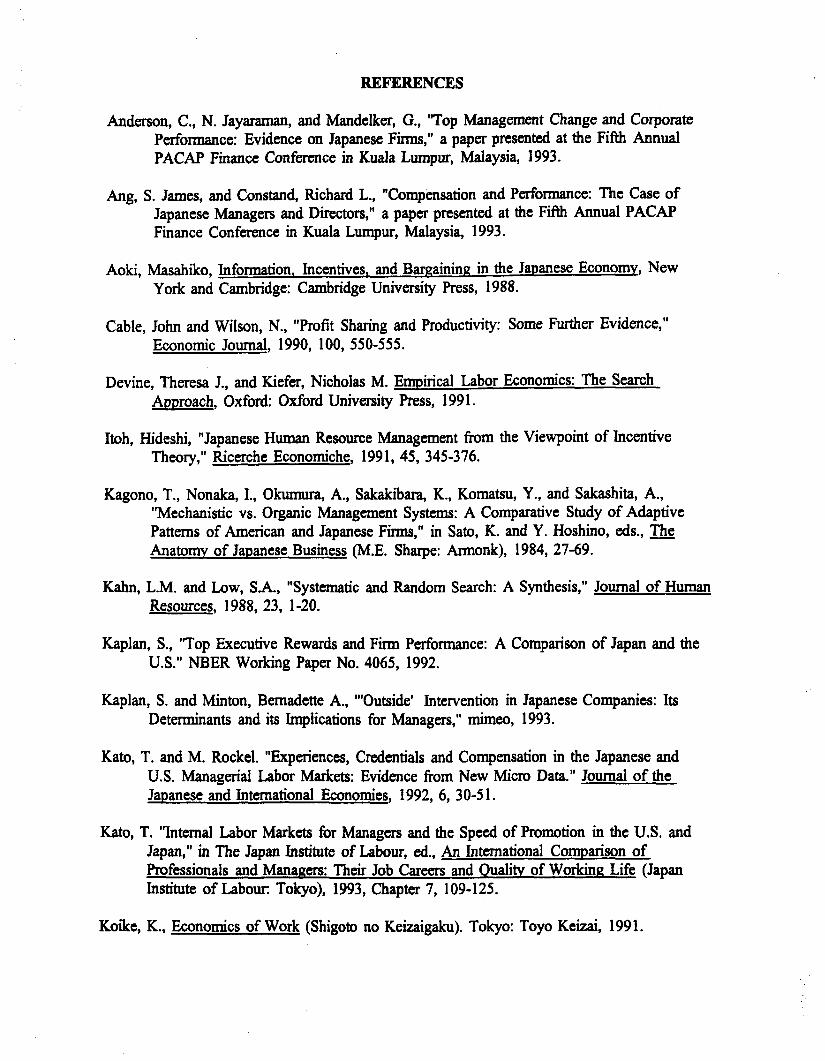
Anderson, C., N. Jayaraman, and Mandelker, G., ‘Top Management Change and Corporate Performance: Evidence on Japanese Firms,” a paper presented at the Fifth Annual PACAP Finance Conference in Kuala Lumpur, Malaysia, 1993.
Ang, S. James, and Constand, Richard L., “Compensation and Performance: The Case of Japanese Managers and Directors,” a paper presented at the Fifth Annual PACAP Finance Conference in Kuala Lumpur, Malaysia, 1993.
Aoki, Masahiko, Infotmation. Incentives, and Bargaining in the Jananese Economy, New York and Cambridge: Cambridge University Press, 1988.
Cable, John and Wilson, N., “Profit Sharing and Productivity: Some Further Evidence,” Economic Journal, 1990, 100, 550-555.
Devine, Theresa J., and Kiefer, Nicholas M. Emnirical Labor Economics: The Search Auproach, Oxford: Oxford University Press, 1991.
Itoh, Hideshi, “Japanese Human Resource Management from the Viewpoint of Incentive Theory,” Ricerche Economiche, 1991, 45, 345-376.
Kagono, T., Nonaka, I., Okumura, A., Sakakibara, K., Komatsu, Y., and Sakashita, A., “Mechanistic vs. Organic Management Systems: A Comparative Study of Adaptive Patterns of American and Japanese Firms,” in Sato, K. and Y. Hoshino, eds., m Anatomy of Japanese Business (M.E. Shatpe: Armonk), 1984, 27-69.
Kahn, L.M. and Low, S.A., “Systematic and Random Search: A Synthesis,” Journal of Human Resources, 1988, 23, l-20.
Kaplan, S., ‘Top Executive Rewards and Fixm Performance: A Comparison of Japan and the U.S.” NBER Working Paper No. 4065, 1992.
Kaplan, S. and Minton, Bernadette A., “‘Outside’ Intervention in Japanese Companies: Its Determinants and its Implications for Managers,” mimeo, 1993.
Kato, T. and M. Rockel. “Experiences, Credentials and Compensation in the Japanese and U.S. Managerial Labor Markets: Evidence from New Micro Data.” Journal of the Japanese and International Economies, 1992, 6, 30-51.
Kato, T. “Internal Labor Markets for Managers and the Speed of Promotion in the U.S. and Japan,” in The Japan Institute of Labour, ed., An International Comparison of Professionals and Managers: Their Job Careers and Oualitv of Working Life (Japan Institute of Labour: Tokyo), 1993, Chapter 7, 109-125.
Koike, K., Economics of Work (Shigoto no Keizaigaku). Tokyo: Toyo Keizai, 1991.
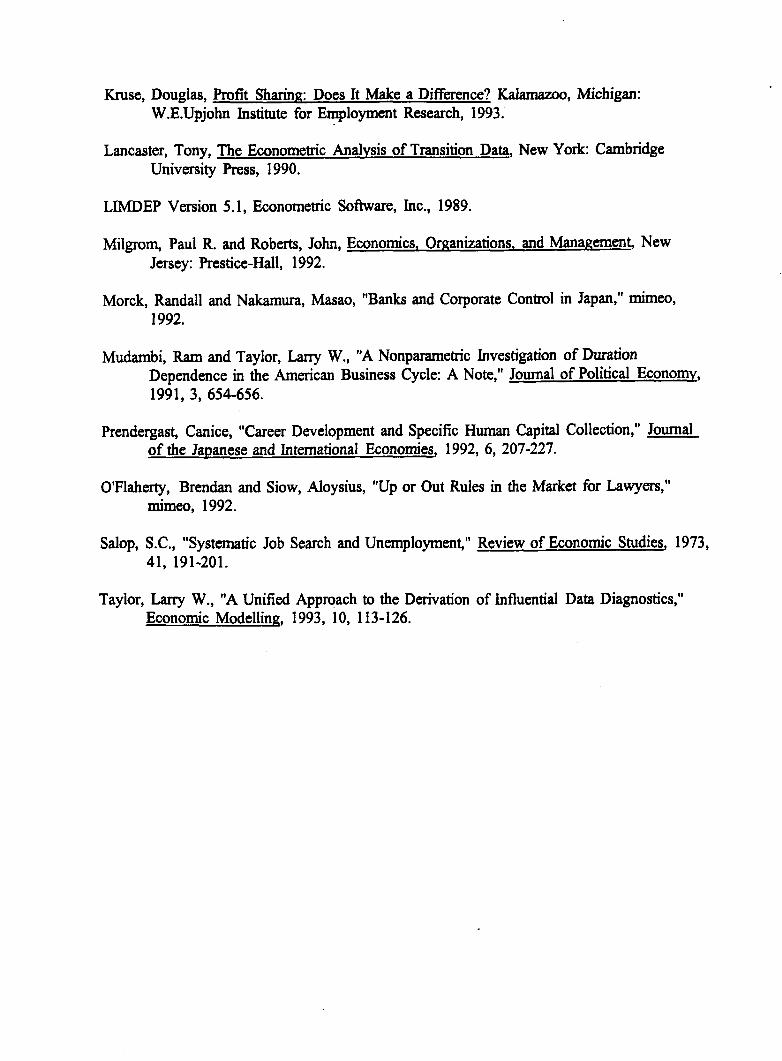
Kruse, Douglas, Profit Sharing: Does It Make a Difference? Kalamazoo, Michigan: W.E.Upjohn Institute for Employment Research, 1993.
Lancaster, Tony, The Econometric Analysis of Transition Data, New York: Cambridge University Press, 1990.
LIMDEP Version 5.1, Econometric Software, Inc., 1989.
Milgrom, Paul R. and Roberts, John, Economics, Organizations. and Management, New Jersey: Prestice-Hall, 1992.
Merck, Randall and Nakamura, Masao, “Banks and Corporate Control in Japan,” mimeo, 1992.
Mudambi, Ram and Taylor, Larry W., “A Nonparametric Investigation of Duration Dependence in the American Business Cycle: A Note,” Journal of Political Economy, 1991, 3, 654-656.
Prendergast, Canice, “Career Development and Specific Human Capital Collection,” Journal of the Japanese and International Economies, 1992, 6, 207-227.
O’Plaherty, Brendan and Siow, Aloysius, “Up or Out Rules in the Market for Lawyers,” mimeo, 1992.
Salop, S.C., “Systematic Job Search and Unemployment,” Review of Economic Studies, 1973, 41, 191-201.
Taylor, Larry W., “A Unified Approach to the Derivation of Influential Data Diagnostics,” Economic Modelling, 1993, 10, 113-126.
Variable Japan U.S. ____________________________________^_________~_~~_~__~~~~~~~~~~_~~~~~~~~~-~~~~~~~~~~~~_~ Duration of Tournaments:
YEARS IN FIRM BEFORE PROMOTION
Mean S.D.
Age:
PRESENT AGE Mean S.D.
AGE AT PROMOTION
Mean 55.919 S.D. 8.8480
External Experiences:
PRIOR EXP Mean 9.3321 S.D. 12.344
Educational Credentials:
NO COLLEGE TOKYO ECOBUS ENGINEER HARVARD MBA
Mean Mean Mean Mean Mean Mean
Size of Firm:
VALUE Mean S.D.
SALE Mean S.D.
EMPLOYEE Mean S.D.
Sample Size
23.739 18.354 years 13.357 10.147
62.039 55.639 years old 7.0173 6.7991
48.924 years old 6.9050
4.7619 % 26.252 % 35.897 % 21.856 %
0.28526 trillion yen 0.59185
0.84738 trillion yen 2.8243
4.6361 thousand 7.3124
819
8.4374 years 9.1552
3.3309 %
13.094 % 22.302 %
3.1569 billion dollars 6.3892
3.4518 billion dollars 7.2675
23.640 thousand 55.517
695b
Notes:
:: See Appendix for definition of variables. Since Moody's (1987) provided us with data on the number of employees only as of the end of (fiscal) 1986, there are but 563 cases used to obtain the summary statistics for EMPLOYEES in the U.S.
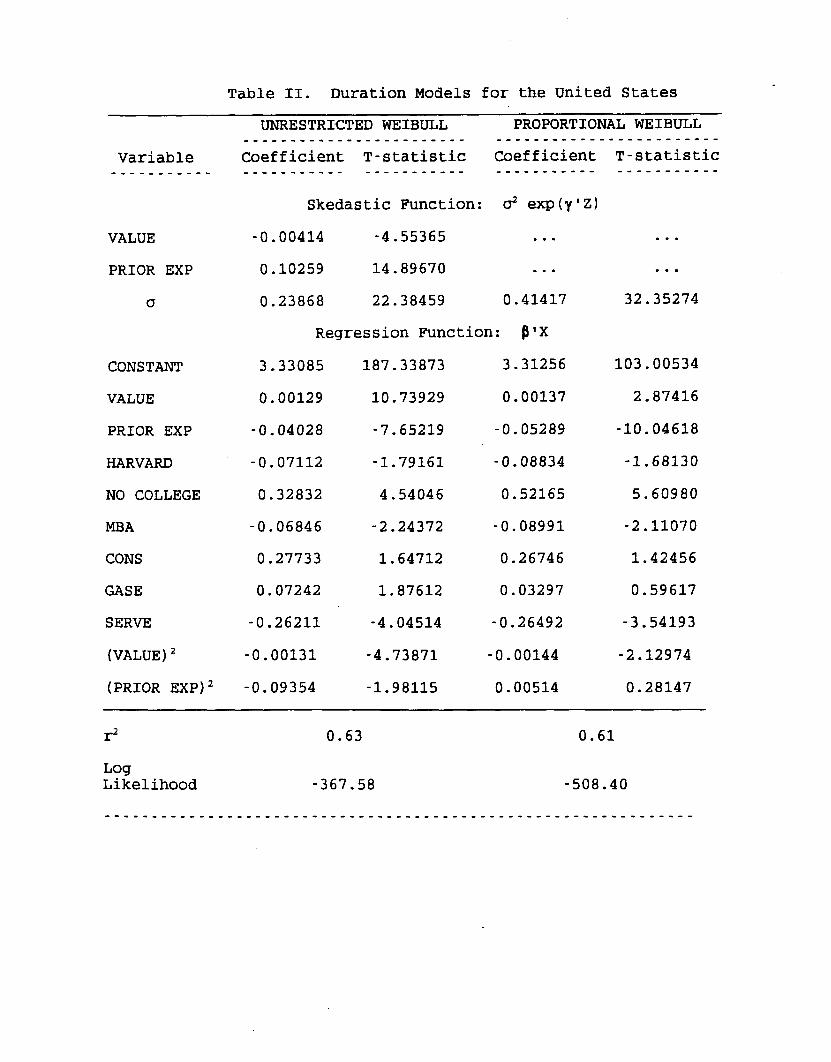
Table II. Duration Models for the United States
UNRESTRICTED WEIBULL PROPORTIONAL WEIBULL ___________-____________ ____________________----
Variable Coefficient T-statistic Coefficient T-statistic -____-___-- ____--____- ___________ ~-----__--- ________---
VALUE
PRIOR EXP
o
CONSTANT
VALUE
PRIOR EXP
HARVARD
NO COLLEGE
MBA
CONS
GASE
SERVE
(VALUE)~
(PRIOR EXP)~
Skedastic Function: 02 exp(y'Z)
-0.00414 -4.55365 . . .
0.10259 14.89670 . . .
0.23868 22.38459 0.41417
Regression Function: B'X
3.33085 187.33873 3.31256
0.00129 10.73929 0.00137
-0.04028 -7.65219 -0.05289
-0.07112 -1.79161 -0.08834
0.32832 4.54046 0.52165
-0.06846 -2.24372 -0.08991
0.27733 1.64712 0.26746
0.07242 1.87612 0.03297
-0.26211 -4.04514 -0.26492
-0.00131 -4.73871 -0.00144
-0.09354 -1.98115 0.00514
. . .
. . .
32.35274
103.00534
2.87416
-10.04618
-1.68130
5.60980
-2.11070
1.42456
0.59617
-3.54193
-2.12974
0.28147
r2 0.63 0.61
Log Likelihood -367.58 -508.40
___~_~_______~______~~~~~~~~~~_~~__~_~~_~~~~~~~~~~~~~~~~~~~~~~~
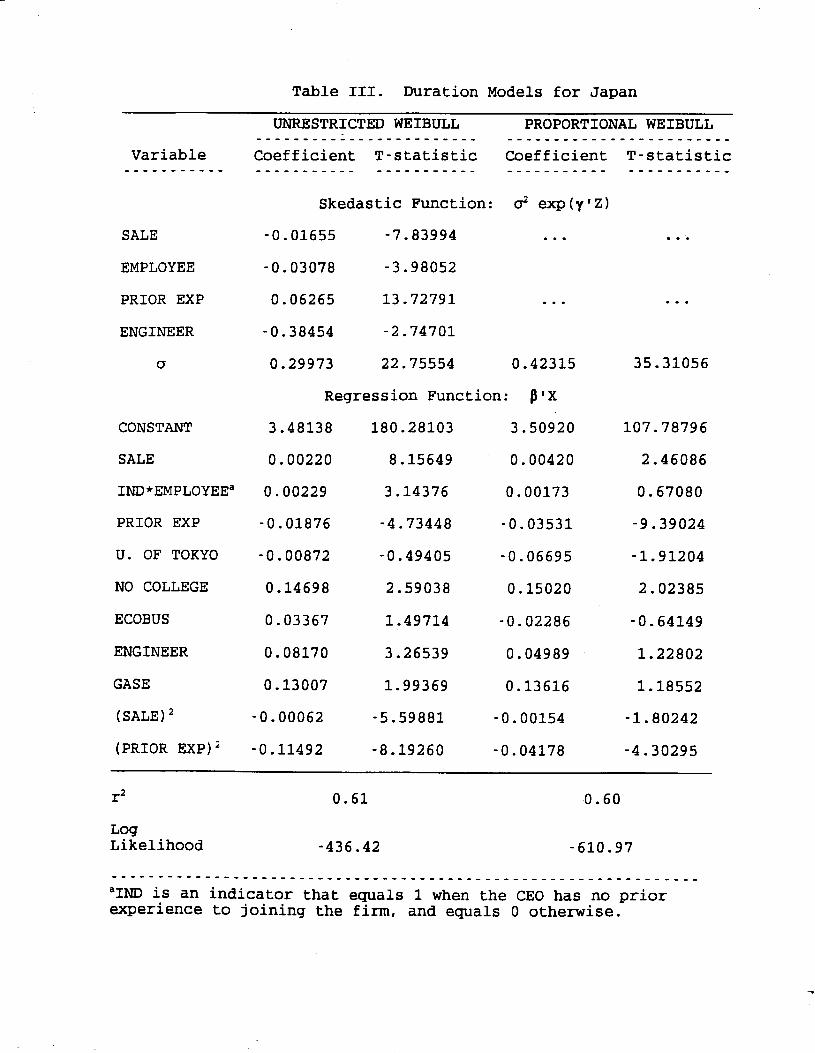
Table III. Duration Models for Japan
UNRESTRICTED WEIBULL PROPORTIONAL WEIBULL ____________________---_ ______________-_____----
Variable Coefficient T-statistic Coefficient T-statistic _____----__ ___________ ----------_ ___________ -----------
Skedastic Function: d exp(y'Z)
SALE
EMPLOYEE
PRIOR EXP
ENGINEER
(5
CONSTANT
SALE
IND*EMPLOYEE=
PRIOR EXP
U. OF TOKYO
NO COLLEGE
ECOBUS
ENGINEER
GASE
(SALE)~
(PRIOR EXP)~
-0.01655 -7.83994 . . .
-0.03078 -3.98052
0.06265 13.72791 . . .
-0.38454 -2.74701
0.29973 22.75554 0.42315
Regression Function: @IX
3.48138 180.28103 3.50920
0.00220 8.15649 0.00420
0.00229 3.14376 0.00173
-0.01876 -4.73448 -0.03531
-0.00872 -0.49405 -0.06695
0.14698 2.59038 0.15020
0.03367 1.49714 -0.02286
0.08170 3.26539 0.04989
0.13007 1.99369 0.13616
-0.00062 -5.59881 -0.00154
-0.11492 -8.19260 -0.04178
. . .
. . .
35.31056
107.78796
2.46086
0.67080
-9.39024
-1.91204
2.02385
-0.64149
1.22802
1.18552
-1.80242
-4.30295
23 0.61 0.60
l-3 Likelihood -436.42 -610.97
_~__-------_________~~~~~~~~~~~~~~~~~~~ ______________-_-_------
'IND is an indicator that equals 1 when the CEO has no prior experience to joining the firm, and equals 0 otherwise.
.sm
.40e
H .3ee
A Z A R .aee D
a -
FIGURE I: NONPARAMEI-RIC HAZARDS
.
. + . +
. .
I” 1 , .I, ( , t I 1 3.00 18.08~15.88 2o.m 25.88 39.88 35.08 4a.80 45.90 50.00
YEARS
l USA + JAPAN
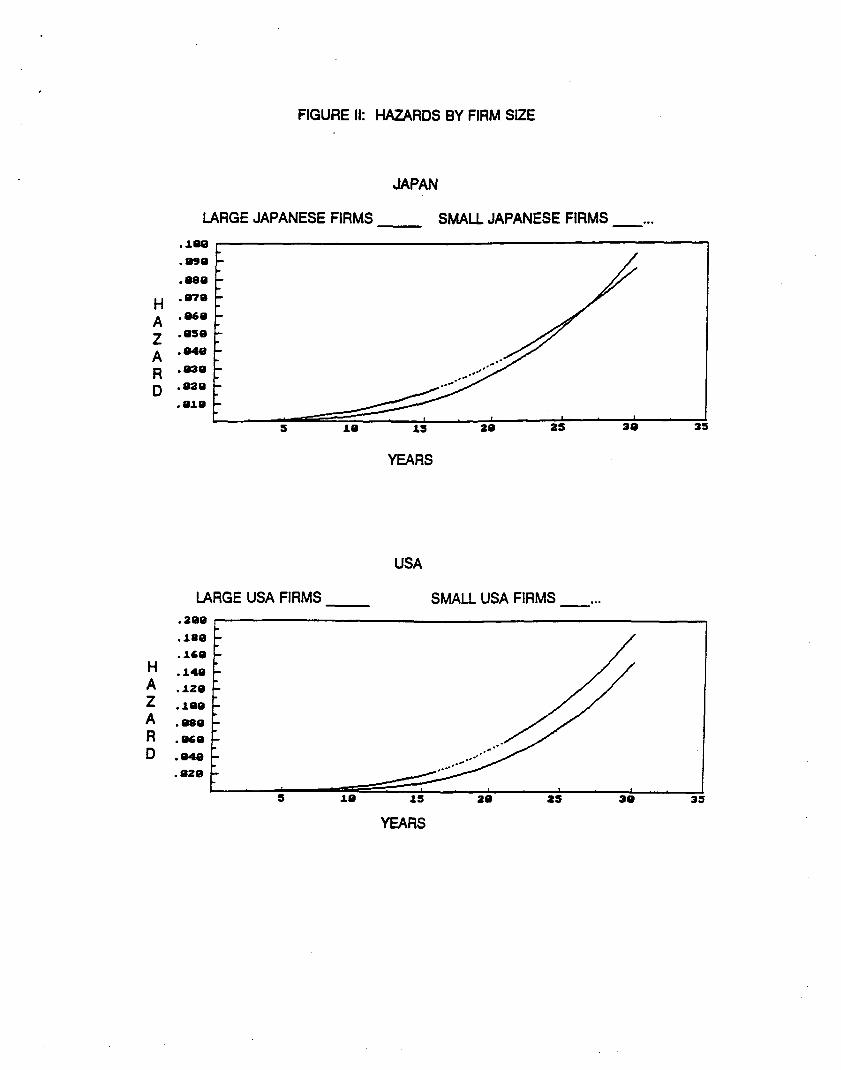
FIGURE II: HAZARDS BY FIRM SlZE
H A Z A R D
H A Z A R D
JAPAN
b ,090 i
.080 -
.070 -
.060 -
,050 -
.040 -
l 030 -
.02e -
,010 -
5 10 is 20 25 20 3
LARGE JAPANESE FIRMS SMALL JAPANESE FIRMS _...
.I88 r
* 5
YEARS
USA
LARGE USA FIRMS SMALL USA FIRMS _... .280
.l80
.I68
.I40
.I20
.IQO
.a80
.060
.a48
,828
YEARS
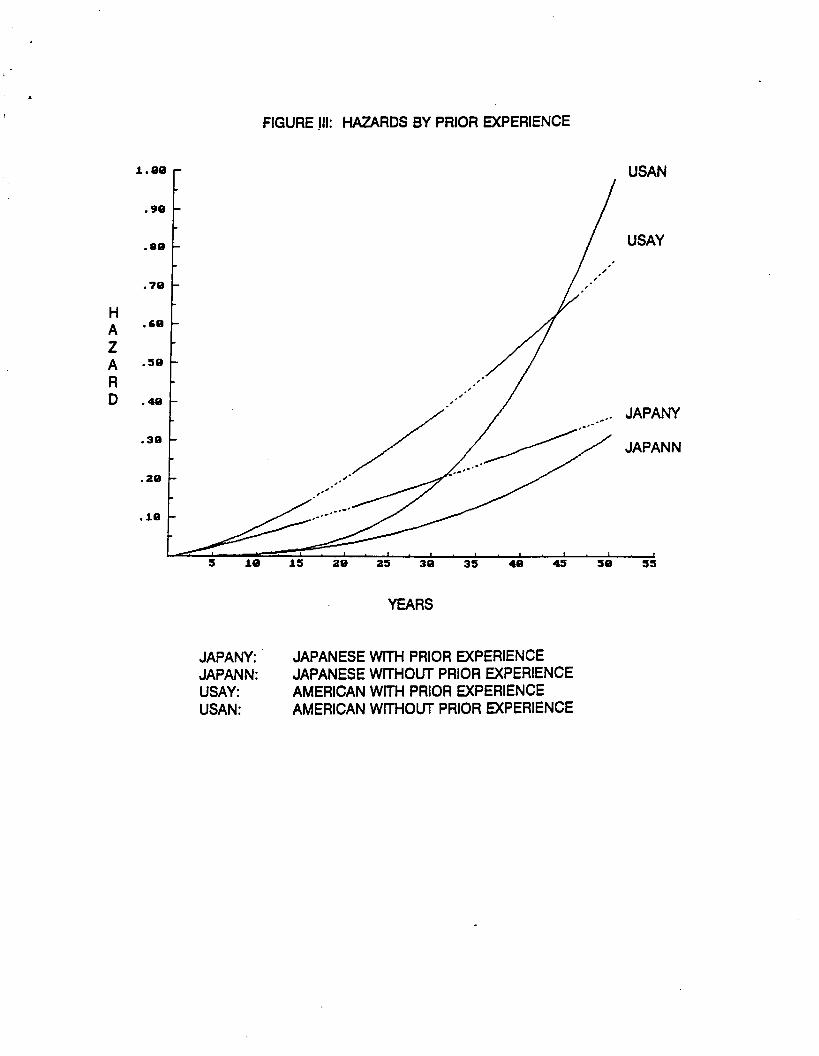
FIGURE III: HAZARDS BY PRIOR EXPERIENCE
H A Z A R D
1.00 - USAN
.90 -
.a0 -
.70 -
.60 -
.50 -
.40 -
.30 -
.20 -
.I0 -
t I , 1 1 I ( 5 10 15 20 25 30 35 40 45 s0 55
YEARS
JAPANY: JAPANESE WITH PRIOR EXPERIENCE JAPANN: JAPANESE WlTHOUT PRIOR EXPERIENCE USAY: AMERICAN WlTH PRIOR EXPERIENCE USAN: AMERICAN WITHOUT PRIOR EXPERIENCE


![beyond_pygmalion perception - takao inamori[1]](https://img.pdfslide.us/doc/110x75/577d2e021a28ab4e1eae9068/beyondpygmalion-perception-takao-inamori1.jpg)