Embed Size (px)
Citation preview

The Ticket to Easy Street?
The Financial Consequences of Winning the Lottery*
Scott Hankins Mark Hoekstra† Paige Marta Skiba
University of Kentucky University of Pittsburgh Vanderbilt University
[email protected] [email protected] [email protected]
October 4, 2009
Abstract
A fundamental question faced by policymakers is how best to help individuals who are in financial
trouble. This paper examines the consequences of the most basic approach: giving people large cash
transfers. To determine whether this prevents or merely postpones bankruptcy, we exploit a unique
dataset of Florida Lottery winners linked to bankruptcy records. Results show that although
recipients of $50,000 to $150,000 are 50 percent less likely to file for bankruptcy in the two years
after winning relative to small winners, they are equally more likely to file three to five years
afterward. Furthermore, bankruptcy records indicate that even though the median winner of a large
cash prize could have paid off all of his unsecured debt or increased equity in new or existing assets,
he chose not to do either. Consequently, our results suggest that some skepticism regarding the
long-term effect of cash transfers may be warranted. In addition, our findings are more consistent
with the strategic model of bankruptcy than the negative shock model, though we note we cannot
rule out the importance of behavioral issues such as high discount rates.
JEL Codes: D14 (Personal Finance), K35 (Personal Bankruptcy Law), D12 (Consumer Economics:
Empirical Analysis)
_________________ †Corresponding author
*We would like to thank David Albouy, Scott Carrell, Stefano Della Vigna, Robert Frank, Robert Lawless, Jeremy
Tobacman, Glen Waddell, and seminar participants at Cornell University, the Federal Reserve Bank of Boston, the
University of California-Berkeley, the University of California-Davis, University of California-Santa Barbara, the
University of Pennsylvania, the University of Texas at Arlington, Vanderbilt University, and the 2009 AEA Annual
Conference and 2009 NBER Summer Institute for helpful comments. We would also like to thank Susan Carter for
providing excellent research assistance and Vanderbilt Law School's Law and Human Behavior Program for providing
financial assistance.

1
1. Introduction
During economic downturns, an important question governments face is whether and how
to help individuals who are struggling financially. The central issue in determining the appropriate
policy is whether the assistance will have a permanent impact or will merely postpone financial
distress. The goal of this paper is to determine whether the simplest solution to helping indebted
individuals—giving them cash—enhances longer-term financial stability and helps them avoid
bankruptcy. In doing so, this paper also offers insight into the long-running debate about whether
bankruptcy is caused by moral hazard or by negative shocks (Fay, Hurst, and White, 2002).
While it might seem unambiguous that cash transfers that are large relative to debt should
prevent bankruptcy, there are reasons to be doubtful. For example, individuals may simply have
high discount rates that lead them to consume the resources in the short run.1 Individuals may also
engage in mental accounting (Thaler, 1990), treat the cash as “house money” and use it to take on
additional risks (Thaler and Johnson, 1990), make consumption commitments that make it more
difficult to overcome future negative income shocks (Chetty and Szeidl, 2007; Zhu, 2008), or
develop a taste for luxury goods that outlasts the money. Finally, individuals may lack the
knowledge to handle large amounts of cash wisely; surveys have consistently shown that U.S. adults
have relatively low levels of financial literacy (e.g., Higert, Hogarth, and Beverly, 2003; Lusardi and
Mitchell, 2007). The perceived importance of these considerations has been partly responsible for
the shift in the legal field from lump-sum payments to structured settlements,2 a trend that Pryor
1 This behavior could be rational or it could be at odds with the long-run selves’ preference against spending in the short run. For more on the latter, see DellaVigna (forthcoming); Frederick et. al (2002); and O’Donoghue and Rabin (1999).
2 This concern is reflected by the words of Judge Joseph Weiss of the United States Court of Appeals for the Third Circuit, who stated that “Lump-sum payments all too often are improvidently invested or squandered by unsophisticated recipients and so fail to provide for the lifetime of medical bills and unemployment faced by victims of serious injury." Judge Weiss also calls the reliance on lump sum awards one of the “enduring weaknesses of the common law tort system” (Jacquette v. Continental, 1999).

2
(2002) states is “perhaps the most striking development in the tort payment structure over the last
25 years.” However, to our knowledge the only research on the general question of whether large
cash transfers improve the longer term financial outcomes of struggling individuals consists of
informal surveys of lump-sum settlement recipients.
This study also contributes to the debate on whether personal bankruptcy is primarily caused
by strategic behavior or by negative shocks (e.g., Fay et al., 2002; Himmelstein, Thorne, Warren, and
Woolhandler, 2009; White, 2006). Since recipients of large cash transfers have the option of filing
bankruptcy later on, indebted recipients may strategically consume all of the transfer in the
expectation that they will later file for bankruptcy anyway. Consequently, to the extent that
receiving transfers large enough to pay off all unsecured debts does not reduce bankruptcy rates
over the longer term, it suggests support for the moral hazard model of bankruptcy rather than the
negative shock model.
To answer these questions, we apply a straightforward research design to a unique dataset.
Specifically, we link winners of the Florida Lottery to bankruptcy records and compare recipients of
$50,000 to $150,000 to those who won less than $10,000. By exploiting the randomness of the
lottery, we can distinguish the effect of cash transfers from confounding factors typically associated
with receipt of such awards. We rely on the identifying assumption that conditional on winning for
the first time, the amount won is uncorrelated with the recipients’ underlying propensity for
bankruptcy. Tests support this assumption: we find no difference in either the demographic
characteristics or the bankruptcy rates of large winners versus small winners in the years prior to
winning the lottery.
The results indicate that giving $50,000 to $150,000 to people only postpones bankruptcy.
Specifically, while these recipients are 50 percent less likely than small winners to file for bankruptcy

3
immediately after winning, they are equally more likely to file for bankruptcy three to five years after
winning. Furthermore, bankruptcy petitions filed in the 5 years after winning reveal that the net
assets and unsecured debt of large winners are no different from those of small winners. This
implies that even though the median winner of a large cash prize could have paid off all of his
unsecured debt or increased equity in new or existing assets, he did neither. Bankruptcy records also
yield little evidence that large winners later filed for bankruptcy due to increased housing
consumption commitments or in order to game the unlimited homestead exemption in Florida
bankruptcy law, suggesting that the recipients consumed their winnings. Since large winners
experienced no more negative shocks than the small winners due to the randomness of the prize
magnitude, we interpret out findings as more consistent with the strategic model of bankruptcy than
the negative-shock model. In addition, our results indicate that policymakers should be cautious in
offering cash assistance to heavily indebted individuals with the hope of increasing their longer-term
financial security.
2. Data
Data on lottery winners were obtained from the Florida Lottery. The data include every
winner of the Fantasy 5 lottery game in Florida from April 29, 1993 through November 27, 2002.
These winners represent all individuals who won more than $600, the minimum amount for which
Federal Law mandates that records be kept and reported to the Internal Revenue Service. For each
lottery winner, we observe the individual’s name and home zip code, the amount won (which we
adjust for inflation), and the date of the drawing.
Because we ultimately link bankruptcy records to winners using their first and last names and
county of residence, we attempt to identify the set of unique names so as to minimize the number of
individuals falsely linked to bankruptcy. Toward that end, we exclude all names that appeared more

4
than once in 2008 phone records for that county. In addition, if lottery records indicated that an
individual with a unique name from a given county won more than once, we then use only the first
time that individual won.3 We do this because while the largest amount an individual won over this
time period would undoubtedly be correlated with her financial condition (e.g., low-income
individuals may play more and thus win more large prizes over time), the amount won the first time
should be random. We also limit the sample to individuals who won less than $150,000 since only
153 Fantasy 5 winners won more than that during this time period. As shown in Table 1, this limits
the sample to 34,987 individuals. While these amounts represent pre-tax winnings, the Internal
Revenue Service requires that the Florida Lottery withhold 25 percent of amounts greater than
$5,000.
Bankruptcy records were obtained from the Public Access to Court Electronic Records
database (PACER) maintained by the Administrative Office of the U.S. Courts. In total, there
were 1,433,243 personal bankruptcy records filed in Florida from 1985 to November 27, 2007.
These records represent all of the Chapter 7 and Chapter 13 personal bankruptcy petitions filed in
the three district U.S. bankruptcy courts in Florida. While we note that not all petitions were
approved by bankruptcy judges, for ease of exposition we will subsequently refer to winners’
bankruptcy rates rather than the more cumbersome “bankruptcy filing rates”.
Included in the data are the first and last name of the filer along with his or her residential
address, the date filed, and the chapter under which the bankruptcy case was filed. In addition, we
also obtained more detailed data from bankruptcies filed between January 1, 2004 and November
27, 2007 since this information was available electronically. These data are discussed in more detail
in Section 6.
3 Results are unchanged when these individuals are excluded from the analysis.

5
Bankruptcy represents an important outcome for several reasons. First, filing for
bankruptcy is arguably the most extreme signal of financial distress. In addition, preventing
bankruptcy may be socially desirable both because it is bad for creditors and because by affecting a
filer’s credit score, it can affect the availability and price of future consumer loans as well as her
employment prospects.
The lottery winners were linked to bankruptcy filings on the basis of first and last name and
county of residence, with results shown in Table 2. Each winner was linked to any bankruptcy case
filed up to five years prior to winning the lottery and within five years after winning the lottery. In
all, 1,934 Fantasy 5 winners were linked to a bankruptcy in the five years after winning. This match
implies a one-year bankruptcy rate among lottery players of just over 1 percent, which is similar to
the filing rate of 1.0 percent for all adults in Florida from 1993 through 2001.4
While it is possible that type I or type II errors were made in linking lottery winners to
bankruptcy records, neither type of error should invalidate the research design. Due to the
randomness with which amount won is determined, we should be no more or less likely to match
winners of large sums than winners of small sums except for the causal effect of amount received on
bankruptcy rates.
3. Fantasy 5 and Identification Strategy
To identify the effect of large cash transfers on bankruptcy rates, we compare the
bankruptcy rates of large cash prize recipients to those of small prize recipients. This strategy is
similar to those employed in other papers to examine the effect of income shocks on health and
mortality (Lindahl, 2005) and on labor earnings, savings, and consumption (Imbens et al., 2001).
4 Source: U.S. Census and authors’ calculations.

6
The identifying assumption in our analysis is that conditional on winning at least $600 in Fantasy 5
for the first time, the amount won is uncorrelated with underlying propensity for bankruptcy. We
emphasize that we focus only on the first time an individual is observed to win rather than assuming
whether or not an individual ever wins a large prize (conditional on winning $600 or more at least
once) is random, given that the latter would clearly depend on frequency of play.
In order to gauge the validity of our identifying assumption, some background regarding the
Fantasy 5 game is necessary. Fantasy 5 is a pari-mutuel lottery game in which amount won depends
on how many numbers were matched, how many winning tickets were sold, and how many people
played. The largest prizes were given for matching five of five numbers and ranged from less than
$10,000 to more than $200,000. The amount won depended not only on the number of winning
tickets and total plays but also on the structure of the game. From April 29, 1993 through July 15,
2001, individuals who matched five of five numbers won an average of $20,000, though depending
on the number of winners the amount varied from $1,300 to $132,000. Beginning on July 16, 2001
the game changed such that the average amount won for matching 5 numbers increased to $120,000.
On days in which no one matched five of five numbers, people who matched 4 numbers won an
average of $900. Consequently, because the number of small and large winners changed over time,
it is important for our main analysis to control for that as well as for year fixed effects. Finally, while
it is possible for individuals to play up to ten times on each card, no lottery winners in the data
played the same 5 numbers multiple times. This implies that although some people are more likely
to enter our data than others (i.e., those who play the lottery more frequently or play more numbers
on a card), conditional on winning $600 the amount won is unaffected by the number of plays paid
for on a given card.

7
An important advantage of this identification strategy is that it can be empirically tested in
two ways. First, in results available upon request, we show that amount won is not explained by
winners’ neighborhood characteristics. Second, and more importantly, we show that recipients of
large cash prizes were no more or less likely to file for bankruptcy before they won than were
recipients of small cash prizes. This implies that except for the difference in amount won, we would
not expect bankruptcy rates to differ systematically after winning the lottery either. Collectively
these tests suggest that any difference between the post-winning bankruptcy rates of large winners
and small winners is properly interpreted as the causal effect of the lottery winnings. In addition, in
Section 5.3 we report similar findings when we restrict the sample to those who won after the game
changed in 2001 and compare players who matched 5 numbers and won an average of $80,000 to
players who matched 4 numbers and won just over $1,000.
In assessing the external validity of our estimates, it is important to point out that lottery
players are much more representative of the population than some might think. For example,
Kearney (2005) reports that over half of the adults in the U.S. have played the lottery in the last year.
Even more importantly, annual spending (i.e., frequency of play) is also approximately equal across
the income distribution, though college-educated individuals play approximately 40 percent less than
high school graduates (Kearney, 2005). In addition, in results available from the authors we find
that our results are unchanged when we exclude individuals who won multiple times over the time
period examined. This indicates that the results are not driven by individuals who play most
frequently. Consequently, while we are unaware of any surveys that ask about both lottery-playing
behavior and other characteristics that might be targeted by government bailouts such as subprime,
adjustable rate, or Alt-A mortgages, we would expect there to be considerable overlap between these
populations. As a result, while our study may be less helpful in predicting the impact of a cash
transfer to highly educated people not near the bankruptcy margin—though for the sake of science
8
we would be happy to participate in that field experiment—we do think it is informative regarding
the likely effect of bailouts to people in financial trouble.
4. Methodology
Given the intuitive research design, the simplest way to determine the effect of receiving
large cash transfers is to compare large prize winners to small prize winners. In addition to
comparing the bankruptcy rates of these groups graphically before and after winning the lottery, we
also do so using ordinary least squares regression, though results are similar when estimating a
probit.5 Specifically, we estimate:
Bankruptcyi = αi + β0 (After Change in Game Structure)i + β1 ($10,000 ≤ Amount < $50,000)i
+ β2 ($50,000 ≤ Amount< $150,000)i + εi
where Bankruptcyi is a dummy variable equal to one if individual i filed for bankruptcy within a given
number of years after winning, αi is a set of fixed effects for the year in which the individual won,
(After Change in Game Structure)i is a dummy variable equal to one if the individual won after the
structure of the game was changed on July 16, 2001, and the remaining variables are dummy
variables for various ranges of amounts won where the excluded group is less than $10,000. While
one may object that winning $10,000 may have its own effect on bankruptcy rates, we choose that as
the cutoff because prior to July 16, 2001 there were relatively few winners of less than $3,000.
However, in Section 5.3 we show that the results are robust to using smaller cash prizes as the
omitted group.
5 Although probit or logit estimations can be preferable to ordinary least squares when most values are near zero or one, there are also disadvantages that one might expect to be especially worrisome in this context. For example, omitted variables can cause bias in probit or logit estimations even if they are orthogonal to the treatment variable. In addition, even classical measurement error in the dependent variable can result in inconsistent estimates (Hausman, 2001; Hausman et al, 1998).
9
Finally, for ease of exposition, we will hereafter refer to recipients of less than $10,000 as
“small winners,” winners of $10,000 to $50,000 as “medium winners,” and winners of $50,000 to
$150,000 as “large winners.”
5. Results
5.1 Tests of the Identification Strategy
To demonstrate that the size of the income shock is random and thus uncorrelated with
underlying financial well-being, we provide two tests. First, we check whether amount won is
explained by the winners’ neighborhood characteristics. Specifically, we regress amount won on 13
variables measuring zip code income, race gender, marital status, and educational attainment, and
find that only one is significant at the 5% level.6 More importantly, all 13 variables explain only
0.1% of the total variation in amount won.
Second, we examine the extent to which filing for bankruptcy prior to winning the lottery is
predicted by the amount later won. So long as the amount won is uncorrelated with one’s
underlying propensity to file for bankruptcy, there should be no difference between the bankruptcy
rates of individuals who later win large or small cash prizes.
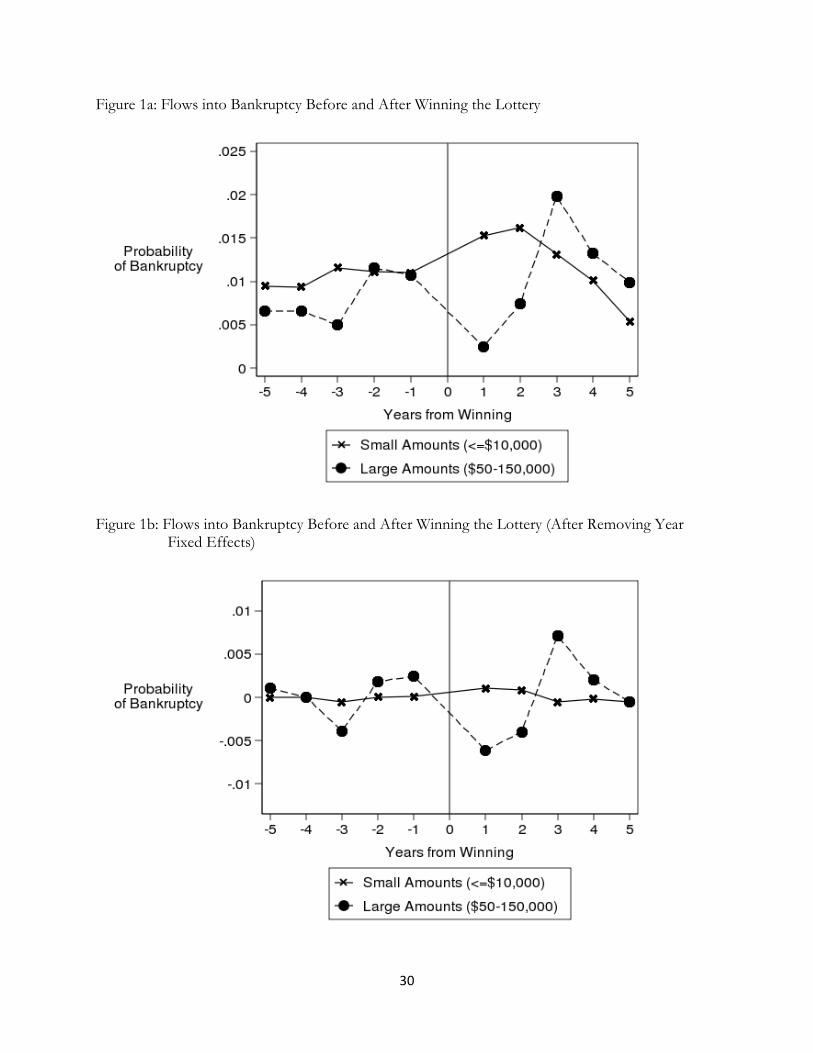
This is shown graphically in Figure 1a, which plots flows into bankruptcy before and after
winning for both small and large winners. While the pre-winning bankruptcy rates of medium and
large winners appear lower than those of small winners, this could be due to change in the game in
2001 that shifted the relative number of large versus small winners. To the extent that
macroeconomic determinants of bankruptcy also varied over time, small winners could on average
6 That variable is median household income, the coefficient of which implies that a $10,000 increase in neighborhood income is associated with a prize that is $400 smaller, which is quite small relative to the prize examined in this paper.

10
be more or less exposed to those forces than large winners. To determine if this is the case, in
Figure 1b we graph residual bankruptcy rates after partialing out year fixed effects. The results show
that this eliminates the pre-winning rate differences.
This is confirmed more formally in Table 3. Although the unconditional means in
specification 1 suggest that medium and large winners were less likely to file for bankruptcy than
small winners before winning, this difference is dramatically diminished and is no longer statistically
significant once one controls for either the change in game structure (specification (2)), year fixed
effects (specification 3), or both (specification 4). This indicates that once one accounts for the fact
that large and small winners were on average exposed to different macroeconomic forces due to the
change in the game, there is little correlation between the size of the cash prize and one’s underlying
propensity to file for bankruptcy.
Figure 1b: Flows into Bankruptcy Before and After Winning the Lottery (After Removing Year Fixed Effects)

11
5.2 The Effect of Lottery Winnings on Bankruptcy Rates
We now turn to estimating the impact of receiving large cash prizes on future bankruptcy
rates. Figures 1a and 1b show the flows into bankruptcy for large and small winners after winning
the lottery and indicate that large winners are much less likely to file for bankruptcy in the two years
after winning. This pattern reverses from years three through five, however, during which time large
winners are more likely to file for bankruptcy than are small winners.
To investigate this pattern more rigorously, we estimate the impact of winning large lump
sums on bankruptcy rates within two years, from three to five years, and within five years after
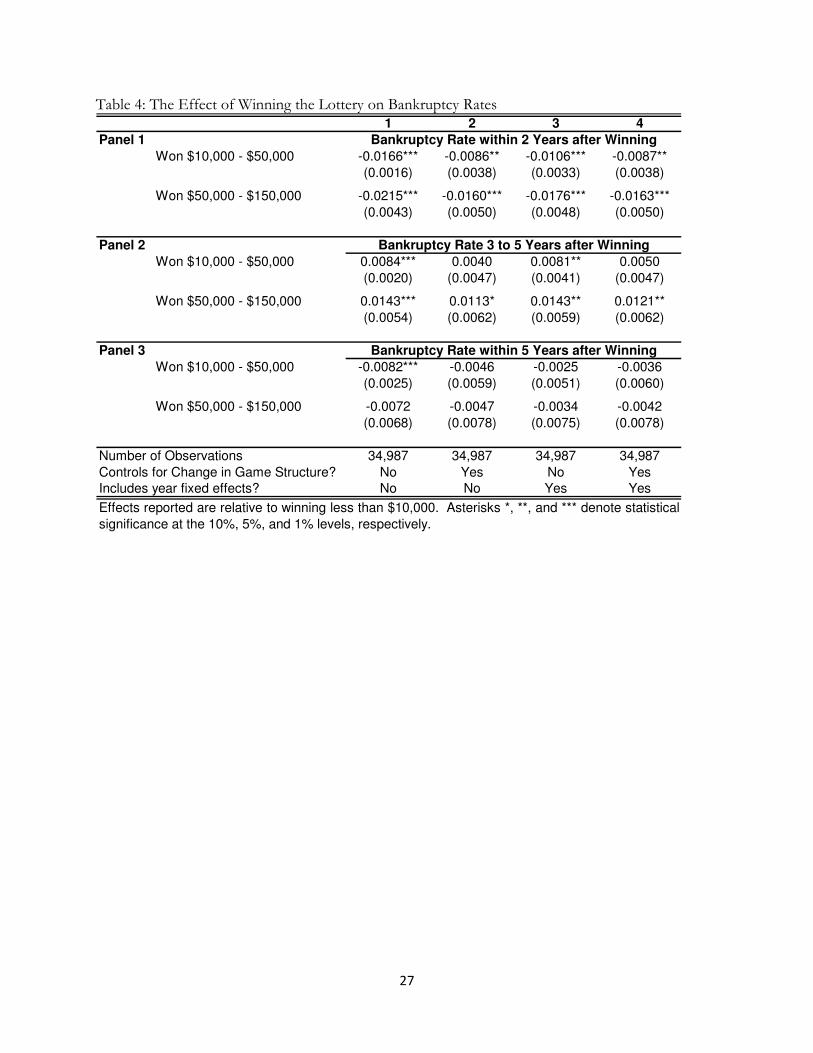
winning. Results are shown in Table 4, where specification 1 shows unconditional differences,
specification 2 controls for the change in the game structure, specification 3 controls for year fixed
effects, and specification 4 controls for both the change in the game structure and year fixed effects.
Consistent with Figures 1a and 1b, we find statistically significant decreases in bankruptcy rates in
the two years after winning, a result that is robust across all of the specifications. Our preferred
specification in specification 4 shows that the bankruptcy rates of medium and large winners fall
0.87 and 1.63 percentage points in the first two years, which represent relative declines of 27 and 50
percent. These declines are offset, however, by increases of 0.5 and 1.21 percentage points three to
five years after winning, respectively, although the increase is only statistically significant for large
winners. The net result is that within five years after winning, medium and large winners are no
more or less likely to file for bankruptcy than are small winners. This is true despite the fact that the
median large winner won a cash prize ($65,000) that was sufficient to pay off all of the unsecured
debt owed by the most financially distressed lottery players ($49,000) at the time of winning.7
7 This figure comes from the bankruptcy filings of lottery players who filed for bankruptcy in the year prior to winning the lottery. These data are discussed in more depth in Section 6.

12
In order to show that this pattern is not driven by the admittedly arbitrary definitions of
small, medium, and large winners, we also show how bankruptcy rates over these time periods vary
across the full distribution of earnings. Figures 2, 3, and 4 show the bankruptcy rates of all
individuals within two years, from three to five years, and within five years of winning the lottery.
The graphical evidence is consistent with the results in Table 4: Figure 2 shows that the likelihood of
filing for bankruptcy within the first two years after winning is smaller for winners of large cash
prizes while Figure 3 shows that this trend reverses three to five years after winning. Finally, Figure
4 shows there is little evidence that winning larger cash prizes affects overall bankruptcy rates in the
five years after winning.
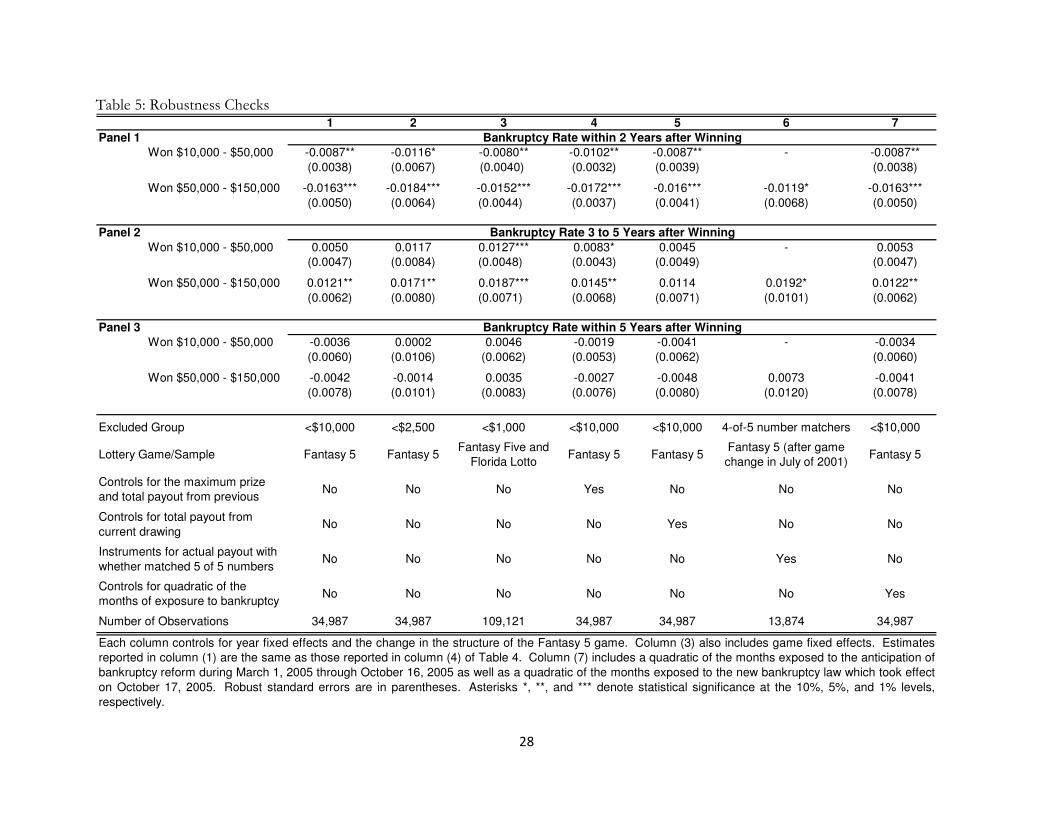
5.3 Robustness of the Results
We investigate the robustness of these results in several ways. First, while we defined the
omitted group as amounts less than $10,000 in order to ensure reasonable numbers of small and
large winners in each year, one might be concerned that winning up to $10,000 has its own effect on
bankruptcy rates. Consequently, we examine whether the effect is different when estimated relative
to winning less than $2,500. Results are shown in specification 2 of Table 5, where the first
specification serves as a reference by showing the preferred result from specification 4 of Table 4.
Results show similar declines in bankruptcy rates for medium and large winners in the two years
after winning and statistically significant increases in bankruptcy rates for medium and large winners
three to five years after winning. In addition, in order to define the control group even more
conservatively, in specification 3 of Table 5 we include winners from Florida Lotto8 and control for
8 Florida Lotto is similar to Fantasy 5 except that individuals can match up to 6 numbers and win a maximum prize of several million dollars. We use data on individuals who matched 5 of 6 numbers and thus won between $600 and $20,000.
13
game fixed effects and find similar results when comparing large winners to those who received less
than $1,000.
To further test the validity of our identification strategy we allow for the possibility that the
pool of players in a given drawing may change depending on the size of the pot and the size of the
largest prize won in the previous drawing. To the extent that these changes are correlated with
expected prize size, estimates could be biased. Consequently, we include controls for both the total
amount paid out in the previous drawing9 and the maximum prize won in the previous drawing
(specification 4) as well as the total amount paid out in the current drawing (specification 5). Results
in Table 5 and indicate that these controls make little difference.
Perhaps a more worrisome possibility is that while the total number of players (and thus
prize pot) is exogenous, the number of individuals who match all 5 numbers on a given day is not.
For example, one might be worried that certain individuals play “more random” numbers than
others and thus win more, conditional on matching all 5 numbers. While we showed earlier that this
was unlikely since large and small winners come from the same neighborhoods and did not file for
bankruptcy at different rates prior to winning, here we offer an additional test. After the game
structure changed on July 16, 2001, the prize size was determined largely by whether the individual
matched 5 of 5 numbers or matched 4 of 5 numbers when no one else matched all 5. Individuals
who matched 5 numbers won an average of $80,000, while those who matched 4 numbers during
this time period won just over $1,000. Consequently, we instrument for being a large winner using
an indicator for whether the individual matched 5 of 5 numbers.
9 This excludes amounts less than $600, which we do not observe.

14
Results are shown in specification 6 of Table 5 and show that large winners (as proxied by
having matched 5 of 5 numbers) are 1.2 percentage points less likely to file for bankruptcy in the
first two years (p=0.081) but are 1.9 percentage points more likely to file three to five years
afterward (p=0.058). Given whether an individual matches 5 rather than 4 numbers is purely
random, we interpret this as compelling evidence in support of our identification strategy.
Finally, we examine whether differential exposure of large and small winners to bankruptcy
reform is driving the results. The Bankruptcy Abuse Prevention and Consumer Protection Act
(BAPCPA) was signed on April 20, 2005 and went into effect on October 17, 2005. In anticipation
of the change, bankruptcy filings increased beginning in March of 2005 and peaked in October
before the law went into effect. While we would expect that year fixed effects would control for
much of the effect of bankruptcy reform, we also construct two control variables that capture
exposure to these effects more precisely. The first measures the number of months during the time
period in question in which the individual faced a greater incentive to file for bankruptcy given the
expectation that BAPCPA would take effect. The second control variable measures the number of
months during the time period in question in which the lottery winner faced a reduced probability of
filing for bankruptcy due to the tougher bankruptcy laws. For example, an individual who won on
June 1 of 2001 was exposed to all 7.5 months (from March 1 of 2005 through October 16, 2005) in
which consumers expected a tougher bankruptcy law in the future and 7.5 months facing the new
bankruptcy law (from October 17, 2005 when the new law went into effect through May 31, 2006,
exactly five years after winning).
Results are shown in the specification 7 of Table 5 and are consistent with the findings
reported earlier. Together with results from specifications 2 through 6, this implies that the results
are unaffected by the choice of control group, the current or previous drawing’s prize pool, the

15
previous drawing’s maximum prize won, or bankruptcy reform. In addition, the results are robust to
comparing the subset of large and small winners for whom the variation in winnings is
unquestionably random. In addition, in results available upon request we find that similar estimates
result when estimating the effect of the cash transfers using a probit instead of ordinary least
squares.10
5.4 Attrition
As noted earlier, individuals were linked to bankruptcy based on first and last name as well
as county of residence. Given this approach, attrition will cause a problem for identification under
two conditions: 1) the amount won is correlated with propensity to move out of the county, and 2)
some of the individuals who moved out of the county on the basis of amount won filed for
bankruptcy in the next five years. In other words, if migration is orthogonal to amount won, then
there will be no bias. Similarly, if none of the individuals who move out of the county file for
bankruptcy, then there is no error in who is ultimately matched to a bankruptcy.
Migration is perhaps less likely to be an issue in Florida than in other states for two reasons.
First, counties in Florida represent relatively large geographic areas. For example, the average
county in Florida (by population) is 1,866 square miles, or more than six times the size of New York
City.11 In addition, Florida is a net in-migration state over this time period. Consequently, one might
expect that exiting the county after winning $50,000 to $150,000 would be less likely in Florida than
it would be in other states.
10 Specifically, marginal effects from probit estimations indicate that large winners are 1.3 percentage points (p=0.000) less likely to file within 2 years of winning and are 1.16 percentage points (p=0.117) more likely to file 3 to 5 years afterward.
11 Sources: www.fl-counties.com and www.census.gov/popest.

16
We can offer an empirical test of whether receiving large amounts of cash causes people to
leave the county. Specifically, we examine whether the amount won is correlated with the likelihood
that the individual will be found in the 2008 phone book 1, 2, 3, 4, 5, and 6 years after winning.
While this is an imperfect test due to the fact that some households no longer have landlines, some
individuals in a household with a landline are not listed in the phone book, and winning the lottery
could potentially enable individuals to afford a landline, the exercise is instructive nonetheless. One
might especially be concerned if large winners were much less likely to show up in the phone book
in the first two years after winning the lottery, but then were much more likely to show up in the
phonebook three to five years after winning. In that case, one might worry that the results were
being driven by selective migration out of the county.
The results from this exercise (available upon request) show no evidence of such a pattern.
Specifically, we find that large winners were a statistically insignificant 3.0 percentage points more
likely to show up in the phone book within two years of winning the lottery relative to small
winners, of whom 30.4 percent were listed in the county phone book. The difference in years three
through five is a similarly insignificant 3.1 percentage points. Collectively, this provides suggestive
evidence that the pattern seen in bankruptcy rates is not driven by selective migration out of the
county.
6. Discussion
There are several potential explanations of the result that in the aggregate, receiving large
financial windfalls only delays bankruptcy rather than prevents it. Perhaps the simplest
interpretation is that bankruptcy is postponed at the individual level. For example, while indebted
individuals may use financial windfalls to continue to make payments to creditors and/or increase
their consumption in the near term, they may not pay down debt sufficiently to avoid bankruptcy in

17
the longer term. This could occur if individuals have high discount rates, engage in mental
accounting, or struggle with financial literacy. Alternatively, recipients of large cash windfalls may
find it optimal to game the bankruptcy system by consuming or protecting their windfall in the
expectation that they will later file for bankruptcy anyway. In fact, Florida bankruptcy law allows for
an unlimited homestead exemption, which provides an incentive for individuals to increase their
equity in real estate as a way of protecting their winnings from creditors in bankruptcy court.
A different interpretation of the results is that receiving large cash windfalls does not delay
bankruptcy at the individual level. Instead, it may be that some individuals use their winnings to
avoid bankruptcy while others make consumption commitments with their cash such as buying a
house. In the years afterward, a fraction of those winners will be subjected to a negative income
shock that would not have pushed them into bankruptcy had they not bought a house (Zhu, 2008).
To help distinguish between these interpretations and to address whether large winners who
subsequently file for bankruptcy have less debt than small winners, we acquired data on cases filed
after 2004, the year at which details of bankruptcy filings became available electronically.
Specifically, we retrieved data for a random sample of people who won less than $1,500 and 1) filed
in the 5 years prior to winning, or 2) filed zero to two years after winning, or 3) filed three to five
years after winning. In addition, we retrieved and coded data from the case filings of all recipients of
more than $25,000 who filed after 2004 and for whom the filing was up to five years before winning,
zero to two years after winning, or three to five years after winning. We emphasize that many of
these lottery winners were not in our original dataset since we could only acquire detailed data for
cases filed after 2004.
The descriptive statistics for this sample of filers are shown in Table 6 and show the levels of
debt, assets, income, expenditures and real estate averaged over all individuals in each group,
18
including those who reported zeros. Panel A shows that there is no economically or statistically
significant difference between the assets, debts, income, and expenditures of larger and smaller
winners who filed for bankruptcy before winning the lottery. While larger winners were somewhat
more likely to be homeowners than smaller winners (75% vs. 56%), despite that difference larger
winners as a group owned slightly less property and had less equity in that property. None of the
differences are statistically significant at conventional levels, which is consistent with the falsification
exercises in Table 3 and provides further support for the identifying assumption.
Panel B shows the characteristics of individuals who filed for bankruptcy within 2 years after
winning. Figures there show evidence consistent with multiple interpretations. Larger winners who
did not avoid bankruptcy in the near term were those who had the highest level of debt. This
suggests that in the short term, large cash windfalls do reduce bankruptcy filings by those with the
least to gain from filing. However, large winners who file in the near term also have significantly
higher housing commitments; seventy-four percent owned their homes compared to fifty-two
percent of small winners who filed.
Panel C shows the characteristics of individuals who filed 3 to 5 years after winning the
lottery and provides some evidence on whether the increase in the rate 3 to 5 years later is due to
consumption commitments. If such commitments were responsible, then one might expect large
winners who filed during this time to be more likely to be homeowners and to live in more valuable
homes. However, we find no evidence that this is the case.12
12 In checking the sensitivity of the figures in Table 6 to outliers, we found one larger winner who filed 3 to 5 years afterward and who reported living in a house worth over $1 million. Consequently, we excluded this individual when calculating the average real estate market value and equity in Panels C and D in Table 6. Including this individual changes average equity and market value to $27,810 and $92,023 in Panel C and to $24,940 and $109,152 in Panel D.

19
Panel D shows the characteristics of winners who filed at some point within 5 years after
winning. There, it is striking that the net assets of recipients of $25,000 to $150,000 were only
$8,000 higher than those of people who won less than $1,500. Furthermore, small winners who
filed reported having unsecured debt of $58,438 while large winners reported a similar amount of
$51,993. We also find that although large winners live in somewhat more expensive houses than
small winners, they are no more likely to own a home and have no more equity in their homes than
small winners. This suggests that larger winners are not gaming the homestead exemption in Florida
bankruptcy law. While this may surprise some economists, it did not surprise bankruptcy lawyers
with whom we spoke13 and is consistent with other evidence more supportive of a notion of
bounded rationality among lottery players (Guryan and Kearney, 2008).
In short, we find little evidence that the increase in the bankruptcy rates of large winners
three to five years after winning is due to consumption commitments. The data also provide no
support for the interpretation that large winners game the bankruptcy system by taking advantage of
Florida’s unlimited homestead exemption in bankruptcy since there is no difference in the real estate
equity of large and small winners who subsequently file for bankruptcy. However, we are ultimately
unable to distinguish whether large winners delay rather than prevent filing for bankruptcy due to
impatience (rational or otherwise) or some other reason.
Finally, we find that the net assets of recipients of $25,000 to $150,000 are no different from
those who received less than $1,500. This suggests that whatever the recipients did with their cash,
they did not use it to either pay down debt or increase their assets. This result is roughly consistent
with that of Agarwal, Liu, and Souleles (2007) who find that although consumers initially used
13 One in particular commented that this type of behavior is so unlikely that “only economists would be concerned about that.”

20
federal rebate checks to reduce debt, eventually debt levels returned to their pre-rebate levels. The
fact that the same appears to be true even when consumers receive vastly larger cash transfers is,
however, striking.
7. Conclusion
We investigate the extent to which receiving large lump sums of cash affect bankruptcy in
the short- and long-term. To distinguish the effect of the transfer from other confounding factors,
we compare lottery players who won between $10,000 and $50,000 or between $50,000 and
$150,000 to those who won less than $10,000. Consistent with the identifying assumption that the
magnitude of the prize won is randomly assigned conditional on winning, we find no statistical
difference between these groups’ bankruptcy rates prior to winning or in the assets, debts, incomes,
or expenditures of those winners who did file prior to winning the lottery.
The results indicate that while the lump-sum payments reduce the probability of bankruptcy
in the first two years after winning in an economically and statistically significant way, this reduction
is followed by statistically significant increases of similar magnitude three to five years after winning.
Furthermore, a deeper examination of the bankruptcy filings shows that not only are the rates of
bankruptcy not different overall, but recipients of $25,000 to $150,000 who later filed for
bankruptcy did so with similar levels of net assets and unsecured debt. Bankruptcy records also
reveal little evidence that large winners filed for bankruptcy due to increased housing consumption
commitments or in order to game the unlimited homestead exemption in Florida bankruptcy law.
This indicates that receiving cash transfers that are sufficiently large to pay off all of one’s unsecured
debt only enables individuals to postpone rather than prevent bankruptcy.
These results are broadly consistent with the strategic or opportunistic model of bankruptcy
rather than the negative-shock model, though we note that we are unable to distinguish between

21
opportunism and other behavioral issues such as high discount rates. In addition, our findings
suggest that some skepticism regarding the long-term effects of financial aid targeted at indebted
individuals may be warranted.

22
References
Agarwal, Sumit, Chunlin Liu, and Nicholas Souleles. 2007. “The Reaction of Consumer Spending and Debt to Tax Rebates—Evidence from Consumer Credit Data.” Journal of Political Economy 115 (6).
Angrist, Joshua, Guido Imbens, and Donald Rubin. 1996. “Identification of Causal Effects Using Instrumental Variables.” Journal of the American Statistical Association 91 (434): 444-455.
Clotfelter, Charles, Phillip Cook, Julie Edell, and Marian Moore. 1999. “State Lotteries at the Turn of the Century: Report to the National Gambling Impact Study Commission.”
Chetty, Raj, and Adam Szeidl. 2007. “Consumption Commitments and Risk Preferences.” Quarterly Journal of Economics 122 (2): 831-877.
DellaVigna, Stefano. "Psychology and Economics: Evidence from the Field." Journal of Economic Literature, forthcoming.
Fay, Scott, Erik Hurst, and Michelle J. White. 2002. “The Household Bankruptcy Decision.” American Economic Review 92:3 706-718.
Frederick, Shane, George Loewenstein and Ted O'Donoghue. 2002. "Time Discounting and Time Preferences: A Critical Review." Journal of Economic Literature 40 (2): 351-401.
Guryan, Jonathan, and Melissa S. Kearney. 2008. “Gambling at Lucky Stores: Empirical Evidence from State Lottery Sales.” American Economic Review 98 (1): 458-473.
Hausman, Jerry, Jason Abrevaya, and F. M. Scott-Morton. 1998. “Misclassification of the Dependent Variable in a Discrete-Response Setting.” Journal of Econometrics, 87 (2): 239-269.
Hausman, Jerry. 2001. “Mismeasured Variables in Econometric Analysis: Problems from the Right and Problems from the Left.” Journal of Economic Perspectives 15 (4): 57-67.
Himmelstein, David U., Deborah Thorne, Elizabeth Warren, and Steffie Woolhandler. 2009. “Medical Bankruptcy in the United States, 2007.” American Journal of Medicine 122 (8): 741-746.
Higert, Marianne A., Jeanne M. Hogarth, and Sondra G. Beverly. 2003. “Household Financial Management: The Connection Between Knowledge and Behavior.” Federal Reserve Bulletin July: 309-322.
Imbens, Guido W., Donald B. Rubin, and Bruce I. Sacerdote. 2001. “Estimating the Effect of Unearned Income on Labor Earnings, Savings, and Consumption: Evidence from a Survey of Lottery Players.” American Economic Review 91 (4): 778-794.
Jacquette v. Continental Casualty Company, No. 99-6005, U.S. Court of Appeals (3rd Circuit, December 28, 1999 p. 12).
Kearney, Melissa. 2005. “State Lotteries and Consumer Behavior.” Journal of Public Economics 89 (11-12): 2269-2299.
23
Lindahl, Mikael. 2005. “Estimating the Effect of Income on Health and Mortality Using Lottery Prizes as an Exogenous Source of Variation in Income.” Journal of Human Resources 40 (1): 144-168.
Lusardi, Annamaria and Olivia Mitchell. 2007. "Financial Literacy and Retirement Preparedness. Evidence and Implications for Financial Education," Business Economics, January 2007, 35-44.
O'Donoghue, Ted and Matthew Rabin. 1999. "Doing It Now or Later." American Economic Review, 89 (1): 103-124.
Pryor, Ellen S. 2002. “After the Judgment.” Virginia Law Review 88: 1757-1830.
Shapiro, Jesse M. 2005. “Is There a Daily Discount Rate? Evidence from the Food Stamp Nutrition Cycle.” Journal of Public Economics 89 (2-3): 303-325.
Stephens, Melvin Jr. 2003 “ ‘3rd of the Month’: Do Social Security Recipients Smooth Consumption between Checks?” American Economic Review 93 (1): 406-422.
Thaler, Richard. 1990. “Saving, Fungibility, and Mental Accounts.” Journal of Economic Perspectives 4: 193-205.
Thaler, Richard H. and Eric J. Johnson. 1990. “Gambling with the House Money and Trying to Break Even: The Effects of Prior Outcomes on Risky Choice.” Management Science 36 (6): 643-660.
White, Michelle. 2006. “Abuse or Protection?” Regulation 29 (3): 28-35.
Zhu, Ning. 2008. “Household Consumption and Personal Bankruptcy.” Forthcoming in the Journal of Legal Studies.

24
Table 1: The Sample of Unique, First-Time Lottery Winners in Florida from May 1993 – December 2002
Amount Freq. Percent Freq. Percent Freq. Percent
<$1,000 8,494 15.08 5,670 14.56 4,888 13.93
$1,000 - $2,500 15,239 27.06 10,190 26.17 8,657 24.68
$2,500 - $5,000 413 0.73 295 0.76 274 0.78
$5,000 - $7,500 577 1.02 404 1.04 373 1.06
$7,500 - $10,000 728 1.29 513 1.32 476 1.36
$10,000 - $15,000 3,028 5.38 2,144 5.51 1,964 5.60
$15,000 - $20,000 5,682 10.09 4,038 10.37 3,760 10.72
$20,000 - $25,000 6,298 11.18 4,460 11.45 4,177 11.91
$25,000 - $30,000 5,418 9.62 3,836 9.85 3,610 10.29
$30,000 - $35,000 3,911 6.95 2,764 7.10 2,583 7.36
$35,000 - $40,000 2,183 3.88 1,582 4.06 1,499 4.27
$40,000 - $45,000 1,446 2.57 1,042 2.68 975 2.78
$45,000 - $50,000 802 1.42 574 1.47 539 1.54
$50,000 - $60,000 837 1.49 553 1.42 512 1.46
$60,000 - $70,000 393 0.70 287 0.74 271 0.77
$70,000 - $80,000 209 0.37 150 0.39 134 0.38
$80,000 - $90,000 124 0.22 77 0.20 69 0.20
$90,000 - $100,000 130 0.23 90 0.23 79 0.23
$100,000 - $150,000 248 0.44 167 0.43 147 0.42
Total 56,160 100 38,836 100 34,987 100
All Fantasy 5 Winners Unique in Phone Book First Time Winners

25
Table 2: Lottery Players Linked to Bankruptcy Petitions
Amount Won No Bankruptcy Bankruptcy % Bankruptcy No Bankruptcy Bankruptcy % Bankruptcy No Bankruptcy Bankruptcy % Bankruptcy
<$1,000 4,742 146 2.99 4,767 121 2.48 4,621 267 5.46$1,000 - $2,500 8,367 290 3.35 8,399 258 2.98 8,109 548 6.33
$2,500 - $5,000 264 10 3.65 264 10 3.65 254 20 7.30$5,000 - $7,500 367 6 1.61 357 16 4.29 351 22 5.90$7,500 - $10,000 467 9 1.89 462 14 2.94 453 23 4.83
$10,000 - $15,000 1,937 27 1.37 1,886 78 3.97 1,859 105 5.35$15,000 - $20,000 3,705 55 1.46 3,628 132 3.51 3,573 187 4.97
$20,000 - $25,000 4,112 65 1.56 4,026 151 3.62 3,961 216 5.17$25,000 - $30,000 3,554 56 1.55 3,474 136 3.77 3,418 192 5.32
$30,000 - $35,000 2,548 35 1.36 2,494 89 3.45 2,459 124 4.80$35,000 - $40,000 1,476 23 1.53 1,433 66 4.40 1,410 89 5.94
$40,000 - $45,000 959 16 1.64 946 29 2.97 930 45 4.62$45,000 - $50,000 532 7 1.30 514 25 4.64 507 32 5.94$50,000 - $60,000 507 5 0.98 493 19 3.71 488 24 4.69
$60,000 - $70,000 269 2 0.74 255 16 5.90 253 18 6.64$70,000 - $80,000 132 2 1.49 129 5 3.73 127 7 5.22
$80,000 - $90,000 69 0 0.00 66 3 4.35 66 3 4.35$90,000 - $100,000 77 2 2.53 75 4 5.06 73 6 7.59
$100,000 - $150,000 146 1 0.68 142 5 3.40 141 6 4.08Total 34,230 757 2.16 33,810 1,177 3.36 33,053 1,934 5.53
Within 2 Years Between 3 & 5 Years Within 5 Years

26
Table 3: Falsification Test: The Effect of Later Winning the Lottery on Bankruptcy Rates 1 2 3 4
Panel 1
Won $10,000 - $50,000 -0.0061*** -0.0011 -0.0028 -0.0006
(0.0015) (0.0035) (0.0031) (0.0036)
Won $50,000 - $150,000 0.0002 0.0037 0.0026 0.0041
(0.0041) (0.0046) (0.0045) (0.0046)
Panel 2
Won $10,000 - $50,000 -0.0134*** 0.0024 0.0043 0.0041
(0.0016) (0.0039) (0.0033) (0.0039)
Won $50,000 - $150,000 -0.0123*** -0.0013 -0.0001 -0.0002
(0.0044) (0.0051) (0.0049) (0.0051)
Panel 3
Won $10,000 - $50,000 -0.0195*** 0.0013 0.0015 0.0035
(0.0022) (0.0052) (0.0045) (0.0052)
Won $50,000 - $150,000 -0.0121** 0.0024 0.0025 0.0039
(0.0060) (0.0068) (0.0066) (0.0068)
Number of Observations 34,987 34,987 34,987 34,987
No Yes No YesNo No Yes YesIncludes year fixed effects?
Effects reported are relative to winning less than $10,000. Asterisks *, **, and *** denote statistical
significance at the 10%, 5%, and 1% levels, respectively.
Bankruptcy Rate in the 2 Years prior to Winning
Bankruptcy Rate 3 to 5 Years prior to Winning
Bankruptcy Rate in the 5 Years prior to Winning
Controls for Change in Game Structure?
27
Table 4: The Effect of Winning the Lottery on Bankruptcy Rates 1 2 3 4
Panel 1
Won $10,000 - $50,000 -0.0166*** -0.0086** -0.0106*** -0.0087**
(0.0016) (0.0038) (0.0033) (0.0038)
Won $50,000 - $150,000 -0.0215*** -0.0160*** -0.0176*** -0.0163***
(0.0043) (0.0050) (0.0048) (0.0050)
Panel 2
Won $10,000 - $50,000 0.0084*** 0.0040 0.0081** 0.0050
(0.0020) (0.0047) (0.0041) (0.0047)
Won $50,000 - $150,000 0.0143*** 0.0113* 0.0143** 0.0121**
(0.0054) (0.0062) (0.0059) (0.0062)
Panel 3
Won $10,000 - $50,000 -0.0082*** -0.0046 -0.0025 -0.0036
(0.0025) (0.0059) (0.0051) (0.0060)
Won $50,000 - $150,000 -0.0072 -0.0047 -0.0034 -0.0042
(0.0068) (0.0078) (0.0075) (0.0078)
Number of Observations 34,987 34,987 34,987 34,987
No Yes No YesNo No Yes YesIncludes year fixed effects?
Effects reported are relative to winning less than $10,000. Asterisks *, **, and *** denote statistical
significance at the 10%, 5%, and 1% levels, respectively.
Bankruptcy Rate within 2 Years after Winning
Bankruptcy Rate 3 to 5 Years after Winning
Bankruptcy Rate within 5 Years after Winning
Controls for Change in Game Structure?
28
Table 5: Robustness Checks 1 2 3 4 5 6 7
Panel 1
Won $10,000 - $50,000 -0.0087** -0.0116* -0.0080** -0.0102** -0.0087** - -0.0087**
(0.0038) (0.0067) (0.0040) (0.0032) (0.0039) (0.0038)
Won $50,000 - $150,000 -0.0163*** -0.0184*** -0.0152*** -0.0172*** -0.016*** -0.0119* -0.0163***
(0.0050) (0.0064) (0.0044) (0.0037) (0.0041) (0.0068) (0.0050)
Panel 2
Won $10,000 - $50,000 0.0050 0.0117 0.0127*** 0.0083* 0.0045 - 0.0053(0.0047) (0.0084) (0.0048) (0.0043) (0.0049) (0.0047)
Won $50,000 - $150,000 0.0121** 0.0171** 0.0187*** 0.0145** 0.0114 0.0192* 0.0122**
(0.0062) (0.0080) (0.0071) (0.0068) (0.0071) (0.0101) (0.0062)
Panel 3
Won $10,000 - $50,000 -0.0036 0.0002 0.0046 -0.0019 -0.0041 - -0.0034
(0.0060) (0.0106) (0.0062) (0.0053) (0.0062) (0.0060)
Won $50,000 - $150,000 -0.0042 -0.0014 0.0035 -0.0027 -0.0048 0.0073 -0.0041
(0.0078) (0.0101) (0.0083) (0.0076) (0.0080) (0.0120) (0.0078)
<$10,000 <$2,500 <$1,000 <$10,000 <$10,000 4-of-5 number matchers <$10,000
Number of Observations 34,987 34,987 109,121 34,987 34,987 13,874 34,987
Each column controls for year fixed effects and the change in the structure of the Fantasy 5 game. Column (3) also includes game fixed effects. Estimatesreported in column (1) are the same as those reported in column (4) of Table 4. Column (7) includes a quadratic of the months exposed to the anticipation of
bankruptcy reform during March 1, 2005 through October 16, 2005 as well as a quadratic of the months exposed to the new bankruptcy law which took effect
on October 17, 2005. Robust standard errors are in parentheses. Asterisks *, **, and *** denote statistical significance at the 10%, 5%, and 1% levels,
respectively.
Controls for quadratic of the months of exposure to bankruptcy
Lottery Game/Sample Fantasy 5 Fantasy 5 Fantasy 5
No
Fantasy Five and Florida Lotto
No
Fantasy 5
Bankruptcy Rate within 2 Years after Winning
Bankruptcy Rate 3 to 5 Years after Winning
Bankruptcy Rate within 5 Years after Winning
Excluded Group
Yes
YesNoNo No
No
No
No
No
No
Controls for the maximum prize and total payout from previous
No No No
Fantasy 5Fantasy 5 (after game change in July of 2001)
No No
No No
Controls for total payout from
current drawing
Instruments for actual payout with
whether matched 5 of 5 numbers
Yes
Yes
No
No
No No
NoNo No

29
Table 6: Debts, Assets, Expenditures, and Income of Lottery Winners Who File for Bankruptcy Panel A: 0-5 Years Prior to Win
Income, Expenditures, and Real Estate
Large Winners Small Winners Diff Large Winners Small Winners Diff
N=20 N=52 N=20 N=52
Unsecured Debt ($) 44,717 50,921 -6,204 % Homeowner 75% 56% 19
Secured Debt ($) 63,556 66,972 -3,416 Equity in Real Estate ($) 20,771 31,209 -10,438
Total Debt ($) 108,274 117,893 -9,620 Market Value of Real Estate ($) 79,505 84,592 -5,087
Total Assets ($) 93,395 94,529 -1,133 Annual Household Income ($) 16,213 17,529 -1,316
Net Assets ($) -14,878 -23,364 8,486 Annual Expenditures ($) 23,519 23,955 -436
Panel B: 0-2 Years Post Win
Large Winners Small Winners Diff Large Winners Small Winners Diff
N=17 N=61 N=17 N=61
Unsecured Debt ($) 76,813 60,752 16,061 % Homeowner 76% 52% 24
Secured Debt ($) 131,708 63,487 68,220** Equity in Real Estate ($) 18,861 17,621 1,240
Total Debt ($) 208,521 124,239 84,282** Market Value of Real Estate ($) 145,425 73,170 72,255**
Total Assets ($) 164,406 93,971 70,434** Annual Household Income ($) 24,714 23,409 1,304
Net Assets ($) -44,115 -30,268 -13,847 Annual Expenditures ($) 35,124 31,122 4,002
Panel C: 3-5 Years Post Win
Large Winners Small Winners Diff Large Winners Small Winners Diff
N=36 N=44 N=36 N=44
Unsecured Debt ($) 40,273 55,230 -14,957 % Homeowner 53% 45% 8
Secured Debt ($) 74,938 73,113 1,825 Equity in Real Estate ($) 22,903 33,827 -10,924
Total Debt ($) 115,211 128,343 -13,132 Market Value of Real Estate ($) 62,367 95,261 -32,894
Total Assets ($) 113,571 114,303 -733 Annual Household Income ($) 17,395 20,510 -3,115
Net Assets ($) -1,641 -14,040 12,399 Annual Expenditures ($) 22,300 26,717 -4,417
Panel D: 0-5 Years Post Win
Large Winners Small Winners Diff Large Winners Small Winners Diff
N=53 N=105 N=53 N=105
Unsecured Debt ($) 51,993 58,438 6,445 % Homeowner 60% 50% 10
Secured Debt ($) 93,147 67,521 25,627 Equity in Real Estate ($) 21,582 24,412 -2,831
Total Debt ($) 145,141 125,959 19,182 Market Value of Real Estate ($) 89,521 82,427 7,093
Total Assets ($) 129,876 102,491 27,385 Annual Household Income ($) 19,742 22,194 -2,452
Net Assets ($) -15,265 -23,468 8,203 Annual Expenditures ($) 26,413 29,276 -2,863Note: Each panel shows average characteristics of lottery winners who filed for personal bankruptcy. Asterisks *, **, and *** denote statistical significance at the 10%, 5%, and 1%
levels, respectively. Source: PACER.
Debt and Assets
Debt and Assets
Debt and Assets
Debt and Assets Income, Expenditures, and Real Estate
Income, Expenditures, and Real Estate
Income, Expenditures, and Real Estate
30
Figure 1a: Flows into Bankruptcy Before and After Winning the Lottery
Figure 1b: Flows into Bankruptcy Before and After Winning the Lottery (After Removing Year Fixed Effects)

31
Figure 2: Bankruptcy Rates in the First 2 Years after Winning the Lottery
Figure 3: Bankruptcy Rates 3 to 5 Years After Winning the Lottery

32
Figure 4: Bankruptcy Rates in the 5 Years After Winning the Lottery