Embed Size (px)
Citation preview
HAL Id: hal-01956614https://hal-enpc.archives-ouvertes.fr/hal-01956614
Submitted on 16 Dec 2018
HAL is a multi-disciplinary open accessarchive for the deposit and dissemination of sci-entific research documents, whether they are pub-lished or not. The documents may come fromteaching and research institutions in France orabroad, or from public or private research centers.
L’archive ouverte pluridisciplinaire HAL, estdestinée au dépôt et à la diffusion de documentsscientifiques de niveau recherche, publiés ou non,émanant des établissements d’enseignement et derecherche français ou étrangers, des laboratoirespublics ou privés.
The Tianjin Eco-City model in the academic literatureon urban sustainability
Yinghao Li, Hadrien Commenges, Frédérique Bordignon, Céline Bonhomme,José-Frédéric Deroubaix
To cite this version:Yinghao Li, Hadrien Commenges, Frédérique Bordignon, Céline Bonhomme, José-Frédéric Deroubaix.The Tianjin Eco-City model in the academic literature on urban sustainability. Journal of CleanerProduction, Elsevier, 2019, 213, pp.59-74. �10.1016/j.jclepro.2018.12.018�. �hal-01956614�
1
1 The Tianjin Eco-City model in the academic literature on urban
2 sustainability
3 Yinghao Lia,1, Hadrien Commengesa,b Frédérique Bordignonc, Céline Bonhommea, 4 José-Frédéric Deroubaixa
5 aUniversity Paris-Est, Laboratoire Eau Environnement et Systèmes Urbains, Ecole des Ponts ParisTech. 6 Corresponding author. Tel : +86 27 6960 0275. Email : [email protected]
7 bUMR 8504 Géographie-cités, Université Paris 1, Université Paris 7, CNRS
8 cEcole des Ponts ParisTech, Centre de documentation
9 Abstract
10 Recent intensive eco-city development in China has been accompanied by rising 11 enthusiasm for environmental sustainability indicators. Whilst there are calls for the 12 indicators to be standardised, and criticism of the difficulties in applying them, little 13 effort has been made to understand their scientific rationale. This article employs a 14 comprehensive bibliometric analysis to investigate the use of environmental 15 indicators from the Tianjin Eco-City Key Performance Indicators by the international 16 scientific community working on urban sustainability. The findings draw a clear 17 picture of the place of Tianjin Eco-City’s indicators in the international scientific 18 literature. China’s ecological problems are found to attract interest not only from 19 domestic researchers but also researchers outside the country. The indicators are used 20 not only for urban planning and management but also for a wide range of urban-21 related and non-urban-related purposes. The scientific rationale of the eleven 22 indicators is specifically addressed, revealing a number of underlying questions about 23 the Tianjin Eco-City indicators.
24 Key words
25 Urban sustainability, environmental indicators, Tianjin Eco-City KPI, scientific 26 rationale, bibliometric analysis, geographical analysis
27 1 Introduction
28 Following the recent promotion of eco-cities, there is increasing interest among 29 researchers and policy makers in sustainability assessment. A sustainable city can be 30 defined by analogy with the Brundtland Commission’s definition of sustainable 31 development (WCED, 1987) as a city that ensures that development meets the needs 32 of the present without compromising the ability of future generations to meet their 33 own needs. Conventionally incorporated into the triple bottom line of environmental, 34 social and economic criteria, the substantive purpose of sustainability assessment is to 35 provide policymakers and city planners with tools for evaluating their cities and to
1 Present address: N.1 Zhiyinghu Avenue, Caidian District, Wuhan, Hubei, China, 430100
2
36 help them to decide what actions to take and not to take (Devuyst et al., 2001). In this 37 context, the main functions of sustainability assessment include decision-making and 38 decision management, target setting, advocacy, participation and consensus building 39 (Joss et al., 2012; Parris and Kates, 2003; Pastille Consortium, 2002). The indicators 40 can be broken down into single-unit indices (such as ecological footprint, wellbeing 41 index, emergy) and indicator-based indices. By contrast with single-unit indices, 42 which score the combined performances of a city, indicator-based indices provide 43 disaggregated information and are used to track sector-level factors (Fiala, 2008).
44 China has been characterised in recent decades by growing enthusiasm for the 45 development of large-scale eco-cities. At the time of writing, there is no consensus on 46 a rigorous definition of what an eco-city is, and in practice the term is used 47 interchangeably alongside other words for sustainable city models such as 48 “sustainable cities”, “low carbon cities”, “resilient cities”, and so forth, despite the 49 underlying conceptual differences that may exist (de Jong et al., 2015). So the term 50 eco-city may encompass a broad range of factors: carbon-neutral and renewable 51 energy supply; a dense urban fabric supported by a public transport system; resource 52 conservation; water and waste reduction and reuse; green buildings; urban renewal; 53 local urban agriculture; decent and affordable housing for all socio-economic and 54 ethnic groups; improved job opportunities; and voluntary change in lifestyle choices.
55 The Sino-Singaporean Tianjin Eco-City project has been widely discussed since its 56 inception in 2007. Built close to the centre of Tianjin Binhai New Area and the 57 second government-to-government urban project between China and Singapore, 58 Tianjin Eco-City has been designed to leverage Singaporean expertise in “practical”, 59 “replicable” and “scalable” city planning and management (de Jong et al. 2013; M.-C. 60 Hu et al. 2015; Lee et al. 2014; Weiss 2014). In parallel with the making of master 61 plan, a set of indicators – entitled Key Performance Indicators (KPIs) – an umbrella of 62 twenty-two “control” indicators and four “guidance” indicators, was jointly developed 63 by Chinese and Singaporean specialists. The indicators cover major urban sectors 64 such as air, water, transport and energy (Li et al., 2018). Presented as one of the 65 standout features of Tianjin Eco-City and “the first indicators system bespoke to 66 Chinese eco-cities”, the KPI system has been extensively discussed in scientific 67 publications and media communication. However, in-depth studies, among which we 68 can cite the report by Caprotti et al. (2015), have focused on the lack of social balance 69 in this primarily upper-middle-class new town project. There has been little attention 70 on the expected environmental performance of Tianjin Eco-City, which seems have 71 been taken for granted. Other papers are content to praise the high-profile bilateral 72 cooperation in the new town development and the KPIs, with little in-depth scientific 73 investigation.
74 Echoing the enthusiasm for eco-city development in China, there has been intense 75 discussion of sustainable city indicators by both government institutions and urban 76 specialists around the world. Reflecting today’s mainstream concern with the 77 promotion of social equity and economic viability, criticisms of the indicator systems 78 have unsurprisingly concentrated on the imbalance between the environmental and 79 socio-economic aspects (Greed, 2012; Medved, 2016). While recognising the
3
80 importance of reinforcing social equity and environmental viability in the 81 construction of sustainable eco-cities, we argue that this overwhelming focus on the 82 socio-economic dimension may obscure the importance of the environmental 83 indicators themselves. First, environmental challenges remain in the forefront of 84 political discourse (Cook et al., 2017; Hao, 2012; Nelson, 2012; Shiuh-Shen, 2013). 85 Second, environmental performance is a precondition for any achievement in the 86 social and economic arenas, as is apparent in the conventional expression “social and 87 economic development that should be environmentally sustainable”.
88 Given the inherent importance of this environmental dimension of sustainability, 89 governments and non-governmental organisations are keen to devise indicators for the 90 assessment of environmental performance. For instance, the European Union 91 approved the “20-20-20 target” for its environmental agenda towards 2020: a 20 92 percent reduction in greenhouse gases emissions, a 20 percent share of renewable 93 energy resources and a 20 percent rise in energy efficiency (Moldan et al., 2012). A 94 number of scholars have been calling for environmental indicators to be standardised. 95 In the recent report Tomorrow’s City Today, Simon Joss and his collaborators argue 96 for the standardisation of indicators in order to drive innovation and render locally 97 generated knowledge and practice transferable (Joss et al., 2015), following an earlier 98 analysis of the absence of global standardisation of eco-city indicators produced by 99 the same authors (Joss et al. 2012). In the same vein, Shen et al. (2011) point out that
100 the lack of consensus on urban sustainability indicators in local practices has caused 101 confusion in the setting of targets and implementation of policies. A number of 102 governments and non-governmental organisations, such as the World Bank (Suzuki et 103 al., 2010), the United Nations (United Nations, 2007) and Ecocity Builders (2015) 104 have been endeavouring to build overarching systems of sustainability indicators.
105 Meanwhile, there are impediments to the on-the-ground application of an 106 environmental indicator and substantial questions remain un-answered and in need of 107 elucidation. By way of example, one indicator in the Tianjin Eco-City KPIs refers to 108 the proportion of green trips. Apparently simple and easy to use, this indicator is in 109 fact hard to monitor for multiple reasons. First, there is no consensus at this time on 110 what types of travel (commuting, leisure…) should be included in this category. 111 Second, the geographical range of “green trips” has been defined as the inner part of 112 Tianjin Eco-City, which prompts questions about how the concept of “green trips” is 113 defined in the international literature. For instance, should intercity travel and transit 114 traffic be included in the calculation? Third, the meaning of “green” can sometimes 115 be unclear. How should a vehicle be judged as being green or not? On the basis of 116 vehicle type or power source? Is public transport inherently green? Fourth, what 117 should be the unit of measurement for green trips? Proportion of trips? Cumulative 118 distance? Travel time? This partial list gives an idea of the many questions raised by 119 an apparently simple indicator, which need to be answered before any standardisation 120 can be achieved. While there is no shortage of debate on these conceptual questions, 121 we note that the debates are mostly sectorial, i.e. limited to one indicator or a series of 122 indicators for a given sector, e.g. urban transport.
123 As previously mentioned, plenty is known about both (Chinese) eco-city development 124 and environmental sustainability indicators, thanks to the work of scientific 125 researchers in recent years. As far as we know, however, there has been no in-depth
4
126 study comparing the two, i.e. examining the environmental indicators within the 127 context of a real-world eco-city. Our paper seeks to fill this gap. It takes as its object 128 of study a set of major environmental indicators produced by Tianjin Eco-City, and 129 employs a bibliometric analysis to investigate the scientific rationale behind these 130 indicators. The number of occurrences of each indicator in the international scientific 131 literature was counted, by reference to the following questions: What is the exact 132 definition of a given indicator? What is it supposed to measure? Is the indicator 133 problem-oriented and relevant to the most urgent local concerns? Is it specific to the 134 urban environment? What are the unsolved scientific questions underlying the 135 indicator? Intertwined with these global scientific questions is the question of whether 136 the indicator is specific to the Chinese context or, conversely, context free. Put 137 another way, is the indicator recognised and widely used by researchers inside and 138 outside China? This question will be addressed by geographical analyses of the 139 publications. This will cast light both on whether Tianjin Eco-City’s indicators are 140 aligned with mainstream challenges in the field of urban sustainability and on the 141 status of Chinese urban environmental problems in the international research agenda.
142 The remainder of the article is organised as follows. Section 2 outlines the 143 methodology informing this research, especially the empirical methods used to pick 144 out publications relating to the Tianjin Eco-City KPIs. Section 3 presents the main 145 results of this bibliometric exercise, followed by an overall discussion of the findings 146 and study conclusion in Section 4.
147 2 Methodology
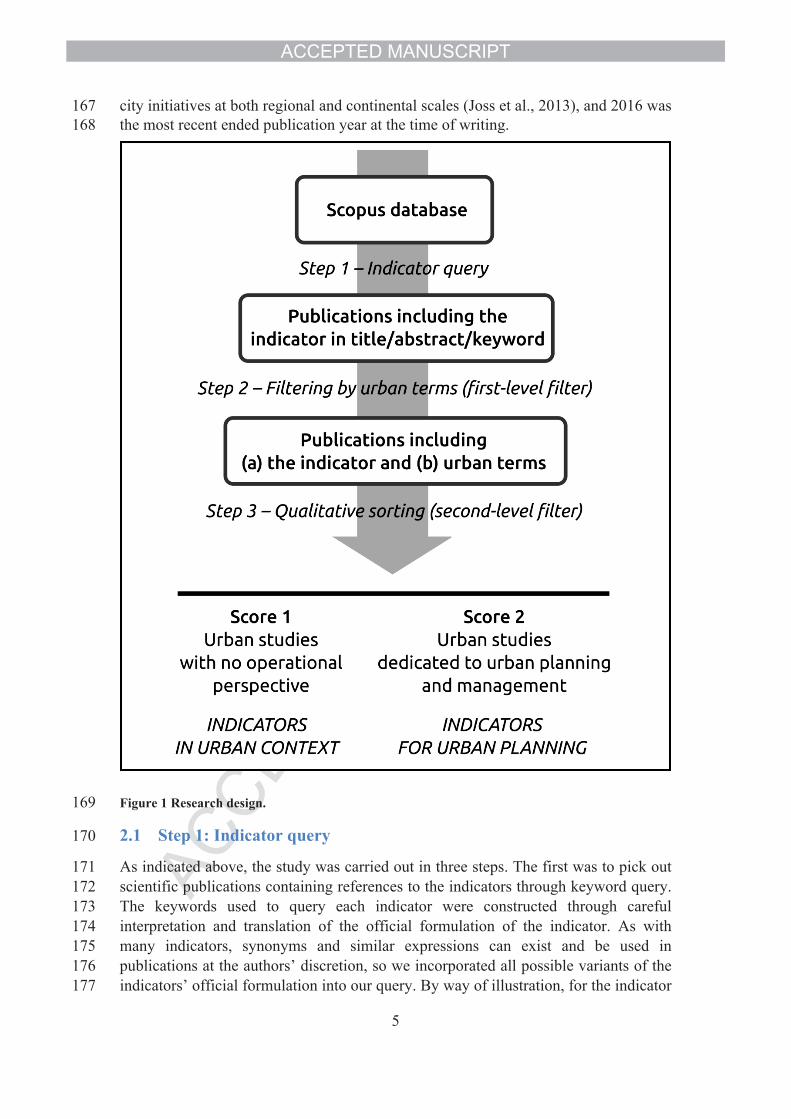
148 As stated above, our aim is to investigate the scientific rationale behind the 149 environmental indicators used in the Tianjin Eco-City KPIs by analysing the 150 international scientific literature on urban sustainability relating to the indicators in 151 question. To do this, we above all have to construct the corpus of scientific 152 publications that will be the subject of our analysis. However, we encountered 153 methodological hurdles to automatic corpus generation by keyword query, which 154 included the semantic problems caused by the polysemic nature of indicators and the 155 increased blurring of the distinctions between urban and non-urban areas. To 156 overcome these difficulties, we designed a three-step roadmap, which will be 157 described below.
158 Figure 1 depicts the methodology underpinning this study. Among the twenty-two 159 indicators in the Tianjin Eco-city KPIs, we selected eleven environmental indicators 160 relating to water, air, energy, transport and waste, as listed in Table 1. The indicator 161 numbers are the same as those published in official documents and research papers, 162 which explains their discontinuity. The Scopus database was chosen for our 163 bibliometric inventory, because it includes publication records for journals since 164 1996, irrespective of changing ISI status (de Jong et al., 2015). The time span of our 165 collection is from 2000 to 2016, given that the early 2000s are recognised to be the 166 starting point of urban sustainability policies in China, with the proliferation of eco-
5
167 city initiatives at both regional and continental scales (Joss et al., 2013), and 2016 was 168 the most recent ended publication year at the time of writing.
169 Figure 1 Research design.
170 2.1 Step 1: Indicator query
171 As indicated above, the study was carried out in three steps. The first was to pick out 172 scientific publications containing references to the indicators through keyword query. 173 The keywords used to query each indicator were constructed through careful 174 interpretation and translation of the official formulation of the indicator. As with 175 many indicators, synonyms and similar expressions can exist and be used in 176 publications at the authors’ discretion, so we incorporated all possible variants of the 177 indicators’ official formulation into our query. By way of illustration, for the indicator
6
178 Carbon emission per unit GDP, the terms “CO2”, “greenhouse gases” and “GHG” are 179 all possible variants of “carbon” and were therefore incorporated into the query. 180 Similarly with “per unit of GDP”, for which “per unit of gross domestic product” and 181 “CO2 intensity” were included in the search as possible variants. The detailed 182 syntaxes of the search query are provided in the Appendix.
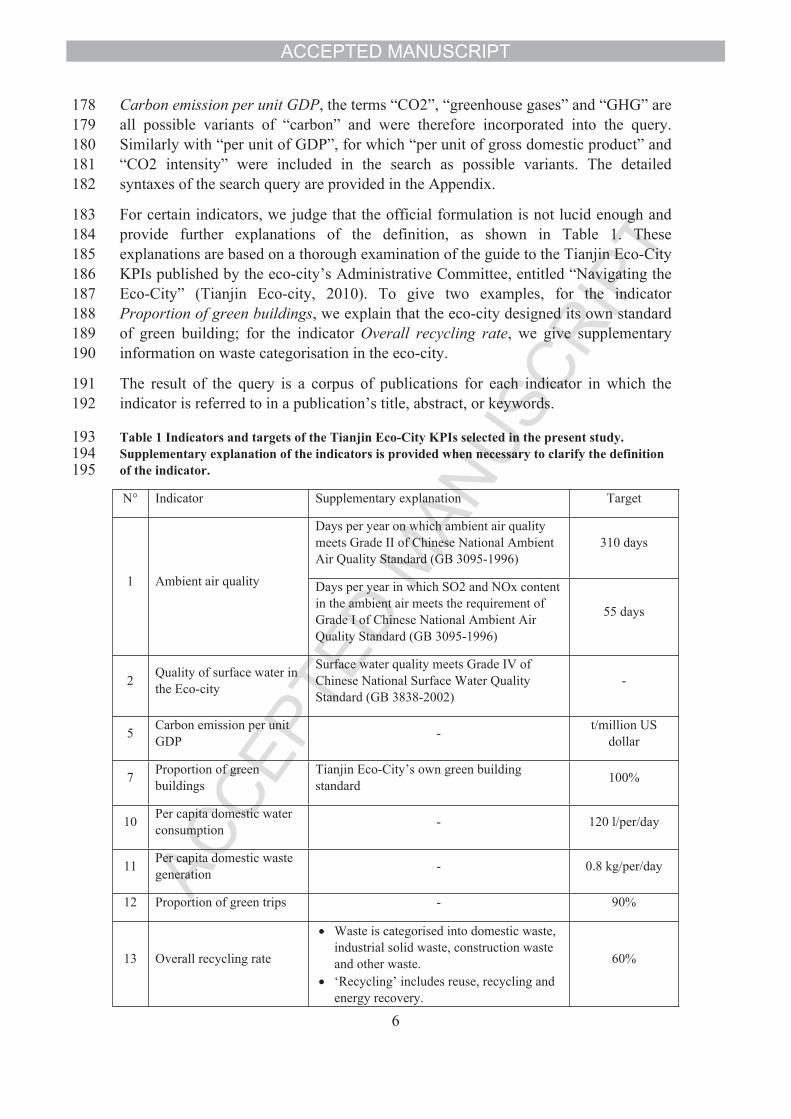
183 For certain indicators, we judge that the official formulation is not lucid enough and 184 provide further explanations of the definition, as shown in Table 1. These 185 explanations are based on a thorough examination of the guide to the Tianjin Eco-City 186 KPIs published by the eco-city’s Administrative Committee, entitled “Navigating the 187 Eco-City” (Tianjin Eco-city, 2010). To give two examples, for the indicator 188 Proportion of green buildings, we explain that the eco-city designed its own standard 189 of green building; for the indicator Overall recycling rate, we give supplementary 190 information on waste categorisation in the eco-city.
191 The result of the query is a corpus of publications for each indicator in which the 192 indicator is referred to in a publication’s title, abstract, or keywords.
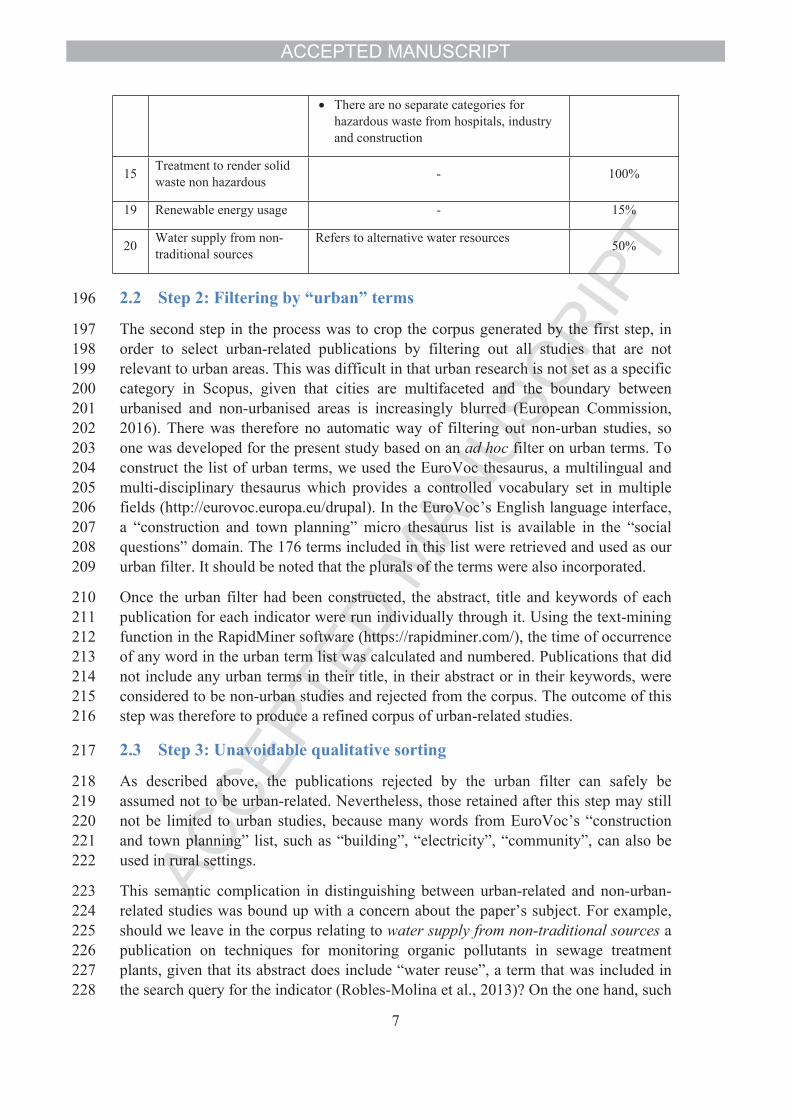
193 Table 1 Indicators and targets of the Tianjin Eco-City KPIs selected in the present study.
194 Supplementary explanation of the indicators is provided when necessary to clarify the definition
195 of the indicator.
N° Indicator Supplementary explanation Target
Days per year on which ambient air quality meets Grade II of Chinese National Ambient Air Quality Standard (GB 3095-1996)
310 days
1 Ambient air quality Days per year in which SO2 and NOx content in the ambient air meets the requirement of Grade I of Chinese National Ambient Air Quality Standard (GB 3095-1996)
55 days
2Quality of surface water in the Eco-city
Surface water quality meets Grade IV of Chinese National Surface Water Quality Standard (GB 3838-2002)
-
5Carbon emission per unit GDP
-t/million US
dollar
7Proportion of green buildings
Tianjin Eco-City’s own green building standard
100%
10Per capita domestic water consumption
- 120 l/per/day
11Per capita domestic waste generation
- 0.8 kg/per/day
12 Proportion of green trips - 90%
13 Overall recycling rate
• Waste is categorised into domestic waste, industrial solid waste, construction waste and other waste.
• ‘Recycling’ includes reuse, recycling and energy recovery.
60%
7
• There are no separate categories for hazardous waste from hospitals, industry and construction
15Treatment to render solid waste non hazardous
- 100%
19 Renewable energy usage - 15%
20Water supply from non-traditional sources
Refers to alternative water resources50%
196 2.2 Step 2: Filtering by “urban” terms
197 The second step in the process was to crop the corpus generated by the first step, in 198 order to select urban-related publications by filtering out all studies that are not 199 relevant to urban areas. This was difficult in that urban research is not set as a specific 200 category in Scopus, given that cities are multifaceted and the boundary between 201 urbanised and non-urbanised areas is increasingly blurred (European Commission, 202 2016). There was therefore no automatic way of filtering out non-urban studies, so 203 one was developed for the present study based on an ad hoc filter on urban terms. To 204 construct the list of urban terms, we used the EuroVoc thesaurus, a multilingual and 205 multi-disciplinary thesaurus which provides a controlled vocabulary set in multiple 206 fields (http://eurovoc.europa.eu/drupal). In the EuroVoc’s English language interface, 207 a “construction and town planning” micro thesaurus list is available in the “social 208 questions” domain. The 176 terms included in this list were retrieved and used as our 209 urban filter. It should be noted that the plurals of the terms were also incorporated.
210 Once the urban filter had been constructed, the abstract, title and keywords of each 211 publication for each indicator were run individually through it. Using the text-mining 212 function in the RapidMiner software (https://rapidminer.com/), the time of occurrence 213 of any word in the urban term list was calculated and numbered. Publications that did 214 not include any urban terms in their title, in their abstract or in their keywords, were 215 considered to be non-urban studies and rejected from the corpus. The outcome of this 216 step was therefore to produce a refined corpus of urban-related studies.
217 2.3 Step 3: Unavoidable qualitative sorting
218 As described above, the publications rejected by the urban filter can safely be 219 assumed not to be urban-related. Nevertheless, those retained after this step may still 220 not be limited to urban studies, because many words from EuroVoc’s “construction 221 and town planning” list, such as “building”, “electricity”, “community”, can also be 222 used in rural settings.
223 This semantic complication in distinguishing between urban-related and non-urban-224 related studies was bound up with a concern about the paper’s subject. For example, 225 should we leave in the corpus relating to water supply from non-traditional sources a 226 publication on techniques for monitoring organic pollutants in sewage treatment 227 plants, given that its abstract does include “water reuse”, a term that was included in 228 the search query for the indicator (Robles-Molina et al., 2013)? On the one hand, such
8
229 a study can arguably be considered to be urban, given the overlap between the topic 230 and urban sewage and water reuse. On the other hand, it seems somewhat remote 231 from the paper’s focus on sustainability indicators for urban planning and 232 management. One possible approach for dealing with such a paper would be to retain 233 it in the corpus but to separate it from those that fully match the focus.
234 At this stage, therefore, we were facing a twofold challenge. First, the non-urban 235 studies that had not been filtered out by the first two automatic steps had to be found 236 and rejected. Second, the urban-related studies had to be classified in terms of their 237 match with our focus. These two tasks entailed a third step, content-based qualitative 238 manual sorting of the publications. In this step, the abstracts of the articles were 239 studied one by one and scored on a 0-1-2 scale, where 0 means totally outside our 240 scope, and 2 highly relevant to our focus on urban planning and management. 241 Particular care was taken when the name of a city was used to provide this study 242 location, as a city name might refer both to the central city area and to the sublevel 243 administrative zones. This is particularly common in China, where a study that refers 244 to Beijing is not necessarily restricted to its inner-city areas but may also include the 245 extensive and still largely rural hinterland.
246 2.4 Abstract analysis and geographical analysis
247 The total number of 896 publications retained after the three-step query process 248 formed our final corpus, on which an abstract analysis and a geographical analysis 249 were conducted. In the abstract analysis, the abstract of each paper was thoroughly 250 studied, with attention to the following key questions: which indicator is used or 251 mentioned in the study? In which country? Is it the same as the indicator from Tianjin 252 Eco-City? If not, what are its advantages and drawbacks in terms of scientific 253 rationale? This “abstract” analysis was reinforced by a review of the article text in 254 cases where the abstract was too vague to provide any relevant information on the 255 indicator in question.
256 The purpose of the geographical analysis was to understand how international 257 researchers use the Tianjin Eco-City KPIs. For each article, three pieces of 258 geographical information were retrieved: 1) the country of origin of the authors, i.e. 259 here authors’ country; 2) the country studied; and 3) the link between the two. The 260 authors’ country, as an aggregate location, quantifies the relative importance of the 261 countries as a source of research. The country studied, also an aggregate location, 262 quantifies the relative interest in a given country as an object of research. The link 263 between the two locations is a piece of relational information that indicates the level 264 of scientific interest in a country A for a country B.A set of text mining methods was 265 employed in order to extract the locations from the corpus. The algorithm was 266 developed under the R software (R Development Core Team, 2011). A set of specific 267 packages were used, mainly stringr (Wickham, 2017) for string manipulation, igraph 268 (Csardi and Nepusz, 2006) and bipartite (Dormann et al., 2009) for network analysis, 269 and ggplot2 (Wickham, 2016) for plotting.
270 Four fields were examined for each study: address of the corresponding author, title, 271 keywords and abstract. The first step was to clean the data (lower case conversion,
9
272 punctuation and removal of editor’s location (such as "Copyright Springer Berlin, 273 Germany")). Then, country detection was performed using a dictionary of locations 274 available in the GeoNames database (http://www.geonames.org). We implemented a 275 simple method, applying regular expressions from a list of level-1 administrative units 276 (countries) and some level-2 administrative units. A comparison between the 277 locations retrieved and the results yielded by the Aylien API (http://aylien.com) 278 showed that the simple detection of high-level administrative units would be 279 sufficient to return the location at country level. In most cases the location name is 280 followed by an indication of the country, such as "Muritz National park (Germany)". 281 This indication is missing in a few US and Chinese cases for which only the lower-282 level administrative unit is given, for example "Everglades National Park (Florida)" 283 or "Foshan (Guangdong)".
284 The time incidence of the country name as the location studied was then calculated 285 both for the entire corpus, expressed as “absolute frequency”, and for the corpus of 286 each indicator, expressed as “relative frequency”. The difference between the absolute 287 and relative frequency for a country gives the relative weight of the indicator among 288 the eleven indicators regarding that country.
289 3 Results
290 3.1 A multi-level final corpus
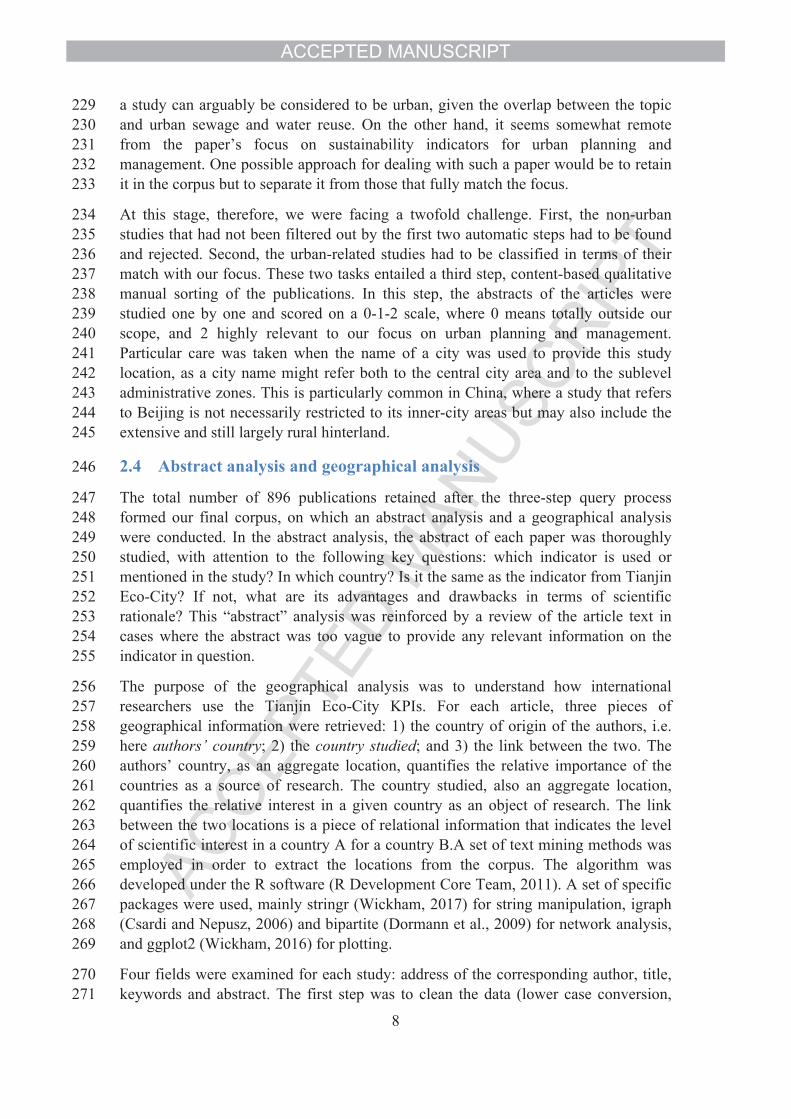
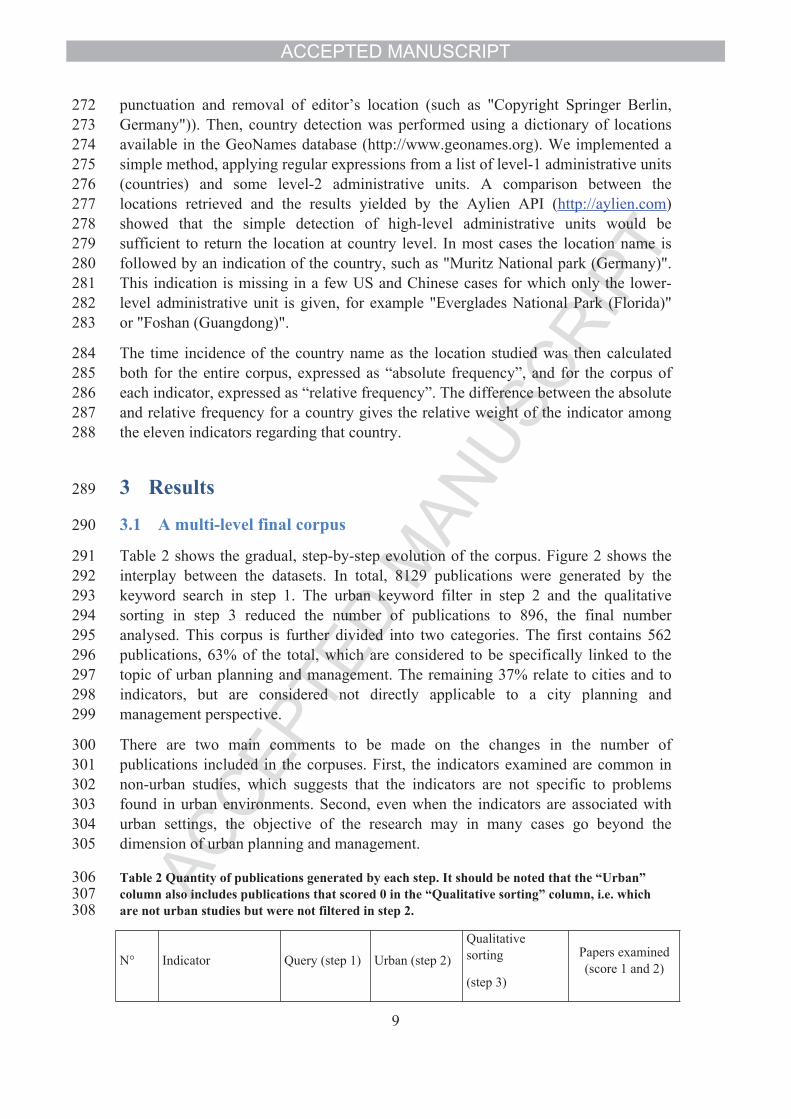
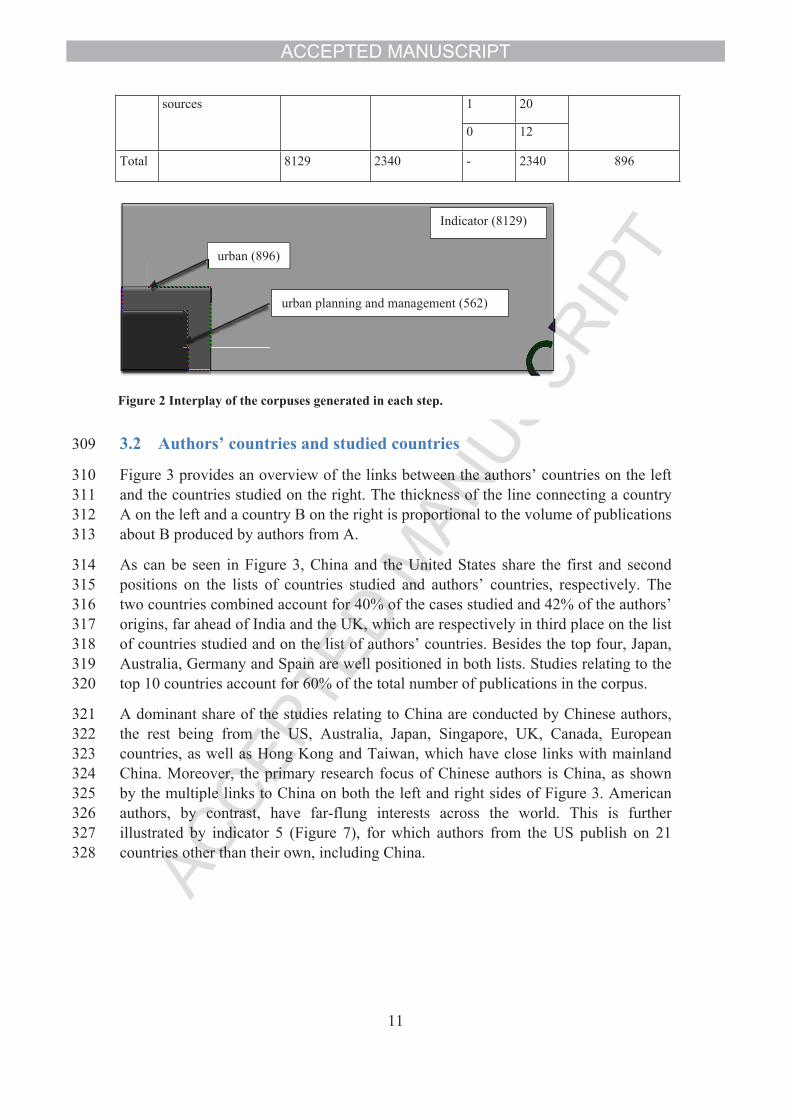
291 Table 2 shows the gradual, step-by-step evolution of the corpus. Figure 2 shows the 292 interplay between the datasets. In total, 8129 publications were generated by the 293 keyword search in step 1. The urban keyword filter in step 2 and the qualitative 294 sorting in step 3 reduced the number of publications to 896, the final number 295 analysed. This corpus is further divided into two categories. The first contains 562 296 publications, 63% of the total, which are considered to be specifically linked to the 297 topic of urban planning and management. The remaining 37% relate to cities and to 298 indicators, but are considered not directly applicable to a city planning and 299 management perspective.
300 There are two main comments to be made on the changes in the number of 301 publications included in the corpuses. First, the indicators examined are common in 302 non-urban studies, which suggests that the indicators are not specific to problems 303 found in urban environments. Second, even when the indicators are associated with 304 urban settings, the objective of the research may in many cases go beyond the 305 dimension of urban planning and management.
306 Table 2 Quantity of publications generated by each step. It should be noted that the “Urban”
307 column also includes publications that scored 0 in the “Qualitative sorting” column, i.e. which
308 are not urban studies but were not filtered in step 2.
N° Indicator Query (step 1) Urban (step 2)
Qualitative sorting
(step 3)
Papers examined (score 1 and 2)
10
Score number
2 89
1 531 Ambient air quality 350 206
0 64
142
2 88
1 312Quality of water bodies within the Eco-city
330 144
0 25
119
2 18
1 525Carbon emission per unit GDP
505 92
0 22
70
2 19
1 117Proportion of green buildings
107 33
0 3
30
2 28
1 810Per capita domestic water consumption
58 48
0 12
36
2 27
1 011Per capita domestic waste generation
46 33
0 6
27
2 89
1 3212Proportion of green trips
2312 1259
0 1138
121
2 86
1 3713Overall recycling rate
1584 169
0 46
123
2 21
1 3015Treatment to render solid waste non hazardous
2155 132
0 81
51
2 67
1 6019Renewable energy ratio
620 162
0 35
127
20 Water supply from non-traditional
62 62 2 30 50
11
1 20sources
0 12
Total 8129 2340 - 2340 896
309 3.2 Authors’ countries and studied countries
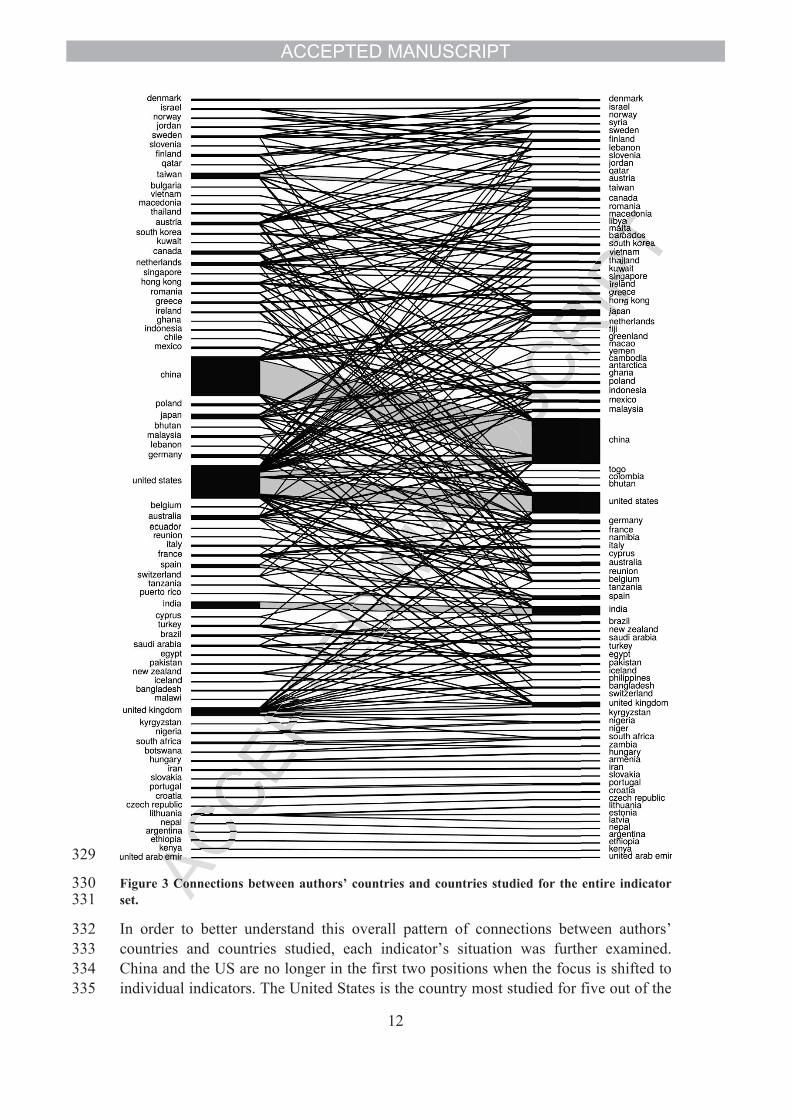
310 Figure 3 provides an overview of the links between the authors’ countries on the left 311 and the countries studied on the right. The thickness of the line connecting a country 312 A on the left and a country B on the right is proportional to the volume of publications 313 about B produced by authors from A.
314 As can be seen in Figure 3, China and the United States share the first and second 315 positions on the lists of countries studied and authors’ countries, respectively. The 316 two countries combined account for 40% of the cases studied and 42% of the authors’ 317 origins, far ahead of India and the UK, which are respectively in third place on the list 318 of countries studied and on the list of authors’ countries. Besides the top four, Japan, 319 Australia, Germany and Spain are well positioned in both lists. Studies relating to the 320 top 10 countries account for 60% of the total number of publications in the corpus.
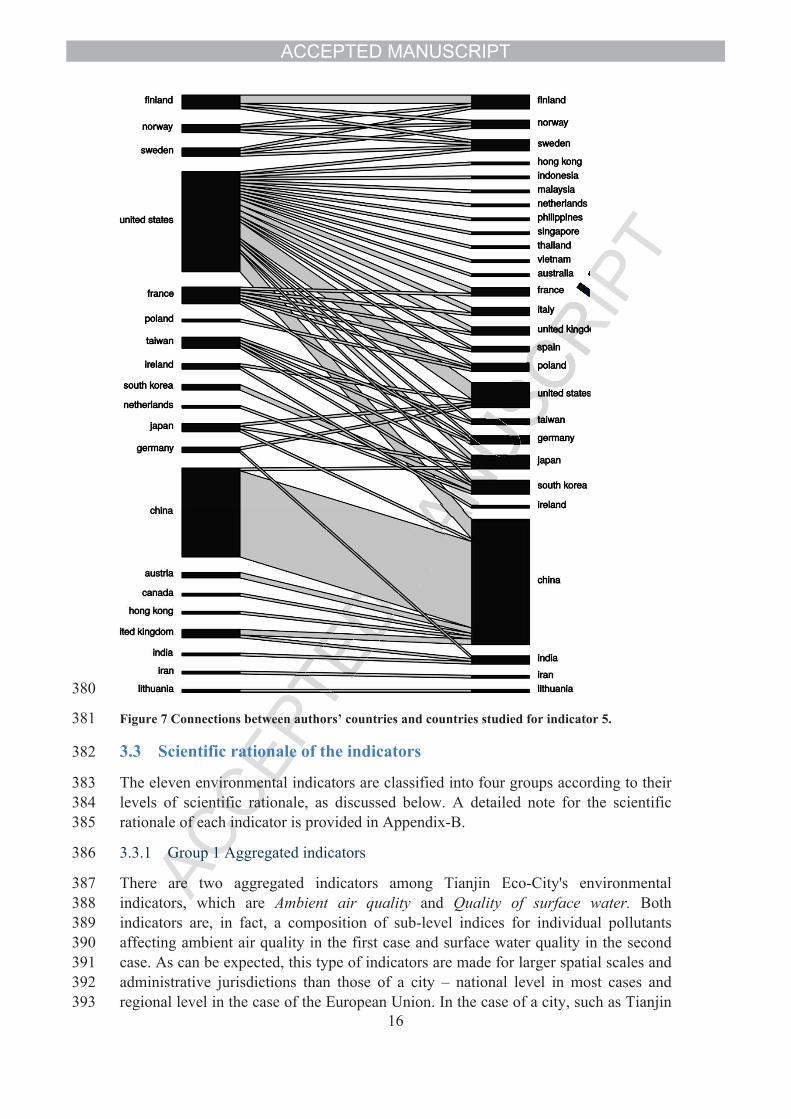
321 A dominant share of the studies relating to China are conducted by Chinese authors, 322 the rest being from the US, Australia, Japan, Singapore, UK, Canada, European 323 countries, as well as Hong Kong and Taiwan, which have close links with mainland 324 China. Moreover, the primary research focus of Chinese authors is China, as shown 325 by the multiple links to China on both the left and right sides of Figure 3. American 326 authors, by contrast, have far-flung interests across the world. This is further 327 illustrated by indicator 5 (Figure 7), for which authors from the US publish on 21 328 countries other than their own, including China.
urban planning and management (562)
urban (896)
Figure 2 Interplay of the corpuses generated in each step.
Indicator (8129)
12
329
330 Figure 3 Connections between authors’ countries and countries studied for the entire indicator
331 set.
332 In order to better understand this overall pattern of connections between authors’ 333 countries and countries studied, each indicator’s situation was further examined. 334 China and the US are no longer in the first two positions when the focus is shifted to 335 individual indicators. The United States is the country most studied for five out of the
13
336 eleven indicators, including Ambient air quality, Proportion of green buildings, 337 Overall recycling rate, Treatment to render solid waste non hazardous and Water 338 supply from non-traditional sources. China is the country most studied for the other 339 five indicators, including Quality of water bodies, Carbon emission per unit GDP, 340 Per capita domestic water consumption, Proportion of green trips, and Renewable 341 energy ratio.
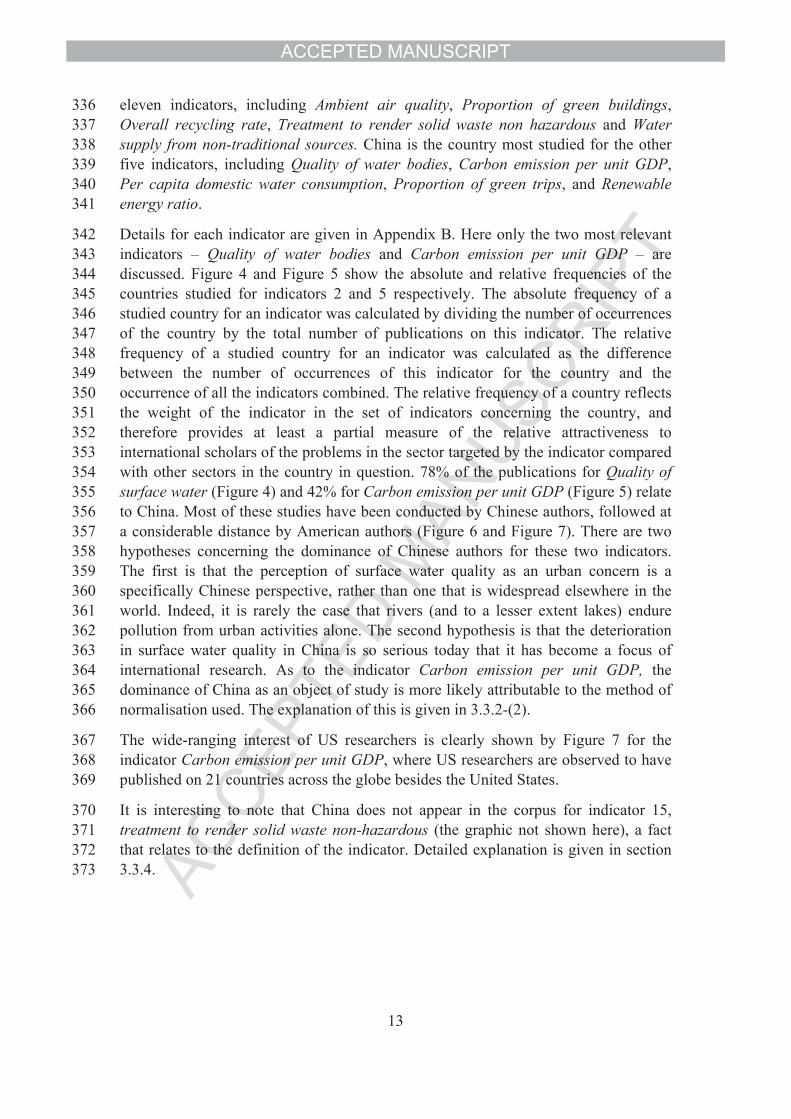
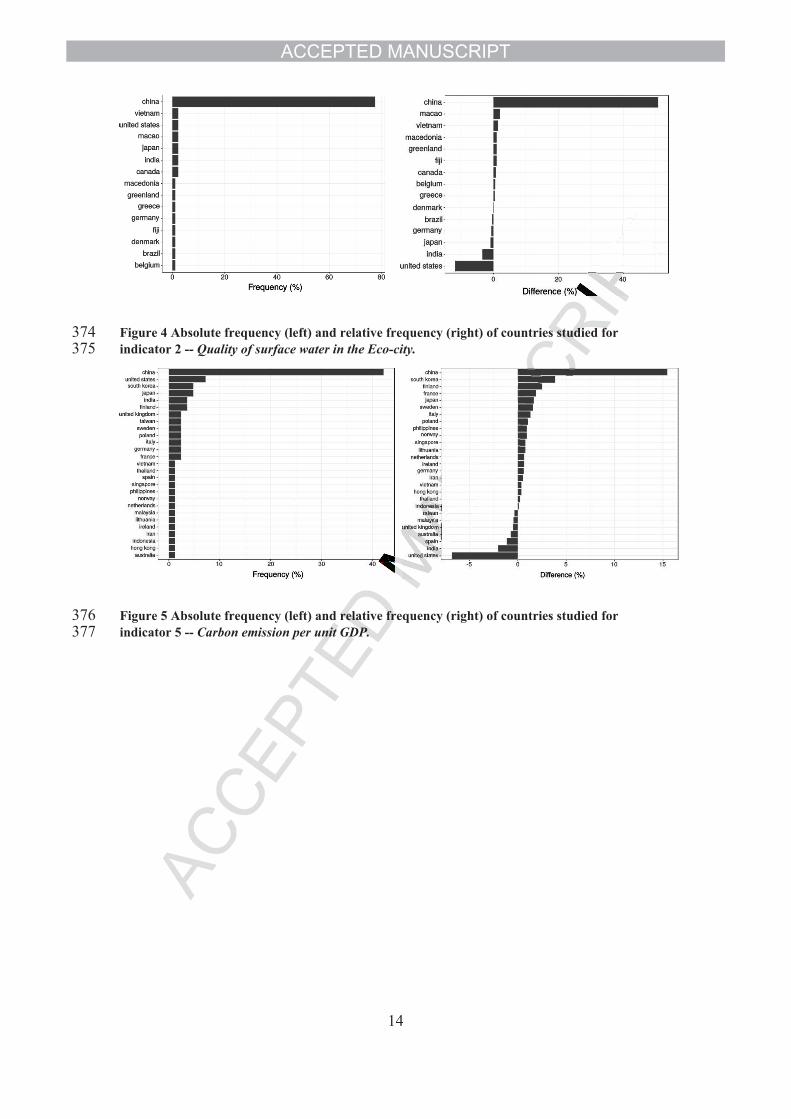
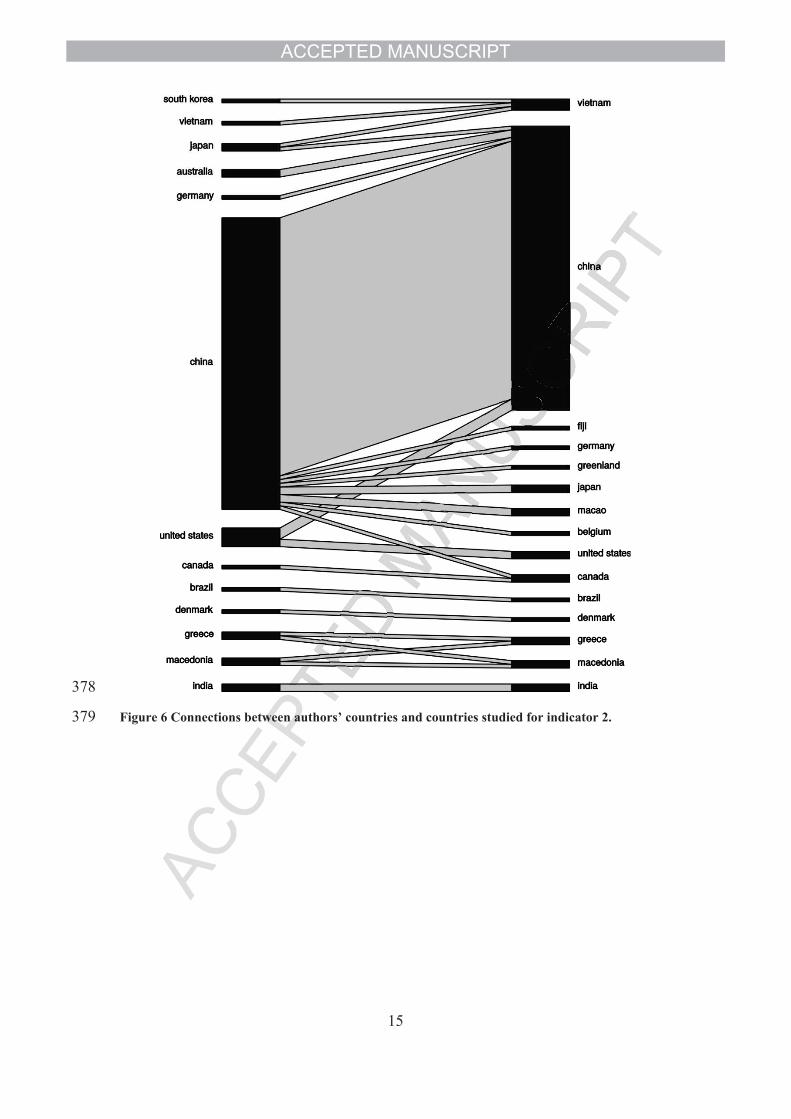
342 Details for each indicator are given in Appendix B. Here only the two most relevant 343 indicators – Quality of water bodies and Carbon emission per unit GDP – are 344 discussed. Figure 4 and Figure 5 show the absolute and relative frequencies of the 345 countries studied for indicators 2 and 5 respectively. The absolute frequency of a 346 studied country for an indicator was calculated by dividing the number of occurrences 347 of the country by the total number of publications on this indicator. The relative 348 frequency of a studied country for an indicator was calculated as the difference 349 between the number of occurrences of this indicator for the country and the 350 occurrence of all the indicators combined. The relative frequency of a country reflects 351 the weight of the indicator in the set of indicators concerning the country, and 352 therefore provides at least a partial measure of the relative attractiveness to 353 international scholars of the problems in the sector targeted by the indicator compared 354 with other sectors in the country in question. 78% of the publications for Quality of 355 surface water (Figure 4) and 42% for Carbon emission per unit GDP (Figure 5) relate 356 to China. Most of these studies have been conducted by Chinese authors, followed at 357 a considerable distance by American authors (Figure 6 and Figure 7). There are two 358 hypotheses concerning the dominance of Chinese authors for these two indicators. 359 The first is that the perception of surface water quality as an urban concern is a 360 specifically Chinese perspective, rather than one that is widespread elsewhere in the 361 world. Indeed, it is rarely the case that rivers (and to a lesser extent lakes) endure 362 pollution from urban activities alone. The second hypothesis is that the deterioration 363 in surface water quality in China is so serious today that it has become a focus of 364 international research. As to the indicator Carbon emission per unit GDP, the 365 dominance of China as an object of study is more likely attributable to the method of 366 normalisation used. The explanation of this is given in 3.3.2-(2).
367 The wide-ranging interest of US researchers is clearly shown by Figure 7 for the 368 indicator Carbon emission per unit GDP, where US researchers are observed to have 369 published on 21 countries across the globe besides the United States.
370 It is interesting to note that China does not appear in the corpus for indicator 15, 371 treatment to render solid waste non-hazardous (the graphic not shown here), a fact 372 that relates to the definition of the indicator. Detailed explanation is given in section 373 3.3.4.
14
374 Figure 4 Absolute frequency (left) and relative frequency (right) of countries studied for
375 indicator 2 -- Quality of surface water in the Eco-city.
376 Figure 5 Absolute frequency (left) and relative frequency (right) of countries studied for
377 indicator 5 -- Carbon emission per unit GDP.
15
378
379 Figure 6 Connections between authors’ countries and countries studied for indicator 2.
16
380
381 Figure 7 Connections between authors’ countries and countries studied for indicator 5.
382 3.3 Scientific rationale of the indicators
383 The eleven environmental indicators are classified into four groups according to their 384 levels of scientific rationale, as discussed below. A detailed note for the scientific 385 rationale of each indicator is provided in Appendix-B.
386 3.3.1 Group 1 Aggregated indicators
387 There are two aggregated indicators among Tianjin Eco-City's environmental 388 indicators, which are Ambient air quality and Quality of surface water. Both 389 indicators are, in fact, a composition of sub-level indices for individual pollutants 390 affecting ambient air quality in the first case and surface water quality in the second 391 case. As can be expected, this type of indicators are made for larger spatial scales and 392 administrative jurisdictions than those of a city – national level in most cases and 393 regional level in the case of the European Union. In the case of a city, such as Tianjin
17
394 Eco-City, it is understandable that city managers apply the sectorial standards that 395 have been developed at national level. On this understanding, a comparison was made 396 between the Chinese national standards and the standards from several developed 397 countries in the present study. The current national air quality standard in China, 398 GB3095-2012, is found generally less strict than that of developed countries such as 399 the United States (NAAQS, https://www.epa.gov/criteria-air-pollutants) and the 400 European Union (EU, 2008), which are in their turn less strict than the WHO air 401 quality guidelines (WHO, 2005). For all the criteria pollutants encompassed by these 402 standards, except NO2, GB3095-2012 is more tolerant than the American and 403 European standards. Especially for PM10 coarse particles, the threshold for 24-hour 404 mean concentration defined in the Chinese standard is 150 µg/m3 for residential 405 zones, which is 3 times that of the European and WHO standards, at 50 µg/m3. It can 406 be argued then, achieving the ambient air quality target as defined by this indicator, 407 should it happen sometime in the future, will still fall far short of guaranteeing air 408 quality in the city with respect to public health.
409 The current Chinese national quality standard for surface water, GB3838-2002, was 410 promulgated in 2002. It is a revised version of the 1983 standard GB3838-83. During 411 the revision, the criterion values were updated, essentially by referencing to the 412 standards of developed countries, including the US, the EU and Japan, given that 413 “there were no lake nutrient criteria related studies during the revision period for 414 GB3838-2002” (Zhou et al., 2014). As a result, the strictness of the criteria values for 415 pollutants in the GB3838-2002 is quite close to that of the developed countries. 416 Certain thresholds in the Chinese standard are even stricter, as noted by Su et al. 417 (2017). The same authors point out however the lack of contextualisation in the 418 implementation of the standard, stating that GB3838-2002 is “generally applied (in 419 all the lakes) in China without considering the differences in different 420 regions…various climates, elevation, geography and other factors”.
421 It has to be recognized that China needs to consider its economic and social realities 422 (industry-dominant economy, demographic challenge, need of urbanisation...) while 423 making progress in environmental protection. This to some extent explains the lower 424 air pollutant threshold set in the national standard GB3095-2012. Bearing this in 425 mind, the immediate challenge for Chinese environmental protection may not be how 426 to match the standards of developed nations at all costs, but how to develop tailor-427 made indicators that take local specificities into account.
428 3.3.2 Group 2 Scientifically-sound indicators
429 This category covers the majority of Tianjin Eco-City’s environmental indicators, 430 which are:
431 (1) the two proportion indicators, one pointing to the built sector, proportion of 432 green buildings, the other the transport sector, proportion of green trips;433 (2) one of the two energy indicators, renewable energy;434 (3) the two indicators of the waste sector, per capita domestic waste generation 435 and overall recycling rate;
18
436 (4) and the two indicators on water consumption, per capita water consumption 437 and water supply from non-traditional sources.
438 These indicators are clearly defined, measurable, widely known and used across the 439 world for the purposes of sustainability assessment and inter-city comparison. Their 440 main advantage is their concreteness and problem specificity – it is easy to interpret 441 the meaning of the indicator and which problem it targets. Because of this 442 concreteness however, these indicators have relatively limited reach and are little use 443 on their own for assessing holistic performance. For instance, while ratios of 444 renewable energy or green trips can be used to measure the level of deployment of 445 renewable energy and low-emission transport facilities in a city, they cannot measure 446 the city’s overall sustainability performance in the energy and transport sectors. Not 447 to mention the technical difficulties of accurately calculating the “ratios”, as discussed 448 at the beginning of the paper. Even more bothering, an exclusive focus on these 449 indicators could impede holistic consideration of sustainability -- even at sectorial 450 level -- by overlooking other aspects, such as urban regeneration in the case of green 451 building, water saving in the case of water supply from non-traditional sources, 452 economic viability in the case of renewable energy use, the inclusion of informal 453 collectors in the case of overall recycling rate, and walkability in the case of green 454 trips.
455 The conciliation between global and local is another critical question raised by the 456 analysis. On the one hand, there are growing calls for the standardisation of 457 sustainability assessment methods and indicators and intensive research efforts made 458 in that direction (Ecocity Builders, 2015; Eurostat, 2016; Suzuki et al., 2010) . On the 459 other hand, the importance of accounting for regional disparities and local 460 characteristics is increasingly recognised, as noted by Joss et al. (2012): “indicators 461 specify in concrete terms what urban sustainability means to a given community by 462 defining the elements and benchmark targets”. Taking the built sector for example, 463 whilst the leading certification schemes, namely LEED, BREEAM, CASBEE, and 464 France’s HQE, have been widely recognised around the world, their use at local scale 465 is far from systematic. This is undoubtedly attributable to the overwhelming 466 enthusiasm of politicians for economic growth, but also to the fact that these 467 certification schemes are not applicable to local contexts (Zhou et al., 2011). In the 468 case of Tianjin Eco-City, all these well-known foreign green building standards, as 469 well as the Chinese national standards (ESGB and EIASGG), were rejected, giving 470 way to a green building standard developed by the eco-city its own, in order that 471 “local climatic and cultural specificities are taken into consideration during the 472 buildings’ performance assessment” (Li et al. 2018).
473 3.3.3 Group 3 Indicator under scientific scrutiny
474 This group concerns one indicator, carbon emission per unit GDP. The indicator is 475 conventionally used to assess a city’s energy performance, together with another form 476 of normalisation for carbon emissions, namely per capita. Despite their widespread 477 use, there is intense debate among scientists over their scientific rationale.
19
478 The problem is twofold. The first concerns the measurement of carbon emissions. 479 How to accurately measure total greenhouse gas (GHG) emissions for a given city, in 480 a global context of increasing interaction between economic activities? Should 481 indirect emissions from local production and consumption be counted in the total 482 GHG? How should emissions relating to import and export activities be counted for? 483 Despite the efforts of scholars to answers these questions (Ala-Mantila et al., 2014; 484 Ramaswami and Chavez, 2013), we seem to be a long way from any universal 485 agreement. The second problem concerns the two possible ways of standardising total 486 emissions, namely per capita or by GDP. Normalising the total emissions of a city by 487 capita or by GDP can lead to contrasting results. For example, Price et al. (2013) 488 reported the carbon emission of two large cities in China, Beijing and Chongqing. 489 Both cities were found to be 20 times more carbon-intensive than international cities 490 when assessed using the GDP-based indicator, but show a similar scale of carbon 491 emissions with the per capita indicator. The authors conclude that indicators of CO2 492 emissions per unit of GDP or per capita were too aggregated, and cannot fully explain 493 end-use energy consumption and emissions within a city.
494 3.3.4 Group 4 Indicator lacking scientific foundation
495 Treatment to render solid waste non-hazardous is the indicator that seems to be the 496 most problematic of the eleven. First, the literal definition of the indicator is 497 confusing. To all appearances this indicator relates to hazardous waste such as 498 electronic or medical waste. In fact however, as explained in “Navigating the Eco-499 City”, the indicator is a portmanteau of multiple waste-treatment goals that basically 500 refer to two fundamental issues in the waste treatment sector. The first is hazardous 501 waste, a term that refers to byproducts of the medical, industrial or construction 502 sectors, and listed in relevant legislative documents promulgated by the Chinese 503 authorities. The second issue concerns the so-called “solid domestic waste”, which 504 refers to all the waste generated by urban human activities, with the exception of the 505 three types of hazardous waste mentioned above. Rendering this kind of waste “non-506 hazardous” means “setting up an appropriate hierarchical disposal system through 507 landfill, biological treatment, recycling, incineration and energy-recover facilities” 508 and “assuring that the emissions from each of these procedures meet the relative 509 national standards”. As a whole, the indicator “treatment to render solid waste non-510 hazardous” means “to proceed to non-harmful disposal of the hazardous waste and 511 solid domestic waste in order that the harmful substances contained in these wastes 512 meet the current national or sectorial pollutant discharge standard” (Tianjin Eco-513 city, 2010). The value of the indicator will be a calculation of the ratio between the 514 quantity of hazardous/solid waste that has been rendered “non-hazardous” and the 515 total quantity of such waste generated in the eco-city before disposal.
516 Having clarified the definition of the indicator, we can now fairly safely argue that the 517 indicator should be replaced by one or more indicators that will be simpler, more 518 concrete and more problem-focused, in a nutshell, more scientifically sound. It would 519 be interesting to know why the indicator has been formulated in this way, but that is 520 beyond the scope of this paper. Here we will be content to note that the United
20
521 Nations sets separate guidelines for the indicators on “waste treatment and disposal” 522 and “generation of hazardous waste” (United Nations, 2007).
523 4 Discussion and conclusion
524 In this paper, we have conducted a comprehensive bibliometric investigation into the 525 scientific rationale for the environmental indicators used in the Tianjin Eco-City KPI 526 system. To our knowledge, this is the first time that the well-known Tianjin Eco-City 527 KPIs have been scientifically studied, and also the first time that a set of real-case 528 environmental sustainability indicators has been addressed as a whole.
529 The results reveal above all that the Tianjin Eco-City KPIs are far from being a 530 system specifically dedicated to the urban scale, but are applicable to a city, to a 531 region, or to a country. This is in fact not so surprising if two realities are recognised: 532 1) that the boundaries between urban and rural are increasingly blurred, both 533 conceptually and in practice; and consequently 2) that no one can tell today how 534 urban sustainability might differ from sustainability in general. There are actions and 535 programmes dedicated to both themes, but the difference between urban and non-536 urban sustainability is never specifically discussed and the formulation is more likely 537 to be case-specific (urban sustainability when the case studied is a city and 538 sustainability otherwise) than to be based on a scientific rationale. Suffice it to say 539 that applying nationwide sustainability indicators to a city without contextual 540 adaptation could lead to inappropriate measures and unwanted consequences. In the 541 case of Tianjin Eco-City, the course of the river within the jurisdiction of the 542 Administrative Committee has been artificially cut off from the polluted river 543 upstream, so that surface water quality inside the city meets the requirements of the 544 indicator (Li et al., 2018), a pragmatic measure that can safely be described as 545 unsustainable.
546 That having been said, most of the environmental indicators from Tianjin Eco-City 547 are found to be scientifically relevant, which means that they are clearly defined, 548 problem-oriented, measurable and widely used by the international community 549 involved in urban sustainability. This is the case, for example, of per capita domestic 550 water consumption and renewable energy ratio. Nonetheless, there is still the 551 challenge of how to standardise measurement/calculation of the indicator and how to 552 gear considerations towards holistic urban sustainability by avoiding excessive 553 attention to one facet at the expense of the others.
554 As for the two indicators taken from the national standards on ambient air quality and 555 surface water quality, the question concerns the rationality of applying the national 556 scale indicators to city-level management. Clearly, the eco-city's managers can do 557 little about upstream water pollution outside the city (except through drastic measures 558 such as cutting the water course), or about air pollution originating from other parts of 559 Tianjin and north China. In other words, meeting air and water quality targets depends 560 less on measures taken inside the eco-city than regional and national policies. In 561 consequence, the relevance of setting such indicators at eco-city scale, though 562 politically acceptable and necessary, is questionable.
21
563 The differences in the scientific rationale for Tianjin Eco-City’s environmental 564 indicators are further reflected in their dispersal across the international scientific 565 literature, as revealed by our geographical analyses. The connections between the 566 authors’ country and the country studied for the whole set of indicators clearly 567 confirm that China remains the hotspot of world research on environmental 568 sustainability, and that the Western world (US, Europe, Japan, etc.), to which China 569 has turned for finding new planning strategies and technical environmental solutions 570 during the recent decades, maintain their interests in China’s urban and ecological 571 transition. Furthermore, the eco-city's environmental indicators, at least the main ones 572 that have been selected in this study, are consistent with the major challenges in 573 making sustainable cities that have been recognised by international scientists: urban 574 air pollution, clean energy use, traffic congestion, CO2 emissions, water saving and 575 reuse, waste reduction, etc. These challenges are a matter of debate in a wide range of 576 countries across the world, as shown by our geographical analysis. Two of the eleven 577 indicators are found to be very “Chinese”, namely Quality of water bodies and 578 Carbon emission per unit GDP, for which papers about China account for 78% and 579 42% of the corpus, respectively. Since the possible reasons of this have already been 580 developed, here we will focus on two important issues revealed by these indicators:
581 • Should trans-boundary pollution, such as that of a river, be defined as the 582 responsibility of a city and incorporated into the assessment of the city’s 583 sustainability performance? While the answer is a priori negative, in a country 584 like China where administration is highly segmented, strictly top-down, and 585 framework for watershed management has yet to be built, it seems difficult to 586 see other ways to tackle the watercourse pollution problem that has already 587 become critical.588 • Bundling environmental performance with economic outcome, as embodied 589 by the indicator Carbon emission per unit GDP, to some extent reflects the 590 tricky choice between economic growth and environmental protection in 591 Chinese cities, at a time when a balance between economic and environmental 592 objectives remains to be found, whether in China or elsewhere. Still, 593 measuring pollution in relation to GDP is fraught with risk as it presupposes 594 that “you can continue to pollute if it creates enough growth”.
595 Based on the bibliometric analyses presented in this article, we made the following 596 recommendations on sustainable city indicators:
597 • The nature of existing indicators should be defined if these indicators are to 598 be recycled in a new system. Local conditions and the characteristics of the 599 (eco-city) project are main factors that impact the suitability of the indicators 600 in the specific setting. In case where an indicator is an aggregated one or/and 601 has been made for national- or regional-scale management, such as those used 602 for air quality and water quality in Tianjin Eco-city, the applicability of the 603 indicator in the new setting should be considered with caution.
604 • The exact definition of an indicator should be clearly understood, and its 605 scientific rational sufficiently evaluated. An indicator is a highly synthetical
22
606 thus simplified expression of sustainability goals, and this simplicity could 607 easily lead to inexact even incorrect interpretation of the goals. Exact 608 understanding of the meaning of the indicator is a pre-condition for 609 evaluating its scientific rational, which in its turn impact the utility and 610 exportability of the indicator.
611 • Last but not least, an indicator system embodies its makers’ understanding of 612 and preference to sustainability, thus its nature and scientific rational can be 613 conditioned by the makers’ specialty. It is thus of importance to investigate 614 the construction process of an indicator system – who made the indicators, 615 how were the indicators selected – before taking the system as a reference.
616 The scientific contribution of this paper is three-fold. First, it is the first time that the 617 Key Performance Indicators of Tianjin Eco-City is analysed, with a focus on their 618 scientific rationale. To our knowledge, it is also the first time that a set of urban 619 environmental indicators is analysed about scientific rationale. Second, instead of 620 higher-level social-economic reflections, we deal with the most basic one among the 621 three pillars of sustainability, environment, in which field problems are far from being 622 solved, especially in rapidly urbanised countries like China. We suggest environment 623 performance of our cities remain an issue to be tackled and should not be overlooked. 624 Third, we show a picture of the consilience and contrast between Chinese perception 625 of urban environment performance and international ones. The information revealed 626 is expected inspirational both for Chinese and international specialists in 627 sustainability.
628 Finally, our work has limitations. The most significant is perhaps the source used for 629 the bibliometric survey. We used bibliometric tools to sample the most relevant 630 academic publications in Scopus that contain environmental indicators that overlap 631 with the Tianjin Eco-City KPIs. However, urban development and sustainability are 632 core concerns not only for academics, but also for policymakers, practitioners, 633 consultants, think tanks, environmental industries, non-governmental organisations, 634 economists, the media…. Writings produced by these actors, such as reports, policy 635 documents and technical manuals, may not be published in scientific journals.
636 5 Acknowledgements
637 This study was supported by France’s Agence Nationale de la Recherche through the 638 investissement d’avenir – Labex Urban Futures funding programme and by École des 639 Ponts ParisTech. We would also like to thank Martin de Jong from Delft University 640 of Technology for his helpful comments on an earlier version of the manuscript.
23
641 Appendix
642 A. Keyword query per indicator
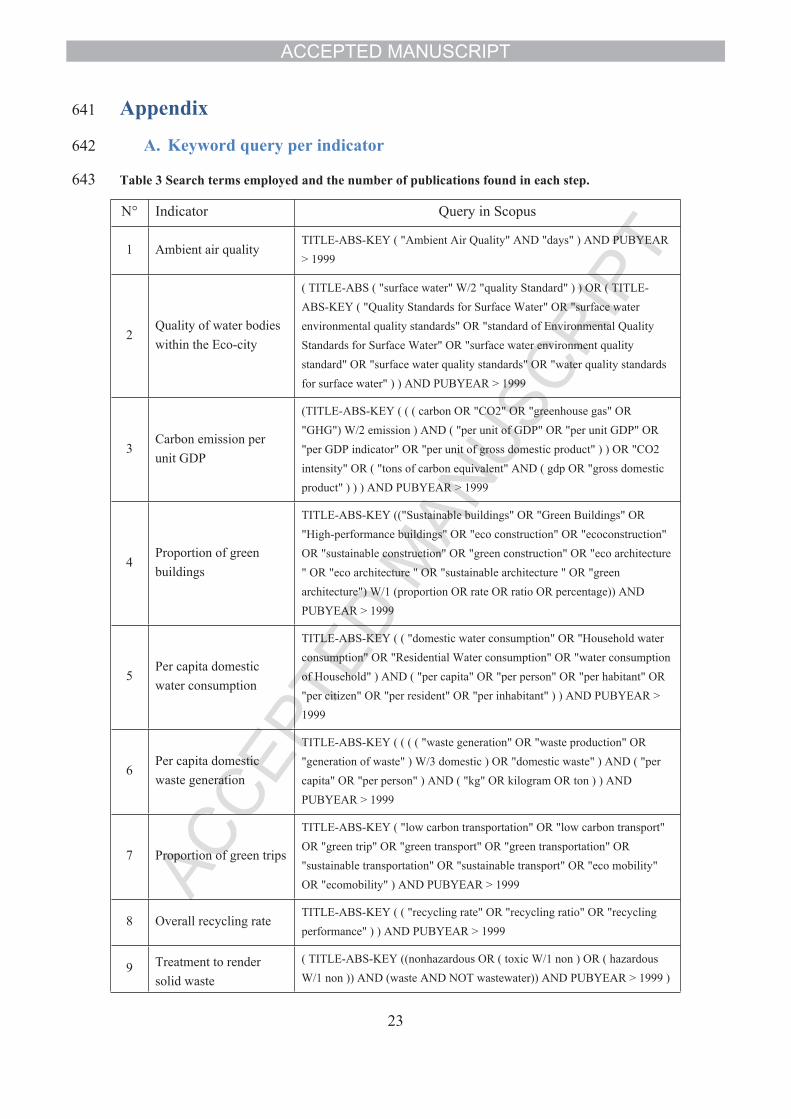
643 Table 3 Search terms employed and the number of publications found in each step.
N° Indicator Query in Scopus
1 Ambient air qualityTITLE-ABS-KEY ( "Ambient Air Quality" AND "days" ) AND PUBYEAR
> 1999
2Quality of water bodies
within the Eco-city
( TITLE-ABS ( "surface water" W/2 "quality Standard" ) ) OR ( TITLE-
ABS-KEY ( "Quality Standards for Surface Water" OR "surface water
environmental quality standards" OR "standard of Environmental Quality
Standards for Surface Water" OR "surface water environment quality
standard" OR "surface water quality standards" OR "water quality standards
for surface water" ) ) AND PUBYEAR > 1999
3Carbon emission per
unit GDP
(TITLE-ABS-KEY ( ( ( carbon OR "CO2" OR "greenhouse gas" OR
"GHG") W/2 emission ) AND ( "per unit of GDP" OR "per unit GDP" OR
"per GDP indicator" OR "per unit of gross domestic product" ) ) OR "CO2
intensity" OR ( "tons of carbon equivalent" AND ( gdp OR "gross domestic
product" ) ) ) AND PUBYEAR > 1999
4Proportion of green
buildings
TITLE-ABS-KEY (("Sustainable buildings" OR "Green Buildings" OR
"High-performance buildings" OR "eco construction" OR "ecoconstruction"
OR "sustainable construction" OR "green construction" OR "eco architecture
" OR "eco architecture " OR "sustainable architecture " OR "green
architecture") W/1 (proportion OR rate OR ratio OR percentage)) AND
PUBYEAR > 1999
5Per capita domestic
water consumption
TITLE-ABS-KEY ( ( "domestic water consumption" OR "Household water
consumption" OR "Residential Water consumption" OR "water consumption
of Household" ) AND ( "per capita" OR "per person" OR "per habitant" OR
"per citizen" OR "per resident" OR "per inhabitant" ) ) AND PUBYEAR >
1999
6Per capita domestic
waste generation
TITLE-ABS-KEY ( ( ( ( "waste generation" OR "waste production" OR
"generation of waste" ) W/3 domestic ) OR "domestic waste" ) AND ( "per
capita" OR "per person" ) AND ( "kg" OR kilogram OR ton ) ) AND
PUBYEAR > 1999
7 Proportion of green trips
TITLE-ABS-KEY ( "low carbon transportation" OR "low carbon transport"
OR "green trip" OR "green transport" OR "green transportation" OR
"sustainable transportation" OR "sustainable transport" OR "eco mobility"
OR "ecomobility" ) AND PUBYEAR > 1999
8 Overall recycling rateTITLE-ABS-KEY ( ( "recycling rate" OR "recycling ratio" OR "recycling
performance" ) ) AND PUBYEAR > 1999
9 Treatment to render
solid waste
( TITLE-ABS-KEY ((nonhazardous OR ( toxic W/1 non ) OR ( hazardous
W/1 non )) AND (waste AND NOT wastewater)) AND PUBYEAR > 1999 )
24
nonhazardous
10Renewable energy
usage
( TITLE-ABS-KEY ( "Renewable energy usage" OR "Renewable energy
utilization" OR "Renewable energy use" ) ) AND PUBYEAR > 1999
11Water supply from
nontraditional sources
TITLE-ABS-KEY ( ( urban OR city OR town ) AND ( "water reuse" OR
"rain water harvesting" OR ( water AND "non-traditional sources" ) OR
"non-traditional water sources" OR ( water AND "alternate sources" ) OR (
water AND "alternative sources" ) OR "alternate water sources" ) AND (
"per capita" OR "per person" OR "per inhabitant" OR "m3/d" OR "gal" OR
"litre" OR "liter" OR "m/day" OR proportion OR percentage ) ) AND
PUBYEAR > 1999
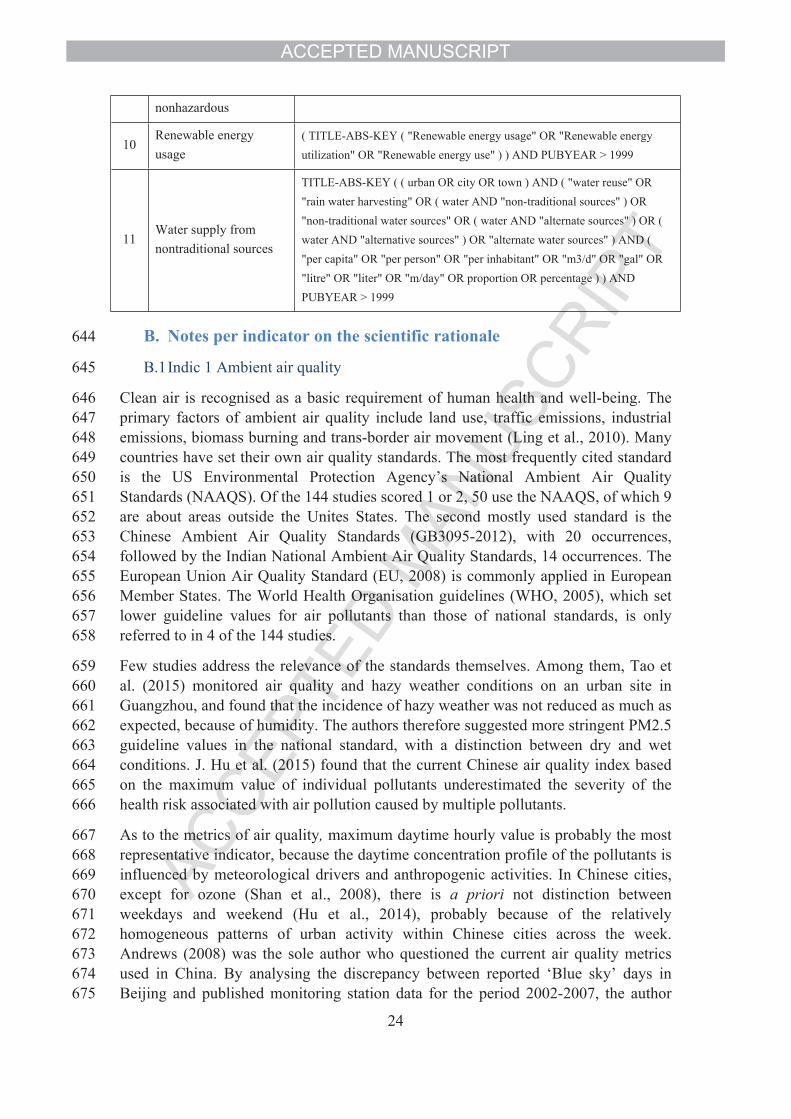
644 B. Notes per indicator on the scientific rationale
645 B.1Indic 1 Ambient air quality
646 Clean air is recognised as a basic requirement of human health and well-being. The 647 primary factors of ambient air quality include land use, traffic emissions, industrial 648 emissions, biomass burning and trans-border air movement (Ling et al., 2010). Many 649 countries have set their own air quality standards. The most frequently cited standard 650 is the US Environmental Protection Agency’s National Ambient Air Quality 651 Standards (NAAQS). Of the 144 studies scored 1 or 2, 50 use the NAAQS, of which 9 652 are about areas outside the Unites States. The second mostly used standard is the 653 Chinese Ambient Air Quality Standards (GB3095-2012), with 20 occurrences, 654 followed by the Indian National Ambient Air Quality Standards, 14 occurrences. The 655 European Union Air Quality Standard (EU, 2008) is commonly applied in European 656 Member States. The World Health Organisation guidelines (WHO, 2005), which set 657 lower guideline values for air pollutants than those of national standards, is only 658 referred to in 4 of the 144 studies.
659 Few studies address the relevance of the standards themselves. Among them, Tao et 660 al. (2015) monitored air quality and hazy weather conditions on an urban site in 661 Guangzhou, and found that the incidence of hazy weather was not reduced as much as 662 expected, because of humidity. The authors therefore suggested more stringent PM2.5 663 guideline values in the national standard, with a distinction between dry and wet 664 conditions. J. Hu et al. (2015) found that the current Chinese air quality index based 665 on the maximum value of individual pollutants underestimated the severity of the 666 health risk associated with air pollution caused by multiple pollutants.
667 As to the metrics of air quality, maximum daytime hourly value is probably the most 668 representative indicator, because the daytime concentration profile of the pollutants is 669 influenced by meteorological drivers and anthropogenic activities. In Chinese cities, 670 except for ozone (Shan et al., 2008), there is a priori not distinction between 671 weekdays and weekend (Hu et al., 2014), probably because of the relatively 672 homogeneous patterns of urban activity within Chinese cities across the week. 673 Andrews (2008) was the sole author who questioned the current air quality metrics 674 used in China. By analysing the discrepancy between reported ‘Blue sky’ days in 675 Beijing and published monitoring station data for the period 2002-2007, the author
25
676 observed that the reported improvements in air quality were more attributable to 677 deficiencies in the metrics than to tangible air quality improvement.
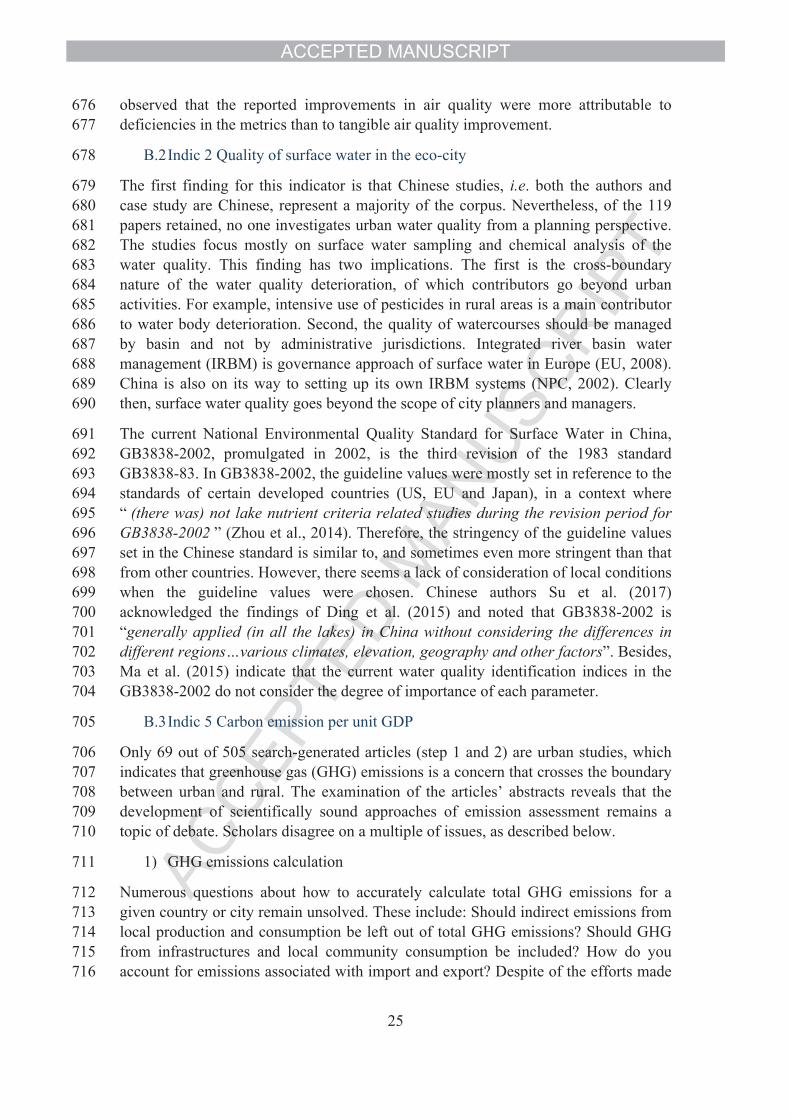
678 B.2Indic 2 Quality of surface water in the eco-city
679 The first finding for this indicator is that Chinese studies, i.e. both the authors and 680 case study are Chinese, represent a majority of the corpus. Nevertheless, of the 119 681 papers retained, no one investigates urban water quality from a planning perspective. 682 The studies focus mostly on surface water sampling and chemical analysis of the 683 water quality. This finding has two implications. The first is the cross-boundary 684 nature of the water quality deterioration, of which contributors go beyond urban 685 activities. For example, intensive use of pesticides in rural areas is a main contributor 686 to water body deterioration. Second, the quality of watercourses should be managed 687 by basin and not by administrative jurisdictions. Integrated river basin water 688 management (IRBM) is governance approach of surface water in Europe (EU, 2008). 689 China is also on its way to setting up its own IRBM systems (NPC, 2002). Clearly 690 then, surface water quality goes beyond the scope of city planners and managers.
691 The current National Environmental Quality Standard for Surface Water in China, 692 GB3838-2002, promulgated in 2002, is the third revision of the 1983 standard 693 GB3838-83. In GB3838-2002, the guideline values were mostly set in reference to the 694 standards of certain developed countries (US, EU and Japan), in a context where 695 “ (there was) not lake nutrient criteria related studies during the revision period for 696 GB3838-2002 ” (Zhou et al., 2014). Therefore, the stringency of the guideline values 697 set in the Chinese standard is similar to, and sometimes even more stringent than that 698 from other countries. However, there seems a lack of consideration of local conditions 699 when the guideline values were chosen. Chinese authors Su et al. (2017) 700 acknowledged the findings of Ding et al. (2015) and noted that GB3838-2002 is 701 “generally applied (in all the lakes) in China without considering the differences in 702 different regions…various climates, elevation, geography and other factors”. Besides, 703 Ma et al. (2015) indicate that the current water quality identification indices in the 704 GB3838-2002 do not consider the degree of importance of each parameter.
705 B.3Indic 5 Carbon emission per unit GDP
706 Only 69 out of 505 search-generated articles (step 1 and 2) are urban studies, which 707 indicates that greenhouse gas (GHG) emissions is a concern that crosses the boundary 708 between urban and rural. The examination of the articles’ abstracts reveals that the 709 development of scientifically sound approaches of emission assessment remains a 710 topic of debate. Scholars disagree on a multiple of issues, as described below.
711 1) GHG emissions calculation
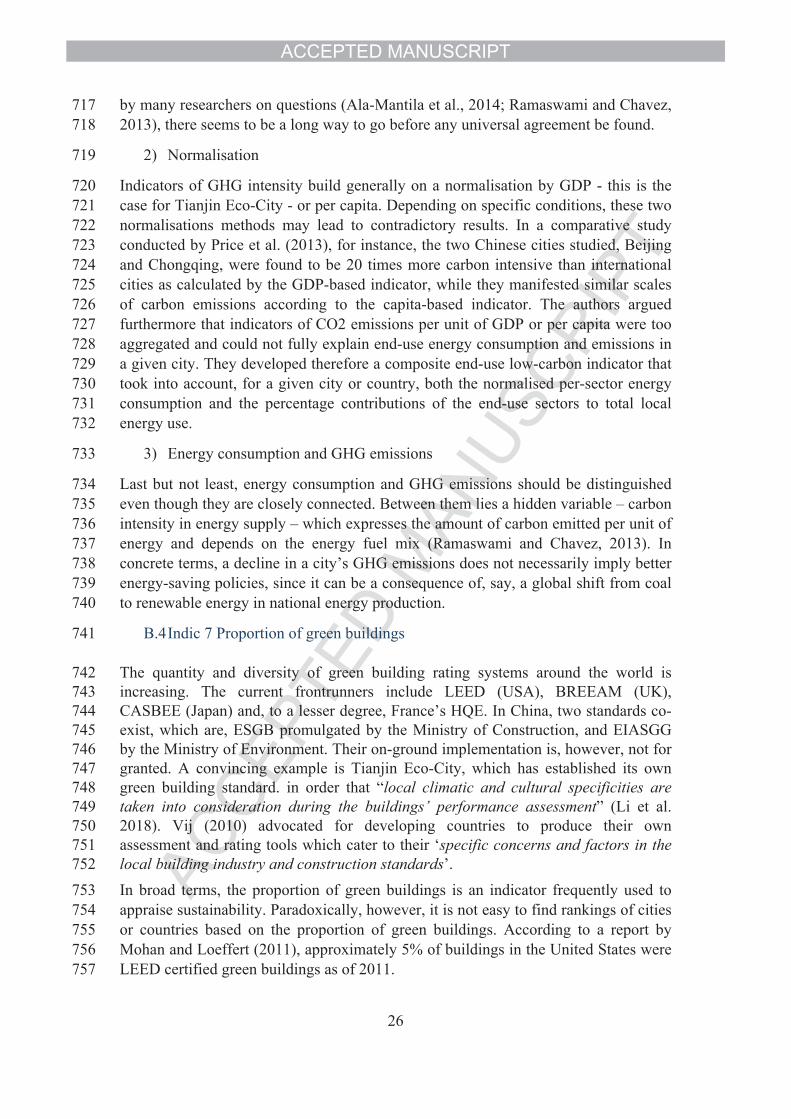
712 Numerous questions about how to accurately calculate total GHG emissions for a 713 given country or city remain unsolved. These include: Should indirect emissions from 714 local production and consumption be left out of total GHG emissions? Should GHG 715 from infrastructures and local community consumption be included? How do you 716 account for emissions associated with import and export? Despite of the efforts made
26
717 by many researchers on questions (Ala-Mantila et al., 2014; Ramaswami and Chavez, 718 2013), there seems to be a long way to go before any universal agreement be found.
719 2) Normalisation
720 Indicators of GHG intensity build generally on a normalisation by GDP - this is the 721 case for Tianjin Eco-City - or per capita. Depending on specific conditions, these two 722 normalisations methods may lead to contradictory results. In a comparative study 723 conducted by Price et al. (2013), for instance, the two Chinese cities studied, Beijing 724 and Chongqing, were found to be 20 times more carbon intensive than international 725 cities as calculated by the GDP-based indicator, while they manifested similar scales 726 of carbon emissions according to the capita-based indicator. The authors argued 727 furthermore that indicators of CO2 emissions per unit of GDP or per capita were too 728 aggregated and could not fully explain end-use energy consumption and emissions in 729 a given city. They developed therefore a composite end-use low-carbon indicator that 730 took into account, for a given city or country, both the normalised per-sector energy 731 consumption and the percentage contributions of the end-use sectors to total local 732 energy use.
733 3) Energy consumption and GHG emissions
734 Last but not least, energy consumption and GHG emissions should be distinguished 735 even though they are closely connected. Between them lies a hidden variable – carbon 736 intensity in energy supply – which expresses the amount of carbon emitted per unit of 737 energy and depends on the energy fuel mix (Ramaswami and Chavez, 2013). In 738 concrete terms, a decline in a city’s GHG emissions does not necessarily imply better 739 energy-saving policies, since it can be a consequence of, say, a global shift from coal 740 to renewable energy in national energy production.
741 B.4Indic 7 Proportion of green buildings
742 The quantity and diversity of green building rating systems around the world is 743 increasing. The current frontrunners include LEED (USA), BREEAM (UK), 744 CASBEE (Japan) and, to a lesser degree, France’s HQE. In China, two standards co-745 exist, which are, ESGB promulgated by the Ministry of Construction, and EIASGG 746 by the Ministry of Environment. Their on-ground implementation is, however, not for 747 granted. A convincing example is Tianjin Eco-City, which has established its own 748 green building standard. in order that “local climatic and cultural specificities are 749 taken into consideration during the buildings’ performance assessment” (Li et al. 750 2018). Vij (2010) advocated for developing countries to produce their own 751 assessment and rating tools which cater to their ‘specific concerns and factors in the 752 local building industry and construction standards’.
753 In broad terms, the proportion of green buildings is an indicator frequently used to 754 appraise sustainability. Paradoxically, however, it is not easy to find rankings of cities 755 or countries based on the proportion of green buildings. According to a report by 756 Mohan and Loeffert (2011), approximately 5% of buildings in the United States were 757 LEED certified green buildings as of 2011.
27
758 Buildings have been recognised as major consumers of energy and emitters of 759 greenhouse gas, so it is understandable that the quantity of green buildings in a city 760 represents to a certain level its performance as regard to sustainability. As 761 certification schemes for green buildings have become increasingly popular, it seems 762 crucial today to clarify how these international and local schemes differ from one 763 another. All of them undoubtedly cover factors such as energy efficiency, reduced 764 carbon emissions, rainwater recycling and reuse, etc. What is interesting to know is 765 how the indicators for the same factor are differently defined in different certification 766 systems. More importantly, constructing green buildings should not be a goal in itself, 767 but a way of achieving tangible sustainability outcomes. The undue enthusiasm for 768 green building labelling and for the construction of new buildings to be labelled can 769 blind us to the importance of renovating existing buildings. As Onat et al. (2014) 770 remarked, ‘focusing on the construction rate of net zero or high performance green 771 buildings alone did not help with stabilising or reducing GHG emissions unless the 772 retrofitting of existing residential building stock was seriously considered as a strict 773 policy along with green building policies’. Should a city district that consists 774 exclusively of new green buildings with old buildings entirely demolished be 775 considered more sustainable than a district where old buildings have been preserved 776 and retrofitted but without being able to be labelled as green buildings?
777 B.5Indic 10 Per capita domestic water consumption
778 Residential water consumption is an essential field of urban planning (Troy and 779 Holloway, 2004). Our review shows that per capita consumption is the indicator 780 commonly used to measure domestic water demand and to plan water supply.
781 Water demand is expected to increase in coming years as a result of climate change, 782 especially in arid and semi-arid regions (Yan, 2013). Rain water harvesting and water 783 reuse offer two major water supply alternatives. While it is obvious that reuse policies 784 can save large quantities of water from potable sources (Gonzalez et al. 2011), public 785 perception has proved to be a big challenge to the implementation of such policies. It 786 has been found that the public tends to be more supportive of low-contact reuse, less 787 so for higher-contact reuse (Friedler and Lahav, 2006; Matos et al., 2013). It is thus 788 recommended to use holistic tools, which assess not only technological and 789 environmental benefits but also socio-cultural, institutional and economic factors 790 when water reuse is planned (Garcia et al., 2015; Rahman et al., 2010; Urkiaga et al., 791 2008). Furthermore, the question of alternating water sources should be considered 792 within a broader category of urban water management (Capodaglio et al., 2016).
793 With regard to technological possibilities contributing to better management of urban 794 water demand, automated water meters are proved to be efficient appliances because 795 of their monitoring capacity. The installation of such equipment can lead to an 796 immediate reduction in water use (Harutyunyan 2012; Joo et al. 2015).
797 While there are growing international calls for water conservation, current pricing 798 policies for this fundamental and inelastic need are seemingly inconsistent with the 799 international consensus (Salman et al., 2008). A survey in the city of Qingdao, China, 800 shows that the average proportion of household expenditure on water is no more than
28
801 0.40% (Jin et al., 2015). Harutyunyan (2012) found that water consumption would 802 rebound after a short, though sharp decline following the installation of water meters, 803 if water prices were not adjusted at the same time. Similar finding have been reported 804 by Fielding et al. (2013).
805 There seems to be a need for technological improvement in household appliances in 806 order to avoid waste. In the UK, 10% of daily per capita household water 807 consumption is caused by waiting for tap water to become hot (Nawaz and Waya, 808 2014). Separate indicators for cold and hot water consumption might provide a better 809 guide to action than aggregated per capita water consumption.
810 B.6Indic 11 Per capita domestic waste generation
811 Per capita per day is a conventionally used norm for measuring the rate of urban 812 waste generation, alongside its two alternatives, per week or per year. The lack of 813 international standards and methodologies for characterising urban solid waste is 814 recognised to be problematic: the content of reported waste may vary from one city to 815 another, making intra-city comparisons difficult (Edjabou et al., 2015). An example of 816 this concerns Chinese cities. While one study reported a waste generation rate of 817 1.08 kg/person/day in Chongqing (Hui et al., 2006), another study showed a very low 818 rate of 0.23 kg/person/day in Beijing (Qu et al., 2009). The stark contrast between the 819 two Chinese megacities is less likely a reality than an artefact of possible differences 820 in the method of measurement.
821 Of equal importance are the manner and the extent to which socio-economic 822 conditions influence waste generation. Findings on this issue diverge. Gomez et al. 823 (2008), Sujauddin et al. (2008) and Ogwueleka (2013) found positive correlation 824 between household income and per capita waste generation, whereas Phuntsho et al. 825 (2010) reported an absence of ‘conclusive result’ between the two. Qu et al. (2009) 826 even found negative correlation between household size/income and waste 827 generation. In general terms however, economic and policy incentives such as ‘pay-828 as-you-throw’, and spending on education, are found to be effective measures for 829 reducing waste generation (Grazhdani, 2016).
830 B.7Indic 12 Proportion of green trips
831 Sustainable transport is a pre-requisite for a sustainable city (Wadhwa, 2000). To 832 date, however, there is no generally accepted definition of sustainable transport, or its 833 variant, “green trips” used in Tianjin Eco-City. Indeed, indicator occupies a core 834 position among urban transport studies (Buzási and Csete, 2015). Baggen and Aben 835 (2006) suggest using time, price and comfort as criterion to compare the performance 836 of urban transport solutions. Jiang et al. (2013) developed a system of 26 indicators to 837 measure transport sustainability in Chinese cities. Among the indicators, “public 838 transport and non-motor share (%)” is similar with Tianjin Eco-City’s green trips 839 indicator.
840 Developing a transit network that offers a variety of transport options and favouring 841 walkability is the primary policy for city sustainability (Haghshenas et al., 2015; Wey 842 and Hsu, 2014). Assessing the performance of a city’s transport system is an
29
843 extremely complex task, bound up with issues such as renewable energy use, GHG 844 emissions, and socio-economic reliability. As Kasperska (2015) says, “How to 845 minimise the costs generated by the development of innovative transport 846 infrastructures and offset them by environmental and social gains is still a challenge”. 847 In light of this, a high green trip proportion alone suffices hardly to make transport 848 sustainable, not to mention the difficulties in appropriately computing the so-called 849 “green trip proportion” (Cottrill and Derrible, 2015; Schipper, 2002). Similar with 850 renewable energy development, sustainable transport is intertwined with a large board 851 of questions of the urban system and requires holistic approaches to tackle with. 852 Integrated analytical and decision-making support tools are thus needed for the make 853 of sound urban transport policies (Praticò and Vaiana, 2012).
854 B.8Indic 13 Overall recycling rate
855 Recycling rate is a widely used indicator for assessing waste management in cities, 856 aside indicators of waste generation and collection. Another indicator often used is 857 “equivalent CO2 emissions” (Wilson et al., 2012). Kaila (2013) addressed the issue of 858 potential hazardous substances in recycled and re-used materials and suggested using 859 material flux to different types of sinks as an indicator of waste management 860 performance. Harder et al. (2008) proposed a Maximum Practicable Recycling Rate 861 Provision indicator for measuring the percentage of local waste that could be recycled 862 by the existing municipal services. The European waste management programme 863 ACR+ (De Clercq and Hannequart, 2010) makes recommendations on setting 864 common indicators for European countries. Wilson et al. (2015) developed a set of 865 indicators on the basis of two overlapping “triangles” defined by UN-Habitat: one 866 triangle containing the three physical components, i.e. collection, recycling, disposal, 867 and one triangle containing the components of governance, i.e. inclusivity, financial 868 sustainability and proactive institutional policies.
869 In Western countries, the transition from landfill to integrated urban waste 870 management has almost been accomplished, though challenges remain in terms of 871 disparities between areas (Clarke and Maantay, 2006; Rudden, 2007). In these 872 countries, the focus of research has shifted from technical issues relating to public 873 services to the socio-economic factors of neighbourhood scale recycling rate. For 874 instance, Clarke and Maantay (2006) developed a Recycling Education, Awareness, 875 and Participation index for measuring the socio-economic variables of recycling rates 876 in urban districts. In developing countries where municipal waste collection and 877 recycling are largely carried out by the informal recycling sector (individual waste-878 pickers), it is crucial to incorporate this sector into the waste management network in 879 order to create synergies around sustainable waste management targets. This 880 integration is believed by many scholars to offer an opportunity for win-win solutions 881 (Linzner and Salhofer, 2014; Sim et al., 2013; Tirado-Soto and Zamberlan, 2013).
882 B.9Indic 15 Treatment to render solid waste non-hazardous
883 According to “Navigating the Eco-city” (Tianjin Eco-city, 2010), this indicator refers 884 to the proportion of the total waste produced in the eco-city that are rendered non-885 hazardous. This includes: 1) treatment of dangerous and toxic waste generated by
30
886 medical, industrial and construction activities; and 2) treatment of domestic through 887 recycling, re-use, biological methods, incineration and landfill. In the book, the 888 authors provide a further explanation relating to point 2):
889 “the first form (recycling and re-use) is considered by default as non-890 hazardous treatment, the second (biological) and third (incineration) 891 forms need to meet requirement by relevant standards; (as to) the fourth 892 form (landfill), it is obligatory to assure non-hazardous landfilling.”
893 In a nutshell, this indicator is not restricted to hazardous solid waste as sensibly seems 894 to be, but to all solid waste. It can therefore be reformulated more generically, for 895 example as safe treatment and recycling of solid waste.
896 After this definition clarification, it will come as little surprise that the corpus shrunk 897 very substantially after the two filters for urban (step 2 and 3), from a considerable 898 volume following the keyword search on non-hazardous (Table 2). Among the papers 899 retained, we can cite Farzadkia et al. (2009) who points out the absence of appropriate 900 separation of hazardous waste from non-hazardous waste in some cities, and the paper 901 on the European Council Directive that suggests an impermeable mineral layer for 902 sealing non-hazardous landfills (Simon and Müller, 2004). A certain number of 903 papers talk about healthcare waste, one paper deals with the impacts of (hazardous) 904 waste on real estate, certain papers explore the use of incineration bottom ash as a 905 non-hazardous material in road construction. But there is not any paper dealing with 906 the treatment of hazardous waste from an urban planning and management 907 perspective.
908 A further examination of the larger corpus before filtering on the urban criterion 909 reveals that many studies on hazardous and non-hazardous waste originating from 910 construction and industrial were rejected because they did not include any terms from 911 the list of urban terms. This finding implies certain discordance between hazardous 912 industrial and construction waste and urban waste management. Whereas the 913 management of non-hazardous waste is the responsibility of local governments 914 (Bacinschi et al., 2010), that of hazardous waste from the healthcare, construction and 915 industrial sectors may remain the responsibility of the producers, which could be a 916 matter of concern with regard to more comprehensive urban waste management.
917 B.10 Indic 19 Renewable energy ratio
918 Renewable energy (RE) ratio is widely used for the assessment of energy 919 performance, especially in the green building and electric vehicle sectors (Begum et 920 al., 2013; Beheiry, 2011; Chen et al., 2014; Gerylo, 2010; Januševičius and 921 Streckienė, 2013; Monteiro and Nunes, 2015; Prata et al., 2013). Other indicators for 922 measuring the development and outcome of RE include “investment in renewable 923 energy” (Spalding-Fecher, 2003), and “household savings” with smart energy control 924 systems (Mourad et al., 2014).
925 Xia et al. (2008) show the importance of taking into account the extra conventional 926 energy consumed in the use of renewables in order to obtain more realistic RE
31
927 outcomes. Otherwise the contribution of RE systems may be exaggerated, leading to 928 “wide use of renewable energy without improving energy efficiency”.
929 A majority of studies in our corpus assess the potential contribution of renewable 930 energy to total energy or total electricity demand by considering the availability of RE 931 facilities or the remaining space for the installation of further facilities. Few studies 932 address RE from a planning perspective. Some explanatory clues can be found in the 933 analysis by Wall et al. (2012), in which the authors identified three architectural 934 barriers to the greater integration of solar technologies into buildings, namely: 1) 935 limited diversity/range of designs for integration into buildings, stemming from 936 insufficient architectural knowledge among manufacturers, 2) lack of knowledge of 937 technology and innovative products among architects, 3) lack of tools to quantify, 938 illustrate and communicate the outcome of including solar energy at the early design 939 phase. We can assume by analogy that the lack of sufficient shared knowledge 940 between planners and RE professions impedes the development of appropriate 941 support tools for holistic RE planning and assessment. Comprehensive planning that 942 includes a variety of city scale RE solutions seems yet to come. As Pitt and Bassett 943 (2013) observed: “While many cities are aggressively pursuing clean energy 944 opportunities in their municipal operations, far fewer are taking action to promote 945 clean energy community wide.”
946 The RE ratio is certainly a criterion that makes sense in promoting RE development, 947 since it enables comparisons between cities and countries. Nevertheless, introducing 948 RE facilities should be seen less as an ultimate goal than a way of tackling energy 949 demand and GHG emission challenges. It is essential to develop holistic approaches 950 that consider other criteria alongside RE ratio. In particular, the economic reliability 951 of any RE planning should not be neglected. Unfortunately, there seems a paucity of 952 literature addressing the economic viability of RE solutions, though we can cite the 953 study of Bassiouny et al. (2011), who evaluated the cost and value of connecting wind 954 farms to electricity grid.
955 B.11 Indic 20 Water supply from non-traditional sources
956 As might be expected, increasing the proportion of water supply from non-traditional 957 sources, i.e. from outside the municipal supply network, is one of the major objectives 958 of urban water management. All of the 50 papers ranked 1-2 deal with this issue. The 959 reuse of grey/black water and rain harvesting are two major sources for non-potable 960 water supply that receive the most attention. Research topics from our corpus include 961 the potential of the aforementioned two sources, their drivers, and the barriers to their 962 large-scale implementation. Wung et al. (2006) estimated that 35% of the water 963 supply to Taipei’s schools could be provided by rainwater harvesting. Garcia et al. 964 (2015) examined the sociological drivers of rainwater harvesting for garden irrigation in 965 a Spanish region, and found that household income, estimated water requirement and 966 education level were direct drivers, and interest in gardening and attitudes to water 967 conservation were indirect drivers. In the context of the USA, Steffen et al. (2013) 968 found that the performance of household rain harvesting systems depended on cistern 969 size and climate patterns.
32
970 In Dhaka city, average household grey water was 85 l/cap/d, i.e. 60% of the total waste 971 water generated (Biswas et al. 2012). A survey taken by Yamagata et al. (2003) showed 972 that 61% of non-potable water demand in 23 wards of the metropolitan region of Tokyo 973 was met by reclaimed water, thanks to biological treatment and ultra-filtration processes.
974 The advantages of scale have been found in the construction cost of on-site water 975 recycling systems. In the case of Tokyo, a capacity of 100m3/d was found to be the 976 threshold for greater economic viability. In the case of Houston in humid sub-tropical 977 Texas, increasing the size of rainwater cisterns was found to increase payback (Sweeney 978 and Pate, 2015).
979 The performance of parcel rainwater harvesting systems greatly depends on climatic 980 conditions, as demonstrated by research carried in a number of regions and cities 981 (Steffen et al., 2013; Sweeney and Pate, 2015).
982 The risks to human health of using reclaimed water are found to be relatively low, 983 provided that rigorous and appropriate treatment processes are implemented for the 984 target usage (Barker-Reid et al., 2010; Sinclair et al., 2010; Wang et al., 2011; 985 Yamagata et al., 2003). Apart from routine issues, which are the object of continuous 986 research, including patterns of indoor water use (Matos et al., 2013), the quality and 987 aesthetics of reclaimed water (Biswas et al. 2012), further progress in regulations and 988 incentive strategies also seems to be a key contributor to the use of alternative water 989 sources. A change in public attitudes from acceptance of low-contact reuse only 990 (Friedler and Lahav, 2006) to acceptance of higher-contact reuse, can only be 991 achieved through greater awareness.
992 Last but not least, the request for alternative water sources should not be a substitute 993 of water-conservation measures and encouragement of behavioral change. It is easy to 994 understand that reuse could lead to excessive consumption because of the lower price 995 of reused water compared with tap water, which in turn would have an adverse impact 996 on sewage (more wastewater to be drained). From this perspective, continuing 997 encouragement is needed both for the use of different water and of less water, in order 998 to alleviate the pressures on surface and underground water resources.
999 References
1000 Ala-Mantila, S., Heinonen, J., Junnila, S., 2014. Relationship between urbanization, 1001 direct and indirect greenhouse gas emissions, and expenditures: A multivariate 1002 analysis. Ecol. Econ. 104, 129–139. 1003 https://doi.org/10.1016/j.ecolecon.2014.04.0191004 Andrews, S.Q., 2008. Inconsistencies in air quality metrics: ‘Blue Sky’ days and PM10 1005 concentrations in Beijing. Environ. Res. Lett. 3. https://doi.org/10.1088/1748-1006 9326/3/3/0340091007 Bacinschi, Z., Rizescu, C.Z., Stoian, E.V., Necula, C., 2010. Waste Management 1008 Practices Used in the Attempt to Protect the Environment, in: Proceedings of 1009 the 3rd WSEAS International Conference on Engineering Mechanics, 1010 Structures, Engineering Geology, EMESEG’10. World Scientific and
33
1011 Engineering Academy and Society (WSEAS), Stevens Point, Wisconsin, 1012 USA, pp. 378–382.1013 Baggen, J.H., Aben, E.M.L., 2006. Automated transport in urban areas: opportunities 1014 in the Netherlands. WIT Press, pp. 453–462. 1015 https://doi.org/10.2495/UT0604511016 Barker-Reid, F., Harper, G.A., Hamilton, A.J., 2010. Affluent effluent: growing 1017 vegetables with wastewater in Melbourne, Australia—a wealthy but bone-dry 1018 city. Irrig. Drain. Syst. 24, 79–94. https://doi.org/10.1007/s10795-009-9082-x1019 Bassiouny, E., El-Ela, A.A.A., Othman, S.A., 2011. Reliability cost/worth evaluation 1020 of bulk power system at Zafarana site in Egypt, in: 2011 IEEE PES 1021 Conference on Innovative Smart Grid Technologies - Middle East (ISGT 1022 Middle East). pp. 1–7. https://doi.org/10.1109/ISGT-MidEast.2011.62208021023 Begum, S., Kumaran, P., Jayakumar, M., 2013. Use of Oil Palm Waste as a 1024 Renewable Energy Source and Its Impact on Reduction of Air Pollution in 1025 Context of Malaysia. IOP Conf. Ser. Earth Environ. Sci. 16, 012026. 1026 https://doi.org/10.1088/1755-1315/16/1/0120261027 Beheiry, S.M., 2011. Benchmarking Sustainable Construction Technology. Adv. 1028 Mater. Res. 347–353, 2913–2920. 1029 https://doi.org/10.4028/www.scientific.net/AMR.347-353.29131030 Biswas, S.K., Rahman, Md Mafizur, Rahman, M.Y.A., Rahman, Md Mehbuboor, 1031 2012. Applicability of domestic grey water reuse for alleviation of water crisis 1032 in Dhaka City. J. Water Reuse Desalination 2, 239–246. 1033 https://doi.org/10.2166/wrd.2012.0771034 Buzási, A., Csete, M., 2015. Sustainability Indicators in Assessing Urban Transport 1035 Systems. Period. Polytech. Transp. Eng. 43, 138–145. 1036 https://doi.org/10.3311/PPtr.78251037 Capodaglio, A.G., Ghilardi, P., Boguniewicz-Zablocka, J., 2016. New paradigms in 1038 urban water management for conservation and sustainability. Water Pract. 1039 Technol. 11, 176–186. https://doi.org/10.2166/wpt.2016.0221040 Caprotti, F., Springer, C., Harmer, N., 2015. ‘Eco’ For Whom? Envisioning Eco-1041 urbanism in the Sino-Singapore Tianjin Eco-city, China. Int. J. Urban Reg. 1042 Res. 39, 495–517. https://doi.org/10.1111/1468-2427.122331043 Chen, Z., Liu, N., Lu, X., Xiao, X., Zhang, J., 2014. Dynamic power distribution 1044 method of PV-based battery switch stations considering battery reservation. 1045 ResearchGate 29, 306–315.1046 Clarke, M.J., Maantay, J.A., 2006. Optimizing recycling in all of New York City’s 1047 neighborhoods: Using GIS to develop the REAP index for improved recycling 1048 education, awareness, and participation. Resour. Conserv. Recycl. 46, 128–1049 148. https://doi.org/10.1016/j.resconrec.2005.06.0081050 Cook, D., Saviolidis, N.M., Davíðsdóttir, B., Jóhannsdóttir, L., Ólafsson, S., 2017. 1051 Measuring countries’ environmental sustainability performance—The 1052 development of a nation-specific indicator set. Ecol. Indic. 74, 463–478. 1053 https://doi.org/10.1016/j.ecolind.2016.12.0091054 Cottrill, C.D., Derrible, S., 2015. Leveraging Big Data for the Development of 1055 Transport Sustainability Indicators. J. Urban Technol. 22, 45–64. 1056 https://doi.org/10.1080/10630732.2014.9420941057 Csardi, G., Nepusz, T., 2006. The igraph software package for complex network 1058 research. InterJournal Complex Syst. 1695, 1–9.
34
1059 De Clercq, O., Hannequart, J.-P., 2010. Vers un observatoire européen décentralisé 1060 des performances de gestion des déchets municipaux. Tech. Sci. Méthodes 1061 67–75. https://doi.org/10.1051/tsm/2010090671062 de Jong, M., Joss, S., Schraven, D., Zhan, C., Weijnen, M., 2015. Sustainable-smart-1063 resilient-low carbon-eco-knowledge cities; Making sense of a multitude of 1064 concepts promoting sustainable urbanization. J. Clean. Prod. 109, 25–38. 1065 https://doi.org/10.1016/j.jclepro.2015.02.0041066 de Jong, M., Yu, C., Chen, X., Wang, D., Weijnen, M., 2013. Developing robust 1067 organizational frameworks for Sino-foreign eco-cities: comparing Sino-Dutch 1068 Shenzhen Low Carbon City with other initiatives. J. Clean. Prod. 57, 209–220. 1069 https://doi.org/10.1016/j.jclepro.2013.06.0361070 Devuyst, D., Hens, L., Lannoy, W. de (Eds.), 2001. How green is the city?: 1071 sustainability assessment and the management of urban environments. 1072 Columbia University Press, New York.1073 Ding, J., Cao, J., Xu, Q., Xi, B., Su, J., Gao, R., Huo, S., Liu, H., 2015. Spatial 1074 heterogeneity of lake eutrophication caused by physiogeographic conditions: 1075 An analysis of 143 lakes in China. J. Environ. Sci. 30, 140–147. 1076 https://doi.org/10.1016/j.jes.2014.07.0291077 Dormann, C.F., Fründ, J., Blüthgen, N., Gruber, B., 2009. Indices, graphs and null 1078 models: analyzing bipartite ecological networks.1079 Ecocity Builders, 2015. International Ecocity Framwework and Standards.1080 Edjabou, M.E., Jensen, M.B., Götze, R., Pivnenko, K., Petersen, C., Scheutz, C., 1081 Astrup, T.F., 2015. Municipal solid waste composition: Sampling 1082 methodology, statistical analyses, and case study evaluation. Waste Manag. 1083 36, 12–23. https://doi.org/10.1016/j.wasman.2014.11.0091084 EU, 2008. Directive 2008/50/EC of the European Parliament and of the Council of 21 1085 May 2008 on ambient air quality and cleaner air for Europe. Off. J. Eur. 1086 Communities 152, 1–43. http://eur-1087 lex.europa.eu/LexUriServ/LexUriServ.do?uri=OJ:L:2008:152:0001:0044:EN:1088 PDF1089 European Comission, 2016. Urban Europe: Statistics on Cities, Towns and Suburbs. 1090 https://doi.org/10.2785/911201091 Eurostat, 2016. Energy, transport and environment indicators. 2016 edition, statistical 1092 books. European Union, Luxembourg.1093 Farzadkia, M., Moradi, A., Mohammadi, M.S., Jorfi, S., 2009. Hospital waste 1094 management status in Iran: a case study in the teaching hospitals of Iran 1095 University of Medical Sciences. Waste Manag. Res. J. Int. Solid Wastes 1096 Public Clean. Assoc. ISWA 27, 384–389. 1097 https://doi.org/10.1177/0734242X093357031098 Fiala, N., 2008. Measuring sustainability: Why the ecological footprint is bad 1099 economics and bad environmental science. Ecol. Econ. 67, 519–525. 1100 https://doi.org/10.1016/j.ecolecon.2008.07.0231101 Fielding, K.S., Spinks, A., Russell, S., McCrea, R., Stewart, R., Gardner, J., 2013. An 1102 experimental test of voluntary strategies to promote urban water demand 1103 management. J. Environ. Manage. 114, 343–351. 1104 https://doi.org/10.1016/j.jenvman.2012.10.0271105 Friedler, E., Lahav, O., 2006. Centralised urban wastewater reuse: what is the public 1106 attitude? Water Sci. Technol. 54, 423. https://doi.org/10.2166/wst.2006.605
35
1107 Garcia, X., Llausàs, A., Ribas, A., Saurí, D., 2015. Watering the garden: preferences 1108 for alternative sources in suburban areas of the Mediterranean coast. Local 1109 Environ. 20, 548–564. https://doi.org/10.1080/13549839.2013.8733971110 Gerylo, R., 2010. The conversion of energy efficiency requirements for buildings in 1111 poland. Prague.1112 Gomez, G., Meneses, M., Ballinas, L., Castells, F., 2008. Characterization of urban 1113 solid waste in Chihuahua, Mexico. Waste Manag. 28, 2465–2471. 1114 https://doi.org/10.1016/j.wasman.2007.10.0231115 Gonzalez, A.., Baca, I.., Chanampa, M., Frutos, C.., Roman, C.., Gonzalez, J.., 2011. 1116 Rethinking the green roof. A proposal of grey water phytodepuration system, 1117 in: Proceedings of the 27th International Conference on Passive and Low 1118 Energy Architecture.1119 Grazhdani, D., 2016. Assessing the variables affecting on the rate of solid waste 1120 generation and recycling: An empirical analysis in Prespa Park. Waste Manag. 1121 48, 3–13. https://doi.org/10.1016/j.wasman.2015.09.0281122 Greed, C., 2012. Planning for sustainable transport or for people’s needs. Proc. Inst. 1123 Civ. Eng. - Urban Des. Plan. 165, 219–229. 1124 https://doi.org/10.1680/udap.10.000331125 Haghshenas, H., Vaziri, M., Gholamialam, A., 2015. Evaluation of sustainable policy 1126 in urban transportation using system dynamics and world cities data: A case 1127 study in Isfahan. Cities 45, 104–115. 1128 https://doi.org/10.1016/j.cities.2014.11.0031129 Hao, W., 2012. Ditan shengtai chengshi guocheng chuangxin yu pingjia yanjiu - yi 1130 tianjinshi weili. Tianjin University.1131 Harder, M.K., Stantzos, N., Woodard, R., Read, A., 2008. Development of a new 1132 quality fair access best value performance indicator (BVPI) for recycling 1133 services. Waste Manag. 28, 299–309. 1134 https://doi.org/10.1016/j.wasman.2006.12.0151135 Harutyunyan, N., 2012. The Move to Universal Water Metering and Volumetric 1136 Pricing in Armenia, in: ICSDEC 2012. American Society of Civil Engineers, 1137 pp. 975–984.1138 Hu, J., Wang, Y., Ying, Q., Zhang, H., 2014. Spatial and temporal variability of 1139 PM2.5 and PM10 over the North China Plain and the Yangtze River Delta, 1140 China. Atmos. Environ. 95, 598–609. 1141 https://doi.org/10.1016/j.atmosenv.2014.07.0191142 Hu, J., Ying, Q., Wang, Y., Zhang, H., 2015. Characterizing multi-pollutant air 1143 pollution in China: Comparison of three air quality indices. Environ. Int. 84, 1144 17–25. https://doi.org/10.1016/j.envint.2015.06.0141145 Hu, M.-C., Wadin, J.L., Lo, H.-C., Huang, J.-Y., 2015. Transformation toward an 1146 eco-city: lessons from three Asian cities. J. Clean. Prod. 1147 https://doi.org/10.1016/j.jclepro.2015.09.0331148 Hui, Y., Li’ao, W., Fenwei, S., Gang, H., 2006. Urban solid waste management in 1149 Chongqing: Challenges and opportunities. Waste Manag. 26, 1052–1062. 1150 https://doi.org/10.1016/j.wasman.2005.09.0051151 International Ecocity Framwework and Standards, 2015.1152 Januševičius, K., Streckienė, G., 2013. Solar Assisted Ground Source Heat Pump 1153 Performance in Nearly Zero Energy Building in Baltic Countries. Sci. J. Riga 1154 Tech. Univ. Environ. Clim. Technol. 11. https://doi.org/10.2478/rtuect-2013-1155 0007
36
1156 Jiang, T., Wu, Z., Song, Y., Liu, X., Liu, H., Zhang, H., 2013. Sustainable transport 1157 data collection and application: China Urban Transport Database. Math. Probl. 1158 Eng. 2013. https://doi.org/10.1155/2013/8797521159 Jin, J., Cui, Y., Zhang, L., Zhou, Y., Wu, C., 2015. Simulation and prediction analysis 1160 of urban household water demand based on multi-agent. J. Hydraul. Eng. 1161 1387–1397.1162 Joo, J.C., Oh, H.J., Ahn, H., Ahn, C.H., Lee, S., Ko, K.-R., 2015. Field application of 1163 waterworks automated meter reading systems and analysis of household water 1164 consumption. Desalination Water Treat. 54, 1401–1409. 1165 https://doi.org/10.1080/19443994.2014.8896091166 Joss, S., Cowley, R., de Jong, M., Müller, B., Park, B.-S., Rees, W., Roseland, M., 1167 Rydin, Y., 2015. Tomorrow’s City Today: Prospects for Standardising 1168 Sustainable Urban Development. University of Westminster, London.1169 Joss, S., Cowley, R., Tomozeiu, D., 2013. Towards the ‘ubiquitous eco-city’: An 1170 analysis of the internationalisation of eco-city policy and practice. Urban Res. 1171 Pract. 6, 54–74. https://doi.org/10.1080/17535069.2012.7622161172 Joss, S., Tomozeiu, D., Cowley, R., 2012. Eco-city indicators: governance challenges. 1173 pp. 109–120. https://doi.org/10.2495/SC1201011174 Kaila, J., 2013. How do we manage consumption wastes from a skinks point of view? 1175 Espoo, Finland.1176 Kasperska, E., 2015. Projekt CIVITAS RENAISSANCE w Szczecinku w kontekście 1177 założeń zrównoważonego. Rocz. Ochr. Śr. Tom 17, cz.1178 Lee, J.H., Hancock, M.G., Hu, M.C., 2014. Towards an effective framework for 1179 building smart cities: Lessons from Seoul and San Francisco. Technol. 1180 Forecast. Soc. Change 89, 80–99. 1181 https://doi.org/10.1016/j.techfore.2013.08.0331182 Li, Y., Bonhomme, C., Deroubaix, J.-F., 2018. Can a Sustainable Urban Development 1183 Model be Exported ? China Perspect. 1–2, 87–97.1184 Ling, H.L.O., Ting, K.H., Shaharuddin, A., Kadaruddin, A., Yaakob, M.J., 2010. Air 1185 quality and human health in urban settlement: Case study of Kuala Lumpur 1186 city, in: 2010 International Conference on Science and Social Research 1187 (CSSR). pp. 510–515. https://doi.org/10.1109/CSSR.2010.57738311188 Linzner, R., Salhofer, S., 2014. Municipal solid waste recycling and the significance 1189 of informal sector in urban China. Waste Manag. Res. J. Int. Solid Wastes 1190 Public Clean. Assoc. ISWA 32, 896–907. 1191 https://doi.org/10.1177/0734242X145435551192 Ma, X., Shang, X., Wang, L., Dahlgren, R.A., Zhang, M., 2015. Innovative approach 1193 for the development of a water quality identification index—a case study from 1194 the Wen-Rui Tang River watershed, China. Desalination Water Treat. 55, 1195 1400–1410. https://doi.org/10.1080/19443994.2014.9258291196 Matos, C., Teixeira, C.A., Duarte, A.A.L.S., Bentes, I., 2013. Domestic water uses: 1197 Characterization of daily cycles in the north region of Portugal. Sci. Total 1198 Environ. 458–460, 444–450. https://doi.org/10.1016/j.scitotenv.2013.04.0181199 Medved, P., 2016. A contribution to the structural model of autonomous sustainable 1200 neighbourhoods: new socio-economical basis for sustainable urban planning. 1201 J. Clean. Prod. 120, 21–30. https://doi.org/10.1016/j.jclepro.2016.01.0911202 Mohan, S.B., Loeffert, B., 2011. Economics of green buildings, in: Proceedings. pp. 1203 2877–2886.
37
1204 Moldan, B., Janoušková, S., Hák, T., 2012. How to understand and measure 1205 environmental sustainability: Indicators and targets. Ecol. Indic. 17, 4–13. 1206 https://doi.org/10.1016/j.ecolind.2011.04.0331207 Monteiro, J., Nunes, M.S., 2015. A Renewable Source Aware Model for the Charging 1208 of Plug-in Electrical Vehicles: SCITEPRESS - Science and and Technology 1209 Publications, pp. 51–58. https://doi.org/10.5220/00054590005100581210 Mourad, M.M., Ali, A.H.H., Ookawara, S., Abdel-Rahman, A.K., Abdelkariem, 1211 N.M., 2014. An energy-efficient smart home for new cities in Egypt. pp. 115–1212 126. https://doi.org/10.2495/ARC1401111213 Nawaz, R., Waya, B.G.K., 2014. Estimating the amount of cold water wastage in UK 1214 households. Proc. Inst. Civ. Eng. - Water Manag. 167, 457–466. 1215 https://doi.org/10.1680/wama.12.001091216 Nelson, C., 2012. China’s Green Building Future | China Business Review, China 1217 buisness review.1218 NPC, 2002. Water law of the People’s Republic of China.1219 Ogwueleka, T.C., 2013. Survey of household waste composition and quantities in 1220 Abuja, Nigeria. Resour. Conserv. Recycl. 77, 52–60. 1221 https://doi.org/10.1016/j.resconrec.2013.05.0111222 Onat, N.C., Egilmez, G., Tatari, O., 2014. Towards greening the U.S. residential 1223 building stock: A system dynamics approach. Build. Environ. 78, 68–80. 1224 https://doi.org/10.1016/j.buildenv.2014.03.0301225 Parris, T.M., Kates, R.W., 2003. Characterizing and measuring sustainable 1226 development. Annu. Rev. Environ. Resour., Review in Advance 28, 559–586. 1227 https://doi.org/10.1146/annurev.energy.28.050302.1055511228 Pastille Consortium, 2002. Indicators Into Action: Local sustainability indicator sets 1229 in their context. Final Report. Deliverable 19. London.1230 Phuntsho, S., Dulal, I., Yangden, D., Tenzin, U.M., Herat, S., Shon, H., Vigneswaran, 1231 S., 2010. Studying municipal solid waste generation and composition in the 1232 urban areas of Bhutan. Waste Manag. Res. J. Int. Solid Wastes Public Clean. 1233 Assoc. ISWA 28, 545–551. https://doi.org/10.1177/0734242X093431181234 Pitt, D., Bassett, E., 2013. Collaborative Planning for Clean Energy Initiatives in 1235 Small to Mid-Sized Cities. J. Am. Plann. Assoc. 79, 280–294. 1236 https://doi.org/10.1080/01944363.2014.9148461237 Prata, J., Arsenio, E., Pontes, J.P., 2013. Moving towards the sustainable city: the role 1238 of electric vehicles, renewable energy and energy efficiency. pp. 871–883. 1239 https://doi.org/10.2495/SC1307421240 Praticò, F.G., Vaiana, R., 2012. Improving infrastructure sustainability in suburban 1241 and urban areas: is porous asphalt the right answer? and how? pp. 673–684. 1242 https://doi.org/10.2495/UT1205711243 Price, L., Zhou, N., Fridley, D., Ohshita, S., Lu, H., Zheng, N., Fino-Chen, C., 2013. 1244 Development of a low-carbon indicator system for China. Habitat Int. 37, 4–1245 21. https://doi.org/10.1016/j.habitatint.2011.12.0091246 Qu, X., Li, Z., Xie, X., Sui, Y., Yang, L., Chen, Y., 2009. Survey of composition and 1247 generation rate of household wastes in Beijing, China. Waste Manag. 29, 1248 2618–2624. https://doi.org/10.1016/j.wasman.2009.05.0141249 R Development Core Team, 2011. A Language and Environment for Statistical 1250 Computing. the R foundation for Statistical Computing, Vienna, Austria.
38
1251 Rahman, A., Dbais, J., Imteaz, M., 2010. Sustainability of rainwater harvesting 1252 systems in multistorey residential buildings. Am. Jounral Eng. Appl. Sci., 1253 Science Publications 3, 73–82.1254 Ramaswami, A., Chavez, A., 2013. What metrics best reflect the energy and carbon 1255 intensity of cities? Insights from theory and modeling of 20 US cities. 1256 Environ. Res. Lett. 8, 035011. https://doi.org/10.1088/1748-9326/8/3/0350111257 Robles-Molina, J., Gilbert-López, B., García-Reyes, J.F., Molina-Díaz, A., 2013. Gas 1258 chromatography triple quadrupole mass spectrometry method for monitoring 1259 multiclass organic pollutants in Spanish sewage treatment plants effluents. 1260 Talanta 111, 196–205. https://doi.org/10.1016/j.talanta.2013.03.0061261 Rudden, P.J., 2007. Report: policy drivers and the planning and implementation of 1262 integrated waste management in Ireland using the regional approach. Waste 1263 Manag. Res. J. Int. Solid Wastes Public Clean. Assoc. ISWA 25, 270–275.1264 Salman, A., Al-Karablieh, E., Haddadin, M., 2008. Limits of pricing policy in 1265 curtailing household water consumption under scarcity conditions. Water 1266 Policy 10, 295–304. https://doi.org/10.2166/wp.2008.0401267 Schipper, L., 2002. Sustainable Urban transport in the 21st century: a new agenda. 1268 Transp. Res. Rec. J. Transp. Res. Board 12–19.1269 Shan, W., Yin, Y., Zhang, J., Ding, Y., 2008. Observational study of surface ozone at 1270 an urban site in East China. Atmospheric Res. 89, 252–261. 1271 https://doi.org/10.1016/j.atmosres.2008.02.0141272 Shen, L.-Y., Jorge Ochoa, J., Shah, M.N., Zhang, X., 2011. The application of urban 1273 sustainability indicators – A comparison between various practices. Habitat 1274 Int. 35, 17–29. https://doi.org/10.1016/j.habitatint.2010.03.0061275 Shiuh-Shen, C., 2013. Chinese eco-cities: A perspective of land-speculation-oriented 1276 local entrepreneurialism. China Inf. 27, 173–196. 1277 https://doi.org/10.1177/0920203X134857021278 Sim, N.M., Wilson, D.C., Velis, C.A., Smith, S.R., 2013. Waste management and 1279 recycling in the former Soviet Union: the City of Bishkek, Kyrgyz Republic 1280 (Kyrgyzstan). Waste Manag. Res. J. Int. Solid Wastes Public Clean. Assoc. 1281 ISWA 31, 106–125. https://doi.org/10.1177/0734242X134998131282 Simon, F.-G., Müller, W.W., 2004. Standard and alternative landfill capping design in 1283 Germany. Environ. Sci. Policy 7, 277–290. 1284 https://doi.org/10.1016/j.envsci.2004.04.0021285 Sinclair, M., O’Toole, J., Forbes, A., Carr, D., Leder, K., 2010. Health status of 1286 residents of an urban dual reticulation system. Int. J. Epidemiol. 39, 1667–1287 1675. https://doi.org/10.1093/ije/dyq1521288 Spalding-Fecher, R., 2003. Indicators of sustainability for the energy sector: a South 1289 African case study. Energy Sustain. Dev. 7, 35–49.1290 Steffen, J., Jensen, M., Pomeroy, C.A., Burian, S.J., 2013. Water Supply and 1291 Stormwater Management Benefits of Residential Rainwater Harvesting in 1292 U.S. Cities. JAWRA J. Am. Water Resour. Assoc. 49, 810–824. 1293 https://doi.org/10.1111/jawr.120381294 Su, J., Ji, D., Lin, M., Chen, Y., Sun, Y., Huo, S., Zhu, J., Xi, B., 2017. Developing 1295 surface water quality standards in China. Resour. Conserv. Recycl. 117, 294–1296 303. https://doi.org/10.1016/j.resconrec.2016.08.0031297 Sujauddin, M., Huda, S.M.S., Hoque, A.T.M.R., 2008. Household solid waste 1298 characteristics and management in Chittagong, Bangladesh. Waste Manag. 28, 1299 1688–1695. https://doi.org/10.1016/j.wasman.2007.06.013
39
1300 Suzuki, H., Dastur, A., Moffatt, S., Yabuki, N., Maruyama, H., 2010. Eco2Cities - 1301 Ecological Cities as Economic Cities.pdf.1302 Sweeney, J.F., Pate, M., 2015. Life Cycle Costs and Field Performance Studies of a 1303 Domestic Rainwater Harvesting Application in a Humid, Sub-Tropical, 1304 Metropolitan Environment, in: World Environmental and Water Resources 1305 Congress 2015. American Society of Civil Engineers, pp. 334–343.1306 Tao, J., Zhang, L., Zhang, Z., Huang, R., Wu, Y., Zhang, R., Cao, J., Zhang, Y., 2015. 1307 Control of PM2.5 in Guangzhou during the 16th Asian Games period: 1308 Implication for hazy weather prevention. Sci. Total Environ. 508, 57–66. 1309 https://doi.org/10.1016/j.scitotenv.2014.11.0741310 Tianjin Eco-city, 2010. Daohang shengtai chengshi - Zhongxin shengtaicheng zhibiao 1311 tixi shishi moshi (Navigating Eco-city - Implementation of the KPI system of 1312 the Sino-Singapore Tianjin Eco-City), China construction industrial press. ed.1313 Tirado-Soto, M.M., Zamberlan, F.L., 2013. Networks of recyclable material waste-1314 picker’s cooperatives: An alternative for the solid waste management in the 1315 city of Rio de Janeiro. Waste Manag. 33, 1004–1012. 1316 https://doi.org/10.1016/j.wasman.2012.09.0251317 Troy, P., Holloway, D., 2004. The use of residential water consumption as an urban 1318 planning tool: a pilot study in Adelaide. J. Environ. Plan. Manag. 47, 97–114. 1319 https://doi.org/10.1080/09640560420001898261320 United Nations (Ed.), 2007. Indicators of sustainable development: guidelines and 1321 methodologies, 3rd ed. ed. United Nations, New York.1322 Urkiaga, A., de las Fuentes, L., Bis, B., Chiru, E., Balasz, B., Hernández, F., 2008. 1323 Development of analysis tools for social, economic and ecological effects of 1324 water reuse. Desalination 218, 81–91. 1325 https://doi.org/10.1016/j.desal.2006.08.0231326 Vij, A., 2010. National green building assessment tool in India, in: Central Europe 1327 towards Sustainable Building “From Theory to Practice.” Prague.1328 Wadhwa, L.., 2000. Sustainable transportation: the Key to sustainable cities, in: 1329 Brebbia, C.., Ferrante, A., Rodriguez, M., Terra, B. (Eds.), The Sustainable 1330 City: Urban Regeneration and Sustainability, International Series on Advances 1331 in Architecture. WIT Press, Southampton, UK ; Boston, pp. 281–289.1332 Wall, M., Probst, M.C.M., Roecker, C., Dubois, M.-C., Horvat, M., Jørgensen, O.B., 1333 Kappel, K., 2012. Achieving Solar Energy in Architecture-IEA SHC Task 41. 1334 Energy Procedia 30, 1250–1260. https://doi.org/10.1016/j.egypro.2012.11.1381335 Wang, X.C., Chen, R., Liu, Y.Z., Zhou, Y.B., Yang, X.D., Zhang, H.S., 2011. An 1336 independent water system with maximized wastewater reuse for non-potable 1337 purposes - Model case for future urban development. Water Pract. Technol. 6, 1338 wpt2011012. https://doi.org/10.2166/wpt.2011.0121339 WCED, 1987. Our common future, World Commission for Environment and 1340 Developmen. Oxford University Press.1341 Weiss, L., 2014. Tianjin, Eco-City, China. A bilateral institutional NEXUS for 1342 cutting-edge sustainable metropolitan development.1343 Wey, W.-M., Hsu, J., 2014. New Urbanism and Smart Growth: Toward achieving a 1344 smart National Taipei University District. Habitat Int. 42, 164–174. 1345 https://doi.org/10.1016/j.habitatint.2013.12.0011346 WHO, 2005. WHO Air quality guidelines for particulate matter, ozone, nitrogen 1347 dioxide and sulfur dioxide - Global update 2005, Summary of risk assessment. 1348 World Health Organ. Publ.
40
1349 Wickham, H., 2017. stringr: Simple, Consistent Wrappers for Common String 1350 Operations.1351 Wickham, H., 2016. ggplot2: elegant graphics for data analysis, Second edi. ed, Use 1352 R! Springer, Cham.1353 Wilson, D.C., Rodic, L., Cowing, M.J., Velis, C.A., Whiteman, A.D., Scheinberg, A., 1354 Vilches, R., Masterson, D., Stretz, J., Oelz, B., 2015. ‘Wasteaware’ 1355 benchmark indicators for integrated sustainable waste management in cities. 1356 Waste Manag. 35, 329–342. https://doi.org/10.1016/j.wasman.2014.10.0061357 Wilson, D.C., Rodic, L., Scheinberg, A., Velis, C.A., Alabaster, G., 2012. 1358 Comparative analysis of solid waste management in 20 cities. Waste Manag. 1359 Res. 30, 237–254. https://doi.org/10.1177/0734242X124375691360 Wung, T.-C., Lin, S.-H., Huang, S.-M., 2006. Rainwater reuse supply and demand 1361 response in urban elementary school of different districts in Taipei. Resour. 1362 Conserv. Recycl. 46, 149–167. 1363 https://doi.org/10.1016/j.resconrec.2005.06.0091364 Xia, C., Zhu, Y., Lin, B., 2008. Renewable energy utilization evaluation method in 1365 green buildings. Renew. Energy 33, 883–886. 1366 https://doi.org/10.1016/j.renene.2007.10.0051367 Yamagata, H., Ogoshi, M., Suzuki, Y., Ozaki, M., Asano, T., 2003. On-site water 1368 recycling systems in Japan. Water Sci. Technol. Water Supply 3, 149–154.1369 Yan, D., 2013. Urban domestic water consumption response to climate change in 1370 Urumqi city. pp. 897–904. https://doi.org/10.2495/ICESEP1311811371 Zhou, C., Dai, X., Wang, R., Huang, J., 2011. Indicators for evaluating sustainable 1372 communities: a review. Acta Ecol. Sin. 31, 4749–4759.1373 Zhou, Y., Khu, S.-T., Xi, B., Su, J., Hao, F., Wu, J., Huo, S., 2014. Status and 1374 challenges of water pollution problems in China: learning from the European 1375 experience. Environ. Earth Sci. 72, 1243–1254. 1376 https://doi.org/10.1007/s12665-013-3042-31377