Embed Size (px)
Citation preview
TI-89 for Summer Bridge Page 1 of 18
Notes for CETA’s Summer Bridge August 2014 Prof. Lee Townsend
The TI-89 calculator
Finding it on the TI website: http://education.ti.com/en/us/products/calculators
The TI-89 Titanium page: http://education.ti.com/en/us/products/calculators/graphing-calculators/ti-89-titanium/downloads/applications
TI-89 for Summer Bridge Page 2 of 18
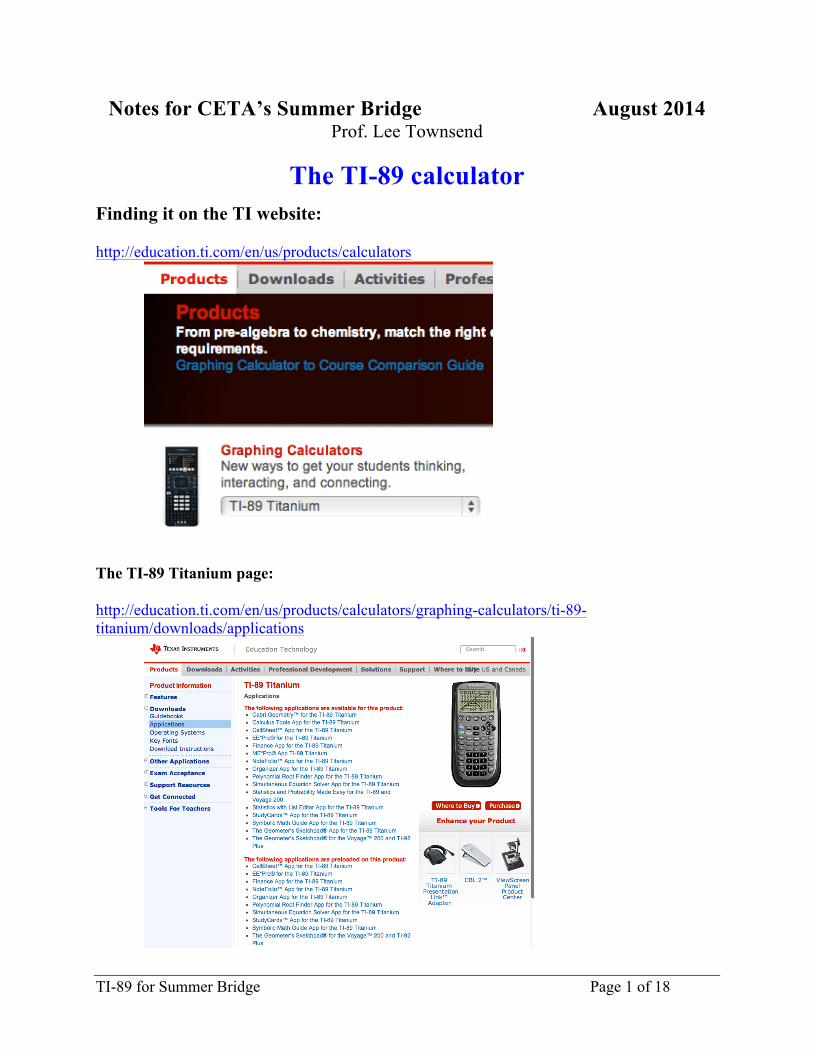
How do you download more apps for your TI-89? You need to put TI-Connect on your computer then connect with a USB cable. http://education.ti.com/en/us/products/computer_software/connectivity-software/ti-connect-software/downloads/download-instructions
User Guides TI-89_Guidebook_EN.pdf http://education.ti.com/download/en/US/FA1DC891957E4700B46A67255850C592/983EA8A4BA2A4AE9B2AF5EEEE922E3C1/TI-89_Guidebook_EN.pdf TI89TitaniumGuidebook_Part2_EN.pdf - More Step by Step Examples http://education.ti.com/media/5CD86F83000749C8827577654B252E06/ti89titaniumguidebook_part2_en.pdf PrenHall: http://www.prenhall.com/divisions/esm/app/graphing/ti89/sitemap.html Northfield Mount Herman: http://www.nmhschool.org/sites/default/files/pdf/academics/math/ti89_instructions.pdf
TI-89 for Summer Bridge Page 3 of 18
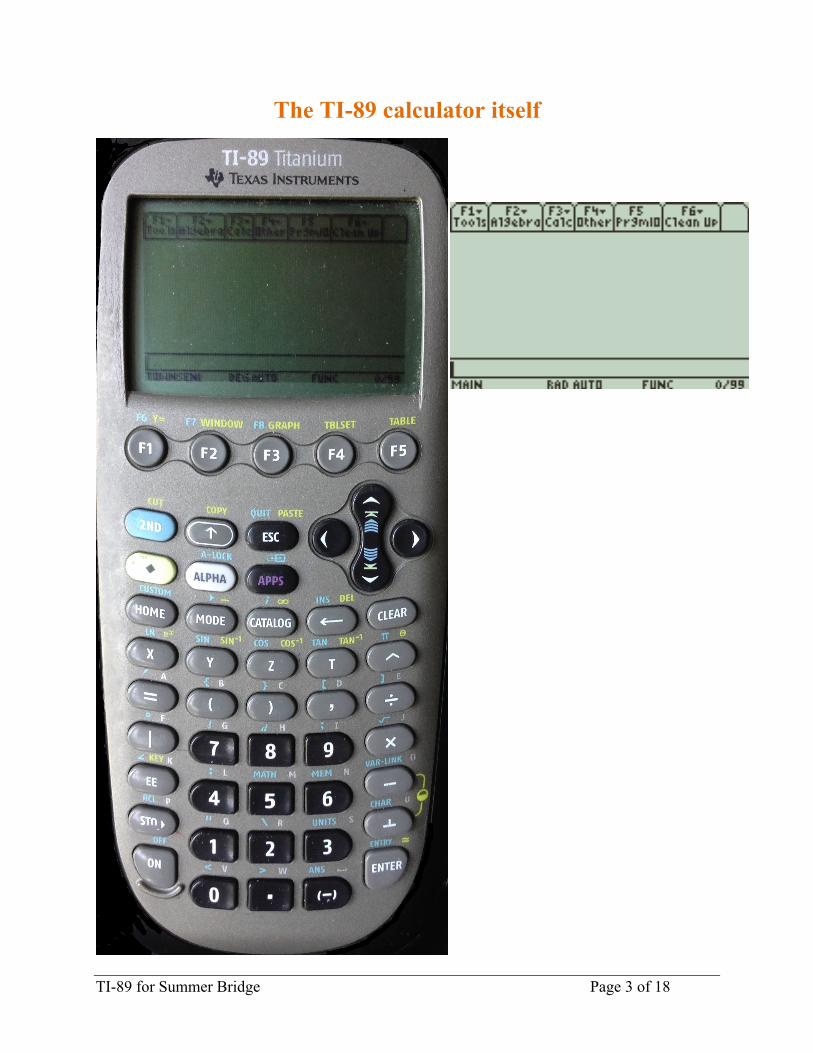
The TI-89 calculator itself
TI-89 for Summer Bridge Page 4 of 18
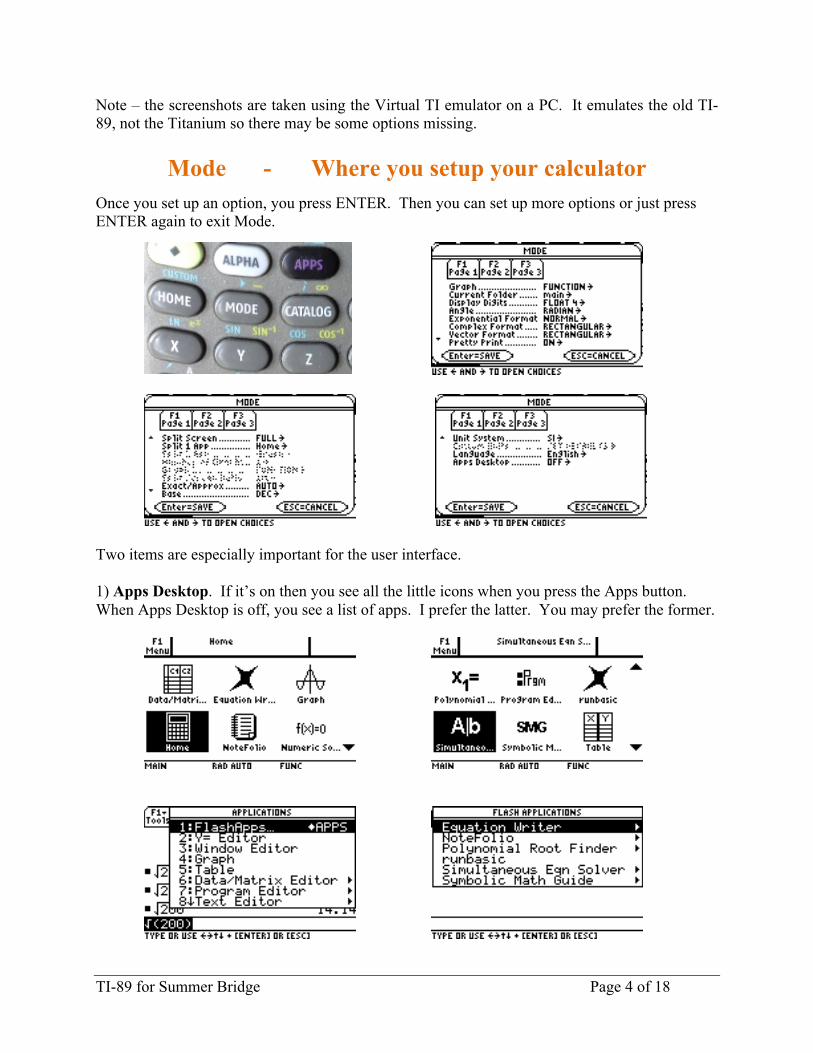
Note – the screenshots are taken using the Virtual TI emulator on a PC. It emulates the old TI-89, not the Titanium so there may be some options missing.
Mode - Where you setup your calculator
Once you set up an option, you press ENTER. Then you can set up more options or just press ENTER again to exit Mode.
Two items are especially important for the user interface. 1) Apps Desktop. If it’s on then you see all the little icons when you press the Apps button. When Apps Desktop is off, you see a list of apps. I prefer the latter. You may prefer the former.
TI-89 for Summer Bridge Page 5 of 18
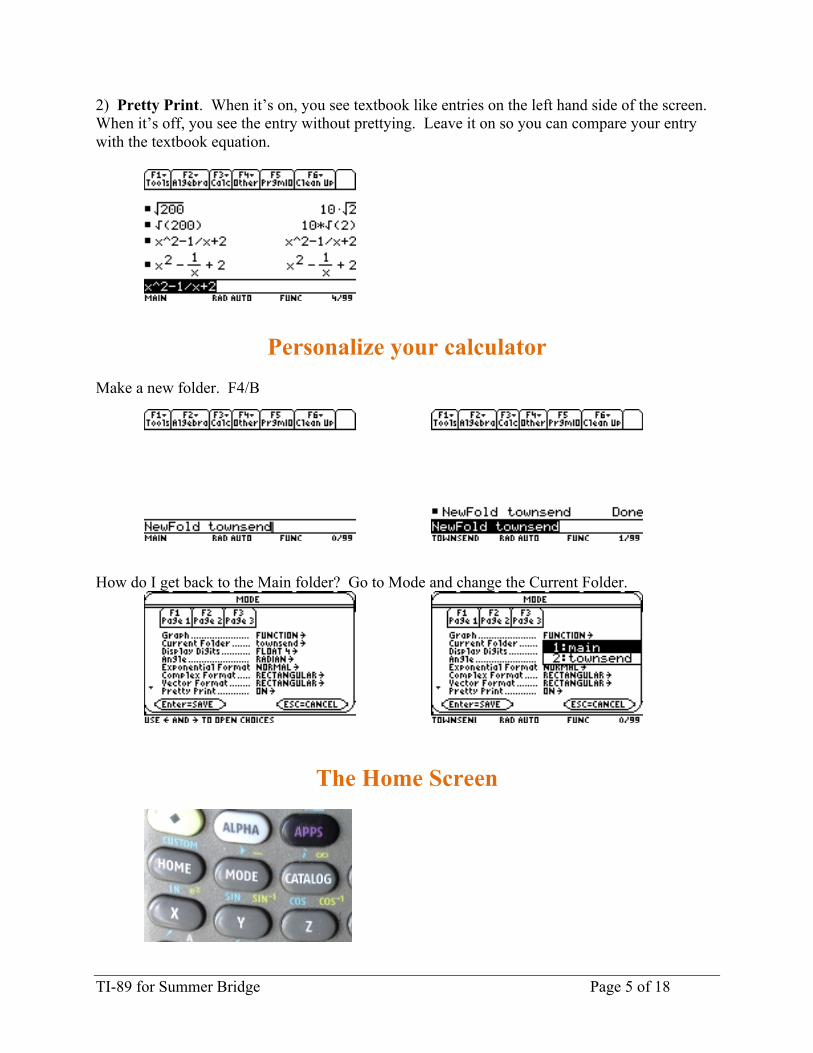
2) Pretty Print. When it’s on, you see textbook like entries on the left hand side of the screen. When it’s off, you see the entry without prettying. Leave it on so you can compare your entry with the textbook equation.
Personalize your calculator Make a new folder. F4/B
How do I get back to the Main folder? Go to Mode and change the Current Folder.
The Home Screen
TI-89 for Summer Bridge Page 6 of 18
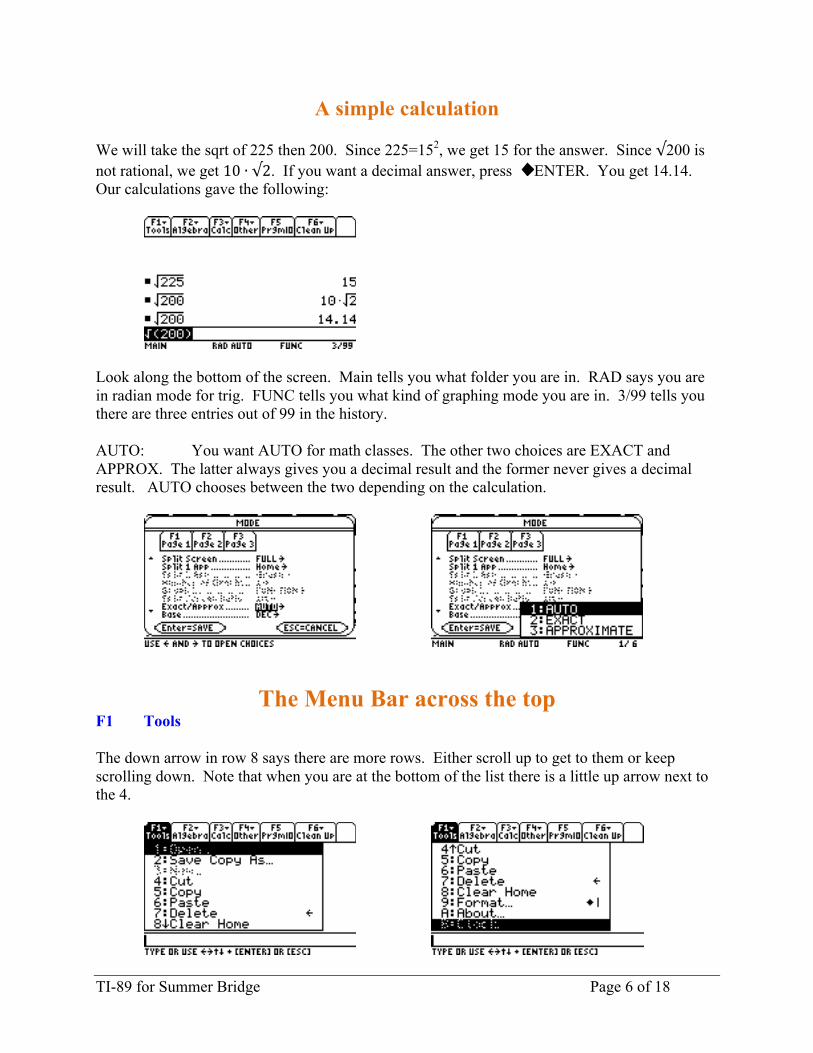
A simple calculation We will take the sqrt of 225 then 200. Since 225=152, we get 15 for the answer. Since √200 is not rational, we get 10 ∙ √2. If you want a decimal answer, press ENTER. You get 14.14. Our calculations gave the following:
Look along the bottom of the screen. Main tells you what folder you are in. RAD says you are in radian mode for trig. FUNC tells you what kind of graphing mode you are in. 3/99 tells you there are three entries out of 99 in the history. AUTO: You want AUTO for math classes. The other two choices are EXACT and APPROX. The latter always gives you a decimal result and the former never gives a decimal result. AUTO chooses between the two depending on the calculation.
The Menu Bar across the top F1 Tools The down arrow in row 8 says there are more rows. Either scroll up to get to them or keep scrolling down. Note that when you are at the bottom of the list there is a little up arrow next to the 4.
TI-89 for Summer Bridge Page 7 of 18
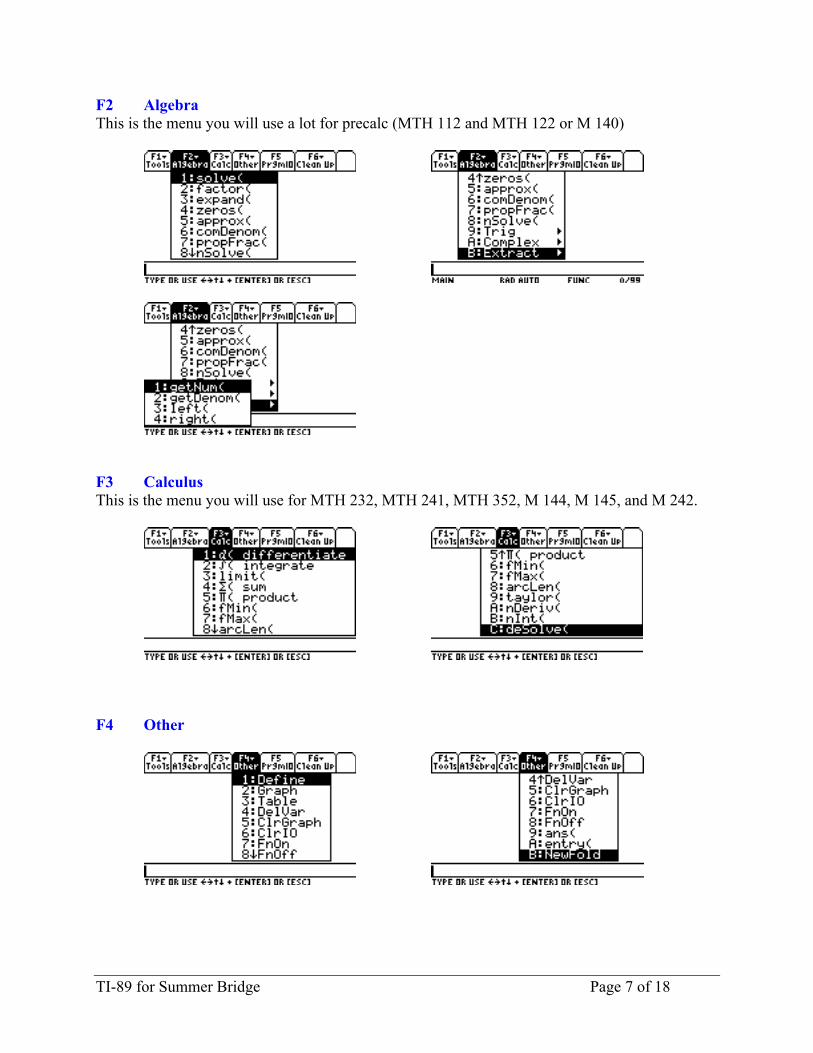
F2 Algebra This is the menu you will use a lot for precalc (MTH 112 and MTH 122 or M 140)
F3 Calculus This is the menu you will use for MTH 232, MTH 241, MTH 352, M 144, M 145, and M 242.
F4 Other
TI-89 for Summer Bridge Page 8 of 18
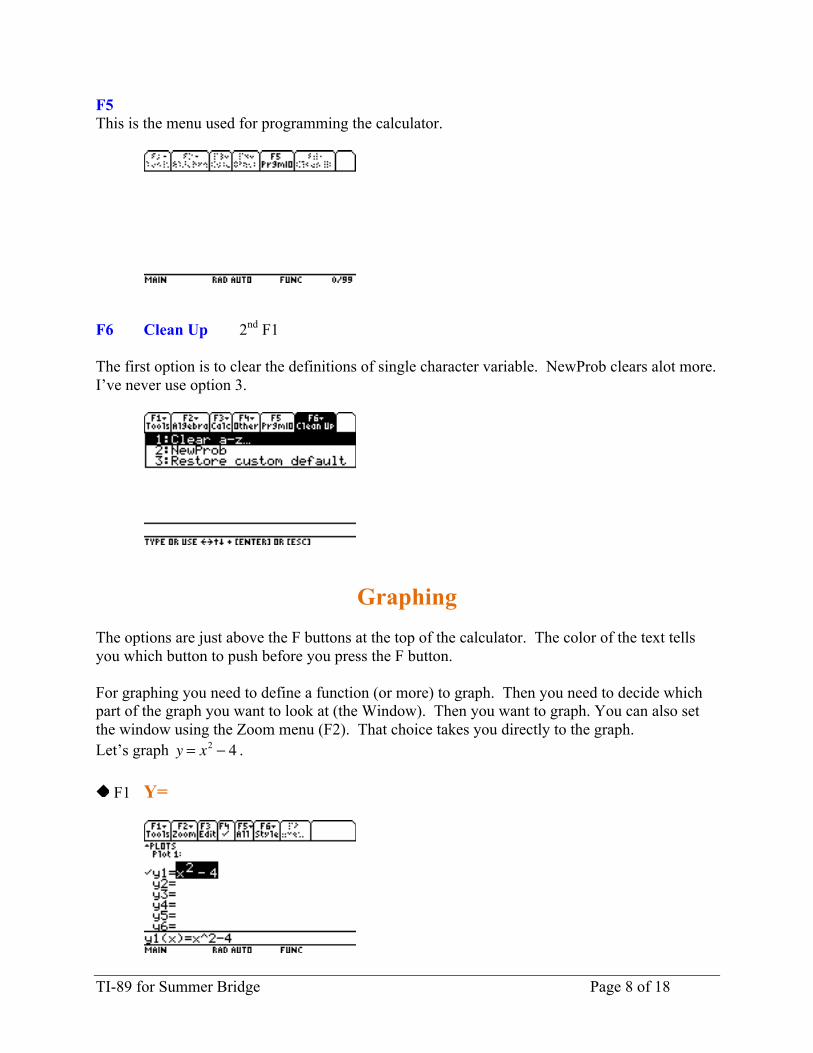
F5 This is the menu used for programming the calculator.
F6 Clean Up 2nd F1 The first option is to clear the definitions of single character variable. NewProb clears alot more. I’ve never use option 3.
Graphing The options are just above the F buttons at the top of the calculator. The color of the text tells you which button to push before you press the F button. For graphing you need to define a function (or more) to graph. Then you need to decide which part of the graph you want to look at (the Window). Then you want to graph. You can also set the window using the Zoom menu (F2). That choice takes you directly to the graph. Let’s graph y = x2 − 4 .
F1 Y=
TI-89 for Summer Bridge Page 9 of 18
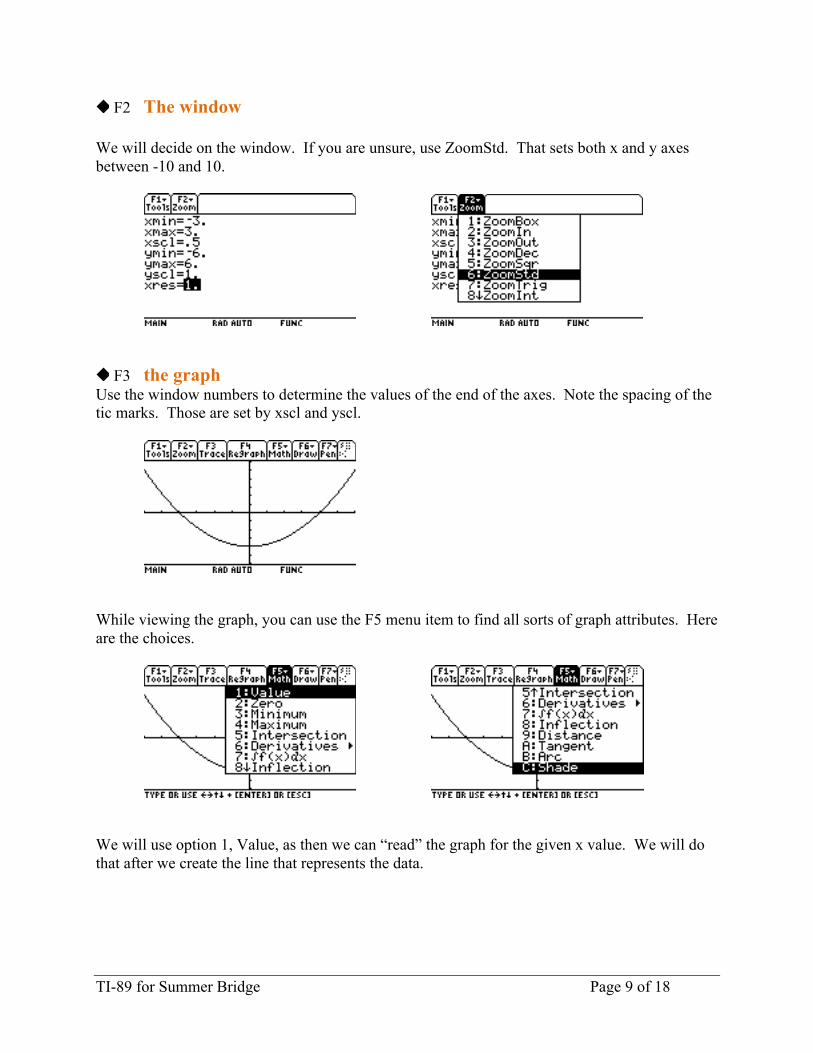
F2 The window We will decide on the window. If you are unsure, use ZoomStd. That sets both x and y axes between -10 and 10.
F3 the graph Use the window numbers to determine the values of the end of the axes. Note the spacing of the tic marks. Those are set by xscl and yscl.
While viewing the graph, you can use the F5 menu item to find all sorts of graph attributes. Here are the choices.
We will use option 1, Value, as then we can “read” the graph for the given x value. We will do that after we create the line that represents the data.
TI-89 for Summer Bridge Page 10 of 18
Statistics The Boe-Bot program: We need to tell the Boe-Bot what direction to go, how fast to go, and how long to run before stopping. Details of programming will be another day. However, below is part of the test program you ran this morning to make sure your Boe-Bot was properly set up. Let’s analyze it.
' {$STAMP BS2} what model Boe-Bot is it? ' {$PBASIC 2.5} what language are we programming in? ' Pin 12 - right wheel ‘just FYI ' Pin 13 - left wheel DEBUG "Program Running!" ‘ the Boe-Bot is telling us it has the program counter VAR Byte ‘we need to send multiple signals to keep the Boe-Bot running. PAUSE 2000 ‘wait 2s (2000ms) ' Go forward FOR counter = 1 TO 80 ‘repeat the three commands 80 times PULSOUT 13, 850 ‘tell the left wheel what to do (CW). 750 is do nothing PULSOUT 12, 650 ‘tell the right wheel what to do (CCW) PAUSE 20 ‘needed by the servo NEXT ‘loop END ‘we’re done
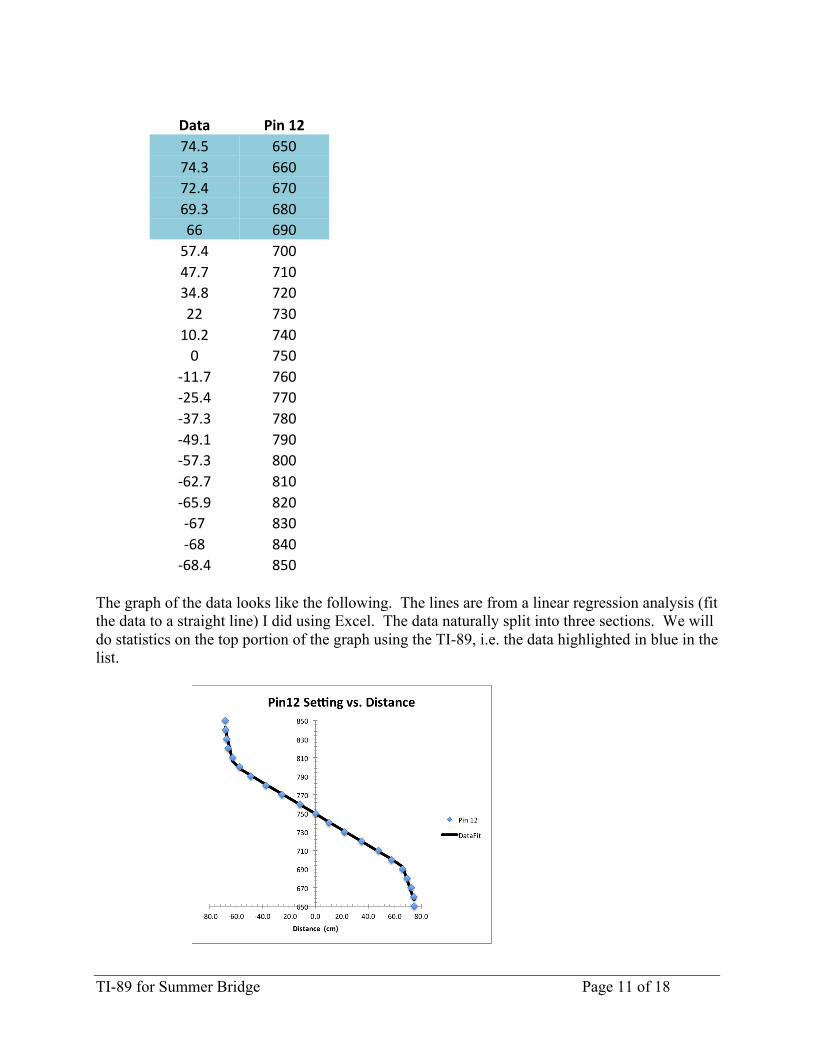
The Data: I took data on the Boe-Bot. Below are the results for Pin12. Each Data value is actually the average of three runs. I would estimate that my error in measuring the distance travelled was ±3mm. When I took the data, I set the Pin12 value and measured the distance. We want to be able to decide on a distance then determine how to set the Pin12 value. Hence, I graphed the Pin12 value as a function of the distance measured. For straight-line motion, the Pin 13 setting is 1500-the Pin 12 setting.
TI-89 for Summer Bridge Page 11 of 18
Data Pin 12 74.5 650 74.3 660 72.4 670 69.3 680 66 690 57.4 700 47.7 710 34.8 720 22 730 10.2 740 0 750
-‐11.7 760 -‐25.4 770 -‐37.3 780 -‐49.1 790 -‐57.3 800 -‐62.7 810 -‐65.9 820 -‐67 830 -‐68 840 -‐68.4 850
The graph of the data looks like the following. The lines are from a linear regression analysis (fit the data to a straight line) I did using Excel. The data naturally split into three sections. We will do statistics on the top portion of the graph using the TI-89, i.e. the data highlighted in blue in the list.
TI-89 for Summer Bridge Page 12 of 18
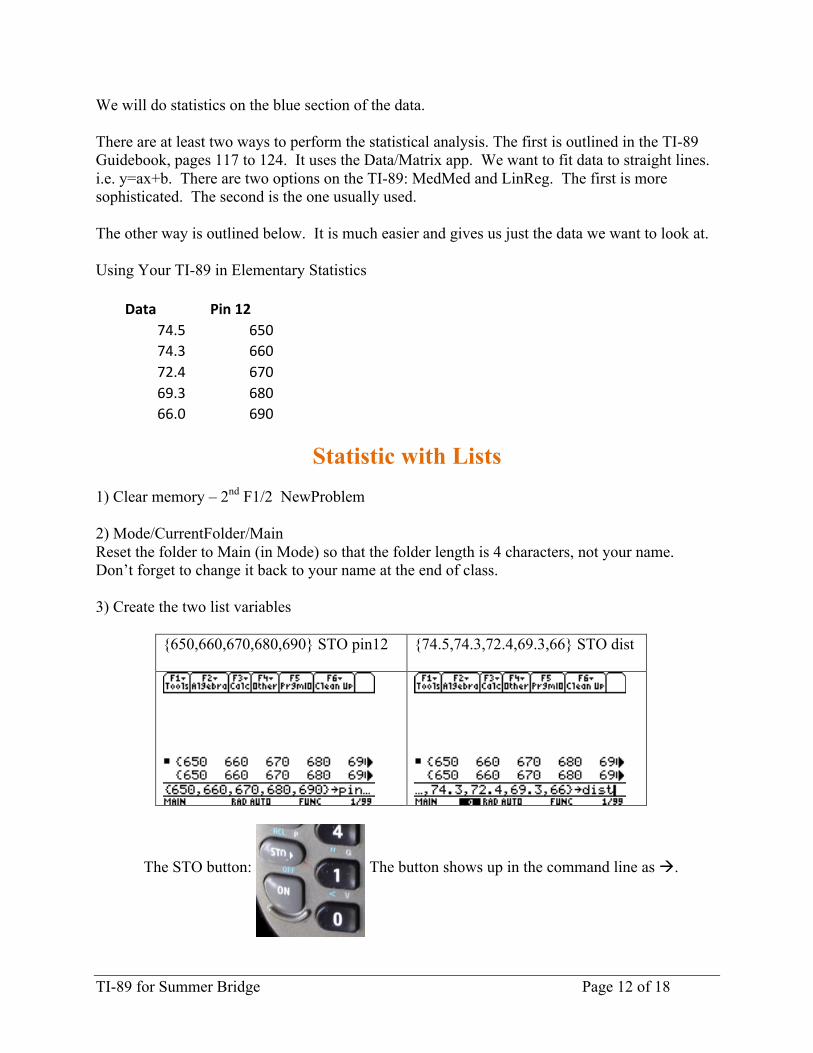
We will do statistics on the blue section of the data. There are at least two ways to perform the statistical analysis. The first is outlined in the TI-89 Guidebook, pages 117 to 124. It uses the Data/Matrix app. We want to fit data to straight lines. i.e. y=ax+b. There are two options on the TI-89: MedMed and LinReg. The first is more sophisticated. The second is the one usually used. The other way is outlined below. It is much easier and gives us just the data we want to look at. Using Your TI-89 in Elementary Statistics
Data Pin 12 74.5 650 74.3 660 72.4 670 69.3 680 66.0 690
Statistic with Lists
1) Clear memory – 2nd F1/2 NewProblem 2) Mode/CurrentFolder/Main Reset the folder to Main (in Mode) so that the folder length is 4 characters, not your name. Don’t forget to change it back to your name at the end of class. 3) Create the two list variables
{650,660,670,680,690} STO pin12 {74.5,74.3,72.4,69.3,66} STO dist
The STO button: The button shows up in the command line as à.
TI-89 for Summer Bridge Page 13 of 18
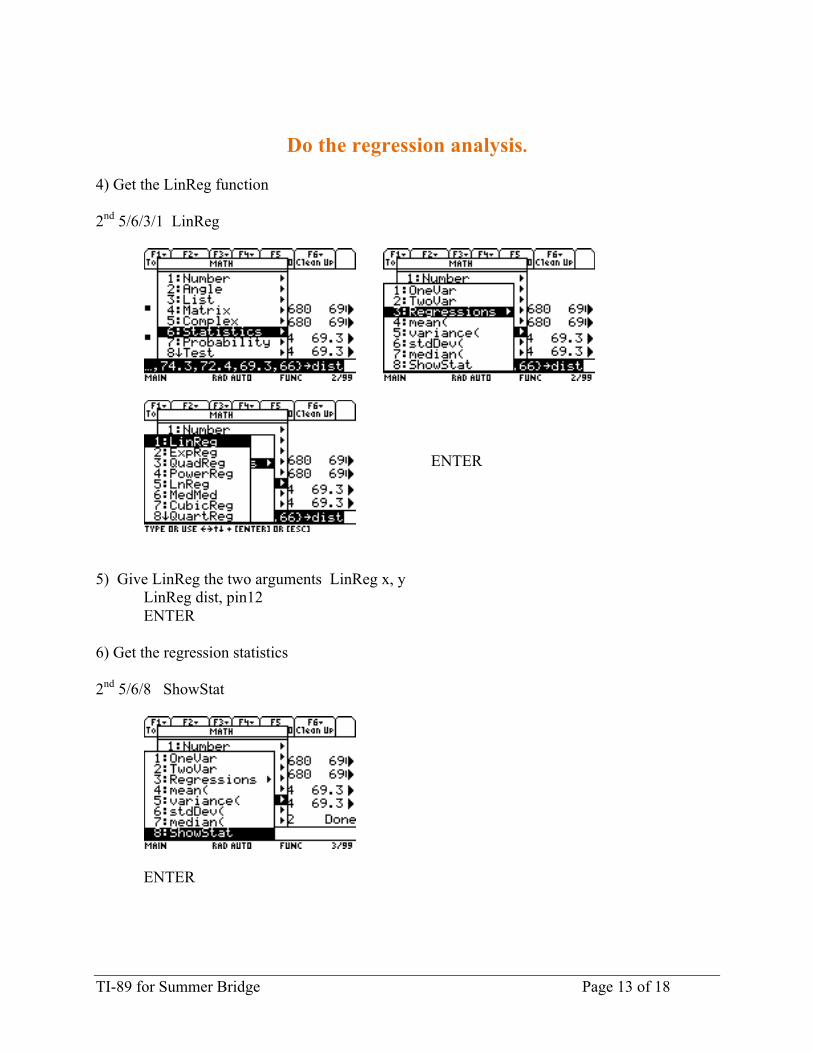
Do the regression analysis. 4) Get the LinReg function 2nd 5/6/3/1 LinReg
ENTER
5) Give LinReg the two arguments LinReg x, y LinReg dist, pin12 ENTER 6) Get the regression statistics 2nd 5/6/8 ShowStat
ENTER
TI-89 for Summer Bridge Page 14 of 18
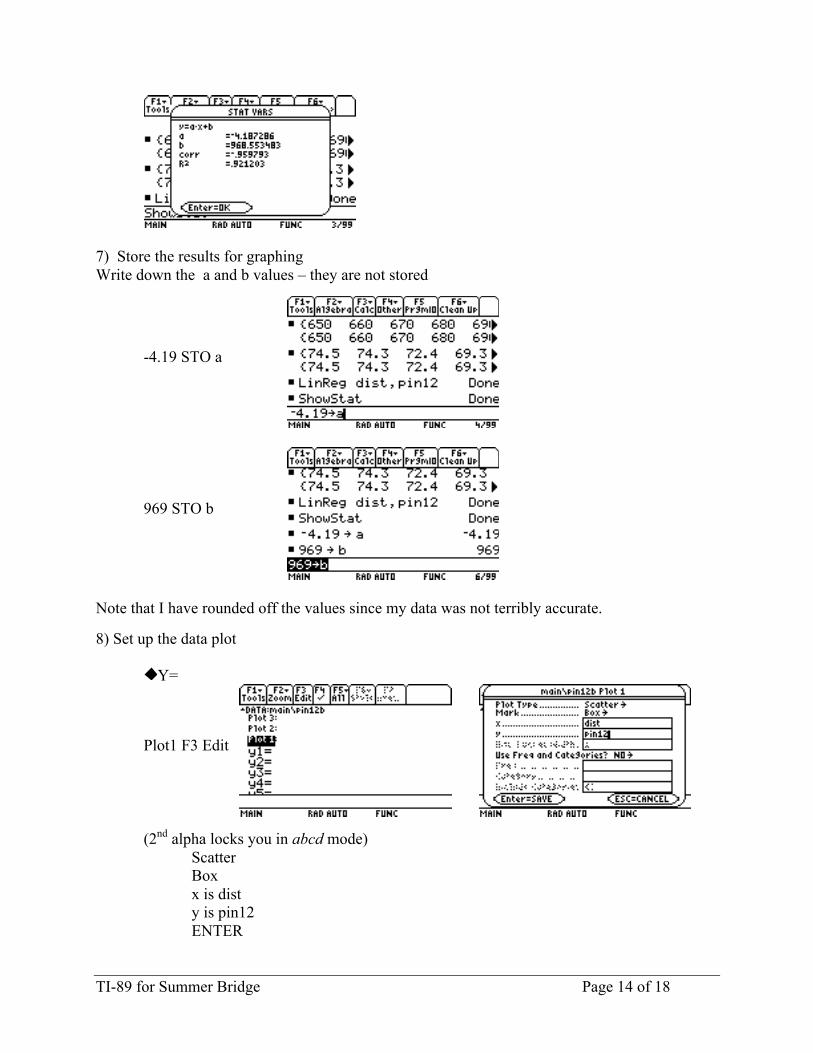
7) Store the results for graphing Write down the a and b values – they are not stored
-4.19 STO a
969 STO b
Note that I have rounded off the values since my data was not terribly accurate. 8) Set up the data plot Y=
Plot1 F3 Edit
(2nd alpha locks you in abcd mode) Scatter Box x is dist y is pin12 ENTER
TI-89 for Summer Bridge Page 15 of 18
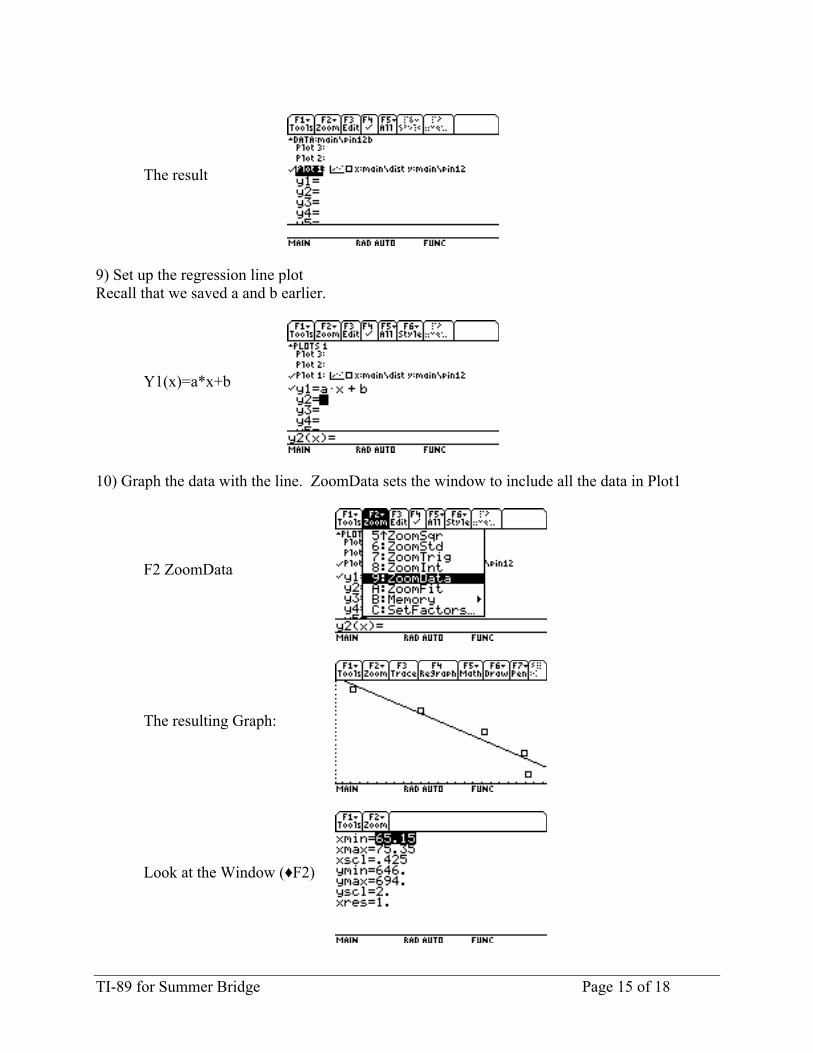
The result
9) Set up the regression line plot Recall that we saved a and b earlier.
Y1(x)=a*x+b
10) Graph the data with the line. ZoomData sets the window to include all the data in Plot1
F2 ZoomData
The resulting Graph:
Look at the Window (♦F2)
TI-89 for Summer Bridge Page 16 of 18
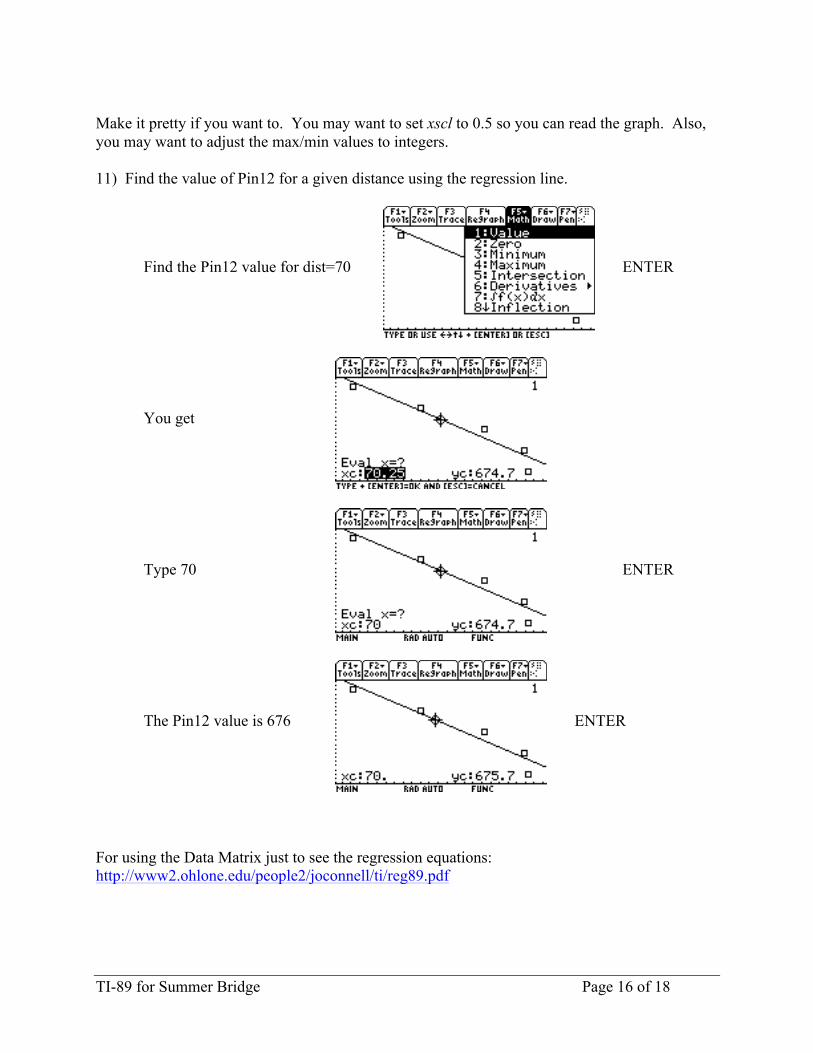
Make it pretty if you want to. You may want to set xscl to 0.5 so you can read the graph. Also, you may want to adjust the max/min values to integers. 11) Find the value of Pin12 for a given distance using the regression line.
Find the Pin12 value for dist=70
ENTER
You get
Type 70
ENTER
The Pin12 value is 676
ENTER
For using the Data Matrix just to see the regression equations: http://www2.ohlone.edu/people2/joconnell/ti/reg89.pdf
TI-89 for Summer Bridge Page 17 of 18
My original data with a 1 second (Pause 1000) delay: Counter time time time
100 4.36 4.13 3.93 90 3.71 3.7 3.8 80 3.33 3.31 3.36 70 3.06 3.06 2.98 60 2.83 2.68 2.68 50 2.4 2.56 2.51 40 2.35 2.26 2.4 30 2.06 2.23 2.05 20 1.76 1.83 1.78 10 1.43 1.26 1.15
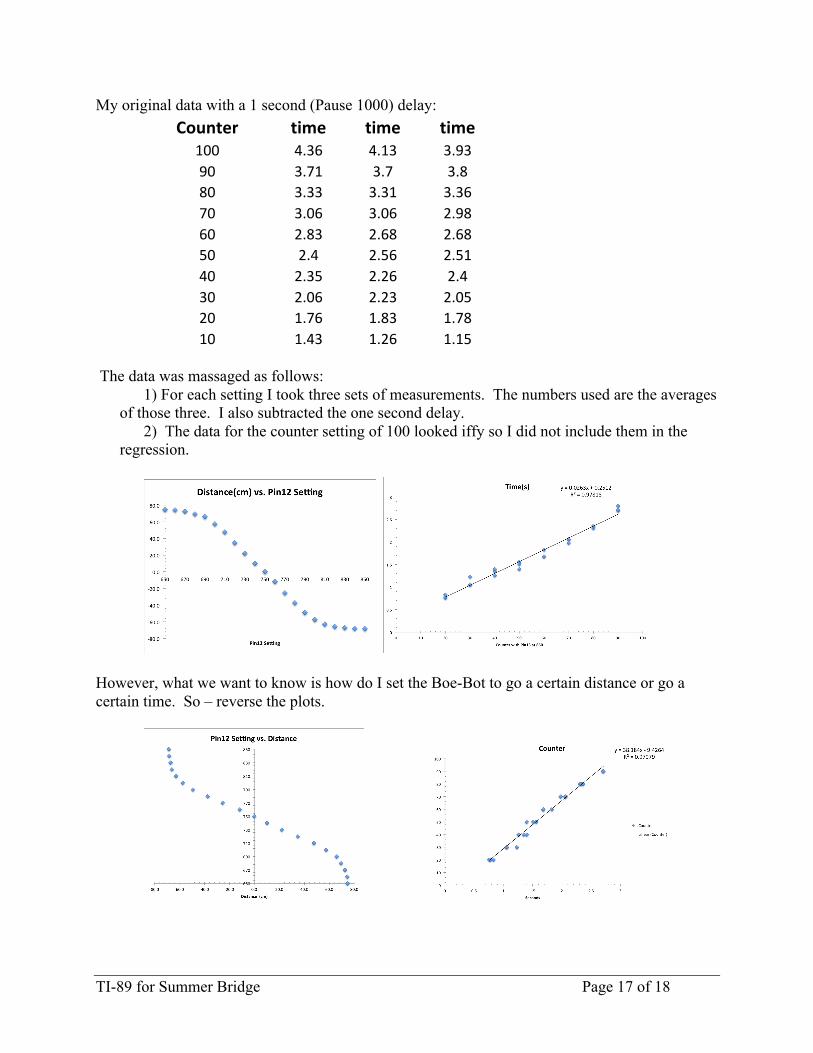
The data was massaged as follows:
1) For each setting I took three sets of measurements. The numbers used are the averages of those three. I also subtracted the one second delay. 2) The data for the counter setting of 100 looked iffy so I did not include them in the regression.
However, what we want to know is how do I set the Boe-Bot to go a certain distance or go a certain time. So – reverse the plots.
TI-89 for Summer Bridge Page 18 of 18
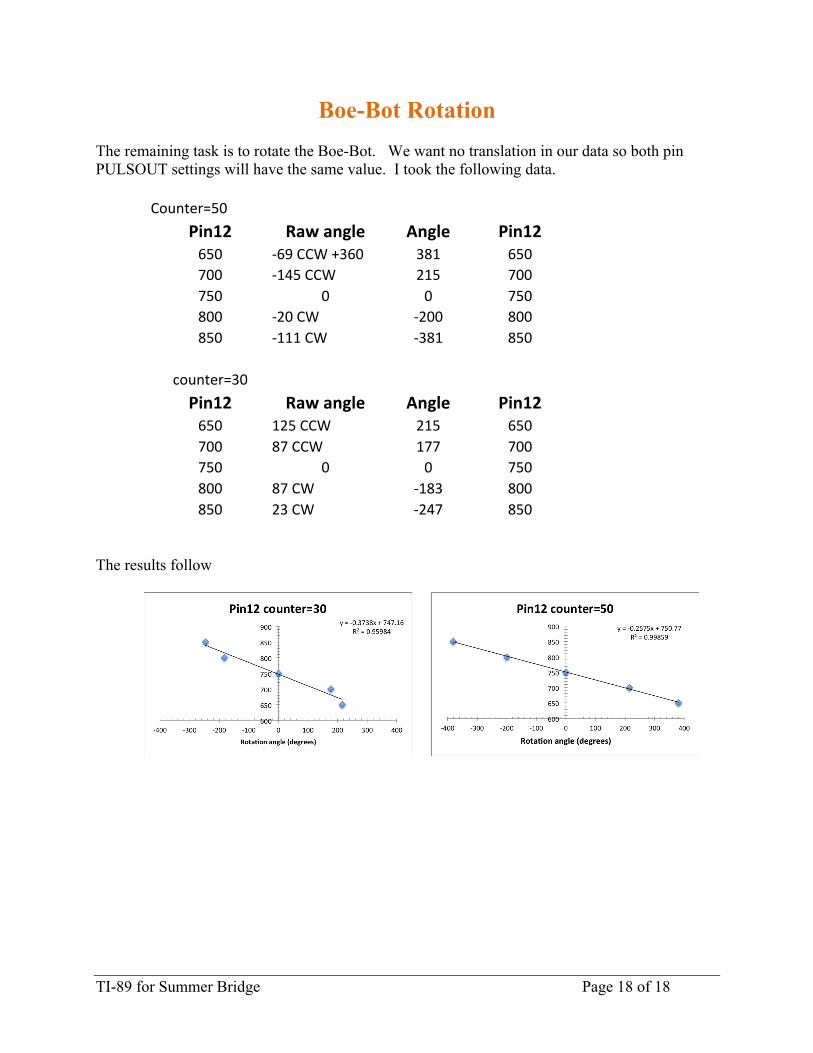
Boe-Bot Rotation The remaining task is to rotate the Boe-Bot. We want no translation in our data so both pin PULSOUT settings will have the same value. I took the following data.
Counter=50 Pin12 Raw angle Angle Pin12
650 -‐69 CCW +360 381 650 700 -‐145 CCW 215 700 750 0 0 750 800 -‐20 CW -‐200 800 850 -‐111 CW -‐381 850
counter=30 Pin12 Raw angle Angle Pin12
650 125 CCW 215 650 700 87 CCW 177 700 750 0 0 750 800 87 CW -‐183 800 850 23 CW -‐247 850
The results follow