Embed Size (px)
Citation preview
Strategic Management JournalStrat. Mgmt. J., 38: 255–277 (2017)
Published online EarlyView 8 January 2016 in Wiley Online Library (wileyonlinelibrary.com) DOI: 10.1002/smj.2478Received 17 January 2014; Final revision received 9 October 2015
THE THRONE VS. THE KINGDOM: FOUNDERCONTROL AND VALUE CREATION IN STARTUPS
NOAM WASSERMAN*Harvard Business School, Boston, MA, U.S.A.University of Southern California, Los Angeles, California, U.S.A.
Research summary: Does the degree to which founders keep control of their startups affectcompany value? I argue that founders face a “control dilemma” in which a startup’s resourcedependence drives a wedge between the startup’s value and the founder’s ability to retain controlof decision making. I develop hypotheses about this tradeoff and test the hypotheses on a uniquedataset of 6,130 American startups. I find that startups in which the founder is still in controlof the board of directors and/or the CEO position are significantly less valuable than those inwhich the founder has given up control. On average, each additional level of founder control (i.e.,controlling the board and/or the CEO position) reduces the pre-money valuation of the startup by17.1–22.0 percent.
Managerial summary: A founder’s vision and capabilities are key ingredients in the early successof a startup. During those early days, it is natural for the founder to have a powerful, centralrole. However, as the startup grows, founders who keep too much control of the startup and itsmost important decisions can harm the value of the startup. Both qualitative case studies andquantitative analyses of more than 6,000 private companies highlight that startups in whichthe founder has maintained control (by retaining a majority of the board of directors and/orby remaining as CEO) have significantly lower valuations than those where the founder hasrelinquished control. This is especially true when the startup is three years old or more. Copyright© 2015 John Wiley & Sons, Ltd.
INTRODUCTION
In a classic study of entrepreneurial growth,Eisenhardt and Schoonhoven (1990: 504) pose thequestion: “Some young firms become resoundingsuccesses. … Others languish as small firms. …Why do these differences in organizational growtharise?” I extend previous work by analyzing a factorthat should have a powerful effect on whether valueis created or the organization languishes: the degreeto which the founder maintains control. I explorethe possibility that the startup’s resource needs
Keywords: entrepreneurship; CEO leadership; value cre-ation; control and autonomy; managerial tradeoffs*Correspondence to: Noam Wasserman, 150 Eliot Street, Chest-nut Hill, MA. E-mail: [email protected]
Copyright © 2015 John Wiley & Sons, Ltd.
drive a wedge between the growth of the startupand the founder’s ability to maintain control—aso-called “control dilemma.” Multiple steps alongthe entrepreneurial journey pose a tradeoff betweenattracting the resources required to build companyvalue and being able to retain control of decisionmaking.
The key resources founders can attract includehuman, social, and financial capital (Sapienza,Korsgaard, et al., 2003) provided by cofounders,hires, and investors. However, attracting thoseresources often comes at the cost of ownershipstakes and decision-making control. I develophypotheses about this tradeoff, and test thehypotheses on a unique dataset of 6,130 Americanstartups collected between 2005 and 2012. Theanalyses tap all respondents in the dataset and use
256 N. Wasserman
fixed-effects with repeat respondents in order tocontrol for unobserved time-invariant companycharacteristics.
This study adds insights to several literatures.Within the entrepreneurship literature, concep-tual studies (e.g., Amit et al., 2000; Evans andJovanovic, 1989) have speculated that the desiresfor autonomy and control may affect the ini-tial decision to launch a company, but have notbroadened to include a fuller picture of companyevolution. Likewise, analyses of entrepreneurialcapital constraints have used bequests (e.g.,Blanchflower and Oswald, 1998) and lottery win-nings (e.g., Lindh and Ohlsson, 1998) to examinethe propensity to become an entrepreneur. Theentrepreneurial-finance literature (e.g., Hamilton,2000; Moskowitz and Vissing-Jorgensen, 2002) hassuggested that, on average, entrepreneurs receivefewer pecuniary benefits than they might receivein paid employment, but has not examined whetherthis is true for some types of entrepreneurs butnot for others, and has not examined empiricallywhether those benefits might be affected by thedegree of control retained by the founders.
In larger corporations, the economics literaturehas examined the private benefits of control inthe securities of public companies (e.g., Barclayand Holderness, 1989; Grossman and Hart, 1988;Lease, McConnell, and Mikkelson, 1983), but hasnot explored whether the private benefits of con-trol extend to entrepreneurial decisions and out-comes. The corporate-finance literature on sustain-able growth rates (e.g., Higgins, 1977, 1998) hashighlighted the tension between growth objectivesand financial policies, but its models ignore controlconsiderations and it assumes stability in financialpolicies, reducing its applicability to our tensionand to the types of companies examined here. Incontrast to studies that focus on organizational rela-tionships with external resource providers—suchas corporate investment relationships, alliances, orjoint ventures (e.g., Gulati and Sytch, 2007; Gulatiand Wang, 2003; Katila, Rosenberger, and Eisen-hardt, 2008; Ozcan and Eisenhardt, 2009)—thisstudy focuses on resource providers who becomepart of the internal startup team, such as cofounders,hires, and investors who join the board of directors.Finally, resource-dependence theory has focusedon the ways in which organizational uncertainty isreduced by attracting resources (Pfeffer and Salan-cik, 1978), but has largely neglected how anotherimportant uncertainty—“control uncertainty,” or
whether company leaders will lose control of deci-sion making—may be heightened by the attractionof resources.
Thus, the current study develops the theoreticalgrounding for this control dilemma. I empiricallytest the hypothesized tradeoff using a large, uniquedataset that includes direct measures of foundercontrol. I also delve into alternative hypotheses andcontingencies. The analyses use fixed effects to con-trol for unobserved time-invariant characteristics ofthe startups, and test the hypotheses on differentmetrics of value creation. The analyses show that,ceteris paribus, startups in which the founder is stillin control of the board of directors and/or the CEOposition are significantly less valuable than those inwhich the founder has given up a level of control.On average, each additional level of founder control(i.e., keeping control of the CEO position or board)reduces the pre-money valuation of the startupby 17.1–22.0 percent.1 The tradeoff is particularlystrong in startups that are three years old or more.Because the analyses include a variety of resourceproviders (cofounders vs. hires vs. investors), Iam also able to examine how different types ofresources can differ in their impacts on the valuethat is built and on the founder’s retention of control.
THEORY AND HYPOTHESES
In 1997, when first-time founder Lew Cirnefounded Wily Technology, an enterprise-application management company, he faced awide variety of decisions about how to buildhis company. Over the next two years, he hiredexperienced executives, built a team of fiftyemployees, raised two large rounds of financingfrom top venture capitalists (VCs), and gave upthree of five seats on the board of directors tothose investors. When it came time to raise thenext round of financing, the board decided thatWily needed a CEO who had stronger businessskills than Cirne, who had a technical background(Wasserman and McCance, 2005). Their choice,“professional CEO” Richard Williams, replacedCirne as CEO. For his part, Cirne was left with
1 As described in “Data and Methods,” one of my two core metricsof company value is the pre-money valuation of the company atthe most recent round of financing (e.g., Gompers et al., 2010;Hsu, 2004), calculated as the price per share in the financing roundtimes the number of shares outstanding prior to the round.
Copyright © 2015 John Wiley & Sons, Ltd. Strat. Mgmt. J., 38: 255–277 (2017)DOI: 10.1002/smj
The Throne vs. the Kingdom 257
a very narrow technical-visionary role within thecompany. However, Williams was able to lead Wilyto a big exit: a $375 million sale to Computer Asso-ciates in early 2006. Cirne admits he could neverhave accomplished such value creation, but henevertheless was left with painful regrets about hisearly decisions that had led to his being replaced.2
The founder of Steria, an information-technologysystems and services company, faced similar deci-sions (Abetti, 2005). His desire “to remain inde-pendent and master of his own destiny” led himto resist cofounders, not to grant stock to potentialemployees, to refuse to accept capital from outsideinvestors, and to maintain control of the company’sequity. As a result, he was able to remain chief exec-utive officer, but the company’s growth was slowedmarkedly (Abetti, 2005).
I focus on a tradeoff that underlies the earlyfounding decisions faced by the founders of Wilyand Steria. Two decades ago, Stevenson andJarillo (1990: 23) declared that “Entrepreneurshipis a process by which individuals … pursueopportunities without regard to the resources theycurrently control.” At first glance, this seems likean aspirational and optimistic definition. However,it has a dark side: When founding their businesses,entrepreneurs rarely control the key resources theywill need to pursue the opportunity fully. In fact, ithas been estimated that entrepreneurs are 60 timesmore likely to be resource constrained than to beunconstrained (Evans and Jovanovic, 1989).
Building on March and Simon (1958) and Pfefferand Salancik (1978) state that an organization’smost critical activity is establishing a coalitionlarge enough to ensure survival. Doing this requiresthe organization to provide inducements to getparticipants to contribute to the organization. Mostcentrally, in exchange for their resources, resourceproviders demand “the ability to control and directorganizational action” (Pfeffer and Salancik, 1978:27). In the startup realm in particular, investorsworry about hold-up by entrepreneurs, and controlrights are the main form of protection that theydemand in exchange for their investment (Hell-mann, 1998). Entrepreneurs who refuse to giveup control should find it harder to attract investors
2 Soon after leaving Computer Associates, Cirne decided tofound his next startup, New Relic. He solo founded New Relicand tapped his favorite Wily employees for his early hires. Hecautiously self-funded New Relic for as long as he could, andmade sure to keep control of his board of directors and to remainCEO, even at the expense of growing more value.
and thus fail to grow as much value. This “controldilemma” highlights how founders, despite theirbest intentions, can make decisions that limit thevalue of the companies they created, or else canrisk losing control of their companies. In makingresource decisions, founders thus trade off resourceuncertainty for control uncertainty.
In this section, I develop hypotheses about thetradeoff between value and control, the contextsin which this tradeoff might not apply, and theresulting performance implications. In developingthese hypotheses, I build on theoretical work andspeculation in the entrepreneurship literature, andon multiple studies of large companies. Closest tohome, prior studies (e.g., Amit et al., 2000; Evansand Jovanovic, 1989) have examined conceptuallyhow potential entrepreneurs’ motivations forcontrol and financial gains might affect their initialdecisions to initiate ventures. However, the tradeoffexamined here applies throughout the early stagesof company building, not only to the decisionto initiate a venture, and has yet to be examinedempirically among entrepreneurs.
In an empirical exploration of the decisionto initiate a venture, Hamilton (2000) foundthat, on average, the earnings of self-employedentrepreneurs were lower, both initially and overtime, than the earnings of those engaged in paidemployment, despite the common assumptionthat it is the profit motive that attracts them tothe challenge of building new organizations (e.g.,Kirzner, 1973; Schumpeter, 1942).3 To explain whypeople decide to become entrepreneurs anyway,he speculated that “entrepreneurs may trade lowerearnings for the nonpecuniary benefits of businessownership … such as ‘being their own boss,’”(Hamilton, 2000: 605–606) but was not able totest this possibility empirically.4 (This speculationmatches that of Carland et al. (1984), Amit et al.(2000), and Sapienza et al. (2003).) Below, Idevelop, enrich, and test this possibility.
This view of the tension between controland value creation contrasts with Berle andMeans’s (1932) classical view of the separation
3 Similar empirical results were found by Moskowitz andVissing-Jorgensen (2002) in small businesses and by Hall andWoodward (2010) in venture capital-backed startups.4 Although Hamilton’s data sources may understateentrepreneurs’ earnings by a significant percentage (Hurst,Li, and Pugsley, 2010), even after adjusting for that underreport-ing, entrepreneurs still earn less than would be expected, thoughthe difference is smaller than that reported in Hamilton (2000).
Copyright © 2015 John Wiley & Sons, Ltd. Strat. Mgmt. J., 38: 255–277 (2017)DOI: 10.1002/smj
258 N. Wasserman
of ownership and control in large corporations,and with subsequent work on agency theory (e.g.,Jensen and Meckling, 1976). When owners nolonger manage the company, the managers’ deci-sions often harm the value of the company becausethe managers’ interests will diverge from those ofthe shareholders. (Regarding small companies inparticular, Jensen and Meckling (1976: 312) statethat the benefits derived by an owner-manager mayinvolve “non-pecuniary aspects of entrepreneurialactivities” such as being able to implement thefounder’s strategies.) In more modern terms, asfounders give up equity to non-founders, agencycosts should increase, reducing the value of thestartup (e.g., Fama and Jensen, 1983; Jensen andMeckling, 1976). I propose a complementaryresource-dependence effect that may counterbal-ance the increase in agency costs as founders giveup control: Attracting key resources to the startupwill help build its value.
When are founders more likely to surrendercontrol?
Within high-potential startups, high rates of growthnecessitate the attraction of a very high percentageof outside resources (Venkataraman, 1997), andthe most valuable of those resources are usuallyin limited supply (Peteraf, 1993). Failure to attractmissing resources can be particularly harmfulbecause it can heighten the liability of newness,harm growth, and increase the chance of failure(Aldrich and Fiol, 1994; Stinchcombe, 1965).In fact, “Attracting resources into a fledglingventure is perhaps the greatest challenge faced byentrepreneurs.” (Brush, Greene, and Hart, 2001:71) The more resources that a new venture can gaincontrol of, and the quicker it can do so, the better theventure’s competitive position (Romanelli, 1989)and the more valuable the venture can become.
At inception, a startup might be missingresources in three major areas: human capital,social capital, and financial capital (Sapienzaet al., 2003). To fill those holes, “core founders”can attract cofounders, hires, and/or investors.(As described in more detail below, early on,resource-attraction decisions are in the hands ofthe core founder—the person who had the initialidea and initiated founding activities.5 As other
5 Although some startups have more than one core founder, aclear majority have a single one (Wasserman, 2012). Below, I willdescribe how I empirically identified the core founder.
resource providers join the startup, they often gaina say in those decisions, either as terms of theirownership or through having a seat on the boardof directors.) Cofounders and hires may bring newskills and industry knowledge, have contacts withcustomers or potential partners, and also contributefinancial capital to help get the startup off theground. Investors can contribute far more financialcapital than the typical cofounder or hire but, asdescribed below, may vary widely in the amount ofother value they might add.
A core dilemma is that the startup’s resourcedependence drives a wedge between startupvalue and founder control. Each step of theentrepreneurial resource-attraction journey poses atradeoff between attracting the resources requiredto build company value and being able to retain con-trol of decision making. High-quality co-foundersand non-founding hires should demand more equityand/or decision rights than will lesser co-foundersand hires. The same is true of investors who can addthe most value, compared to lower-value investors(for conceptual arguments, see Amit, Glosten, andMuller, 1990; for empirical evidence, see Hsu,2004). Such investors want both to own a stake inthe venture to gain from its growth in value and toprotect their investments by having decision rightsand influence through a board presence (Pfefferand Salancik, 1978).
The more value that would be provided by thecore founder, the more control s/he should beable to retain; the more value that would be pro-vided by the other three resource providers, theless value that the core founder should be ableto retain. On one side, core founders who haveaccumulated direct human capital in the form ofprior founding experience (Sapienza et al., 2003)and have developed the social capital necessary toattract employees to the startup, should be ableto keep more control (Wasserman, 2003). Theother resource providers should have the oppositeeffect on control of the startup; in order to attractvalue-added resource providers, founders shouldhave to give up a share of the venture’s controland its future rents (Coff, 1999). For instance,less studied than investors—but still very impor-tant from a resource-dependence perspective—isthe way in which cofounders and hires might affectcontrol of the startup. In young businesses, thereis a close relationship between human capital andthe success of the startup, especially for humancapital developed through actual work experience
Copyright © 2015 John Wiley & Sons, Ltd. Strat. Mgmt. J., 38: 255–277 (2017)DOI: 10.1002/smj
The Throne vs. the Kingdom 259
(Unger et al., 2011). Thus, the more cofounderswho join the team, and the more experienced thosecofounders, the more decision-making control thecore founder should have to give up when attract-ing them.6 As the startup evolves, “the further intothe start-up process one gets, the more specific andidiosyncratic will be the resources and informa-tion needed for further successful completion ofthe process” (Davidsson and Honig, 2003: 302).Such human capital improves strategic planning,resource acquisition, and operational effectiveness(e.g., Brush et al., 2001; Shane and Venkataraman,2000; Unger et al., 2011). Thus, the more expe-rienced the non-founding hires, the more controlthe core founder should have to give up to attractthem, too.
Finally, as a condition of investing capital inthe company, outside investors will often requireone or more board seats, in addition to receivingan ownership stake (Gorman and Sahlman, 1989).7
Outside investors need voting rights because ofcontractual incompleteness; they want to ensure thatdecisions and actions will maximize their financialreturns. More specifically, investors need to protectthemselves from problems caused by the fact thatthe entrepreneur can derive non-pecuniary benefits“from control, access, and other non-contractibleaspects of managing the venture” (Kirilenko, 2001:566). In essence, the interests of the entrepreneurand of the investor can diverge because the investorcares about financial returns while the entrepreneuralso enjoys private benefits of control (Aghion andBolton, 1992; Grossman and Hart, 1988; Kaplanand Stromberg, 2003). Whenever founders andtheir resource providers disagree with each other,control rights become critical. Control comes inboth ex ante form and ex post form, with ex antecontrol driven by board representation and ex postcontrol indicated by whether the founder has beenreplaced as CEO (Hellmann, 1998). First, the board
6 Some founders may try— but fail— to attract cofounders beforedeciding either to go solo or to defer founding the startup (Ruef,2010). However, the resource-dependence implications should bethe same regardless of whether the founder decided ex ante tosolo found vs. cofound or decided to do so after failing to findcofounders. In addition, to the extent that some founders aren’table to choose from the full range of control vs. value-creationoptions, it should be harder to find such tradeoffs across the fulldataset, making the empirical tests more conservative.7 Startups in the high-tech and life-sciences industries rarely havethe collateral and fixed assets necessary to secure bank loans (e.g.,Sherman, 2005), so outside capital almost always comes in theform of equity instead.
of directors controls the most important high-leveldecisions within the venture (Lerner, 1995). Forinstance, the board typically decides whether tomake important changes in strategy, when and howto raise new rounds of financing, and whether topartner or merge with other corporations (Bagleyand Dauchy, 2003). The board also controls whowill be CEO of the company (Wasserman, 2003).
As founders give up equity and board seats inorder to attract investors, the founders’ percent-age of board seats progressively decreases, untilthe point where the founders are a minority ofboard members and there is no longer “dom-inance of inside over outside directors on theboard” (Morck, Shleifer, and Vishny, 1988: 301).8
Founders are more willing to take weaker invest-ment terms—most centrally, terms that affect thesecontrol rights—from venture capitalists than fromother investors, such as angel investors (Hsu, 2004).For their part, angel investors provide much lesscapital than do venture capitalists (Gompers andLerner, 1999; Wong, 2002), take smaller equitystakes than do VCs (Clercq et al., 2006), and relyon more informal methods of control than do VCs(Wong, Bhatia, and Freeman, 2009). Therefore, instartups that raise capital from venture capitalists,the core founder should retain less control than instartups that raise capital from angel investors.9
This leads to the following hypotheses about thedegree of control retained by the founder.
Hypothesis 1a (H1a) (core founder): If the corefounder has prior founding experience and if thecore founder taps personal networks to attractemployees, the founder will retain more control.
Hypothesis 1b (H1b) (cofounders): The largerthe founding team and the more experiencedthe cofounders, the less control the founder willretain.
8 In the midst of building the startup, founders can sometimessell some of their equity and receive cash to use for personalpurposes—also known as partial founder buyouts or secondarytransactions. Within the industries studied here, such transactionshappen much less frequently than do the standard financing roundsanalyzed above. Furthermore, even when a partial-founder buyoutoccurs, the amount of equity that changes hands is much smallerthan in standard financing rounds, and thus has a much smallerimpact on the outcomes that are of interest here.9 These arguments contrast with the positive view of the effectsof raising capital from venture capitalists (e.g., Stuart, Hoang,and Hybels, 1999), highlighting the control-related downside toattracting capital from those sought-after investors.
Copyright © 2015 John Wiley & Sons, Ltd. Strat. Mgmt. J., 38: 255–277 (2017)DOI: 10.1002/smj
260 N. Wasserman
Hypothesis 1c (H1c) (non-founding executives):The more experienced the non-founding execu-tives, the less control the founder will retain.
Hypothesis 1d (H1d) (investors): Founders whoraise capital from venture capitalists will retainless control. Founders who raise capital fromangel investors will retain more control.
Performance implications: Is there a tradeoffbetween autonomy and value creation?
The CEO position exerts significant control overcompany decisions. This is particularly true fornew ventures, which are just beginning to form andevolve, and in which every CEO decision seemsto bear more pronounced weight (Aldrich and Fiol1994). From a resource-dependence perspective, aboard chooses the CEO who is most “capable ofcoping with the critical problems facing the orga-nization” (Pfeffer and Salancik, 1978: 236). Duringthe early days of the startup, a founder is often thebest person to cope with those challenges: s/he cameup with the idea, which was often based on thefounder’s expertise or sparked by the founder’s prioremployment experience (Bhide, 2000), and themanagerial challenges are at the level of a technicalproject team rather than a multi-function company.
However, as the startup grows and changes,the founder often lacks the skills to address thenext set of challenges. For instance, after productdevelopment has been completed and the producthas to be marketed and sold to customers, thechallenges shift from technical issues to buildinga multi-function company (Wasserman, 2003). Atthat point, a new CEO will often be more qualifiedto address the company’s challenges and should bemore effective at growing the value of the company,as was the case with Richard Williams at Wily(described above). In other words, a new CEO willbe able to do things that the founder can’t do. Inaddition, a new CEO might be able to do things thatthe founder won’t do. For instance, founders mightbe constrained by their attachment to their initialideas and strategies (Adomdza, 2008) or to theirearly employees (e.g., Wasserman and Fynn, 2007).They might fall prey to managerial conceit (Marchand Shapira, 1987), to the temptation to escalatetheir commitment (Schmidt and Calantone, 2002;Staw, 1981), or to overconfidence and complacencyfostered by prior success (Miller, 1991). In suchsituations, a new CEO would be more effective at
adjusting strategies or at changing the employeebase to fit the company’s new challenges.
As decisions accumulate, they can lead to verydifferent outcomes. At the control extreme, thefounder consistently foregoes attracting resources,maximizing control but sacrificing value. The rea-sons why founders may make such choices includeheterogeneous preferences for control or differingexpectations about their ventures’ prospects.10 Atthe value-creation extreme, founders consistentlyattract valuable outside resources but risk losingcontrol.11 In between these two extremes, foundersmay be able to keep a measure of control whilebuilding some value, but typically have to sacrificesome of each, and possibly large amounts of both.
Companies use boards of directors to gainresources and minimize dependence (Pfeffer,1972). Outside directors bring four major benefits:“advice and counsel,” access to external channelsof information, access to resources, and legitimacy(Hillman, Withers, and Collins, 2009; Pfeffer andSalancik, 1978). Founders who haven’t raisedcapital from outside investors will control the entireboard of directors and thus all board decisions, butwill lack the “board capital” (Hillman and Dalziel,2003) that directors could contribute, and also lackthe discipline that can come from their monitoring(Garg, 2013).
Some investors add few resources beyond theirfinancial capital. Other investors, such as VCs, areknown for “providing value-added services to theirportfolio companies” (Baker and Gompers, 2003:571). More specifically, “their involvement includesservice on the boards of firms in their portfolios,frequent informal visits, meetings with customersand suppliers, and active involvement in key per-sonnel and strategic decisions.” (Lerner, 1995: 302)As a result, VC backing can help grow largercompanies (Baker and Gompers, 1999) and helpimprove long-term outcomes (Baker and Gompers,2003). In one study, VC-backed companies wentpublic more than four years sooner than did com-panies not backed by VCs (Baker and Gompers,
10 Rather than deciding to forego attracting resources, foundersmay also try to attract them but fail to do so, thus ending up witha high control/low value venture. To account for this possibility,in the empirical analyses I use fixed-effects methods, propensityscoring, and other approaches.11 It should be noted that attracting too many resources mayalso harm startup performance (George, 2005). Similarly, withinmultinational corporations, although slack resources can fostergreater experimentation, they can also reduce discipline regardinginnovative projects (Nohria and Gulati, 1996).
Copyright © 2015 John Wiley & Sons, Ltd. Strat. Mgmt. J., 38: 255–277 (2017)DOI: 10.1002/smj
The Throne vs. the Kingdom 261
1999). Because the best VCs can add value—andboard capital –founders are willing to take fromthem investment terms that are less founder-friendly(Hsu, 2004).
Although less studied, similar arguments sug-gest that there is a spectrum of value that canbe added by the other types of resource providersattracted to startup coalitions. For instance, thelarger the founding team, the higher the startup’sgrowth (Eisenhardt and Schoonhoven, 1990) andthe greater the company’s revenues (Cooper andBruno, 1977). Up to the point where an increasein team size can compromise outcomes (e.g., Hor-witz and Horwitz, 2007), attracting cofounders andnon-founding hires should help grow the value ofthe startup, but at the cost of imperiling control.12
As a result, controlling for company age andother differences across startups, there should be atradeoff between control and company value.
Hypothesis 2 (H2): For a given startup, the valueof the startup varies inversely with the degree ofcontrol retained by founders.
Does the tradeoff apply across the board, orto only some contingencies?
On the one hand, these resource-dependence chal-lenges may be stronger for different types of compa-nies and in different contexts. Thus, it’s possible thatthe tradeoff only applies to a subset of companiesand that that subset is driving the results, rather thanbeing significant across all situations. On the otherhand, the tradeoff may be more universal, in that itapplies across contingencies. To test these “contin-gent vs. universal” possibilities, I assess contingen-cies regarding what type of startup was founded andits evolution over time. First, the tradeoff may dif-fer according to the degree to which the company’sindustry segment is capital intensive. Second, the
12 Two other factors may reinforce this tradeoff. Even though—from a resource-dependence perspective— we would expect tosee that the attraction of resources helps build the value of thecompany, the effect may also be effective in the other direction:A potential resource provider’s confidence that the companycan become valuable may enable the core founder to attractthat resource provider. (My empirical tests do not assume thatthe causality runs in one direction or the other.) Furthermore,some early choices may constrain or reinforce later choices. Forinstance, choosing to self-fund may constrain the startup’s laterhiring (because it doesn’t have enough money to attract the besthires) and thus value creation. Thus, such path dependence maystrengthen the tradeoff.
tradeoff may differ between younger and older star-tups.
The more capital-intensive the company, themore critical it may be to attract resources in orderto grow value, and the more control the companyshould have to give up to attract those resources(Pfeffer and Salancik, 1978). Within larger com-panies, at both the corporate and business-segmentlevels, high capital intensity can have a negativeimpact on performance (Misangyi et al., 2006).For instance, high capital intensity can constrainstrategic choices, leading companies to chooseshort-term solutions over longer-term investments(Qu, Pinsonneault, and Oh, 2011). Startups incapital-intensive businesses have to invest morecapital in product development and make other sub-stantial investments in order to build the company.Such startups should have greater resource needsand thus may have to give up more control in orderto attract those resources. Conversely, startups inlow-capital-intensity businesses should be able togrow more value without having to give up a lotof control. This leads to the following contingenthypothesis:
Hypothesis 3 (H3): The inverse relationshipbetween company value and founder control willbe strong in startups in more capital-intensiveindustry segments but not in startups in lesscapital-intensive industry segments.
During the early stages of founding, founders’skills are often better suited to the challenges facedby the young startup than to the challenges faceddown the road. For instance, founders with tech-nical or scientific backgrounds are well-suited tolead the initial product-development effort. How-ever, as the startup’s needs broaden beyond techni-cal or scientific challenges, the founders’ skills areoften less suited to those new challenges. In essence,these founder-CEOs have succeeded at achievingthe key operating milestone of completing initialproduct development, but that very success hasincreased the divergence between founder abili-ties and startup needs (Wasserman, 2003).13 Thus,the need for—and potential impact of—attracting
13 This “paradox of entrepreneurial success” (Wasserman, 2003)suggests that a startup’s pre-succession performance could behigh, yet we could still see replacement of the founder due to theresource-dependence challenges examined here.
Copyright © 2015 John Wiley & Sons, Ltd. Strat. Mgmt. J., 38: 255–277 (2017)DOI: 10.1002/smj

262 N. Wasserman
new skills should increase as the startup evolves.At the same time, attracting financial resourcesheightens the likelihood that the founder-CEO willbe replaced by the board of directors (Boekerand Karichalil, 2002; Hellmann, 1998; Wasserman,2003). Thus, the tradeoff may get stronger as thestartup ages. This leads to the following contingenthypothesis:
Hypothesis 4 (H4): The inverse relationshipbetween company value and founder control willget stronger as startups age.
DATA AND METHODS
One hurdle to the rigorous study of entrepreneur-ship is that “data are difficult to obtain” (Shane andVenkataraman, 2000: 219). For this reason, muchof the relevant work on the issues described abovehas been based on theoretical models (e.g., Aghionand Bolton, 1992; Hellmann, 1998; Kirilenko,2001) or field-based interviews (e.g., Amit et al.,2000). Interviews can be invaluable for finding outentrepreneurs’ stated motives (Amit et al., 2000),especially as a complement to the “coarse grained”methodologies used to study relatively mature the-ories (Edmondson and McManus, 2007; Harrigan,1983). However, “we do not have, and it wouldbe very difficult (if not impossible) to specify,the ‘true’ beliefs” of interviewed entrepreneurs(Amit et al., 2000: 139). Instead, strategies maybest be inferred by observing “realized strategies”(Mintzberg and Waters, 1982: 466) and observable,concrete decisions (Hambrick and Mason, 1984).Thus, in my data collection, I focus on the actualdecisions made during the founding process—e.g.,how many founders there were, which non-founderswere on the executive team, whether the startupraised outside capital and from whom, etc.
My data come from the annual CompStudy sur-vey of private American ventures. The first Comp-Study survey was conducted in 2000 and focused onprivate information-technology ventures (broadlydefined, including telecommunications). Two yearslater a parallel survey of life-sciences ventures wasadded, and since then, annual surveys of both indus-tries have been conducted. In 2005, the sectionabout founders was enhanced, and I use all datacollected between 2005 and 2012. The full datasetincludes 6,130 startups that were founded by a totalof 16,500 founders. On the one hand, the dataset is
limited to a single country, to two industries withinthat country, and to a specific time period, andtherefore may not apply in other contexts. On theother hand, the technology and life-sciences indus-tries are by far the largest industries for Americanhigh-potential startups, accounting for more thantwo-thirds of the angel capital and venture capitalinvested during the time period, and accounting fornearly half of the initial public offerings (with noother industry accounting for more than 12% of theIPOs).14 In addition, the survey time period includesstartups that were founded across all stages of twomajor business cycles, with the vast majority of star-tups in the dataset founded across the boom of thelate 1990s, the bust of the early 2000s, the subse-quent uptick in the mid-2000s, and then the deeprecession from 2009 onwards, giving us the abilityto assess whether the tradeoff I examine pertains toonly parts of the business cycle or across it.
Invitations to participate in the survey are sentto the membership lists of local technology andlife-sciences associations (e.g., the MassachusettsHigh-Technology Council), the list of privatecompanies from the VentureXpert database, andsimilar databases. The invitations are sent to theCEOs and CFOs, who are offered a free copy of adetailed “CompStudy Compensation Report” basedon the survey results and available only to partic-ipants.15 Because the market for executive talent
14 According to Renaissance Capital, of the initial public offer-ings (IPOs) over the last decade, 48 percent came from thosetwo industries, and no other industry accounted for more than12 percent. According to Center for Venture Research at the Uni-versity of New Hampshire and the National Venture Capital Asso-ciation, of the angel capital invested during the decade, 74 percentwent to those two industries, as did 71 percent of venture capi-tal. According to Thomson’s Venture Expert Database, technologyinvestments (including Internet, computer software and services,communications and media, semiconductors and other electron-ics, and computer hardware) were 56 percent of venture capi-tal investments from 2000 to 2009 and life sciences investments(medical/health and biotechnology) were an additional 15 percent.15 The report includes position-by-position breakdowns of com-pensation (salaries, bonuses, and equity holdings) for the elevenmost common C-level and VP-level positions in private ventures.The breakdowns provide compensation benchmarks by companysize and age, industry segment, geographic location, financingrounds, founder versus non-founder status, and other dimen-sions. The reports were published by three professional-servicesfirms with which I partnered in collecting the data: accountingfirm Ernst & Young, law firm Hale & Dorr (now WilmerHale),and executive-search firm J. Robert Scott (now ParkSquare). In2009, we replaced the Compensation Reports with an onlinedata-analysis tool, at compstudy.com, that is also only availableto participants. To preclude any conflicts of interest, I have neverreceived any compensation from these firms, nor do I have anyownership stake in CompStudy.
Copyright © 2015 John Wiley & Sons, Ltd. Strat. Mgmt. J., 38: 255–277 (2017)DOI: 10.1002/smj
The Throne vs. the Kingdom 263
varies over time, companies usually want currentdata on executive compensation, so they have anincentive to participate even if they have alreadyparticipated in the past. Over the last decade,CompStudy’s annual compensation reports havebecome a standard reference for executive teams inprivate American ventures and for board membersand investors involved in those ventures. Eachyear, survey response rates vary between 10 and20 percent, higher than the typical response rates forsurveys targeting similar levels of executives (e.g.,Graham and Harvey, 2001) and for the sensitivityof the questions asked (e.g., about private-companyfinancing history and performance, and aboutexecutive compensation and equity stakes). Thesurveys are conducted online and fields are vali-dated as data are entered. When possible, data arecross-checked with publicly-available informationto check accuracy and representativeness.
For comparison, VentureXpert (formerly VentureEconomics) is one of the most commonly usedsources of data for research on high-potential star-tups (e.g., Gompers, 1995; Lerner, 1995; Sorensonand Stuart, 2008).16 VentureXpert is compiled byThomson Economics and provides data on venturecapital and other early-stage funding for compa-nies. It provides each company’s financing history,location, and related information. However, it doesnot provide many of the data points needed forthe current study—e.g., founder and non-founderbackgrounds, executive compensation and equityholdings, and levels of control retained by thefounders—and focuses on a more limited set ofstartups (those that have raised institutional capital,in contrast to CompStudy, which also includespre-funding ventures). It is instructive to comparethe distributions of companies within the twodatasets. I compared the CompStudy sample to theVentureXpert sample on the three dimensions onwhich they can be compared: geographic distri-bution, industry, and founding year. First, the twodatasets almost match regarding the percentage ofstartups from each state in the country, with theexception that CompStudy has a few more firmsin Massachusetts and fewer in California. (Furtherdetails are available from the author.) Regardingindustry breakdown, CompStudy is more balanced,with 65.2 percent of the CompStudy firms comingfrom high technology compared to 79.1 percent of
16 For an analysis of this database, also see Kaplan, Stromberg,et al. (2002).
the VentureXpert firms. Regarding founding year,VentureXpert has a higher proportion of companiesfrom before 2000, and is much more influenced bycompanies founded in 1999 than is CompStudy.Otherwise their distributions are similar.17
For two of the metrics within the founding team,we can compare CompStudy to the data fromanother study. Although more targeted, in that itfocused on MIT startups alone, Hsu, Roberts, andEesley (2007) also surveyed high-potential startups.They reported an average of 2.86 founders per team.My dataset has 2.70 founders per team. In Hsuet al. (2007), 46 percent of the entrepreneurial teamshad no prior startup experience. In my sample,53 percent of the core founders had no prior startupexperience.
The CompStudy survey design enables us to getdata on companies at a very early stage in theirdevelopment. The data should thus be less suscepti-ble to survivor bias than samples of public compa-nies, or even than samples of venture capital-backedcompanies (e.g., VentureXpert). Even so, becausethe surveys ask questions about decisions thatoccurred months or years earlier, they may besusceptible to retrospective bias. The first way Ireduced this bias was by asking relatively objectivequestions whenever possible; e.g., instead of asking,“How much leverage did the founders have whenraising their first round of outside capital?” I asked“How many board seats did the founders retainafter raising their first round of outside capital?”Second, many companies participated in multipleyears, enabling comparison of initial submissionsto later surveys. As described below, I also usedthe multiple responses from repeat respondentsto perform fixed-effects analyses that control forunobserved time-invariant company characteristics.
Dependent and independent variables
The initial hypotheses (H1a–d) examine thedegree of control retained by founders. FollowingHellmann (1998), I measure control at two levels:
17 Thus, overall the CompStudy dataset looks similar but notidentical to the VentureXpert dataset. To check if my results wouldchange if the composition of the CompStudy sample matched theVentureXpert distribution on these three dimensions, I reran allof the core models reweighting the observations using propensityscores (e.g., Rosenbaum and Rubin, 1983). The core results didnot change, in both the models using all responses and in thefixed-effects models, and for both the company-valuation andcapital-raised dependent variables.
Copyright © 2015 John Wiley & Sons, Ltd. Strat. Mgmt. J., 38: 255–277 (2017)DOI: 10.1002/smj
264 N. Wasserman
control of the CEO position (is the founder stillthe CEO?) and control of the board of directors(do the founders and inside executives have morethan half of the seats on the board of directors?). Inthe core models, I used a discrete ordinal “controlindex” that ranges from 0 to 2: 0 if the founderscontrol neither the CEO position nor the board ofdirectors, 1 if they control one but not the other,and 2 if they control both the CEO position andthe board of directors. In robustness tests, andto examine whether either of the two arenas ofcontrol is the real driver of the results, I also reranthe models using separate binary variables foreach of those two arenas of control. The coreresults were the same as in the models using thecontrol index. I also reran those models using thepercentage of the board controlled by the founders,rather than using the binary metric of board con-trol that was used to calculate the control-indexvariable. Again, the results were the same as in thecore models.
Hypotheses 2–4 focus on the tradeoff betweenthe value of the company and the degree of foundercontrol. I use two different metrics to estimate thevalue of the company: most recent company valu-ation and total amount of capital raised. My coremetric is pre-money valuation of the company atthe most recent round of financing (e.g., Gomperset al., 2010; Hsu, 2004), calculated as the price pershare in the financing round times the number ofshares outstanding prior to the round. The secondmetric for company value is the total amount of cap-ital raised by the startup since founding, includingall rounds of financing through the time of the sur-vey.18 Both variables were log-normally distributed,so I use the natural log of each variable. To allowfor the companies that had not raised any capi-tal as of the time of the survey, I added 1 to thecapital-raised metric before taking its natural log-arithm. To account for missing data in the survey, Iused multiple-imputation methods (Rubin, 1987).
Regarding independent variables, the modelsinclude an indicator of whether the core founder
18 The most common round of financing is one in which theinvestors’ capital goes into the company, sparks the creation ofnew shares of equity, and is used for organizational purposes.Although rare, some rounds of financing also include capital thatis being used to buy existing equity (from the founders or otherinsiders), does not increase the number of shares, and goes to theequity sellers for their own purposes. The “total capital raised”variable includes the former equity sales but not the latter, becausethe latter does not provide resources that will help grow the valueof the company itself.
had prior founding experience and whether the corefounder tapped social networks to attract executivehires, while controlling for the core founder’syears of prior work experience.19 For the foundingteam, the models include the size of the foundingteam and the founding team’s total years of priorwork experience. Value may also be affected bythe founders’ initial capital investments in thestartup, which I aggregate across the foundingteam. I include three aspects for non-foundingexecutives: their years of prior work experience,the number of executives who in prior work werethe senior-most executives within their functions,and the average compensation of the executives(as another metric of the quality of the executives).I also control for the executives’ equity stakes.20
The amount of capital raised may be affected bythe source of financing—the founders themselves,angel investors, or venture capitalists—so I includedummy variables for each of those three sources.Larger boards of directors can add more resources,but can also be less effective because of diffusedresponsibility, because of increased agency prob-lems (e.g., free riding by directors), or because theboard becomes more symbolic than effective (e.g.,Eisenberg, Sundgren, and Wells, 1998; Jensen,1993; Yermack, 1996). Therefore, I also controlledfor the size of the board, allowing for curvilineareffects on value creation. Regarding the startup’slocation, more valuable ventures may be created instartup “hubs” that have plentiful startup resources,so I controlled for whether the startup is located ina hub (i.e., CA or MA, the hubs of the Americanstartup scene), a secondary market (IL, NJ, NY, orTX), or in smaller markets. To assess capital inten-sity, I categorized each startup’s business segmentinto the three segments with the highest capitalintensity and the three segments with the lowestcapital intensity, based on the capital-intensity rat-ings published in the IBISWorld industry reports.21
19 I used five criteria to assess whether a founder was the “corefounder”: Which founder was the initial CEO, which founder hadthe initial idea, which founder held the largest equity stake, whichfounder contributed the most seed capital, and whether the founderwas a full-time employee at time of founding.20 Startups give equity stakes in order to attract executive hires,align their incentives, and heighten the sense of ownership(see Rousseau and Shperling, 2003). In addition, because theytypically must conserve their cash, they often include equity stakesin the compensation package in order to be able to pay lowersalaries.21 Higher capital intensity segments included Biopharma, Clean-Tech, and Hardware/Semiconductors/Communications. Lower
Copyright © 2015 John Wiley & Sons, Ltd. Strat. Mgmt. J., 38: 255–277 (2017)DOI: 10.1002/smj
The Throne vs. the Kingdom 265
To assess the macroeconomic conditions at timeof founding, I categorized each startup’s year offounding into boom, middling (neither boom notbust), or bust eras.22
Methods
In the multivariate models testing Hypotheses 2–4,the core analyses use fixed-effects models with(log of) company valuation as the dependent vari-able. Of the 6,130 companies that participated inthe survey, 49 percent participated more than onetime, enabling me to use their responses in thefixed-effects analyses; using company-level fixedeffects reduces the risk of omitted-variable biasby allowing us to control for the unobservabletime-invariant characteristics of each firm. Robust-ness tests included fixed-effects models with (logof) capital raised as an alternate metric of valuecreation, and ordinary-least-squares models (with-out fixed effects) using all surveys (not just thosethat were repeat respondents), inversely weightingeach survey by the number of surveys submittedby that company. Standard errors were clustered atthe firm level. I also performed robustness tests ofthe functional forms of several variables (e.g., com-pany age, number of founders, macroeconomic con-ditions, capital intensity) in which I replaced thevariable of interest with dummy variables captur-ing each possible level of the variable or with theraw underlying levels (for composite variables). Inall robustness tests, the core results were the sameas in the models shown.
I compared the initial responses of repeat respon-dents to the initial (sole) responses of non-repeatersto see if there were significant differences. The95 percent confidence intervals overlapped regard-ing company valuation, number of employees,company age, the founder’s prior years of workexperience, whether the core founder had priorfounding experience, and how much seed capitalthe founders invested. The biggest differences werein the degree of control the founders had retained(in repeat respondents, the founders had a littleless control when the company’s initial survey was
capital intensity segments included Digital Media/Content, Soft-ware, and Medical devices. (The remaining segments— 23% ofthe total—were categorized as Other.)22 The boom eras included 1997–1999 and 2006–2008, themiddling eras included 2004–2005 and 2012, and the bust erasincluded 2000–2003 and 2009–2011.
completed) and in the size of the founding team (inrepeat respondents, the founding teams were a littlebigger). Despite these differences, as describedbelow, the core results regarding my hypotheseswere the same across both the all-companiesand fixed-effects (i.e., repeat respondent only)models.
To test Hypothesis 3, I wanted to see whetherfirms with differing levels of capital intensityface different tradeoffs between control and valuecreated. I interacted dummy variables indicatingwhether the firm had low capital intensity orhigh capital intensity. This yielded equivalentregression coefficients to estimating the core modeltwice—once restricting the sample to firms withlow capital intensity and once to firms with highcapital intensity—while still being able to useall data points in the model (instead, the separaterestricted models would each have about one-halfthe observations). Combining these regressionsinto one regression also enables us to test thedifference between the coefficient on control forthe different types of firms. Two questions areof particular interest in these analyses: (1) Is thecontrol index still significant? (2) Are the newinteraction terms significant, suggesting supportfor the contingency-specific hypothesis? (If theinteraction terms are not significant, we cannotreject the null hypothesis that the tradeoff appliesacross contingencies.) I performed similar analysesto test Hypothesis 4 about startup age.
RESULTS
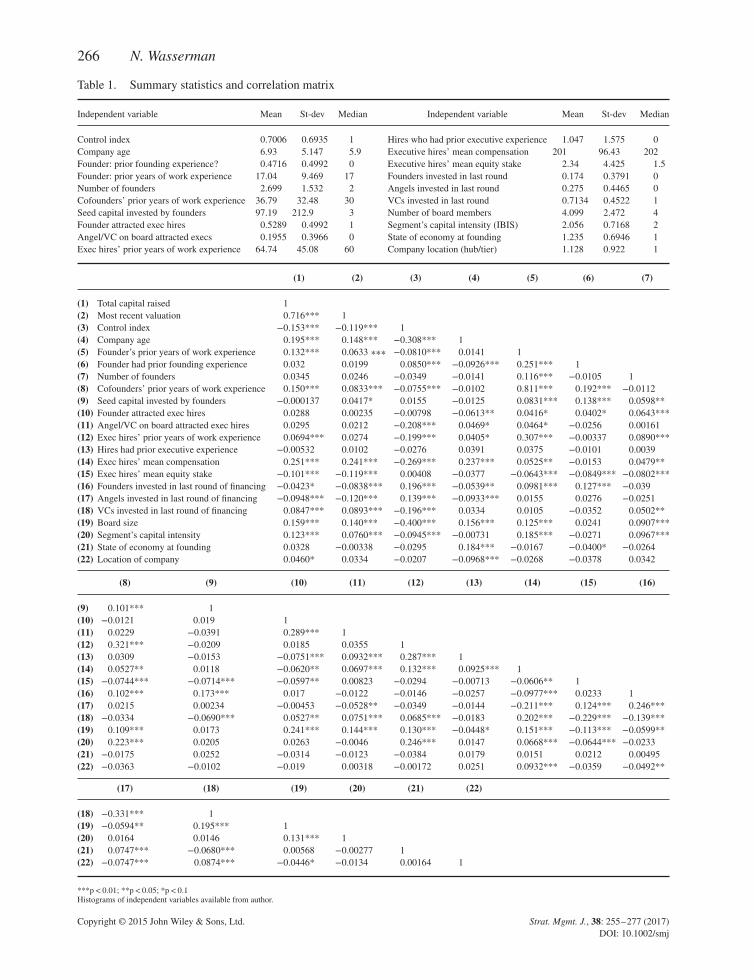
Table 1 shows summary statistics and a correlationmatrix. On average the 6,130 companies werefounded by 2.7 founders. The median numberof full-time-equivalent employees was 26. Thecompanies had raised a median of $7 million incapital and were a median of 5.9 years old. Thecore founders averaged 17 years of prior workexperience and 47 percent had prior founding expe-rience. Of the prior rounds of financing, 17 percentincluded founder capital, 28 percent includedangel investors, and 71 percent included venturecapitalists. Regarding control of the company, in49 percent of the companies a founder was stillCEO, in 21 percent of the companies the insiderscontrolled more than half of the seats on the boardof directors, and in 41 percent of the companies thefounders owned more than half of the company’s
Copyright © 2015 John Wiley & Sons, Ltd. Strat. Mgmt. J., 38: 255–277 (2017)DOI: 10.1002/smj
266 N. Wasserman
Table 1. Summary statistics and correlation matrix
Independent variable Mean St-dev Median Independent variable Mean St-dev Median
Control index 0.7006 0.6935 1 Hires who had prior executive experience 1.047 1.575 0Company age 6.93 5.147 5.9 Executive hires’ mean compensation 201 96.43 202Founder: prior founding experience? 0.4716 0.4992 0 Executive hires’ mean equity stake 2.34 4.425 1.5Founder: prior years of work experience 17.04 9.469 17 Founders invested in last round 0.174 0.3791 0Number of founders 2.699 1.532 2 Angels invested in last round 0.275 0.4465 0Cofounders’ prior years of work experience 36.79 32.48 30 VCs invested in last round 0.7134 0.4522 1Seed capital invested by founders 97.19 212.9 3 Number of board members 4.099 2.472 4Founder attracted exec hires 0.5289 0.4992 1 Segment’s capital intensity (IBIS) 2.056 0.7168 2Angel/VC on board attracted execs 0.1955 0.3966 0 State of economy at founding 1.235 0.6946 1Exec hires’ prior years of work experience 64.74 45.08 60 Company location (hub/tier) 1.128 0.922 1
(1) (2) (3) (4) (5) (6) (7)
(1) Total capital raised 1(2) Most recent valuation 0.716*** 1(3) Control index −0.153*** −0.119*** 1(4) Company age 0.195*** 0.148*** −0.308*** 1(5) Founder’s prior years of work experience 0.132*** 0.0633 ∗∗∗ −0.0810*** 0.0141 1(6) Founder had prior founding experience 0.032 0.0199 0.0850*** −0.0926*** 0.251*** 1(7) Number of founders 0.0345 0.0246 −0.0349 −0.0141 0.116*** −0.0105 1(8) Cofounders’ prior years of work experience 0.150*** 0.0833*** −0.0755*** −0.0102 0.811*** 0.192*** −0.0112(9) Seed capital invested by founders −0.000137 0.0417* 0.0155 −0.0125 0.0831*** 0.138*** 0.0598**(10) Founder attracted exec hires 0.0288 0.00235 −0.00798 −0.0613** 0.0416* 0.0402* 0.0643***(11) Angel/VC on board attracted exec hires 0.0295 0.0212 −0.208*** 0.0469* 0.0464* −0.0256 0.00161(12) Exec hires’ prior years of work experience 0.0694*** 0.0274 −0.199*** 0.0405* 0.307*** −0.00337 0.0890***(13) Hires had prior executive experience −0.00532 0.0102 −0.0276 0.0391 0.0375 −0.0101 0.0039(14) Exec hires’ mean compensation 0.251*** 0.241*** −0.269*** 0.237*** 0.0525** −0.0153 0.0479**(15) Exec hires’ mean equity stake −0.101*** −0.119*** 0.00408 −0.0377 −0.0643*** −0.0849*** −0.0802***(16) Founders invested in last round of financing −0.0423* −0.0838*** 0.196*** −0.0539** 0.0981*** 0.127*** −0.039(17) Angels invested in last round of financing −0.0948*** −0.120*** 0.139*** −0.0933*** 0.0155 0.0276 −0.0251(18) VCs invested in last round of financing 0.0847*** 0.0893*** −0.196*** 0.0334 0.0105 −0.0352 0.0502**(19) Board size 0.159*** 0.140*** −0.400*** 0.156*** 0.125*** 0.0241 0.0907***(20) Segment’s capital intensity 0.123*** 0.0760*** −0.0945*** −0.00731 0.185*** −0.0271 0.0967***(21) State of economy at founding 0.0328 −0.00338 −0.0295 0.184*** −0.0167 −0.0400* −0.0264(22) Location of company 0.0460* 0.0334 −0.0207 −0.0968*** −0.0268 −0.0378 0.0342
(8) (9) (10) (11) (12) (13) (14) (15) (16)
(9) 0.101*** 1(10) −0.0121 0.019 1(11) 0.0229 −0.0391 0.289*** 1(12) 0.321*** −0.0209 0.0185 0.0355 1(13) 0.0309 −0.0153 −0.0751*** 0.0932*** 0.287*** 1(14) 0.0527** 0.0118 −0.0620** 0.0697*** 0.132*** 0.0925*** 1(15) −0.0744*** −0.0714*** −0.0597** 0.00823 −0.0294 −0.00713 −0.0606** 1(16) 0.102*** 0.173*** 0.017 −0.0122 −0.0146 −0.0257 −0.0977*** 0.0233 1(17) 0.0215 0.00234 −0.00453 −0.0528** −0.0349 −0.0144 −0.211*** 0.124*** 0.246***(18) −0.0334 −0.0690*** 0.0527** 0.0751*** 0.0685*** −0.0183 0.202*** −0.229*** −0.139***(19) 0.109*** 0.0173 0.241*** 0.144*** 0.130*** −0.0448* 0.151*** −0.113*** −0.0599**(20) 0.223*** 0.0205 0.0263 −0.0046 0.246*** 0.0147 0.0668*** −0.0644*** −0.0233(21) −0.0175 0.0252 −0.0314 −0.0123 −0.0384 0.0179 0.0151 0.0212 0.00495(22) −0.0363 −0.0102 −0.019 0.00318 −0.00172 0.0251 0.0932*** −0.0359 −0.0492**
(17) (18) (19) (20) (21) (22)
(18) −0.331*** 1(19) −0.0594** 0.195*** 1(20) 0.0164 0.0146 0.131*** 1(21) 0.0747*** −0.0680*** 0.00568 −0.00277 1(22) −0.0747*** 0.0874*** −0.0446* −0.0134 0.00164 1
***p< 0.01; **p< 0.05; *p< 0.1Histograms of independent variables available from author.
Copyright © 2015 John Wiley & Sons, Ltd. Strat. Mgmt. J., 38: 255–277 (2017)DOI: 10.1002/smj
The Throne vs. the Kingdom 267
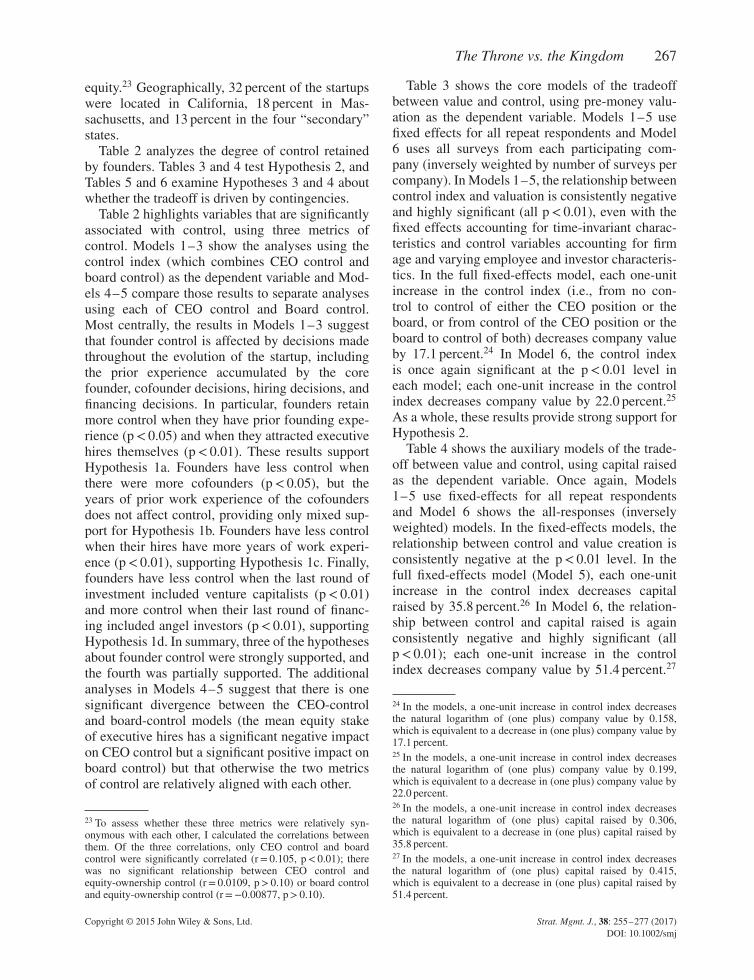
equity.23 Geographically, 32 percent of the startupswere located in California, 18 percent in Mas-sachusetts, and 13 percent in the four “secondary”states.
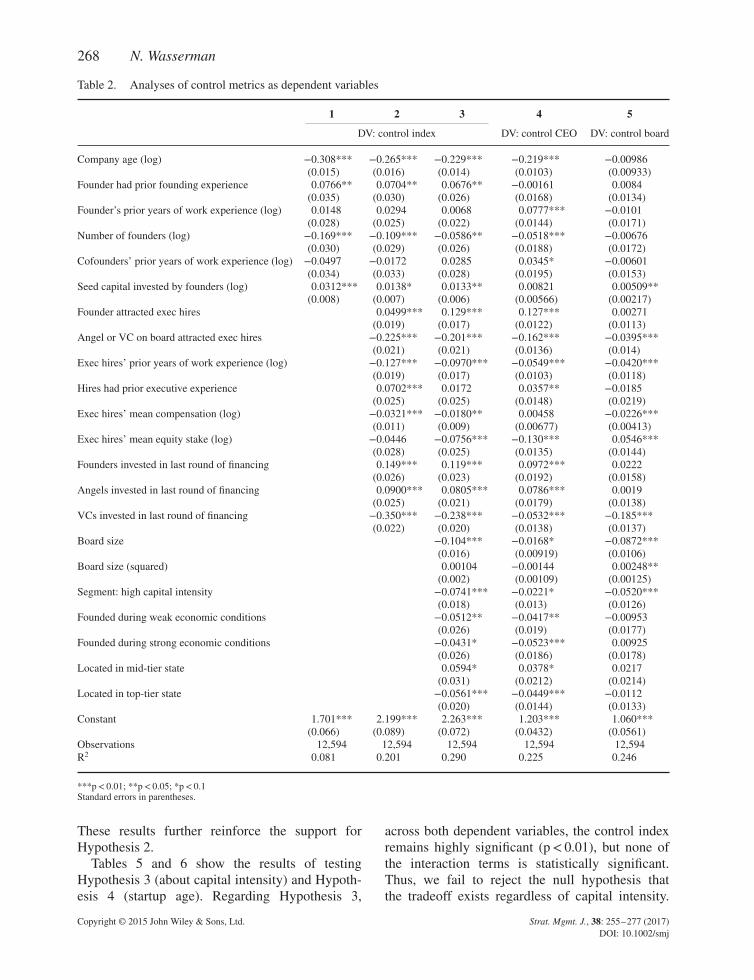
Table 2 analyzes the degree of control retainedby founders. Tables 3 and 4 test Hypothesis 2, andTables 5 and 6 examine Hypotheses 3 and 4 aboutwhether the tradeoff is driven by contingencies.
Table 2 highlights variables that are significantlyassociated with control, using three metrics ofcontrol. Models 1–3 show the analyses using thecontrol index (which combines CEO control andboard control) as the dependent variable and Mod-els 4–5 compare those results to separate analysesusing each of CEO control and Board control.Most centrally, the results in Models 1–3 suggestthat founder control is affected by decisions madethroughout the evolution of the startup, includingthe prior experience accumulated by the corefounder, cofounder decisions, hiring decisions, andfinancing decisions. In particular, founders retainmore control when they have prior founding expe-rience (p< 0.05) and when they attracted executivehires themselves (p< 0.01). These results supportHypothesis 1a. Founders have less control whenthere were more cofounders (p< 0.05), but theyears of prior work experience of the cofoundersdoes not affect control, providing only mixed sup-port for Hypothesis 1b. Founders have less controlwhen their hires have more years of work experi-ence (p< 0.01), supporting Hypothesis 1c. Finally,founders have less control when the last round ofinvestment included venture capitalists (p< 0.01)and more control when their last round of financ-ing included angel investors (p< 0.01), supportingHypothesis 1d. In summary, three of the hypothesesabout founder control were strongly supported, andthe fourth was partially supported. The additionalanalyses in Models 4–5 suggest that there is onesignificant divergence between the CEO-controland board-control models (the mean equity stakeof executive hires has a significant negative impacton CEO control but a significant positive impact onboard control) but that otherwise the two metricsof control are relatively aligned with each other.
23 To assess whether these three metrics were relatively syn-onymous with each other, I calculated the correlations betweenthem. Of the three correlations, only CEO control and boardcontrol were significantly correlated (r= 0.105, p< 0.01); therewas no significant relationship between CEO control andequity-ownership control (r= 0.0109, p> 0.10) or board controland equity-ownership control (r=−0.00877, p> 0.10).
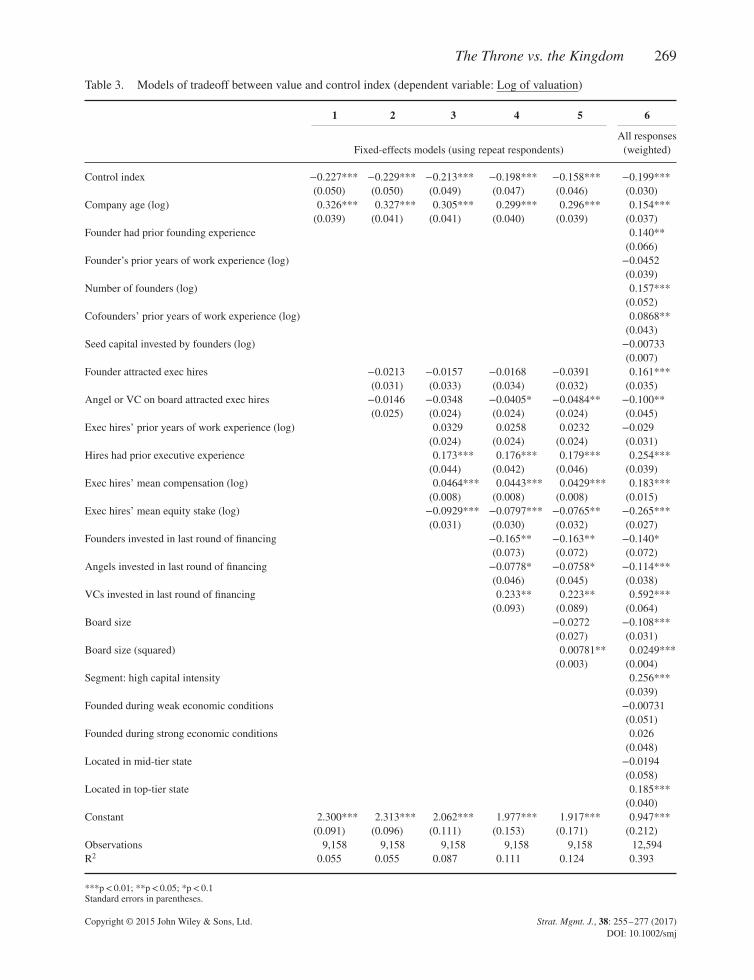
Table 3 shows the core models of the tradeoffbetween value and control, using pre-money valu-ation as the dependent variable. Models 1–5 usefixed effects for all repeat respondents and Model6 uses all surveys from each participating com-pany (inversely weighted by number of surveys percompany). In Models 1–5, the relationship betweencontrol index and valuation is consistently negativeand highly significant (all p< 0.01), even with thefixed effects accounting for time-invariant charac-teristics and control variables accounting for firmage and varying employee and investor characteris-tics. In the full fixed-effects model, each one-unitincrease in the control index (i.e., from no con-trol to control of either the CEO position or theboard, or from control of the CEO position or theboard to control of both) decreases company valueby 17.1 percent.24 In Model 6, the control indexis once again significant at the p< 0.01 level ineach model; each one-unit increase in the controlindex decreases company value by 22.0 percent.25
As a whole, these results provide strong support forHypothesis 2.
Table 4 shows the auxiliary models of the trade-off between value and control, using capital raisedas the dependent variable. Once again, Models1–5 use fixed-effects for all repeat respondentsand Model 6 shows the all-responses (inverselyweighted) models. In the fixed-effects models, therelationship between control and value creation isconsistently negative at the p< 0.01 level. In thefull fixed-effects model (Model 5), each one-unitincrease in the control index decreases capitalraised by 35.8 percent.26 In Model 6, the relation-ship between control and capital raised is againconsistently negative and highly significant (allp< 0.01); each one-unit increase in the controlindex decreases company value by 51.4 percent.27
24 In the models, a one-unit increase in control index decreasesthe natural logarithm of (one plus) company value by 0.158,which is equivalent to a decrease in (one plus) company value by17.1 percent.25 In the models, a one-unit increase in control index decreasesthe natural logarithm of (one plus) company value by 0.199,which is equivalent to a decrease in (one plus) company value by22.0 percent.26 In the models, a one-unit increase in control index decreasesthe natural logarithm of (one plus) capital raised by 0.306,which is equivalent to a decrease in (one plus) capital raised by35.8 percent.27 In the models, a one-unit increase in control index decreasesthe natural logarithm of (one plus) capital raised by 0.415,which is equivalent to a decrease in (one plus) capital raised by51.4 percent.
Copyright © 2015 John Wiley & Sons, Ltd. Strat. Mgmt. J., 38: 255–277 (2017)DOI: 10.1002/smj
268 N. Wasserman
Table 2. Analyses of control metrics as dependent variables
1 2 3 4 5
DV: control index DV: control CEO DV: control board
Company age (log) −0.308*** −0.265*** −0.229*** −0.219*** −0.00986(0.015) (0.016) (0.014) (0.0103) (0.00933)
Founder had prior founding experience 0.0766** 0.0704** 0.0676** −0.00161 0.0084(0.035) (0.030) (0.026) (0.0168) (0.0134)
Founder’s prior years of work experience (log) 0.0148 0.0294 0.0068 0.0777*** −0.0101(0.028) (0.025) (0.022) (0.0144) (0.0171)
Number of founders (log) −0.169*** −0.109*** −0.0586** −0.0518*** −0.00676(0.030) (0.029) (0.026) (0.0188) (0.0172)
Cofounders’ prior years of work experience (log) −0.0497 −0.0172 0.0285 0.0345* −0.00601(0.034) (0.033) (0.028) (0.0195) (0.0153)
Seed capital invested by founders (log) 0.0312*** 0.0138* 0.0133** 0.00821 0.00509**(0.008) (0.007) (0.006) (0.00566) (0.00217)
Founder attracted exec hires 0.0499*** 0.129*** 0.127*** 0.00271(0.019) (0.017) (0.0122) (0.0113)
Angel or VC on board attracted exec hires −0.225*** −0.201*** −0.162*** −0.0395***(0.021) (0.021) (0.0136) (0.014)
Exec hires’ prior years of work experience (log) −0.127*** −0.0970*** −0.0549*** −0.0420***(0.019) (0.017) (0.0103) (0.0118)
Hires had prior executive experience 0.0702*** 0.0172 0.0357** −0.0185(0.025) (0.025) (0.0148) (0.0219)
Exec hires’ mean compensation (log) −0.0321*** −0.0180** 0.00458 −0.0226***(0.011) (0.009) (0.00677) (0.00413)
Exec hires’ mean equity stake (log) −0.0446 −0.0756*** −0.130*** 0.0546***(0.028) (0.025) (0.0135) (0.0144)
Founders invested in last round of financing 0.149*** 0.119*** 0.0972*** 0.0222(0.026) (0.023) (0.0192) (0.0158)
Angels invested in last round of financing 0.0900*** 0.0805*** 0.0786*** 0.0019(0.025) (0.021) (0.0179) (0.0138)
VCs invested in last round of financing −0.350*** −0.238*** −0.0532*** −0.185***(0.022) (0.020) (0.0138) (0.0137)
Board size −0.104*** −0.0168* −0.0872***(0.016) (0.00919) (0.0106)
Board size (squared) 0.00104 −0.00144 0.00248**(0.002) (0.00109) (0.00125)
Segment: high capital intensity −0.0741*** −0.0221* −0.0520***(0.018) (0.013) (0.0126)
Founded during weak economic conditions −0.0512** −0.0417** −0.00953(0.026) (0.019) (0.0177)
Founded during strong economic conditions −0.0431* −0.0523*** 0.00925(0.026) (0.0186) (0.0178)
Located in mid-tier state 0.0594* 0.0378* 0.0217(0.031) (0.0212) (0.0214)
Located in top-tier state −0.0561*** −0.0449*** −0.0112(0.020) (0.0144) (0.0133)
Constant 1.701*** 2.199*** 2.263*** 1.203*** 1.060***(0.066) (0.089) (0.072) (0.0432) (0.0561)
Observations 12,594 12,594 12,594 12,594 12,594R2 0.081 0.201 0.290 0.225 0.246
***p< 0.01; **p< 0.05; *p< 0.1Standard errors in parentheses.
These results further reinforce the support forHypothesis 2.
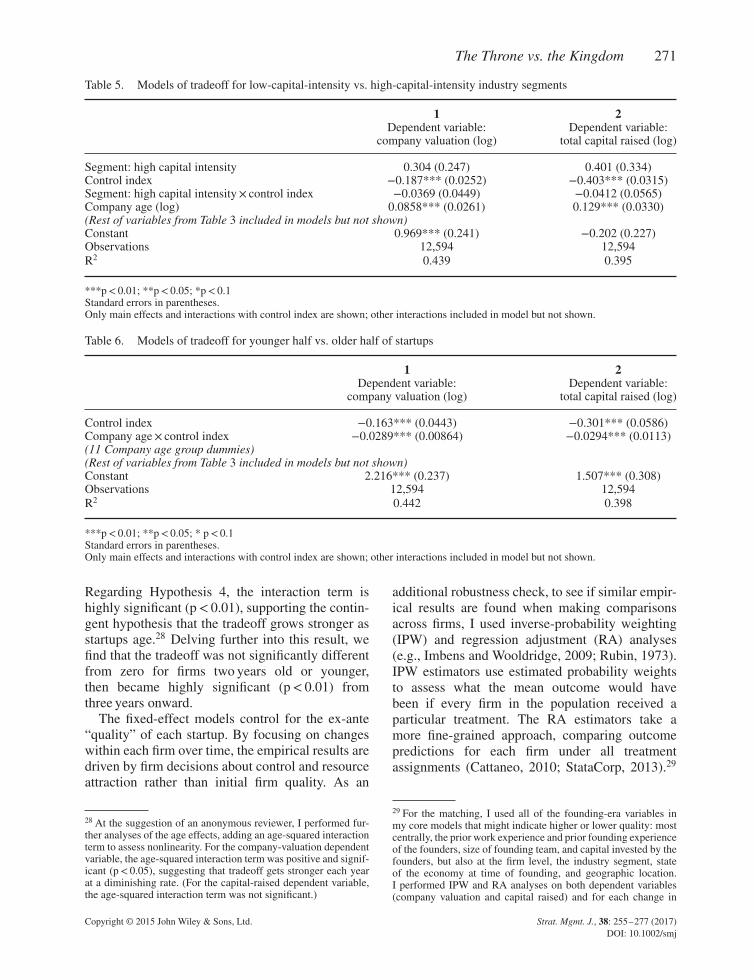
Tables 5 and 6 show the results of testingHypothesis 3 (about capital intensity) and Hypoth-esis 4 (startup age). Regarding Hypothesis 3,
across both dependent variables, the control indexremains highly significant (p< 0.01), but none ofthe interaction terms is statistically significant.Thus, we fail to reject the null hypothesis thatthe tradeoff exists regardless of capital intensity.
Copyright © 2015 John Wiley & Sons, Ltd. Strat. Mgmt. J., 38: 255–277 (2017)DOI: 10.1002/smj
The Throne vs. the Kingdom 269
Table 3. Models of tradeoff between value and control index (dependent variable: Log of valuation)
1 2 3 4 5 6
Fixed-effects models (using repeat respondents)All responses
(weighted)
Control index −0.227*** −0.229*** −0.213*** −0.198*** −0.158*** −0.199***(0.050) (0.050) (0.049) (0.047) (0.046) (0.030)
Company age (log) 0.326*** 0.327*** 0.305*** 0.299*** 0.296*** 0.154***(0.039) (0.041) (0.041) (0.040) (0.039) (0.037)
Founder had prior founding experience 0.140**(0.066)
Founder’s prior years of work experience (log) −0.0452(0.039)
Number of founders (log) 0.157***(0.052)
Cofounders’ prior years of work experience (log) 0.0868**(0.043)
Seed capital invested by founders (log) −0.00733(0.007)
Founder attracted exec hires −0.0213 −0.0157 −0.0168 −0.0391 0.161***(0.031) (0.033) (0.034) (0.032) (0.035)
Angel or VC on board attracted exec hires −0.0146 −0.0348 −0.0405* −0.0484** −0.100**(0.025) (0.024) (0.024) (0.024) (0.045)
Exec hires’ prior years of work experience (log) 0.0329 0.0258 0.0232 −0.029(0.024) (0.024) (0.024) (0.031)
Hires had prior executive experience 0.173*** 0.176*** 0.179*** 0.254***(0.044) (0.042) (0.046) (0.039)
Exec hires’ mean compensation (log) 0.0464*** 0.0443*** 0.0429*** 0.183***(0.008) (0.008) (0.008) (0.015)
Exec hires’ mean equity stake (log) −0.0929*** −0.0797*** −0.0765** −0.265***(0.031) (0.030) (0.032) (0.027)
Founders invested in last round of financing −0.165** −0.163** −0.140*(0.073) (0.072) (0.072)
Angels invested in last round of financing −0.0778* −0.0758* −0.114***(0.046) (0.045) (0.038)
VCs invested in last round of financing 0.233** 0.223** 0.592***(0.093) (0.089) (0.064)
Board size −0.0272 −0.108***(0.027) (0.031)
Board size (squared) 0.00781** 0.0249***(0.003) (0.004)
Segment: high capital intensity 0.256***(0.039)
Founded during weak economic conditions −0.00731(0.051)
Founded during strong economic conditions 0.026(0.048)
Located in mid-tier state −0.0194(0.058)
Located in top-tier state 0.185***(0.040)
Constant 2.300*** 2.313*** 2.062*** 1.977*** 1.917*** 0.947***(0.091) (0.096) (0.111) (0.153) (0.171) (0.212)
Observations 9,158 9,158 9,158 9,158 9,158 12,594R2 0.055 0.055 0.087 0.111 0.124 0.393
***p< 0.01; **p< 0.05; *p< 0.1Standard errors in parentheses.
Copyright © 2015 John Wiley & Sons, Ltd. Strat. Mgmt. J., 38: 255–277 (2017)DOI: 10.1002/smj

270 N. Wasserman
Table 4. Models of tradeoff between value and control index (dependent variable: Log of capital raised)
1 2 3 4 5 6
Fixed-effects models (using repeat respondents)All responses
(weighted)
Control index −0.366*** −0.366*** −0.356*** −0.336*** −0.306*** −0.418***(0.066) (0.066) (0.066) (0.063) (0.061) (0.037)
Company age (log) 0.434*** 0.426*** 0.409*** 0.412*** 0.403*** 0.195***(0.051) (0.051) (0.053) (0.050) (0.048) (0.041)
Founder had prior founding experience 0.104(0.084)
Founder’s prior years of work experience (log) −0.0546(0.052)
Number of founders (log) 0.144**(0.065)
Cofounders’ prior years of work experience (log) 0.151***(0.057)
Seed capital invested by founders (log) −0.0210**(0.010)
Founder attracted exec hires −0.0541 −0.0482 −0.0504 −0.0662** 0.193***(0.036) (0.034) (0.033) (0.032) (0.044)
Angel or VC on board attracted exec hires 0.0061 −0.00866 −0.0201 −0.026 −0.0372(0.027) (0.026) (0.025) (0.025) (0.050)
Exec hires’ prior years of work experience (log) 0.00183 −0.0132 −0.0136 −0.033(0.021) (0.021) (0.022) (0.037)
Hires had prior executive experience 0.131*** 0.138*** 0.136*** 0.191***(0.040) (0.038) (0.039) (0.048)
Exec hires’ mean compensation (log) 0.0366*** 0.0345*** 0.0333*** 0.205***(0.009) (0.010) (0.011) (0.022)
Exec hires’ mean equity stake (log) −0.0684*** −0.0551** −0.0530** −0.287***(0.023) (0.023) (0.024) (0.033)
Founders invested in last round of financing −0.0125 −0.0104 0.0407(0.064) (0.063) (0.062)
Angels invested in last round of financing −0.0744 −0.0706 −0.078(0.053) (0.052) (0.048)
VCs invested in last round of financing 0.357*** 0.353*** 1.017***(0.080) (0.075) (0.065)
Board size −0.0835** −0.122***(0.035) (0.038)
Board size (squared) 0.0139*** 0.0283***(0.004) (0.004)
Segment: high capital intensity 0.317***(0.049)
Founded during weak economic conditions 0.00629(0.063)
Founded during strong economic conditions 0.119*(0.063)
Located in mid-tier state −0.102(0.077)
Located in top-tier state 0.164***(0.051)
Constant 1.499*** 1.542*** 1.408*** 1.217*** 1.253*** −0.191(0.120) (0.121) (0.133) (0.136) (0.152) (0.206)
Observations 9,158 9,158 9,158 9,158 9,158 12,594R2 0.098 0.099 0.113 0.144 0.158 0.436
***p< 0.01; **p< 0.05; *p< 0.1Standard errors in parentheses.
Copyright © 2015 John Wiley & Sons, Ltd. Strat. Mgmt. J., 38: 255–277 (2017)DOI: 10.1002/smj
The Throne vs. the Kingdom 271
Table 5. Models of tradeoff for low-capital-intensity vs. high-capital-intensity industry segments
1 2Dependent variable:
company valuation (log)Dependent variable:
total capital raised (log)
Segment: high capital intensity 0.304 (0.247) 0.401 (0.334)Control index −0.187*** (0.0252) −0.403*** (0.0315)Segment: high capital intensity× control index −0.0369 (0.0449) −0.0412 (0.0565)Company age (log) 0.0858*** (0.0261) 0.129*** (0.0330)(Rest of variables from Table 3 included in models but not shown)Constant 0.969*** (0.241) −0.202 (0.227)Observations 12,594 12,594R2 0.439 0.395
***p< 0.01; **p< 0.05; *p< 0.1Standard errors in parentheses.Only main effects and interactions with control index are shown; other interactions included in model but not shown.
Table 6. Models of tradeoff for younger half vs. older half of startups
1 2Dependent variable:
company valuation (log)Dependent variable:
total capital raised (log)
Control index −0.163*** (0.0443) −0.301*** (0.0586)Company age× control index −0.0289*** (0.00864) −0.0294*** (0.0113)(11 Company age group dummies)(Rest of variables from Table 3 included in models but not shown)Constant 2.216*** (0.237) 1.507*** (0.308)Observations 12,594 12,594R2 0.442 0.398
***p< 0.01; **p< 0.05; * p< 0.1Standard errors in parentheses.Only main effects and interactions with control index are shown; other interactions included in model but not shown.
Regarding Hypothesis 4, the interaction term ishighly significant (p< 0.01), supporting the contin-gent hypothesis that the tradeoff grows stronger asstartups age.28 Delving further into this result, wefind that the tradeoff was not significantly differentfrom zero for firms two years old or younger,then became highly significant (p< 0.01) fromthree years onward.
The fixed-effect models control for the ex-ante“quality” of each startup. By focusing on changeswithin each firm over time, the empirical results aredriven by firm decisions about control and resourceattraction rather than initial firm quality. As an
28 At the suggestion of an anonymous reviewer, I performed fur-ther analyses of the age effects, adding an age-squared interactionterm to assess nonlinearity. For the company-valuation dependentvariable, the age-squared interaction term was positive and signif-icant (p< 0.05), suggesting that tradeoff gets stronger each yearat a diminishing rate. (For the capital-raised dependent variable,the age-squared interaction term was not significant.)
additional robustness check, to see if similar empir-ical results are found when making comparisonsacross firms, I used inverse-probability weighting(IPW) and regression adjustment (RA) analyses(e.g., Imbens and Wooldridge, 2009; Rubin, 1973).IPW estimators use estimated probability weightsto assess what the mean outcome would havebeen if every firm in the population received aparticular treatment. The RA estimators take amore fine-grained approach, comparing outcomepredictions for each firm under all treatmentassignments (Cattaneo, 2010; StataCorp, 2013).29
29 For the matching, I used all of the founding-era variables inmy core models that might indicate higher or lower quality: mostcentrally, the prior work experience and prior founding experienceof the founders, size of founding team, and capital invested by thefounders, but also at the firm level, the industry segment, stateof the economy at time of founding, and geographic location.I performed IPW and RA analyses on both dependent variables(company valuation and capital raised) and for each change in
Copyright © 2015 John Wiley & Sons, Ltd. Strat. Mgmt. J., 38: 255–277 (2017)DOI: 10.1002/smj
272 N. Wasserman
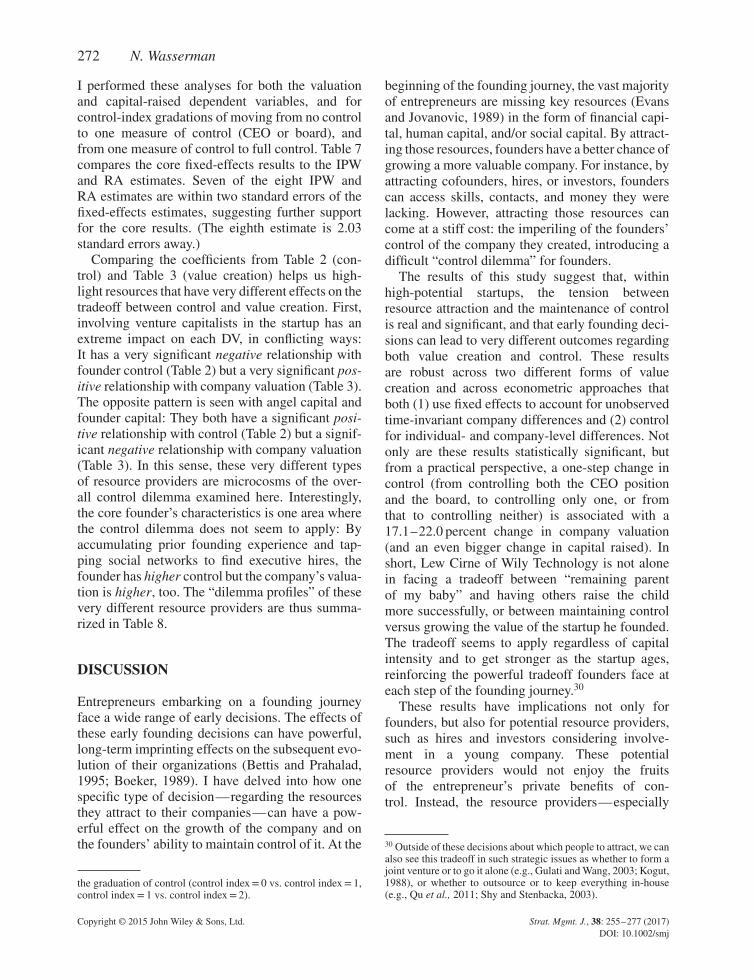
I performed these analyses for both the valuationand capital-raised dependent variables, and forcontrol-index gradations of moving from no controlto one measure of control (CEO or board), andfrom one measure of control to full control. Table 7compares the core fixed-effects results to the IPWand RA estimates. Seven of the eight IPW andRA estimates are within two standard errors of thefixed-effects estimates, suggesting further supportfor the core results. (The eighth estimate is 2.03standard errors away.)
Comparing the coefficients from Table 2 (con-trol) and Table 3 (value creation) helps us high-light resources that have very different effects on thetradeoff between control and value creation. First,involving venture capitalists in the startup has anextreme impact on each DV, in conflicting ways:It has a very significant negative relationship withfounder control (Table 2) but a very significant pos-itive relationship with company valuation (Table 3).The opposite pattern is seen with angel capital andfounder capital: They both have a significant posi-tive relationship with control (Table 2) but a signif-icant negative relationship with company valuation(Table 3). In this sense, these very different typesof resource providers are microcosms of the over-all control dilemma examined here. Interestingly,the core founder’s characteristics is one area wherethe control dilemma does not seem to apply: Byaccumulating prior founding experience and tap-ping social networks to find executive hires, thefounder has higher control but the company’s valua-tion is higher, too. The “dilemma profiles” of thesevery different resource providers are thus summa-rized in Table 8.
DISCUSSION
Entrepreneurs embarking on a founding journeyface a wide range of early decisions. The effects ofthese early founding decisions can have powerful,long-term imprinting effects on the subsequent evo-lution of their organizations (Bettis and Prahalad,1995; Boeker, 1989). I have delved into how onespecific type of decision—regarding the resourcesthey attract to their companies—can have a pow-erful effect on the growth of the company and onthe founders’ ability to maintain control of it. At the
the graduation of control (control index= 0 vs. control index= 1,control index= 1 vs. control index= 2).
beginning of the founding journey, the vast majorityof entrepreneurs are missing key resources (Evansand Jovanovic, 1989) in the form of financial capi-tal, human capital, and/or social capital. By attract-ing those resources, founders have a better chance ofgrowing a more valuable company. For instance, byattracting cofounders, hires, or investors, founderscan access skills, contacts, and money they werelacking. However, attracting those resources cancome at a stiff cost: the imperiling of the founders’control of the company they created, introducing adifficult “control dilemma” for founders.
The results of this study suggest that, withinhigh-potential startups, the tension betweenresource attraction and the maintenance of controlis real and significant, and that early founding deci-sions can lead to very different outcomes regardingboth value creation and control. These resultsare robust across two different forms of valuecreation and across econometric approaches thatboth (1) use fixed effects to account for unobservedtime-invariant company differences and (2) controlfor individual- and company-level differences. Notonly are these results statistically significant, butfrom a practical perspective, a one-step change incontrol (from controlling both the CEO positionand the board, to controlling only one, or fromthat to controlling neither) is associated with a17.1–22.0 percent change in company valuation(and an even bigger change in capital raised). Inshort, Lew Cirne of Wily Technology is not alonein facing a tradeoff between “remaining parentof my baby” and having others raise the childmore successfully, or between maintaining controlversus growing the value of the startup he founded.The tradeoff seems to apply regardless of capitalintensity and to get stronger as the startup ages,reinforcing the powerful tradeoff founders face ateach step of the founding journey.30
These results have implications not only forfounders, but also for potential resource providers,such as hires and investors considering involve-ment in a young company. These potentialresource providers would not enjoy the fruitsof the entrepreneur’s private benefits of con-trol. Instead, the resource providers—especially
30 Outside of these decisions about which people to attract, we canalso see this tradeoff in such strategic issues as whether to form ajoint venture or to go it alone (e.g., Gulati and Wang, 2003; Kogut,1988), or whether to outsource or to keep everything in-house(e.g., Qu et al., 2011; Shy and Stenbacka, 2003).
Copyright © 2015 John Wiley & Sons, Ltd. Strat. Mgmt. J., 38: 255–277 (2017)DOI: 10.1002/smj
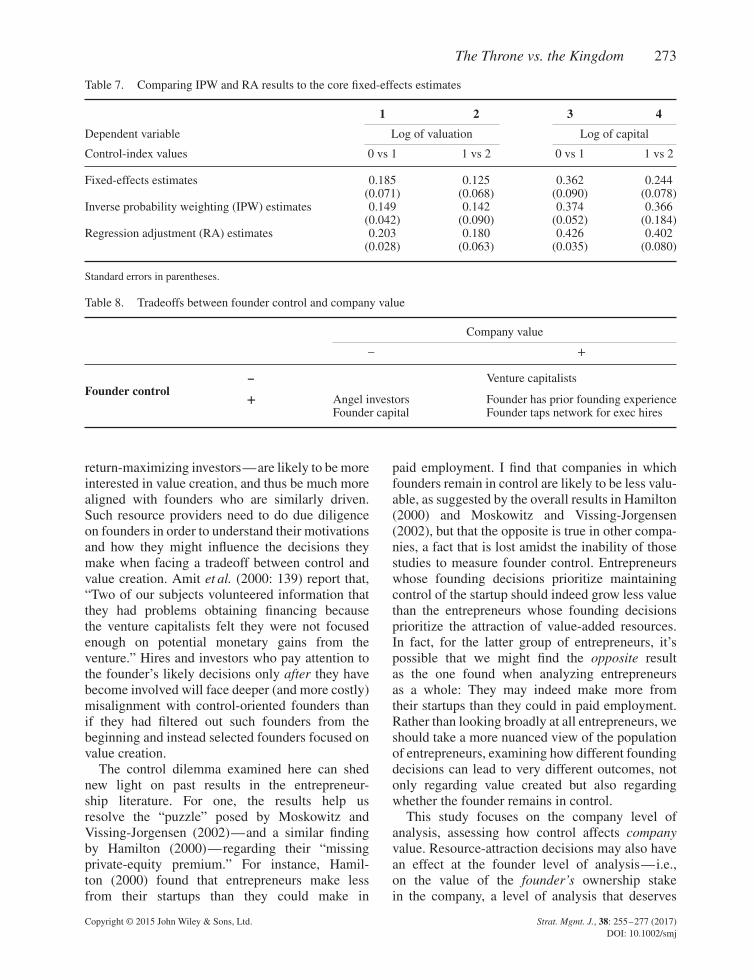
The Throne vs. the Kingdom 273
Table 7. Comparing IPW and RA results to the core fixed-effects estimates
1 2 3 4
Dependent variable Log of valuation Log of capital
Control-index values 0 vs 1 1 vs 2 0 vs 1 1 vs 2
Fixed-effects estimates 0.185 0.125 0.362 0.244(0.071) (0.068) (0.090) (0.078)
Inverse probability weighting (IPW) estimates 0.149 0.142 0.374 0.366(0.042) (0.090) (0.052) (0.184)
Regression adjustment (RA) estimates 0.203 0.180 0.426 0.402(0.028) (0.063) (0.035) (0.080)
Standard errors in parentheses.
Table 8. Tradeoffs between founder control and company value
Company value
– +
Founder control– Venture capitalists
+ Angel investors Founder has prior founding experienceFounder capital Founder taps network for exec hires
return-maximizing investors—are likely to be moreinterested in value creation, and thus be much morealigned with founders who are similarly driven.Such resource providers need to do due diligenceon founders in order to understand their motivationsand how they might influence the decisions theymake when facing a tradeoff between control andvalue creation. Amit et al. (2000: 139) report that,“Two of our subjects volunteered information thatthey had problems obtaining financing becausethe venture capitalists felt they were not focusedenough on potential monetary gains from theventure.” Hires and investors who pay attention tothe founder’s likely decisions only after they havebecome involved will face deeper (and more costly)misalignment with control-oriented founders thanif they had filtered out such founders from thebeginning and instead selected founders focused onvalue creation.
The control dilemma examined here can shednew light on past results in the entrepreneur-ship literature. For one, the results help usresolve the “puzzle” posed by Moskowitz andVissing-Jorgensen (2002)—and a similar findingby Hamilton (2000)—regarding their “missingprivate-equity premium.” For instance, Hamil-ton (2000) found that entrepreneurs make lessfrom their startups than they could make in
paid employment. I find that companies in whichfounders remain in control are likely to be less valu-able, as suggested by the overall results in Hamilton(2000) and Moskowitz and Vissing-Jorgensen(2002), but that the opposite is true in other compa-nies, a fact that is lost amidst the inability of thosestudies to measure founder control. Entrepreneurswhose founding decisions prioritize maintainingcontrol of the startup should indeed grow less valuethan the entrepreneurs whose founding decisionsprioritize the attraction of value-added resources.In fact, for the latter group of entrepreneurs, it’spossible that we might find the opposite resultas the one found when analyzing entrepreneursas a whole: They may indeed make more fromtheir startups than they could in paid employment.Rather than looking broadly at all entrepreneurs, weshould take a more nuanced view of the populationof entrepreneurs, examining how different foundingdecisions can lead to very different outcomes, notonly regarding value created but also regardingwhether the founder remains in control.
This study focuses on the company level ofanalysis, assessing how control affects companyvalue. Resource-attraction decisions may also havean effect at the founder level of analysis—i.e.,on the value of the founder’s ownership stakein the company, a level of analysis that deserves
Copyright © 2015 John Wiley & Sons, Ltd. Strat. Mgmt. J., 38: 255–277 (2017)DOI: 10.1002/smj
274 N. Wasserman
attention in future research. This study also focuseson founders’ revealed preferences: their actualdecisions that should affect the value they createand the control they maintain. However, the valuesand motivations of an organization’s most powerfulactors can have a strong impact on its strategicchoices, particularly regarding the attraction andallocation of resources (Hambrick and Mason,1984; Tagiuri, 1965). Future research—possiblyusing “finer grained” qualitative methodologiesto complement the quantitative methods usedhere (Harrigan, 1983)—could delve into how afounder’s motivations affect founding decisions,thus influencing control vs. value-creation out-comes. Power and economic motivations oftendominate executive decision making (e.g., Tagiuri,1965). For entrepreneurs in particular, Sapienzaet al. (2003: 106) argue that “wealth maximiza-tion and self-determination are the two primarymotives driving entrepreneurial financing choices.”However, not all entrepreneurs start venturesto get wealthy (Amit et al., 2000: 120); amongMIT alumni initiating high-technology ventures,independence (“being own boss”) and challengewere more important motivators than financial gain(Roberts, 1988, 1991). Instead, researchers argue,such entrepreneurs are motivated by the chanceto play a central role in driving and controllingthe growth of the company they founded (e.g.,Begley and Boyd, 1987; Carland et al., 1984).The key for this study isn’t the particular orderingof the control and value-creation motivations,but that they can conflict and might lead to verydifferent outcomes. Furthermore, for founders whoare clearly motivated by either independence orfinancial gains, the decisions they should makeare much clearer than for founders with mixedmotivations.
Risk is another important factor in these founderdecisions. On the one hand, resource scarcityincreases the firm’s risk (Keats and Hitt, 1988)and should exacerbate the liability of newness(Stinchcombe, 1965). However, firm demise is notthe only risk faced by founders; many founders mayalso worry about the risk of losing control of theidea they conceived and the company they birthed,leading them to avoid attracting resources.31 Futureresearch could examine the risk profiles of each of
31 Connecting risk to the private benefits of control, Shaobo (2007)argues that “the private benefits of control actually are … the riskpremium of control.”
these paths and how they should affect resourcedecisions. Risk also affects the value of capitalinvestments via its impact on option values (Abelet al., 1996; McDonald and Siegel, 1986), whichcan be a substantial portion of the value of anentrepreneurial venture (Dixit and Pindyck, 1995).Furthermore, although attracting outside resourcesmay increase company survival, bringing investorsinto the startup can increase the pressure to “swingfor the fences”—to ratchet up the growth, usuallyincreasing the risk of complete failure. Replacinga founder-CEO—especially one unhappy withlosing control—may also heighten risks for thecompany. For these reasons, a founder’s refusal toattract outside resources and to remain CEO mayinstead reduce risks for the company. Research thatexamines these competing types of risk can helpshed further light on this tradeoff.
ACKNOWLEDGEMENTS
Thank you to Ben Esty, Teresa Amabile, LyndaApplegate, Matt Marx, Tom Eisenmann, Bill Kerr,Sam Garg, Magnus Torfason, Tom Nicholas, andseminar participants at Hong Kong University ofScience and Technology and at the University ofSouthern California for their invaluable commentson early drafts of the paper. Fifteen years of deepappreciation to Aaron Lapat, Bill Holodnak, MikeDipierro, Furqan Nazeeri, and Evan Brown for theirsupport and assistance with data collection. Thankyou also to Andrew Marder for his multi-prongedand dedicated research assistance and to Bill Simp-son and Xiang Ao for their input throughout theanalysis phase.
REFERENCES
Abel AB, Dixit AK, Eberly JC, Pindyck RC. 1996.Options, the value of capital, and investment. QuarterlyJournal of Economics 111(3): 753–777.
Abetti PA. 2005. The creative evolution of Steria. Creativ-ity and Innovation Management 14(2): 191–204.
Adomdza GK. 2008. The role of affect in commercializ-ing new ideas. Unpublished PhD diss., University ofWaterloo, Ontario, Canada.
Aghion P, Bolton P. 1992. An incomplete contractsapproach to financial contracting. Review of EconomicStudies 59: 473–494.
Aldrich HE, Fiol CM. 1994. Fools rush in? The institu-tional context of industry creation. Academy of Man-agement Review 19(4): 645–670.
Copyright © 2015 John Wiley & Sons, Ltd. Strat. Mgmt. J., 38: 255–277 (2017)DOI: 10.1002/smj
The Throne vs. the Kingdom 275
Amit R, Glosten L, Muller E. 1990. Entrepreneurial ability,venture investments, and risk sharing. ManagementScience 36(10): 1232–1245.
Amit R, MacCrimmon KR, Zietsma C, Oesch J. 2000.Does money matter? Wealth attainment as the motivefor initiating growth-oriented technology ventures.Journal of Business Venturing 16: 119–143.
Bagley CE, Dauchy CE. 2003. The Entrepreneur’s Guideto Business Law. Thomson Learning: Ontario.
Baker M, Gompers PA. 1999. Executive ownership andcontrol in newly public firms: the role of venturecapitalists. November 1999 (First draft in 1998.).
Baker M, Gompers PA. 2003. The determinants of boardstructure at the initial public offering. Journal of Lawand Economics 46(2): 569–598.
Barclay MJ, Holderness CG. 1989. Private benefits fromcontrol of public corporations. Journal of FinancialEconomics 25: 371–395.
Begley TM, Boyd DP. 1987. Psychological characteristicsassociated with performance in entrepreneurial firmsand smaller businesses. Journal of Business Venturing2: 79–93.
Berle A, Means GC. 1932. The Modern Corporation andPublic Property. Macmillan: New York.
Bettis RA, Prahalad CK. 1995. The dominant logic: retro-spective and extension. Strategic Management Journal16(1): 5–14.
Bhide A. 2000. The Origin and Evolution of New Busi-nesses. Oxford University Press: New York, NY.
Blanchflower DG, Oswald AJ. 1998. What makes anentrepreneur? Journal of Labor Economics 16(1),pp. 26–60.
Boeker W. 1989. Strategic change: the effects of foundingand history. Academy of Management Journal 32:489–515.
Boeker W, Karichalil R. 2002. Entrepreneurial transi-tions: factors influencing founder departure. Academyof Management Journal 45(3): 818–826.
Brush CG, Greene PG, Hart MM, Haller HS. 2001. Frominitial idea to unique advantage: the entrepreneurialchallenge of constructing a resource base. Academy ofManagement Executive 15(1): 64–80.
Carland JW, Hoy F, Boulton WR, Carland JC. 1984. Dif-ferentiating entrepreneurs from small business owners:a conceptualization. Academy of Management Review9: 354–359.
Cattaneo MD. 2010. Efficient semiparametric estimationof multi-valued treatment effects under ignorability.Journal of Econometrics 155(2): 138–154.
Clercq DD, Fried VH, Lehtonen O, Sapienza HJ.2006. An entrepreneur’s guide to the venture capitalgalaxy. Academy of Management Perspectives 20(3):90–112.
Coff RW. 1999. When competitive advantage doesn’t leadto performance: the resource-based view and stake-holder bargaining power. Organization Science 10(2):119–133.
Cooper AC, Bruno AV. 1977. Success among high-technology firms. Business Horizons 20(2): 16–22.
Davidsson P, Honig B. 2003. The role of social andhuman capital among nascent entrepreneurs. Journal ofBusiness Venturing 18: 301–331.
Dixit AK, Pindyck RS. 1995. The options approach tocapital investment. Harvard Business Review 73(3):105–115.
Edmondson AC, McManus SE. 2007. Methodological fitin management field research. Academy of ManagementReview 32(4): 1155–1179.
Eisenberg T, Sundgren S, Wells MT. 1998. Large boardsize and decreasing firm value in small firms. Journalof Financial Economics 48: 35–54.
Eisenhardt KM, Schoonhoven CB. 1990. Organizationalgrowth: linking founding team, strategy, environment,and growth among U.S. semiconductor ventures,1978–1988. Administrative Science Quarterly 35:504–529.
Evans DS, Jovanovic B. 1989. An estimated model ofentrepreneurial choice under liquidity constraints. Jour-nal of Political Economy 97(4): 808–827.
Fama EF, Jensen ML. 1983. Separation of ownership andcontrol. Journal of Law and Economics 26: 301–325.
Garg S. 2013. Venture boards: distinctive monitoringand implications for firm performance. Academy ofManagement Review 38(1): 90–108.
George G. 2005. Slack resources and the performance ofprivately held firms. Academy of Management Journal48(4): 661–676.
Gompers P. 1995. Optimal investment, monitoring, andthe staging of venture capital. Journal of Finance 50:1461–1489.
Gompers P, Lerner J. 1999. The Venture Capital Cycle.MIT Press: Boston, MA.
Gompers P, Lerner J, Scharfstein D, Kovner AR. 2010.Performance persistence in entrepreneurship and ven-ture capital. Journal of Financial Economics 96(1):18–32.
Gorman M, Sahlman WA. 1989. What do venture capital-ists do? Journal of Business Venturing 4(4): 231–248.
Graham J, Harvey C. 2001. The theory and practice ofcorporate finance: evidence from the field. Journal ofFinancial Economics 60: 187–243.
Grossman SJ, Hart OD. 1988. One share-one vote andthe market for corporate control. Journal of FinancialEconomics 20: 175–202.
Gulati R, Sytch M. 2007. Dependence asymmetry and jointdependence in interorganizational relationships: effectsof embeddedness on a manufacturer’s performancein procurement relationships. Administrative ScienceQuarterly 52(1): 32–69.
Gulati R, Wang L. 2003. Size of the pie and shareof the pie: implications of structural embeddednessfor value creation and value appropriation in jointventures. Research in the Sociology of Organizations20: 209–242.
Hall RE, Woodward SE. 2010. The burden of the nondiver-sifiable risk of entrepreneurship. American EconomicReview 100(June): 1163–1194.
Hambrick DC, Mason PA. 1984. Upper echelons: the orga-nization as a reflection of its top managers. Academy ofManagement Review 9: 193–206.
Hamilton BH. 2000. Does entrepreneurship pay? Anempirical analysis of the returns to self-employment.Journal of Political Economy 108(3): 604–631.
Copyright © 2015 John Wiley & Sons, Ltd. Strat. Mgmt. J., 38: 255–277 (2017)DOI: 10.1002/smj
276 N. Wasserman
Harrigan KR. 1983. Research methodologies for contin-gency approaches to business strategy. Academy ofManagement Review 8(3): 398–405.
Hellmann T. 1998. The allocation of control rights inventure capital contracts. RAND Journal of Economics29: 57–76.
Higgins RC. 1977. How much growth can a firm afford?Financial Management 6(3): 7–16.
Higgins RC. 1998. Analysis for Financial Management.Irwin/McGraw-Hill: Boston, MA.
Hillman A, Dalziel T. 2003. Board of directors andfirm performance: integrating and resource dependenceperspectives. Academy of Management Review 28(3):383–396.
Hillman AJ, Withers MC, Collins BJ. 2009. Resourcedependence theory: a review. Journal of Management35: 1404–1427.
Horwitz SK, Horwitz IB. 2007. The effects of teamdiversity on team outcomes: a meta-analytic reviewof team demography. Journal of Management 33(6):987–1015.
Hsu D. 2004. What do entrepreneurs pay for ven-ture capital affiliation? Journal of Finance 59(4):1805–1844.
Hsu D, Roberts DR, Eesley D. 2007. Entrepreneurs fromtechnology-based universities: evidence from MIT.Organization Science 6(3): 768–788.
Hurst E, Li G, Pugsley B. 2010. Using expendituresto estimate missing self employed income. Workingpaper, University of Chicago, IL.
Imbens GW, Wooldridge JM. 2009. Recent developmentsin the econometrics of program evaluation. Journal ofEconomic Literature 47(1): 5–86.
Jensen M. 1993. The modern industrial revolution, exit,and the failure of internal control systems. Journal ofFinance 48: 831–880.
Jensen M, Meckling W. 1976. Theory of the firm: man-agerial behavior, agency costs and ownership structure.Journal of Financial Economics 3: 305–360.
Kaplan SN, Stromberg P. 2003. Financial contractingtheory meets the real world: an empirical analysis ofventure capital contracts. Review of Economic Studies70: 281–315.
Kaplan SN, Strömberg P., Sensoy BA. 2002. How welldo venture capital databases reflect actual investments?Available at: SSRN 939073.
Katila R, Rosenberger JD, Eisenhardt K. 2008. Swimmingwith sharks: technology ventures, defense mecha-nisms and corporate relationships. AdministrativeScience Quarterly 53: 295–332.
Keats BW, Hitt MA. 1988. A causal model of link-ages among environmental dimensions, macro organi-zational characteristics, and performance. Academy ofManagement Journal 31: 570–598.
Kirilenko AA. 2001. Valuation and control in venturefinance. Journal of Finance 56(2): 565–587.
Kirzner IM. 1973. Competition and Entrepreneurship.University of Chicago Press: Chicago, IL.
Kogut B. 1988. Joint ventures: theoretical and empiri-cal perspectives. Strategic Management Journal 9(4):319–332.
Lease RC, McConnell JJ, Mikkelson W. 1983. The marketvalue of control in publicly-traded corporations. Jour-nal of Financial Economics 11: 439–471.
Lerner J. 1995. Venture capitalists and the oversight ofprivate firms. Journal of Finance 50: 301–318.
Lindh T, Ohlsson H. 1998. Self-employment and wealthinequality. Review of Income and Wealth 44(1): 25–42.
March JG, Shapira Z. 1987. Managerial perspectives onrisk and risk taking. Management Science 33(11):1404–1418.
March JG, Simon HA. 1958. Organizations. Wiley: NewYork.
McDonald R, Siegel D. 1986. The value of waitingto invest. Quarterly Journal of Economics 101(4):707–728.
Miller D. 1991. The Icarus Paradox: How ExceptionalCompanies Bring About Their Own Downfall. Harper-Business: New York.
Mintzberg H, Waters JA. 1982. Tracking strategy in anentrepreneurial firm. Academy of Management Journal25(3): 465–499.
Misangyi VF, Elms H, Greckhamer T, Lepine JA. 2006.A new perspective on a fundamental debate: a mul-tilevel approach to industry, corporate, and businessunit effects. Strategic Management Journal 27(6):571–590.
Morck R, Shleifer A, Vishny R. 1988. Management owner-ship and market valuation: an empirical analysis. Jour-nal of Financial Economics 20: 293–315.
Moskowitz TJ, Vissing-Jorgensen A. 2002. The returnsto entrepreneurial investment: a private equity pre-mium puzzle? American Economic Review 92(4):745–778.
Nohria N, Gulati R. 1996. Is slack good or bad forinnovation? Academy of Management Journal 39(5):1245–1264.
Ozcan P, Eisenhardt KM. 2009. Origin of alliance port-folios: entrepreneurs, network strategies, and firm per-formance. Academy of Management Journal 52(2):246–279.
Peteraf MA. 1993. The cornerstones of competitive advan-tage: a resource-based view. Strategic ManagementJournal 14(3): 179–191.
Pfeffer J. 1972. Size and composition of corporate boardsof directors. Administrative Science Quarterly 17:218–229.
Pfeffer J, Salancik GR. 1978. The External Control ofOrganizations: A Resource Dependence Perspective.Harper and Row: New York, NY.
Qu WG, Pinsonneault A, Oh W. 2011. Influence ofindustry characteristics on information technology out-sourcing. Journal of Management Information Systems27(4): 99–127.
Roberts EB 1988. The personality and motivations oftechnological entrepreneurs. Working paper #2078–88,M.I.T. Sloan: Boston, MA.
Roberts EB. 1991. Entrepreneurs in High-Technology.Oxford University Press: New York.
Romanelli E. 1989. Environments and strategies of organi-zation start-up: effect on early survival. AdministrativeScience Quarterly 34(3): 369–387.
Copyright © 2015 John Wiley & Sons, Ltd. Strat. Mgmt. J., 38: 255–277 (2017)DOI: 10.1002/smj
The Throne vs. the Kingdom 277
Rosenbaum PR, Rubin DB. 1983. The central role of thepropensity score in observational studies for causaleffects. Biometrika 70(1): 41–55.
Rousseau DM, Shperling Z. 2003. Pieces of the action:ownership and the changing employment rela-tionship. Academy of Management Review 28(4):553–570.
Rubin DB. 1973. The use of matched sampling andregression adjustment to remove bias in observationalstudies. Biometrics 29(1): 185–203.
Rubin DB. 1987. Multiple Imputation for Nonresponse inSurveys. Wiley: New York.
Ruef M. 2010. The Entrepreneurial Group: Social Iden-tities, Relations, and Collective Action. Princeton, NJ:Princeton University Press.
Sapienza HJ, Korsgaard MA, Forbes DP. 2003. Theself-determination motive and entrepreneurs’ choice offinancing. In Cognitive Approaches to Entrepreneur-ship Research (Volume 6), Katz JA, Shepherd D (eds).Elsevier Science & Technology Books: Burlington,MA; 105–138.
Schmidt JB, Calantone RJ. 2002. Escalation of commit-ment during new product development. Journal of theAcademy of Marketing Science 30(2): 103–118.
Schumpeter J. 1942. Capitalist, Socialism, and Democ-racy. Harper & Brothers: New York.
Shane S, Venkataraman S. 2000. The promise ofentrepreneurship as a field of research. Academy ofManagement Review 25: 217–226.
Shaobo L. 2007. The paradox of private benefits ofcontrol and excessive benefits of control: a new the-oretical explanation of large shareholders’ expropri-ation of small ones. Economic Research Journal 2:85–96.
Sherman A. 2005. Raising Capital (2nd edn). New York:Amacom.
Shy O, Stenbacka R. 2003. Strategic outsourcing. Journalof Economic Behavior & Organization 50(2): 203–224.
Sorenson O, Stuart TE. 2008. Bringing the context back in:settings and the search for syndicate partners in venturecapital investment networks. Administrative ScienceQuarterly 53(2): 266–294.
StataCorp. 2013. Stata 13 Base Reference Manual. StataPress: College Station, TX.
Staw BM. 1981. The escalation of commitment to acourse of action. Academy of Management Review 6(4):577–587.
Stevenson HH, Jarillo JC. 1990. A paradigm ofentrepreneurship: entrepreneurial management.Strategic Management Journal 11(1): 17–27.
Stinchcombe AL. 1965. Organizations and social structure.In Handbook of Organizations, March JG (ed). RandMcNally: Chicago, IL; 153–193.
Stuart T, Hoang H, Hybels RC. 1999. Interorganizationalendorsements and the performance of entrepreneurialventures. Administrative Science Quarterly 44:315–349.
Tagiuri R. 1965. Value orientations and the relationshipof managers and scientists. Administrative ScienceQuarterly 10(1): 39–51.
Unger JM, Rauch A, Frese M, Rosenbusch N. 2011.Human capital and entrepreneurial success: ameta-analytical review. Journal of Business Venturing26: 341–358.
Venkataraman S. 1997. The distinctive domainof entrepreneurship research. In Advances inEntrepreneurship, Firm Emergence, and Growth(Volume 3). JAI Press: Greenwich, CT; 119–138.
Wasserman N. 2003. Founder-CEO succession and theparadox of entrepreneurial success. Organization Sci-ence 14(2): 149–172.
Wasserman N. 2012. The Founder’s Dilemmas: Anticipat-ing and Avoiding the Pitfalls That Can Sink a Startup.Princeton, NJ: Princeton University Press.
Wasserman NT, Fynn R 2007. Les is more, times four.Harvard Business School Case 807-173.
Wasserman N, McCance H. 2005. Founder-CEO succes-sion at Wily technology. Harvard Business School Case805-150.
Wong A. 2002. Angel finance: the other venture capital.Graduate school of business. Unpublished PhD diss.,University of Chicago, IL.
Wong A, Bhatia M, Freeman Z. 2009. Angel finance:the other venture capital. Strategic Change 18 (SpecialIssue: Entrepreneurial Finance): 221–230.
Yermack D. 1996. Higher market evaluation of companieswith a small board of directors. Journal of FinancialEconomics 40: 185–211.
Copyright © 2015 John Wiley & Sons, Ltd. Strat. Mgmt. J., 38: 255–277 (2017)DOI: 10.1002/smj