Embed Size (px)
Citation preview

1
THE THREE DIMENSIONS OF MULTIMEDIA TEACHING OF STATISTICS
Nathaniel Derby, Wolfgang Härdle, and Bernd Rönz
Institut für Statistik und Ökonometrie
Wirtschaftswissenschaftliche Fakultät
Spandauer Straße 1
Humboldt-Universität zu Berlin
10178 Berlin
Germany
Abstract
Statistics is often difficult for students, since it requires coordination of quantitative
and graphical insights with mathematical ability. Furthermore, ever-increasing special
knowledge of statistics is demanded, since data of increasing complexity and size need to be
understood and analyzed. In the face of this changing demand on educated statisticians, our
methods of teaching statistics is obsolete, continuing to rely on the blackboard, textbooks, and
handwritten homework. With only these materials, it’s impossible to teach some modern
statistical techniques without confusing the student in a plethora of formulas and numbers.
There is clearly a need for introducing more adaptive teaching methods to address this
demand. In this article, we isolate three important dimensions of teaching statistics and
propose how to map them onto a web-language-based computer teaching aid, called
MM*STAT.
1. Introduction
Statistics is the science of extracting information from highly complex structured data.
In this information age, where we’re daily exposed to data of ever-increasing complexity, the
understanding of statistics and data analysis is crucial not only for those who wish to thrive in
society, but for society in general. Indeed, it’s not only important that politicians, doctors,
and lawyers thoroughly understand the data analyses presented to them daily, but equally
2
important that the public understands facts and figures presented (and misrepresented) to them
in the media (Tufte, 1983). For an educated society, an effective education in statistics is a
necessity for students of all subjects. However, most students find statistics difficult and
uninspiring. Some difficulty should be expected, since what is learned in a beginning
statistics/probability class often conflicts with pre-conceived ideas about chance and data
analysis. Unfortunately, this difficulty is often exacerbated by the fact that statistics
instruction is dependent on relatively ineffective blackboard-based lectures and paper-and-
pencil homework, even though the subject matter has become increasingly complicated since
then (Härdle, Klinke and Marron, 1999). More simply put, a blackboard can only do so
much.
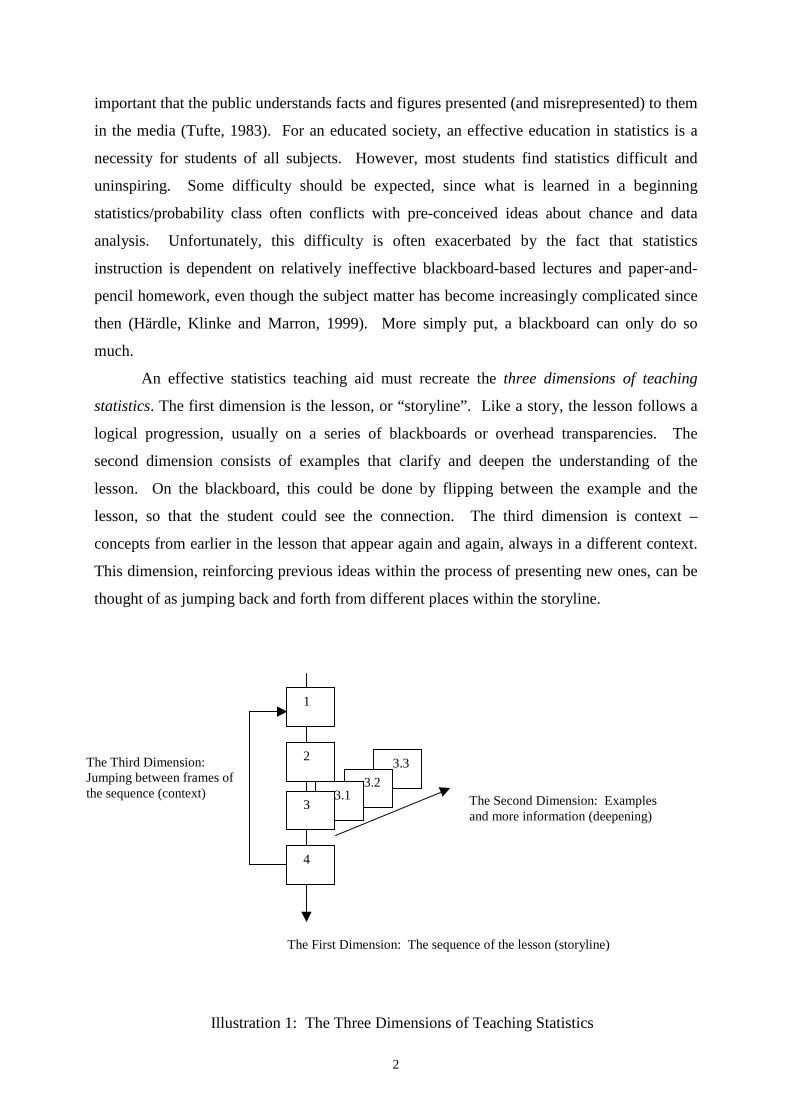
An effective statistics teaching aid must recreate the three dimensions of teaching
statistics. The first dimension is the lesson, or “storyline” . Like a story, the lesson follows a
logical progression, usually on a series of blackboards or overhead transparencies. The
second dimension consists of examples that clarify and deepen the understanding of the
lesson. On the blackboard, this could be done by flipping between the example and the
lesson, so that the student could see the connection. The third dimension is context –
concepts from earlier in the lesson that appear again and again, always in a different context.
This dimension, reinforcing previous ideas within the process of presenting new ones, can be
thought of as jumping back and forth from different places within the storyline.
The Third Dimension:Jumping between frames ofthe sequence (context)
3.3
3.2 3.1
1
2
3
4
The First Dimension: The sequence of the lesson (storyline)
The Second Dimension: Examplesand more information (deepening)
Illustration 1: The Three Dimensions of Teaching Statistics

3
A web-language-based solution is a natural choice for improving the quality and
effectiveness of an education in statistics. Indeed, the biggest difficulty for beginning
students of statistics is often the coordination of quantitative and graphical insights with
mathematical skills. A well-designed use of the computer as a teaching aid can make this
learning process easier by allowing the student to develop these insights without getting
bogged down in the mathematics. Moreover, as statistical problems in general are using
mathematical formulas and data sets that grow in size and complexity, computers are essential
to statistics. Computers are also essential to statistics for their easy access to real data sets,
software, and literature, through the World-Wide Web. Thus, getting a student acquainted
with statistical computing from the onset (i.e. the beginning statistics class) is ideal. In the
interests of widest accessibility, we shouldn’ t restrict ourselves to a particular platform.
Indeed, even though the windows environment is popular, there are still plenty of people who
use Macs, UNIXs, and other platforms. Since the only thing these various platforms have in
common is a web browser, focusing a solution on a web-based language not only ensures
greatest accessibility, but also allows for the availability of web tools. Furthermore, the
availability of the statistics teaching aid on the internet could support the exchangeability
between several geographically dispersed universities and other institutions. For instance, it’s
not unusual for a faculty member to give a course at another location – the instructor could
simply use the internet to present the course, to modify statistical models, and carry out
computational and empirical exercises at his/her own university.
For an effective teaching aid, these three dimensions must be mapped onto a
computer. In particular, the computer system must be interactive. Corresponding to the
second dimension (examples that deepen the understanding of a concept), in which the
teacher asks questions to the students, there must be an aspect of the computer program which
allows for interaction with the student or teacher. That is, the student or teacher should be
able to try out different ideas, and see what happens. Moreover, for those with advanced
computer skills, the student or teacher should be able to modify the examples, such as
changing the data sets, parameters, etc. This concept of interactive learning assures that the
student is actively participating in the learning process, rather than passively reading or
hearing about something outside of his/her control. This example of learning by doing, where
motivation is led by curiosity, has proven to be most effective in the learning process (Härdle,
Klinke, and Marron, 1999).
Ideally, with such a “ three-dimensional” web-language-based teaching aid, the
professor/teacher would be able to accomplish the following goals:

4
1. Move from classroom examples to more elaborate statistical data analysis
2. Handle more data and examples as an integral part of the instruction
3. Encourage and emphasize more statistical thinking, statistical concepts, and logical
inferences from the analysis
4. Demonstrate in detail the assumptions connected with the various statistical methods and
models
5. Concentrate more on the interaction with the students and their difficulties in
understanding
The student would be able to accomplish the following goals, corresponding to the three
dimensions:
1. Review the content of the lectures at his/her own pace from the same materials used to
teach the class
2. Perform many examples with several data sets, or with changed parameters of the
statistical methods applied, and view the results
3. Discover relations between the course subjects by him-/herself
2. The Present Situation
The content of the standard introductory statistical courses for a typical university is as
follows, each with 2 hours of lecture and 1 hour of tutorials per week over one semester:
STATISTICS I:
• Basic terms
• Descriptive statistics
• One-dimensional frequency distributions and their properties
• Two-dimensional frequency distributions and their properties
• Analysis of relationships between variables
• Introduction to time series analysis
• Combinatorics
• Basic concepts of probability
5
STATISTICS II:
• Random variables and important probability distributions
• Statistical Inference
• Sampling theory
• Estimation
• Testing hypotheses
The present situation of teaching in most universities can be characterized by stating that
computer-assisted teaching is not an essential part of the introductory courses. In the lectures,
transparencies are often shown on an overhead projector which contain the following:
• An outline of the lecture in short sentences or catch phrases
• The important formulas
• Graphic representations
• Examples (case studies, data sets, various parameters and distributions, etc.)
Typically, few examples are computer-based, and are exclusively presented by the lecturer.
These examples are mostly graphical, showing the effect of changing assumptions and
parameters on distributions and confidence intervals.
The teaching material for the students often includes the following: An outline of the
lectures, selected textbook references, a collection of formulas, printed versions of the
transparencies, and prepared exercises with solutions. Sometimes this material can also be
downloaded off the internet, and sometimes there are some exercises to be done with the
computer. However, these computer supplements are all too often not stressed in the class,
not used in the lecture, and thus used by few students. With only this ineffective use of
computers for the students, it’s clear we need to revise the system.
3. The Proposal: MM*STAT
There are many existing projects and attempts at creating a web-language-based
teaching aid to statistics which can be revealed by a quick look through the internet. These
include http://www.stat.sc.edu/~west/webstat/,

6
http://www.stat.berkeley.edu/users/stark/Java/index.htm, and
http://www.ruf.rice.edu/~lane/stat_sim/index.html. However, these attempts fall short of our
goals in two aspects: First, since many of these attempts utilize a Java applet plug-in in an
HTML document, they cannot be modified by the teacher unless he/she knows how to
program in a low-level computer language (frequently not the case). Second, they cannot be
modified by the teacher, and they don’ t incorporate a “storyline” . That is, these three
attempts give interactive examples, but aren’ t accompanied by a lesson. We would like an aid
that encompasses all three dimensions of teaching and learning (as described above), with
possibilities for interaction and modification.
Thus, we are left to design our own computerized teaching aid, and to implement it
into the classroom. We’ve called this product MM*STAT, from Method and Data
Technologies (MD*Tech).
Details of the project
The following elements are implemented in the electronic statistics course to attain the
aforementioned goals:
a) Hypertext functionality throughout all pages:
• Links from each paragraph in the list of contents to the relevant page
• Links from a keyword on a page to a previous page where this keyword was explained
• The search for keywords
• A register of all keywords (alphabetically sorted) from where the student can go
directly to the relevant page
b) More information
Upon clicking on such a button, a new page appears, presenting more information
concerning the content of the current page (e.g. more textual explanations or a derivation
of a formula and so on). Links to relevant literature available on-line are also inserted in
this part.
c) Examples related to the content of the pages
If possible, all the examples should be based on real data sets. We consider four kinds of
examples:
1. Fully explained examples
These examples are related to the content of the current page or the last few pages. As
the term implies, the examples are fully explained: beginning with the illustration of
7
the data, continuing with the exact argumentation of the statistical methods to be
applied, and ending with the interpretation of the results.
2. Enhanced examples
These examples are fully explained as well, but go into more depth than the first level
of examples. At least one of the following apply to this type of example:
• They are extended to the overall content of a paragraph
• They contain a comparison of various statistical methods, models or parameters
(e.g. mean, median and mode)
• They show the application of the same statistical method on different variables or
on the breakdown of a variable by a factor, and the comparison of the results (e.g.
an overall income distribution and the income distributions broken down according
to sex, together with range, quartiles, mean, standard deviation, outliers, histogram,
and boxplot)
3. Interactive examples
This kind of example allows the student to change certain features interactively for a
repeated application of the statistical methods or models presented on the current page
or few previous pages. These examples may include the following:
• Usage of the same data set as in the fully explained or enhanced example, but with
different applications of the variables
• Choice of data sets
• In case of grouped data, changing the number of groups or the group width and
showing the resulting effect by histograms
• ������������� ����������������������������� �!�"���#�$��%�"�&�(')�+*,�* �����&-��&� ���.�"���/���&�)���+01���"�!� �
ibution; n
and/or p in the binomial distribution)
• Transformation of variables and comparison to the distribution of the original
variable
• Changing the intercept and/or the slope of a regression line of Y on X and showing
the resulting residuals
• Changing the confidence level and/or the sample size for a confidence interval
• Choosing a different significance level of hypothesis tests or the transition from a
two-sided to an one-sided test
The opportunities for such interactive examples are numerous. The statistical server
tool behind this teaching aid is XploRe, developed at MD*Tech. After submitting the
modification to XploRe, a new output and/or graphical presentation is displayed.
8
A more technical explanation of this kind of examples can be found in Müller,
Marlene (1998), or on http://ise.wiwi.hu-berlin.de/~marlene/publications.html.
4. Programmable examples
This kind of examples is similar to the interactive examples, but the student can
modify the XploRe quantlet code for his/her special purposes.
Of course, b) and c) will only appear when necessary.
d) Multiple choice questions at the end of the paragraphs
This should give the student the opportunity to check his/her knowledge.
e) A glossary
f) An introductory page with general explanations of the electronic course
g) A help system
Because information is better absorbed if receptive to more than one of the senses, the
following are being developed:
h) Video sequences
i) Sound for auditory explanations
Furthermore, we are considering the following ideas for future development:
• the installation of a question-answer-page, where the student can ask us questions
This page would simultaneously give us feedback on the comprehension of the statistical
methods and on the acceptance of the multimedia project.
• the installation of a page on which the student can take his/her own notes (to be saved on
the student's disk)
• the installation of a page on which the timing with the lecture during the current term is
given
• links to other subject areas for more information (for example, if we have a data set on
sharks, we can have a link to a web page on sharks)
Current Implementation
At the present time, MM*STAT is only available in German, being written for and
tested on students at the Humboldt-Universität zu Berlin, Germany. It will later be available
in English, as well. Here, we shall illustrate some of the details mentioned in the previous
section, already implemented.
Upon entering the system, the user is first presented with the following screen:

9
Illustration 2: Table of Contents
This is the standard contents page, in which the user can choose which lecture unit to review
within one of several given subject areas. Here, they include the following:
• Basic Concepts of Statistics
• One-dimensional Frequency Distributions
• Two-dimensional Frequency Distributions
• Time Series Analysis
• Combinatorics
• Basics of Probability Theory
The two “Theme” icons on the lower right are currently under development, and will
eventually lead to tables of contents for certain subject areas. For example, a table of contents
for time series analysis would include all contents from the “Time series” subject area, plus
various subtopics which are alluded to in the “Time series” subject area lecture units. This
way, a student can avoid becoming overwhelmed with superfluous material. Clicking on the
“Contents” icon on the bottom of the screen will always display this page. Each subject area
has a list of subtopics that can be displayed by clicking on the arrow to the left of it.
10
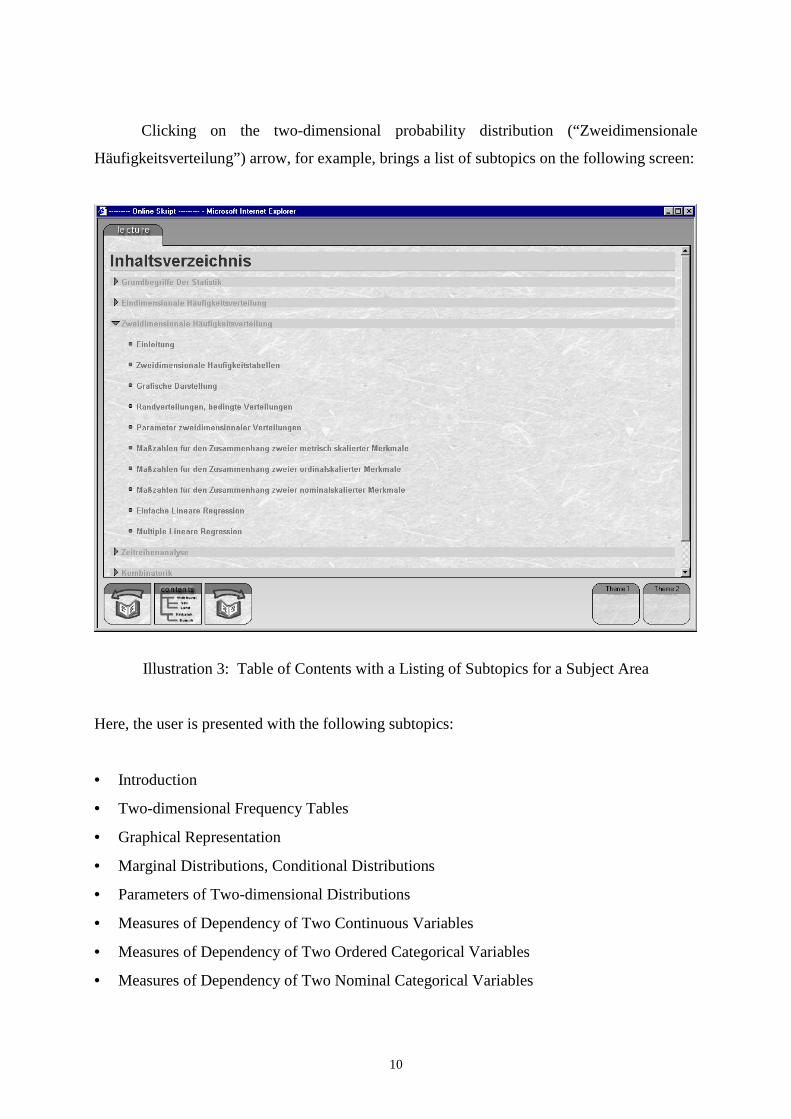
Clicking on the two-dimensional probability distribution (“Zweidimensionale
Häufigkeitsverteilung” ) arrow, for example, brings a list of subtopics on the following screen:
Illustration 3: Table of Contents with a Listing of Subtopics for a Subject Area
Here, the user is presented with the following subtopics:
• Introduction
• Two-dimensional Frequency Tables
• Graphical Representation
• Marginal Distributions, Conditional Distributions
• Parameters of Two-dimensional Distributions
• Measures of Dependency of Two Continuous Variables
• Measures of Dependency of Two Ordered Categorical Variables
• Measures of Dependency of Two Nominal Categorical Variables
11
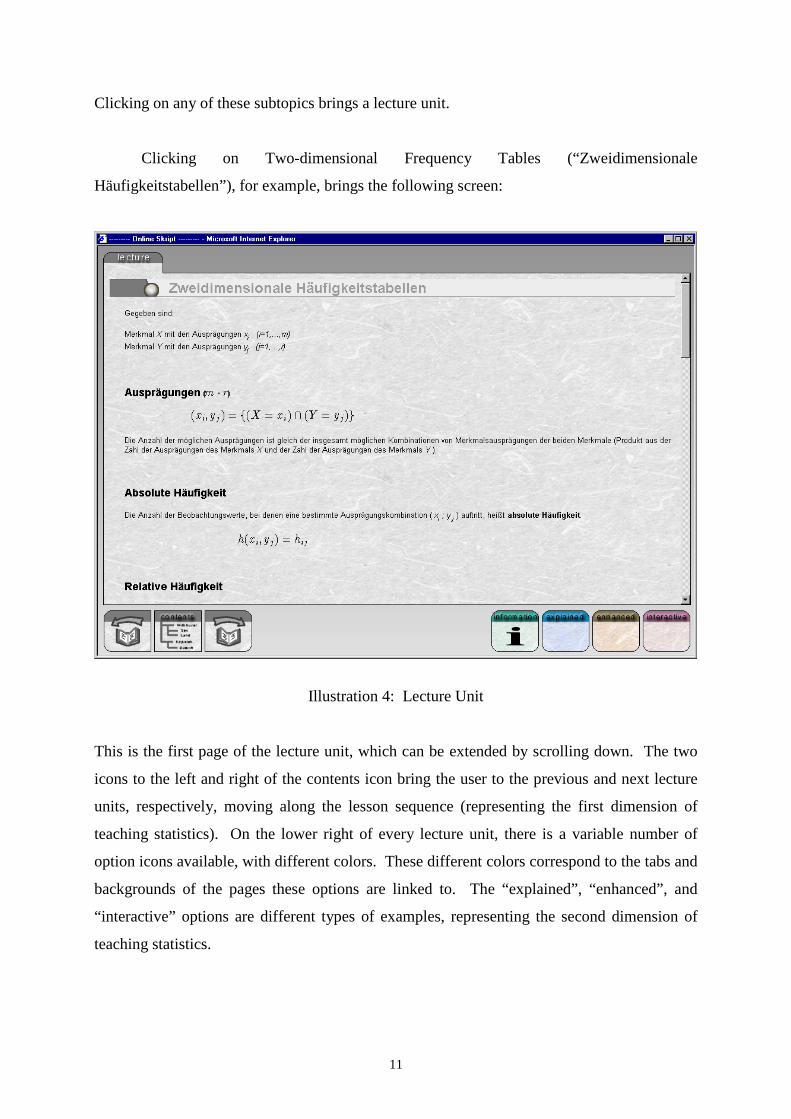
Clicking on any of these subtopics brings a lecture unit.
Clicking on Two-dimensional Frequency Tables (“Zweidimensionale
Häufigkeitstabellen”), for example, brings the following screen:
Illustration 4: Lecture Unit
This is the first page of the lecture unit, which can be extended by scrolling down. The two
icons to the left and right of the contents icon bring the user to the previous and next lecture
units, respectively, moving along the lesson sequence (representing the first dimension of
teaching statistics). On the lower right of every lecture unit, there is a variable number of
option icons available, with different colors. These different colors correspond to the tabs and
backgrounds of the pages these options are linked to. The “explained” , “enhanced”, and
“ interactive” options are different types of examples, representing the second dimension of
teaching statistics.

12
The “ Information” option gives extra information for the lesson, as explained earlier in
this paper:
Illustration 5: More Information
This is basically a clarification of the information in the lecture unit – a representation of the
second dimension of teaching statistics. The background and tab for this page is green, just
like the option icon on the previous page. Now we have actually two pages loaded into the
computer, which the user can switch to and from by clicking on the tabs above.

13
If the user clicks on the left tab, he/she returns to the first page, while leaving the
above page ready to be previewed again:
Illustration 6: Lecture Unit Revisited
This is the same page as before – it’s just scrolled down halfway. Now the user can switch
back and forth between pages by clicking on the above tab, and delete a page by double-
clicking on the tab. This switching back and forth between the lecture units and the examples
is once again the second dimension.

14
From the lecture unit page, the user can click on the explained icon to see a fully
explained example:
Illustration 7: Fully Explained Example
This is a fully explained example, part of the second dimension as described in the previous
sections. Now we have three tabs above, through which we can easily go back to the previous
two pages (i.e. the lecture page, and the information page).

15
Going back to the original page and clicking on the enhanced icon, we have an
enhanced example:
Illustration 8: Enhanced Example
This is a more detailed example than the fully explained example, as illustrated earlier in this
paper. It’s another part of the second dimension of teaching statistics.

16
Returning to the original page and then clicking on the interactive icon, we have the
interactive example:
Illustration 9: Interactive Example
Here, as described previously in this paper, the user has instructions for conducting an
interactive session with an XploRe server. More specifically, he/she is given information
about a variety of data sets – the number of observations, an explanation of the variables,
observed values of these variables, and the like. With XploRe, he/she can compute various
statistics from the data sets. This is another form of the second dimension, deepening the
user’s understanding through examples.
17
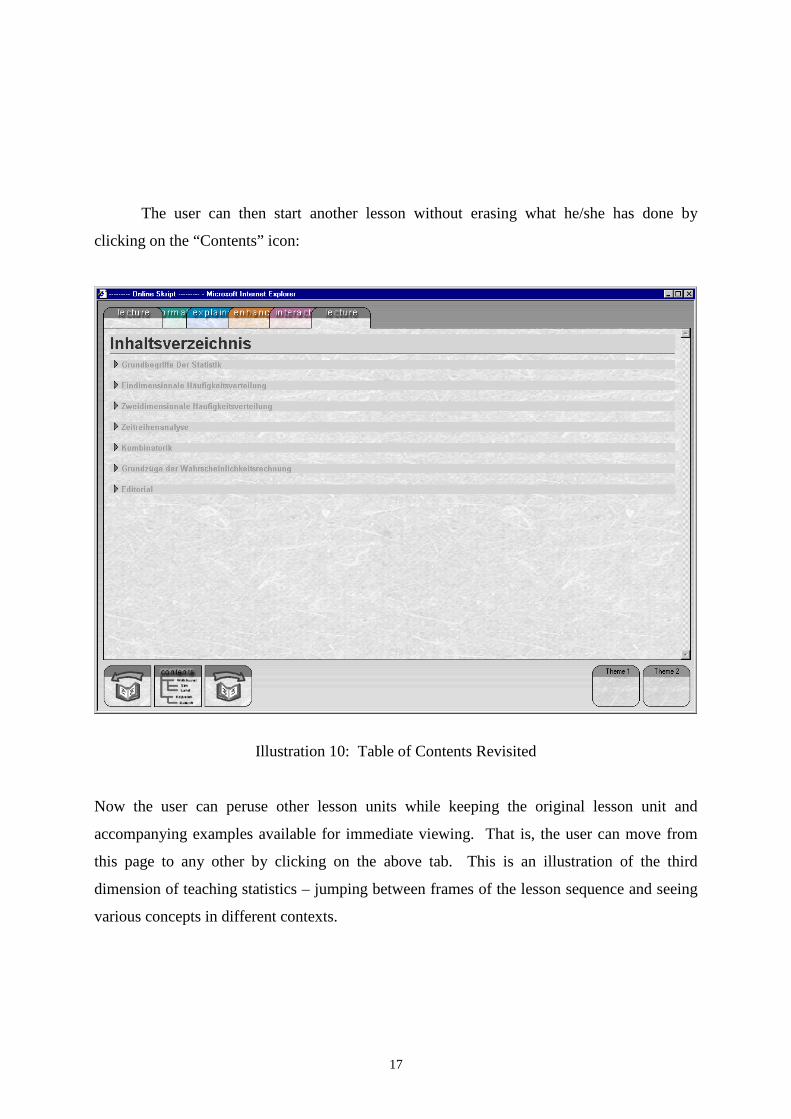
The user can then start another lesson without erasing what he/she has done by
clicking on the “Contents” icon:
Illustration 10: Table of Contents Revisited
Now the user can peruse other lesson units while keeping the original lesson unit and
accompanying examples available for immediate viewing. That is, the user can move from
this page to any other by clicking on the above tab. This is an illustration of the third
dimension of teaching statistics – jumping between frames of the lesson sequence and seeing
various concepts in different contexts.
18
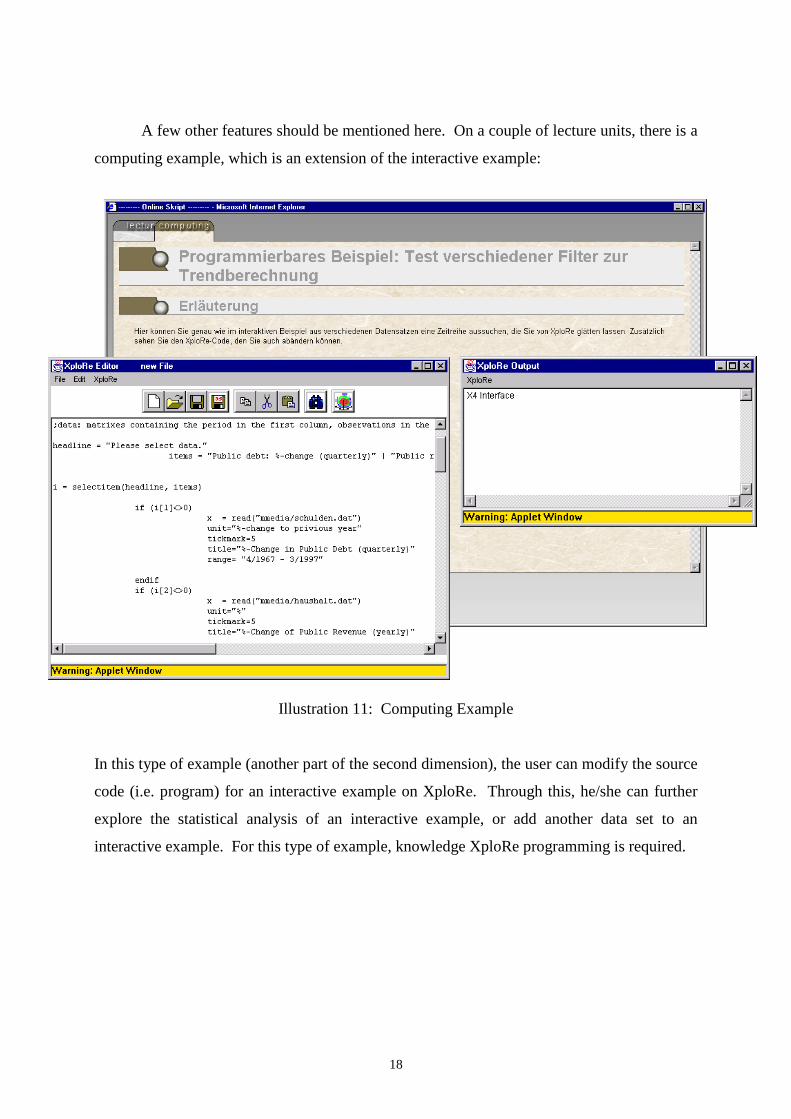
A few other features should be mentioned here. On a couple of lecture units, there is a
computing example, which is an extension of the interactive example:
Illustration 11: Computing Example
In this type of example (another part of the second dimension), the user can modify the source
code (i.e. program) for an interactive example on XploRe. Through this, he/she can further
explore the statistical analysis of an interactive example, or add another data set to an
interactive example. For this type of example, knowledge XploRe programming is required.

19
A video is also implemented, in the process of further development:
Illustration 12: Video
What is already implemented can be found on any internet Explorer platform with Java plug-
in under http://ise.wiwi.hu-berlin.de/~mmedia http://sfb.wiwi.hu-berlin.de. We would be
happy to receive any comments and suggestions.
4. References
Härdle, W., Klinke, S., and Marron, J. (1999). Connected Teaching of Statistics, recently
submitted to the Journal of Statistical Planning and Inference.
Müller, M. (1998). Computer-Assisted Statistics Teaching in Network Environment. In:
COMPSTAT 1998 Proceedings in Computational Statistics (ed. Payne, R., Green, P.),
77 - 88. Heidelberg: Physica-Verlag
(http://ise.wiwi.hu-berlin.de/~marlene/publications.html)
20
Müller, M. (1998). Teaching Statistics with XploRe. Math&Stats Newsletter, 21 - 24.
Glasgow: CTI Statistics; (http://www.stats.gla.ac.uk/cti/activities/articles.html)
Redfern, E.J., Bedford, S.E. (1994). Teaching and Learning through Technology: The
Development of Software for Teaching Statistics to Non-Specialist Students. In:
COMPSTAT 1994 Proceedings in Computational Statistics (ed. Dutter, R.,
Grossmann, W.), 408 - 414. Heidelberg: Physica-Verlag
Sonderforschungsbereich staff and projects (http://www.sfb.wiwi.hu-berlin.de)
Talbot, M. (1998). Statistics Training and the Internet. In: COMPSTAT 1998 Proceedings in
Computational Statistics (ed. Payne, R., Green, P.), 461 - 466. Heidelberg: Physica-
Verlag (http://www.bioss.sari.ac.uk/~mike/)
Tufte, Edward, The Visual Display of Quantitative Information, Graphics Press, New Haven,
1983.
West, R.W. (1997). Statistical Applications for the World Wide Web. In: Bulletin of the
International Statistical Institute, 51st Session Proceedings Book 2, 7 - 10, Turkey
5. Acknowledgements
We are grateful for discussions and seminars at UCSD and UCLA. Nathaniel Derby’s
research was supported by the Fulbright Commission, Bonn, Germany. Wolfgang Härdle’s
and Bernd Rönz’s research was supported by the Hochschulsonderprogramm III, Humboldt-
Universität zu Berlin, Germany.