Embed Size (px)
Citation preview

ICES CM2005/U:19 The three-dimensional GIS using sonar information for coastal fisheries Akira Hamano1, Hideaki Tanoue2, and Robert Kieser 3 1 National Fisheries University, Shimonoseki, Japan 2 Ocean Research Institute, The University of Tokyo, Japan 3 Pacific Biological Station, Fisheries and Oceans, Canada
Abstract The imaging of acoustic data in 3D is an effective tool for examining school distributions and behavior and to enhance coastal fisheries. For this purpose, we propose the combined use of sonar information and GIS techniques. The acoustic data for the present study were collected in November 2000 and July 2001 from a coastal area in the southern Japan Sea. A sector-scanning sonar was used to observe the distribution of fish schools. Computer based sonar images were created and a binarization method was used to define schools and school area. A 3D GIS was used to demonstrate the spatial distribution of the schools on a three dimensional map. The 3D view can provide an animated image for us. This image of fish schools could be easily observed from different points of view. From the visualization, it was found that (1) the distribution of schools was concentrated around a sea hill and an artificial reef, (2) about 56% of the fish schools are distributed in the layer upper 20m of the water column, (3) the number of school images was 344 on the starboard side, 129 on the port side, and 119 below the ship. The combined use of sonar information and GIS spatial analysis has provided a significant step in determining the real features of schools in the waters. Key words: 3D-GIS, sonar information, binarization method, artificial reef, coastal fisheries. Akira Hamano: National Fisheries University, 2-7-1, Nagata-honmachi, Shimonoseki, Yamaguchi 759-6595, Japan [tel +81 832 86 5111, fax: +81 832 86 7432, e-mail: [email protected]
1

Introduction
Acoustic methods have been used to determine the abundance and distribution of fish stocks for over 30 years (Reid and Simmonds, 1993). In particular, the quantitative echo-sounder has become an indispensable tool for estimating fish stocks. However, a downward-looking echo-sounder only collects information below the vessel and no information is obtained from the volume between transect. Information from a wide zone on either side of the survey vessel is required to assess fish behavior in the vicinity of the vessel and to provide better stock estimates. This is especially true in shallow coastal areas that are characterized by scattered and heterogeneous fish distributions. Scanning sonar can provide information from a wide swath. Acoustic information from a scanning sonar is a practical tool to observe the distribution and behavior patterns of the numerous species that inhabit the three-dimensional space below the surface.
Recent advances in acoustic remote sensing techniques and GIS have been substantial (Meaden, 1996; Nishida et al., 1999; Simmonds and MacLennan 2005), this enables us to obtain three-dimensional visualization of school distribution with relative ease. This paper shows the importance of sonar echograms for a clear understanding of school distributions, it will describe our procedures for combining sonar information and GIS, and it will demonstrate the visual effectiveness of a 3D GIS for underwater observations. A survey in a coastal area of southern Japan is used as an example, the spatial distribution of fish schools is presented in a three-dimensional map and the shape and relative location of fish schools are explored. Methods The echo data as the base of the present study were collected in November 2000 and July 2001, in a coastal area of the southern Japan Sea (Fig.1). The survey was conducted from the research vessel Kuroshio (119 tons) while traveling at 1.5-3.5 knots. The 24 parallel transects, 0.6-1.0 nautical miles in length, were laid out due east-west and placed at 0.1 mile intervals. A 162 kHz sector-scanning sonar (Furuno CH-34), a quantitative echo-sounder with 50kHz quasi-ideal beam (Furuno FQ-70), and a DGPS (JRC-4110 MK2) were used. The sonar images were automatically captured on videocassette. A scan converter (Digital Arts DSCO5d) then produced
2
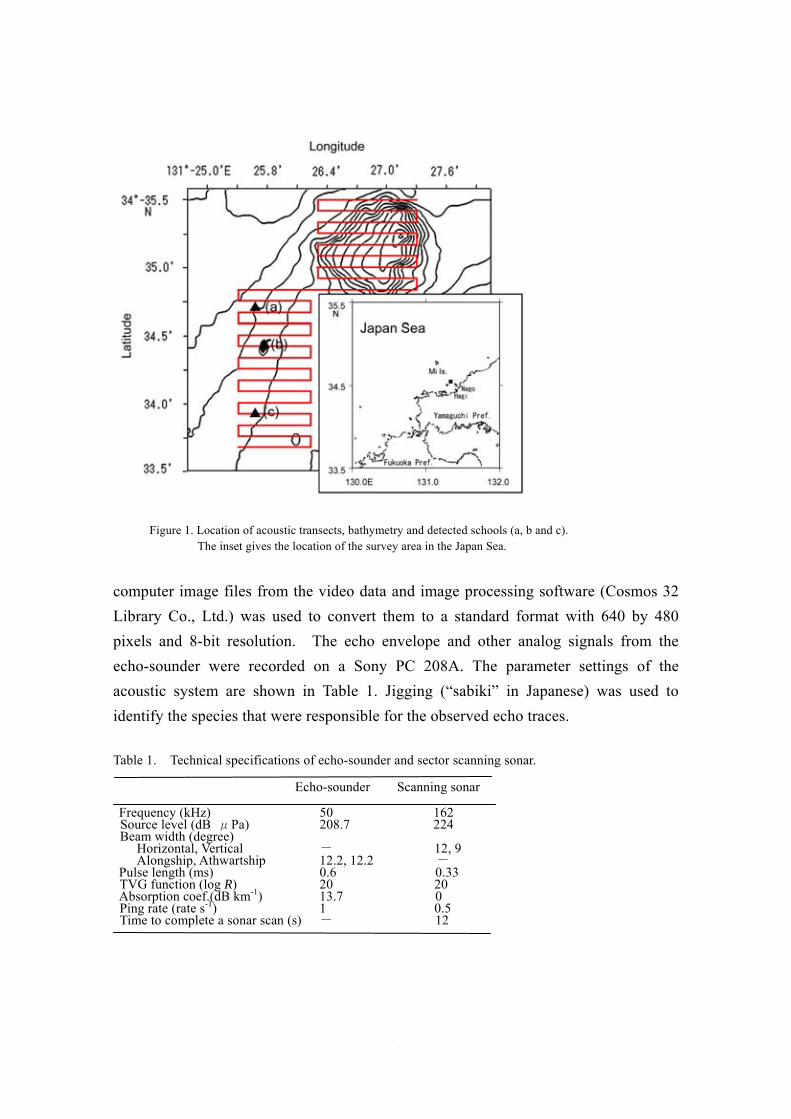
Figure 1. Location of acoustic transects, bathymetry and detected schools (a, b and c). The inset gives the location of the survey area in the Japan Sea.
computer image files from the video data and image processing software (Cosmos 32 Library Co., Ltd.) was used to convert them to a standard format with 640 by 480 pixels and 8-bit resolution. The echo envelope and other analog signals from the echo-sounder were recorded on a Sony PC 208A. The parameter settings of the acoustic system are shown in Table 1. Jigging (“sabiki” in Japanese) was used to identify the species that were responsible for the observed echo traces. Table 1. Technical specifications of echo-sounder and sector scanning sonar.
Echo-sounder Scanning sonar Frequency (kHz) 50 162
Source level (dB μPa) 208.7 224 Beam width (degree) Horizontal, Vertical - 12, 9 Alongship, Athwartship 12.2, 12.2 - Pulse length (ms) 0.6 0.33 TVG function (log R) 20 20 Absorption coef.(dB km-1) 13.7 0 Ping rate (rate s-1) 1 0.5 Time to complete a sonar scan (s) - 12
3

Processing of scanning sonar and quantitative echo-sounder information
The sonar image of a typical school is shown in Fig.2a. The school cross-section is in a vertical plane that is perpendicular to the transect direction. The 640 by 480 pixels of the digitized portion of the sonar image (Fig.2b) provide a distance by depth resolution of 10 by 4.6 cm. The 0 to 255 pixel color code provides an approximate measure for the volume backscatter strength, especially as pixel colors were only used to find the school boundary. Schools were defined by the binarization method (Tamura, 2002) that uses an optimal threshold for this purpose. The distance from the vessel to the center of the school, h, and the approximate school radius, r, were measured from the sonar image (Fig.2). The echogram from the quantitative echo-sounder was sectioned into cells of 1 ping (0.78 to 1.80m distance) by 1m depth, and the mean volume back-scattering strength (SV) from the quantitative echo-sounder was digitized to generate two-dimensional images with Echoview (Sonar Data Pty, Ltd.).
Figure 2. (a) Example of scanning sonar image from CRT display and (b) digitized pixel values
for the school shown in (a).
4

Three dimensional visualization and GIS
Sounder-detected bottom-depth and GIS software was used to create a map of the bottom topography. The triangulated irregular network (TIN) model was then employed to obtain 3D elevation maps (ArcGIS 8.0 and 3D Analyst, ESRI Co., Ltd.). Finally school position, depth and school cross-section were entered to show fish schools in their 3D environment.
Realistic estimates of school shape and volume were obtained from the sonar echogram as follows. A three-dimensional image was constructed by stacking a series of two-dimensional athwart-ship sonar images. Figure 3a shows the basic idea of our underwater acoustic tomography: Here three 2D images are stacked to provide a 3D image. A new layer was obtained every 12s. The data were stored as volume data in the computer, with x and y axes in the athwart-ship and along-ship (transect) direction, and with z as depth (Fig.3b). The three-dimensional software Slicer (Spyglass Software) was used to estimate the school volume by counting the number of voxcels in the school and multiplying the result by the voxcel volume.
Figure 3. (a) Principle of stacking 2D sonar data to obtain a 3D image. (b) Orientation of the
3D volume in relation to the transect.
Results Extracting school area from sonar-image with the binarization method Binarization is a process that reduces a range of pixel values to 0 or 1. The two values here correspond to black (intensity 0) and white (intensity 255). Binarization uses an optimal threshold to separate school and non-school (background) pixels. The objective function is Σσ2
B/σ2T, where the summation is over all intensity levels 0 to
5

I-1, I=256, σ2B is the between-class variance andσ2
T is the total variance. In this study the threshold that maximizes this function is 86. The suitability of this value was visually confirmed.
Fish schools detected by sector scanning sonar
During our survey, 592 sonar fish schools images were recorded. Of these 344, 129 and 119 are from the starboard side, the port side, and from below the vessel, respectively. The average school cross-section is 638 m2 and about 41% of all schools cross-sections are between 100 and 500 m2. The horizontal distribution of fish schools that is detected by the scanning sonar is shown by the irregular red areas in Fig. 4. As expected, school and transect locations at times coincide, however many schools are located between transects. Only schools that are at the transect location will be detected by the echo-sounder. This 2D map was used to guide our analyses with the 3D GIS.
Figure 4. 2D distribution of fish school detected by the sector scanning sonar.
6

Spatial distribution of fish schools
We hope that an understanding of the 3D spatial distribution of fish schools will lead to improvements in the standing stock estimation process (Gerlotto et al., 1999). Recent advances in sonar and computer technology have made computer readable sonar data much more available and affordable software provides effective tools for two and three dimensional visualization and analysis. The fish school cross-section images from scanning sonar provide the basic information for our 3D fish distribution maps. It was found valuable to view the 3D image from different distances, directions and altitudes to appreciate fish school shapes and their location with respect to each other and to their environment. From this visualization, it was founded that the distribution of schools were concentrated around the sea hill called Futasima guri and the artificial reef shown in Fig.5. About 56% of the fish schools were between the surface and 20 m depth (Fig.6).
Figure 5. 3D visualization of fish schools with bottom topography.
Depth Cross-section of fish schools
Artificial reef
Futashima‐guri
7

0
20
40
60
80
100
120
140
160
180
200
0 20 40 60
Depth (m)
Freq
uenc
y
three-dimensional visualization of individual schools is shown in (Fig.7). Table 2 give
hip
Table 2. Estimated dimension of schools. Depth, Athwartship and Alongship are maximum
Depth×Athwartship×Alongship Volume
As dimensions and volume estimates for the three schools that are shown at
locations a, b and c in Fig. 1. For these examples, school extent in depth, athwartsand alongship dimension are from 31 to 48, 90 to 109, and 47 to 120 m, respectively. School volume was between 35 and 73 m3.
Figure 6. a) Fish schools are shown in red and vertical bars indicate depth of those fish schools that are close to the observer. b) Frequency distribution of fish school depth.
school dimensions and volume is from the voxcel count as explained in the text and Figure 3.
(m) ×103 (m ) 3
(a) 31 × 90 × 120 35.2 (b) 46 × 109 × 47 66.2
×(c) 48 109 × 75 72.8
8

gure 7. Three-dimensional school images constructed from the scanning sonar information for
Fischools a, b and c. School density increases from green to yellow to red. The grey area gives the projection of the school on a horizontal plane that is located at the maximum depth shown.
9
Discussion
he three-dimensional analysis of fish schools is fundamental for the study of pelagic
y be degr
utions, it provides an exam
possible distortion of the image that results from
e
an
school images (Fig. 5 and 7) and dim
d
Tfish communities (Green et al., 1998; Stanley et al., 2002; Cooke et al., 2003). Studies of coastal fishing grounds and artificial reefs provide an example. Even a few years ago there was a lack of effective methods. One reason is that fish schools are frequently characterized by a large variability in their spatial and temporal distribution that may be linked to environmental conditions (Hamano and Nakamura, 2002).
Simmonds et al. (1992) showed that the accuracy of fish stock estimates maaded by errors in methodology, by sampling errors and by a series of biases. In this
study, we explored the combined use of acoustic information from a scanning sonar and GIS based 3D visualize software. Our results illustrate the importance of spatially referenced sonar information for the visualization and understanding of fish schools, the relation between fish schools and their relation with the bottom. If measured plankton and oceanographic features are added easily. The approach also will be valuable for the planning of assessment surveys and as we show for the monitoring and assessment of coastal fishing grounds that involve artificial reefs.
Our work offers a greater understanding of fish school distribple of generating 3D images from sonar data and it suggests improvements for
data acquisition and analysis software. First, attention should be paid to the the limited angular resolution of the scanning sonar. That is to say, as the cross-
section of the sonar beam increases with increasing range (Misund and Aglen, 1992; Misund, 1993; Misund et al., 1995) the school image will expands perpendicular to thdirection of the beam and the sea bottom echo will increase in thickness and bent upwards. Attempts have been made to compensate for the distortion by subtractingamount equal to the beam width at range (Smith, 1970). This correction has not been used in this report but is considered for future work.
Second, the scanning sonar not only provides fish ensions (Table 2) it also provides information on possible vessel avoidance. For
example Gerlotto et al. (1999) point out differences between schools that are observeclose to and at greater horizontal distance from the vessel and Iida et al. (1998) note possible vessel avoidance for schools that are observed in shallow water. Avoidance was not detected with our 3D imaging and mapping of sonar data but the above references indicate the importance of looking for this effect.
10
Finally, additional errors may be due to the relative movement between the obse
nt
nce of sonar based 3D images of the under water environment has been dem
eful
cknowledgements
he authors thank Takeshi Nakamura, and Yuichi Umetani, from the National Fisheries
eferences
Cooke, K., Kieser, R., and Stanley, R.D. 2003. Acoustic observation and assessment of
Freo k
Gerl use of
Gree M.C.Benfied, and Popp, J.M. 1998.
Ham sounder with
Iida, alysis of distribution f
rved school and the survey vessel (Freon et al., 1993). The school dimensionalong the vessel path will be over or under-estimated depending on school movemewith or opposite to the vessel's direction. This effect will increase with decreasing vessel speed.
The relevaonstrated. Their information content and usefulness will improve sharply as
additional data are incorporated, as data quality increases and when 2D and 3D thematic maps can be generated in real or near real time. Our work presents a usfirst step. A TUniversity, Shimonoseki, Japan, for helpful discussion and the captain and crew of the “Kuroshio” from the Yamaguchi Fisheries Research Center, for their assistance during the field survey. R
fish in high-relief habitats, ICES Journal of Marine Science, 60:658-661. n, P., Gerlotto, F., and Misund, A. 1993. Consequences of fish behavior for stocassessment. ICES Journal of Marine Science Symposium, 196:190-195. otto, F., Soria, M., and Freon, P. 1999. From two dimensions to three: the multibeam sonar for a new approach in fisheries acoustics. Canadian Journal of Fisheries and Aquatic Science, 56:6-12. n, C.H., Wiebe, P.H., Pelkie, C. Three-dimensional acoustic visualization of zooplankton patchness, Deep-Sea Research. Part II tropical Studies in Oceanography, 45:1201-1217. ano, A., and Nakamura, T. 2001. Combined use of quantitative echo-scanning sonar to visualize semi-quantitative three-dimensional image of fish schools. Journal of National Fisheries University, 50:1-11. K., Mukai, T., and Horiuchi, N. 1998. Three dimensional anand shape of pelagic/mesopelagic fish school using scanning sonar. The Journal o
11

the Marine Acoustic Society of Japan, 25:240-249. den, G.J. 1996. Potential for geographical informatiMea on system (GIS) in fisheries
Misu of fish school in the North
Misu vior of herring and mackerel in purse seine capture
Misu Mapping the shape, size, and density
Nish ollingworth, C.E. 1999. Proceedings of the First
Reid ues for the study of fish
Simm rlotto, F., and Aglen, A. 1992. Acoustic survey S
Simm Fisheries Acoustics, Second Edition.
Smit rizontal dimensions and abundance of fish schools in the
y G.B.
Stan e-dimensional visualization of
Tam Third Edition. Ohmsha, Tokyo. 336 pp.
management, in Computers in Fisheries Research, pp.41-79. Ed by B.A.Megrey and E. Moksness. Chapman & Hall, London, 254 pp. nd, O.A., and Aglen, A. 1992. Swimming behaviourSea during acoustic surveying and pelagic trawl sampling. ICES Journal of Marine Science, 49:325-334. nd, O.A. 1993. Avoidance behasituations. Fisheries Research, 16:179-194. nd, O.A., Aglen, A., and Fronaes, E. 1995.of fish schools by echo integration and a high-resolution sonar. ICES Journal of Marine Science, 52:11-20. ida, T., Kailola, J., and HInternational Symposium on Geographic Information Systems (GIS) in Fishery Sciences. March 2-4, 1999, Seattle, Washington, USA. , D.G., and Simmonds, E.J. 1993. Image analysis techniqschool structure from acoustic survey data. Canadian Journal of Fisheries and Aquatic Science, 50:886-893. onds, E.J., Williamson, N., Ge
design and analysis procedure: a comprehensive review of current practice. ICECooperative Research Report 187, 127 pp. onds, J., and MacLennan, David N. 2005.
Blackwell. 352pp. h, P.E. 1970. The houpper mixed layer as measured by sonar. In Proceedings of an International Symposium on Biological Sound Scattering in the Ocean, pp.563-591. Ed. bFarquhar, Department of Navy, Washington, DC. ley, R.D., Kieser, R, and Hajirakar, M. 2002. Threwindow rockfish (Sebastes entomelas) shoal over interpolated bathymetry, ICES Journal of Marine Science, 59:151-155. ura, H. 2002. Computer image processing, (In Japanese)
12