Embed Size (px)
Citation preview

QuickLinks -- Click here to rapidly navigate through this document
FORM 6-K
UNITED STATESSECURITIES AND EXCHANGE COMMISSION
Washington D.C. 20549
Report of Foreign Issuer
Pursuant to Rule 13a-16 or 15d-16 ofthe Securities Exchange Act of 1934
For the month of April 2004 Commission File No.: 1-31349
THE THOMSON CORPORATION(Translation of registrant's name into English)
Metro Center, One Station PlaceStamford, Connecticut 06902, United States
(Address of principal executive offices)
Indicate by check mark whether the registrant files or will file annual reports under cover Form 20-F or Form 40-F.
Form 20-F o Form 40-F ☒
Indicate by check mark if the registrant is submitting the Form 6-K in paper as permitted by Regulation S-T Rule 101(b)(1): o
Indicate by check mark if the registrant is submitting the Form 6-K in paper as permitted by Regulation S-T Rule 101(b)(7): o
Indicate by check mark whether the registrant by furnishing the information contained in this Form is also thereby furnishing the information to theCommission to Rule 12g3-2(b) under the Securities Exchange Act of 1934.
Yes o No ☒
If "Yes" is marked, indicate below the file number assigned to the registrant in connection with Rule 12g3-2(b): 82-.
EXHIBIT INDEX
Exhibit Number
Description
99.1 Annual Report to Shareholders
99.2 Notice of Annual Meeting of Shareholders and Management Information Circular (Proxy Statement)
99.3 Form of Proxy
99.4 National Instrument 54-102 Supplemental Mailing List Card
2
SIGNATURES
Pursuant to the requirements of the Securities Exchange Act of 1934, the registrant has duly caused this report to be signed on its behalf by the undersigned,thereunto duly authorized.
THE THOMSON CORPORATION
By: /s/ DEIRDRE STANLEY
Name: Deirdre StanleyTitle: Senior Vice President and General Counsel
Date: April 7, 2004

3
QuickLinks
EXHIBIT INDEXSIGNATURES
QuickLinks -- Click here to rapidly navigate through this document
Exhibit 99.1
Creating Value Through Information
The Thomson Corporation Annual Report 2003
Information Knowledge
In a knowledge-driven economy, you need to know. Having the right information, delivered where and when you need it, has become critical to gainingcompetitive advantage.
We believe the most powerful solutions are those that transform information into knowledge. Our customers benefit from Thomson solutions that enablethem to work more effectively and efficiently, and provide them with tools for creating new value.
To experience an interactive version of this annual report, go to www.thomson.com
The Thomson Corporation
Financial Highlights†
2003
2002
Change
Revenues 7,606 7,444 + 2%Adjusted EBITDA(1) 2,064 1,961 + 5%Adjusted operating profit(2) 1,476 1,426 + 4%Operating profit 1,191 1,136 + 5%Earnings attributable to common shares 879 586 +50%Earnings per common share (EPS) $ 1.34 $ 0.91 +47%Adjusted earnings from continuing operations(3) 705 636 +11%Adjusted EPS from continuing operations(3) $ 1.08 $ 0.99 + 9%Shareholders' equity 9,200 8,966 Net cash provided by operating activities 1,654 1,691 - 2%Free cash flow(4) 983 980 —
Thomson Market Groups(5)
Legal & Regulatory41% of Revenues
2003
2002
Change
Revenues 3,142 2,959 +6%Adjusted EBITDA(1) 980 926 +6%Adjusted operating profit(2) 799 767 +4%
17,000 people in 24 countries / Thomson Legal & Regulatory provides integrated information solutions to legal, tax, accounting, intellectual property,compliance and business professionals, as well as government agencies around the world.
Learning27% of Revenues
2003
2002
Change
Revenues 2,052 2,036 + 1%Adjusted EBITDA(1) 520 465 +12%Adjusted operating profit(2) 337 302 +12%
9,100 people in 40 countries / Thomson Learning provides a wide range of tailored learning solutions to colleges, universities, professors, students, libraries,reference centers, government agencies, corporations and professionals globally.
Financial20% of Revenues
2003 2002 Change

Revenues 1,523 1,597 -5%Adjusted EBITDA(1) 406 409 -1%Adjusted operating profit(2) 231 240 -4%
7,700 people in 22 countries / Thomson Financial provides a broad range of financial products and information solutions to the global financial servicesindustry, including brokers, financial planners and corporate executives.
Scientific & Healthcare10% of Revenues
2003
2002
Change
Revenues 760 692 +10%Adjusted EBITDA(1) 217 187 +16%Adjusted operating profit(2) 186 160 +16%
3,900 people in 19 countries / Thomson Scientific & Healthcare provides information and services to researchers, physicians and other professionals in thehealthcare, academic, scientific, corporate and government marketplaces.
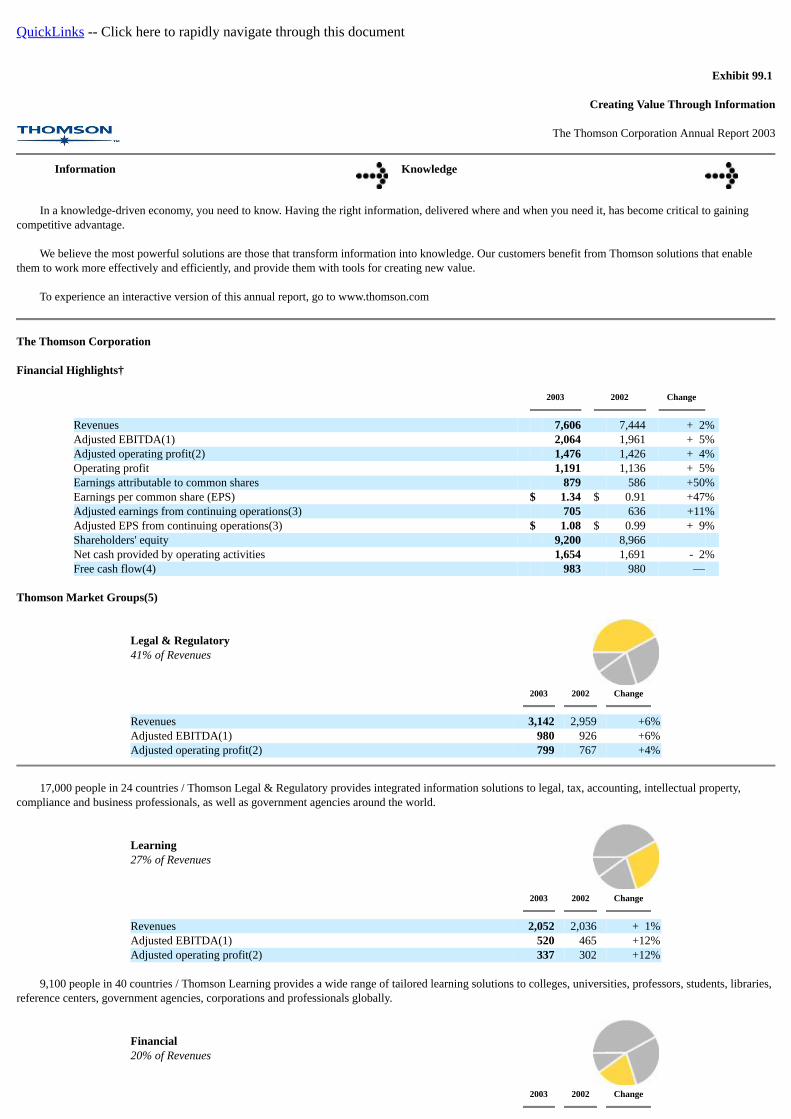
Five-Year RevenuesFive-Year CAGR 7.6% 03 7,60602 7,44401 7,07500 6,45399 5,674
Five-Year Adjusted EBITDA(1)Five-Year CAGR 9.6% 03 2,06402 1,96101 1,73300 1,49699 1,371
Five-Year Adjusted EPS(3)Five-Year CAGR 5.9% 03 1.0802 0.9901 0.9800 0.9599 0.90
† Millions of U.S. dollars except per common share amounts. Adjusted EBITDA, Adjusted operating profit, Adjusted earnings from continuing operations, Adjusted EPS from continuing operations andFree cash flow are non-GAAP financial measures, which are reconciled to the most directly comparable GAAP financial measures within the MD&A.
(1) Earnings from continuing operations before interest, taxes, depreciation and amortization, as well as restructuring charges, net other income (expense) and equity in net losses of associates, net of tax.
(2) Before amortization and restructuring charges.
(3) Excludes one-time items. For a full reconciliation to reported earnings, see the six-year summary on page 90.
(4) Net cash provided by operating activities less net additions to property and equipment, other investing activities and dividends paid on preference shares.
(5) Amounts are in millions of U.S. dollars, and represent results from ongoing businesses, which exclude businesses sold or held for sale that do not qualify as discontinued operations.
Value
At Thomson, we create value by leveraging knowledge, expertise and technology across markets that are fundamental to the global economy. We deliversolutions that put knowledge to work.
To Our Shareholders:
We are pleased to report that The Thomson Corporation made significant progress in strengthening our business, delivering solid earnings growth andsecuring our leadership position in our markets during 2003.
Today, Thomson is a global leader in the information services industry. The markets we serve are fundamental to the global economy and have sustainablelong-term growth potential. Our customers, many of whom are professionals such as lawyers, accountants, professors, doctors, researchers and financial advisors,rely on us for vital information that helps them make informed decisions. And, with continuing advances in software technology, Thomson has the ability, morethan ever before, to tailor the delivery of information to meet specific needs. Our strategy is to combine information and software tools to create solutions thathelp our customers be more productive and successful.
Business Highlights
In the legal market, we continue to build on the leading position of our Westlaw brand to drive growth in new areas of the business. We have acquired anddeveloped software businesses that give Thomson the unique ability to provide law firms with new productivity tools in addition to the world-class legal researchthat has made West so successful. We now offer a broad range of services to help law firms manage cases, maintain accurate billing records and attract newclients as they seek to run their practices more effectively and efficiently.
At Thomson Financial, we have transformed our business model from being a supplier of numerous stand-alone products to developing integrated offerings.Thomson ONE, for example, allows us to combine our broad range of financial information, market data and software tools, and tailor these to the specific needsof investment bankers, traders, advisors and analysts. Thomson ONE performed well during its first full year on the market. We added approximately 43,000Thomson ONE users in 2003 through contract wins and by transitioning existing customers to this new and superior product. At the beginning of 2004, wealready had commitments to add approximately 40,000 more users.
Similarly, we are developing a new suite of online research products for the pharmaceutical industry that we plan to launch in 2004. This new offeringleverages the benefits of our operating model by combining information from across our Scientific & Healthcare market group, as well as from ThomsonFinancial and outside data sources, into a single product that can be tailored to the needs of the customer. It is designed for researchers at every stage of the drugdevelopment process, and it represents an exciting opportunity to expand our presence in the pharmaceutical industry.
We also continued to leverage our technology expertise across the Company in 2003. For example, we extended the use of our Novus platform, which wedeveloped to efficiently distribute information online around the world. We began utilizing Novus in our Legal & Regulatory market group and we are nowexpanding its use to our Learning and Financial groups, as well. Products representing a significant portion of our revenues will be delivered on this global onlineplatform in the future. Leveraging resources across Thomson allows us to create better products for our customers and drive efficiencies throughout ouroperations.
Financial Performance
Despite challenging market conditions for some of our businesses, Thomson delivered solid earnings in 2003. Earnings per share (EPS) rose 47% to $1.34.After adjusting for discontinued operations and one-time items, which we believe is a more meaningful comparison, EPS grew 9% to $1.08 per share in 2003.
Revenues grew 2% to $7.6 billion for the year. Thomson Scientific & Healthcare and Thomson Legal & Regulatory generated revenue growth of 10% and6%, respectively, driven by good performance in existing businesses and contributions from tactical acquisitions that have been folded into existing operations. Inboth market groups, we continued to see strong revenue growth from online products, as well as very high customer retention rates—over 95% in some cases.
Thomson Learning revenues increased by 1%, as growth in the higher education business was largely offset by lower revenues in our library reference andIT testing and training operations due to weak market conditions. While 2003 presented challenges for Thomson Learning, we believe our strong position in both
the college textbook and e-learning markets creates excellent opportunities for future growth, as education and training increasingly become lifelong pursuits andwe continue to target new markets of opportunity.
Thomson Financial performed in line with our expectations in 2003, but revenues were down 5% due to weakness in the U.S. and European financialservices markets. By year end, market conditions were improving, and we expect further strengthening in 2004, particularly in the United States. This, combinedwith additional market share gains we expect for Thomson ONE, makes us confident that Thomson Financial will generate revenue growth in 2004.
An important financial measure for Thomson is free cash flow, which was strong again in 2003, at $983 million. This was about level with a year ago, eventhough our capital expenditures rose 10% and the prior year benefited from unusually strong improvement in working capital. We plan to continue to use our freecash flow to fund internal growth initiatives and acquisitions, pay an attractive dividend to shareholders and repay debt.
Creating Long-term Value
The Board of Directors and management of Thomson are firmly committed to creating long-term value for the Company's shareholders. We continue toposition Thomson in highly attractive markets with excellent long-term growth potential. We are confident that our business strategies are sound and will enableus to capitalize on the growing information needs of our customers. Most important, we believe we have the management and resources necessary to executesuccessfully and deliver attractive returns to our shareholders.
Thomson has always been committed to good corporate governance and the highest standards of integrity in all of our business dealings. To furtherunderscore that commitment, our Board recently conducted a thorough review of our policies; expanded guidelines defining Board duties, director independenceand conflicts of interest; and instituted a code of conduct for all directors and employees that reflects our values as a corporation.
On behalf of the Board and management, we would like to express our appreciation to all of our shareholders and customers for their ongoing support asThomson continues to evolve and grow. We would especially like to recognize the hard work and dedication of our 39,000 employees around the world, who arecommitted to the Company's success and to strengthening our position as a world leader in information services.
Sincerely,
David K.R. ThomsonChairman of the Board
Richard J. HarringtonPresident & Chief Executive Officer
2
Information Knowledge
The need to know
Much has been written about the information economy, and indeed more information—more data—is available than ever before. Information has become acommodity. But the market for knowledge—information analyzed and applied—is vast and growing.
In the United States, most new jobs are for knowledge workers, and that trend is becoming global. Information is the tool of their trade. They analyze andapply information to solve problems—technology problems, business problems, legal problems—for their companies and their customers. Their need to know isconstant, almost insatiable.
4

Jeff LiguoriEquity Sales Trader, America's Growth Capital
Another important trend is the increasing need for knowledge workers to do more with less. Industries such as financial services, law and accounting areconsolidating; performance pressure is intense. Professionals in every industry must constantly improve their productivity.
Information that in-house research departments used to process is now being delivered directly to the desktop computers of brokers, attorneys, clinicians andcorporate managers.
Customers must manage more information, and are therefore more demanding. Demanding that the information they buy is comprehensive, accurate andcurrent. Demanding that it be delivered right now, when and where they need it, in a form they can put to immediate use.
5
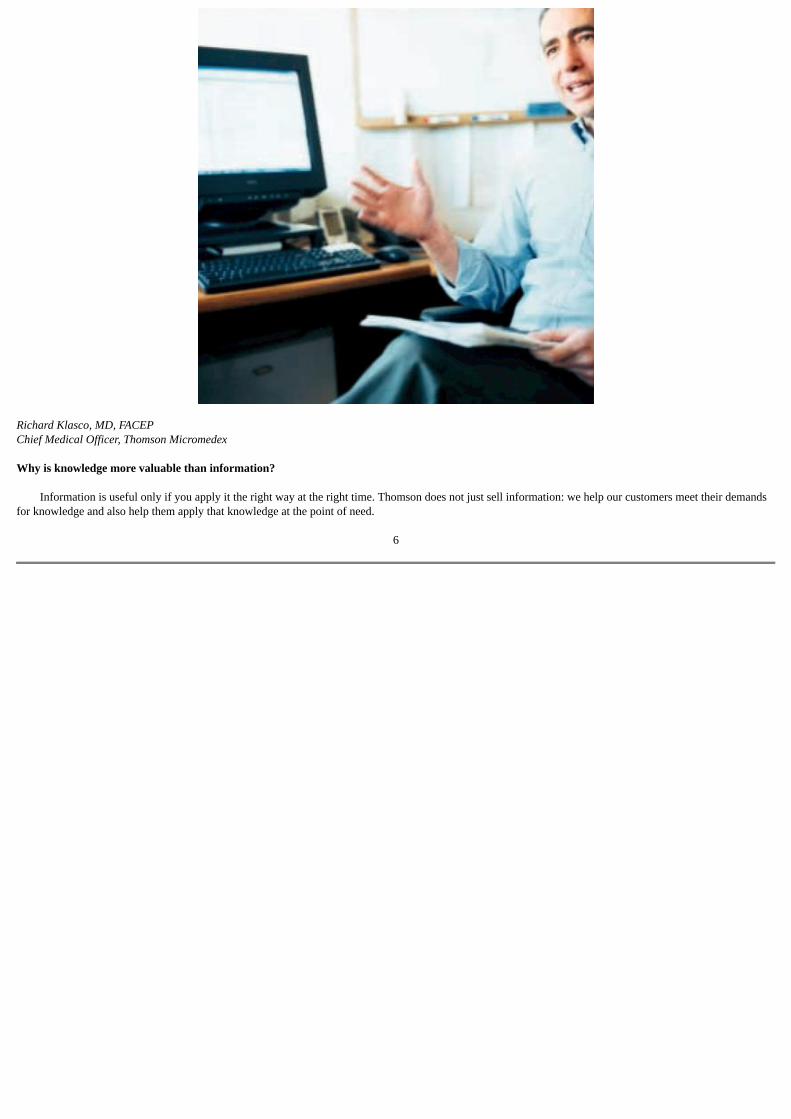
Richard Klasco, MD, FACEPChief Medical Officer, Thomson Micromedex
Why is knowledge more valuable than information?
Information is useful only if you apply it the right way at the right time. Thomson does not just sell information: we help our customers meet their demandsfor knowledge and also help them apply that knowledge at the point of need.
6

To save lives, when seconds matter
Knowledge on demand has become critical in a variety of contexts. In some, it is literally a matter of life or death. Dr. Rich Klasco, chief medical officer ofThomson Micromedex, is also a practicing emergency physician. Not only does he oversee the content development of key Micromedex products, he also usesthem in the E.R. at a major trauma center.
A few years ago, Rich learned an unforgettable lesson about how indispensable such solutions are. He was one of the emergency physicians on duty whenseveral critically injured teenagers were brought in for emergency care.
"I used a Thomson solution at the bedside. The computer was right in the resuscitation room where we were caring for these kids, and the neurosurgeon andI used the DRUGDEX and EMERGINDEX information. We had all that information at our fingertips, and could make a decision in a matter of moments. Thatreally made a difference in these kids' lives."
7
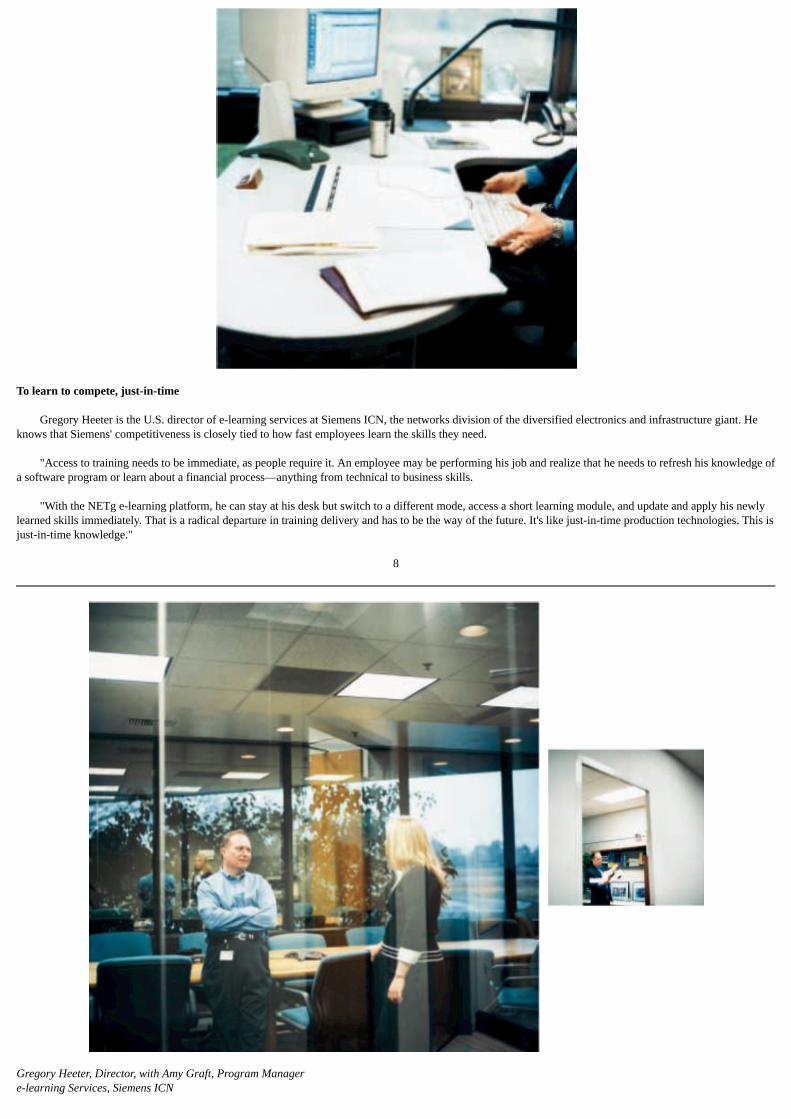
To learn to compete, just-in-time
Gregory Heeter is the U.S. director of e-learning services at Siemens ICN, the networks division of the diversified electronics and infrastructure giant. Heknows that Siemens' competitiveness is closely tied to how fast employees learn the skills they need.
"Access to training needs to be immediate, as people require it. An employee may be performing his job and realize that he needs to refresh his knowledge ofa software program or learn about a financial process—anything from technical to business skills.
"With the NETg e-learning platform, he can stay at his desk but switch to a different mode, access a short learning module, and update and apply his newlylearned skills immediately. That is a radical departure in training delivery and has to be the way of the future. It's like just-in-time production technologies. This isjust-in-time knowledge."
8
Gregory Heeter, Director, with Amy Graft, Program Managere-learning Services, Siemens ICN

9
What are information solutions made of?
Thomson solutions combine high-value content, software tools and Thomson expertise to help customers solve problems and capitalize on opportunities.They deliver knowledge that is in demand, on demand.
10
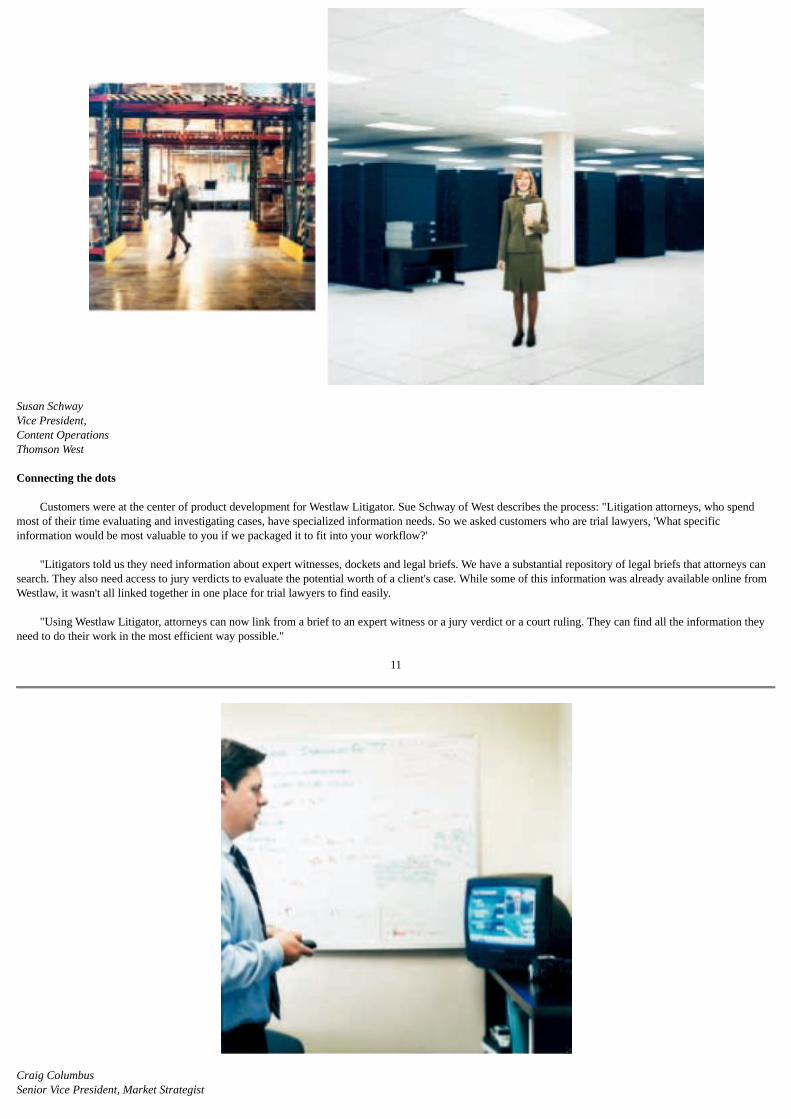
Susan SchwayVice President,Content OperationsThomson West
Connecting the dots
Customers were at the center of product development for Westlaw Litigator. Sue Schway of West describes the process: "Litigation attorneys, who spendmost of their time evaluating and investigating cases, have specialized information needs. So we asked customers who are trial lawyers, 'What specificinformation would be most valuable to you if we packaged it to fit into your workflow?'
"Litigators told us they need information about expert witnesses, dockets and legal briefs. We have a substantial repository of legal briefs that attorneys cansearch. They also need access to jury verdicts to evaluate the potential worth of a client's case. While some of this information was already available online fromWestlaw, it wasn't all linked together in one place for trial lawyers to find easily.
"Using Westlaw Litigator, attorneys can now link from a brief to an expert witness or a jury verdict or a court ruling. They can find all the information theyneed to do their work in the most efficient way possible."
11
Craig ColumbusSenior Vice President, Market Strategist
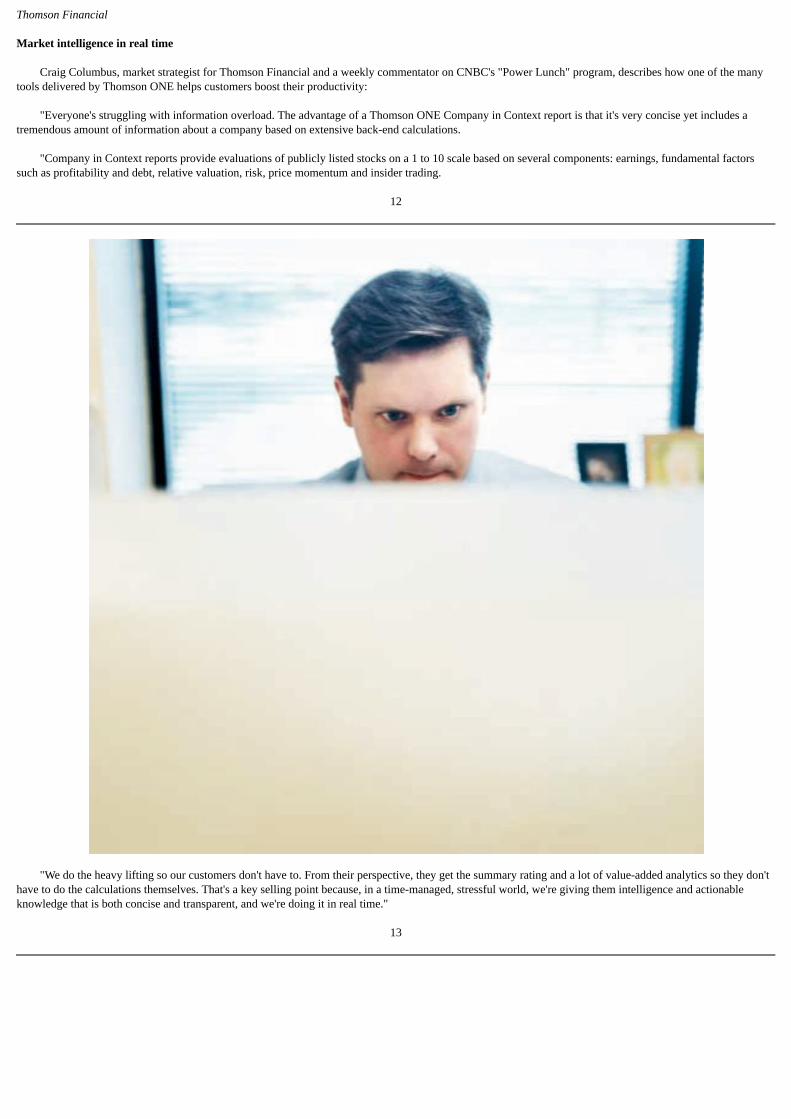
Thomson Financial
Market intelligence in real time
Craig Columbus, market strategist for Thomson Financial and a weekly commentator on CNBC's "Power Lunch" program, describes how one of the manytools delivered by Thomson ONE helps customers boost their productivity:
"Everyone's struggling with information overload. The advantage of a Thomson ONE Company in Context report is that it's very concise yet includes atremendous amount of information about a company based on extensive back-end calculations.
"Company in Context reports provide evaluations of publicly listed stocks on a 1 to 10 scale based on several components: earnings, fundamental factorssuch as profitability and debt, relative valuation, risk, price momentum and insider trading.
12
"We do the heavy lifting so our customers don't have to. From their perspective, they get the summary rating and a lot of value-added analytics so they don'thave to do the calculations themselves. That's a key selling point because, in a time-managed, stressful world, we're giving them intelligence and actionableknowledge that is both concise and transparent, and we're doing it in real time."
13

William BrottmillerVice President, Healthcare Business UnitThomson Delmar Learning
Changing how people learn
Thomson Delmar Learning has been developing innovative solutions to the problems of nursing education. One such product was designed to help nursesgain a level of comfort with complex hands-on procedures.
"Our IV (intravenous) therapy product was developed in partnership with Rensselaer Polytechnic Institute, whose electronic media department has cutting-edge, three-dimensional graphic technology," explains Bill Brottmiller of Thomson Delmar Learning. "We teamed up with them to create 3-D imagery of IVtherapy practice.
"With this software, a nursing student can use the mouse to experiment with the pressure it takes to push a needle into a person's blood vessel. And they cansee inside the patient's arm, in a 3-D environment. Does the needle hit the right vessel? When do you stop pressing? How about choosing the drip rate of themedication—is it too fast or too slow?
14

"All this can now be done in a software environment, so that when you or your loved ones are in a hospital, the nurse who has used our products will bemuch more adept at performing these vital tasks."
15
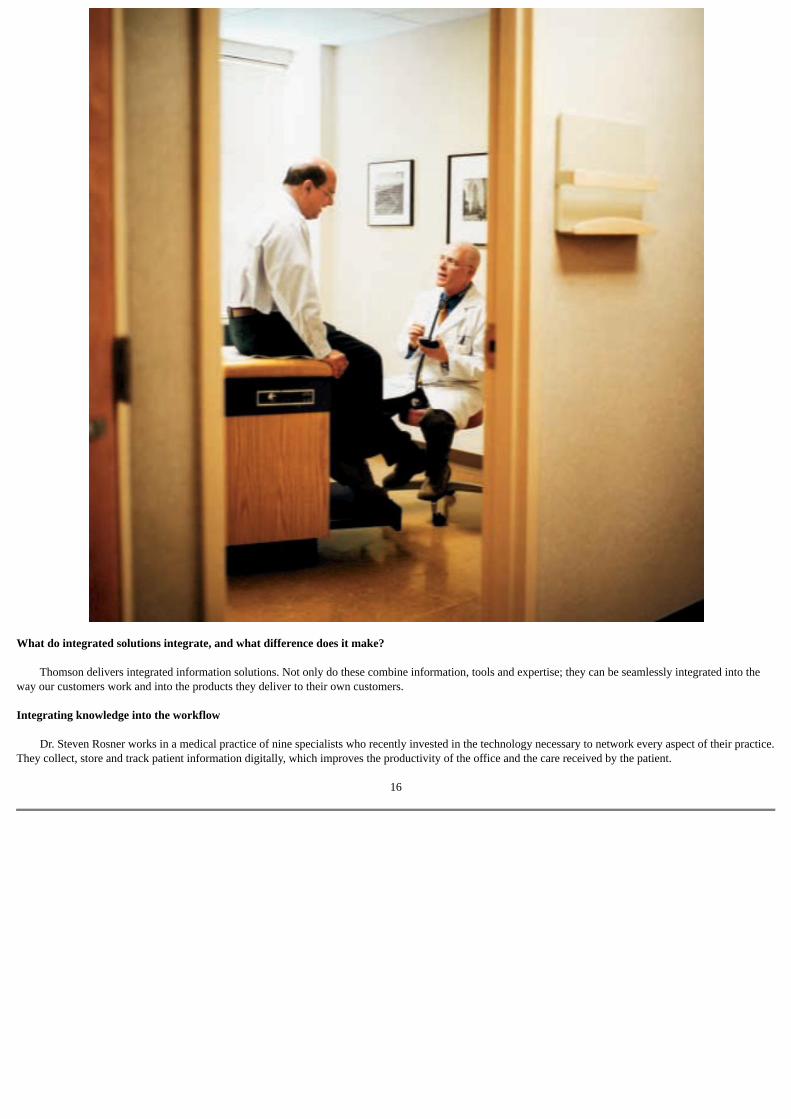
What do integrated solutions integrate, and what difference does it make?
Thomson delivers integrated information solutions. Not only do these combine information, tools and expertise; they can be seamlessly integrated into theway our customers work and into the products they deliver to their own customers.
Integrating knowledge into the workflow
Dr. Steven Rosner works in a medical practice of nine specialists who recently invested in the technology necessary to network every aspect of their practice.They collect, store and track patient information digitally, which improves the productivity of the office and the care received by the patient.
16

Steven Rosner, MDOld Hook Medical Associates
One of the most important gains is the ability to reduce errors: "My laptop and PDA (personal digital assistant) allow me to access PDR.net and mobilePDR—electronic products from Thomson PDR (Physicians' Desk Reference). One of the terrific benefits of how this has changed my practice is that I now write myprescriptions using the PDA.
"If the patient has bronchitis, for example, and you input that as the diagnosis, there's a drop-down menu for all the drugs you've chosen as preferred forbronchitis. You just highlight one of them and the computer instantly prints a prescription on a state-approved prescription blank from the printer by the nurses'station.
"The big advantage is that the computer has every drug in memory, and the computer types it for you. There's no confusion with drugs that sound alike, andthere's no mistake in dosing. It's also a speed advantage. If a patient has bronchitis and all your preferred drugs are memorized, you can prescribe a coughsuppressant, an antibiotic and an inhaler, all from one screen."
17
Shelly GregorySenior Supervisor,Financial PlanningChick-fil-A
Integrating knowledge into the work product
At Chick-fil-A, a highly successful U.S. food service business, the financial planning department relies on Thomson RIA's Checkpoint product for taxplanning. Shelly Gregory values its constantly updated content and the new tools that have emerged from her interactions with the Thomson people who supportCheckpoint.
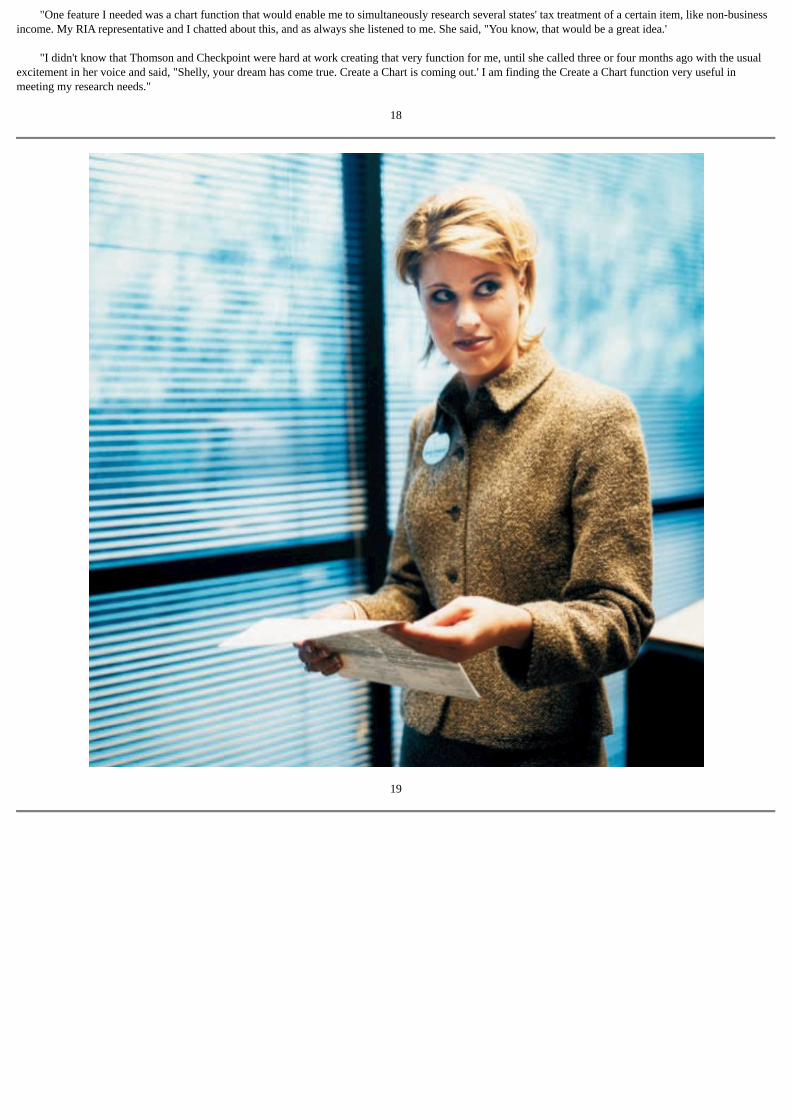
"One feature I needed was a chart function that would enable me to simultaneously research several states' tax treatment of a certain item, like non-businessincome. My RIA representative and I chatted about this, and as always she listened to me. She said, "You know, that would be a great idea.'
"I didn't know that Thomson and Checkpoint were hard at work creating that very function for me, until she called three or four months ago with the usualexcitement in her voice and said, "Shelly, your dream has come true. Create a Chart is coming out.' I am finding the Create a Chart function very useful inmeeting my research needs."
18
19

Todd SmithEquity Research Analyst, America's Growth Capital
20
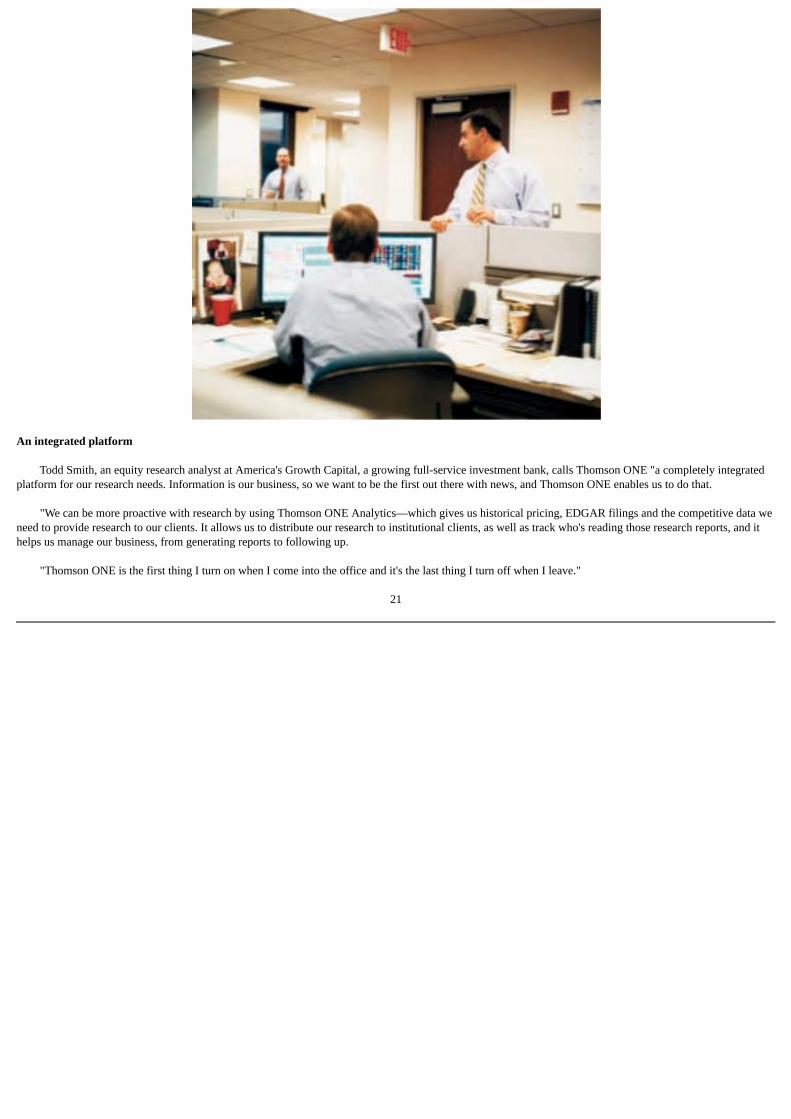
An integrated platform
Todd Smith, an equity research analyst at America's Growth Capital, a growing full-service investment bank, calls Thomson ONE "a completely integratedplatform for our research needs. Information is our business, so we want to be the first out there with news, and Thomson ONE enables us to do that.
"We can be more proactive with research by using Thomson ONE Analytics—which gives us historical pricing, EDGAR filings and the competitive data weneed to provide research to our clients. It allows us to distribute our research to institutional clients, as well as track who's reading those research reports, and ithelps us manage our business, from generating reports to following up.
"Thomson ONE is the first thing I turn on when I come into the office and it's the last thing I turn off when I leave."
21

22
Knowledge Value
From knowledge to value creation
Thomson solutions are enabling people to make better decisions faster—anywhere, anytime. We are helping our customers find new ways to create value,enabling them to be more competitive.
As Thomson builds better solutions and develops deeper customer knowledge, we are becoming an increasingly trusted partner. Customers rely on us, notonly for solutions that are already available, but to help them find ever more innovative ways to translate information into knowledge and apply it at the point ofneed.
Thomson has focused its business on markets that are central to economic development and growth—legal, regulatory, learning, financial, scientific andhealthcare. As more people become part of the information economy, Thomson is well positioned as a leader in the business of knowledge.
To experience an interactive version of this annual report, go to www.thomson.com
23
The Thomson Corporation
Our Business and Markets
Thomson is a world leader in providing integrated information solutions to business and professional customers. We provide our customers with business-critical information from multiple Thomson and third-party databases, and further enhance the value of that information with analysis, insight and commentary.
We focus on four major information markets: legal & regulatory, learning, financial, and scientific & healthcare. These markets are large, global andinformation-dependent. They all play a vital role in the future of the global economy, so we believe Thomson is well positioned for the long term.
Many of our customers are what management guru Peter Drucker termed knowledge workers. Back in the 1950s, Drucker predicted the rise of a new kind ofworker—well-educated professionals who use specialized information to perform their jobs every day. Drucker was right. The majority of new jobs in the UnitedStates today are knowledge worker jobs, and this is a growing trend in other countries as well.
Knowledge workers have a constant need for accurate, up-to-date information. And they need tools to manage this information and integrate it into theirwork products.
Our customers are high-end knowledge workers such as attorneys, accountants, educators, bankers, researchers, and physicians.
Our strategy capitalizes on three major forces at work in the information industry.
Too Much of a Good Thing
The first trend is the information explosion. It has been estimated that the amount of information online is doubling every six months. You don't have to be amathematician to figure out that people are going to have a harder and harder time keeping up. Knowledge workers are inundated with data that they must sortthrough, condense and analyze in order to make informed decisions.
The Revolution Continues
A second trend fuels the information explosion: the technology revolution, which keeps on changing the way we work and live.
Computers made it possible to create and compile more data than ever before. Then the Internet made it possible to tap into that data anytime, from almostanywhere. The open standards movement in computing made it feasible to access and transfer information using all kinds of devices, from desktop computers tolaptop computers to handheld PDAs (personal digital assistants).
And innovations in software are now making it easier to search vast seas of data, pull out the relevant bits, and bundle them together to meet the specializedinformation needs of different groups of knowledge workers.
24
Something New Every Day
Not so long ago, customer requests were delivered by the post office, and—if the request was urgent—answered within days. Today, scenes like thefollowing are becoming the norm:
• The phone rings on an equity sales trader's desk. A potential customer is calling for advice on which of two stocks to buy. The trader knows he hasto do a comprehensive comparative analysis of the two stocks right then, while he has the customer on the phone. Fortunately, all the data andanalytical tools needed for this sophisticated analysis are right in front of him. He doesn't even have to put down the receiver.
• A technician is troubleshooting a problem in her company's telecommunications software. She discovers that she hasn't encountered this type ofproblem before and does not have the skills to solve it. So she calls up a training module on her desktop computer, spends an hour learning theneeded skills from an online course, then fixes the software.
• A tax specialist not only needs to stay current on changes in tax law for every state where her company operates, she also needs to keep hermanagement informed about the impact of changes. Fortunately, the same product that provides her with constant updates on state tax law alsocreates the charts she needs to communicate her findings clearly and quickly.
• An emergency room physician treating a critically wounded patient has to decide which drug to use and exactly how to use it. The patient's lifedepends on making the right decision. And it has to be made right now. It's a good thing the doctor doesn't have to leave his patient's bedside tosearch some of the largest drug databases in the world and retrieve definitive information within seconds.
These are all stories from Thomson customers who use Thomson products to do their jobs and add value in real time.

These stories illustrate the third trend shaping the information industry: information needs are evolving at an accelerating speed. High-end knowledgeworkers are confronted with new challenges every day. They must have, or be able to get, the knowledge necessary to meet these challenges as they arise.
25
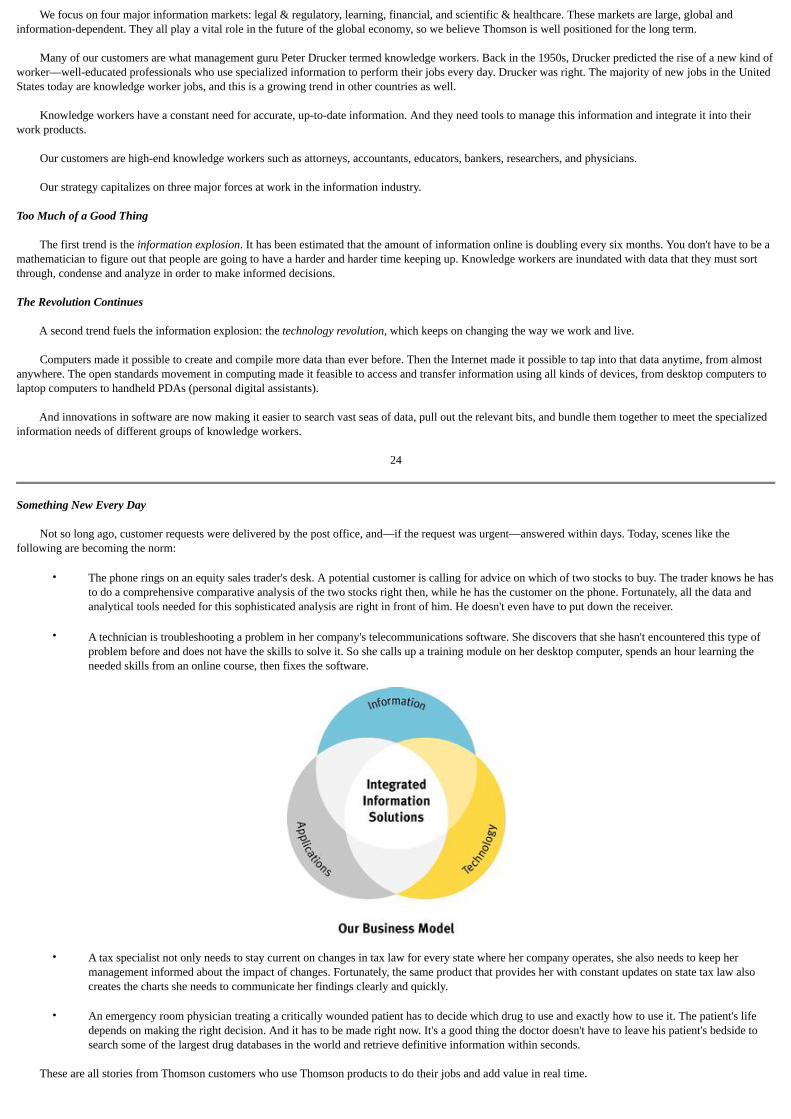
Our Business Model
To satisfy our customers' need to know, Thomson targets the sweet spot where technology, information and applications meet. We create integratedinformation solutions that combine exhaustive information with tools powerful enough to transform that information into value. The essentials of our businessmodel are:
• Business-critical information that is comprehensive, accurate and timely
• Ease of access—making content available to individuals any way they want it delivered, right to their desktop or their PDA
• Online analysis, tools and applications to raise productivity
• Integration of information into total solutions that bring together Thomson data with data from third parties and the customer's own databases, aswell as the tools to manage the data.
This business model allows us to become partners with our customers to help them make better decisions faster—anytime, anywhere.
Key Initiatives
Refining Our Customer Strategy
We are reinvigorating our customer strategy to ensure that we deliver the right products at the right price to meet our customers' changing needs. Across ourbusinesses, we are:
• Using market research to deepen our understanding of customer needs and work flows—as they are today and as they are evolving in response tomarket forces
• Identifying customer sub-segments in existing markets whose needs we can meet through tailored products and services
• Reframing and realigning, where necessary, to better serve our customers. For instance, Thomson Financial has completed a reorganization of itssales force to increase responsiveness
• Refining our pricing models to ensure the right value/price equation for our products and services.
We are continuously soliciting customer feedback and driving "the voice of the customer" deep into all of our business processes.
Leveraging Resources across Thomson
Each quarter sees new examples of cross-business collaboration to deliver comprehensive information solutions, such as Thomson Scientific & Healthcareintegrating relevant data from Thomson Financial into its comprehensive IDdb drug database, or Thomson Learning providing online training and testingresources to supplement our Westlaw and Thomson ONE products.
We are also leveraging our technology assets, such as the powerful Novus platform, to deliver products and services more efficiently and effectively.
Strengthening Our Operating Mechanisms
We have put in place enterprise-wide operating mechanisms that are designed to help Thomson achieve its strategic goals. Going forward, we expect to reapthe benefits of:
• A Company-wide planning process that aligns Thomson businesses with major market opportunities
• Shared performance metrics to drive excellence in execution
• Anew talent management process that helps develop leaders across the Company and ensures that we have the right talent in place in keypositions.
26
Thomson Legal & Regulatory
Our Business and Markets
Thomson Legal & Regulatory is a world leader in providing information and software-based solutions for legal, tax, accounting, intellectual property,compliance and other business professionals, as well as government agencies. We offer our customers access to over 19,000 databases—some of the largest in theworld.
While the overall market in law, tax and accounting continues to grow steadily but modestly, the demand for online products, software and services isaccelerating and driving growth in our business.
As law firms continue to consolidate, demand is rising for more efficient and effective ways to manage law practices and attract new clients. The story issimilar in tax and accounting, where consolidation is also the rule of the day and performance pressures remain high.
Our Business Model
In addition to delivering must-have information, we increasingly provide software, tools and services that help lawyers, accountants and other professionalswork more effectively and better serve their customers.
We offer a broad range of products and services that leverage our electronic databases of legal and regulatory information. Our offerings also include non-content-based products and services, such as software to assist lawyers and accountants with practice management functions, and software that assists taxprofessionals with preparing and filing tax returns. And we deliver business information and news to more than 25,000 corporate customers and 100,000professional researchers.
In the U.S. legal market, we support the attorney from the time he or she enters law school throughout every phase of a career:
• Our legal textbook publishing business has over 1,400 titles and, through BAR/BRI, we provide bar examination review courses and materials.
• For the practicing attorney and legal researcher, Westlaw is the number one source of authoritative information.
• FindLaw offers client development services to help attorneys build their practices.
• Our legal software suite brings together Elite, ProLaw, West km, and Law Manager products to help firms manage the business of law. Customersuse this product suite to improve front- and back-office functions such as case management, records management and billing.
• Through West LegalEdcenter, we are the top provider of online continuing legal education.
We believe that there is substantial growth opportunity in replicating this model of comprehensive legal products and services internationally. Furtheropportunity lies in building out elements of this model in our tax and accounting businesses.
RICH CONTENT TOOLS AND APPLICATIONS
High-quality, comprehensive databases of must-have information compiled and continuouslyupdated by subject-matter experts. Examples include: Over 19,000 databases encompassing case law, statutes, citations, treatises, briefs, commentary,legal education materials and other legal information enhanced with headnotes, synopses, keynumbers and other editorial enhancements; tax and accounting information, and regulatory data;business information, current and archival news; trademark search and information services.
State-of-the-art tools and software to search, compare,aggregrate, analyze, synthesize and communicate vastamounts of data; law firm management software; web-basedlegal directory and website creation and hosting services; taxand accounting software.
27
Key Initiatives
Growing Online Products
In 2003, revenues for many of our online products grew by double digits. To meet growing demand, we are continuing our shift to online products andservices. Examples include:
• Checkpoint, our online tax product, provides customers with instant access to a broad collection of databases. Checkpoint's subscriber base hasbeen growing fast, and increased 22% in 2003.
• Westlaw, our primary online platform for the legal market, offers numerous search features and navigation tools that enable customers to quicklysearch extensive databases for case histories, statutes, law briefs, topical commentary and many other legal matters.
Expanding Internationally
Westlaw supports customers in almost 30 countries. We are working to broaden our coverage geographically and to deepen the local content we offer. Forexample, Westlaw DE, based in Germany, now offers comprehensive coverage of German and European legal information.
Sub-segmenting Markets
Technology is enabling us to sub-segment our markets so that we can profitably deliver tailored products to the litigator, the real estate law specialist andmany other customer segments. For example, our new Westlaw Litigator product is uniquely designed to help attorneys evaluate and investigate cases and preparefor trial.
Integrating Solutions
We continue to integrate our front- and back-office management products to provide total solutions for firms seeking to increase productivity and reduce thecost and time associated with practice management. In 2003, we acquired Elite to build out our software offerings in this area. In addition, demand for clientdevelopment services has been booming; our FindLaw business grew 53% in 2003.
In the business information arena, we are in the process of migrating Dialog's content to our global Novus online platform so that we can enhance ourofferings and accelerate new product development. We expect to gain further leverage as Dialog content becomes a component of solutions offered by otherThomson market groups, in addition to Legal & Regulatory.

Leveraging Our Technology
Novus, the latest generation of our global online delivery platform, allows us to seamlessly combine content from our various online services, reduce productdelivery costs and decrease development time for new products. We continuously upgrade the applications and infrastructure, thereby enhancing our ability to selland deliver products on the Internet.
OPEN TECHNOLOGYARCHITECTURE
MULTIPLE DELIVERYOPTIONS
POINT OF NEED
Open standards technology that makes it easy tointegrate our content and applications withcustomers' information systems.
Content and tools delivered through the channel orchannels preferred by the customer—e.g., print,CD-ROM, proprietary online platform, the Internet,wireless.
Solutions delivered anytime, anywhere to supportthe education, research, and managerial needs oflawyers, law students, law librarians, accountants,trademark professionals, consultants, governmentagencies and business professionals.
28
Thomson Learning
Our Business and Markets
Thomson Learning is one of the two global leaders in higher education, and is strongly positioned in the corporate training and testing markets. We provide awide range of tailored learning solutions to colleges, universities, professors, students, libraries, reference centers, government agencies, corporations andprofessionals globally.
Favorable trends are expected to lead to long-term growth in both the higher education and lifelong learning markets:
• The global demand for post-secondary education is continuing to rise, driven in part by a large wage gap between workers who hold collegedegrees and those who don't. This trend should accelerate as major economies around the world continue their shift to the service sector. As theservice sector grows, so does the need for knowledge workers.
• Education is becoming a lifelong pursuit. This is in part due to the information explosion, which requires professionals to update their educationcontinually and to recertify periodically.
• Companies have long relied on internal corporate training programs to improve employee skills. Increasingly, companies are supplementing orreplacing traditional classroom learning with e-training and e-testing to provide cost- and time-efficient training on a 24/7 basis.
We believe the long-term growth prospects are excellent, although recent economic conditions have constrained spending in some areas of higher educationand corporate training:
• Overall, the demand for post-secondary education remains strong, although state budget issues have led to larger class sizes and some courseconsolidation. At the same time, distance learning is expanding access to higher education around the world, and electronic instructional materialswill grow in importance.
• The library reference market has also experienced budget pressures. However, this is accelerating the migration from print to electronic offerings,which affords Thomson the opportunity to supply integrated reference solutions.
• Corporations are seeking to cut costs by outsourcing training programs and shifting to more cost-efficient e-learning solutions.
Our Business Model
The higher education and lifelong learning markets are changing rapidly, and we are evolving our business model to meet our customers' current andemerging needs.
While higher education instructors and students are increasingly seeking electronic resources, printed materials continue to be the most widely used learningresource:
• We publish textbooks, study guides and teaching guides in both print and electronic formats. We are uniquely positioned to supplement our majortextbooks with electronic teaching aids, such as online interactive information resources, to help students achieve their learning goals.
• We combine primary-source research information and content from scholarly journals, and integrate them into a broad array of sophisticatedreference tools used by libraries and research institutions around the world.
RICH CONTENT TOOLS AND APPLICATIONS
High-quality, comprehensive databases of must-have information compiled and continuouslyupdated by subject-matter experts. Examples include: Higher Education/Reference—Textbooks and electronic course materials in the humanities,social sciences, business, economics, mathematics, sciences, modern languages and English-language training; college selection and test preparation guides; reference collections ofperiodicals, microfilm and encyclopedias.
Tools to search, compare, aggregate, analyze, synthesize andcommunicate vast amounts of data; state-of-the-art e-learning technology; technology-based test development,delivery, and management.

Lifelong Learning—Textbooks and learning materials for technology, business skills, healthcare,trades, professional and career education.
29
Corporate training is undergoing a profound shift toward e-learning. This is partly driven by the demand for just-in-time training that enables employees tolearn new skills at the point those skills are needed. In addition, many companies are trying to achieve economies of scale by seeking flexible training resourcesthat meet the diverse needs of employees enterprise-wide—which frequently means worldwide. One of the strengths of our training and testing business is thebreadth of our online offerings. We have a repository of more than 80,000 self-contained instruction modules to teach specific skills, and more than 3,000 e-learning courses. This breadth enables us to create flexible and personalized programs tailored to the needs of the individual student.
Key Initiatives
Migrating to Online Products
We are evolving our educational offerings to address students' evolving needs:
• Through Peterson's Test Prep, we have begun providing customized lessons and exercises for college entrance exams. Our technology enables usto design individualized courses for each student, which are tailored to his or her strengths and weaknesses.
• Online learning products like BCA/iLrn (Brooks/ColeAssessment) are growing in reach and impact. BCA/iLrn delivers homework tools,interactive content and links to live tutors. Students made over three million visits to the BCA/iLrn website in 2003.
Expanding Internationally
We see great opportunity to continue expanding the international reach of our products:
• In 2003, Thomson NETg supported one of the largest online learning implementations in Europe when a major telecommunications companyrolled out a comprehensive collection of e-learning courses and reference materials to 125,000 employees and their families.
• We adapt textbooks and learning materials for international sales by translating them, where necessary, and supplementing them with localcontent. In 2003, approximately 60% of our non-U.S. higher education revenues came from content created in local markets.
Expanding into New Market Segments
We are enhancing our ability to provide comprehensive, must-have solutions for government and corporate customers:
• We are creating solutions that help customers maintain mandatory professional certifications and licenses, and comply with governmentregulations.
• In 2003, we began providing pre-employment screening for a major U.S. financial services corporation. We believe the corporate market for thistype of e-testing will be significant.
Integrating Solutions
We are currently digitizing our microfilm collection and integrating this content with our electronic products. For example, Gale's Eighteenth CenturyCollections Online provides electronic access to 150,000 printed works from multiple academic disciplines. With full-text search capabilities across 33 millionpages, this collection creates a new way to conduct multidisciplinary research.
OPEN TECHNOLOGYARCHITECTURE
MULTIPLE DELIVERYOPTIONS
POINT OF NEED
Open standards technology that makes it easy tointegrate our content and applications withcustomers' information systems.
Content and tools delivered through the channel orchannels preferred by the customer—e.g., print,CD-ROM, proprietary online platform, the Internet,wireless.
Solutions delivered anywhere, anytime to supportthe learning goals of college students, professionalsand instructors; and the information needs ofcolleges, universities, vocational schools, libraries,research centers, corporations and governmentagencies.
30
Thomson Financial
Our Business and Markets
Thomson Financial is one of the Big Three information providers for the worldwide financial services industry. With the broadest range of products andservices in the industry, as well as a growing capability to provide turnkey solutions for global firms, we help clients in more than 70 countries make betterdecisions and be more productive.
During 2002 and 2003, weakness in the economy strongly impacted the financial services industry. There was significant consolidation, accompanied bywaves of layoffs and budget cuts among financial services firms. Demand for financial information declined as well.
However, in late 2003, the U.S. market began to turn around. The fourth quarter saw the greatest IPO volume in three years, and merger and acquisitionactivity increased after a two-year decline. Industry employment levels began to stabilize. While recovery in international markets lagged behind North America,many experts predict the beginnings of a turnaround in Europe during 2004.
While there have been signs of recovery in the financial services industry, financial firms remain under heavy pressure to increase productivity and lowercosts. They need services tailored for the individual professional that enable him or her to increase personal productivity. More and more, our customers aredemanding integrated solutions that offer advanced analytic capabilities and that can be easily integrated into their own workflows and work products.
Our Business Model
The breadth and depth of our products position us uniquely to satisfy customers' complete information needs:
• We provide customers with financial information, including historical financial and economic information, broker research, earnings estimates,transaction data, insider trading information, corporate information and public disclosure documents.
• We offer access to real-time information, including market data, trading information and financial news.
• We make this information more valuable to our customers by providing tools that search, analyze and manipulate the data so that it can be usedmore effectively.
• We also provide services such as the dissemination of corporate news releases, back-office data processing, transaction processing and, throughour joint ventures, services that facilitate trade settlement and securities issuance.
RICH CONTENT TOOLS AND APPLICATIONS
High-quality, comprehensive databases of must-have information compiled and continuouslyupdated by subject-matter experts. Examples include: Transactional data, institutional holdings data, current and historical earnings estimates, pricinginformation, SEC filings, real-time equity and fixed-income brokerage research, current andhistorical analyst forecast estimates, company accounts data, market indices, market intelligence,and corporate news and information. Industry-leading content brands include First Call, SDC, Worldscope and IFR.
Tools to search, compare, aggregrate, analyze, synthesizeand communicate vast amounts of data; back-office dataprocessing services; real-time networks for trade orderindications and trade executions; performance attributionand portfolio construction tools; portfolio management andorder management systems; and web-based applicationsproviding corporate news, stock surveillance and outboundcommunications services.
31
Besides the comprehensiveness of our products and services, we offer customers exceptional flexibility to purchase tailored workflow products that deliveronly the content and applications they need.
In 2003, we made a major step forward in choice and customization with the introduction of Thomson ONE. Thomson ONE is a flexible, open-architecturetechnology platform that enables easy integration and delivery of bundled products and services. It provides content both from Thomson Financial and from thirdparties, and combines this content with a suite of applications and tools tailored to the end-user's workflow. For example, Merrill Lynch brokers will be able toaccess Thomson data and tools, third-party data and their own proprietary information, seamlessly from their desktops.
Integrated information solutions currently delivered via Thomson ONE include: Thomson ONE Banker for investment banking professionals; ThomsonONE Yield and Thomson ONE Equity, targeting the needs of institutional fixed-income and equity traders; Thomson ONE Advisor, designed for retail brokerageand wealth managers; and Thomson ONE Analytics—including our popular First Call product—to meet the needs of research analysts and portfolio managers.
More than 90% of our revenues come from sales of products and services delivered electronically. Three-quarters of our revenues come from subscription-based products.
Key Initiatives
Delivering Superior Value
• Helping current customers transition to Thomson ONE, which improves our service to them and optimizes our efficiency in product developmentand delivery
• Implementing bundling strategies that leverage the full suite of Thomson Financial assets to deliver superior value and provide customer-centricalternatives to premium-price competitor products.
Expanding into New Markets
• Expanding our offerings to target new markets in the institutional sales and trading, and portfolio management segments
• Accelerating our growth internationally as the financial services industry begins to recover in Europe and Asia.
Enhancing the Customer Experience
In addition to enriching our line of products and services, we continue to enhance the customer's overall experience with Thomson Financial by:
• Adopting a single-point-of-contact sales model across a broad range of products and services
• Delivering innovative new service models that reduce the cost, time and complexity of switching from our competitors
• Building out training and pilot capabilities to ensure smooth transitions to our integrated solutions
• Continuing to align our product development, sales, service and administrative processes to maximize responsiveness to customer needs.
OPEN TECHNOLOGYARCHITECTURE
MULTIPLE DELIVERYOPTIONS
POINT OF NEED
Open standards technology that makes it easy tointegrate our content and applications withcustomers' information systems. We have integratedour content and tools into a single, flexible, highlyefficient technology platform—Thomson ONE.
Content and tools delivered through the channel orchannels preferred by the customer—e.g., CD-ROM, proprietary online platform, the Internet,wireless.
Solutions delivered straight to the desktop to helpfinancial professionals and corporate executivesmake informed, timely decisions. Our customersinclude investment bankers, private equityprofessionals, institutional traders, retail traders,investment advisors, portfolio managers, researchanalysts and investor relations professionals.
32
Thomson Scientific & Healthcare
Our Business and Markets
Thomson Scientific & Healthcare is a leading provider of integrated information solutions to researchers, physicians, and other professionals in thehealthcare, academic, scientific, corporate and government marketplaces.
Our solutions assist scientists in all stages of the research and development cycle from scientific discovery to product release.
We provide physicians with critical drug and clinical information, as well as medical education, enabling them to improve the quality of care their patientsreceive. We also provide decision-support solutions so that healthcare managers and practitioners can more effectively manage the cost and quality of healthcare.
Scientific
The scientific information market is truly global, since researchers need to stay informed of scientific breakthroughs wherever they occur. Thus high-quality,comprehensive scientific databases have relevance worldwide.
In addition, the scientific community has been an early adopter of online information sources. Today, the top academic and corporate research librariessubscribe to electronic databases as their primary vehicle for distributing scientific and technical information. Increasingly, information is being delivered directlyto the individual scientist's desktop on demand, and information solutions are becoming embedded in researchers' workflows.
Healthcare
The global healthcare information market is extremely broad. While we participate in various segments of the market, we focus on the clinical and druginformation and medical education segments because we believe these areas have the greatest growth prospects.
In the United States, continued investments in scientific R&D, drug development and healthcare services are fueled by the graying of the population. AsAmerica ages, investments in drug development for chronic conditions and diseases are growing more than 10% a year. Drug development pipelines areimproving in the pharmaceutical and biotechnology markets. Furthermore, the demand for healthcare services generated by the aging U.S. population increasesthe need for information solutions that facilitate effective and efficient healthcare delivery.
A second major market trend is the shift toward delivering information to physicians and other healthcare professionals at the point of care. For example,more and more doctors are using their PDAs to access information and tools, sometimes literally at their patients' bedsides. Consumer demand for qualityhealthcare, cost pressures and heightened awareness of medical errors all feed the growing demand for accurate and reliable point-of-care information.
RICH CONTENT TOOLS AND APPLICATIONS
High-quality, comprehensive databases of must-have information compiled and continuouslyupdated by subject-matter experts. Examples include: Scientific—journal literature, patents, commercial news sources, company communications,patented genetic sequences. Healthcare—FDA approved drug monographs; clinical, toxicological and environmental data;poison control and emergency procedures; acute and chronic disease information; marketintelligence, benchmark data and research for managing the delivery of health services; medicaleducation materials.
Tools to search, compare, aggregrate, analyze, synthesizeand communicate vast amounts of data, including decisionsupport systems.
33

Our Business Model
Today we are uniquely positioned in the scientific and healthcare market to deliver information solutions across the value chain—from R&D informationthrough medical reference databases to our suite of healthcare cost management solutions.
Leading Products
Web of Science reaches nearly nine million researchers globally.
Using Delphion, customers can search over 39 million patents from 70 countries and leverage unique productivity tools to track market developments andcompetitive activities.
More than 9,000 healthcare facilities depend on our Micromedex solutions to meet their medical reference needs.
Approximately 160,000 healthcare professionals have registered for PDR.net, which provides an online version of the PDR (Physicians' Desk Reference) andalso enables handheld access through mobilePDR.
Medstat is a leading provider of decision-support systems, market intelligence and benchmark databases for managing the purchase, administration, anddelivery of health services and benefits.
Physicians World and Gardiner-Caldwell deliver continuing medical education to help caregivers keep their skills up to date.
In response to our customers' evolving needs, we are accelerating the shift from stand-alone reference databases to integrated information solutions. Forexample, IDdb (Investigational Drugs Database) provides validated, integrated and evaluated information about the R&D portfolios of more than 9,600organizations involved in drug development. It includes information about therapeutic patents, the pipeline status of more than 20,000 investigational drugs,searchable chemical structures and meeting reports. This comprehensive solution is currently used by 20,000 professionals in the pharmaceutical industry.
Key Initiatives
Integrating Solutions
We are increasing penetration of the hospital market by repositioning our Micromedex offering as an integrated information solution for clinical practice andclinical management support.
In the scientific market, we are enhancing our Web of Knowledge platform tools and content to strengthen our competitive advantage in the academic andgovernment research markets.
Delivering to the Point of Care
We are continuing to develop point-of-need products and services for the clinician and researcher. In 1998, virtually no U.S. doctors used PDAs in patientcare; today more than 25% do. Point-of-care solutions like mobilePDR and mobileMICROMEDEX reduce the risk of error in diagnosis and prescription byhelping caregivers make more informed decisions.
Expanding into New Markets
We are developing an integrated platform that will deliver products and services tailored for customers in the pharmaceutical and biotechnology industries.This platform will seamlessly combine content and tools from our scientific and healthcare businesses, augmented by relevant products from other Thomsonmarket groups.
OPEN TECHNOLOGYARCHITECTURE
MULTIPLE DELIVERYOPTIONS
POINT OF NEED
Open standards technology that makes it easy tointegrate our content and applications withcustomers' information systems.
Content and tools delivered through the channel orchannels preferred by the customer—e.g., print,CD-ROM, proprietary online platform, the Internet,wireless.
Solutions delivered anywhere, anytime—to thehospital to help physicians deliver better care, or tothe laboratory or desktop to help the scientistconduct research. Our customers includecorporations in the pharmaceutical, biotechnology,chemical and engineering industries, as well asgovernment agencies, research libraries,universities, hospitals, poison control centers,insurance companies and health professionals.
34
Financial and Corporate Information
To experience an interactive version of this annual report, go to www.thomson.com
35
37 Management's Discussion and Analysis
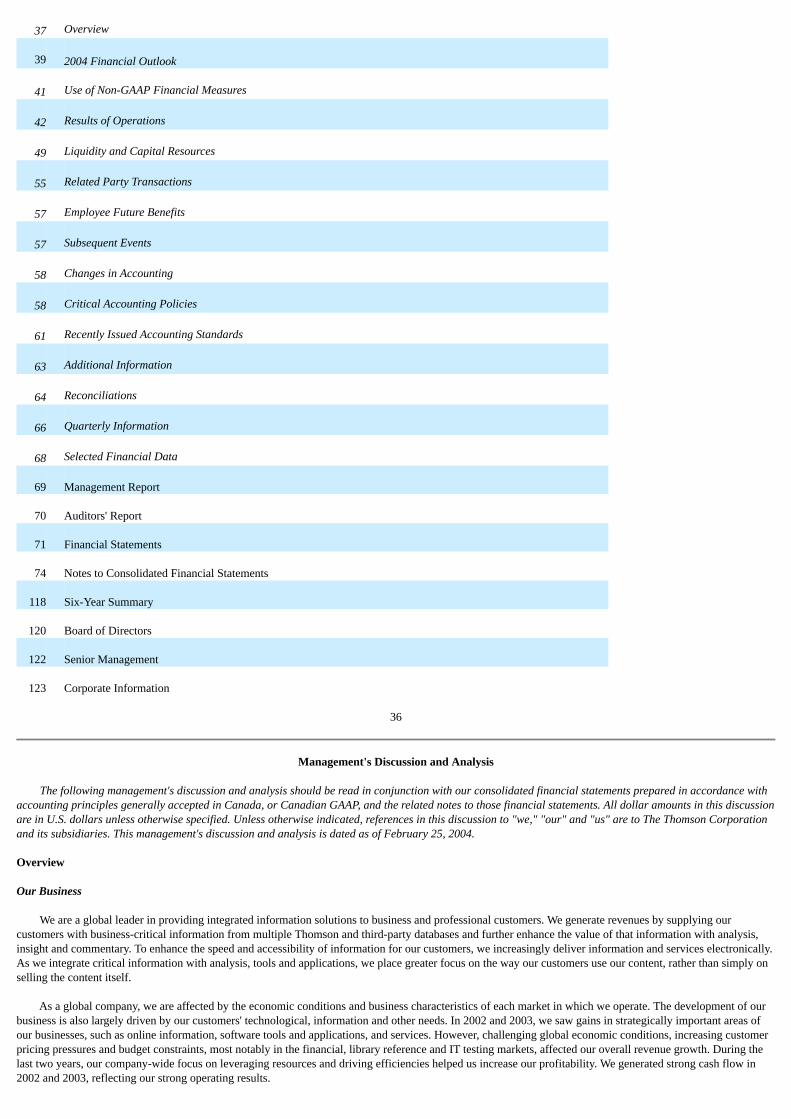
37 Overview
39 2004 Financial Outlook
41 Use of Non-GAAP Financial Measures
42 Results of Operations
49 Liquidity and Capital Resources
55 Related Party Transactions
57 Employee Future Benefits
57 Subsequent Events
58 Changes in Accounting
58 Critical Accounting Policies
61 Recently Issued Accounting Standards
63 Additional Information
64 Reconciliations
66 Quarterly Information
68 Selected Financial Data
69 Management Report
70 Auditors' Report
71 Financial Statements
74 Notes to Consolidated Financial Statements
118 Six-Year Summary
120 Board of Directors
122 Senior Management
123 Corporate Information
36
Management's Discussion and Analysis
The following management's discussion and analysis should be read in conjunction with our consolidated financial statements prepared in accordance withaccounting principles generally accepted in Canada, or Canadian GAAP, and the related notes to those financial statements. All dollar amounts in this discussionare in U.S. dollars unless otherwise specified. Unless otherwise indicated, references in this discussion to "we," "our" and "us" are to The Thomson Corporationand its subsidiaries. This management's discussion and analysis is dated as of February 25, 2004.
Overview
Our Business
We are a global leader in providing integrated information solutions to business and professional customers. We generate revenues by supplying ourcustomers with business-critical information from multiple Thomson and third-party databases and further enhance the value of that information with analysis,insight and commentary. To enhance the speed and accessibility of information for our customers, we increasingly deliver information and services electronically.As we integrate critical information with analysis, tools and applications, we place greater focus on the way our customers use our content, rather than simply onselling the content itself.
As a global company, we are affected by the economic conditions and business characteristics of each market in which we operate. The development of ourbusiness is also largely driven by our customers' technological, information and other needs. In 2002 and 2003, we saw gains in strategically important areas ofour businesses, such as online information, software tools and applications, and services. However, challenging global economic conditions, increasing customerpricing pressures and budget constraints, most notably in the financial, library reference and IT testing markets, affected our overall revenue growth. During thelast two years, our company-wide focus on leveraging resources and driving efficiencies helped us increase our profitability. We generated strong cash flow in2002 and 2003, reflecting our strong operating results.

In 2003, we derived approximately 64% (2002—62%) of our revenues from sales of subscription-based products, 34% (2002—36%) from books and otherproducts and services and only 2% (2002—2%) from advertising. In 2003, we derived 81% (2002—82%) of our revenues from our operations in North America,and 55% (2002—56%) of our revenues from products and services delivered electronically. The following table summarizes selected financial information for2003 and 2002, including certain metrics which are non-GAAP financial measures. Please see the section below entitled "Use of Non-GAAP Financial Measures"for definitions of these terms and refer to the
37
"Reconciliations" section at the end of this management's discussion and analysis for a reconciliation of these measures to the most directly comparable CanadianGAAP measures.
Year ended December 31
(millions of U.S. dollars, except per share amounts)
2003
2002
Change
Consolidated statement of earnings data Revenues 7,606 7,444 2%Operating profit 1,191 1,136 5%Earnings attributable to common shares(1) 879 586 50%Basic and diluted earnings per common share(1) $ 1.34 $ 0.91 47%
Consolidated balance sheet data Cash and cash equivalents 683 709 Total assets 18,680 18,548 Total liabilities 9,480 9,582 Shareholders' equity 9,200 8,966
Other data(2) Adjusted EBITDA 2,064 1,961 5%Adjusted earnings attributable to common shares 705 636 11%Adjusted earnings per common share $ 1.08 $ 0.99 9%Net debt 3,373 3,573 Free cash flow 983 980
(1) Results are not directly comparable due to certain one-time items. For more information, please see the "Results of Operations" section of thismanagement's discussion and analysis.
(2) Non-GAAP financial measures.
We organize our operations into four market groups that are structured on the basis of the customers they serve:
• THOMSON LEGAL & REGULATORY (41% of revenues) is a leading provider of integrated information solutions to legal, tax, accounting, intellectualproperty, compliance and other business professionals, as well as government agencies. Major brands include Westlaw, Aranzadi, BAR/BRI,Carswell, Checkpoint, Compu-Mark, Creative Solutions, Dialog, Elite, FindLaw, GEE, IOB, Lawbook, RIA, Sweet & Maxwell and Thomson &Thomson.
• THOMSON LEARNING (27% of revenues) is a leading provider of tailored learning solutions to colleges, universities, professors, students, libraries,reference centers, government agencies, corporations and professionals. Major brands include Course Technology, Delmar, Gale, Heinle, Nelson,NETg, Peterson's, Prometric, SouthWestern and Wadsworth.
• THOMSON FINANCIAL (20% of revenues) is a leading provider of financial products and information solutions to the global financial servicesindustry, including brokers, financial planners and corporate executives. Major businesses and brands include AutEx, Baseline, BETA Systems,Datastream, DigiTRADE, Disclosure, First Call, I/B/E/S, IFR, Investext, IR Channel, Thomson ONE Equity, Thomson ONE Analytics, ThomsonONE Advisor, Thomson ONE Banker, Thomson ONE Yield and Worldscope.
• THOMSON SCIENTIFIC & HEALTHCARE (10% of revenues) is a leading provider of information and services to researchers, physicians and otherprofessionals in the healthcare, academic, scientific, corporate and government marketplaces. Major businesses and information solutions includeCurrent Drugs IDdb (Investigational Drugs Database), Derwent World Patents Index, Medstat,
38
Micromedex, PDR (Physicians' Desk Reference), Web of Science and Web of Knowledge, and continuing medical education providers PhysiciansWorld and Gardiner-Caldwell.
We also report financial results for a corporate and other reporting category, which constituted 2% of our 2003 total revenues, as well as discontinuedoperations. The corporate and other category principally includes corporate expenses, costs associated with our stock-related compensation and the results ofThomson Media, which is a business unit we established in 2001 to manage print-based businesses that were previously managed in our financial group.
2004 Financial Outlook
We anticipate that the current economic environment will improve in 2004, including the market for U.S. financial services. Consequently, we expect 2004revenue growth to accelerate from the 2% increase achieved in 2003, but to remain below our long-term target of 7% to 9%. This long-term target is not an annualrevenue objective, but is expected to be achieved by our portfolio of businesses over the normal business cycle. Growth is expected to be driven by continued
high growth rates in the strategic areas of the business, supplemented by tactical acquisitions. Our financial group is expected to post a revenue increase in 2004,following two years of declines due to depressed market conditions.
Adjusted EBITDA margins in 2004 are expected to remain consistent with 2003 levels, reflecting continued operating improvement, offset by higher pensionexpense and higher expected stock-related compensation expense.
We expect to continue to generate strong free cash flow in 2004, in line with the level achieved in 2003.
Revenues
Our revenues are derived from a diverse customer base. In both 2003 and 2002, no single customer accounted for more than 2% of our total revenues.
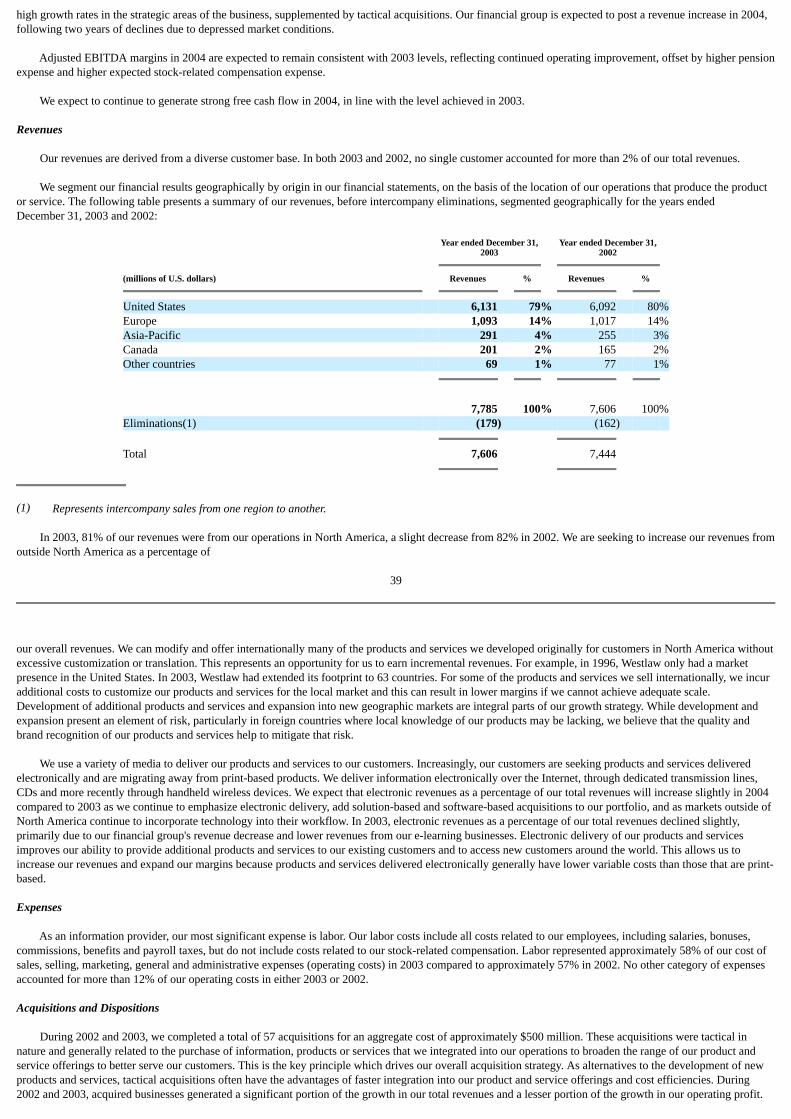
We segment our financial results geographically by origin in our financial statements, on the basis of the location of our operations that produce the productor service. The following table presents a summary of our revenues, before intercompany eliminations, segmented geographically for the years endedDecember 31, 2003 and 2002:
Year ended December 31,2003
Year ended December 31,2002
(millions of U.S. dollars)
Revenues
%
Revenues
%
United States 6,131 79% 6,092 80%Europe 1,093 14% 1,017 14%Asia-Pacific 291 4% 255 3%Canada 201 2% 165 2%Other countries 69 1% 77 1%
7,785 100% 7,606 100%Eliminations(1) (179) (162) Total 7,606 7,444
(1) Represents intercompany sales from one region to another.
In 2003, 81% of our revenues were from our operations in North America, a slight decrease from 82% in 2002. We are seeking to increase our revenues fromoutside North America as a percentage of
39
our overall revenues. We can modify and offer internationally many of the products and services we developed originally for customers in North America withoutexcessive customization or translation. This represents an opportunity for us to earn incremental revenues. For example, in 1996, Westlaw only had a marketpresence in the United States. In 2003, Westlaw had extended its footprint to 63 countries. For some of the products and services we sell internationally, we incuradditional costs to customize our products and services for the local market and this can result in lower margins if we cannot achieve adequate scale.Development of additional products and services and expansion into new geographic markets are integral parts of our growth strategy. While development andexpansion present an element of risk, particularly in foreign countries where local knowledge of our products may be lacking, we believe that the quality andbrand recognition of our products and services help to mitigate that risk.
We use a variety of media to deliver our products and services to our customers. Increasingly, our customers are seeking products and services deliveredelectronically and are migrating away from print-based products. We deliver information electronically over the Internet, through dedicated transmission lines,CDs and more recently through handheld wireless devices. We expect that electronic revenues as a percentage of our total revenues will increase slightly in 2004compared to 2003 as we continue to emphasize electronic delivery, add solution-based and software-based acquisitions to our portfolio, and as markets outside ofNorth America continue to incorporate technology into their workflow. In 2003, electronic revenues as a percentage of our total revenues declined slightly,primarily due to our financial group's revenue decrease and lower revenues from our e-learning businesses. Electronic delivery of our products and servicesimproves our ability to provide additional products and services to our existing customers and to access new customers around the world. This allows us toincrease our revenues and expand our margins because products and services delivered electronically generally have lower variable costs than those that are print-based.
Expenses
As an information provider, our most significant expense is labor. Our labor costs include all costs related to our employees, including salaries, bonuses,commissions, benefits and payroll taxes, but do not include costs related to our stock-related compensation. Labor represented approximately 58% of our cost ofsales, selling, marketing, general and administrative expenses (operating costs) in 2003 compared to approximately 57% in 2002. No other category of expensesaccounted for more than 12% of our operating costs in either 2003 or 2002.
Acquisitions and Dispositions
During 2002 and 2003, we completed a total of 57 acquisitions for an aggregate cost of approximately $500 million. These acquisitions were tactical innature and generally related to the purchase of information, products or services that we integrated into our operations to broaden the range of our product andservice offerings to better serve our customers. This is the key principle which drives our overall acquisition strategy. As alternatives to the development of newproducts and services, tactical acquisitions often have the advantages of faster integration into our product and service offerings and cost efficiencies. During2002 and 2003, acquired businesses generated a significant portion of the growth in our total revenues and a lesser portion of the growth in our operating profit.

Generally, the businesses that we acquired in 2002 and 2003 have initially had lower margins than our existing businesses. In 2003, our largest acquisition wasElite Information Group, a provider of practice management software to law firms that we acquired in May 2003 for $101 million. In 2004, we expect that thetotal amount we will spend on acquisitions will increase from the 2003 level of $211 million.
When integrating acquired businesses, we focus on eliminating cost redundancies and combining the acquired products and services with our existingofferings. We may incur costs, such as severance
40
payments to terminate employees and contract cancellation fees, when we integrate businesses. We include many of these costs in deriving our operating profit.
During 2002 and 2003, we completed a total of 19 dispositions for aggregate consideration of approximately $475 million. In 2003, we also announced theplanned sale of certain businesses which we expect to complete in 2004. While a number of these businesses possessed strong brand equity, loyal customer basesand talented employees, these businesses did not provide the type of synergies that strengthen our core integrated information solutions. The more significant ofthese dispositions were the sale of our 20% interest in Bell Globemedia Inc., or BGM, in April 2003 for $279 million and the sale of our healthcare magazines inOctober 2003 for $135 million. The BGM transaction is discussed in "Related Party Transactions" below and the healthcare magazines transaction is discussed in"Discontinued Operations" below.
Seasonality
We typically derive a much greater portion of our operating profit and operating cash flow in the second half of the year. Customer buying patterns areconcentrated in the second half of the year, particularly in the learning and regulatory markets, while costs are spread more evenly throughout the year. As aresult, our operating margins generally increase as the year progresses. For these reasons, it may not be possible to compare the performance of our businessesquarter to consecutive quarter, and our quarterly results should be considered on the basis of results for the whole year or by comparing results in a quarter withthe results in the same quarter for the previous year. While we report results quarterly, we view and manage our business from a longer-term perspective.
Use of Non-GAAP Financial Measures
In addition to the results reported in accordance with Canadian GAAP, we use non-GAAP financial measures as supplemental indicators of our operatingperformance and financial position. We use these non-GAAP financial measures internally for comparing actual results from one period to another, as well as forfuture planning purposes. We have historically reported non-GAAP financial results as we believe their use provides more insight to our results. The followingdiscussion defines the measures that we use and explains why we believe they are useful measures of our performance, including our ability to generate cashflow:
• ADJUSTED EBITDA. We define Adjusted EBITDA as earnings from continuing operations before interest, taxes, depreciation and amortization, aswell as restructuring charges, net other income (expense) and equity in net losses of associates, net of tax. Among other things, Adjusted EBITDAeliminates the differences that arise between businesses due to the manner in which they were acquired or funded. In particular, Adjusted EBITDAexcludes the effects of amortization of identifiable intangible assets, which is a non-cash charge arising from acquisitions accounted for under thepurchase method of accounting. We also use Adjusted EBITDA margin, which we define as Adjusted EBITDA as a percentage of revenues.
• ADJUSTED OPERATING PROFIT. Operating profit before amortization and restructuring charges, or Adjusted operating profit, reflects depreciationexpense but eliminates the effects of restructuring charges and amortization of identifiable intangible assets. Because we do not consider theseitems to be operating costs, we exclude them from the measurement of our operating performance. We also use Adjusted operating profit margin,which we define as Adjusted operating profit as a percentage of revenues.
• FREE CASH FLOW. We evaluate our operating performance based on free cash flow, which we define as net cash provided by operating activitiesless net additions to property and equipment, other investing activities and dividends paid on our preference shares. We use free cash flow as
41
a performance measure because it represents cash available to repay debt, pay common dividends and fund new acquisitions.
• ADJUSTED EARNINGS AND ADJUSTED EARNINGS PER COMMON SHARE FROM CONTINUING OPERATIONS. We measure our earnings attributable tocommon shares and per share amounts to adjust for non-recurring items and discontinued operations which we refer to as Adjusted earnings fromcontinuing operations and Adjusted earnings per share from continuing operations. We use these measures to assist in comparisons from oneperiod to another. Adjusted earnings per common share from continuing operations does not represent actual earnings per share attributable toshareholders.
• NET DEBT. We measure our indebtedness including associated hedging instruments (swaps) on our debt less cash and cash equivalents. Given thatwe hedge some of our debt to reduce risk, we include hedging instruments as a better measure of the total obligation associated with ouroutstanding debt. We reduce gross indebtedness by cash and cash equivalents, on the basis that they could be used to pay down debt.
These and related measures do not have any standardized meaning prescribed by Canadian GAAP, and therefore, are unlikely to be comparable with thecalculation of similar measures used by other companies. You should not view these measures as alternatives to operating profit, cash flow from operations, netearnings, total debt or other measures of financial performance calculated in accordance with Canadian GAAP. We encourage you to review the reconciliation ofthese non-GAAP financial measures to the most directly comparable Canadian GAAP measure within this management's discussion and analysis.
Results of Operations
Consolidated Operations

Our results from continuing operations exclude businesses that we classify as discontinued operations for all periods presented in the accompanyingconsolidated financial statements. For more information on these businesses, please see the section below entitled "Discontinued Operations." Our market groupresults from continuing operations represent ongoing businesses, which exclude the results of businesses sold or held for sale that do not qualify as discontinuedoperations (i.e., disposals). The principal businesses included in disposals were various businesses in our financial market group. The following table sets forthour summarized results from 2003 and 2002.
Year ended December 31
(millions of U.S. dollars, except per common share amounts)
2003
2002
Change
Revenues 7,606 7,444 2%Adjusted EBITDA 2,064 1,961 5%Adjusted EBITDA margin 27.1% 26.3% Operating profit 1,191 1,136 5%Operating profit margin 15.7% 15.3% Adjusted operating profit 1,476 1,426 4%Adjusted operating profit margin 19.4% 19.2% Net earnings 867 605 43%Earnings attributable to common shares 879 586 50%Earnings per share attributable to common shares $ 1.34 $ 0.91 47%
See the "Reconciliations" section for a reconciliation of the above non-GAAP financial measures to the most directly comparable Canadian GAAP measures.
42
REVENUES. The increase in revenues was primarily attributable to contributions from acquisitions and the impact of favorable foreign currency translation.Growth from certain existing businesses, notably in our legal and regulatory and scientific and healthcare businesses, was offset primarily by reduced revenues inlibrary reference and e-testing businesses in our learning group, transaction-based products in our financial group, and the news and trademark businesses in ourlegal and regulatory group.
To conform to the current year's presentation, revenues and expenses for 2002 within our learning and financial groups have been increased in order topresent on a gross basis certain fees charged to our customers that had previously been netted. This reclassification had no impact on Adjusted EBITDA orAdjusted operating profit, and each reclassification is discussed in more detail within the market group discussions below.
OPERATING PROFIT. Operating profit and related margin growth in 2003 reflected continued efficiency efforts across the corporation and, to a lesser extent,contributions from acquisitions and the favorable impact of foreign currency translation. Those increases were partially offset by higher depreciation expensefrom recent acquisitions and capital expenditures; expense in 2003 associated with our stock appreciation rights, reflecting an increase in the trading price of ourcommon shares during the year, compared to a benefit in 2002; and higher pension expense. The increased pension expense was due to changes in assumptionsand the amortization of deferred losses, as well as the effect of a one-time benefit of $32 million recognized in 2002 in connection with one of our pension plans.This benefit was recorded within corporate and other, and is discussed more fully under that section. There was no such benefit in 2003.
ADJUSTED EBITDA AND ADJUSTED OPERATING PROFIT. Adjusted EBITDA and Adjusted operating profit and related margins increased for the same reasonsdiscussed in the "Operating profit" discussion in the immediately preceding paragraph.
DEPRECIATION AND AMORTIZATION. Depreciation in 2003 increased 10% to $588 million from $535 million in 2002. This increase reflected recentacquisitions and capital expenditures. Amortization was $285 million in 2003, essentially unchanged from $284 million in 2002, as increases due to theamortization of newly acquired assets were offset by decreases arising from the completion of amortization for certain intangible assets acquired in previousyears.
NET OTHER INCOME (EXPENSE). In 2003, net other income was $74 million, compared to a net other expense of $34 million in 2002. The 2003 amountcomprised primarily a gain on the sale of our 20% interest in BGM (discussed in "Related Party Transactions" below), and the receipt of $22 million in July 2003as part of a settlement with Skillsoft PLC, a competitor of our learning group. Under the terms of the settlement, Skillsoft PLC is scheduled to pay us anadditional $22 million in July 2004, which will be recognized upon receipt. In 2002, net expense was primarily comprised of charges associated with the sale orwrite-down of certain investments.
NET INTEREST EXPENSE AND OTHER FINANCING COSTS. Our interest expense in 2003 decreased 13% to $252 million from $291 million in 2002. Thisdecrease reflected lower average levels of outstanding net debt in 2003.
INCOME TAXES. Our income tax expense in 2003 of $156 million represented 15.4% of our earnings from continuing operations before income taxes andour proportionate share of losses on investments accounted for using the equity method of accounting. This compares with income tax expense of $162 million in2002 and an equivalent effective rate of 20.0%. The decrease in the effective rate largely reflected the reversal, in the fourth quarter of 2003, of contingent taxliabilities principally arising from a favorable tax settlement. After consideration of the tax settlement, as well as other tax contingencies as at December 31, 2003,we reduced our liability for tax contingencies by $64 million.
43
Excluding the effect of the adjustment to contingent tax liabilities, our income tax expense in 2003 would have been $220 million, or 21.7% of our earnings fromcontinuing operations before income taxes and our proportionate share of losses on investments accounted for using the equity method of accounting.
Our effective income tax rate in each year was lower than the statutory corporate income tax rate in Canada of 36.6% (2002—38.6%) due principally to thelower tax rates and differing tax rules applicable to our operating and financing subsidiaries outside Canada.
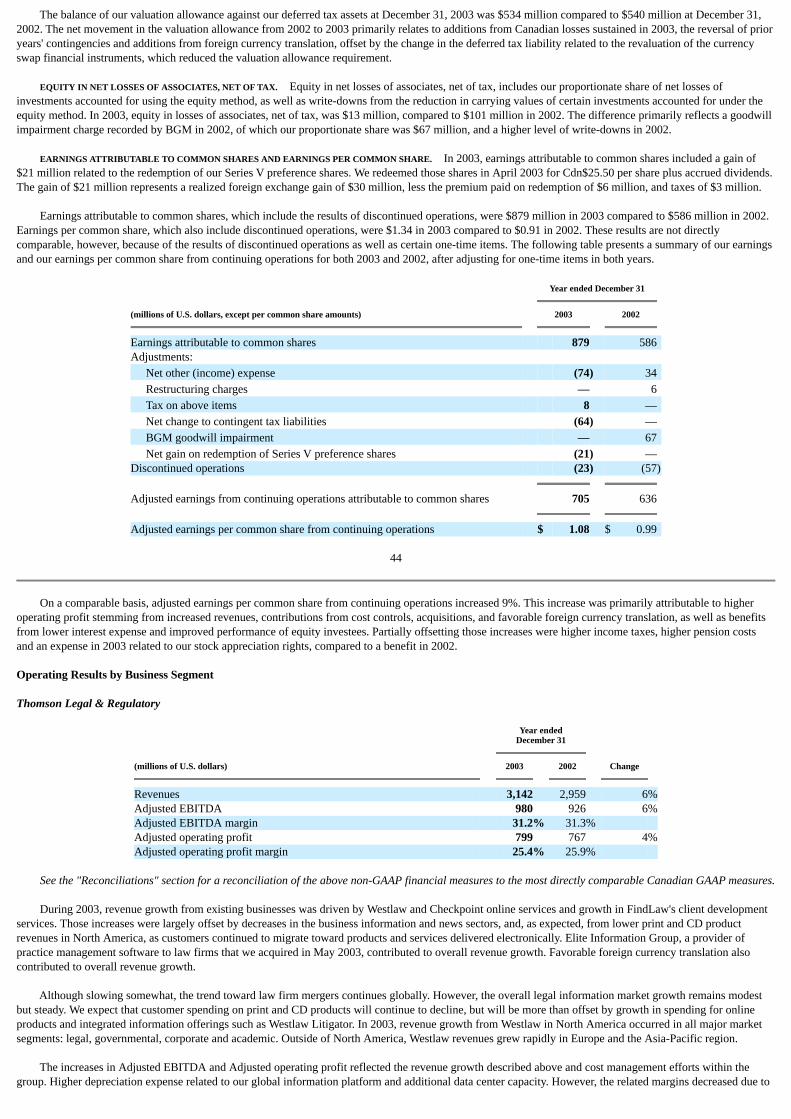
The balance of our valuation allowance against our deferred tax assets at December 31, 2003 was $534 million compared to $540 million at December 31,2002. The net movement in the valuation allowance from 2002 to 2003 primarily relates to additions from Canadian losses sustained in 2003, the reversal of prioryears' contingencies and additions from foreign currency translation, offset by the change in the deferred tax liability related to the revaluation of the currencyswap financial instruments, which reduced the valuation allowance requirement.
EQUITY IN NET LOSSES OF ASSOCIATES, NET OF TAX. Equity in net losses of associates, net of tax, includes our proportionate share of net losses ofinvestments accounted for using the equity method, as well as write-downs from the reduction in carrying values of certain investments accounted for under theequity method. In 2003, equity in losses of associates, net of tax, was $13 million, compared to $101 million in 2002. The difference primarily reflects a goodwillimpairment charge recorded by BGM in 2002, of which our proportionate share was $67 million, and a higher level of write-downs in 2002.
EARNINGS ATTRIBUTABLE TO COMMON SHARES AND EARNINGS PER COMMON SHARE. In 2003, earnings attributable to common shares included a gain of$21 million related to the redemption of our Series V preference shares. We redeemed those shares in April 2003 for Cdn$25.50 per share plus accrued dividends.The gain of $21 million represents a realized foreign exchange gain of $30 million, less the premium paid on redemption of $6 million, and taxes of $3 million.
Earnings attributable to common shares, which include the results of discontinued operations, were $879 million in 2003 compared to $586 million in 2002.Earnings per common share, which also include discontinued operations, were $1.34 in 2003 compared to $0.91 in 2002. These results are not directlycomparable, however, because of the results of discontinued operations as well as certain one-time items. The following table presents a summary of our earningsand our earnings per common share from continuing operations for both 2003 and 2002, after adjusting for one-time items in both years.
Year ended December 31
(millions of U.S. dollars, except per common share amounts)
2003
2002
Earnings attributable to common shares 879 586 Adjustments: Net other (income) expense (74) 34 Restructuring charges — 6 Tax on above items 8 — Net change to contingent tax liabilities (64) — BGM goodwill impairment — 67 Net gain on redemption of Series V preference shares (21) — Discontinued operations (23) (57) Adjusted earnings from continuing operations attributable to common shares 705 636 Adjusted earnings per common share from continuing operations $ 1.08 $ 0.99
44
On a comparable basis, adjusted earnings per common share from continuing operations increased 9%. This increase was primarily attributable to higheroperating profit stemming from increased revenues, contributions from cost controls, acquisitions, and favorable foreign currency translation, as well as benefitsfrom lower interest expense and improved performance of equity investees. Partially offsetting those increases were higher income taxes, higher pension costsand an expense in 2003 related to our stock appreciation rights, compared to a benefit in 2002.
Operating Results by Business Segment
Thomson Legal & Regulatory
Year endedDecember 31
(millions of U.S. dollars)
2003
2002
Change
Revenues 3,142 2,959 6%Adjusted EBITDA 980 926 6%Adjusted EBITDA margin 31.2% 31.3% Adjusted operating profit 799 767 4%Adjusted operating profit margin 25.4% 25.9%
See the "Reconciliations" section for a reconciliation of the above non-GAAP financial measures to the most directly comparable Canadian GAAP measures.
During 2003, revenue growth from existing businesses was driven by Westlaw and Checkpoint online services and growth in FindLaw's client developmentservices. Those increases were largely offset by decreases in the business information and news sectors, and, as expected, from lower print and CD productrevenues in North America, as customers continued to migrate toward products and services delivered electronically. Elite Information Group, a provider ofpractice management software to law firms that we acquired in May 2003, contributed to overall revenue growth. Favorable foreign currency translation alsocontributed to overall revenue growth.
Although slowing somewhat, the trend toward law firm mergers continues globally. However, the overall legal information market growth remains modestbut steady. We expect that customer spending on print and CD products will continue to decline, but will be more than offset by growth in spending for onlineproducts and integrated information offerings such as Westlaw Litigator. In 2003, revenue growth from Westlaw in North America occurred in all major marketsegments: legal, governmental, corporate and academic. Outside of North America, Westlaw revenues grew rapidly in Europe and the Asia-Pacific region.
The increases in Adjusted EBITDA and Adjusted operating profit reflected the revenue growth described above and cost management efforts within thegroup. Higher depreciation expense related to our global information platform and additional data center capacity. However, the related margins decreased due to

the impact of increased pension costs and because recently acquired companies contributed initial margins that were lower than existing businesses. Additionally,margins decreased due to the impact of strengthening foreign currencies on our lower margin international businesses.
45
Thomson Learning
Year endedDecember 31
(millions of U.S. dollars)
2003
2002
Change
Revenues 2,052 2,036 1%Adjusted EBITDA 520 465 12%Adjusted EBITDA margin 25.3% 22.8% Adjusted operating profit 337 302 12%Adjusted operating profit margin 16.4% 14.8%
See the "Reconciliations" section for a reconciliation of the above non-GAAP financial measures to the most directly comparable Canadian GAAP measures.
The increase in revenues during 2003 was attributable to improved performance in the Higher Education sector and favorable foreign currency translation,partially offset by decreases in revenues primarily in our library reference and e-testing businesses.
Within the Higher Education sector, strong growth came from sales to vocational and career markets as well as our international businesses. Decliningdemand arising from budget pressures at educational institutions continued to impact our academic group, despite a year of strong product releases. Sales of bothnew and updated editions of textbooks increased significantly over 2002 levels. However, those sales were offset by a decline in sales of older editions. Whilepost-secondary education enrollment continues to increase, many public post-secondary institutions are dealing with cutbacks in state and local governmentfunding support. While those cuts are not negatively affecting the demand for education, the underlying economic conditions have led to further tuition increasesand a reduction in some course offerings. Those conditions have made students more sensitive about textbook prices, leading to reduced textbook sales.
State government cutbacks have also significantly reduced the amounts spent by libraries on reference materials. These cuts have resulted in an acceleratedmigration of collections to electronic products, and many libraries that had in the past purchased materials in both print and electronic formats are now choosingto purchase in electronic format only. These negative factors led to a decrease in revenues at Gale, despite strong growth in our electronic offerings.
The general economic conditions have led to reduced information technology hiring and reduced corporate spending on employee training, which havenegatively impacted certification volumes at Prometric. NETg's revenues remained virtually unchanged despite the difficult economic conditions. NETg endedthe year on a positive note, with orders received in December 2003 well above those of the comparable period in 2002.
While 2003 was a challenging year for our learning group due to many economic factors, we recognize that education has become a lifelong pursuit in aglobal knowledge-based economy, and we expect to benefit from this growing trend.
To conform to the current year's presentation, revenues and expenses for 2002 have been increased by $26 million in order to present on a gross basis certainfreight and distribution fees charged to our customers that had previously been netted. This reclassification had no impact on Adjusted EBITDA or Adjustedoperating profit. However, it did decrease the Adjusted EBITDA margin and Adjusted operating profit margin for 2002.
In the fourth quarter of 2003, we reduced staffing levels and consolidated office locations at several of our businesses. As a result, we recorded a $16 millioncharge primarily related to severance and lease termination costs. Offsetting this charge were credits of approximately $27 million, which
46
largely related to the reversal of incentive accruals which were no longer required due to the lower than expected performance in several of our learning group'sbusinesses.
The increases in Adjusted EBITDA, Adjusted operating profit, and the related margins in 2003 largely resulted from improved efficiencies realized fromcombining businesses acquired in 2001 from Harcourt General, Inc., or Harcourt, with existing businesses, general cost-containment measures and the impact ofthe items referred to in the preceding paragraph. Additionally, 2002 results included certain non-recurring expenses related to the Harcourt acquisition. Thesefactors were partially offset by increased depreciation due to the deployment of several projects during 2003, most notably a scheduling and registration system inour e-testing business.
Thomson Financial
Year ended December 31
(millions of U.S. dollars)
2003
2002
Change
Revenues 1,523 1,597 (5)%Adjusted EBITDA 406 409 (1)%Adjusted EBITDA margin 26.7% 25.6% Adjusted operating profit 231 240 (4)%Adjusted operating profit margin 15.2% 15.0%
See the "Reconciliations" section for a reconciliation of the above non-GAAP financial measures to the most directly comparable Canadian GAAP measures.

Revenues decreased in each of the major geographical markets served by our financial group, most notably in Europe. The decrease in revenues wasprimarily attributable to the difficult market conditions that prevailed in the global financial services industry, offset partially by the favorable impact of foreigncurrency translation. These difficult market conditions led to reduced earnings for many of our customers. Those customers responded by reducing their capitalspending and budgets, which in turn led to some product cancellations, particularly from our European customers, and pressure on our pricing. Consolidation inthe financial services industry has reduced the number of customers in the market, thereby intensifying competition.
However, deal activity in the fourth quarter of 2003 provided signs of improving market conditions. A high level of fourth-quarter merger and acquisitionactivity led to an overall increase in such activity for the year. Although initial public offering activity declined in 2003 compared to 2002, volume in the fourthquarter of 2003 was the highest in more than three years.
To conform to the current year's presentation, revenues and expenses for 2002 have been increased by $70 million in order to present on a gross basis certainstock exchange fees charged to our customers that had previously been netted. This reclassification had no impact on Adjusted EBITDA or Adjusted operatingprofit; however, it did decrease Adjusted EBITDA margin and Adjusted operating profit margin for 2002.
The decreases in Adjusted EBITDA and Adjusted operating profit reflected the reduced revenues, which were partially mitigated by cost-containmentactions. The 2003 amounts include a net benefit of $4 million related to insurance claims for September 11, 2001 losses recorded in earlier periods. Comparabilitywas also affected by a net benefit of $10 million recorded in the fourth quarter of 2002, which represented a $30 million reversal of bonus-related accruals and a$20 million severance charge.
Despite the decreases in Adjusted EBITDA and Adjusted operating profit, the related margins showed improvements, primarily due to the effects ofleveraging initiatives, cost controls and technology platform consolidation across the businesses in our financial group.
47
Thomson Scientific & Healthcare
Year endedDecember 31
(millions of U.S. dollars)
2003
2002
Change
Revenues 760 692 10%Adjusted EBITDA 217 187 16%Adjusted EBITDA margin 28.6% 27.0% Adjusted operating profit 186 160 16%Adjusted operating profit margin 24.5% 23.1%
See the "Reconciliations" section for a reconciliation of the above non-GAAP financial measures to the most directly comparable Canadian GAAP measures.
The increase in revenues in 2003 was attributable to growth from existing businesses, contributions from acquired companies and, to a lesser extent,favorable foreign currency translation. Growth from existing businesses was primarily due to increases in continuing medical education revenues, growth in ourWeb of Science and Web of Knowledge products, higher revenues from our PDR (Physicians' Desk Reference) and higher Micromedex electronic subscriptionrevenues. These increases reflect continuing investments by our customers in basic research and drug development and the increasing demand for healthcarepoint-of-care and management information solutions fueled by the aging U.S. population. Revenue growth from acquisitions resulted primarily from CurrentDrugs, a provider of databases to the pharmaceutical and biotechnology industries acquired in August 2002; and Delphion Research Site, a patent researchsolution acquired in December 2002. The revenue increases were partly offset by lower sales of patent information at Derwent.
We believe that demand for scientific information will continue to grow because scientific research and development funding are considered to be necessary,not discretionary, expenditures for our customers. Within the healthcare information market, we see a continuation of the trend toward delivering information tophysicians and other healthcare professionals at the point of care. We also see continued growth in the continuing medical education market because physiciansmust be made aware of the existence of new drugs and their benefits and risks before considering them as treatment options for their patients.
The increases in Adjusted EBITDA and Adjusted operating profit primarily resulted from these increased revenues. Corresponding margins increased as aresult of cost controls.
Corporate and Other
Revenues, which relate solely to Thomson Media, remained constant at $164 million. The revenue performance reflected continued weakness in the globalfinancial services industry and the related advertising market.
In 2003, the overall Adjusted EBITDA loss for corporate and other was $60 million, compared to a loss in 2002 of $35 million. The increased loss in 2003was primarily attributable to a $32 million benefit recorded in 2002 in connection with one of our U.K. pension plans. Additionally, in 2003 we recognized anexpense associated with our stock appreciation rights, reflecting an increase in the trading price of our common shares, compared to the recognition of a benefit in2002.
The $32 million benefit recorded in 2002 related to a reversal of a valuation allowance against the assets of one of our U.K. pension plans. Canadianaccounting principles require us to record a valuation allowance against the assets of overfunded pension plans if the assets cannot be used by us to reduce futurecontributions to the plans. When the values of these assets decline, the need for the valuation allowance against the assets also declines. However, we recognizethe decline in the value of the assets over time, while we recognize in income immediately the reduction in the valuation
48

allowance, as computed on the measurement date of the plan. In the fourth quarter of 2002, such a situation occurred with respect to one of our U.K. pensionplans due to the decline in equity markets. As such, we reversed the valuation allowance against the assets, which resulted in a pre-tax benefit of $32 million.There was no such benefit in 2003.
Effective January 1, 2003, we began expensing the fair value of all stock options issued with restatement of prior periods. Included within "Corporate andother" for 2003 were charges of $19 million (2002—$17 million), related to compensation expense associated with stock options.
Discontinued Operations
In October 2003, we sold our portfolio of healthcare magazines for $135 million and recorded the related post-tax gain of $63 million in the fourth quarter of2003. The magazines had previously been managed within our scientific and healthcare group.
In November 2003, we expressed our intention to sell Sheshunoff Information Services Inc., a provider of critical data, compliance and management tools tofinancial institutions, which had been managed within Thomson Media. We are working toward completing a sale in the first half of 2004. Based on recentestimates of fair market value, we recorded a pre-tax impairment charge of $24 million relating to intangible assets in the fourth quarter of 2003 withindiscontinued operations.
In February 2004, we completed the sale of DBM, a provider of human resource solutions, which had been managed within our learning group. Based on thestatus of the negotiations at December 31, 2003, we recorded a pre-tax impairment charge of $62 million relating to intangible assets within discontinuedoperations.
These three businesses, along with one other small business formerly managed in our learning group that was sold in June 2003, are classified asdiscontinued operations within our consolidated financial statements. None of these businesses is considered fundamental to our integrated information offerings.
For more information on these discontinued operations, see Note 6 to our consolidated financial statements.
Liquidity and Capital Resources
Financial Position
At December 31, 2003, our total assets were $18,680 million, which represented a 1% increase from the December 31, 2002 total of $18,548 million. Thisincrease was primarily due to the impact of foreign currency translation and an increase in goodwill arising from acquisitions, partly offset by the effect ofdepreciation and amortization and the sale of our 20% interest in BGM (discussed below in "Related Party Transactions").
49
Our total assets by market group as of December 31, 2003 and 2002 were as follows:
Year ended December 31, 2003
Year ended December 31, 2002
(millions of U.S. dollars)
Totalassets
Percentage oftotal assets
Totalassets
Percentage oftotal assets
Legal & Regulatory 7,412 40% 7,195 39%Learning 5,108 27% 5,068 28%Financial 2,914 16% 3,022 16%Scientific & Healthcare 994 5% 985 5%Corporate and other 1,988 11% 1,902 10%Discontinued operations 264 1% 376 2% Total assets 18,680 100% 18,548 100%
The following table presents comparative information related to total net debt, which we define as total debt, after accounting for swap arrangements, lesscash and cash equivalents; shareholders' equity and the ratio of net debt to shareholders' equity:
As at December 31
(millions of U.S. dollars)
2003
2002
Short-term indebtedness 87 316 Current portion of long-term debt 484 318 Long-term debt 3,684 3,487 Total debt 4,255 4,121 Swaps (199) 161 Total debt after swaps 4,056 4,282 Less: Cash and cash equivalents (683) (709) Net debt 3,373 3,573
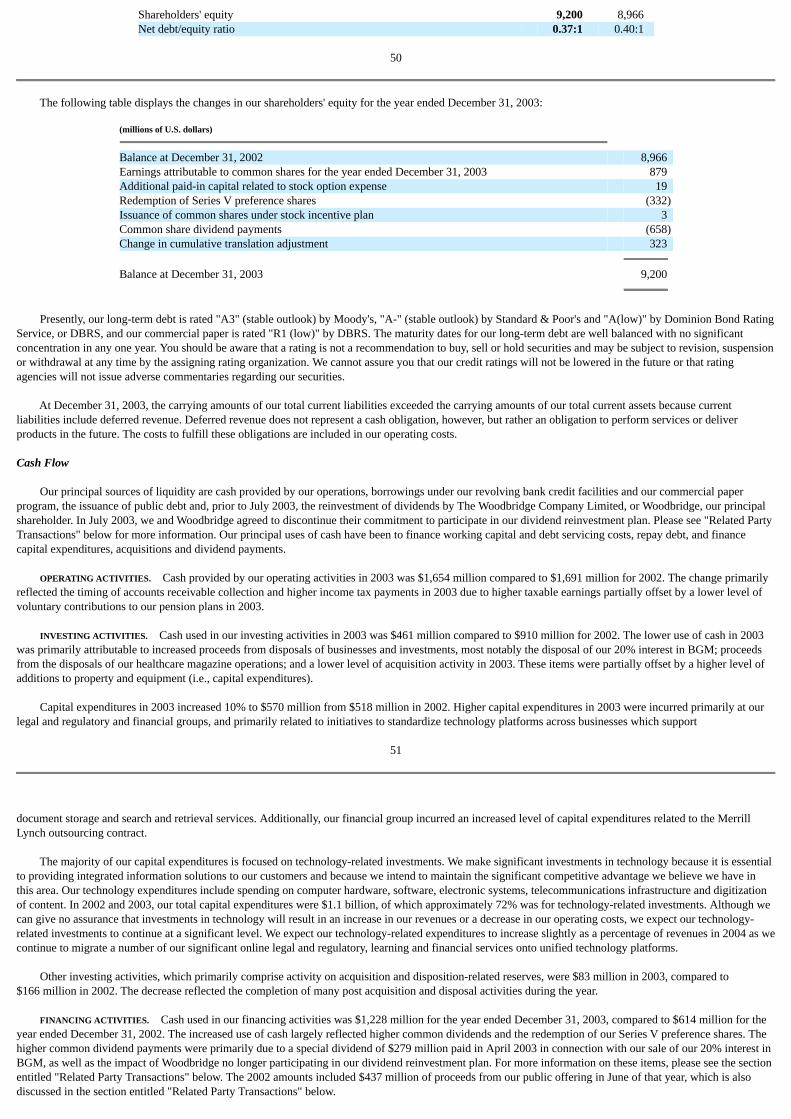
Shareholders' equity 9,200 8,966 Net debt/equity ratio 0.37:1 0.40:1
50
The following table displays the changes in our shareholders' equity for the year ended December 31, 2003:
(millions of U.S. dollars)
Balance at December 31, 2002 8,966 Earnings attributable to common shares for the year ended December 31, 2003 879 Additional paid-in capital related to stock option expense 19 Redemption of Series V preference shares (332)Issuance of common shares under stock incentive plan 3 Common share dividend payments (658)Change in cumulative translation adjustment 323 Balance at December 31, 2003 9,200
Presently, our long-term debt is rated "A3" (stable outlook) by Moody's, "A-" (stable outlook) by Standard & Poor's and "A(low)" by Dominion Bond RatingService, or DBRS, and our commercial paper is rated "R1 (low)" by DBRS. The maturity dates for our long-term debt are well balanced with no significantconcentration in any one year. You should be aware that a rating is not a recommendation to buy, sell or hold securities and may be subject to revision, suspensionor withdrawal at any time by the assigning rating organization. We cannot assure you that our credit ratings will not be lowered in the future or that ratingagencies will not issue adverse commentaries regarding our securities.
At December 31, 2003, the carrying amounts of our total current liabilities exceeded the carrying amounts of our total current assets because currentliabilities include deferred revenue. Deferred revenue does not represent a cash obligation, however, but rather an obligation to perform services or deliverproducts in the future. The costs to fulfill these obligations are included in our operating costs.
Cash Flow
Our principal sources of liquidity are cash provided by our operations, borrowings under our revolving bank credit facilities and our commercial paperprogram, the issuance of public debt and, prior to July 2003, the reinvestment of dividends by The Woodbridge Company Limited, or Woodbridge, our principalshareholder. In July 2003, we and Woodbridge agreed to discontinue their commitment to participate in our dividend reinvestment plan. Please see "Related PartyTransactions" below for more information. Our principal uses of cash have been to finance working capital and debt servicing costs, repay debt, and financecapital expenditures, acquisitions and dividend payments.
OPERATING ACTIVITIES. Cash provided by our operating activities in 2003 was $1,654 million compared to $1,691 million for 2002. The change primarilyreflected the timing of accounts receivable collection and higher income tax payments in 2003 due to higher taxable earnings partially offset by a lower level ofvoluntary contributions to our pension plans in 2003.
INVESTING ACTIVITIES. Cash used in our investing activities in 2003 was $461 million compared to $910 million for 2002. The lower use of cash in 2003was primarily attributable to increased proceeds from disposals of businesses and investments, most notably the disposal of our 20% interest in BGM; proceedsfrom the disposals of our healthcare magazine operations; and a lower level of acquisition activity in 2003. These items were partially offset by a higher level ofadditions to property and equipment (i.e., capital expenditures).
Capital expenditures in 2003 increased 10% to $570 million from $518 million in 2002. Higher capital expenditures in 2003 were incurred primarily at ourlegal and regulatory and financial groups, and primarily related to initiatives to standardize technology platforms across businesses which support
51
document storage and search and retrieval services. Additionally, our financial group incurred an increased level of capital expenditures related to the MerrillLynch outsourcing contract.
The majority of our capital expenditures is focused on technology-related investments. We make significant investments in technology because it is essentialto providing integrated information solutions to our customers and because we intend to maintain the significant competitive advantage we believe we have inthis area. Our technology expenditures include spending on computer hardware, software, electronic systems, telecommunications infrastructure and digitizationof content. In 2002 and 2003, our total capital expenditures were $1.1 billion, of which approximately 72% was for technology-related investments. Although wecan give no assurance that investments in technology will result in an increase in our revenues or a decrease in our operating costs, we expect our technology-related investments to continue at a significant level. We expect our technology-related expenditures to increase slightly as a percentage of revenues in 2004 as wecontinue to migrate a number of our significant online legal and regulatory, learning and financial services onto unified technology platforms.
Other investing activities, which primarily comprise activity on acquisition and disposition-related reserves, were $83 million in 2003, compared to$166 million in 2002. The decrease reflected the completion of many post acquisition and disposal activities during the year.
FINANCING ACTIVITIES. Cash used in our financing activities was $1,228 million for the year ended December 31, 2003, compared to $614 million for theyear ended December 31, 2002. The increased use of cash largely reflected higher common dividends and the redemption of our Series V preference shares. Thehigher common dividend payments were primarily due to a special dividend of $279 million paid in April 2003 in connection with our sale of our 20% interest inBGM, as well as the impact of Woodbridge no longer participating in our dividend reinvestment plan. For more information on these items, please see the sectionentitled "Related Party Transactions" below. The 2002 amounts included $437 million of proceeds from our public offering in June of that year, which is alsodiscussed in the section entitled "Related Party Transactions" below.

The following table sets forth our common dividend activity. Prior to July 2003, reinvested dividends related primarily to Woodbridge.
Year ended December 31
2003
2002
Regular dividends declared 473 451 Special dividends declared 279 — Dividends reinvested (94) (168) Dividends paid 658 283
The following describes our significant financing activities from each year.
In August 2003, we completed an offering of $450 million of global unsecured notes, raising approximately $445 million in net proceeds after expenses. Theoffering included $200 million of 4.25% notes due 2009 and $250 million of 5.25% notes due 2013. We entered into an interest rate swap related to the 4.25%notes to convert the notes from a fixed rate of interest to a floating rate of interest. We used a portion of the proceeds to redeem $250 million of preferred sharesissued to a subsidiary of Woodbridge (which shares previously had been included in "Long-term debt" in our consolidated balance sheet) and used the balance ofthe proceeds to repay other outstanding indebtedness and for general corporate purposes. Following the completion of this offering, in September 2003 we filed ashelf registration statement covering the sale of up to $2 billion in debt securities. As of December 31, 2003, the entire amount remained available under thisregistration. The shelf registration is valid until October 2005.
52
In April 2003, we redeemed all 18,000,000 of our outstanding Series V preference shares for $308 million, plus $3 million of associated tax.
On June 12, 2002, our common shares were listed on the New York Stock Exchange. On June 14, 2002, we and our principal shareholder, Woodbridge,completed a public offering of 32,051,284 common shares at a price of $31.20 per share. The offering included 14,615,385 common shares newly issued by usand 17,435,899 common shares held by Woodbridge. Proceeds to us from the offering, net of the underwriting commissions and expenses, of $437 million wereused for general corporate purposes, including the repayment of indebtedness. We did not receive any proceeds from the sale of common shares by Woodbridge.The expenses incurred from the offering were divided equally between us and Woodbridge, other than the underwriting commission, which was allocated basedupon the proportionate share of the proceeds from the offering received by each party.
In January 2002, we issued $400 million of 5.75% notes due 2008. We used the net proceeds of $397 million from the offering primarily to repayindebtedness.
FREE CASH FLOW. The following table sets forth a calculation of our free cash flow for 2003 and 2002:
Year ended December 31
(millions of U.S. dollars)
2003
2002
Net cash provided by operating activities 1,654 1,691 Additions to property and equipment (570) (518)Other investing activities (83) (166)Dividends paid on preference shares (11) (22)Additions to property and equipment of discontinued operations (7) (5)
Free cash flow 983 980
Our free cash flow for 2003 benefited from increased Adjusted EBITDA, lower voluntary pension contributions and lower acquisition and disposition-related reserve activity. Those items, however, were essentially offset by higher capital expenditures, higher tax payments due to higher taxable earnings and thetiming of accounts receivable collection.
CREDIT FACILITIES AND COMMERCIAL PAPER PROGRAM. We maintain revolving unsecured credit facilities that we have historically used to support theissuance of commercial paper. Borrowings under our commercial paper program reduce the amount available to us under our credit facilities. In 2003, werenewed our existing credit facilities and entered into new arrangements with certain financial institutions. At December 31, 2003, our credit lines and relatedactivity were as follows:
(millions of U.S. dollars)Type
Creditlines
Amountdrawn
Commercialpaper
outstanding(1)
Linesavailable
Multi-year 1,040 (65) (76) 899364-day 520 — — 520 Total 1,560 (65) (76) 1,419
(1) Includes related currency swaps.

Our commercial paper program authorizes us to issue up to Cdn$1 billion.
53
Our multi-year facilities currently expire in March 2008. Of our 364-day facilities, $195 million expires in September 2004 and the remaining $325 millionexpires in March 2005. Although not currently anticipated, if our long-term debt rating was downgraded by Moody's or Standard & Poor's, our facility fee andborrowing costs under our existing multi-year credit facilities may increase, although availability would be unaffected. Conversely, an upgrade in our ratings mayreduce our facility fees and borrowing costs.
COMMITMENTS. The following table presents a summary of our long-term debt and related currency swap instruments, as well as our off-balance sheetcontractual obligations as of December 31, 2003 for the years indicated:
(millions of U.S. dollars)
2004
2005
2006
2007
2008
Thereafter
Total
Long-term debt 484 316 432 635 771 1,530 4,168 Currency swap instruments (9) (5) (31) (58) (45) (51) (199) Hedged debt 475 311 401 577 726 1,479 3,969 Operating lease payments 190 173 132 112 98 344 1,049 Unconditional purchase obligations 103 28 13 3 1 — 148 Capital commitments to investees 15 — — — — — 15 Total 783 512 546 692 825 1,823 5,181
We have entered into operating leases in the ordinary course of business, primarily for real property and equipment. Payments for these leases are contractualobligations as scheduled per each agreement. With certain leases, we guarantee a portion of the residual value loss, if any, incurred by the lessors in disposing ofthe assets, or to restore a property to a specified condition after completion of the lease period. With certain real property leases, we guarantee the rentalobligations of some of our subsidiaries that are tenants. We believe, based upon current facts and circumstances, that a material payment pursuant to suchguarantees is remote.
We have various unconditional purchase obligations. These obligations are for materials, supplies and services incident to the ordinary conduct of business.
We have obligations to pay additional consideration for prior acquisitions, typically based upon performance measures contractually agreed to at the time ofpurchase. Known payments have been accrued. We do not believe that additional payments would have a material impact on our financial statements.Additionally, we have capital commitments to investees of $15 million of which $11 million is payable upon demand and $4 million is payable only upon theattainment of certain operational milestones by the investee.
In certain disposition agreements, we guarantee to the purchaser the recoverability of certain assets or limits on certain liabilities. We believe, based uponcurrent facts and circumstances, that a material payment pursuant to such guarantees is remote. In connection with two prior dispositions, we have guaranteedcertain obligations of which $29 million remain potentially outstanding at December 31, 2003. At this time, we estimate that we will incur $13 million of theremaining contingency, and we have accrued this estimate within "Accounts payable and accruals" and "Other non-current liabilities" in our consolidated balancesheet.
We guarantee certain obligations of our subsidiaries, including borrowings by our subsidiaries under our revolving credit facilities. These guaranteesgenerally require that we maintain a minimum amount of capital and retained earnings and that our net debt-to-equity ratio not exceed 2.0:1.
Other than as described above, we do not engage in any off-balance sheet financing arrangements. In particular, we do not have any interests inunconsolidated special-purpose or structured finance entities.
54
For the foreseeable future, we believe that cash from our operations and available credit facilities are sufficient to fund our future cash dividends, debtservice, projected capital expenditures and tactical acquisitions that we pursue in the normal course of business.
Market Risks
Our consolidated financial statements are expressed in U.S. dollars but a portion of our business is carried on in currencies other than U.S. dollars. Changesin the exchange rates for such currencies into U.S. dollars can affect our revenues, earnings and the carrying values of our assets and liabilities in our consolidatedbalance sheet, either positively or negatively. Changes in exchange rates between 2002 and 2003 increased our revenues by approximately 2%. The translationeffects of changes in exchange rates in our consolidated balance sheet are recorded within the cumulative translation adjustment component of our shareholders'equity. In 2003, we recorded cumulative translation gains of $309 million, reflecting changes in exchange rates of various currencies compared to the U.S. dollar.
We use derivative instruments only to reduce our foreign currency and interest rate exposures. In particular, when we borrow money in currencies other thanthe U.S. dollar, we generally enter into currency swap arrangements to effectively convert our obligations into U.S. dollars. All such swap arrangements areentered into only with counterparties that are investment-grade financial institutions. At December 31, 2003, 98% of our indebtedness was denominated in U.S.dollars or had been swapped into U.S. dollar obligations.
At December 31, 2003, after taking into account interest rate swap agreements, 84% of our total debt was at fixed rates of interest and the remainder was atfloating rates of interest. Based upon these levels, a 1% change in floating interest rates would increase or decrease our full-year interest expense byapproximately $6 million.

Set out below are the U.S. dollar equivalents of our local currency revenues and operating profit. Based on our 2003 results of operations, a 10% change inthe average exchange rate for each of these currencies into U.S. dollars would increase or decrease our full year revenues and operating profit by the followingamounts:
(millions of U.S. dollars)Currency
Revenuesas reported
Impact onrevenues
Operatingprofit asreported
Impact onoperating
profit
U.S. dollar 6,136 — 1,061 —British pound sterling 675 67 80 8Euro 223 22 13 1Canadian dollar 198 20 35 3Australian dollar 131 13 6 1Other 243 25 (4) — Total 7,606 147 1,191 13
In addition to exposing us to changes in foreign currency exchange rates and interest rates, operating in foreign countries subjects us to certain risks that areinherent in doing business in certain jurisdictions outside North America, including difficulties in penetrating new markets, exposure to varying legal standards inother jurisdictions and potential instability of international economies and governments.
Related Party Transactions
As at March 5, 2004, through Woodbridge and its affiliates, Kenneth R. Thomson controlled approximately 69% of our common shares.
55
In the normal course of business, a Woodbridge-owned company rents office space from one of our subsidiaries. Additionally, a number of our subsidiariescharge a Woodbridge-owned company administrative fees for various services. In 2003, the total amount charged to Woodbridge for these rentals and serviceswas approximately $2 million. Additionally, in 2003, we paid one of our directors, Mr. J.A. Tory, $89,000 for advisory services in connection with our long-termtax and capital strategies.
The employees of Jane's Information Group, a business sold by us to Woodbridge in April 2001, continue to participate in our United States and UnitedKingdom pension plans. Jane's makes proportional contributions to these plans as required.
In September 2003, we redeemed $250 million of preferred shares issued by a Thomson subsidiary to a subsidiary of Woodbridge. The shares, which wereoriginally issued in February 2001 and exchanged in February 2002 for separate preferred shares in the same face amount, paid a fixed annual dividend of 4.5%and by their original terms were redeemable at the option of either Woodbridge or us beginning February 2006 and annually thereafter. Prior to the redemption,the shares were included within "Long-term debt" in the consolidated balance sheet.
In July 2003, we announced that Woodbridge had agreed to discontinue its commitment to participate in our dividend reinvestment plan. Previously,Woodbridge had agreed to reinvest at least 50% of the quarterly dividends received by it and its subsidiaries in our common shares through June 2005. Thetermination of this commitment reflects our expected ability to generate sufficient cash flow for our dividends. All eligible shareholders of our company,including Woodbridge, retain the ability to reinvest their dividends in Thomson stock on a voluntary basis under the dividend reinvestment plan. However,Woodbridge has advised management that it has no current intention to voluntarily participate.
In March 2003, we sold our 20% interest in BGM to a company that is owned by the Thomson family for $279 million. In the event that BGM issubsequently sold to a third party for a gain prior to February 7, 2005, we are entitled to receive half of the gain relative to our former interest, subject to certainadjustments. If no such gains are recognized from a subsequent sale to a third party, we are not required to reimburse the former owner for any losses. Our Boardof Directors appointed a committee of independent directors to review the transaction. The committee retained a financial advisor to provide an opinion to us as tothe fairness of the transaction to us from a financial point of view. One of our directors is also a director of the parent company of the financial advisor, but wasnot a member of the committee. In connection with the sale, we paid a special dividend, equal to the proceeds received of $0.428 per common share.
In September 2002, we sold a parcel of properties located in Toronto, Ontario to Woodbridge for $15 million. In connection with this transaction, wereceived a report from a financial advisor providing an assessment of market values of those properties. The transaction was recorded based upon the $15 millionexchanged in the transaction, and the proceeds were recorded in "Proceeds from disposals of businesses and investments" while the resulting gain of $2 millionwas included in "Net other income (expense)" within the consolidated financial statements. If Woodbridge sells any of the properties for a gain prior toSeptember 30, 2005, we are entitled to receive half of the gain subject to certain adjustments. If Woodbridge does not recognize any such gains, we are notrequired to reimburse Woodbridge for any losses. In prior periods, we had maintained a liability of $8 million for certain of the above-noted properties that wereto be contributed to BGM. During 2002, we negotiated an agreement with BGM under which we paid cash to BGM equivalent to the recorded liability, in order torelieve us of our obligation to contribute these properties. The properties were then included within the parcel of properties sold to Woodbridge.
In September 2002, we entered into an agreement with Woodbridge to reduce the cost of our directors' and officers' insurance coverage. Under the terms ofthe agreement, we maintain standard directors' and officers' insurance for any amount up to $15 million with a third-party insurance
56
company. A separate third-party insurer is responsible for the next $75 million of coverage. Woodbridge indemnifies this second insurer. For its agreement toindemnify the insurer, we pay Woodbridge an annual premium of $685,000, which is less than the premium that we would have paid to a third party.

In June 2002, we completed a series of transactions to assist Woodbridge in reorganizing its holding of our common shares to achieve certain Canadian taxobjectives. Similar transactions were completed at the same time with certain companies affiliated with Woodbridge and a company controlled by one of ourdirectors. We issued an aggregate of 431,503,802 common shares to members of this group of companies, and a wholly-owned subsidiary of our companyacquired the same number of common shares from members of this group of companies. Immediately following the acquisition, the wholly- owned subsidiarywas wound up into our company and the 431,503,802 common shares it held were cancelled. The total number of our common shares outstanding, as well as ourstated capital, was the same before and after this series of transactions. Woodbridge and the other companies have reimbursed us for all costs and expenses arisingfrom, and have agreed to indemnify us, our officers, directors and shareholders against any liabilities that may arise in connection with the series of transactions.These transactions had no economic effect, did not cause any change to our common shares or result in any other consequence to us or to our other shareholders.
In June 2002, our wholly-owned U.K. subsidiary, The Thomson Corporation PLC, redeemed its outstanding Series A ordinary shares for $0.6 million. TheSeries A ordinary shares were held by Woodbridge.
Employee Future Benefits
In September 2003, we contributed $50 million (2002—$107 million) to our principal qualified defined benefit pension plan in the United States. In thefourth quarter of 2003, we contributed $31 million (2002—$35 million) to various benefit plans, principally in the United Kingdom and Canada. While none ofthese contributions were required under the applicable funding rules and regulations governing each country, we decided to make the voluntary contributions inlight of the decrease in interest rates, which increased the present value of the future pension obligations. As a result of the contribution, the fair value of the U.S.plan assets was sufficient to fund the accumulated benefit obligation on its measurement date.
We are not required to make contributions to our major pension plan, which is in the U.S., in 2004. However, from time to time, we may elect to voluntarilycontribute to the plan in order to improve its funded status. Because the decision to voluntarily contribute is based on various market-related factors, includingasset values and interest rates, which are used to determine the plan's funded status, we cannot predict whether, or the amount, we may elect to voluntarilycontribute in 2004.
The determination of the cost and obligations associated with employee future benefits requires the use of various assumptions, including an expected rate ofreturn on assets and a discount rate to measure obligations. We consult with our actuaries regarding the selection of these assumptions each year. Reflecting ourexpectation of future investment returns, we will reduce our 2004 assumption of the expected rate of return on assets available to fund obligations. Similarly, in2004 we will lower our assumed discount rate to measure obligations to reflect lower interest rates. These assumption changes had no impact on the 2003 cost ofbenefits. Management currently estimates that the changes in assumptions will cause the 2004 cost of employee future benefits to increase by approximately$30 million.
Subsequent Events
In January 2004, we acquired the publishing assets of Biological Abstracts, Inc. and BIOSIS. BIOSIS offers both custom and standard information resourcesdesigned to fit the information needs of
57
researchers, students and information professionals worldwide. BIOSIS is now part of our scientific and healthcare group.
Also in January 2004, we announced that we had signed a definitive agreement to acquire the 90% of Corporate Communications Broadcast Network, orCCBN, Inc., that we did not previously own. CCBN provides web-based solutions for the investment community, offering services to enhance the way companiescommunicate and meet disclosure requirements, and assists investors in managing and leveraging this information. If the transaction closes as contemplated,CCBN will be a part of our financial group.
In February 2004, we completed the sale of DBM.
Changes in Accounting
Effective January 1, 2003, we began expensing the fair value of all stock options issued as allowed under Canadian Institute of Chartered Accountants, orCICA, Handbook Section 3870, Stock-Based Compensation and Other Stock-Based Payments. Prior to January 1, 2003, we used the intrinsic value-based methodto account for our stock incentive plan and no compensation expense had been recognized under the plan. This change in policy has been applied retroactively forall periods. For the year ended December 31, 2002, compensation expense recorded in connection with the stock incentive plan was $17 million before incometaxes. Details of the restatements made to previously reported financial statements are discussed in Note 2 to our consolidated financial statements.
In July 2001, the CICA issued Handbook Section 3062, Goodwill and Other Intangible Assets, or CICA 3062. CICA 3062, which became effectiveJanuary 1, 2002, eliminates the amortization of goodwill and identifiable intangible assets with indefinite useful lives, but subjects such assets to tests forimpairment based upon comparing carrying values to their fair values at least annually or when certain conditions arise. This fair value-based approach toimpairment differs from the previous approach, under which impairment was determined by comparing net carrying amounts to net recoverable amounts.
The transitional provisions of CICA 3062 required that we perform an initial impairment test as of January 1, 2002. During the first quarter of 2002, as aresult of that transitional impairment test and the adoption of the provisions of this new accounting standard, we recorded pretax reductions in the carryingamounts of identifiable intangible assets with indefinite useful lives of $26 million and goodwill of $50 million related to a unit in our Scientific & Healthcaregroup. Additionally, during the second quarter of 2002, we recorded a transitional impairment charge of $116 million in connection with the application of CICA3062 by BGM, an equity-method investment. Those non-cash charges, which totaled $183 million after taxes, were applied to the opening balance of retainedearnings as of January 1, 2002.
Critical Accounting Policies
The preparation of our financial statements requires management to make judgments, estimates and assumptions that affect the reported amounts of assetsand liabilities, disclosure of contingent assets and liabilities at the date of the financial statements and the reported amount of revenues and expenses during thereporting period. Our estimates are based on historical experience and on various other assumptions that are believed to be reasonable under the circumstances.

The result of our ongoing evaluation of these estimates forms the basis for making judgments about the carrying values of assets and liabilities and the reportedamounts of revenues and expenses that are not readily apparent from other sources. Actual results may differ from these estimates under different assumptions.
58
Our critical accounting policies are those that we believe are the most important in portraying our financial condition and results, and require the mostsubjective judgment and estimates on the part of management. A summary of our significant accounting policies, including the critical accounting policiesdiscussed below, is set forth in Note 1 to our consolidated financial statements.
Revenue Recognition
Revenues from subscription-based products, excluding software, generally are recognized ratably over the term of the subscription. Where applicable, werecognize usage fees as earned. Subscription payments received or receivable in advance of delivery of our products or services are included in our deferredrevenue account on our consolidated balance sheet. As we deliver subscription-based products and services to subscribers, we recognize the proportionate shareof deferred revenue in our consolidated statement of earnings and our deferred revenue account balance is reduced. Certain incremental costs that are directlyrelated to the subscription revenue are deferred and amortized over the subscription period.
Revenues from sales of products such as books, that are separate and distinct from any other product and carry no further substantive performanceobligations on our part after shipment, are recognized when delivery has occurred and significant risks and rewards of ownership have transferred to the customer,provided that the price is fixed or determinable and ultimate collection is reasonably assured. We recognize revenues from sales of discrete products net ofestimated returns. Significant judgment is involved in estimating future returns. Estimates are made after taking into account historical experience and currentmarket conditions. If future returns differ from our estimates, the impact would be recorded against future revenues and profits.
For all accounts receivable, we must make a judgment regarding the ability of our customers to pay and, accordingly, we establish an allowance forestimated losses arising from non-payment. We consider customer creditworthiness, current economic trends and our past experience when evaluating theadequacy of this allowance. If future collections differ from our estimates, our future earnings would be affected.
Capitalized Software
A significant portion of our expenditures relates to software that is developed as part of our electronic databases, delivery systems and internalinfrastructures, and, to a lesser extent, software sold directly to our customers. During the software development process, our judgment is required to determinethe expected period of benefit over which capitalized costs should be amortized. Due to rapidly changing technology and the uncertainty of the softwaredevelopment process itself, our future results could be affected if our current assessment of our various projects differs from actual performance.
Identifiable Intangible Assets and Goodwill
We account for our business acquisitions using the purchase method of accounting. We allocate the total cost of an acquisition to the underlying net assetsbased on their respective estimated fair values. As part of this allocation process, we must identify and attribute values and estimated lives to the intangible assetsacquired. These determinations involve significant estimates and assumptions, including those with respect to future cash inflows and outflows, discount rates andasset lives, and therefore require considerable judgment. These determinations will affect the amount of amortization expense recognized in future periods.
We review the carrying values of identifiable intangible assets with indefinite lives and goodwill at least annually to assess impairment because these assetsare not amortized. Additionally, we review the carrying value of any intangible asset or goodwill whenever events or changes in circumstances indicate
59
that its carrying amount may not be recoverable. Examples of such events or changes in circumstances include significant negative industry or economic trends,significant changes in the manner of our use of the acquired assets or our strategy, a significant decrease in the market value of the asset, and a significant changein legal factors or in the business climate that could affect the value of the asset.
We assess impairment by comparing the fair value of an identifiable intangible asset or goodwill with its carrying value. The determination of fair valueinvolves significant management judgment. Impairments are expensed when incurred. Specifically, we test for impairment as follows:
IDENTIFIABLE INTANGIBLE ASSETS WITH FINITE LIVES
We compare the expected undiscounted future operating cash flows associated with the asset to its carrying value to determine if the asset is recoverable. Ifthe expected future operating cash flows are not sufficient to recover the carrying value, we estimate the fair value of the asset. Impairment is recognized whenthe carrying amount of the asset is not recoverable and when the carrying value exceeds fair value.
IDENTIFIABLE INTANGIBLE ASSETS WITH INDEFINITE LIVES
We determine the fair values of our intangible assets with indefinite lives using an income approach, the relief from royalties method. Impairment isrecognized when the carrying amount exceeds fair value.
GOODWILL
We test goodwill for impairment on a "reporting unit" level. A reporting unit is a group of businesses: (a) for which discrete financial information isavailable; and (b) that have similar economic characteristics. We test goodwill for impairment using the following two-step approach:
• In the first step, we determine the fair value of each reporting unit. If the fair value of a reporting unit is less than its carrying value, this is anindicator that the goodwill assigned to that reporting unit might be impaired, which requires performance of the second step.
• In the second step, we allocate the fair value of the reporting unit to the assets and liabilities of the reporting unit as if it had just been acquired in abusiness combination, and as if the purchase price was equivalent to the fair value of the reporting unit. The excess of the fair value of thereporting unit over the amounts assigned to its assets and liabilities is referred to as the implied fair value of goodwill. We then compare thatimplied fair value of the reporting unit's goodwill to the carrying value of that goodwill. If the implied fair value is less than the carrying value, werecognize an impairment loss for that excess.
We determine the fair value of our reporting units based on a combination of various techniques, including the present value of future cash flows andearnings multiples of competitors.
As the valuation of identifiable intangible assets and goodwill requires significant estimates and judgment about future performance and fair values, ourfuture results could be affected if our current estimates of future performance and fair values change.
INVESTMENTS
We use the equity method of accounting to account for investments in businesses over which we have the ability to exercise significant influence. Under theequity method, we initially record investments at cost and subsequently adjust the carrying amounts to reflect our share of net earnings or losses of the investeecompanies. We reduce the carrying amounts for dividends received. We use the
60
cost method of accounting to account for investments in businesses over which we do not have the ability to exercise significant influence.
To determine whether or not we have significant influence, we consider the percentage of the investee we own, whether we have representation on the boardof the investee, our voting rights, as well as any other influential relationships which may exist with respect to the investee.
We regularly review the fair value of investments to determine if an impairment that is other than temporary has occurred. Because many of the entities inwhich we invest are not publicly traded, the determination of fair value requires us to make estimates. To the extent that our estimates differ from actual fairvalue, any required change to the carrying amounts of our investments will affect future reporting periods.
Income Taxes
We are required to estimate our income taxes in each of the jurisdictions in which we operate. This includes estimating a value for our existing net operatinglosses based on our assessment of our ability to utilize them against future taxable income before they expire. Our assessment is based upon existing tax laws andestimates of future taxable income. If our assessment of our ability to use our net operating losses proves inaccurate in the future, we might be required torecognize more or less of the net operating losses as assets, which would decrease or increase our income tax expense in the relevant year. This would affect ourearnings in that year.
Our accounting for income taxes requires us to exercise judgment for issues relating to known issues under discussion with tax authorities and transactionsyet to be settled. As a result, we maintain a tax liability for contingencies and regularly assess the adequacy of this tax liability. We record liabilities for known taxcontingencies when, in our judgment, it is probable that a liability has been incurred. It is reasonably possible that actual amounts payable resulting from audits bytax authorities could be materially different from the liabilities we have recorded due to the complex nature of the tax legislation that affects us.
Employee Future Benefits
The determination of the cost and obligations associated with our employee future benefits requires the use of various assumptions. We must selectassumptions such as the expected return on assets available to fund pension obligations, the discount rate to measure obligations, the projected age of employeesupon retirement, the expected rate of future compensation and the expected healthcare cost trend rate. These assumptions are re-evaluated each year, andvariations between the actual results and the results based on our assumptions for any period will affect reported amounts in future periods. We retain anindependent actuarial expert to prepare the calculations and to advise on the selection of assumptions.
Recently Issued Accounting Standards
The Accounting Standards Board and the Emerging Issues Committee, or EIC, of the CICA, have recently issued the following accounting standards that areapplicable to our activities in future periods.
CICA HANDBOOK SECTION 3110, ASSET RETIREMENT OBLIGATIONS. CICA Handbook Section 3110 was issued in March 2003 and is effective for fiscal yearsbeginning on or after January 1, 2004. The new guidance harmonizes Canadian GAAP with U.S. GAAP relative to the recognition and measurement ofobligations associated with the retirement of property, plant and equipment when those obligations result from the acquisition, construction, development ornormal operation of the assets.
61
The adoption of Handbook Section 3110 is not expected to have a material impact on our consolidated financial statements.
ACCOUNTING GUIDELINE ACG-13, HEDGING RELATIONSHIPS. Effective for hedging relationships in effect for fiscal years beginning on or after July 1, 2003,this Guideline was issued by the CICA in 2001 to address the identification, designation, documentation and effectiveness of hedging relationships, as well as theconditions for applying hedge accounting.
EIC ABSTRACT 128, ACCOUNTING FOR TRADING, SPECULATIVE OR NON-HEDGING DERIVATIVE FINANCIAL INSTRUMENTS. Issued in June 2002, the consensusreached in EIC Abstract 128 must be applied in all financial statements prepared for fiscal periods beginning on or after the date of implementation of AcG-13.The consensus requires that, with certain exceptions, a freestanding derivative financial instrument that does not qualify for hedge accounting under AcG-13,should be recognized in the balance sheet and measured at fair value, with changes in fair value recognized in income.

Certain derivatives previously accounted for as hedges will not qualify for this treatment under AcG-13. Therefore, in accordance with AcG-13 and EICAbstract 128, changes in the fair value of these derivatives after January 1, 2004 will be recognized in our earnings in the period in which they occur. If AcG-13and EIC Abstract 128 had been in effect in 2003, we would have recognized additional income of approximately $20 million associated with the changes in fairvalues of these derivatives. At December 31, 2003, the fair value of these derivatives was approximately $25 million in favor of the counterparties and wouldhave been recorded in "Prepaid expenses and other current assets" and "Other non-current liabilities" in our consolidated balance sheet.
ACCOUNTING GUIDELINE ACG-15, CONSOLIDATION OF VARIABLE INTEREST ENTITIES. In June 2003, the CICA issued AcG-15, which requires theconsolidation of certain entities that are subject to control on a basis other than the ownership of voting interest. This Guideline provides guidance for determiningwhen an enterprise includes the assets, liabilities and results of operations of a variable interest entity in its consolidated financial statements. The guidancerelated to consolidation requirements is effective for periods beginning on or after November 1, 2004.
We are in the process of assessing the impact of AcG-15, but do not expect the adoption to have a material impact on the consolidated financial statements.
EIC ABSTRACT 141, REVENUE RECOGNITION. In December 2003, the EIC issued EIC Abstract 141, which incorporates the principles and summarizes theguidance in the U.S. Securities and Exchange Commission (SEC) Staff Accounting Bulletin (SAB) 101, Revenue Recognition in Financial Statements. TheAbstract also provides interpretive guidance on the application of CICA Handbook Section 3400, Revenue. The Abstract may be applied prospectively to salestransactions recognized in 2004, or may be applied retroactively, with prior period financial statements being restated.
Because we have previously applied the provisions of SAB 101, the adoption of EIC Abstract 141 is not expected to have a material impact on ourconsolidated financial statements.
EIC ABSTRACT 142, REVENUE ARRANGEMENTS WITH MULTIPLE DELIVERABLES. Issued in December 2003, this Abstract addresses the accounting by vendorsfor arrangements in which the vendor will perform multiple revenue-generating activities. The Abstract conforms Canadian GAAP to the U.S. GAAP set forth inEmerging Issues Task Force, or EITF, Issue 00-21, also entitled Revenue Arrangements with Multiple Deliverables.
Because we have previously applied EITF Issue 00-21, the adoption of EIC Abstract 142 is not expected to have a material impact on our consolidatedfinancial statements.
62
CICA HANDBOOK SECTION 1100, GENERALLY ACCEPTED ACCOUNTING PRINCIPLES. CICA Handbook Section 1100 was issued in October 2003, and iseffective for our fiscal year beginning January 1, 2004. The Handbook Section establishes standards for financial reporting in accordance with generally acceptedaccounting principles and clarifies the relative authority of various accounting pronouncements and other sources within GAAP.
We are in the process of assessing the impact of this standard.
Additional Information
Disclosure Controls and Procedures
Our Chief Executive Officer and Chief Financial Officer, after evaluating the effectiveness of our disclosure controls and procedures (as defined inapplicable U.S. and Canadian securities law) as of the end of the period covered by this management's discussion and analysis, have concluded that our disclosurecontrols and procedures are effective to ensure that all information required to be disclosed by our company in reports that it files or furnishes under the U.S.Securities Exchange Act and applicable Canadian securities law is recorded, processed, summarized and reported within the time periods specified in the rulesand forms of the U.S. Securities and Exchange Commission and Canadian securities regulatory authorities.
Changes in Internal Controls over Financial Reporting
There was no change in our company's internal control over financial reporting that occurred during our last fiscal year that has materially affected, or isreasonably likely to materially affect, our internal control over financial reporting.
Share Capital
As of February 25, 2004, we had outstanding 654,608,008 common shares and 6,000,000 Series II preference shares.
Public Securities Filings
You may access other information about our company, including our annual information form and our other disclosure documents, reports, statements orother information that we file with the Canadian securities regulatory authorities through SEDAR at www.sedar.com and in the United States with the SEC atwww.sec.gov.
63
Reconciliations
Reconciliation of Adjusted EBITDA to Net Earnings and Adjusted Operating Profit to Operating Profit
For the year ended December 31, 2003
(millions of U.S. dollars)(unaudited)
Legal &Regulatory
Learning
Financial
Scientific &Healthcare
Corporateand other
Ongoing
Disposals
Total
Adjusted EBITDA 980 520 406 217 (60) 2,063 1 2,064

Less: Depreciation (181) (183) (175) (31) (18) (588) — (588) Adjusted operating profit 799 337 231 186 (78) 1,475 1 1,476 Less: Amortization (106) (83) (62) (26) (8) (285) — (285) Operating profit 693 254 169 160 (86) 1,190 1 1,191 Net other income (expense) 74 Net interest expense and otherfinancing costs (252)Income taxes (156)Equity in net losses of associates, net oftax (13) Earnings from continuing operations 844 Earnings from discontinued operations,net of tax 23 Net earnings 867
For the year ended December 31, 2002
Legal &Regulatory
Learning
Financial
Scientific &Healthcare
Corporateand other
Ongoing
Disposals
Total
Adjusted EBITDA 926 465 409 187 (35) 1,952 9 1,961 Less: Depreciation (159) (163) (169) (27) (16) (534) (1) (535) Adjusted operating profit 767 302 240 160 (51) 1,418 8 1,426 Less: Amortization (91) (97) (63) (22) (11) (284) — (284)Restructuring charges (4) — — — (2) (6) — (6) Operating profit 672 205 177 138 (64) 1,128 8 1,136 Net other income (expense) (34)Net interest expense and otherfinancing costs (291)Income taxes (162)Equity in net losses of associates, net oftax (101) Earnings from continuing operations 548 Earnings from discontinued operations,net of tax 57 Net earnings 605
64
Reconciliation of Adjusted EBITDA Margin and Adjusted Operating Profit Margin to Operating Profit Margin
For the year ended December 31, 2003
(as a percentage of revenue)(unaudited)
Legal &Regulatory
Learning
Financial
Scientific &Healthcare
Corporateand other
Ongoing
Disposals
Total
Adjusted EBITDA 31.2% 25.3% 26.7% 28.6% (36.6)% 27.1% 14.3% 27.1%Less: Depreciation (5.8)% (8.9)% (11.5)% (4.1)% (11.0)% (7.7)% — (7.7)% Adjusted operating profit 25.4% 16.4% 15.2% 24.5% (47.6)% 19.4% 14.3% 19.4%Less: Amortization (3.3)% (4.0)% (4.1)% (3.4)% (4.8)% (3.7)% — (3.7)% Operating profit 22.1% 12.4% 11.1% 21.1% (52.4)% 15.7% 14.3% 15.7%
For the year ended December 31, 2002
Legal &
Regulatory Learning Financial Scientific &
Healthcare Corporate
and other Ongoing Disposals Total

Adjusted EBITDA 31.3% 22.8% 25.6% 27.0% (21.3)% 26.4% 23.7% 26.3%Less: Depreciation (5.4)% (8.0)% (10.6)% (3.9)% (9.8)% (7.3)% (2.6)% (7.1)% Adjusted operating profit 25.9% 14.8% 15.0% 23.1% (31.1)% 19.1% 21.1% 19.2%Less: Amortization (3.1)% (4.7)% (3.9)% (3.2)% (6.7)% (3.8)% — (3.8)%Restructuring charges (0.1)% — — — (1.2)% (0.1)% — (0.1)% Operating profit 22.7% 10.1% 11.1% 19.9% (39.0)% 15.2% 21.1% 15.3%
Certain information in this management's discussion and analysis, particularly under the heading "2004 Financial Outlook," are forward-looking statementsthat are not historical facts but reflect our current expectations regarding future results. These forward-looking statements are subject to a number of risks anduncertainties that could cause actual results or events to differ materially from current expectations. Some of the factors that could cause actual results or eventsto differ materially from current expectations are: actions of our competitors; failure of our significant investments in technology to increase our revenues ordecrease our operating costs; failure to fully derive anticipated benefits from our acquisitions; failure to develop additional products and services to meet ourcustomers' needs, attract new customers or expand into new geographic markets; failure to meet the special challenges involved in expansion of our operationsoutside North America; failure to recruit and retain high-quality management and key employees; consolidation of our customers; increased self-sufficiency ofour customers; increased accessibility to free or relatively inexpensive information sources; failure to maintain the availability of information obtained throughlicensing arrangements and changes in the terms of our licensing arrangements; changes in the general economy; inadequate protection of our intellectualproperty rights; an increase in our effective income tax rate; impairment of goodwill and identifiable intangible assets; and failures or disruptions of ourelectronic delivery systems or the Internet. Additional factors are discussed in our materials filed with the securities regulatory authorities in Canada and theUnited States from time to time, including our annual information form, which is contained in our current annual report on Form 40-F. We disclaim any intentionor obligation to update or revise any forward-looking statements, whether as a result of new information, future events or otherwise.
65
Quarterly Information (unaudited)
The following table presents a summary of our segments and consolidated operating results for each of the eight quarters ended March 31, 2002 throughDecember 31, 2003.
The following table includes measurements for Adjusted EBITDA and Adjusted operating profit which do not have any standardized meaning prescribed byCanadian GAAP. These measurements are used by management to evaluate performance. A further discussion of these performance measures and areconciliation of them to our statement of earnings and retained earnings are included in Note 26 to our consolidated financial statements.
Quarter endedMarch 31
Quarter endedJune 30
Quarter endedSeptember 30
Quarter endedDecember 31
(millions of U.S. dollars)
2003
2002
2003
2002
2003
2002
2003
2002
Revenues Legal & Regulatory 676 664 769 733 794 728 903 834 Learning 327 328 397 388 714 705 614 615 Financial 383 406 379 403 375 394 386 394 Scientific & Healthcare 169 148 181 159 169 157 241 228 Corporate and other(1) 33 34 46 47 37 36 48 47 Eliminations (10) (9) (12) (12) (8) (7) (12) (14) 1,578 1,571 1,760 1,718 2,081 2,013 2,180 2,104 Disposals(2) 4 11 1 13 1 8 1 6 1,582 1,582 1,761 1,731 2,082 2,021 2,181 2,110 Adjusted EBITDA(3) Legal & Regulatory 151 137 244 226 262 233 323 330 Learning (23) (25) 46 41 278 249 219 200 Financial 94 94 102 98 107 100 103 117 Scientific & Healthcare 34 30 46 33 40 34 97 90 Corporate and other(1) (10) (32) (13) (4) (11) (2) (26) 3 246 204 425 394 676 614 716 740 Disposals(2) 2 2 — 4 (1) (1) — 4 248 206 425 398 675 613 716 744 Adjusted operating profit (loss)(3) Legal & Regulatory 108 98 200 185 216 195 275 289 Learning (57) (54) 10 10 218 194 166 152 Financial 49 55 60 57 63 53 59 75 Scientific & Healthcare 27 23 37 27 33 27 89 83

Corporate and other(1) (16) (36) (16) (7) (17) (6) (29) (2) 111 86 291 272 513 463 560 597 Disposals(2) 2 2 — 3 (1) (1) — 4 113 88 291 275 512 462 560 601
The following table includes measurements for Adjusted earnings and Adjusted earnings per common share which do not have any standardized meaningprescribed by Canadian GAAP. These measurements are used by management to evaluate performance. A further discussion of these performance measures anda
66
reconciliation of them to our statement of earnings and retained earnings are included in this management's discussion and analysis.
Quarter endedMarch 31
Quarter endedJune 30
Quarter endedSeptember 30
Quarter endedDecember 31
(millions of U.S. dollars, except per common share amounts)
2003
2002
2003
2002
2003
2002
2003
2002
Earnings from continuing operations 36 (44) 108 80 295 248 405 264 Discontinued operations, net of tax 11 11 8 13 12 11 (8) 22 Net earnings 47 (33) 116 93 307 259 397 286 Dividends declared on preference shares (5) (3) (2) (5) (1) (6) (1) (5)Net gain on redemption of Series V preference shares 24 — (3) — — — — — Earnings attributable to common shares 66 (36) 111 88 306 253 396 281 Basic and fully diluted earnings (loss) per commonshare(4) From continuing operations $ 0.08 $ (0.07) $ 0.16 $ 0.12 $ 0.45 $ 0.37 $ 0.62 $ 0.40 From discontinued operations 0.02 0.01 0.01 0.02 0.02 0.02 (0.02) 0.03 $ 0.10 $ (0.06) $ 0.17 $ 0.14 $ 0.47 $ 0.39 $ 0.60 $ 0.43 Supplemental information Earnings attributable to common shares as above 66 (36) 111 88 306 253 396 281 Adjust: one-time items, net of tax, resulting from other(income) expense, restructuring charges, proportionate shareof goodwill impairment recognized by equity-methodinvestee, net gain on redemption of Series V preferenceshares and favorable tax settlement, net (81) 2 3 3 (14) 3 (59) 99 Discontinued operations (11) (11) (8) (13) (12) (11) 8 (22) Adjusted earnings from continuing operations (26) (45) 106 78 280 245 345 358 Adjusted basic and diluted earnings per common share fromcontinuing operations $ (0.04) $ (0.07) $ 0.16 $ 0.12 $ 0.43 $ 0.38 $ 0.53 $ 0.55
(1) Corporate and other includes the results of Thomson Media, a non-reportable segment, as well as corporate costs and costs associated with stock-relatedcompensation.
(2) Disposals include the results of businesses sold or held for sale that do not qualify as discontinued operations.
(3) Before amortization and restructuring costs.
(4) Per common share amounts for the quarter are computed independently and, due to the computation formula, the sum of the quarters may not equal theyear-to-date period. Please see the section entitled "Seasonality."
67
Selected Financial Data
The following tables present selected financial data for the three most recent years and are derived from our consolidated financial statements.
(millions of U.S. dollars, except per share amounts)For the years ended or as at December 31
2003
2002
2001
Revenues 7,606 7,444 7,075

Earnings from continuing operations 844 548 654Earnings from discontinued operations, net of tax 23 57 115 Net earnings 867 605 769 Basic and fully diluted earnings per common share $ 1.34 $ 0.91 $ 1.18 Total assets 18,680 18,548 18,650Total long-term liabilities 6,335 6,377 6,562Total shareholders' equity 9,200 8,966 8,225Dividends per common share—ordinary (US$) $ 0.725 $ 0.705 $ 0.70Dividends per common share—special (US$) $ 0.428 — —Dividends per Series II preferred share (Cdn$) $ 0.82 $ 0.73 $ 1.07Dividends per Series V preferred share (Cdn$)(1) $ 0.32 $ 1.00 $ 1.25
Supplemental Information (unaudited)
(millions of U.S. dollars, except per common share amounts)For the years ended December 31
2003
2002
2001
Earnings attributable to common shares 879 586 742 Adjustments One time items: Net other expense (income) (74) 34 (302) Restructuring charges — 6 30 Tax on above items 8 — 66 Net change to contingent tax liabilities (64) — — BGM goodwill impairment — 67 — Net gain on redemption of Series V preference shares (21) — — Earnings from discontinued operations, net of tax (23) (57) (115)Effect of new accounting standard(2) — — 194 Adjusted earnings from continuing operations(3) 705 636 615 Adjusted basic and fully diluted earnings per common share from continuing operations(3) $ 1.08 $ 0.99 $ 0.98
(1) Redeemed in April 2003.
(2) Represents the reduction of amortization, net of tax, of identifiable intangible assets and goodwill as if the current accounting standard was in effect in2001.
(3) Non-GAAP financial measure. See the "Reconciliations" section of this management's discussion and analysis.
68
Management Report
The management of The Thomson Corporation is responsible for the accompanying consolidated financial statements and other information included in theannual report. The financial statements have been prepared in conformity with Canadian generally accepted accounting principles using the best estimates andjudgments of management, where appropriate. Information presented elsewhere in this annual report is consistent with that in the financial statements.
Management is also responsible for a system of internal control which is designed to provide reasonable assurance that assets are safeguarded, liabilities arerecognized and that the accounting systems provide timely and accurate financial reports.
The Board of Directors is responsible for ensuring that management fulfills its responsibilities in respect of financial reporting and internal control. TheAudit Committee of the Board of Directors meets periodically with management and the Corporation's independent auditors to discuss auditing matters andfinancial reporting issues. In addition, the Audit Committee recommends to the Board of Directors the approval of the interim and annual consolidated financialstatements and the annual appointment of the independent auditors.
Richard J. HarringtonPresident & Chief Executive Officer
Robert D. DaleoExecutive Vice President & Chief Financial Officer
February 12, 2004

69
Auditors' Report
To the shareholders of The Thomson Corporation:
We have audited the consolidated balance sheet of The Thomson Corporation (the Corporation) as at December 31, 2003 and 2002, and the consolidatedstatements of earnings and retained earnings and of cash flow for each of the years in the two year period ended December 31, 2003. These consolidated financialstatements are the responsibility of the Corporation's management. Our responsibility is to express an opinion on these financial statements based on our audits.
We conducted our audits in accordance with Canadian generally accepted auditing standards. Those standards require that we plan and perform an audit toobtain reasonable assurance whether the financial statements are free of material misstatement. An audit includes examining, on a test basis, evidence supportingthe amounts and disclosures in the financial statements. An audit also includes assessing the accounting principles used and significant estimates made bymanagement, as well as evaluating the overall financial statement presentation.
In our opinion, these consolidated financial statements present fairly, in all material respects, the financial position of the Corporation as at December 31,2003 and 2002, and the results of its operations and its cash flows for each of the years in the two year period ended December 31, 2003 in accordance withCanadian generally accepted accounting principles.
PricewaterhouseCoopers LLPChartered Accountants, Toronto, Canada
February 12, 2004
70
The Thomson Corporation
Consolidated Statement of Earnings and Retained Earnings
Year ended December 31
(millions of U.S. dollars, except per common share amounts)
2003
2002(notes 2 and 6)
Revenues (note 1) 7,606 7,444 Cost of sales, selling, marketing, general and administrative expenses (note 1) (5,542) (5,483)Depreciation (note 11) (588) (535)Amortization (note 12) (285) (284)Restructuring charges (note 19) — (6) Operating profit 1,191 1,136 Net other income (expense) (note 3) 74 (34)Net interest expense and other financing costs (note 4) (252) (291)Income taxes (note 5) (156) (162)Equity in net losses of associates, net of tax (note 15) (13) (101) Earnings from continuing operations 844 548 Earnings from discontinued operations, net of tax (note 6) 23 57 Net earnings 867 605 Dividends declared on preference shares (note 16) (9) (19)Net gain on redemption of Series V preference shares (note 16) 21 — Earnings attributable to common shares 879 586 Retained earnings at beginning of year (note 2) 6,196 6,244 Effect of adoption of accounting standard, net of tax (note 7) — (183)Deduct net gain on redemption of Series V preference shares recorded in Capital (note 16) (21) — Dividends declared on common shares (note 16) (752) (451) Retained earnings at end of year 6,302 6,196
Basic and diluted earnings per common share (note 8): From continuing operations $ 1.31 $ 0.83 From discontinued operations $ 0.03 $ 0.08 Basic and diluted earnings per common share $ 1.34 $ 0.91
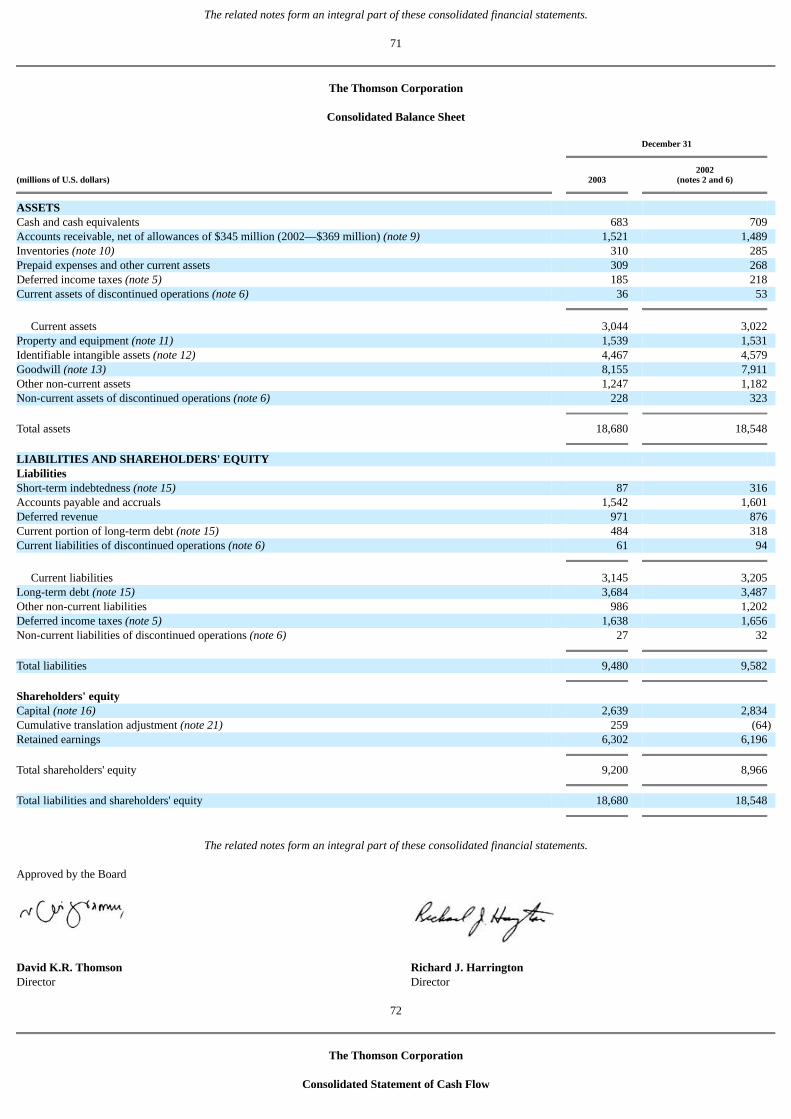
The related notes form an integral part of these consolidated financial statements.
71
The Thomson Corporation
Consolidated Balance Sheet
December 31
(millions of U.S. dollars)
2003
2002(notes 2 and 6)
ASSETS Cash and cash equivalents 683 709 Accounts receivable, net of allowances of $345 million (2002—$369 million) (note 9) 1,521 1,489 Inventories (note 10) 310 285 Prepaid expenses and other current assets 309 268 Deferred income taxes (note 5) 185 218 Current assets of discontinued operations (note 6) 36 53 Current assets 3,044 3,022 Property and equipment (note 11) 1,539 1,531 Identifiable intangible assets (note 12) 4,467 4,579 Goodwill (note 13) 8,155 7,911 Other non-current assets 1,247 1,182 Non-current assets of discontinued operations (note 6) 228 323 Total assets 18,680 18,548 LIABILITIES AND SHAREHOLDERS' EQUITY Liabilities Short-term indebtedness (note 15) 87 316 Accounts payable and accruals 1,542 1,601 Deferred revenue 971 876 Current portion of long-term debt (note 15) 484 318 Current liabilities of discontinued operations (note 6) 61 94 Current liabilities 3,145 3,205 Long-term debt (note 15) 3,684 3,487 Other non-current liabilities 986 1,202 Deferred income taxes (note 5) 1,638 1,656 Non-current liabilities of discontinued operations (note 6) 27 32 Total liabilities 9,480 9,582 Shareholders' equity Capital (note 16) 2,639 2,834 Cumulative translation adjustment (note 21) 259 (64)Retained earnings 6,302 6,196 Total shareholders' equity 9,200 8,966 Total liabilities and shareholders' equity 18,680 18,548
The related notes form an integral part of these consolidated financial statements.
Approved by the Board
David K.R. ThomsonDirector
Richard J. HarringtonDirector
72
The Thomson Corporation
Consolidated Statement of Cash Flow

Year ended December 31
(millions of U.S. dollars)
2003
2002(notes 2 and 6)
CASH PROVIDED BY (USED IN): Operating activities Earnings from continuing operations 844 548 Add back (deduct) items not involving cash: Amortization of development costs and capitalized software for sale 38 46 Depreciation (note 11) 588 535 Amortization (note 12) 285 284 Net (gains) losses on disposals of businesses and investments (note 3) (52) 34 Deferred income taxes (note 5) 22 94 Equity in net losses of associates, net of tax (note 15) 13 101 Other, net 54 62 Voluntary pension contributions (81) (142)Changes in working capital and other items (note 23) (93) 58 Cash provided by operating activities—discontinued operations (note 6) 36 71 Net cash provided by operating activities 1,654 1,691 Investing activities Acquisitions of businesses and investments, less cash therein of $25 million (2002—$15 million) (note 20) (211) (272)Proceeds from disposals of businesses and investments (note 20) 288 51 Additions to property and equipment, less proceeds from disposals of $6 million (2002—$8 million) (570) (518)Other investing activities (83) (166)Additions to property and equipment of discontinued operations (note 6) (7) (5)Proceeds from disposals of discontinued operations 137 — Cash used in investing activities—discontinued operations (note 6) (15) — Net cash used in investing activities (461) (910) Financing activities Proceeds from debt (note 15) 451 400 Repayments of debt (note 15) (468) (540)Net repayments of short-term loan facilities (230) (604)Proceeds from issuance of common shares (note 16) 2 437 Redemption of Series V preference shares (note 16) (311) — Dividends paid on preference shares (note 16) (11) (22)Dividends paid on common shares (note 16) (658) (283)Other financing activities, net (3) (2) Net cash used in financing activities (1,228) (614) (35) 167 Translation adjustments 9 10 (Decrease) increase in cash and cash equivalents (26) 177 Cash and cash equivalents at beginning of period 709 532 Cash and cash equivalents at end of period 683 709
Supplemental cash flow information is provided in notes 4 and 23.
The related notes form an integral part of these consolidated financial statements.
73
The Thomson Corporation
Notes to Consolidated Financial Statements
(unless otherwise stated, all amounts are in millions of U.S. dollars)
Note 1: Summary of Significant Accounting Policies
Principles of Consolidation
The consolidated financial statements of The Thomson Corporation ("Thomson" or the "Company") include all controlled companies and are prepared inaccordance with accounting principles generally accepted in Canada ("Canadian GAAP"). All intercompany transactions and balances are eliminated onconsolidation.

Accounting Estimates
The preparation of financial statements in conformity with Canadian GAAP requires management to make estimates and assumptions that affect the reportedamounts of assets and liabilities, the disclosure of contingent assets and liabilities at the date of the financial statements, and the reported amounts of revenues andexpenses during the reporting period. Actual results may differ from those estimates.
Foreign Currency
Assets and liabilities of self-sustaining subsidiaries denominated in currencies other than U.S. dollars are translated at the period end rates of exchange, andthe results of their operations are translated at average rates of exchange for the period. The resulting translation adjustments are accumulated in a separatecomponent of shareholders' equity. Other currency gains or losses are included in earnings.
Revenue Recognition
Revenues are recognized, net of estimated returns, when the following four criteria are met:
• persuasive evidence of an arrangement exists;
• delivery has occurred;
• the fee is fixed or determinable; and
• collectibility is probable.
In addition to the above general principles, the Company applies the following specific revenue recognition policies:
SUBSCRIPTION-BASED PRODUCTS (EXCLUDING SOFTWARE)
Revenues from sales of subscription-based products are primarily recognized ratably over the term of the subscription. Where applicable, usage fees above abase period fee are recognized as earned. Subscription revenue received or receivable in advance of the delivery of services or publications is included in deferredrevenue. Incremental costs that are directly related to the subscription revenue are deferred and amortized over the subscription period.
MULTIPLE ELEMENT ARRANGEMENTS
When a sales arrangement requires the delivery of more than one product or service, the individual deliverables are accounted for separately, if applicablecriteria are met. Specifically, the revenue is allocated to each deliverable if reliable and objective evidence of fair value for each
74
deliverable is available. The amount allocated to each unit is then recognized when each unit is delivered, provided that all other relevant revenue recognitioncriteria are met with respect to that unit.
If, however, evidence of fair value is only available for undelivered elements, the revenue is allocated first to the undelivered items, with the remainder ofthe revenue being allocated to the delivered items, according to a calculation known as the residual method. Amounts allocated to delivered items are limited ifthere are further obligations with respect to the delivered items.
If evidence of fair value is only available for the delivered items, but not for the undelivered items, the arrangement is considered a single elementarrangement and revenue is recognized as the relevant recognition criteria are met.
SOFTWARE-RELATED PRODUCTS AND SERVICES
If the four criteria of revenue recognition are met, license fees are generally recognized ratably on a straight-line basis over the license period. Alternatively,if there is neither an associated licensing period, nor future obligations, revenues are recognized upon delivery.
Certain contracts specify separate fees for software and ongoing fees for maintenance and other support. If sufficient vendor specific objective evidence ofthe fair value of each element of the arrangement exists, the elements of the contract are unbundled and the revenue for each element is recognized as appropriate.
OTHER SERVICE CONTRACTS
For a majority of service or consulting arrangements, revenues are recognized as services are performed based on output measures, or if no discernablepattern of revenue recognition exists, the straight-line method is utilized.
Employee Future Benefits
Net periodic pension expense for employee future benefits is actuarially determined using the projected benefit method. Determination of benefit expenserequires assumptions such as the expected return on assets available to fund pension obligations, the discount rate to measure obligations, the projected age ofemployees upon retirement, the expected rate of future compensation and the expected healthcare cost trend rate. For the purpose of calculating expected returnon plan assets, the assets are valued at fair market value. Actual results will differ from results which are estimated based on assumptions. When the cumulativedifference between actual and estimated results exceeds 10% of the greater of the benefit obligation or the fair value of the plan assets, such difference isamortized into earnings over the average remaining service period of active employees. Past service costs arising from plan amendments are amortized on astraight-line basis over the average remaining service period of active employees at the date of the amendment.
Cash and Cash Equivalents
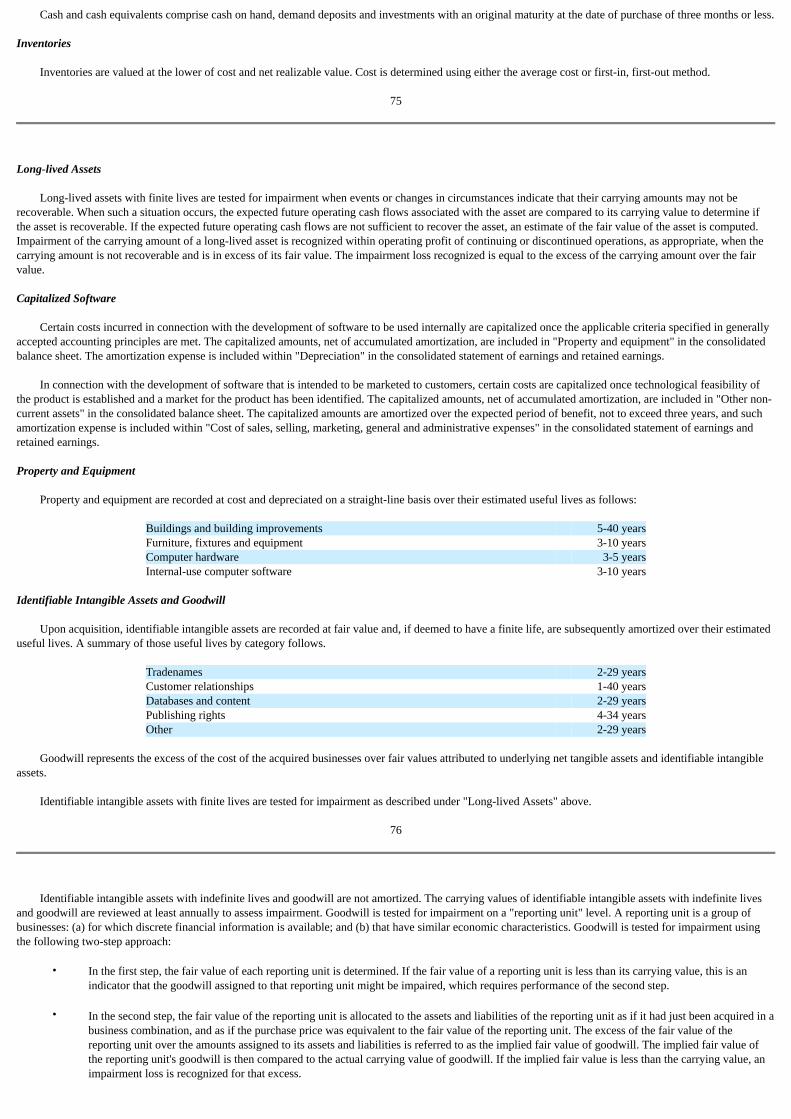
Cash and cash equivalents comprise cash on hand, demand deposits and investments with an original maturity at the date of purchase of three months or less.
Inventories
Inventories are valued at the lower of cost and net realizable value. Cost is determined using either the average cost or first-in, first-out method.
75
Long-lived Assets
Long-lived assets with finite lives are tested for impairment when events or changes in circumstances indicate that their carrying amounts may not berecoverable. When such a situation occurs, the expected future operating cash flows associated with the asset are compared to its carrying value to determine ifthe asset is recoverable. If the expected future operating cash flows are not sufficient to recover the asset, an estimate of the fair value of the asset is computed.Impairment of the carrying amount of a long-lived asset is recognized within operating profit of continuing or discontinued operations, as appropriate, when thecarrying amount is not recoverable and is in excess of its fair value. The impairment loss recognized is equal to the excess of the carrying amount over the fairvalue.
Capitalized Software
Certain costs incurred in connection with the development of software to be used internally are capitalized once the applicable criteria specified in generallyaccepted accounting principles are met. The capitalized amounts, net of accumulated amortization, are included in "Property and equipment" in the consolidatedbalance sheet. The amortization expense is included within "Depreciation" in the consolidated statement of earnings and retained earnings.
In connection with the development of software that is intended to be marketed to customers, certain costs are capitalized once technological feasibility ofthe product is established and a market for the product has been identified. The capitalized amounts, net of accumulated amortization, are included in "Other non-current assets" in the consolidated balance sheet. The capitalized amounts are amortized over the expected period of benefit, not to exceed three years, and suchamortization expense is included within "Cost of sales, selling, marketing, general and administrative expenses" in the consolidated statement of earnings andretained earnings.
Property and Equipment
Property and equipment are recorded at cost and depreciated on a straight-line basis over their estimated useful lives as follows:
Buildings and building improvements 5-40 yearsFurniture, fixtures and equipment 3-10 yearsComputer hardware 3-5 yearsInternal-use computer software 3-10 years
Identifiable Intangible Assets and Goodwill
Upon acquisition, identifiable intangible assets are recorded at fair value and, if deemed to have a finite life, are subsequently amortized over their estimateduseful lives. A summary of those useful lives by category follows.
Tradenames 2-29 yearsCustomer relationships 1-40 yearsDatabases and content 2-29 yearsPublishing rights 4-34 yearsOther 2-29 years
Goodwill represents the excess of the cost of the acquired businesses over fair values attributed to underlying net tangible assets and identifiable intangibleassets.
Identifiable intangible assets with finite lives are tested for impairment as described under "Long-lived Assets" above.
76
Identifiable intangible assets with indefinite lives and goodwill are not amortized. The carrying values of identifiable intangible assets with indefinite livesand goodwill are reviewed at least annually to assess impairment. Goodwill is tested for impairment on a "reporting unit" level. A reporting unit is a group ofbusinesses: (a) for which discrete financial information is available; and (b) that have similar economic characteristics. Goodwill is tested for impairment usingthe following two-step approach:
• In the first step, the fair value of each reporting unit is determined. If the fair value of a reporting unit is less than its carrying value, this is anindicator that the goodwill assigned to that reporting unit might be impaired, which requires performance of the second step.
• In the second step, the fair value of the reporting unit is allocated to the assets and liabilities of the reporting unit as if it had just been acquired in abusiness combination, and as if the purchase price was equivalent to the fair value of the reporting unit. The excess of the fair value of thereporting unit over the amounts assigned to its assets and liabilities is referred to as the implied fair value of goodwill. The implied fair value ofthe reporting unit's goodwill is then compared to the actual carrying value of goodwill. If the implied fair value is less than the carrying value, animpairment loss is recognized for that excess.

The fair value of the Company's reporting units are determined based on a combination of various techniques, including the present value of future cashflows and earnings multiples of competitors. Fair value of intangible assets with indefinite lives is determined using an income approach, specifically the relieffrom royalties method.
The carrying values of all intangible assets are reviewed for impairment whenever events or changes in circumstances indicate that their carrying amountsmay not be recoverable. Impairment is determined by comparing the fair values of such assets with their carrying amounts.
Investments
The equity method of accounting is used to account for investments in businesses over which Thomson has the ability to exercise significant influence.Under the equity method, investments are initially recorded at cost and the carrying amounts are adjusted to reflect the Company's share of net earnings or lossesof the investee companies, and are reduced by dividends received.
The cost method of accounting is used to account for investments in businesses over which Thomson does not have the ability to exercise significantinfluence.
When the estimated fair values of investments fall below their carrying values, the investments are written down when such declines are considered to beother than temporary.
Disposal of Long-lived Assets and Discontinued Operations
Long-lived assets are classified as held for sale when certain criteria are met. Assets held for sale are measured at the lower of their carrying amounts or fairvalues less costs to sell and are no longer depreciated. Long-lived assets held for sale are classified as discontinued operations if the operations and cash flows canbe clearly distinguished, operationally and for financial reporting purposes, from the remaining operations. See Note 6 for detail on the Company's discontinuedoperations.
Deferred Income Taxes
Deferred income taxes are determined based on the temporary differences between the financial reporting and tax bases of assets and liabilities using theenacted or substantially enacted rates expected to apply to taxable income in the years in which those temporary differences are expected to reverse. A valuationallowance is recorded against deferred income tax assets if management determines that it is more likely than not that such deferred income tax assets will not berealized within the foreseeable
77
future. The income tax provision for the period is the tax payable for the period and the change during the period in deferred income tax assets and liabilities.
Derivative Financial Instruments
In the ordinary course of business, Thomson enters into the following types of derivative financial instruments to manage foreign currency and interest rateexposures:
• foreign currency contracts to hedge currency exposures on non-U.S. dollar debt;
• foreign currency contracts to hedge forecasted cash flows denominated in currencies other than the functional currency of a particular Thomsonsubsidiary; and
• interest rate contracts to manage the fixed versus floating interest rate mix of debt. Such contracts require periodic exchange of payments withoutthe exchange of the notional principal amount upon which the payments are based.
The Company identifies a risk management objective for each transaction. All derivatives are linked to specific assets and liabilities or to specific firmcommitments or forecasted transactions. Where required, periodic assessments of each derivative's effectiveness are performed.
While the derivative financial instruments are subject to the risk of loss from changes in exchange and interest rates, these losses are offset by gains on theexposures being hedged. Gains and losses on foreign currency derivative instruments designated as hedges of existing assets and liabilities are accrued asexchange rates change, thereby offsetting gains and losses from the underlying assets and liabilities. Gains and losses on foreign exchange contracts designated ashedges for firm commitments or forecasted transactions are recorded in consolidated earnings when the related transaction is realized. The differential paid orreceived on interest rate swap agreements is recognized as part of net interest expense.
Stock-based Compensation Plans
Thomson has both a Stock Appreciation Rights ("SAR") plan and a stock incentive plan, which are described in Note 22.
Under the SAR plan, compensation expense is recognized as SARs change in value based on the fair market value of the Company's common stock at theend of each reporting period.
Under the stock incentive plan, Thomson may grant stock options and other equity-based awards to certain employees for up to 20,000,000 shares ofcommon stock. The options vest over a period of four to five years. The maximum term of an option is 10 years from the date of grant. Options under the plan aregranted at the closing price of the Company's common stock on the day prior to the date of grant. Effective January 1, 2003 the Company began expensing thefair value of all stock options retroactively as allowed under Canadian Institute of Chartered Accountants ("CICA") Handbook Section 3870, Stock-BasedCompensation and Other Stock-Based Payments ("CICA3870"). See Note 2.

Recently Issued Accounting Standards
The Accounting Standards Board and the Emerging Issues Committee ("EIC") of the CICA have recently issued the following accounting standards that areapplicable to the Company's activities in future periods.
CICA HANDBOOK SECTION 3110, ASSET RETIREMENT OBLIGATIONS. CICA Handbook Section 3110 was issued in March 2003 and is effective for fiscal yearsbeginning on or after January 1, 2004. The new guidance harmonizes Canadian GAAP with U.S. GAAP relative to the recognition and measurement of
78
obligations associated with the retirement of property, plant and equipment when those obligations result from the acquisition, construction, development ornormal operation of the assets.
The adoption of Handbook Section 3110 is not expected to have a material impact on the Company's consolidated financial statements.
ACCOUNTING GUIDELINE ACG-13, HEDGING RELATIONSHIPS. Effective for hedging relationships in effect for fiscal years beginning on or after July 1, 2003,this Guideline was issued by the CICA in 2001 to address the identification, designation, documentation and effectiveness of hedging relationships, as well as theconditions for applying hedge accounting.
EIC ABSTRACT 128, ACCOUNTING FOR TRADING, SPECULATIVE OR NON-HEDGING DERIVATIVE FINANCIAL INSTRUMENTS. Issued in June 2002, the consensusreached in EIC Abstract 128 must be applied in all financial statements prepared for fiscal periods beginning on or after the date of implementation of AcG-13.The consensus requires that, with certain exceptions, a freestanding derivative financial instrument that does not qualify for hedge accounting under AcG-13,should be recognized in the balance sheet and measured at fair value, with changes in fair value recognized in income.
Certain derivatives, previously accounted for as hedges, will not qualify for this treatment under AcG-13. Therefore, in accordance with AcG-13 and EICAbstract 128, changes in the fair value of these derivatives after January 1, 2004 will be recognized in earnings in the period in which they occur. If AcG-13 andEIC Abstract 128 had been in effect in 2003, the Company would have recognized additional income of approximately $20 million associated with the changes infair values of these derivatives. At December 31, 2003 the fair value of these derivatives was approximately $25 million, net, in favor of the counterparties andwould have been recorded within "Prepaid expenses and other current assets" and "Other non-current liabilities" in the consolidated balance sheet.
ACCOUNTING GUIDELINE ACG-15, CONSOLIDATION OF VARIABLE INTEREST ENTITIES. In June 2003, the CICA issued AcG-15, which requires theconsolidation of certain entities that are subject to control on a basis other than the ownership of voting interest. This Guideline provides guidance for determiningwhen an enterprise includes the assets, liabilities and results of operations of a variable interest entity in its consolidated financial statements. The guidancerelated to consolidation requirements is effective for periods beginning on or after November 1, 2004.
The Company is in the process of assessing the impact of AcG-15, but does not expect the adoption to have a material impact on the consolidated financialstatements.
EIC ABSTRACT 141, REVENUE RECOGNITION. In December 2003, the EIC issued EIC Abstract 141, which incorporates the principles and summarizes theguidance in the U.S. Securities and Exchange Commission (SEC) Staff Accounting Bulletin (SAB) 101, Revenue Recognition in Financial Statements. TheAbstract also provides interpretive guidance on the application of CICA Handbook Section 3400, Revenue. The Abstract may be applied prospectively to salestransactions recognized in 2004, or may be applied retroactively, with prior period financial statements being restated.
Because the Company has previously applied the provisions of SAB 101, the adoption of EIC Abstract 141 is not expected to have a material impact on theconsolidated financial statements.
EIC ABSTRACT 142, REVENUE ARRANGEMENTS WITH MULTIPLE DELIVERABLES. Issued in December 2003, this Abstract addresses the accounting by vendorsfor arrangements in which the vendor will perform multiple revenue-generating activities. The Abstract conforms Canadian GAAP to the U.S. GAAP set forth inEmerging Issues Task Force, or EITF, Issue 00-21, also entitled Revenue Arrangements with Multiple Deliverables.
Because the Company has previously applied EITF Issue 00-21, the adoption of EIC Abstract 142 is not expected to have a material impact on theconsolidated financial statements.
79
CICA HANDBOOK SECTION 1100, GENERALLY ACCEPTED ACCOUNTING PRINCIPLES. CICA Handbook Section 1100 was issued in October 2003, and iseffective for the Company's fiscal year beginning January 1, 2004. The Handbook Section establishes standards for financial reporting in accordance withgenerally accepted accounting principles and clarifies the relative authority of various accounting pronouncements and other sources within GAAP.
The Company is in the process of assessing the impact of this standard.
Comparative Amounts
Prior periods have been restated for discontinued operations. Additionally, where necessary, certain amounts for 2002 have been reclassified to conform tothe current year's presentation. In particular, within Thomson Learning, for the year ended December 31, 2002, revenues and cost of sales, selling, marketing,general and administrative expenses were increased by $26 million to present on a gross basis certain freight and distribution costs charged to customers whichhad previously been netted. Additionally, within Thomson Financial, for the year ended December 31, 2002, revenues and cost of sales, selling, marketing,general and administrative expenses were increased by $70 million to present on a gross basis certain stock exchange fees charged to customers which hadpreviously been netted. On a consolidated basis, for the year ended December 31, 2002, after eliminating intercompany revenues of $3 million, the total increasein revenues and expenses was $93 million. The revised presentation is in accordance with EIC Abstract 123, Reporting Revenue Gross as a Principal versus Net
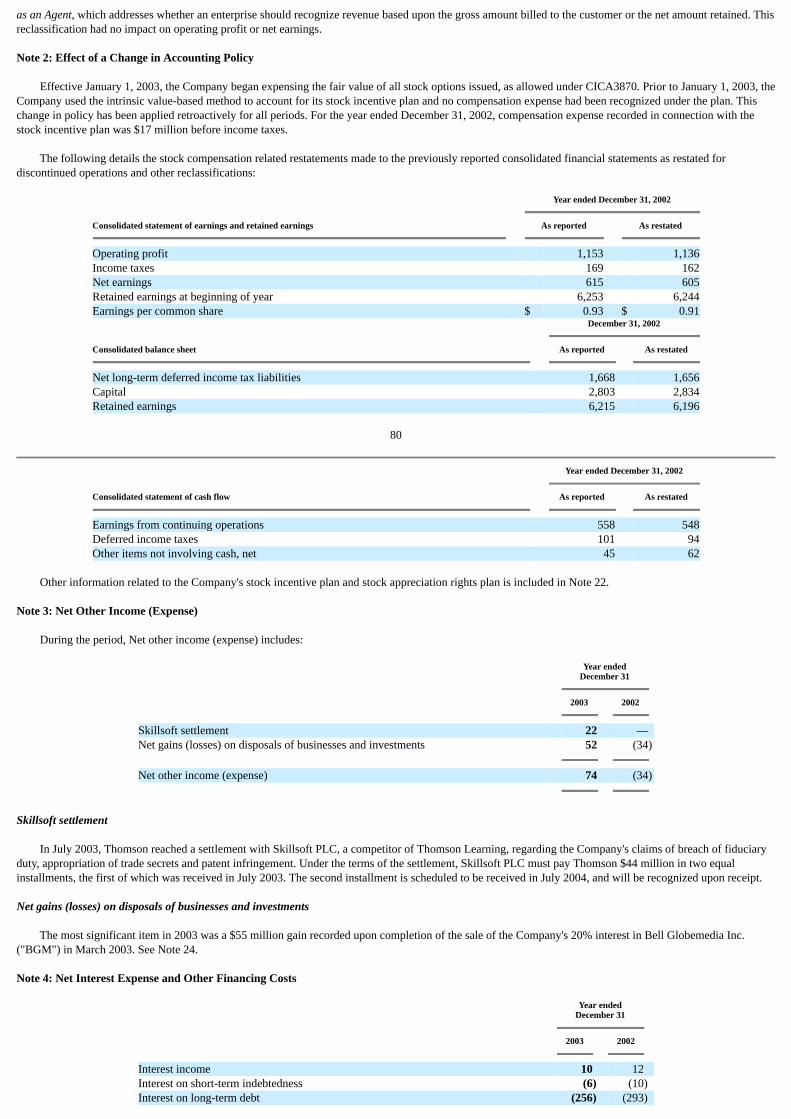
as an Agent, which addresses whether an enterprise should recognize revenue based upon the gross amount billed to the customer or the net amount retained. Thisreclassification had no impact on operating profit or net earnings.
Note 2: Effect of a Change in Accounting Policy
Effective January 1, 2003, the Company began expensing the fair value of all stock options issued, as allowed under CICA3870. Prior to January 1, 2003, theCompany used the intrinsic value-based method to account for its stock incentive plan and no compensation expense had been recognized under the plan. Thischange in policy has been applied retroactively for all periods. For the year ended December 31, 2002, compensation expense recorded in connection with thestock incentive plan was $17 million before income taxes.
The following details the stock compensation related restatements made to the previously reported consolidated financial statements as restated fordiscontinued operations and other reclassifications:
Year ended December 31, 2002
Consolidated statement of earnings and retained earnings
As reported
As restated
Operating profit 1,153 1,136Income taxes 169 162Net earnings 615 605Retained earnings at beginning of year 6,253 6,244Earnings per common share $ 0.93 $ 0.91
December 31, 2002
Consolidated balance sheet
As reported
As restated
Net long-term deferred income tax liabilities 1,668 1,656Capital 2,803 2,834Retained earnings 6,215 6,196
80
Year ended December 31, 2002
Consolidated statement of cash flow
As reported
As restated
Earnings from continuing operations 558 548Deferred income taxes 101 94Other items not involving cash, net 45 62
Other information related to the Company's stock incentive plan and stock appreciation rights plan is included in Note 22.
Note 3: Net Other Income (Expense)
During the period, Net other income (expense) includes:
Year endedDecember 31
2003
2002
Skillsoft settlement 22 — Net gains (losses) on disposals of businesses and investments 52 (34) Net other income (expense) 74 (34)
Skillsoft settlement
In July 2003, Thomson reached a settlement with Skillsoft PLC, a competitor of Thomson Learning, regarding the Company's claims of breach of fiduciaryduty, appropriation of trade secrets and patent infringement. Under the terms of the settlement, Skillsoft PLC must pay Thomson $44 million in two equalinstallments, the first of which was received in July 2003. The second installment is scheduled to be received in July 2004, and will be recognized upon receipt.
Net gains (losses) on disposals of businesses and investments
The most significant item in 2003 was a $55 million gain recorded upon completion of the sale of the Company's 20% interest in Bell Globemedia Inc.("BGM") in March 2003. See Note 24.
Note 4: Net Interest Expense and Other Financing Costs
Year endedDecember 31
2003
2002
Interest income 10 12 Interest on short-term indebtedness (6) (10)Interest on long-term debt (256) (293)

(252) (291)
Interest paid on short-term indebtedness and long-term debt during 2003 was $263 million (2002—$282 million) and interest received during 2003 was$12 million (2002—$11 million).
81
Note 5: Income Taxes
The components of earnings (loss) before taxes by jurisdiction are as follows:
Year ended December 31
2003
2002
Canada (127) (239)U.S. and other jurisdictions 1,140 1,050 Total earnings before taxes(1) 1,013 811
(1) Represents earnings from continuing operations before equity in net losses of associates, net of tax and income taxes.
The provision for income taxes consists of:
Year endedDecember 31
2003
2002
Canada: Current 1 1 Deferred — 1 Total Canadian 1 2 U.S. and other jurisdictions: Current 133 67 Deferred 22 93 Total U.S. and other jurisdictions 155 160 Total worldwide 156 162
The tax effects of the significant components of temporary differences giving rise to the Company's deferred income tax assets and liabilities at December 31are as follows:
2003
2002
Accrued expenses 155 145 Accounts receivable allowances 96 86 Deferred compensation 85 83 Financial instruments — 64 Tax loss and credit carryforwards 736 502 Other 97 135 Total deferred tax asset 1,169 1,015 Valuation allowance (534) (540) Net deferred tax asset 635 475 Intangible assets (1,564) (1,482)Property and equipment (244) (253)Financial instruments (72) — Pension (148) (126)Other (60) (52) Total deferred tax liability (2,088) (1,913) Net deferred tax liability (1,453) (1,438)

82
The net deferred liability of $1,453 million (2002—$1,438 million) was comprised of net current deferred tax assets of $185 million (2002—$218 million)and net long-term deferred tax liabilities of $1,638 million (2002—$1,656 million).
The net movement in the valuation allowance from 2002 to 2003 primarily relates to additions from Canadian losses sustained in 2003, the reversal of prioryears' contingencies and additions from foreign currency translation, offset by the change in the deferred tax liability related to the revaluation of the currencyswap financial instruments, which reduced the valuation allowance requirement.
The following is a reconciliation of income taxes calculated at the Canadian corporate tax rate of 36.6% (2002—38.6%) to the income tax provision:
2003
2002
Earnings before taxes 1,013 811 Income taxes at the Canadian corporate tax rate 371 313 Differences attributable to: Effect of income recorded at rates different than the Canadian tax rate (173) (213) Change in valuation allowance 33 78 Net change to contingent tax liabilities (64) — Other, net (11) (16) Income tax provision on continuing operations 156 162
The Company's tax provision is impacted by the geographical mix of earnings before taxes, and also by the impact of differing tax rules applicable to theCompany's operating and financing subsidiaries outside Canada. The Company maintains a tax liability for contingencies associated with known issues underdiscussion with tax authorities and transactions yet to be settled and regularly assesses the adequacy of this tax liability. In the fourth quarter of 2003, theCompany reduced its contingent tax liabilities by a net amount of $64 million, principally arising from a favorable tax settlement.
At December 31, 2003, the Company had Canadian tax loss carryforwards of $1,335 million, and tax loss carryforwards in other jurisdictions of$383 million. If not utilized, $56 million of Canadian tax loss carryforwards will expire in 2004, with the majority of the remainder expiring between 2007 and2010. The majority of the tax loss carryforwards from other jurisdictions may be carried forward indefinitely. The ability to realize the tax benefits of these lossesis dependent upon a number of factors, including the future profitability of operations in the jurisdictions in which the tax losses arose. Additionally, the Companyhad other tax credit carryforwards of $32 million, which may be carried forward indefinitely, and $70 million of capital loss carryforwards that may be used onlyin offsetting future capital gains.
The total amount of undistributed earnings of non-Canadian subsidiaries for income tax purposes was approximately $4.8 billion at December 31, 2003. Aportion of such undistributed earnings can be remitted to Canada tax free. Where tax free remittance of undistributed earnings is not possible, it is the Company'sintention to reinvest such undistributed earnings and thereby indefinitely postpone their remittance. Accordingly, no provision has been made for withholdingincome taxes that may become payable if undistributed earnings from non-Canadian subsidiaries were distributed by those companies. The additional taxes onthat portion of the undistributed earnings, which is available for dividends, are not practicably determinable.
83
Note 6: Discontinued Operations
On October 1, 2003, Thomson sold its portfolio of healthcare magazines for $135 million and recorded the related pre-tax gain on the sale of $103 million inthe fourth quarter of 2003. The magazines had previously been managed within Thomson Scientific & Healthcare.
In June 2003, Thomson announced its intention to sell DBM (Drake Beam Morin), a provider of human resource solutions, which had been managed withinThomson Learning. The Company completed the sale in February 2004. Based on the status of negotiations at December 31, 2003, an impairment charge relatingto goodwill of $62 million before income taxes was recorded in the fourth quarter of 2003 within discontinued operations.
In November 2003, Thomson announced its intention to sell Sheshunoff Information Services Inc. ("Sheshunoff"), a provider of critical data, compliance andmanagement tools to financial institutions, which had been managed within Thomson Media. The Company is working toward completing a sale in the first halfof 2004. Based on recent estimates of fair value, an impairment charge relating to identifiable intangible assets and goodwill of $24 million before income taxeswas recorded in the fourth quarter of 2003 within discontinued operations.
These three businesses, along with one other small business from Thomson Learning, which was sold in June 2003, were classified as discontinuedoperations within the consolidated financial statements for all periods presented. None of these businesses is considered fundamental to the integrated informationofferings of Thomson.
The carrying amounts of assets and liabilities related to these discontinued businesses as of December 31, 2003 and 2002 are as follows:
Balance Sheet—December 31, 2003
DBM
HealthcareMagazines
Sheshunoff
Other
Total 2003
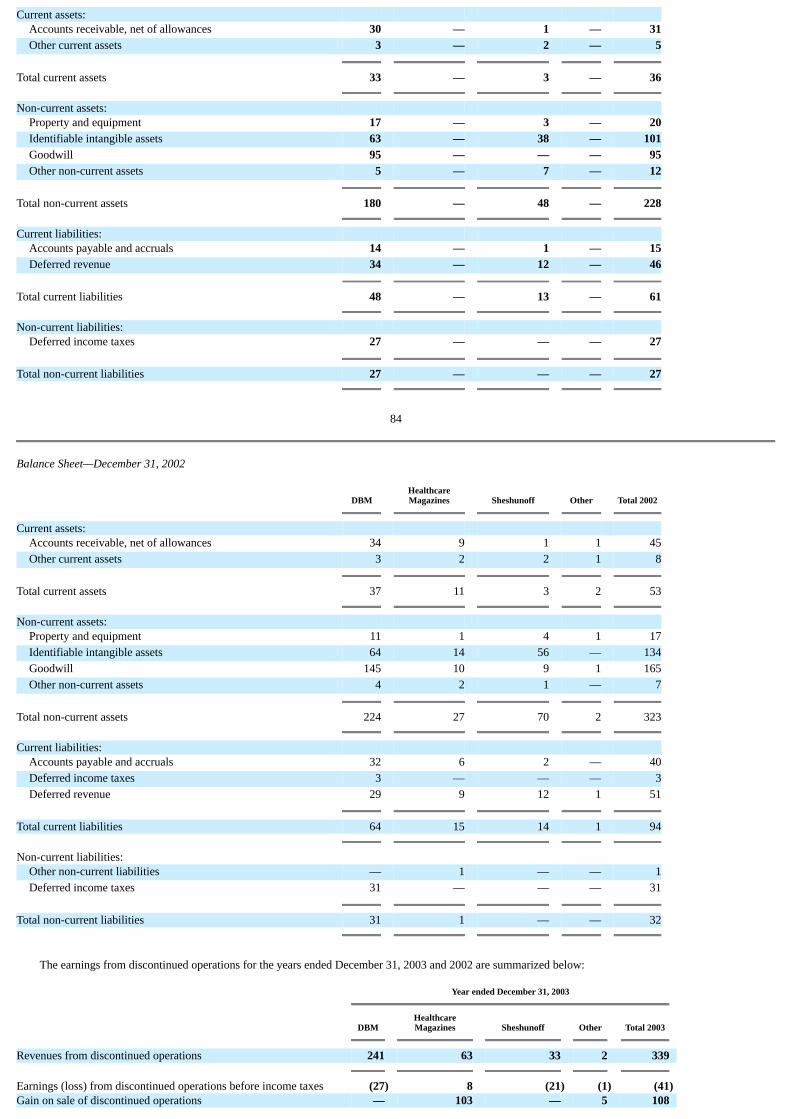
Current assets: Accounts receivable, net of allowances 30 — 1 — 31 Other current assets 3 — 2 — 5 Total current assets 33 — 3 — 36 Non-current assets: Property and equipment 17 — 3 — 20 Identifiable intangible assets 63 — 38 — 101 Goodwill 95 — — — 95 Other non-current assets 5 — 7 — 12 Total non-current assets 180 — 48 — 228 Current liabilities: Accounts payable and accruals 14 — 1 — 15 Deferred revenue 34 — 12 — 46 Total current liabilities 48 — 13 — 61 Non-current liabilities: Deferred income taxes 27 — — — 27 Total non-current liabilities 27 — — — 27
84
Balance Sheet—December 31, 2002
DBM
HealthcareMagazines
Sheshunoff
Other
Total 2002
Current assets: Accounts receivable, net of allowances 34 9 1 1 45 Other current assets 3 2 2 1 8 Total current assets 37 11 3 2 53 Non-current assets: Property and equipment 11 1 4 1 17 Identifiable intangible assets 64 14 56 — 134 Goodwill 145 10 9 1 165 Other non-current assets 4 2 1 — 7 Total non-current assets 224 27 70 2 323 Current liabilities: Accounts payable and accruals 32 6 2 — 40 Deferred income taxes 3 — — — 3 Deferred revenue 29 9 12 1 51 Total current liabilities 64 15 14 1 94 Non-current liabilities: Other non-current liabilities — 1 — — 1 Deferred income taxes 31 — — — 31 Total non-current liabilities 31 1 — — 32
The earnings from discontinued operations for the years ended December 31, 2003 and 2002 are summarized below:
Year ended December 31, 2003
DBM
HealthcareMagazines
Sheshunoff
Other
Total 2003
Revenues from discontinued operations 241 63 33 2 339 Earnings (loss) from discontinued operations before income taxes (27) 8 (21) (1) (41)Gain on sale of discontinued operations — 103 — 5 108
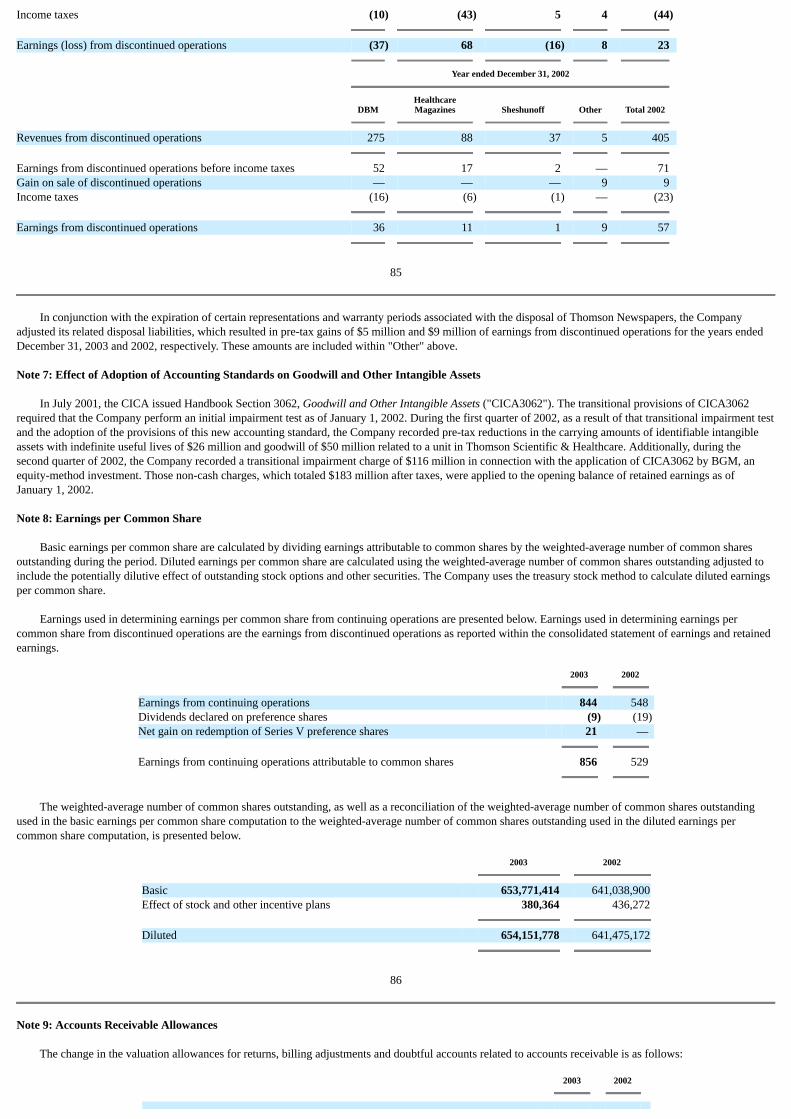
Income taxes (10) (43) 5 4 (44) Earnings (loss) from discontinued operations (37) 68 (16) 8 23
Year ended December 31, 2002
DBM
HealthcareMagazines
Sheshunoff
Other
Total 2002
Revenues from discontinued operations 275 88 37 5 405 Earnings from discontinued operations before income taxes 52 17 2 — 71 Gain on sale of discontinued operations — — — 9 9 Income taxes (16) (6) (1) — (23) Earnings from discontinued operations 36 11 1 9 57
85
In conjunction with the expiration of certain representations and warranty periods associated with the disposal of Thomson Newspapers, the Companyadjusted its related disposal liabilities, which resulted in pre-tax gains of $5 million and $9 million of earnings from discontinued operations for the years endedDecember 31, 2003 and 2002, respectively. These amounts are included within "Other" above.
Note 7: Effect of Adoption of Accounting Standards on Goodwill and Other Intangible Assets
In July 2001, the CICA issued Handbook Section 3062, Goodwill and Other Intangible Assets ("CICA3062"). The transitional provisions of CICA3062required that the Company perform an initial impairment test as of January 1, 2002. During the first quarter of 2002, as a result of that transitional impairment testand the adoption of the provisions of this new accounting standard, the Company recorded pre-tax reductions in the carrying amounts of identifiable intangibleassets with indefinite useful lives of $26 million and goodwill of $50 million related to a unit in Thomson Scientific & Healthcare. Additionally, during thesecond quarter of 2002, the Company recorded a transitional impairment charge of $116 million in connection with the application of CICA3062 by BGM, anequity-method investment. Those non-cash charges, which totaled $183 million after taxes, were applied to the opening balance of retained earnings as ofJanuary 1, 2002.
Note 8: Earnings per Common Share
Basic earnings per common share are calculated by dividing earnings attributable to common shares by the weighted-average number of common sharesoutstanding during the period. Diluted earnings per common share are calculated using the weighted-average number of common shares outstanding adjusted toinclude the potentially dilutive effect of outstanding stock options and other securities. The Company uses the treasury stock method to calculate diluted earningsper common share.
Earnings used in determining earnings per common share from continuing operations are presented below. Earnings used in determining earnings percommon share from discontinued operations are the earnings from discontinued operations as reported within the consolidated statement of earnings and retainedearnings.
2003
2002
Earnings from continuing operations 844 548 Dividends declared on preference shares (9) (19)Net gain on redemption of Series V preference shares 21 — Earnings from continuing operations attributable to common shares 856 529
The weighted-average number of common shares outstanding, as well as a reconciliation of the weighted-average number of common shares outstandingused in the basic earnings per common share computation to the weighted-average number of common shares outstanding used in the diluted earnings percommon share computation, is presented below.
2003
2002
Basic 653,771,414 641,038,900Effect of stock and other incentive plans 380,364 436,272 Diluted 654,151,778 641,475,172
86
Note 9: Accounts Receivable Allowances
The change in the valuation allowances for returns, billing adjustments and doubtful accounts related to accounts receivable is as follows:
2003
2002

Balance at beginning of year 369 380 Charges 448 452 Write-offs (485) (462)Other 13 (1) Balance at end of year 345 369
Other includes additions from acquisitions, net of reductions from disposals, and the impact from foreign currency translation.
The Company is exposed to normal credit risk with respect to its accounts receivable. To mitigate this credit risk, the Company follows a program ofcustomer credit evaluation and maintains provisions for potential credit losses. The Company has no significant exposure to any single customer.
Note 10: Inventories
Inventories consist of the following:
2003
2002
Raw materials 26 38Work in process 34 34Finished goods 250 213 310 285
Note 11: Property and Equipment
Property and equipment consist of the following:
2003
2002
Land, buildings and building improvements 494 473 Furniture, fixtures and equipment 910 830 Computer hardware 1,044 1,047 Internal-use computer software 1,408 1,153 3,856 3,503 Accumulated depreciation (2,317) (1,972) 1,539 1,531
Fully depreciated assets are retained in asset and accumulated depreciation accounts until such assets are removed from service. In the case of disposals,assets and related accumulated depreciation amounts are removed from the accounts, and the net amounts, less proceeds from disposals, are included in income.The depreciation charge in 2003 was $588 million (2002—$535 million), of which $240 million (2002—$193 million) represented amortization of capitalizedinternal-use computer software.
87
Note 12: Identifiable Intangible Assets
The following table presents the details of identifiable intangible assets as at December 31, 2003 and 2002.
As at December 31, 2003
Gross identifiableintangible assets
Accumulatedamortization
Net identifiableintangible
assets
Finite useful lives: Tradenames 342 (91) 251 Customer relationships 1,707 (466) 1,241 Databases and content 1,225 (374) 851 Publishing rights 1,746 (550) 1,196 Other 140 (63) 77 5,160 (1,544) 3,616 Indefinite useful lives: Tradenames 851 851 6,011 (1,544) 4,467 As at December 31, 2002 Gross identifiable Accumulated Net identifiable
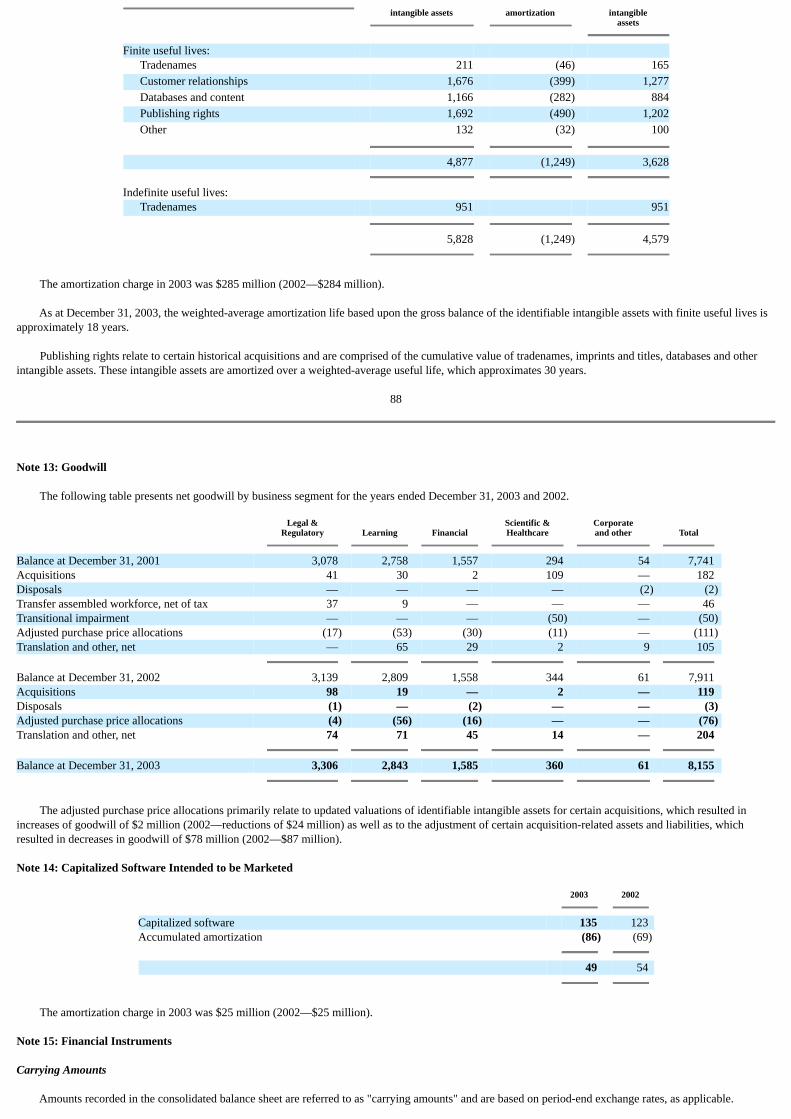
intangible assets amortization intangibleassets
Finite useful lives: Tradenames 211 (46) 165 Customer relationships 1,676 (399) 1,277 Databases and content 1,166 (282) 884 Publishing rights 1,692 (490) 1,202 Other 132 (32) 100 4,877 (1,249) 3,628 Indefinite useful lives: Tradenames 951 951 5,828 (1,249) 4,579
The amortization charge in 2003 was $285 million (2002—$284 million).
As at December 31, 2003, the weighted-average amortization life based upon the gross balance of the identifiable intangible assets with finite useful lives isapproximately 18 years.
Publishing rights relate to certain historical acquisitions and are comprised of the cumulative value of tradenames, imprints and titles, databases and otherintangible assets. These intangible assets are amortized over a weighted-average useful life, which approximates 30 years.
88
Note 13: Goodwill
The following table presents net goodwill by business segment for the years ended December 31, 2003 and 2002.
Legal &Regulatory
Learning
Financial
Scientific &Healthcare
Corporateand other
Total
Balance at December 31, 2001 3,078 2,758 1,557 294 54 7,741 Acquisitions 41 30 2 109 — 182 Disposals — — — — (2) (2)Transfer assembled workforce, net of tax 37 9 — — — 46 Transitional impairment — — — (50) — (50)Adjusted purchase price allocations (17) (53) (30) (11) — (111)Translation and other, net — 65 29 2 9 105 Balance at December 31, 2002 3,139 2,809 1,558 344 61 7,911 Acquisitions 98 19 — 2 — 119 Disposals (1) — (2) — — (3)Adjusted purchase price allocations (4) (56) (16) — — (76)Translation and other, net 74 71 45 14 — 204 Balance at December 31, 2003 3,306 2,843 1,585 360 61 8,155
The adjusted purchase price allocations primarily relate to updated valuations of identifiable intangible assets for certain acquisitions, which resulted inincreases of goodwill of $2 million (2002—reductions of $24 million) as well as to the adjustment of certain acquisition-related assets and liabilities, whichresulted in decreases in goodwill of $78 million (2002—$87 million).
Note 14: Capitalized Software Intended to be Marketed
2003
2002
Capitalized software 135 123 Accumulated amortization (86) (69) 49 54
The amortization charge in 2003 was $25 million (2002—$25 million).
Note 15: Financial Instruments
Carrying Amounts
Amounts recorded in the consolidated balance sheet are referred to as "carrying amounts" and are based on period-end exchange rates, as applicable.
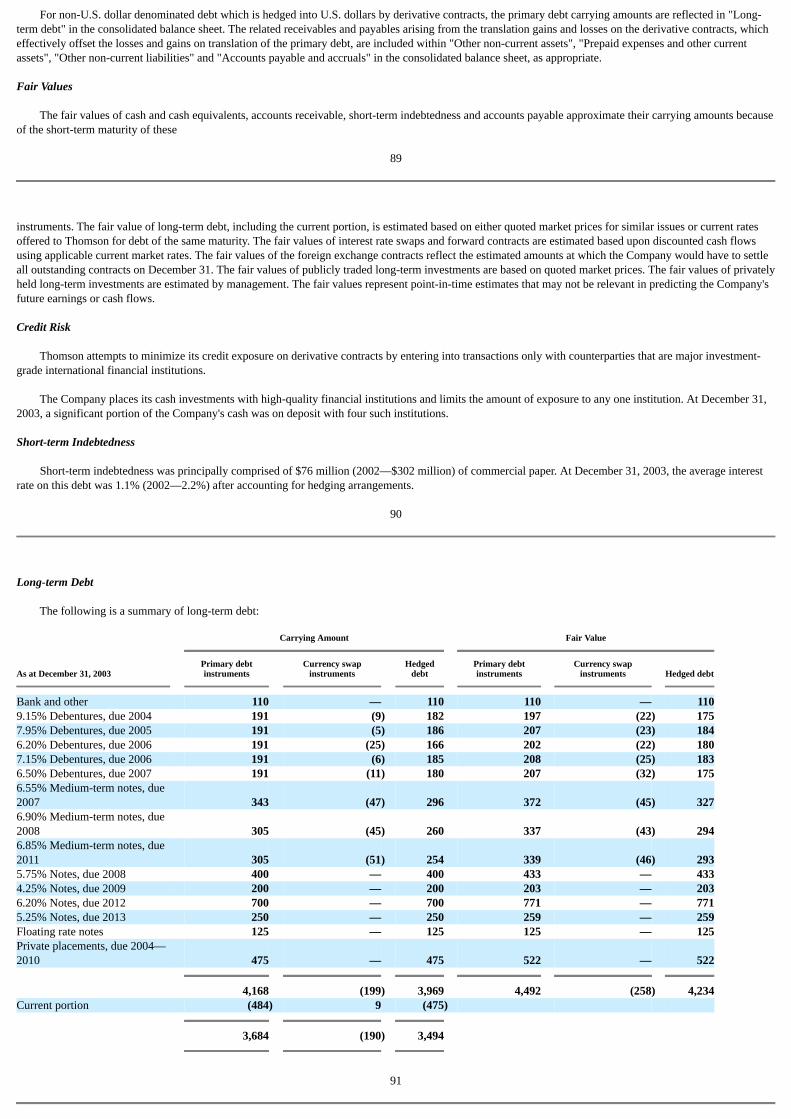
For non-U.S. dollar denominated debt which is hedged into U.S. dollars by derivative contracts, the primary debt carrying amounts are reflected in "Long-term debt" in the consolidated balance sheet. The related receivables and payables arising from the translation gains and losses on the derivative contracts, whicheffectively offset the losses and gains on translation of the primary debt, are included within "Other non-current assets", "Prepaid expenses and other currentassets", "Other non-current liabilities" and "Accounts payable and accruals" in the consolidated balance sheet, as appropriate.
Fair Values
The fair values of cash and cash equivalents, accounts receivable, short-term indebtedness and accounts payable approximate their carrying amounts becauseof the short-term maturity of these
89
instruments. The fair value of long-term debt, including the current portion, is estimated based on either quoted market prices for similar issues or current ratesoffered to Thomson for debt of the same maturity. The fair values of interest rate swaps and forward contracts are estimated based upon discounted cash flowsusing applicable current market rates. The fair values of the foreign exchange contracts reflect the estimated amounts at which the Company would have to settleall outstanding contracts on December 31. The fair values of publicly traded long-term investments are based on quoted market prices. The fair values of privatelyheld long-term investments are estimated by management. The fair values represent point-in-time estimates that may not be relevant in predicting the Company'sfuture earnings or cash flows.
Credit Risk
Thomson attempts to minimize its credit exposure on derivative contracts by entering into transactions only with counterparties that are major investment-grade international financial institutions.
The Company places its cash investments with high-quality financial institutions and limits the amount of exposure to any one institution. At December 31,2003, a significant portion of the Company's cash was on deposit with four such institutions.
Short-term Indebtedness
Short-term indebtedness was principally comprised of $76 million (2002—$302 million) of commercial paper. At December 31, 2003, the average interestrate on this debt was 1.1% (2002—2.2%) after accounting for hedging arrangements.
90
Long-term Debt
The following is a summary of long-term debt:
Carrying Amount
Fair Value
As at December 31, 2003
Primary debtinstruments
Currency swapinstruments
Hedgeddebt
Primary debtinstruments
Currency swapinstruments
Hedged debt
Bank and other 110 — 110 110 — 1109.15% Debentures, due 2004 191 (9) 182 197 (22) 1757.95% Debentures, due 2005 191 (5) 186 207 (23) 1846.20% Debentures, due 2006 191 (25) 166 202 (22) 1807.15% Debentures, due 2006 191 (6) 185 208 (25) 1836.50% Debentures, due 2007 191 (11) 180 207 (32) 1756.55% Medium-term notes, due2007 343 (47) 296 372 (45) 3276.90% Medium-term notes, due2008 305 (45) 260 337 (43) 2946.85% Medium-term notes, due2011 305 (51) 254 339 (46) 2935.75% Notes, due 2008 400 — 400 433 — 4334.25% Notes, due 2009 200 — 200 203 — 2036.20% Notes, due 2012 700 — 700 771 — 7715.25% Notes, due 2013 250 — 250 259 — 259Floating rate notes 125 — 125 125 — 125Private placements, due 2004—2010 475 — 475 522 — 522 4,168 (199) 3,969 4,492 (258) 4,234Current portion (484) 9 (475) 3,684 (190) 3,494
91

Carrying Amount
Fair Value
As at December 31, 2002
Primary debtinstruments
Currency swapinstruments
Hedgeddebt
Primary debtinstruments
Currency swapinstruments
Hedged debt
Bank and other 108 — 108 108 — 1087.70% Debentures, due 2003 159 37 196 165 30 1959.15% Debentures, due 2004 159 23 182 171 5 1767.95% Debentures, due 2005 159 27 186 175 8 1836.20% Debentures, due 2006 159 7 166 168 16 1847.15% Debentures, due 2006 159 26 185 173 7 1806.50% Debentures, due 2007 159 21 180 170 4 1746.55% Medium-term notes, due2007 285 11 296 307 25 3326.90% Medium-term notes, due2008 254 6 260 277 20 2976.85% Medium-term notes, due2011 254 — 254 272 21 2935.75% Notes, due 2008 400 — 400 432 — 4326.20% Notes, due 2012 700 — 700 759 — 759Floating rate notes 125 — 125 125 — 125Private placements, due 2004—2010 475 — 475 536 — 536Redeemable preference shares(note 25) 250 — 250 261 — 261 3,805 158 3,963 4,099 136 4,235Current portion (318) (37) (355) 3,487 121 3,608
The floating rate notes will mature on March 22, 2004 and are subject to a one-year extension by the holders from March 22, 2004 to March 21, 2005.Interest, which is payable quarterly, is equal to U.S.$ LIBOR plus (i) 0.55% for the period from March 20, 2003 through March 21, 2004, and (ii) 0.65% for theperiod from March 22, 2004 through March 20, 2005. The private placements have interest rates ranging from 6.76% to 7.98%, with a weighted-average rate of7.53% at December 31, 2003.
Bank and other debt at December 31, 2003 and 2002 was primarily denominated in foreign currencies. The debentures and medium-term notes are Canadiandollar denominated and are fully hedged into U.S. dollars. The 5.75% Notes, 4.25% Notes, 6.20% Notes, 5.25% Notes, floating rate
92
notes, private placements and redeemable preference shares are U.S. dollar denominated. The carrying amount of long-term debt, all of which is unsecured, wasdenominated in the following currencies:
Before hedgingarrangements
After hedgingarrangements
2003
2002
2003
2002
Canadian dollar 1,908 1,747 — —U.S. dollar 2,183 1,981 3,892 3,886Other currencies 77 77 77 77 4,168 3,805 3,969 3,963
Maturities of long-term debt in each of the next five years and thereafter are as follows:
2004
2005
2006
2007
2008
Thereafter
Total
Before hedging arrangements 484 316 432 635 771 1,530 4,168After hedging arrangements 475 311 401 577 726 1,479 3,969
At December 31, 2003, undrawn and available bank facilities amounted to $1,419 million.
In August 2003, Thomson completed an offering of $450 million of global notes. The offering included $200 million of 4.25% unsecured notes due 2009 and$250 million of 5.25% unsecured notes due 2013. The Company entered into an interest rate swap related to the 4.25% notes due 2009 to convert these notesfrom a fixed rate of interest to a floating rate of interest. Thomson used a portion of the proceeds to redeem $250 million of preferred shares issued to a subsidiaryof Thomson's principal shareholder, The Woodbridge Company Limited ("Woodbridge") (see Note 25) and used the balance to repay other outstandingindebtedness and for general corporate purposes.
In January 2002, Thomson issued $400 million of U.S. dollar denominated principal amount unsecured notes due February 1, 2008 bearing an annual rate ofinterest of 5.75%, payable semi-annually. The net proceeds of $397 million were principally used to repay existing indebtedness.
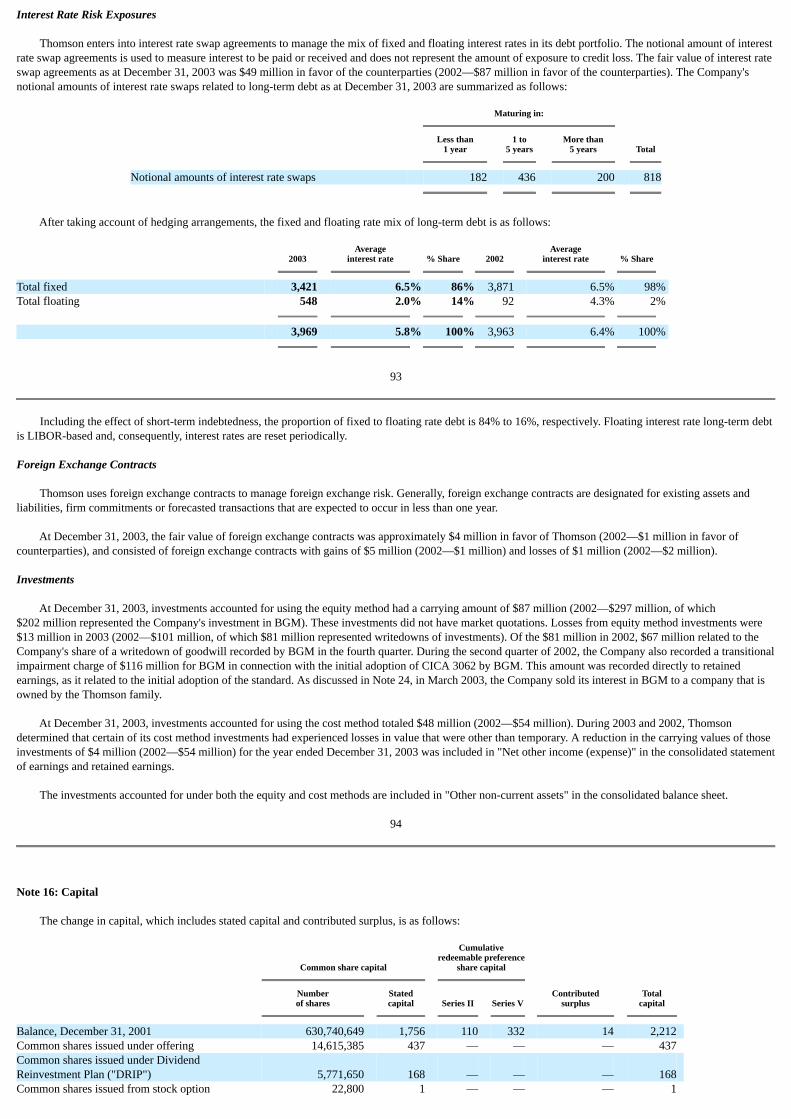
Interest Rate Risk Exposures
Thomson enters into interest rate swap agreements to manage the mix of fixed and floating interest rates in its debt portfolio. The notional amount of interestrate swap agreements is used to measure interest to be paid or received and does not represent the amount of exposure to credit loss. The fair value of interest rateswap agreements as at December 31, 2003 was $49 million in favor of the counterparties (2002—$87 million in favor of the counterparties). The Company'snotional amounts of interest rate swaps related to long-term debt as at December 31, 2003 are summarized as follows:
Maturing in:
Less than1 year
1 to5 years
More than5 years
Total
Notional amounts of interest rate swaps 182 436 200 818
After taking account of hedging arrangements, the fixed and floating rate mix of long-term debt is as follows:
2003
Averageinterest rate
% Share
2002
Averageinterest rate
% Share
Total fixed 3,421 6.5% 86% 3,871 6.5% 98%Total floating 548 2.0% 14% 92 4.3% 2% 3,969 5.8% 100% 3,963 6.4% 100%
93
Including the effect of short-term indebtedness, the proportion of fixed to floating rate debt is 84% to 16%, respectively. Floating interest rate long-term debtis LIBOR-based and, consequently, interest rates are reset periodically.
Foreign Exchange Contracts
Thomson uses foreign exchange contracts to manage foreign exchange risk. Generally, foreign exchange contracts are designated for existing assets andliabilities, firm commitments or forecasted transactions that are expected to occur in less than one year.
At December 31, 2003, the fair value of foreign exchange contracts was approximately $4 million in favor of Thomson (2002—$1 million in favor ofcounterparties), and consisted of foreign exchange contracts with gains of $5 million (2002—$1 million) and losses of $1 million (2002—$2 million).
Investments
At December 31, 2003, investments accounted for using the equity method had a carrying amount of $87 million (2002—$297 million, of which$202 million represented the Company's investment in BGM). These investments did not have market quotations. Losses from equity method investments were$13 million in 2003 (2002—$101 million, of which $81 million represented writedowns of investments). Of the $81 million in 2002, $67 million related to theCompany's share of a writedown of goodwill recorded by BGM in the fourth quarter. During the second quarter of 2002, the Company also recorded a transitionalimpairment charge of $116 million for BGM in connection with the initial adoption of CICA 3062 by BGM. This amount was recorded directly to retainedearnings, as it related to the initial adoption of the standard. As discussed in Note 24, in March 2003, the Company sold its interest in BGM to a company that isowned by the Thomson family.
At December 31, 2003, investments accounted for using the cost method totaled $48 million (2002—$54 million). During 2003 and 2002, Thomsondetermined that certain of its cost method investments had experienced losses in value that were other than temporary. A reduction in the carrying values of thoseinvestments of $4 million (2002—$54 million) for the year ended December 31, 2003 was included in "Net other income (expense)" in the consolidated statementof earnings and retained earnings.
The investments accounted for under both the equity and cost methods are included in "Other non-current assets" in the consolidated balance sheet.
94
Note 16: Capital
The change in capital, which includes stated capital and contributed surplus, is as follows:
Common share capital
Cumulativeredeemable preference
share capital
Numberof shares
Statedcapital
Series II
Series V
Contributedsurplus
Totalcapital
Balance, December 31, 2001 630,740,649 1,756 110 332 14 2,212 Common shares issued under offering 14,615,385 437 — — — 437 Common shares issued under DividendReinvestment Plan ("DRIP") 5,771,650 168 — — — 168 Common shares issued from stock option 22,800 1 — — — 1
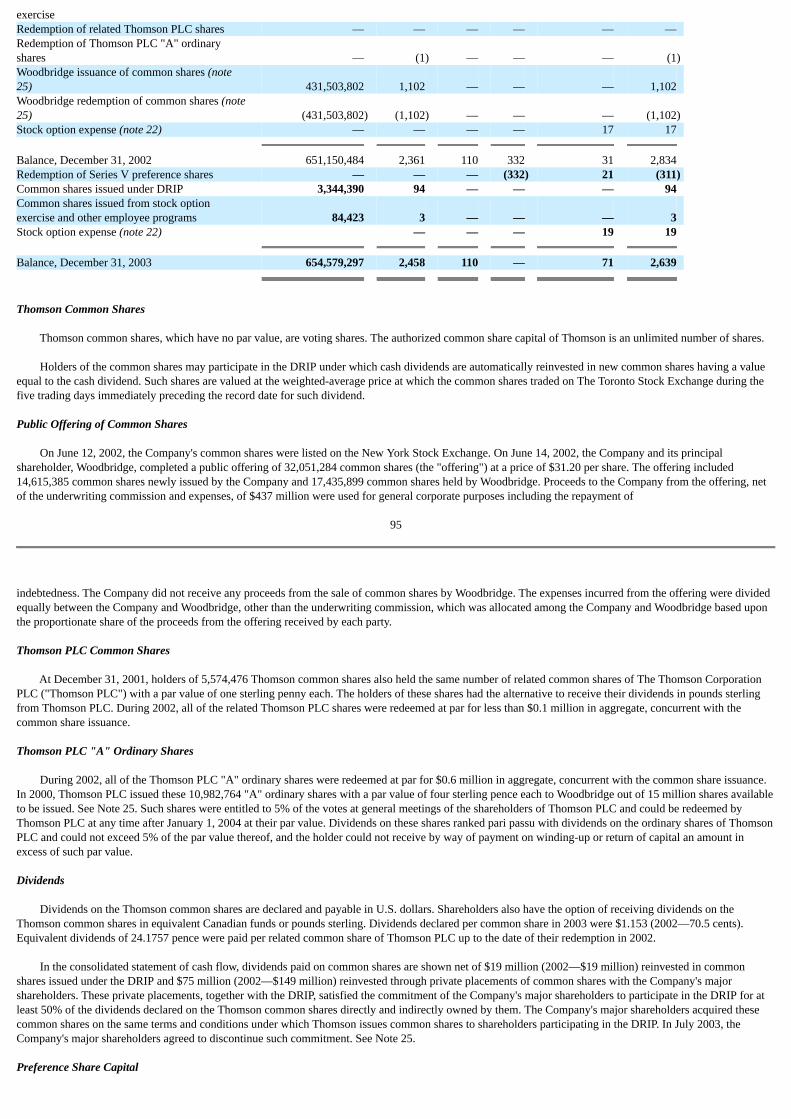
exerciseRedemption of related Thomson PLC shares — — — — — — Redemption of Thomson PLC "A" ordinaryshares — (1) — — — (1)Woodbridge issuance of common shares (note25) 431,503,802 1,102 — — — 1,102 Woodbridge redemption of common shares (note25) (431,503,802) (1,102) — — — (1,102)Stock option expense (note 22) — — — — 17 17 Balance, December 31, 2002 651,150,484 2,361 110 332 31 2,834 Redemption of Series V preference shares — — — (332) 21 (311)Common shares issued under DRIP 3,344,390 94 — — — 94 Common shares issued from stock optionexercise and other employee programs 84,423 3 — — — 3 Stock option expense (note 22) — — — 19 19 Balance, December 31, 2003 654,579,297 2,458 110 — 71 2,639
Thomson Common Shares
Thomson common shares, which have no par value, are voting shares. The authorized common share capital of Thomson is an unlimited number of shares.
Holders of the common shares may participate in the DRIP under which cash dividends are automatically reinvested in new common shares having a valueequal to the cash dividend. Such shares are valued at the weighted-average price at which the common shares traded on The Toronto Stock Exchange during thefive trading days immediately preceding the record date for such dividend.
Public Offering of Common Shares
On June 12, 2002, the Company's common shares were listed on the New York Stock Exchange. On June 14, 2002, the Company and its principalshareholder, Woodbridge, completed a public offering of 32,051,284 common shares (the "offering") at a price of $31.20 per share. The offering included14,615,385 common shares newly issued by the Company and 17,435,899 common shares held by Woodbridge. Proceeds to the Company from the offering, netof the underwriting commission and expenses, of $437 million were used for general corporate purposes including the repayment of
95
indebtedness. The Company did not receive any proceeds from the sale of common shares by Woodbridge. The expenses incurred from the offering were dividedequally between the Company and Woodbridge, other than the underwriting commission, which was allocated among the Company and Woodbridge based uponthe proportionate share of the proceeds from the offering received by each party.
Thomson PLC Common Shares
At December 31, 2001, holders of 5,574,476 Thomson common shares also held the same number of related common shares of The Thomson CorporationPLC ("Thomson PLC") with a par value of one sterling penny each. The holders of these shares had the alternative to receive their dividends in pounds sterlingfrom Thomson PLC. During 2002, all of the related Thomson PLC shares were redeemed at par for less than $0.1 million in aggregate, concurrent with thecommon share issuance.
Thomson PLC "A" Ordinary Shares
During 2002, all of the Thomson PLC "A" ordinary shares were redeemed at par for $0.6 million in aggregate, concurrent with the common share issuance.In 2000, Thomson PLC issued these 10,982,764 "A" ordinary shares with a par value of four sterling pence each to Woodbridge out of 15 million shares availableto be issued. See Note 25. Such shares were entitled to 5% of the votes at general meetings of the shareholders of Thomson PLC and could be redeemed byThomson PLC at any time after January 1, 2004 at their par value. Dividends on these shares ranked pari passu with dividends on the ordinary shares of ThomsonPLC and could not exceed 5% of the par value thereof, and the holder could not receive by way of payment on winding-up or return of capital an amount inexcess of such par value.
Dividends
Dividends on the Thomson common shares are declared and payable in U.S. dollars. Shareholders also have the option of receiving dividends on theThomson common shares in equivalent Canadian funds or pounds sterling. Dividends declared per common share in 2003 were $1.153 (2002—70.5 cents).Equivalent dividends of 24.1757 pence were paid per related common share of Thomson PLC up to the date of their redemption in 2002.
In the consolidated statement of cash flow, dividends paid on common shares are shown net of $19 million (2002—$19 million) reinvested in commonshares issued under the DRIP and $75 million (2002—$149 million) reinvested through private placements of common shares with the Company's majorshareholders. These private placements, together with the DRIP, satisfied the commitment of the Company's major shareholders to participate in the DRIP for atleast 50% of the dividends declared on the Thomson common shares directly and indirectly owned by them. The Company's major shareholders acquired thesecommon shares on the same terms and conditions under which Thomson issues common shares to shareholders participating in the DRIP. In July 2003, theCompany's major shareholders agreed to discontinue such commitment. See Note 25.
Preference Share Capital
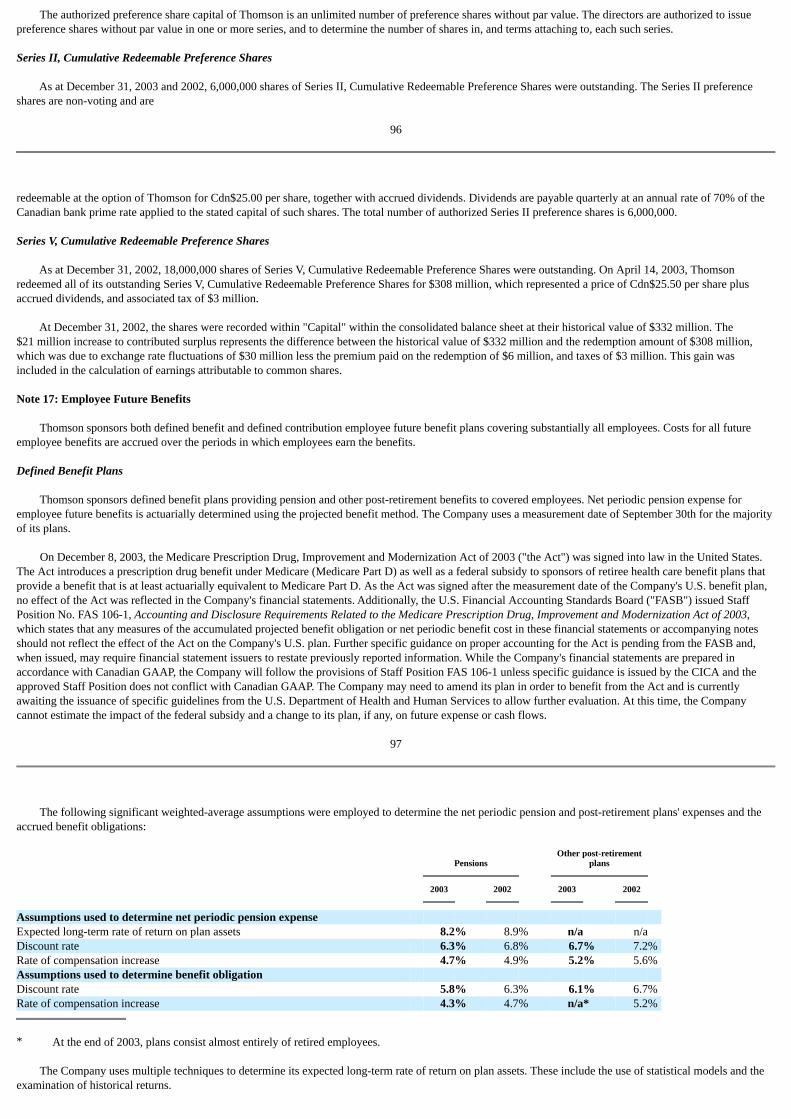
The authorized preference share capital of Thomson is an unlimited number of preference shares without par value. The directors are authorized to issuepreference shares without par value in one or more series, and to determine the number of shares in, and terms attaching to, each such series.
Series II, Cumulative Redeemable Preference Shares
As at December 31, 2003 and 2002, 6,000,000 shares of Series II, Cumulative Redeemable Preference Shares were outstanding. The Series II preferenceshares are non-voting and are
96
redeemable at the option of Thomson for Cdn$25.00 per share, together with accrued dividends. Dividends are payable quarterly at an annual rate of 70% of theCanadian bank prime rate applied to the stated capital of such shares. The total number of authorized Series II preference shares is 6,000,000.
Series V, Cumulative Redeemable Preference Shares
As at December 31, 2002, 18,000,000 shares of Series V, Cumulative Redeemable Preference Shares were outstanding. On April 14, 2003, Thomsonredeemed all of its outstanding Series V, Cumulative Redeemable Preference Shares for $308 million, which represented a price of Cdn$25.50 per share plusaccrued dividends, and associated tax of $3 million.
At December 31, 2002, the shares were recorded within "Capital" within the consolidated balance sheet at their historical value of $332 million. The$21 million increase to contributed surplus represents the difference between the historical value of $332 million and the redemption amount of $308 million,which was due to exchange rate fluctuations of $30 million less the premium paid on the redemption of $6 million, and taxes of $3 million. This gain wasincluded in the calculation of earnings attributable to common shares.
Note 17: Employee Future Benefits
Thomson sponsors both defined benefit and defined contribution employee future benefit plans covering substantially all employees. Costs for all futureemployee benefits are accrued over the periods in which employees earn the benefits.
Defined Benefit Plans
Thomson sponsors defined benefit plans providing pension and other post-retirement benefits to covered employees. Net periodic pension expense foremployee future benefits is actuarially determined using the projected benefit method. The Company uses a measurement date of September 30th for the majorityof its plans.
On December 8, 2003, the Medicare Prescription Drug, Improvement and Modernization Act of 2003 ("the Act") was signed into law in the United States.The Act introduces a prescription drug benefit under Medicare (Medicare Part D) as well as a federal subsidy to sponsors of retiree health care benefit plans thatprovide a benefit that is at least actuarially equivalent to Medicare Part D. As the Act was signed after the measurement date of the Company's U.S. benefit plan,no effect of the Act was reflected in the Company's financial statements. Additionally, the U.S. Financial Accounting Standards Board ("FASB") issued StaffPosition No. FAS 106-1, Accounting and Disclosure Requirements Related to the Medicare Prescription Drug, Improvement and Modernization Act of 2003,which states that any measures of the accumulated projected benefit obligation or net periodic benefit cost in these financial statements or accompanying notesshould not reflect the effect of the Act on the Company's U.S. plan. Further specific guidance on proper accounting for the Act is pending from the FASB and,when issued, may require financial statement issuers to restate previously reported information. While the Company's financial statements are prepared inaccordance with Canadian GAAP, the Company will follow the provisions of Staff Position FAS 106-1 unless specific guidance is issued by the CICA and theapproved Staff Position does not conflict with Canadian GAAP. The Company may need to amend its plan in order to benefit from the Act and is currentlyawaiting the issuance of specific guidelines from the U.S. Department of Health and Human Services to allow further evaluation. At this time, the Companycannot estimate the impact of the federal subsidy and a change to its plan, if any, on future expense or cash flows.
97
The following significant weighted-average assumptions were employed to determine the net periodic pension and post-retirement plans' expenses and theaccrued benefit obligations:
Pensions
Other post-retirementplans
2003
2002
2003
2002
Assumptions used to determine net periodic pension expense Expected long-term rate of return on plan assets 8.2% 8.9% n/a n/a Discount rate 6.3% 6.8% 6.7% 7.2%Rate of compensation increase 4.7% 4.9% 5.2% 5.6%Assumptions used to determine benefit obligation Discount rate 5.8% 6.3% 6.1% 6.7%Rate of compensation increase 4.3% 4.7% n/a* 5.2%
* At the end of 2003, plans consist almost entirely of retired employees.
The Company uses multiple techniques to determine its expected long-term rate of return on plan assets. These include the use of statistical models and theexamination of historical returns.

The Company's net defined benefit plan (income) expense is comprised of the following elements:
Pensions
Other post-retirement plans
Funded
Unfunded
2003
2002
2003
2002
2003
2002
Current service cost 39 30 5 4 2 1 Interest cost 104 95 10 9 8 7 Expected return on plan assets (148) (134) — — — — Amortization of net transition obligation 3 3 — — — — Amortization of net actuarial losses (gains) 8 (3) — — 1 (1)Amortization of prior service cost — — 3 1 — — Change in valuation allowance provided against accrued benefit asset — (32) — — — — Net defined benefit plan (income) expense 6 (41) 18 14 11 7
98
The following information summarizes activity in all of the pension and other post-retirement benefit plans for the Company:
Pensions
Other post-retirementplans
Funded
Unfunded
2003
2002
2003
2002
2003
2002
Benefit obligation Beginning benefit obligation 1,632 1,414 142 121 126 93 Current service cost 39 30 5 4 2 1 Interest cost 104 95 10 9 8 7 Plan participants' contributions 4 3 — — 1 1 Actuarial losses 126 99 14 8 33 33 Non-routine events — 2 5 (2) (2) — Acquisitions, net — — 1 8 — — Benefits paid (77) (73) (7) (6) (10) (9)Translation adjustments 86 62 3 — 1 — Ending benefit obligation 1,914 1,632 173 142 159 126 Plan assets Beginning fair value of plan assets 1,532 1,468 — — — — Actual return (loss) on plan assets 213 (80) — — — — Employer contributions 66 149 7 6 10 8 Plan participants' contributions 4 6 — — 1 1 Benefits paid (77) (73) (7) (6) (10) (9)Acquisitions, net 2 — — — (1) — Translation adjustments 81 62 — — — — Ending fair value of plan assets 1,821 1,532 — — — — Funded status—deficit (93) (100) (173) (142) (159) (126)Unamortized net actuarial loss 544 478 30 17 53 22 Unamortized past service costs 6 6 9 6 — — Unamortized net transitional asset (6) (3) — — — — Post-measurement date activity 26* 1 2 2 3 2 Accrued benefit asset (liability) 477 382 (132) (117) (103) (102)
* Consists primarily of contributions.
The accrued benefit assets and liabilities are included within "Other non-current assets" and "Other non-current liabilities" within the consolidated balancesheet.
The unfunded pension plans referred to above consist primarily of supplemental executive retirement plans ("SERP") for eligible employees. Thomsonpartially funds the liabilities of these plans through insurance contracts, which are excluded from plan assets in accordance with CICA Handbook Section 3461.The cash surrender values of insurance contracts used to fund the SERPs total $33 million at December 31, 2003 and are included in "Other noncurrent assets" inthe Company's consolidated balance sheet.
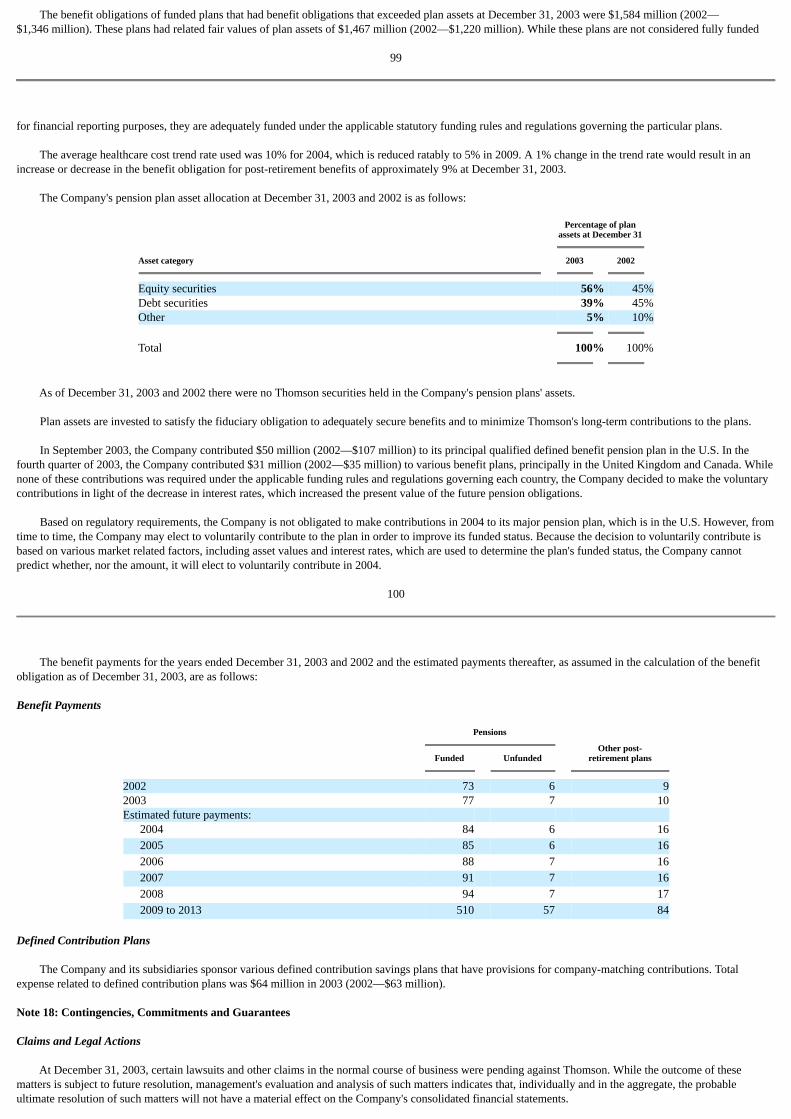
The benefit obligations of funded plans that had benefit obligations that exceeded plan assets at December 31, 2003 were $1,584 million (2002—$1,346 million). These plans had related fair values of plan assets of $1,467 million (2002—$1,220 million). While these plans are not considered fully funded
99
for financial reporting purposes, they are adequately funded under the applicable statutory funding rules and regulations governing the particular plans.
The average healthcare cost trend rate used was 10% for 2004, which is reduced ratably to 5% in 2009. A 1% change in the trend rate would result in anincrease or decrease in the benefit obligation for post-retirement benefits of approximately 9% at December 31, 2003.
The Company's pension plan asset allocation at December 31, 2003 and 2002 is as follows:
Percentage of planassets at December 31
Asset category
2003
2002
Equity securities 56% 45%Debt securities 39% 45%Other 5% 10% Total 100% 100%
As of December 31, 2003 and 2002 there were no Thomson securities held in the Company's pension plans' assets.
Plan assets are invested to satisfy the fiduciary obligation to adequately secure benefits and to minimize Thomson's long-term contributions to the plans.
In September 2003, the Company contributed $50 million (2002—$107 million) to its principal qualified defined benefit pension plan in the U.S. In thefourth quarter of 2003, the Company contributed $31 million (2002—$35 million) to various benefit plans, principally in the United Kingdom and Canada. Whilenone of these contributions was required under the applicable funding rules and regulations governing each country, the Company decided to make the voluntarycontributions in light of the decrease in interest rates, which increased the present value of the future pension obligations.
Based on regulatory requirements, the Company is not obligated to make contributions in 2004 to its major pension plan, which is in the U.S. However, fromtime to time, the Company may elect to voluntarily contribute to the plan in order to improve its funded status. Because the decision to voluntarily contribute isbased on various market related factors, including asset values and interest rates, which are used to determine the plan's funded status, the Company cannotpredict whether, nor the amount, it will elect to voluntarily contribute in 2004.
100
The benefit payments for the years ended December 31, 2003 and 2002 and the estimated payments thereafter, as assumed in the calculation of the benefitobligation as of December 31, 2003, are as follows:
Benefit Payments
Pensions
Other post-retirement plans
Funded
Unfunded
2002 73 6 92003 77 7 10Estimated future payments: 2004 84 6 16 2005 85 6 16 2006 88 7 16 2007 91 7 16 2008 94 7 17 2009 to 2013 510 57 84
Defined Contribution Plans
The Company and its subsidiaries sponsor various defined contribution savings plans that have provisions for company-matching contributions. Totalexpense related to defined contribution plans was $64 million in 2003 (2002—$63 million).
Note 18: Contingencies, Commitments and Guarantees
Claims and Legal Actions
At December 31, 2003, certain lawsuits and other claims in the normal course of business were pending against Thomson. While the outcome of thesematters is subject to future resolution, management's evaluation and analysis of such matters indicates that, individually and in the aggregate, the probableultimate resolution of such matters will not have a material effect on the Company's consolidated financial statements.

Taxes
The Company maintains a tax liability for contingencies associated with known issues under discussion with tax authorities and transactions yet to be settledand regularly assesses the adequacy of this tax liability. The Company records liabilities for known tax contingencies when, in the Company's judgment, it isprobable that a liability has been incurred.
Leases
The Company enters into operating leases in the ordinary course of business, primarily for real property and equipment. Payments for these leases arecontractual obligations as scheduled per each agreement. Operating lease payments in 2003 were $204 million (2002—$215 million). The future minimumoperating lease payments are $190 million in 2004, $173 million in 2005, $132 million in 2006, $112 million in 2007, $98 million in 2008 and $344 millionthereafter.
With certain leases, the Company guarantees a portion of the residual value loss, if any, incurred by the lessors in disposing of the assets, or in restoring aproperty to a specified condition after completion of the lease period. The Company believes, based upon current facts and circumstances, that the likelihood of amaterial payment pursuant to such guarantees is remote.
101
Business Combinations and Investments
The Company has obligations to pay additional consideration for prior acquisitions, typically based upon performance measures contractually agreed to atthe time of purchase. Known payments have been accrued. The Company does not believe that additional payments would have a material impact on theconsolidated financial statements. Additionally, the Company has capital commitments of $15 million to investees of which $11 million is payable upon demandand $4 million is payable upon the attainment of certain operational milestones by the investee.
In certain disposition agreements, the Company guarantees to the purchaser the recoverability of certain assets or limits on certain liabilities. The Companybelieves, based upon current facts and circumstances, that a material payment pursuant to such guarantees is remote. In connection with two prior dispositions,the Company has guaranteed certain obligations of which $29 million remain potentially outstanding at December 31, 2003. At this time, Thomson estimates thatit will incur $13 million of the remaining contingency, and has accrued this estimate within "Accounts payable and accruals" and "Other non-current liabilities" inthe consolidated balance sheet.
Other Commitments
At December 31, 2003 the Company has various unconditional purchase obligations. These obligations are for materials, supplies and services incident to theordinary conduct of business.
Note 19: Restructuring Charges
During the first quarter of 2002, the Company completed restructuring activities pertaining to strategic initiatives undertaken in the prior year to improveoperational and administrative efficiencies within Thomson Legal & Regulatory and Thomson Media. The restructuring charges for the year ended December 31,2002 consisted of a charge to Thomson Legal & Regulatory of $4 million and a charge to Corporate and other of $2 million.
The following table presents the activity in and balances of the restructuring liability accounts, included in "Accounts payable and accruals" and "Other non-current liabilities" in the consolidated balance sheet, from December 31, 2002 through December 31, 2003:
Type of cost
BalanceDecember 31, 2002
2003Utilization
2003Other movements
BalanceDecember 31, 2003
Severance 3 (3) — —Contract cancellation costs 6 (3) (1) 2Other exit costs 1 — — 1 10 (6) (1) 3
Substantially all of the restructuring charges recorded represented expected cash outlays.
102
Note 20: Acquisitions and Disposals of Businesses and Investments
During the year ended December 31, 2003, 25 businesses and two investments (2002—26 businesses and four investments) were acquired for cashconsideration as follows:
Year endedDecember 31
2003
2002
Businesses acquired 233 277Investments in businesses 3 10

Total acquisitions of businesses and investments 236 287
All acquisitions have been accounted for using the purchase method and the results of acquired businesses are included in the consolidated financialstatements from the dates of acquisition. For acquisitions made in 2003 and 2002, the majority of the acquired goodwill is not deductible for tax purposes.
The details of net assets of businesses acquired are as follows:
2003
2002
Cash and cash equivalents 25 15 Accounts receivable 23 5 Inventories 4 2 Prepaid expenses and other current assets 5 8 Property and equipment 8 8 Identifiable intangible assets 105 107 Goodwill 119 182 Other non-current assets 6 — Total assets 295 327 Accounts payable and accruals (27) (23)Deferred revenue (29) (20)Other non-current liabilities (6) (7) Total liabilities (62) (50) Net assets 233 277
As of December 31, 2003, the balance of the reserves for exit costs related to business acquisitions consummated during 2001 through 2003 totaled$6 million. Reserves recorded in connection with businesses acquired during the year ended December 31, 2003 were $4 million. The following table presents theactivity in these acquisition reserve accounts, which are included within "Accounts payable and accruals" and "Other non-current liabilities" in the consolidatedbalance sheet.
Type of cost
BalanceDecember 31, 2002
2003Utilization
2003Additions
Othermovements
BalanceDecember 31, 2003
Severance and other employee-related costs 8 (6) 4 (5) 1Lease cancellation and idle facility costs 11 (2) — (5) 4Other exit costs 4 (1) — (2) 1 Total 23 (9) 4 (12) 6
103
The following highlights certain acquisitions, none of which was significant individually nor in the aggregate:
Date
Company
Acquiring market group
Description
December 2003 Quickfinder Legal & Regulatory A provider of tax reference materials and knowledgeJuly 2003 TaxRelief Legal & Regulatory A provider of integrated tax compliance and ccounting
software productsJuly 2003 Gage Learning A provider of educational materials to Canadian marketMay 2003 Elite Legal & Regulatory A provider of integrated practice and financial
management applicationsDecember 2002 Delphion Scientific & Healthcare A provider of full-text patent research informationAugust 2002 Current Drugs Scientific & Healthcare A provider of competitor intelligence services to the
pharmaceutical industryAugust 2002 Lawtel Legal & Regulatory AU.K.-based online legal current awareness provider
The identifiable intangible assets acquired are summarized as follows:
Weighted-averageamortization period
(years)
2003
2002
2003
2002
Finite useful lives: Tradenames 14 12 14 13 Customer relationships 37 38 14 7 Databases and content 43 55 10 8
Other 11 2 8 9

105 107
Disposals
In 2003, Thomson received $288 million (2002—$51 million) cash consideration from the disposals of businesses and investments which did not qualify asdiscontinued operations within the following segments:
2003
2002
Legal & Regulatory 4 2Learning — 19Financial 5 1Scientific & Healthcare — 7Corporate and other 279 22 288 51
The disposal within Corporate and other in 2003 is the sale of the Company's 20% interest in BGM. See Note 24.
104
Note 21: Cumulative Translation Adjustment
An analysis of the cumulative translation adjustment shown separately in shareholders' equity in the consolidated balance sheet is as follows:
2003
2002
Balance at beginning of year (64) (231)Realized from disposal of investment 14 — Net translation gains 309 167 Balance at end of year 259 (64)
Note 22: Stock-based Compensation
Stock Appreciation Rights Plan
Thomson has a Stock Appreciation Rights ("SAR") plan that provides for the granting of SARs to officers and key employees. The SAR provides the holderwith the opportunity to earn a cash award equal to the fair market value of the Company's common stock less the price at which the SAR was issued.Compensation expense is measured based on the market price of Thomson common stock at the end of the reporting period. The SARs outstanding under the planhave been granted at the closing price of the Company's common stock on the day prior to the date of grant, vest over a four to eight-year period, and expire fiveto eleven years after the grant date. The compensation expense is recognized over the applicable period. At December 31, 2003, the authorized number of SARswas 20,500,000 and there were 3,298,419 units available for grant. Thomson recognized an expense of $7 million related to the SAR plan for the year endedDecember 31, 2003 (2002—$9 million benefit) in the consolidated statement of earnings and retained earnings as a result of the increase (2002—decrease) in theCompany's share price as compared to the prior year-end.
A summary of the status of the Thomson SAR plan as of December 31, 2003 and 2002, and changes during the years ended on those dates, is as follows:
2003
2002
SARs
Canadian $weighted-average
exercise price
SARs
Canadian $weighted-average
exercise price
Outstanding at beginning of year 3,132,281 34.46 3,424,744 33.11Granted 192,032 44.32 165,768 40.69Exercised (415,798) 23.44 (361,229) 26.09Forfeited (297,347) 38.31 (97,002) 28.56 Outstanding at end of year 2,611,168 36.51 3,132,281 34.46 Exercisable at end of year 2,085,323 34.46 2,091,365 31.86
The following table summarizes information on SARs outstanding at December 31, 2003:
SARs outstanding
SARs exercisableCanadian $range ofexercise prices
Number Weighted-average Canadian $ Number Canadian $

outstanding at12/31/03
remainingcontractual life
weighted-averageexercise price
exercisable at12/31/03
weighted-averageexercise price
16.00 - 17.25 6,500 0.9 16.96 6,500 16.9621.77 - 32.125 592,088 2.8 23.23 589,588 23.2035.00 - 44.50 1,712,300 5.5 38.48 1,310,741 37.1348.40 - 57.45 300,280 7.6 51.84 178,494 52.72
105
Stock Incentive Plan
On January 24, 2000, the Board of Directors approved the adoption of a stock incentive plan, which authorizes the Company to grant officers and keyemployees stock options. Under the plan, the exercise price equals the closing market price of the Company's stock on the day prior to the date of the grant andthe maximum term of an option is 10 years. In general, grants vest 25% per year from the date of issuance. Under the plan options may be granted in eitherCanadian dollars or U.S. dollars. As of December 31, 2003 there were 8,304,840 shares available for grant (2002—10,214,585).
A summary of the status of the options granted and exercised in Canadian dollars as of December 31, 2003 and 2002, and changes during the years ended onthose dates, is as follows:
2003
2002
Options
Canadian $weighted-average
exercise price
Options
Canadian $weighted-average
exercise price
Outstanding at beginning of year 7,085,813 49.50 7,127,813 49.56Granted 11,500 44.37 84,000 42.56Exercised (53,000) 41.00 (22,800) 41.00Forfeited (767,223) 50.62 (103,200) 50.15 Outstanding at end of year 6,277,090 49.43 7,085,813 49.50 Exercisable at end of year 3,734,394 50.22 2,561,339 50.56
The following table summarizes information on Canadian dollar stock options outstanding at December 31, 2003:
Options outstanding
Options exercisable
Canadian $range ofexercise prices
Numberoutstanding at
12/31/03
Weighted-averageremaining
contractual life
Canadian $weighted-average
exercise price
Numberexercisable at
12/31/03
Canadian $weighted-average
exercise price
40.69 - 44.40 1,564,800 6.2 41.03 889,000 41.0145.90 - 48.70 2,584,080 7.9 48.37 1,287,035 48.3750.25 - 57.45 2,128,210 7.0 56.88 1,558,359 57.00
A summary of the status of the stock incentive plan granted and exercised in U.S. dollars as of December 31, 2003, and changes during the year endedDecember 31, 2003, is as follows:
2003
2002
Options
U.S. $weighted-average
exercise price
Options
U.S. $weighted-average
exercise price
Outstanding at beginning of year 2,576,802 26.30 — —Granted 2,689,968 33.42 2,576,802 26.30Exercised (1,875) 26.06 — —Forfeited (24,500) 26.06 — — Outstanding at end of year 5,240,395 29.96 2,576,802 26.30 Exercisable at end of year 636,200 26.30 — —
106
The following table summarizes information on U.S. dollar stock options outstanding at December 31, 2003:
Options outstanding
Options exercisable
U.S. $range of
exercise prices
Numberoutstanding at
12/31/03
Weighted-averageremaining
contractual life
U.S. $weighted-average
exercise price
Numberexercisable at
12/31/03
U.S. $weighted-average
exercise price
26.06 - 29.70 2,470,427 9.0 26.12 606,200 26.08
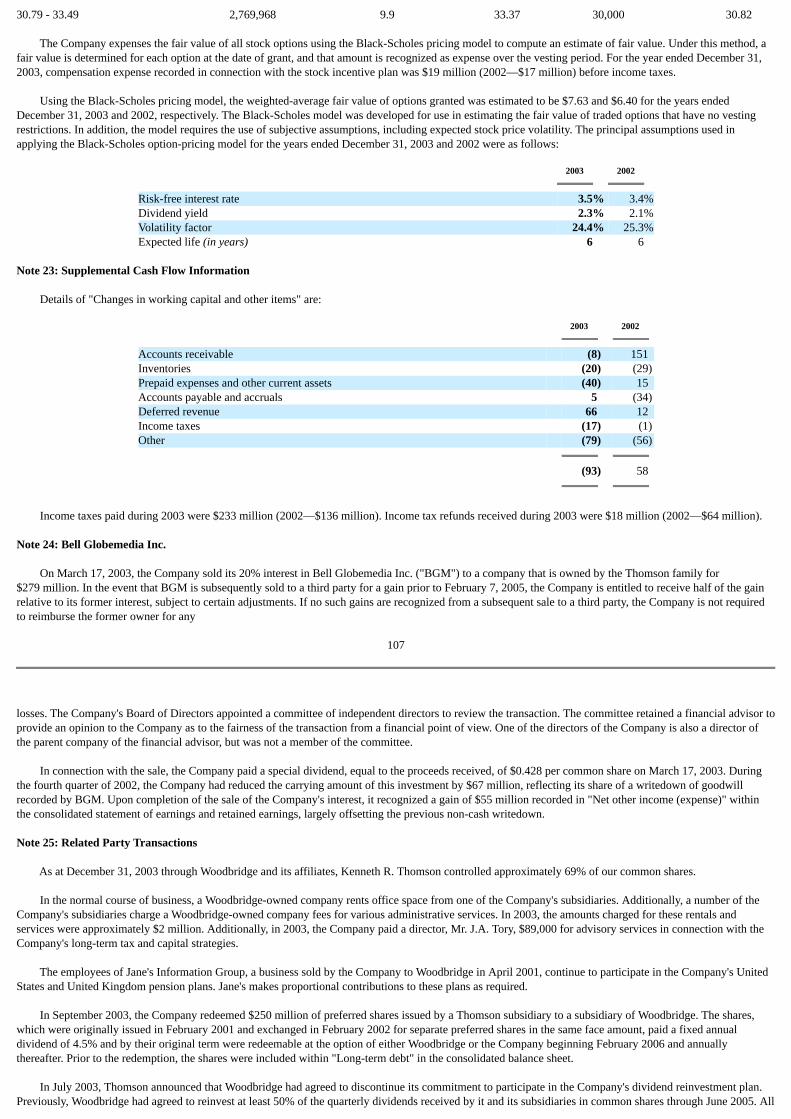
30.79 - 33.49 2,769,968 9.9 33.37 30,000 30.82
The Company expenses the fair value of all stock options using the Black-Scholes pricing model to compute an estimate of fair value. Under this method, afair value is determined for each option at the date of grant, and that amount is recognized as expense over the vesting period. For the year ended December 31,2003, compensation expense recorded in connection with the stock incentive plan was $19 million (2002—$17 million) before income taxes.
Using the Black-Scholes pricing model, the weighted-average fair value of options granted was estimated to be $7.63 and $6.40 for the years endedDecember 31, 2003 and 2002, respectively. The Black-Scholes model was developed for use in estimating the fair value of traded options that have no vestingrestrictions. In addition, the model requires the use of subjective assumptions, including expected stock price volatility. The principal assumptions used inapplying the Black-Scholes option-pricing model for the years ended December 31, 2003 and 2002 were as follows:
2003
2002
Risk-free interest rate 3.5% 3.4%Dividend yield 2.3% 2.1%Volatility factor 24.4% 25.3%Expected life (in years) 6 6
Note 23: Supplemental Cash Flow Information
Details of "Changes in working capital and other items" are:
2003
2002
Accounts receivable (8) 151 Inventories (20) (29)Prepaid expenses and other current assets (40) 15 Accounts payable and accruals 5 (34)Deferred revenue 66 12 Income taxes (17) (1)Other (79) (56) (93) 58
Income taxes paid during 2003 were $233 million (2002—$136 million). Income tax refunds received during 2003 were $18 million (2002—$64 million).
Note 24: Bell Globemedia Inc.
On March 17, 2003, the Company sold its 20% interest in Bell Globemedia Inc. ("BGM") to a company that is owned by the Thomson family for$279 million. In the event that BGM is subsequently sold to a third party for a gain prior to February 7, 2005, the Company is entitled to receive half of the gainrelative to its former interest, subject to certain adjustments. If no such gains are recognized from a subsequent sale to a third party, the Company is not requiredto reimburse the former owner for any
107
losses. The Company's Board of Directors appointed a committee of independent directors to review the transaction. The committee retained a financial advisor toprovide an opinion to the Company as to the fairness of the transaction from a financial point of view. One of the directors of the Company is also a director ofthe parent company of the financial advisor, but was not a member of the committee.
In connection with the sale, the Company paid a special dividend, equal to the proceeds received, of $0.428 per common share on March 17, 2003. Duringthe fourth quarter of 2002, the Company had reduced the carrying amount of this investment by $67 million, reflecting its share of a writedown of goodwillrecorded by BGM. Upon completion of the sale of the Company's interest, it recognized a gain of $55 million recorded in "Net other income (expense)" withinthe consolidated statement of earnings and retained earnings, largely offsetting the previous non-cash writedown.
Note 25: Related Party Transactions
As at December 31, 2003 through Woodbridge and its affiliates, Kenneth R. Thomson controlled approximately 69% of our common shares.
In the normal course of business, a Woodbridge-owned company rents office space from one of the Company's subsidiaries. Additionally, a number of theCompany's subsidiaries charge a Woodbridge-owned company fees for various administrative services. In 2003, the amounts charged for these rentals andservices were approximately $2 million. Additionally, in 2003, the Company paid a director, Mr. J.A. Tory, $89,000 for advisory services in connection with theCompany's long-term tax and capital strategies.
The employees of Jane's Information Group, a business sold by the Company to Woodbridge in April 2001, continue to participate in the Company's UnitedStates and United Kingdom pension plans. Jane's makes proportional contributions to these plans as required.
In September 2003, the Company redeemed $250 million of preferred shares issued by a Thomson subsidiary to a subsidiary of Woodbridge. The shares,which were originally issued in February 2001 and exchanged in February 2002 for separate preferred shares in the same face amount, paid a fixed annualdividend of 4.5% and by their original term were redeemable at the option of either Woodbridge or the Company beginning February 2006 and annuallythereafter. Prior to the redemption, the shares were included within "Long-term debt" in the consolidated balance sheet.
In July 2003, Thomson announced that Woodbridge had agreed to discontinue its commitment to participate in the Company's dividend reinvestment plan.Previously, Woodbridge had agreed to reinvest at least 50% of the quarterly dividends received by it and its subsidiaries in common shares through June 2005. All

eligible Thomson shareholders, including Woodbridge, retain the ability to reinvest their dividends in Thomson stock on a voluntary basis under the DRIP.
In March 2003, the Company sold its 20% interest in BGM to a company that is owned by the Thomson family for $279 million. See Note 24.
In September 2002, the Company sold a parcel of properties located in Toronto, Ontario to Woodbridge for $15 million. In connection with this transaction,the Company received a report from a financial advisor providing an assessment of market values of those properties. The transaction was recorded based uponthe $15 million exchanged in the transaction, and the proceeds were recorded in "Proceeds from disposals of businesses and investments" while the resulting gainof $2 million was included in "Net other income (expense)" within the consolidated financial statements. If Woodbridge sells any of the properties for a gain priorto September 30, 2005, Thomson is entitled to receive half of the gain subject to certain adjustments. If Woodbridge does not recognize any such gains, theCompany is not required to reimburse Woodbridge for any losses. In prior periods, the Company had maintained a liability of $8 million for certain of the above-noted properties that were to be contributed to BGM. During 2002, the Company negotiated an agreement with BGM under which the
108
Company paid cash to BGM equivalent to the recorded liability, in order to relieve the Company of its obligation to contribute these properties. The propertieswere then included within the parcel of properties sold to Woodbridge.
In September 2002, the Company entered into an agreement with Woodbridge to reduce the cost of the Company's directors' and officers' insurancecoverage. Under the terms of the agreement, the Company maintains standard directors' and officers' insurance for any amount up to $15 million with a third-party insurance company. A separate third-party insurer is responsible for the next $75 million of coverage. Woodbridge indemnifies this second insurer. For itsagreement to indemnify the insurer, the Company pays Woodbridge an annual premium of $685,000, which is less than the premium that the Company wouldhave paid to a third party.
In June 2002, the Company completed a series of transactions to assist Woodbridge in reorganizing its holding of the Company's common shares to achievecertain Canadian tax objectives. Similar transactions were completed at the same time with certain companies affiliated with Woodbridge and a companycontrolled by one of the Company's directors. The Company issued an aggregate of 431,503,802 common shares to members of this group of companies, and awholly-owned subsidiary of the Company acquired the same number of common shares from members of this group of companies. Immediately following theacquisition, the wholly-owned subsidiary was wound up into the Company and the 431,503,802 common shares it held were cancelled. The total number of theCompany's common shares outstanding, as well as the Company's stated capital, was the same before and after this series of transactions. Woodbridge and theother companies have reimbursed the Company for all costs and expenses arising from, and have agreed to indemnify the Company (and the officers, directorsand shareholders of the Company and its subsidiaries) against any liabilities that may arise in connection with the series of transactions. These transactions had noeconomic effect, did not cause any change to the Company's common shares or result in any other consequence to the Company or to the Company's othershareholders.
In June 2002, one of the Company's wholly-owned U.K. subsidiaries, The Thomson Corporation PLC, redeemed its outstanding Series A ordinary shares for$0.6 million. The Series A ordinary shares were held by Woodbridge.
Note 26: Segment Information
Thomson is a global provider of integrated information solutions for business and professional customers. Thomson operates in four reportable marketsegments worldwide. The reportable segments of Thomson are strategic business groups that offer products and services to target markets. The accountingpolicies applied by the segments are the same as those applied by the Company. The Company's four reportable segments are:
Legal & Regulatory
Providing integrated information solutions to legal, tax, accounting, intellectual property, compliance and other business professionals, as well asgovernment agencies.
Learning
Providing tailored learning solutions to colleges, universities, professors, students, libraries, reference centers, government agencies, corporations andprofessionals.
Financial
Providing financial products and information solutions to the global financial services industry, including brokers, financial planners and corporateexecutives.
109
Scientific & Healthcare
Providing information and services to researchers, physicians and other professionals in the healthcare, academic, scientific, corporate and governmentmarketplaces.
Business Segments—2003
(millions of U.S. dollars)
Revenues
AdjustedEBITDA
Adjustedoperating profit
Additions tocapital assets(1)
Total assets
Legal & Regulatory 3,144 981 800 370 7,412

Learning 2,052 520 337 242 5,108Financial 1,528 406 231 154 2,914Scientific & Healthcare 760 217 186 26 994Corporate and other(2) 164 (60) (78) 15 1,988Eliminations (42) — — — — Continuing operations 7,606 2,064 1,476 807 18,416Discontinued operations 264 Total 18,680
Business Segments—2002
(millions of U.S. dollars)
Revenues
AdjustedEBITDA
Adjustedoperating profit
Additions tocapital assets(1)
Total assets
Legal & Regulatory 2,962 928 769 238 7,195Learning(3) 2,036 465 302 226 5,068Financial(4) 1,624 414 244 129 3,022Scientific & Healthcare 696 189 162 221 985Corporate and other(2)(5) 168 (35) (51) 8 1,902Eliminations (42) — — — — Continuing operations 7,444 1,961 1,426 822 18,172Discontinued operations 376 Total 18,548
110
Geographic Segments—2003
(by country of origin)(millions of U.S. dollars)
Revenues
Capital assets(1)
Totalassets
United States 6,131 11,510 14,827Europe 1,093 2,128 2,986Asia-Pacific 291 198 356Canada 201 204 313Other countries 69 121 198Eliminations (179) — — Total 7,606 14,161 18,680
Geographic Segments—2002
(by country of origin)(millions of U.S. dollars)
Revenues
Capital assets(1)
Totalassets
United States 6,092 11,624 14,858Europe 1,017 1,988 2,812Asia-Pacific 255 163 287Canada 165 140 417Other countries 77 107 174Eliminations (162) — — Total 7,444 14,022 18,548
(1) Capital assets include property and equipment, identifiable intangible assets and goodwill.
(2) Corporate and other includes the results of Thomson Media, a non-reportable segment, as well as corporate costs and costs associated with theCompany's stock appreciation rights. Thomson Media's results for the years ended December 31, 2003 and 2002 are as follows:
Year endedDecember 31
(in millions of U.S. dollars)
2003
2002
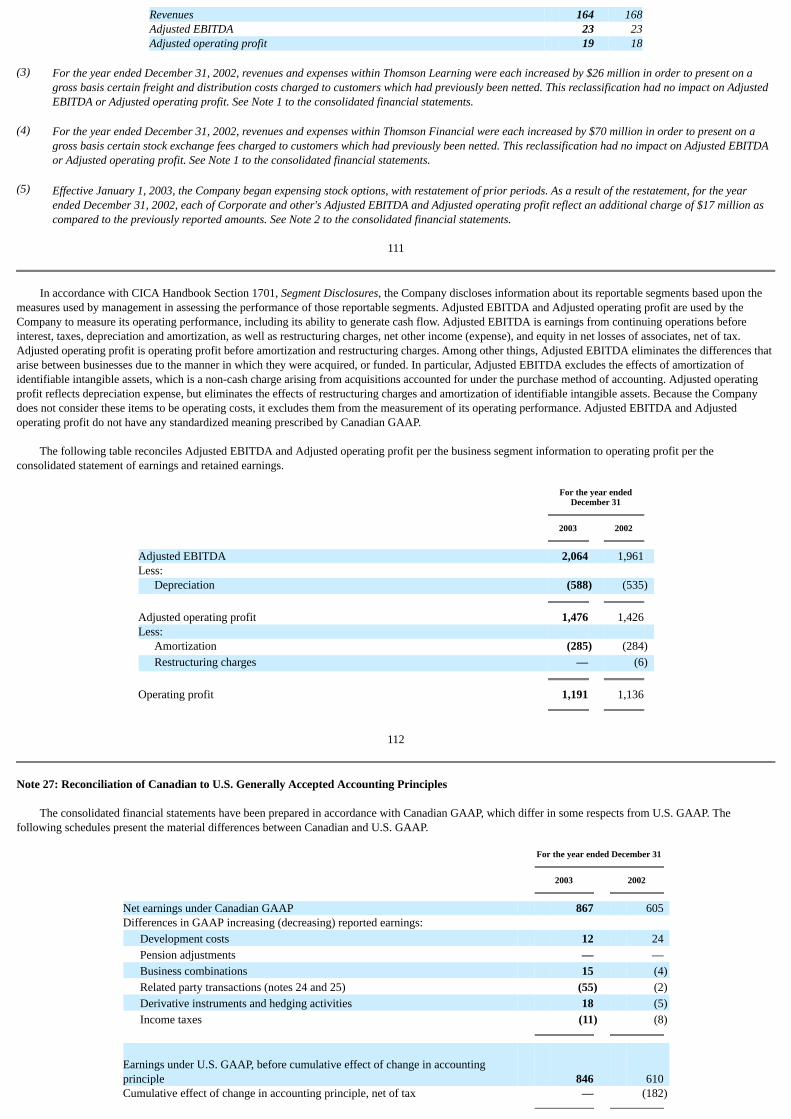
Revenues 164 168Adjusted EBITDA 23 23Adjusted operating profit 19 18
(3) For the year ended December 31, 2002, revenues and expenses within Thomson Learning were each increased by $26 million in order to present on agross basis certain freight and distribution costs charged to customers which had previously been netted. This reclassification had no impact on AdjustedEBITDA or Adjusted operating profit. See Note 1 to the consolidated financial statements.
(4) For the year ended December 31, 2002, revenues and expenses within Thomson Financial were each increased by $70 million in order to present on agross basis certain stock exchange fees charged to customers which had previously been netted. This reclassification had no impact on Adjusted EBITDAor Adjusted operating profit. See Note 1 to the consolidated financial statements.
(5) Effective January 1, 2003, the Company began expensing stock options, with restatement of prior periods. As a result of the restatement, for the yearended December 31, 2002, each of Corporate and other's Adjusted EBITDA and Adjusted operating profit reflect an additional charge of $17 million ascompared to the previously reported amounts. See Note 2 to the consolidated financial statements.
111
In accordance with CICA Handbook Section 1701, Segment Disclosures, the Company discloses information about its reportable segments based upon themeasures used by management in assessing the performance of those reportable segments. Adjusted EBITDA and Adjusted operating profit are used by theCompany to measure its operating performance, including its ability to generate cash flow. Adjusted EBITDA is earnings from continuing operations beforeinterest, taxes, depreciation and amortization, as well as restructuring charges, net other income (expense), and equity in net losses of associates, net of tax.Adjusted operating profit is operating profit before amortization and restructuring charges. Among other things, Adjusted EBITDA eliminates the differences thatarise between businesses due to the manner in which they were acquired, or funded. In particular, Adjusted EBITDA excludes the effects of amortization ofidentifiable intangible assets, which is a non-cash charge arising from acquisitions accounted for under the purchase method of accounting. Adjusted operatingprofit reflects depreciation expense, but eliminates the effects of restructuring charges and amortization of identifiable intangible assets. Because the Companydoes not consider these items to be operating costs, it excludes them from the measurement of its operating performance. Adjusted EBITDA and Adjustedoperating profit do not have any standardized meaning prescribed by Canadian GAAP.
The following table reconciles Adjusted EBITDA and Adjusted operating profit per the business segment information to operating profit per theconsolidated statement of earnings and retained earnings.
For the year endedDecember 31
2003
2002
Adjusted EBITDA 2,064 1,961 Less: Depreciation (588) (535) Adjusted operating profit 1,476 1,426 Less: Amortization (285) (284) Restructuring charges — (6) Operating profit 1,191 1,136
112
Note 27: Reconciliation of Canadian to U.S. Generally Accepted Accounting Principles
The consolidated financial statements have been prepared in accordance with Canadian GAAP, which differ in some respects from U.S. GAAP. Thefollowing schedules present the material differences between Canadian and U.S. GAAP.
For the year ended December 31
2003
2002
Net earnings under Canadian GAAP 867 605 Differences in GAAP increasing (decreasing) reported earnings: Development costs 12 24 Pension adjustments — — Business combinations 15 (4) Related party transactions (notes 24 and 25) (55) (2) Derivative instruments and hedging activities 18 (5) Income taxes (11) (8)
Earnings under U.S. GAAP, before cumulative effect of change in accountingprinciple 846 610 Cumulative effect of change in accounting principle, net of tax — (182)

Net income under U.S. GAAP 846 428 Other comprehensive income: Foreign currency translation 319 167
Minimum pension liability (net of taxes in 2003—$2 million and 2002—$3 million) (13) (28)
Net unrealized gains (losses) on cash flow hedges (net of taxes in 2003 and2002—$0 million) 52 (72)
Other comprehensive income 358 67 Comprehensive income 1,204 495 Earnings under U.S. GAAP from continuing operations, before cumulative effect ofchange in accounting principle 819 552 Cumulative effect of change in accounting principle, net of tax — (182)Earnings under U.S. GAAP from discontinued operations 27 58 Net income under U.S. GAAP 846 428
Basic and diluted earnings (loss) per common share, under U.S. GAAP, from:
Continuing operations, before cumulative effect of change in accountingprinciple, net of tax $ 1.27 $ 0.83
Cumulative effect of change in accounting principle, net of tax — (0.28) Discontinued operations, net of tax 0.04 0.09 Basic and diluted earnings per common share(1) $ 1.31 $ 0.64
(1) Earnings per common share is calculated after taking into account dividends declared on preference shares and the gain recognized in connection withthe redemption of the Series V preference shares.
113
As at December 31
2003
2002
Shareholders' equity as reported under Canadian GAAP 9,200 8,966 Differences in GAAP increasing (decreasing) reported shareholders' equity: Development costs — (12) Business combinations (647) (658) Minimum pension liability (53) (38) Derivative instruments and hedging activities (33) (103) Income taxes 171 180 Shareholders' equity under U.S. GAAP 8,638 8,335
Descriptions of the nature of the reconciling differences are provided below:
Development Costs
Under Canadian GAAP, certain costs classified as development are deferred and amortized over their estimated useful lives. Under U.S. GAAP, alldevelopment costs are expensed as incurred.
Business Combinations
Prior to January 1, 2001, various differences existed between Canadian and U.S. GAAP for the accounting for business combinations, including theestablishment of acquisition-related liabilities. The $15 million increase to income ($4 million decrease—2002) primarily relates to (i) costs that are required tobe recorded as operating expenses under U.S. GAAP which, prior to January 1, 2001 were capitalized under Canadian GAAP; (ii) overall decreased amortizationcharges due to basis differences; and (iii) differences in gain or loss calculations on business disposals resulting from the above factors.
The $647 million decrease in Shareholders' equity as of December 31, 2003 ($658 million—December 31, 2002) primarily relates to basis differences inintangible assets and goodwill due to the factors discussed above, as well as a gain of $54 million recorded for U.S. GAAP resulting from a 1997 disposalmandated by the U.S. Department of Justice, which was required to be recorded as a reduction of goodwill under Canadian GAAP. On a U.S. GAAP basis,goodwill was $7,856 million at December 31, 2003 (2002—$7,605 million). On the same basis, identifiable intangible assets, net of accumulated amortization,were $4,113 million at December 31, 2003 (2002—$4,213 million).
Related Party Transactions

During the years ended December 31, 2003 and 2002, in accordance with Canadian GAAP, the Company recognized gains on transactions with entitiesassociated with its controlling shareholder in its net earnings. Under U.S. GAAP, such related party gains are not recognizable in net earnings, but must bereflected as equity transactions. In 2003, the related party transaction was the sale of the Company's 20% interest in BGM to a company that is owned by theThomson family which resulted in a gain of $55 million.
Derivative Instruments and Hedging Activities
Under Canadian GAAP, the fair values of derivative instruments are disclosed in the notes to the consolidated financial statements as at and for the yearended December 31, 2003, but not recorded in the consolidated balance sheet. Under U.S. Statement of Financial Accounting Standards ("SFAS") No. 133,Accounting for Derivative Instruments and Hedging Activities as amended by SFAS 138, Accounting for Certain Derivative Instruments and Certain HedgingActivities, all derivative instruments
114
are recognized in the balance sheet at their fair values, and changes in fair value are recognized either immediately in earnings or, if the transaction qualifies forhedge accounting, when the transaction being hedged affects earnings. Accordingly, under U.S. GAAP as at December 31, 2003, prepaid expenses and othercurrent assets were $6 million higher (2002—unchanged), accounts payable and accruals were unchanged (2002—$4 million higher), current portion of long-term debt was unchanged (2002—$6 million higher), long-term debt was $37 million higher (2002—$31 million higher) and other non-current liabilities were$2 million higher (2002—$62 million higher) as compared to Canadian GAAP.
Income Taxes
The income tax adjustment for each period is comprised of the tax effect of the U.S. GAAP reconciling items. The adjustment to shareholders' equity relatesentirely to deferred tax liabilities.
Employee Future Benefits
PENSION ADJUSTMENT
In accordance with Canadian GAAP, prior to 2002, the Company recorded a pension valuation allowance for plans that had an excess of the adjusted benefitasset over the expected future benefits, and recognized changes in the pension valuation allowance in earnings. As U.S. GAAP did not specifically addresspension valuation allowances, this was not treated as a difference between Canadian and U.S. GAAP in prior periods. Due to a clarification of accountingguidance on this matter in 2002, changes in the valuation allowance must be treated as a GAAP difference. In order to reconcile earnings under Canadian GAAPto earnings under U.S. GAAP in 2002, earnings under Canadian GAAP were reduced by $22 million, representing the after-tax effect of the change in thevaluation allowance. This difference was offset by the elimination of the valuation allowance for U.S. GAAP purposes, which increased earnings by $22 million.
MINIMUM PENSION LIABILITY
Certain of the Company's defined benefit pension plans have accumulated benefit obligations in excess of the fair market value of assets available to fundsuch obligations as of the annual measurement date for those plans. With respect to those plans, U.S. accounting standards require the recognition of an"additional minimum liability" of $53 million (2002—$38 million), with a corresponding reduction in shareholders' equity. If, at a subsequent date, the fairmarket value of the pension assets exceeds the accumulated benefit obligations, the equity adjustment would be reversed. This adjustment has no impact onincome or cash flow. Because the concept of an additional minimum liability does not exist in Canadian GAAP, the liability and the reduction in equity resulted ina reconciling item.
The accumulated benefit obligation of funded pension plans that had accumulated benefit obligations that exceeded plan assets at December 31, 2003 was$150 million (2002—$125 million). These plans had related fair values of plan assets of $113 million (2002—$92 million).
Comprehensive Income
SFAS No. 130, Reporting Comprehensive Income, requires companies to disclose comprehensive income, which includes, in addition to net income, othercomprehensive income consisting primarily of unrealized gains and losses which bypass the traditional income statement and are recorded directly intoshareholders' equity on a U.S. GAAP basis. In 2003 and 2002, the components of other comprehensive income consist of unrealized gains and losses relating tothe translation of foreign currency financial statements, minimum pension liabilities, hedging activity and certain investment
115
securities. Accumulated other comprehensive income as at December 31, 2003 was a gain of $194 million (2002—loss of $164 million).
Change in Accounting Principle
The cumulative effect of change in accounting principle represents the transitional impairment charge relating to adopting the U.S. GAAP equivalent ofCICA 3062, SFAS 142, Goodwill and Other Intangible Assets. Under U.S. GAAP, this charge is required to be recorded net of tax as a cumulative effect of achange in accounting principle, which is a component of net income, as compared with a charge to opening retained earnings under Canadian GAAP. See Note 7.
Note 28: Subsequent Events
In January 2004, the Company acquired the publishing assets of Biological Abstracts, Inc. and BIOSIS. BIOSIS offers both custom and standard informationresources designed to fit the information needs of researchers, students and information professionals worldwide. BIOSIS is now part of Thomson Scientific &Healthcare.
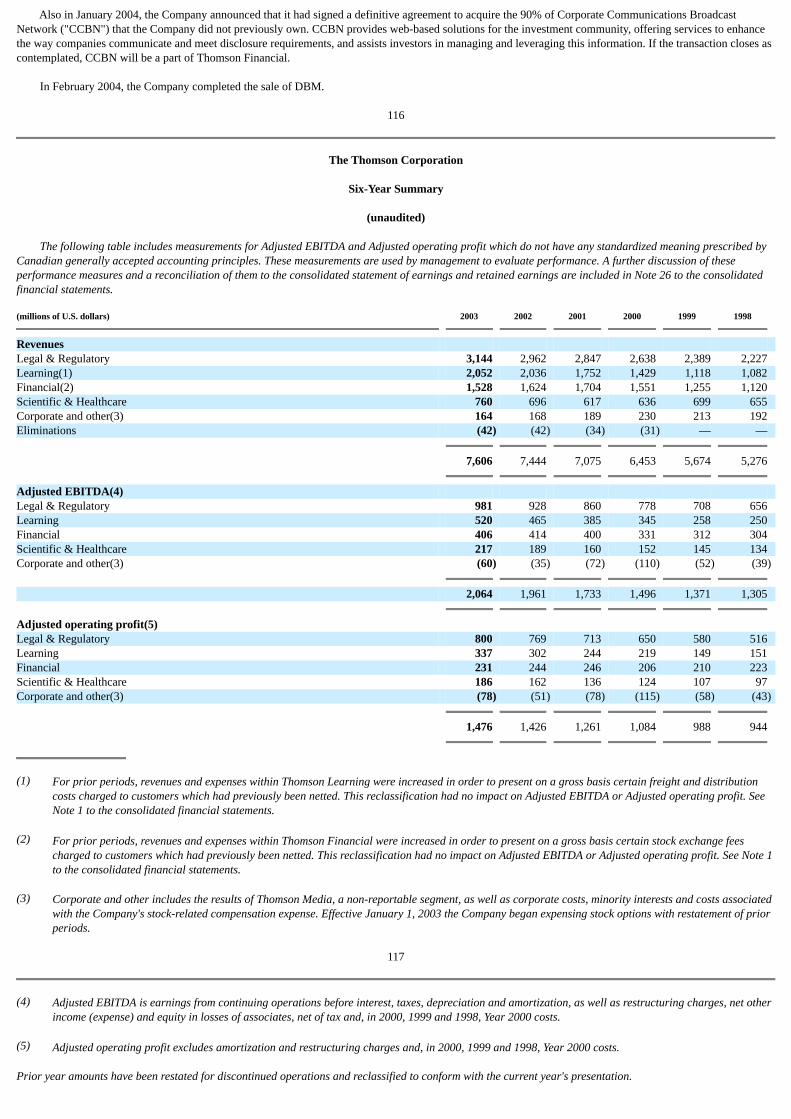
Also in January 2004, the Company announced that it had signed a definitive agreement to acquire the 90% of Corporate Communications BroadcastNetwork ("CCBN") that the Company did not previously own. CCBN provides web-based solutions for the investment community, offering services to enhancethe way companies communicate and meet disclosure requirements, and assists investors in managing and leveraging this information. If the transaction closes ascontemplated, CCBN will be a part of Thomson Financial.
In February 2004, the Company completed the sale of DBM.
116
The Thomson Corporation
Six-Year Summary
(unaudited)
The following table includes measurements for Adjusted EBITDA and Adjusted operating profit which do not have any standardized meaning prescribed byCanadian generally accepted accounting principles. These measurements are used by management to evaluate performance. A further discussion of theseperformance measures and a reconciliation of them to the consolidated statement of earnings and retained earnings are included in Note 26 to the consolidatedfinancial statements.
(millions of U.S. dollars)
2003
2002
2001
2000
1999
1998
Revenues Legal & Regulatory 3,144 2,962 2,847 2,638 2,389 2,227 Learning(1) 2,052 2,036 1,752 1,429 1,118 1,082 Financial(2) 1,528 1,624 1,704 1,551 1,255 1,120 Scientific & Healthcare 760 696 617 636 699 655 Corporate and other(3) 164 168 189 230 213 192 Eliminations (42) (42) (34) (31) — — 7,606 7,444 7,075 6,453 5,674 5,276 Adjusted EBITDA(4) Legal & Regulatory 981 928 860 778 708 656 Learning 520 465 385 345 258 250 Financial 406 414 400 331 312 304 Scientific & Healthcare 217 189 160 152 145 134 Corporate and other(3) (60) (35) (72) (110) (52) (39) 2,064 1,961 1,733 1,496 1,371 1,305 Adjusted operating profit(5) Legal & Regulatory 800 769 713 650 580 516 Learning 337 302 244 219 149 151 Financial 231 244 246 206 210 223 Scientific & Healthcare 186 162 136 124 107 97 Corporate and other(3) (78) (51) (78) (115) (58) (43) 1,476 1,426 1,261 1,084 988 944
(1) For prior periods, revenues and expenses within Thomson Learning were increased in order to present on a gross basis certain freight and distributioncosts charged to customers which had previously been netted. This reclassification had no impact on Adjusted EBITDA or Adjusted operating profit. SeeNote 1 to the consolidated financial statements.
(2) For prior periods, revenues and expenses within Thomson Financial were increased in order to present on a gross basis certain stock exchange feescharged to customers which had previously been netted. This reclassification had no impact on Adjusted EBITDA or Adjusted operating profit. See Note 1to the consolidated financial statements.
(3) Corporate and other includes the results of Thomson Media, a non-reportable segment, as well as corporate costs, minority interests and costs associatedwith the Company's stock-related compensation expense. Effective January 1, 2003 the Company began expensing stock options with restatement of priorperiods.
117
(4) Adjusted EBITDA is earnings from continuing operations before interest, taxes, depreciation and amortization, as well as restructuring charges, net otherincome (expense) and equity in losses of associates, net of tax and, in 2000, 1999 and 1998, Year 2000 costs.
(5) Adjusted operating profit excludes amortization and restructuring charges and, in 2000, 1999 and 1998, Year 2000 costs.
Prior year amounts have been restated for discontinued operations and reclassified to conform with the current year's presentation.
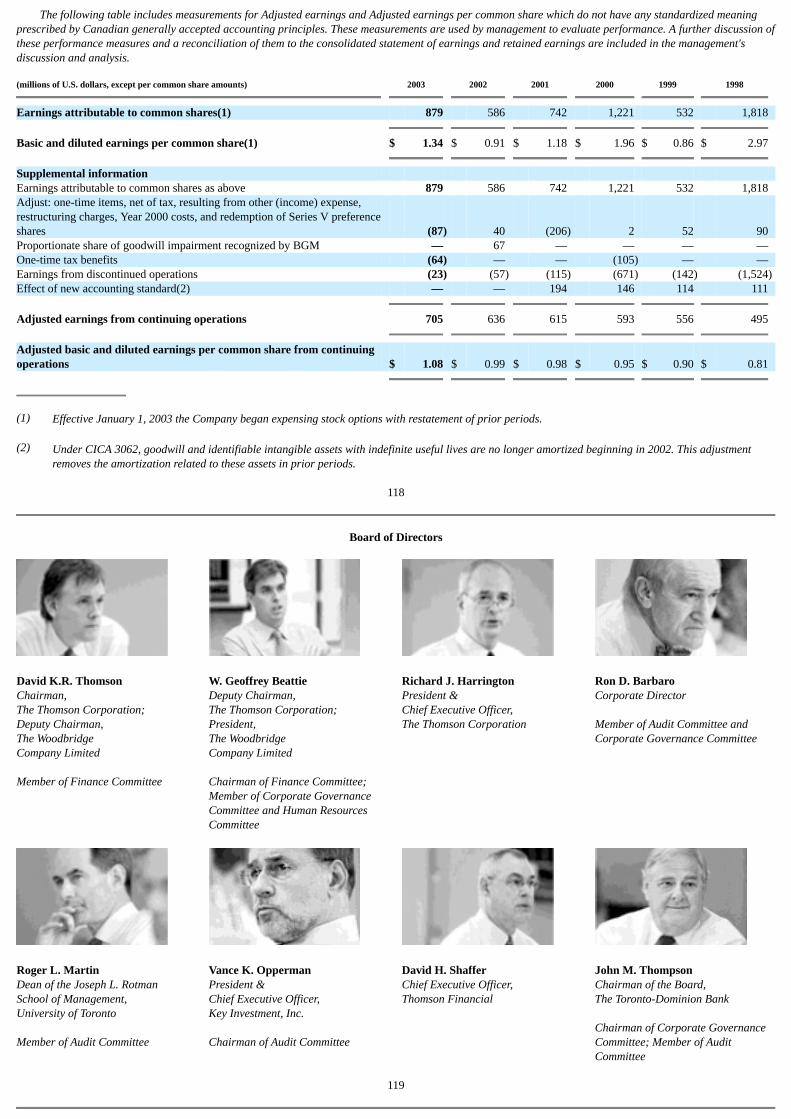
The following table includes measurements for Adjusted earnings and Adjusted earnings per common share which do not have any standardized meaningprescribed by Canadian generally accepted accounting principles. These measurements are used by management to evaluate performance. A further discussion ofthese performance measures and a reconciliation of them to the consolidated statement of earnings and retained earnings are included in the management'sdiscussion and analysis.
(millions of U.S. dollars, except per common share amounts)
2003
2002
2001
2000
1999
1998
Earnings attributable to common shares(1) 879 586 742 1,221 532 1,818 Basic and diluted earnings per common share(1) $ 1.34 $ 0.91 $ 1.18 $ 1.96 $ 0.86 $ 2.97 Supplemental information Earnings attributable to common shares as above 879 586 742 1,221 532 1,818 Adjust: one-time items, net of tax, resulting from other (income) expense,restructuring charges, Year 2000 costs, and redemption of Series V preferenceshares (87) 40 (206) 2 52 90 Proportionate share of goodwill impairment recognized by BGM — 67 — — — — One-time tax benefits (64) — — (105) — — Earnings from discontinued operations (23) (57) (115) (671) (142) (1,524)Effect of new accounting standard(2) — — 194 146 114 111 Adjusted earnings from continuing operations 705 636 615 593 556 495 Adjusted basic and diluted earnings per common share from continuingoperations $ 1.08 $ 0.99 $ 0.98 $ 0.95 $ 0.90 $ 0.81
(1) Effective January 1, 2003 the Company began expensing stock options with restatement of prior periods.
(2) Under CICA 3062, goodwill and identifiable intangible assets with indefinite useful lives are no longer amortized beginning in 2002. This adjustmentremoves the amortization related to these assets in prior periods.
118
Board of Directors
David K.R. ThomsonChairman,The Thomson Corporation;Deputy Chairman,The WoodbridgeCompany Limited Member of Finance Committee
W. Geoffrey BeattieDeputy Chairman,The Thomson Corporation;President,The WoodbridgeCompany Limited Chairman of Finance Committee;Member of Corporate GovernanceCommittee and Human ResourcesCommittee
Richard J. HarringtonPresident &Chief Executive Officer,The Thomson Corporation
Ron D. BarbaroCorporate Director Member of Audit Committee andCorporate Governance Committee
Roger L. MartinDean of the Joseph L. RotmanSchool of Management,University of Toronto Member of Audit Committee
Vance K. OppermanPresident &Chief Executive Officer,Key Investment, Inc. Chairman of Audit Committee
David H. ShafferChief Executive Officer,Thomson Financial
John M. ThompsonChairman of the Board,The Toronto-Dominion Bank Chairman of Corporate GovernanceCommittee; Member of AuditCommittee
119
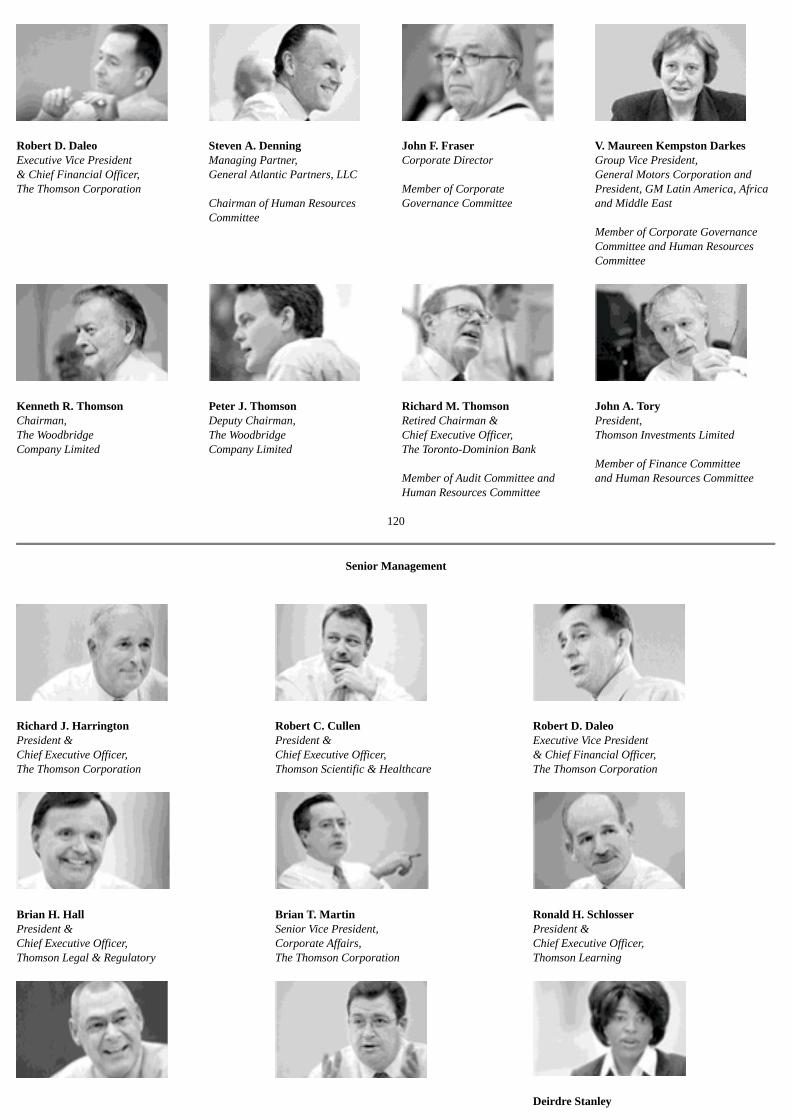
Robert D. DaleoExecutive Vice President& Chief Financial Officer,The Thomson Corporation
Steven A. DenningManaging Partner,General Atlantic Partners, LLC Chairman of Human ResourcesCommittee
John F. FraserCorporate Director Member of CorporateGovernance Committee
V. Maureen Kempston DarkesGroup Vice President,General Motors Corporation andPresident, GM Latin America, Africaand Middle East Member of Corporate GovernanceCommittee and Human ResourcesCommittee
Kenneth R. ThomsonChairman,The WoodbridgeCompany Limited
Peter J. ThomsonDeputy Chairman,The WoodbridgeCompany Limited
Richard M. ThomsonRetired Chairman &Chief Executive Officer,The Toronto-Dominion Bank Member of Audit Committee andHuman Resources Committee
John A. ToryPresident,Thomson Investments Limited Member of Finance Committeeand Human Resources Committee
120
Senior Management
Richard J. HarringtonPresident &Chief Executive Officer,The Thomson Corporation
Robert C. CullenPresident &Chief Executive Officer,Thomson Scientific & Healthcare
Robert D. DaleoExecutive Vice President& Chief Financial Officer,The Thomson Corporation
Brian H. HallPresident &Chief Executive Officer,Thomson Legal & Regulatory
Brian T. MartinSenior Vice President,Corporate Affairs,The Thomson Corporation
Ronald H. SchlosserPresident &Chief Executive Officer,Thomson Learning
Deirdre Stanley
David H. ShafferChief Executive Officer,Thomson Financial
James C. SmithExecutive Vice President,Human Resources & Administration,The Thomson Corporation
Senior Vice President &General Counsel,The Thomson Corporation
121
Corporate Information
Corporate Headquarters
Metro CenterOne Station PlaceStamford, Connecticut 06902United Statestel [email protected]
Stock Exchange Listings
Common shares (symbol: TOC):
• Toronto Stock Exchange (TSX)
• New York Stock Exchange (NYSE)
Series II preference shares (symbol: TOC.PR.B):
• Toronto Stock Exchange (TSX)
Capital Stock
Shares outstanding as of December 31, 2003:Common: 654,579,297Series II preference: 6,000,000
Controlling shareholder: Kenneth R. Thomson(approximately 69% of common shares)
Financial Calendar
Year end: December 31
Annual report: mailed April
Quarterly reports: mailed May/August/November to shareholders who elect to receive them by checking a box located on the annual meeting proxy card or byenrolling electronically with the registrar.
Common Share Dividends
At the discretion of the directors. Paid on March 15/June 15/September 15/December 15 or on the first business day thereafter. Declared in U.S. dollars but can bepaid in Canadian dollars or U.K. pounds sterling at the holder's option (see also Note 16, page 74). Further information is available from the registrar.
122
Dividend Reinvestment Plan
Thomson has a dividend reinvestment plan under which eligible common shareholders may elect to have cash dividends reinvested in common shares. Furtherinformation is available from the registrar.
Annual Meeting of Shareholders
Wednesday, May 5, 2004, 12:00 p.m. atRoy Thomson Hall60 Simcoe StreetToronto, Ontario, Canada
Transfer Agent and Registrar
Computershare Trust Company of Canada100 University Avenue, 9th FloorToronto, Ontario M5J 2Y1Canada

Auditors
PricewaterhouseCoopers LLPSuite 3000, Box 82Royal Trust TowerToronto-Dominion CentreToronto, Ontario M5K 1G8Canada
Corporate Governance
A statement of our policy with respect to corporate governance is included in the management information circular enclosed with the annual report mailed toshareholders. Our corporate governance guidelines, board committee charters, code of conduct and a summary of the significant ways in which our corporategovernance practices differ from those followed by U.S. domestic companies under NYSE listing standards, are available on our website.
Further Information
Please visit www.thomson.com for corporate and management news and more detailed information on individual Thomson businesses, products and services. Forinvestor relations inquiries, call 1.800.969.9974 or e-mail: [email protected].
123
Design: Aegis, TorontoPhotography: Christopher Wahl, Bill GalleryTypesetting, prepress: Moveable Inc., TorontoPrinted in Canada
To experience an interactive version of this annual report, go to www.thomson.com
The Thomson Corporation
Metro Center Suite 2706, Toronto Dominion Bank TowerOne Station Place P.O.Box 24, Toronto-Dominion CentreStamford, Connecticut 06902 Toronto, Ontario M5K 1A1United States Canadatel 203.539.8000 tel 416.360.8700
QuickLinks
Exhibit 99.1

QuickLinks -- Click here to rapidly navigate through this document
Exhibit 99.2
Notice of Annual Meeting of Shareholdersand Management Information Circular
May 5, 2004
The Thomson Corporation
Table of Contents
2 Notice of Annual Meeting of Shareholders
3 Management Information Circular
3 Voting Questions and Answers
7 Principal Shareholder
7 Business of the Meeting
14 Executive Compensation
20 Report on Executive Compensation
22 Compensation of Directors
23 Performance Graph
24 Indebtedness of Directors, Executive Officers and Senior Officers
24 Directors' and Officers' Insurance
25 Statement of Corporate Governance Practices
30 Additional Information
30 Directors' Approval
1
Notice of Annual Meeting of Shareholders of The Thomson Corporation
Date
Wednesday, May 5, 2004
Time
12:00 p.m. (EDT)
Place
Roy Thomson Hall, 60 Simcoe Street, Toronto, Ontario, Canada
Business
The business of the meeting is to:
• receive the consolidated financial statements of the company for the year ended December 31, 2003 and the auditors' report on those statements;
• elect directors;
• appoint auditors and authorize the directors to fix their remuneration; and
• transact any other business properly brought before the meeting.

At the meeting we will also report on our 2003 business results. The management information circular included with this notice is your guide tounderstanding the business to be considered at the meeting.
Record Date
You are entitled to vote if you were a Thomson shareholder as of 5:00 p.m. (EST) on Wednesday, March 17, 2004.
Voting
Please vote by proxy on the matters to be considered at the meeting if it is not convenient for you to attend. The enclosed proxy form contains instructions onhow to complete and send your voting instructions by mail, telephone, Internet or fax. Instructions are also included in the circular. Our transfer agent,Computershare Trust Company of Canada, must receive your proxy or voting instructions no later than 5:00 p.m. (EDT) on Monday, May 3, 2004 or, if themeeting is adjourned, no later than 48 hours (excluding Saturdays and holidays) before any adjourned meeting.
Please visit www.thomson.com for more information about Thomson.
By order of the Board,
David W. Binet Secretary to the Board of Directors
April 2, 2004
If you wish to receive (or continue to receive) quarterly interim financial statements by mail during 2004, registered shareholders must mark the request boxat the bottom of their form of proxy, and non-registered shareholders must complete and return the enclosed interim report request form. If you do not mark therequest box or return the request form, quarterly financial statements will not be sent to you. Financial results are announced by news release and are availableon the Thomson website at www.thomson.com. For more information about registered and non-registered shareholders, please see page 3 of the managementinformation circular.
2
Management Information Circular
About this Document and Related Proxy Materials
We are providing this circular and proxy materials to you in connection with The Thomson Corporation's annual meeting of shareholders on May 5, 2004.As a shareholder, you are invited to attend the annual meeting. If you are unable to attend, you may still vote.
This circular describes the items to be voted on at the annual meeting and the voting process, and provides information about executive compensation andour corporate governance practices.
Please see the "Voting Questions and Answers" section below for an explanation of how you can vote on the matters to be considered at the meeting,whether or not you decide to attend the meeting.
Unless otherwise indicated, all amounts in this circular are in U.S. dollars and information is as of March 26, 2004.
Voting Questions and Answers
What is the business of the meeting?
At the meeting, shareholders are voting on two items: (1) the election of directors and (2) the appointment of auditors of the company and the authorizationof the directors to fix the auditors' remuneration. We are not aware of any other matters to be considered at the meeting. However, you may also vote on any otherbusiness that may properly come before the meeting.
Who can vote?
Holders of common shares as of 5:00 p.m. (EST) on March 17, 2004 are entitled to vote at the meeting. Each common share is entitled to one vote. OnMarch 17, 2004, there were 654,705,775 common shares outstanding.
If you want to vote shares acquired after March 17, 2004 at the meeting, you must ask Computershare to include you on the list of shareholders entitled tovote at the meeting and you must produce properly endorsed share certificates or establish in some other way that you owned the shares before 5:00 p.m. (EDT)on April 23, 2004.
How do I vote?
You should first determine whether you are a registered shareholder or a non-registered shareholder.
• You are a registered shareholder if your name appears on your share certificates. If you are a registered shareholder, you can either vote:
•
in person at the meeting; or
• by submitting your voting instructions by proxy, which means that you give another person authority to vote on your behalf.
• You are a non-registered shareholder if your name does not appear on your share certificates. For example, you are a non-registered shareholder ifyour shares are held in the name of an intermediary (such as a bank, trust company, securities broker, trustee or custodian) or in the name of aclearing agency (such as ADP Investor Communication Services) in which the intermediary participates. If you are a non-registered shareholder,please see the white box on page 4 for information on how to vote your shares.
3
If I am a registered shareholder, how do I vote in person?
You do not need to do anything except attend the meeting. Do not complete or return the proxy form, as your vote will be taken at the meeting. You shouldregister with representatives of Computershare when you arrive at the meeting. If you wish to vote shares registered in the name of a corporation, the corporationmust submit a properly executed proxy to Computershare authorizing you to vote the shares on behalf of the corporation.
If I am a registered shareholder, how do I vote by proxy?
If it is not convenient for you to attend the meeting, you may vote by proxy on the matters to be considered at the meeting in one of two ways:
• You can authorize the management representatives named on the enclosed proxy form to vote your shares. If you choose this option, there are fourways you can give voting instructions:
• Mail. Complete the enclosed proxy form by indicating how you want your shares voted. Sign, date and return the proxy form in theenvelope provided. Computershare's address for receiving proxies is 100 University Avenue, 9th Floor, Toronto, Ontario M5J 2Y1 Canada.
• Telephone (Canada and the United States only). Call the toll free number on the enclosed proxy form using a touchtone telephone andfollow the voice instructions. Please have your Holder Account Number and Proxy Access Number ready to convey your votinginstructions on the telephone. Your Holder Account Number and Proxy Access Number are located on the front of the enclosed proxyform. If your proxy form does not contain a Holder Account Number and Proxy Access Number, you will not be able to vote by telephone.
• Internet. Follow the instructions on the enclosed proxy form in order to vote your shares through the Internet. Please have your proxy formwith you when you are ready to vote, as it contains the information you will need to do this.
• Fax. Complete the enclosed proxy form by indicating how you want your shares voted. Sign and date the proxy form. Fax the completedproxy form to Computershare at 416.263.9524 or toll free in Canada and the United States only at 1.866.249.7775; or
• You may appoint another person to attend the meeting on your behalf and vote your shares. If you choose this option, you can appoint your proxyby mail, fax or through the Internet. If you mail or fax the proxy form, you must print the person's name in the blank space provided on the back ofthe enclosed proxy form and you may indicate how you want your shares voted. Sign, date and return the proxy form in the envelope provided orfax the proxy form as described above. You may also appoint another person to be your proxyholder and indicate how you want your shares votedthrough the Internet as described above. You may choose anyone to be your proxyholder; the person does not have to be another shareholder. Theperson you appoint must attend the meeting and vote on your behalf in order for your votes to be counted. Proxyholders should register withrepresentatives of Computershare when they arrive at the meeting.
Please remember that your proxy or voting instructions must be received by 5:00 p.m. (EDT) on Monday, May 3, 2004.
If I am a non-registered shareholder, how do I vote my shares?
As mentioned above, you are a non-registered shareholder if your shares are held in the name of an intermediary (such as a bank, trust company, securitiesbroker, trustee or custodian) or in the name of a clearing agency (such as ADP Investor Communication Services).
4
There are two ways that you can vote your shares:
• In person. If you wish to attend the meeting and vote in person, you should do one of the following:
• if you have received a proxy form from your intermediary, insert your own name in the blank space provided in the proxy form to appointyourself as proxyholder. If the intermediary has not signed the form, you must sign and date it. Follow your intermediary's instructions forreturning the proxy form. Do not otherwise complete the form as your vote will be taken at the meeting; or
• if you have received a voting instruction form from your intermediary, follow your intermediary's instructions for completing the form.
•

By proxy. If it is not convenient for you to attend the meeting, you should do one of the following:
• if you received a proxy form from your intermediary, you may vote by authorizing the management representatives named on the form tovote your shares. If you choose this option, you may complete the proxy form by indicating how you want your shares to be voted. If theintermediary has not signed the proxy form, you must sign and date it. Return the completed proxy form as instructed on the form.Alternatively, you may appoint another person to attend the meeting on your behalf and vote your shares by printing that person's name inthe blank space on the form and indicating how you want your shares to be voted. The person you choose does not have to be anothershareholder. The person named on the form must attend the meeting and vote on your behalf in order for your votes to be counted; or
• if you have received a voting instruction form from your intermediary, follow your intermediary's instructions for completing the form. Ifyou received a proxy form from ADP Investor Communication Services, you will be able to vote by telephone or through the Internet atwww.proxyvotecanada.com.
How will my shares be voted if I appoint a proxyholder?
Your proxyholder must vote your shares in accordance with your instructions if you have completed and signed the enclosed proxy form correctly anddelivered it to Computershare.
If you have not specified how to vote on a particular matter, then your proxyholder can vote your shares as he or she sees fit. If you have appointed themanagement representatives named on the enclosed proxy form as your proxyholder, and you have not specified how you want to vote, your shares will be votedas follows:
• FOR the election as directors of the nominees set out in this circular; and
• FOR the appointment of PricewaterhouseCoopers LLP as the auditors of the company and the authorization of the directors to fix theirremuneration.
What happens if any amendments are made to these matters or if other matters are properly brought before the meeting?
Your proxyholder will have discretionary authority to vote your shares as he or she sees fit. As of the date of the printing of this circular, management knowsof no such amendment, variation or other matter expected to come before the meeting.
5
If I change my mind, how do I revoke my proxy or voting instructions?
If you are a registered shareholder and you have returned a proxy form or given voting instructions you may revoke them in any of the following ways:
• By completing and signing a proxy form with a later date than the proxy form you previously returned, and delivering it to Computershare;
• By delivering a written statement signed by you or your attorney authorized in writing:
• at the offices of Computershare at any time before 5:00 p.m. (EDT) on May 4, 2004, or, if the meeting is adjourned, the business daybefore any adjourned meeting; or
• to the chairman of the meeting before the meeting starts; or
• In any other manner permitted by law.
If you are a non-registered shareholder, you may revoke a proxy or voting instruction (or a waiver of the right to receive meeting materials and to vote) givento your intermediary at any time by written notice to the intermediary, provided that the revocation is received by the intermediary at least seven days before themeeting. If your revocation is not received by that time, your intermediary is not required to act on it.
How many votes are required for approval?
A simple majority of votes cast, in person or by proxy, is required to approve each of the items specified in the notice of meeting which accompanies thiscircular.
Who is soliciting my proxy?
Our company's management is soliciting your proxy for use at the meeting and any adjourned meeting. We are soliciting proxies by mail and ouremployees may also solicit them personally. We are paying all costs of solicitation.
Is my vote confidential?

Yes. Computershare independently counts and tabulates the proxies to preserve the confidentiality of individual shareholder votes. Proxies are referred to usonly in cases where a shareholder clearly intends to communicate with management, in the event of questions as to the validity of a proxy or where it is necessaryto do so to meet applicable legal requirements.
Does Thomson provide electronic delivery of shareholder communications?
Yes. Electronic delivery is a voluntary program for our registered and non-registered shareholders. Under this program, an e-mail notification is sent advisingthem that documents (such as this circular and our annual report) which must be delivered under applicable securities law are available on our website. Webelieve that electronic delivery will benefit the environment and reduce our costs. If this approach is not suitable for you, we will continue to provide paper copiesof documentation to you.
How can I enroll for electronic delivery?
If you are a registered shareholder and wish to enroll for electronic delivery of documents, please go to Computershare's website at www.computershare.comand click "Investors" and then "Electronic Shareholder Communications." You will need your Holder Account Number and Proxy Access Number. You can findthese numbers on the form of proxy provided in your package.
6
If you are a non-registered shareholder and wish to enroll for electronic delivery of documents, please go to ADP Investor Communication Services' websiteat www.investordeliverycanada.com for more instructions and to register. You will need your Control Number. You can find this number on the form of proxyprovided in your package.
Principal Shareholder
The Woodbridge Company Limited, or Woodbridge, is our principal shareholder. On March 17, 2004, Woodbridge beneficially owned 418,582,440 of ourcommon shares, or 63.93% of our outstanding common shares.
Woodbridge is the primary investment vehicle for Kenneth R. Thomson and other members of the family of the late first Lord Thomson of Fleet. Mr.Thomson, a director of our company, controls Woodbridge and other companies that beneficially owned 30,764,989 of our common shares on March 17, 2004.Through Woodbridge and these other companies, Mr. Thomson controls an aggregate of 449,347,429 of our common shares, or 68.63% of our outstandingcommon shares.
Note 25 to our 2003 consolidated financial statements provides information on certain transactions that we entered into with Woodbridge and affiliates of theThomson family in 2002 and 2003.
Business of the Meeting
At the meeting, you will be asked to:
• elect directors; and
• appoint PricewaterhouseCoopers LLP as auditors and authorize the directors to fix their remuneration.
Election of Directors
At the meeting, 16 directors are to be elected. All of the nominees are currently directors of our company. Each director elected will hold office until the nextannual meeting of shareholders or until the director resigns or a successor is elected or appointed. Management does not believe that any of the nominees will beunable to serve as a director but, if that occurs for any reason before the meeting, the persons named in the enclosed proxy form may vote for another nominee attheir discretion.
The following provides information regarding each of the nominees, including the number of shares beneficially owned directly or indirectly by them, orover which they exercised control or direction, and the number of deferred share units held by them on March 17, 2004.
David K.R. Thomson(1)Toronto, Ontario
Director since 1988Common shares: 6,070Deferred share units: —
David K.R. Thomson, 46, is Chairman of TheThomson Corporation and Deputy Chairman ofWoodbridge. Mr. Thomson is also a member ofthe finance committee.
Mr. Thomson was named Chairman of Thomsonin May 2002.
7
W. Geoffrey BeattieToronto, Ontario
Director since 1998Common shares: 100,500Deferred share units: —
W. Geoffrey Beattie, 44, is Deputy Chairman ofThe Thomson Corporation and President ofWoodbridge. Mr. Beattie is chair of the financecommittee and a member of the corporategovernance and human resources committees.

Mr. Beattie has been Deputy Chairman ofThomson since 2000. He is also a director ofRoyal Bank of Canada, Bell Globemedia Inc.,Hydro One Inc. and TM BiosciencesCorporation.
Richard J. HarringtonWestport, Connecticut
Director since 1993Common shares: 15,100Deferred share units: 310,949
Richard J. Harrington, 57, is President and ChiefExecutive Officer of Thomson. Mr. Harrington joined Thomson in 1982. He hasheld a number of key leadership positionsduring his Thomson career, including Presidentand Chief Executive Officer of ThomsonNewspapers. Mr. Harrington also serves on theboard of directors of Xerox Corporation.
Ron D. BarbaroToronto, Ontario
Director since 1993Common shares: 25,000Deferred share units: 9,828
Ron D. Barbaro, 72, is a corporate director. Mr.Barbaro is a member of the audit and corporategovernance committees. Prior to 2004, Mr. Barbaro was Chairman andCEO of the Ontario Lottery and GamingCorporation. Prior to that, he was President ofthe Prudential Insurance Company of Americaand President of Worldwide Operations ofPrudential Insurance Company of America. Mr.Barbaro is also a director of Flow InternationalCorp. and chairman of Trans Global InsuranceCompany.
8
Robert D. DaleoAlpine, New Jersey
Director since 2001Common shares: 1,100Deferred share units: 49,446
Robert D. Daleo, 54, is Executive VicePresident and Chief Financial Officer ofThomson. Mr. Daleo began his career with Thomson in1994 when he joined Thomson Newspapers asSenior Vice President and Chief FinancialOfficer. In 1998, Mr. Daleo became ChiefFinancial Officer of Thomson.
Steven A. DenningGreenwich, Connecticut
Director since 2000Common shares: —Deferred share units: 6,191
Steven A. Denning, 55, is Managing Partner ofGeneral Atlantic Partners, LLC, a private equityinvestment firm. Mr. Denning is the chair of thehuman resources committee. Mr. Denning is a director of Exult, Inc., EclipsysCorporation, SRA International, Inc. andLiberata plc.
John F. Fraser, O.C.Winnipeg, Manitoba
Director since 1989Common shares: 2,385Deferred share units: 9,868
John F. Fraser, O.C., 73, is a corporate director.Mr. Fraser is a member of the corporategovernance committee. Mr. Fraser was the non-executive chairman ofAir Canada until 2003 and is currently amember of its board of directors. Prior to that,he was Chairman and Chief Executive Officerof Russel Metals Inc. He is also a director ofManitoba Telecom Services Inc.
9
V. Maureen KempstonDarkes, O.C.Miami, Florida
Director since 1996Common shares: 500Deferred share units: 8,512
V. Maureen Kempston Darkes, O.C., 55, isGroup Vice President, General MotorsCorporation and President of GM LatinAmerica, Africa and the Middle East. Ms.Kempston Darkes is a member of the corporategovernance and human resources committees.

Previously, Ms. Kempston Darkes was Presidentand General Manager of General Motors ofCanada Limited. Ms. Kempston Darkes is also adirector of Canadian National RailwayCompany and Noranda Inc.
Roger L. MartinToronto, Ontario
Director since 1999Common shares: 6,000Deferred share units: 6,959
Roger L. Martin, 47, is Dean of the Joseph L.Rotman School of Management at theUniversity of Toronto. Mr. Martin is a memberof the audit committee. Previously, Mr. Martin was Co-Head of MonitorCompany. He is also chairman of the board ofdirectors of Workbrain Corporation.
Vance K. OppermanMinneapolis, Minnesota
Director since 1996Common shares: 50,000Deferred share units: 10,206
Vance K. Opperman, 61, is President and ChiefExecutive Officer of Key Investment, Inc. Mr.Opperman is chair of the audit committee. Previously, Mr. Opperman was President ofWest Publishing Company. He is also a directorof Delta Dental Plans Association,BlueCross/BlueShield of Minnesota and AvenetLLC.
10
David H. ShafferNew York, New York
Director since 1998Common shares: 40,000Deferred share units: 1,774
David H. Shaffer, 61, is Executive VicePresident of Thomson and Chief ExecutiveOfficer of Thomson Financial, a position he hasheld since November 2002. Mr. Shaffer joined our company in 1998 andpreviously served as Chief Operating Officer ofThomson and as President and Chief ExecutiveOfficer of Thomson Learning.
John M. ThompsonToronto, Ontario
Director since 2003Common shares: 1,500Deferred share units: 1,774
John M. Thompson, 61, is Chairman of theBoard of The Toronto-Dominion Bank. Mr.Thompson is chair of the corporate governancecommittee and a member of the auditcommittee. Mr. Thompson was Vice Chairman of the Boardof IBM from August 2000 to September 2002.Prior to that, he held various senior executivepositions with IBM. Mr. Thompson is also adirector of Robert Mondavi Corporation andRoyal Philips Electronics.
Kenneth R. Thomson(1)Toronto, Ontario
Director since 1978Common shares: 449,347,429(2)Deferred share units: —
Kenneth R. Thomson, 80, is Chairman ofWoodbridge. Mr. Thomson is our company's controllingshareholder and was Chairman of Thomsonfrom 1978 to 2002.
Peter J. Thomson(1)Toronto, Ontario
Director since 1995Common shares: —Deferred share units: —
Peter J. Thomson, 38, is Deputy Chairman ofWoodbridge.
11
Richard M. Thomson, O.C.(1)Toronto, Ontario
Director since 1995Common shares: 31,700Deferred share units: 11,200
Richard M. Thomson, O.C., 70, is a corporatedirector. Mr. Thomson is a member of the auditand human resources committees. Previously, Mr. Thomson was Chairman andChief Executive Officer of The Toronto-

Dominion Bank. He is a director of TheToronto-Dominion Bank, Inco Limited,Prudential Financial, Inc., Stuart EnergySystems Corporation, Trizec Properties Inc. andNexen Inc.
John A. ToryToronto, Ontario
Director since 1978Common shares: 501,670Deferred share units: —
John A. Tory, 74, is President of ThomsonInvestments Limited, an affiliate of Woodbridge.Mr. Tory is a member of the finance and humanresources committees. Mr. Tory was Deputy Chairman of Thomsonfrom 1978 to 1997 and President of Woodbridgefrom 1973 to 1998. Mr. Tory is also a director ofAbitibi-Consolidated Inc. and RogersCommunications Inc.
(1) David K.R. Thomson and Peter J. Thomson are the sons of Kenneth R. Thomson. Richard M. Thomson is not related to the family of Kenneth R. Thomson.
(2) In addition, Mrs. K.R. Thomson indirectly beneficially owned 262,558 common shares as of March 17, 2004.
For more information on deferred share units held by our non-management directors, please see "Compensation of Directors" on page 15. Messrs.Harrington and Daleo hold their deferred share units under our deferred compensation plan, which provides that they will receive shares of our company equal tothe number of deferred share units disclosed upon ceasing to be employed by our company.
Appointment of Auditors
It is recommended that PricewaterhouseCoopers LLP be reappointed as the auditors of the company to hold office until the next annual meeting ofshareholders and that the directors be authorized to fix their remuneration. PricewaterhouseCoopers LLP have been the auditors of the company since itsincorporation in 1977.
12
Fees payable to PricewaterhouseCoopers LLP for the years ended December 31, 2003 and 2002 were as follows:
Fees in millions of U.S. dollars
2003
2002
Audit fees 10.7 11.3Audit-related fees 6.3 2.9Tax fees 7.5 7.8All other fees 1.7 4.0 Total 26.2 26.0
AUDIT FEES
Audit fees were for professional services rendered for the audits of our consolidated financial statements, review of interim financial statements included inour quarterly reports, and services that generally only the independent auditors can reasonably provide, such as comfort letters, statutory audits, consents, andassistance and review of documents filed with the SEC and Canadian securities regulatory authorities.
AUDIT-RELATED FEES
Audit-related fees were for assurance and related services that are reasonably related to the performance of the audit or review of our financial statementsand are not reported under the "audit fees" category above. These services included Sarbanes-Oxley Section 404 advisory services, internal control reviews,audits of our various employee benefit plans, transaction due diligence, subsidiary audits, and other services related to acquisitions and dispositions.
TAX FEES
Tax fees were for tax compliance, tax advice and tax planning. These services included the preparation and review of corporate and expatriate tax returns,assistance with tax audits and transfer pricing matters, advisory services relating to federal, state, provincial and international tax compliance for customs andduties, advisory services regarding common forms of domestic and international taxation (i.e., tax credits, income tax, VAT, GST and excise taxes) and advisoryservices regarding restructurings, mergers and acquisitions.
ALL OTHER FEES
Fees disclosed in the table above under the item "all other fees" were for services other than the audit fees, audit-related fees and tax fees described above.These services included:
• insurance, transaction and benefit plan advisory services;
• review of non-financial information systems design and implementation in 2002; and
•

French translations of financial statements, management's discussion and analysis and financial information included in our annual informationform, prospectuses and other offering documents.
PRE-APPROVAL POLICIES AND PROCEDURES
Our audit committee is responsible for overseeing the work of the independent auditors and has considered whether the provision of services other than auditservices is compatible with maintaining the auditors' independence. The audit committee has adopted a policy regarding its pre-approval of all audit andpermissible non-audit services provided by the independent auditors. The policy gives detailed guidance to our management as to the specific types of servicesthat have been pre-approved
13
by the audit committee. The policy requires the audit committee's specific approval of all other permitted types of services that have not been pre-approved. Oursenior management periodically provides the audit committee with a summary of services provided by the independent auditors in accordance with the pre-approval policy. The audit committee's charter permits delegation to the chair of the authority to evaluate and approve engagements in the event that the needarises for approval between audit committee meetings. If the chair approves any such engagements, he reports his approval decisions to the full audit committeeat its next meeting. For the year ended December 31, 2003, none of the audit-related, tax or all other fees described above made use of the de minimus exceptionto pre-approval provisions contained in the applicable rules of the SEC.
Executive Compensation
Summary Compensation Table
The following table discloses compensation received during the last three years by our President and Chief Executive Officer and our next four most highlycompensated executive officers in 2003. In this section, these individuals are referred to as the named executive officers. All dollar amounts are in U.S. dollarsunless otherwise indicated.
Annual compensation
Long-term compensation
Awards
Payouts
Name and principalposition
Year
Salary ($)
Bonus ($)
Other annualcompensation ($)(1)
Securitiesunder
options/SARsgranted (#)
Restrictedshares orrestricted
share units ($)
Long-termincentive planpayouts ($)(2)
All othercompensation ($)
(3)
Richard J. HarringtonPresident and ChiefExecutive Officer
200320022001
1,280,0001,230,0001,200,000
1,461,8881,692,9721,840,800
457,388437,220481,715
325,000325,000375,000
———
266,240——
6,0006,0005,100
David H. ShafferExecutive Vice President ofThomson and ChiefExecutive Officer ofThomson Financial
200320022001
1,000,000979,167950,000
1,250,0001,958,3341,365,150
433,844309,045206,265
140,000140,000208,000
———
208,000——
6,0005,5005,100
Brian H. HallExecutive Vice President ofThomson and President andChief Executive Officer ofThomson Legal &Regulatory
200320022001
810,000770,000750,000
1,171,326975,205899,250
252,667240,535326,907
115,000115,000155,000
———
168,480—
807,444
6,0006,0005,100
Robert D. DaleoExecutive Vice President andChief Financial Officer
200320022001
750,000710,000690,000
856,575977,244
1,058,460
251,184237,666252,917
105,000105,000133,000
———
156,000——
6,0005,5004,806
Ronald H. Schlosser(4)Executive Vice President ofThomson and President andChief Executive Officer ofThomson Learning
200320022001
700,000566,667525,000
500,000741,801695,363
191,913181,362188,676
100,000100,000108,000
———
145,600198,959277,875
3,8133,4753,247
(1) Amounts for 2003, 2002 and 2001 include premiums that we paid for life insurance policies on behalf of our named executive officers. We replaced some of our life insurance arrangements followingthe enactment of the Sarbanes-Oxley Act of 2002 and we will not recover premiums paid in 2003. Please see the discussion on page 12 under the caption "Insurance Policies" for more information.
14
The amount for Mr. Harrington in 2003 includes payment of a premium and a tax reimbursement of $329,892 in connection with his policy. The amounts for 2002 and 2001 include $329,892 and$401,775, respectively, in respect of Mr. Harrington's insurance policy of which $6,642 and $4,860, respectively, represent the premium we paid for the term life portion of the policy and $323,250 and$396,915, respectively, represent the actuarial equivalent of the benefit to Mr. Harrington of the premium we paid for the non-term life portion of the policy.
The amounts for Mr. Shaffer in 2003, 2002 and 2001 include the cost of premiums that we paid for his life insurance policy in the amounts of $95,750, $99,337 and $101,876, respectively. The amountsfor 2003, 2002 and 2001 also include $246,045, $137,545 and $59,269, respectively, paid to Mr. Shaffer as compensation for living, travel and related expenses incurred as a result of working asignificant distance from his family's principal residence.
The amount for Mr. Hall in 2003 includes payment of a premium and a tax reimbursement of $206,688 in connection with his policy. The amounts for 2002 and 2001 include $206,688 and $251,525,respectively, in respect of Mr. Hall's insurance policy of which $4,158 and $2,841, respectively, represent the premium we paid for the term life portion of the policy and $202,530 and $248,684,respectively, represent the actuarial equivalent of the benefit to Mr. Hall of the premium we paid for the non-term life portion of the policy.
The amount for Mr. Daleo in 2003 includes payment of a premium and a tax reimbursement of $181,200 in connection with his policy. The amounts for 2002 and 2001 include $181,200 and $216,568,respectively, in respect of Mr. Daleo's insurance policy of which $3,373 and $2,303, respectively, represent the premium we paid for the term life portion of the policy and $177,827 and $214,265,respectively, represent the actuarial equivalent of the benefit to Mr. Daleo of the premium we paid for the non-term life portion of the policy.
The amount for Mr. Schlosser in 2003 includes payment of a premium and a tax reimbursement of $138,019 in connection with his policy. The amounts for 2002 and 2001 include $138,019 and$165,079, respectively, in respect of Mr. Schlosser's insurance policy of which $2,565 and $1,870, respectively, represent the premium we paid for the term life portion of the policy and $135,454 and$163,209, respectively, represent the actuarial equivalent of the benefit to Mr. Schlosser of the premium we paid for the non-term life portion of the policy.
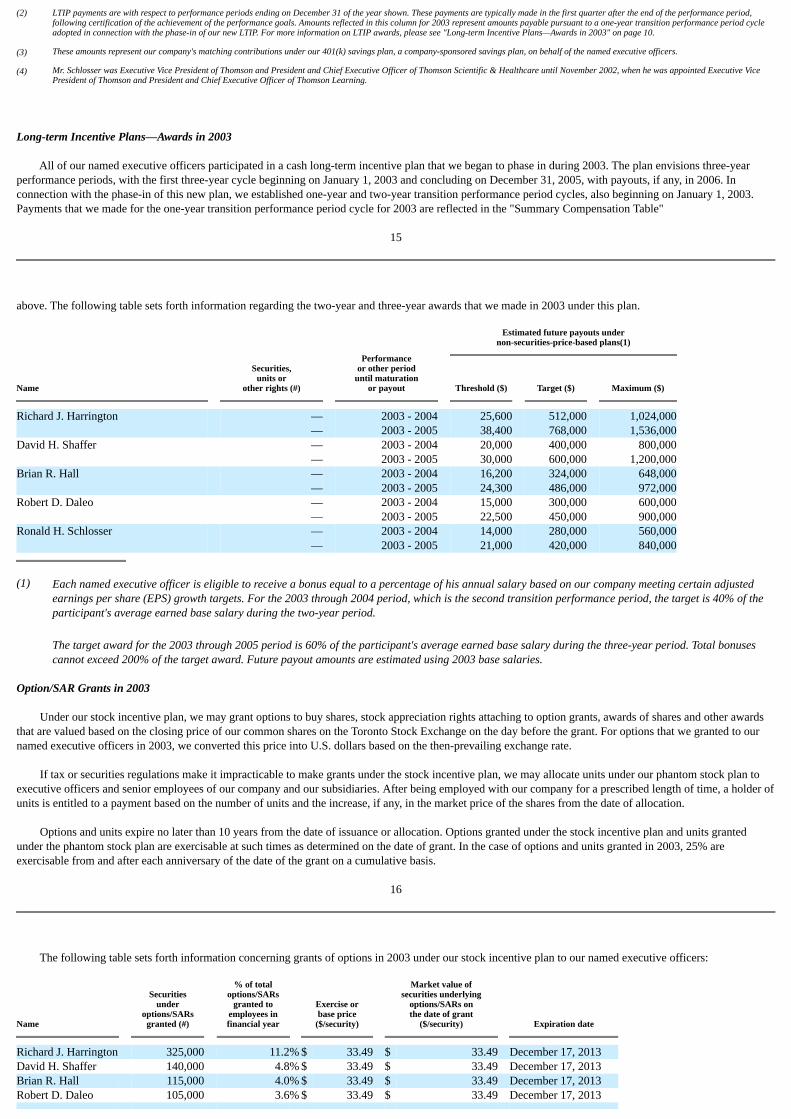
(2) LTIP payments are with respect to performance periods ending on December 31 of the year shown. These payments are typically made in the first quarter after the end of the performance period,following certification of the achievement of the performance goals. Amounts reflected in this column for 2003 represent amounts payable pursuant to a one-year transition performance period cycleadopted in connection with the phase-in of our new LTIP. For more information on LTIP awards, please see "Long-term Incentive Plans—Awards in 2003" on page 10.
(3) These amounts represent our company's matching contributions under our 401(k) savings plan, a company-sponsored savings plan, on behalf of the named executive officers.
(4) Mr. Schlosser was Executive Vice President of Thomson and President and Chief Executive Officer of Thomson Scientific & Healthcare until November 2002, when he was appointed Executive VicePresident of Thomson and President and Chief Executive Officer of Thomson Learning.
Long-term Incentive Plans—Awards in 2003
All of our named executive officers participated in a cash long-term incentive plan that we began to phase in during 2003. The plan envisions three-yearperformance periods, with the first three-year cycle beginning on January 1, 2003 and concluding on December 31, 2005, with payouts, if any, in 2006. Inconnection with the phase-in of this new plan, we established one-year and two-year transition performance period cycles, also beginning on January 1, 2003.Payments that we made for the one-year transition performance period cycle for 2003 are reflected in the "Summary Compensation Table"
15
above. The following table sets forth information regarding the two-year and three-year awards that we made in 2003 under this plan.
Estimated future payouts undernon-securities-price-based plans(1)
Performanceor other period
until maturationor payoutName
Securities,units or
other rights (#)
Threshold ($)
Target ($)
Maximum ($)
Richard J. Harrington ——
2003 - 20042003 - 2005
25,60038,400
512,000768,000
1,024,0001,536,000
David H. Shaffer ——
2003 - 20042003 - 2005
20,00030,000
400,000600,000
800,0001,200,000
Brian R. Hall ——
2003 - 20042003 - 2005
16,20024,300
324,000486,000
648,000972,000
Robert D. Daleo ——
2003 - 20042003 - 2005
15,00022,500
300,000450,000
600,000900,000
Ronald H. Schlosser ——
2003 - 20042003 - 2005
14,00021,000
280,000420,000
560,000840,000
(1) Each named executive officer is eligible to receive a bonus equal to a percentage of his annual salary based on our company meeting certain adjustedearnings per share (EPS) growth targets. For the 2003 through 2004 period, which is the second transition performance period, the target is 40% of theparticipant's average earned base salary during the two-year period.
The target award for the 2003 through 2005 period is 60% of the participant's average earned base salary during the three-year period. Total bonusescannot exceed 200% of the target award. Future payout amounts are estimated using 2003 base salaries.
Option/SAR Grants in 2003
Under our stock incentive plan, we may grant options to buy shares, stock appreciation rights attaching to option grants, awards of shares and other awardsthat are valued based on the closing price of our common shares on the Toronto Stock Exchange on the day before the grant. For options that we granted to ournamed executive officers in 2003, we converted this price into U.S. dollars based on the then-prevailing exchange rate.
If tax or securities regulations make it impracticable to make grants under the stock incentive plan, we may allocate units under our phantom stock plan toexecutive officers and senior employees of our company and our subsidiaries. After being employed with our company for a prescribed length of time, a holder ofunits is entitled to a payment based on the number of units and the increase, if any, in the market price of the shares from the date of allocation.
Options and units expire no later than 10 years from the date of issuance or allocation. Options granted under the stock incentive plan and units grantedunder the phantom stock plan are exercisable at such times as determined on the date of grant. In the case of options and units granted in 2003, 25% areexercisable from and after each anniversary of the date of the grant on a cumulative basis.
16
The following table sets forth information concerning grants of options in 2003 under our stock incentive plan to our named executive officers:
Name
Securitiesunder
options/SARsgranted (#)
% of totaloptions/SARs
granted toemployees infinancial year
Exercise orbase price
($/security)
Market value ofsecurities underlying
options/SARs onthe date of grant
($/security)
Expiration date
Richard J. Harrington 325,000 11.2% $ 33.49 $ 33.49 December 17, 2013David H. Shaffer 140,000 4.8% $ 33.49 $ 33.49 December 17, 2013Brian R. Hall 115,000 4.0% $ 33.49 $ 33.49 December 17, 2013Robert D. Daleo 105,000 3.6% $ 33.49 $ 33.49 December 17, 2013
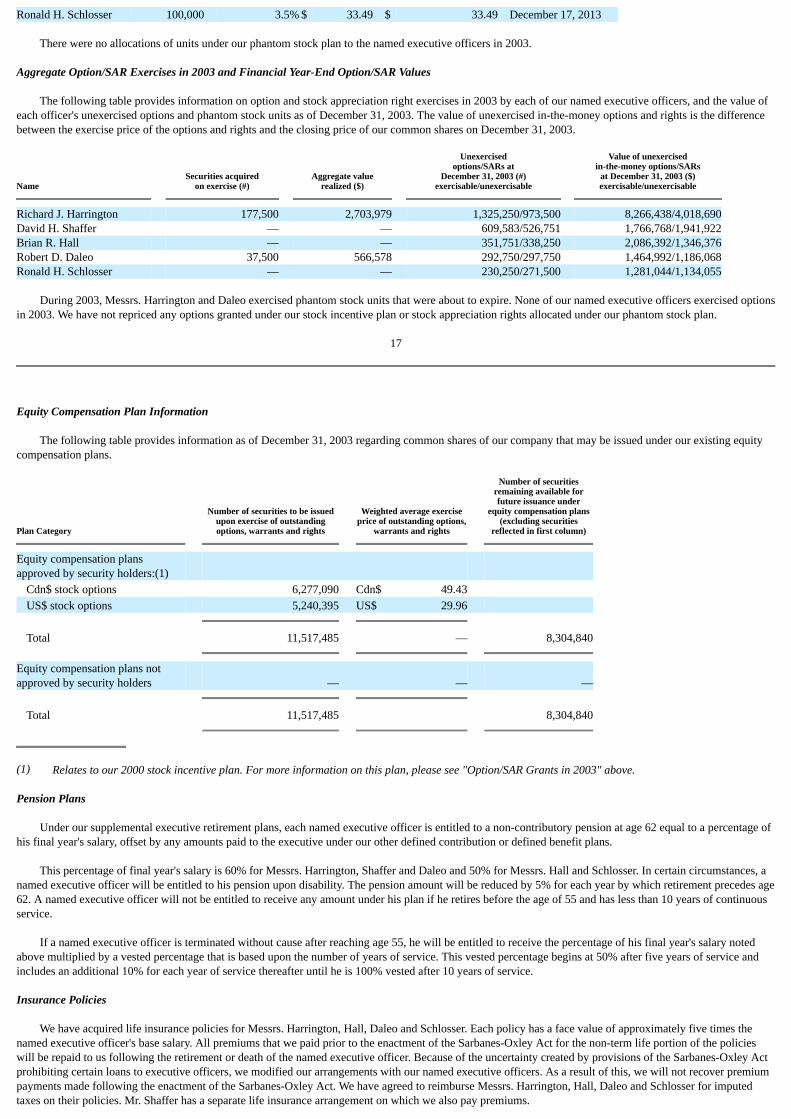
Ronald H. Schlosser 100,000 3.5% $ 33.49 $ 33.49 December 17, 2013
There were no allocations of units under our phantom stock plan to the named executive officers in 2003.
Aggregate Option/SAR Exercises in 2003 and Financial Year-End Option/SAR Values
The following table provides information on option and stock appreciation right exercises in 2003 by each of our named executive officers, and the value ofeach officer's unexercised options and phantom stock units as of December 31, 2003. The value of unexercised in-the-money options and rights is the differencebetween the exercise price of the options and rights and the closing price of our common shares on December 31, 2003.
Name
Securities acquiredon exercise (#)
Aggregate valuerealized ($)
Unexercisedoptions/SARs at
December 31, 2003 (#)exercisable/unexercisable
Value of unexercisedin-the-money options/SARs
at December 31, 2003 ($)exercisable/unexercisable
Richard J. Harrington 177,500 2,703,979 1,325,250/973,500 8,266,438/4,018,690David H. Shaffer — — 609,583/526,751 1,766,768/1,941,922Brian R. Hall — — 351,751/338,250 2,086,392/1,346,376Robert D. Daleo 37,500 566,578 292,750/297,750 1,464,992/1,186,068Ronald H. Schlosser — — 230,250/271,500 1,281,044/1,134,055
During 2003, Messrs. Harrington and Daleo exercised phantom stock units that were about to expire. None of our named executive officers exercised optionsin 2003. We have not repriced any options granted under our stock incentive plan or stock appreciation rights allocated under our phantom stock plan.
17
Equity Compensation Plan Information
The following table provides information as of December 31, 2003 regarding common shares of our company that may be issued under our existing equitycompensation plans.
Plan Category
Number of securities to be issuedupon exercise of outstandingoptions, warrants and rights
Weighted average exerciseprice of outstanding options,
warrants and rights
Number of securitiesremaining available forfuture issuance under
equity compensation plans(excluding securities
reflected in first column)
Equity compensation plansapproved by security holders:(1) Cdn$ stock options 6,277,090 Cdn$ 49.43 US$ stock options 5,240,395 US$ 29.96 Total 11,517,485 — 8,304,840 Equity compensation plans notapproved by security holders — — — Total 11,517,485 8,304,840
(1) Relates to our 2000 stock incentive plan. For more information on this plan, please see "Option/SAR Grants in 2003" above.
Pension Plans
Under our supplemental executive retirement plans, each named executive officer is entitled to a non-contributory pension at age 62 equal to a percentage ofhis final year's salary, offset by any amounts paid to the executive under our other defined contribution or defined benefit plans.
This percentage of final year's salary is 60% for Messrs. Harrington, Shaffer and Daleo and 50% for Messrs. Hall and Schlosser. In certain circumstances, anamed executive officer will be entitled to his pension upon disability. The pension amount will be reduced by 5% for each year by which retirement precedes age62. A named executive officer will not be entitled to receive any amount under his plan if he retires before the age of 55 and has less than 10 years of continuousservice.
If a named executive officer is terminated without cause after reaching age 55, he will be entitled to receive the percentage of his final year's salary notedabove multiplied by a vested percentage that is based upon the number of years of service. This vested percentage begins at 50% after five years of service andincludes an additional 10% for each year of service thereafter until he is 100% vested after 10 years of service.
Insurance Policies
We have acquired life insurance policies for Messrs. Harrington, Hall, Daleo and Schlosser. Each policy has a face value of approximately five times thenamed executive officer's base salary. All premiums that we paid prior to the enactment of the Sarbanes-Oxley Act for the non-term life portion of the policieswill be repaid to us following the retirement or death of the named executive officer. Because of the uncertainty created by provisions of the Sarbanes-Oxley Actprohibiting certain loans to executive officers, we modified our arrangements with our named executive officers. As a result of this, we will not recover premiumpayments made following the enactment of the Sarbanes-Oxley Act. We have agreed to reimburse Messrs. Harrington, Hall, Daleo and Schlosser for imputedtaxes on their policies. Mr. Shaffer has a separate life insurance arrangement on which we also pay premiums.
18
We provide group life insurance to certain of our U.S. employees in the amount of their annual salary up to $600,000. Messrs. Harrington, Shaffer, Daleo andSchlosser also participate in this plan.
Employment Agreements
Each named executive officer is a party to an employment agreement. If any of them is terminated without cause, he will receive a payment based on hisfinal year's salary. In the case of Mr. Harrington, the payment is three times his final year's salary. For Mr. Shaffer, the payment is two and one-half times his finalyear's salary. For each of Messrs. Hall, Daleo and Schlosser, the payment is two times his final year's salary. If any of them is terminated without cause, one-halfof all unvested options issued under the stock incentive plan and units allocated under the phantom stock plan are immediately exercisable and the balance isforfeited.
Report on Executive Compensation
Our executive compensation structure encourages executives to achieve exceptional performance. We reward both individual and corporate performance,primarily over the long term, but also in the short term. We expect to pay exceptional compensation for superior performance, and outstanding executives havethe opportunity to achieve substantial earnings. Compensation for executives reflects:
• the functions they perform;
• their contribution to our company;
• their capacity to improve the financial performance of our company;
• their enthusiasm and loyalty; and
• above all, their ability to create value for our shareholders.
We also believe it is important to compensate our senior executives in the top quartile of the compensation paid by our competitors. We believe this allows usto attract and retain high-quality executives.
From time to time, we retain consultants to analyze total compensation and its form to ensure our company is competitive in this regard. In 2003, aconsulting firm extensively reviewed our executive compensation program and concluded that our program generally provides executives with competitivecompensation opportunities, links compensation to performance and value creation and is efficient from an accounting standpoint.
We believe that increased share ownership by our senior executives will further align their interests with those of our shareholders. In 2002, we approvednew share ownership guidelines for some of our senior executives that require them to maintain an equity interest in our company with a value equal to a multipleof their salary. The highest multiple is four times salary and the lowest is one times salary. Compliance is being phased in and the value of deferred share unitsand common shares acquired pursuant to our deferred compensation plan and company-sponsored 401(k) retirement savings plan, respectively, will count towardmeeting the share ownership requirement. We added company shares as an investment option in our 401(k) plan in 2003 and believe that it facilitates the abilityof executives to increase their equity holdings in our company.
Total Compensation
A senior executive's target compensation typically comprises salary, annual and long-term cash incentive bonus plan payments and equity-based incentives.The human resources committee believes this mix aligns the interests of executives with those of shareholders, provides significant cash incentives and assists inkeeping our company competitive in the market for high-quality executives.
19
Salary
Salary is determined by reference to an executive's performance and salaries prevailing in the relevant market. Generally, increases in base salary aredetermined primarily by the performance of Thomson, of the market group in which the executive works, and of the executive. For an executive in one of ourcompany's market groups, the most heavily weighted factors are the performance of that executive and that group. For an executive with corporate-wideresponsibilities, the most heavily weighted factors are the performance of that executive and the performance of Thomson as a whole. In the past few years, mostof our executives have had annual salary increases in the 3-5% range.
The human resources committee approves changes in base salary for senior executive officers, including the named executive officers. The most recentreview took place in December 2003.
Annual Incentive Bonus Plans
We use annual incentive bonus plans to motivate and reward senior executives. Different plans may be put into effect to compensate individual executives orbusinesses. Each market group establishes plans within parameters we set which take into account the market conditions of the particular group. The plans aretypically designed to reward the individual executive for the direct contribution that he or she can make to our company or his or her market group. At the mostsenior levels, these plans are related to increases in revenue, adjusted operating profit and return on invested capital (ROIC) meeting or exceeding specific targetsdetermined by the Board by reference to our company's strategic plans.
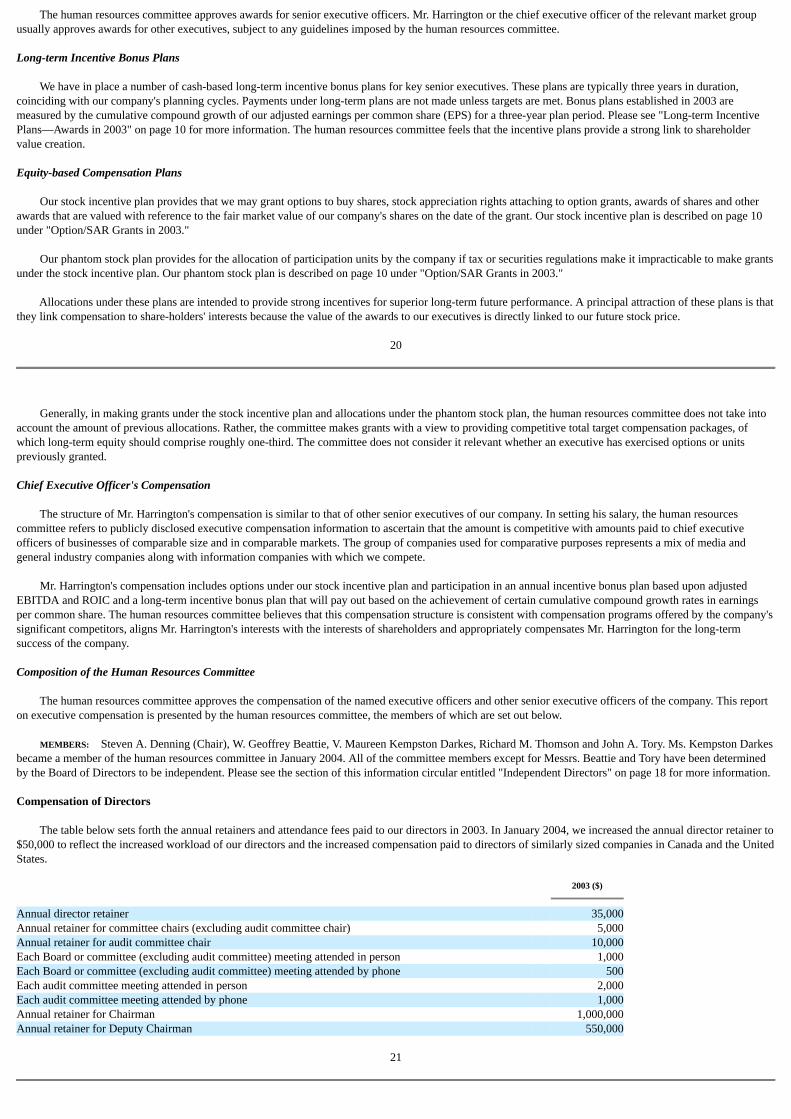
The human resources committee approves awards for senior executive officers. Mr. Harrington or the chief executive officer of the relevant market groupusually approves awards for other executives, subject to any guidelines imposed by the human resources committee.
Long-term Incentive Bonus Plans
We have in place a number of cash-based long-term incentive bonus plans for key senior executives. These plans are typically three years in duration,coinciding with our company's planning cycles. Payments under long-term plans are not made unless targets are met. Bonus plans established in 2003 aremeasured by the cumulative compound growth of our adjusted earnings per common share (EPS) for a three-year plan period. Please see "Long-term IncentivePlans—Awards in 2003" on page 10 for more information. The human resources committee feels that the incentive plans provide a strong link to shareholdervalue creation.
Equity-based Compensation Plans
Our stock incentive plan provides that we may grant options to buy shares, stock appreciation rights attaching to option grants, awards of shares and otherawards that are valued with reference to the fair market value of our company's shares on the date of the grant. Our stock incentive plan is described on page 10under "Option/SAR Grants in 2003."
Our phantom stock plan provides for the allocation of participation units by the company if tax or securities regulations make it impracticable to make grantsunder the stock incentive plan. Our phantom stock plan is described on page 10 under "Option/SAR Grants in 2003."
Allocations under these plans are intended to provide strong incentives for superior long-term future performance. A principal attraction of these plans is thatthey link compensation to share-holders' interests because the value of the awards to our executives is directly linked to our future stock price.
20
Generally, in making grants under the stock incentive plan and allocations under the phantom stock plan, the human resources committee does not take intoaccount the amount of previous allocations. Rather, the committee makes grants with a view to providing competitive total target compensation packages, ofwhich long-term equity should comprise roughly one-third. The committee does not consider it relevant whether an executive has exercised options or unitspreviously granted.
Chief Executive Officer's Compensation
The structure of Mr. Harrington's compensation is similar to that of other senior executives of our company. In setting his salary, the human resourcescommittee refers to publicly disclosed executive compensation information to ascertain that the amount is competitive with amounts paid to chief executiveofficers of businesses of comparable size and in comparable markets. The group of companies used for comparative purposes represents a mix of media andgeneral industry companies along with information companies with which we compete.
Mr. Harrington's compensation includes options under our stock incentive plan and participation in an annual incentive bonus plan based upon adjustedEBITDA and ROIC and a long-term incentive bonus plan that will pay out based on the achievement of certain cumulative compound growth rates in earningsper common share. The human resources committee believes that this compensation structure is consistent with compensation programs offered by the company'ssignificant competitors, aligns Mr. Harrington's interests with the interests of shareholders and appropriately compensates Mr. Harrington for the long-termsuccess of the company.
Composition of the Human Resources Committee
The human resources committee approves the compensation of the named executive officers and other senior executive officers of the company. This reporton executive compensation is presented by the human resources committee, the members of which are set out below.
MEMBERS: Steven A. Denning (Chair), W. Geoffrey Beattie, V. Maureen Kempston Darkes, Richard M. Thomson and John A. Tory. Ms. Kempston Darkesbecame a member of the human resources committee in January 2004. All of the committee members except for Messrs. Beattie and Tory have been determinedby the Board of Directors to be independent. Please see the section of this information circular entitled "Independent Directors" on page 18 for more information.
Compensation of Directors
The table below sets forth the annual retainers and attendance fees paid to our directors in 2003. In January 2004, we increased the annual director retainer to$50,000 to reflect the increased workload of our directors and the increased compensation paid to directors of similarly sized companies in Canada and the UnitedStates.
2003 ($)
Annual director retainer 35,000Annual retainer for committee chairs (excluding audit committee chair) 5,000Annual retainer for audit committee chair 10,000Each Board or committee (excluding audit committee) meeting attended in person 1,000Each Board or committee (excluding audit committee) meeting attended by phone 500Each audit committee meeting attended in person 2,000Each audit committee meeting attended by phone 1,000Annual retainer for Chairman 1,000,000Annual retainer for Deputy Chairman 550,000
21
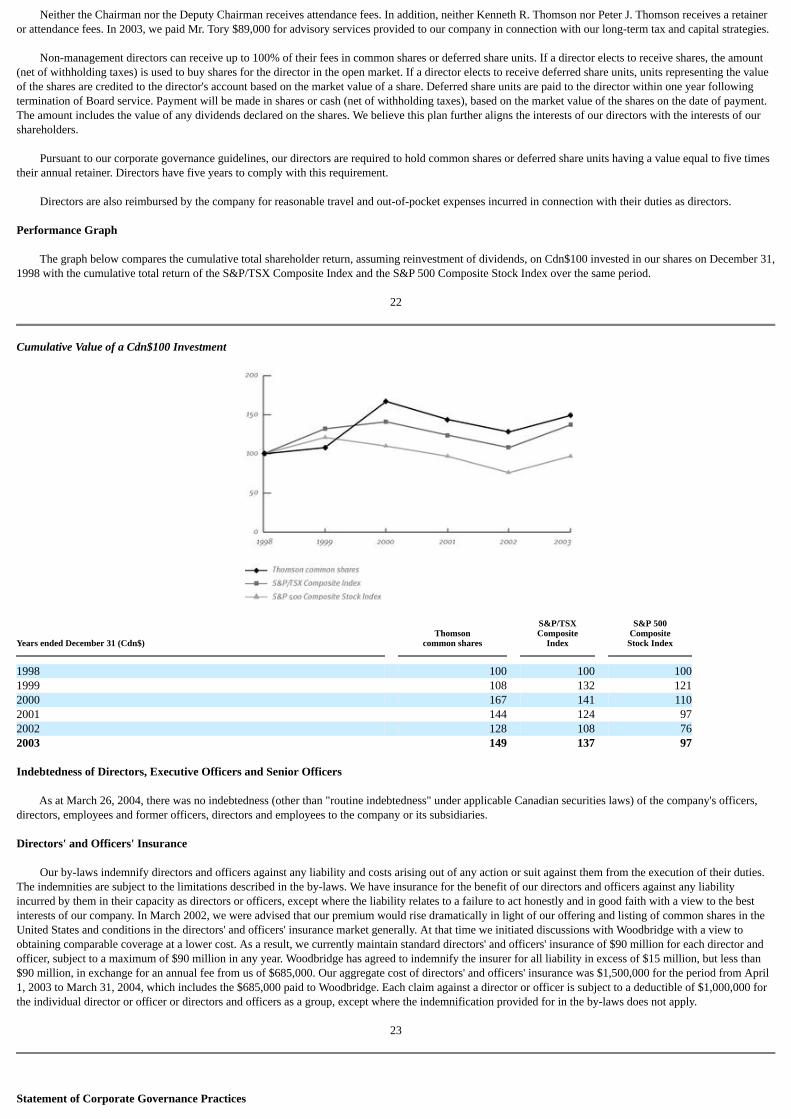
Neither the Chairman nor the Deputy Chairman receives attendance fees. In addition, neither Kenneth R. Thomson nor Peter J. Thomson receives a retaineror attendance fees. In 2003, we paid Mr. Tory $89,000 for advisory services provided to our company in connection with our long-term tax and capital strategies.
Non-management directors can receive up to 100% of their fees in common shares or deferred share units. If a director elects to receive shares, the amount(net of withholding taxes) is used to buy shares for the director in the open market. If a director elects to receive deferred share units, units representing the valueof the shares are credited to the director's account based on the market value of a share. Deferred share units are paid to the director within one year followingtermination of Board service. Payment will be made in shares or cash (net of withholding taxes), based on the market value of the shares on the date of payment.The amount includes the value of any dividends declared on the shares. We believe this plan further aligns the interests of our directors with the interests of ourshareholders.
Pursuant to our corporate governance guidelines, our directors are required to hold common shares or deferred share units having a value equal to five timestheir annual retainer. Directors have five years to comply with this requirement.
Directors are also reimbursed by the company for reasonable travel and out-of-pocket expenses incurred in connection with their duties as directors.
Performance Graph
The graph below compares the cumulative total shareholder return, assuming reinvestment of dividends, on Cdn$100 invested in our shares on December 31,1998 with the cumulative total return of the S&P/TSX Composite Index and the S&P 500 Composite Stock Index over the same period.
22
Cumulative Value of a Cdn$100 Investment
Years ended December 31 (Cdn$)
Thomsoncommon shares
S&P/TSXComposite
Index
S&P 500Composite
Stock Index
1998 100 100 1001999 108 132 1212000 167 141 1102001 144 124 972002 128 108 762003 149 137 97
Indebtedness of Directors, Executive Officers and Senior Officers
As at March 26, 2004, there was no indebtedness (other than "routine indebtedness" under applicable Canadian securities laws) of the company's officers,directors, employees and former officers, directors and employees to the company or its subsidiaries.
Directors' and Officers' Insurance
Our by-laws indemnify directors and officers against any liability and costs arising out of any action or suit against them from the execution of their duties.The indemnities are subject to the limitations described in the by-laws. We have insurance for the benefit of our directors and officers against any liabilityincurred by them in their capacity as directors or officers, except where the liability relates to a failure to act honestly and in good faith with a view to the bestinterests of our company. In March 2002, we were advised that our premium would rise dramatically in light of our offering and listing of common shares in theUnited States and conditions in the directors' and officers' insurance market generally. At that time we initiated discussions with Woodbridge with a view toobtaining comparable coverage at a lower cost. As a result, we currently maintain standard directors' and officers' insurance of $90 million for each director andofficer, subject to a maximum of $90 million in any year. Woodbridge has agreed to indemnify the insurer for all liability in excess of $15 million, but less than$90 million, in exchange for an annual fee from us of $685,000. Our aggregate cost of directors' and officers' insurance was $1,500,000 for the period from April1, 2003 to March 31, 2004, which includes the $685,000 paid to Woodbridge. Each claim against a director or officer is subject to a deductible of $1,000,000 forthe individual director or officer or directors and officers as a group, except where the indemnification provided for in the by-laws does not apply.
23
Statement of Corporate Governance Practices

Our Governance
Our governance structure is designed to permit our Board to responsibly supervise the management of the business and affairs of our company. The Board'sprincipal responsibilities are strategic planning, risk identification and financial and human resources oversight.
We believe that sustainable value creation for all shareholders, including, in particular, shareholders other than the Thomson family, will be fostered througha Board that is informed and engaged and that functions independently of management.
Responsibility for our governance structure lies, in the first instance, with the corporate governance committee, established in 1994, and more generally withour Board. In light of recent regulatory changes, primarily those arising from the SEC and New York Stock Exchange (NYSE), our corporate governancecommittee undertook a thorough review of our Board practices, other best practices and mandated practices in 2003. This review resulted in the establishment ofcorporate governance guidelines as well as updated charters for our Board committees. Further regulatory changes are anticipated from the Canadian securitiesregulators, whose corporate governance rules are in draft form at the time of printing of this circular. These draft rules contemplate that they would replace theexisting corporate governance guidelines of the Toronto Stock Exchange (TSX). Once new rules are adopted, the Board will re-assess its corporate governancepractices and make any necessary changes.
Our corporate governance guidelines deal with issues such as Board duties and responsibilities, share ownership requirements and conflicts of interest. Theguidelines and committee charters are posted on our website at www.thomson.com.
As part of our governance structure, the Board has ensured that there is in place an appropriate procedure so that inquiries or other communications fromshareholders to management are answered by our investor relations professionals, or referred to an appropriate person in the company.
Board and Committee Composition
The Board believes that its composition and procedures and those of its committees ensure that the Board functions independently of management. OurBoard composition and committee
24
membership are set forth in the table below. Each committee is discussed in more detail below under "Committees."
Auditcommittee
Humanresourcescommittee
Corporategovernancecommittee
Financecommittee
David K.R. Thomson •W. Geoffrey Beattie • • ChairRichard J. Harrington Ron D. Barbaro • • Robert D. Daleo Steven A. Denning Chair John F. Fraser • V. Maureen Kempston Darkes • • Roger L. Martin • Vance K. Opperman Chair David H. Shaffer John M. Thompson • Chair Kenneth R. Thomson Peter J. Thomson Richard M. Thomson • • John A. Tory • •
In 2003, the Board held 11 meetings. One annual Board meeting is devoted to our company's three-year strategic plan. At the conclusion of all Boardmeetings that are held in person, the non-management directors meet as a group. The non-management directors also meet from time to time after Board meetingsthat are held by telephone. The Chairman or Deputy Chairman chairs these sessions and informs management of the substance of the meetings to the extent thataction is required by management.
The Board meets at least once a year at the offices of one of our company's businesses in order to meet operating management and develop a deeperunderstanding of a particular business or market group. In 2003, the Board made site visits to Thomson Learning facilities in the Cincinnati, Ohio area and toThomson Financial's offices in New York.
To facilitate the Board's independence from management, we also have a Secretary to the Board who reports to the Chairman and who also acts as secretaryto each of the committees of the Board.
The Board periodically considers the principal risks facing our company and the steps that our management is taking to monitor and mitigate these risks.
The Board also periodically receives reports on our company's operating activities, as well as reports on certain non-operational matters, including corporategovernance, insurance, pension and treasury matters. We have a secure intranet site for the Board that is used to distribute information and to fostercommunication among directors and between directors and senior management.
A director can retain an outside advisor with the approval of the corporate governance committee. In 2003, a committee of independent directors wasappointed to review a proposed related party transaction and retained advisors who provided information and advice relied on by the independent committee andthe Board in assessing the transaction.
INDEPENDENT DIRECTORS

Our Board has assessed the independence of each of its members. In determining independence, the Board examined and relied on the definition of"independent" in the NYSE rules and "unrelated
25
director" in the TSX Guidelines. After considering a wide variety of factors and information disclosed by each director, our Board determined that of the 16directors, eight are independent.
• Three of the directors, Messrs. Harrington, Daleo and Shaffer, are not independent because they are members of management of Thomson.
• Five directors are either members of the family of Kenneth R. Thomson (Mr. Thomson and his sons, David K.R. Thomson, and Peter J. Thomson),or employees of Woodbridge, the Thomson family's principal holding company, or its affiliates other than our company (W. Geoffrey Beattie andJohn A. Tory). While the Board considers that these directors' interests are fully aligned with the interests of minority shareholders, and that theydo act independently of management, the NYSE rules require that they be considered not independent.
• The independent directors are V. Maureen Kempston Darkes and Messrs. Barbaro, Denning, Fraser, Martin, Opperman, Thompson and RichardM. Thomson. Richard M. Thomson is not related to the family of Kenneth R. Thomson.
For purposes of the TSX Guidelines, all of our directors except for Messrs. Harrington, Daleo and Shaffer are considered to be "unrelated."
The Chairman is not independent by virtue of the Thomson family ownership position. As Chairman, he directs the operations of the Board in such a waythat it operates independently of management. The Chairman is responsible for establishing the agenda for meetings, ensuring that the Board has sufficientresources and information to make decisions in the best interests of all shareholders, and maintaining a constructive relationship between the Board and seniormanagement.
CONTROLLED CORPORATION
The rules of the NYSE require a listed company to have, among other things, a majority of independent directors on its Board and solely independentdirectors on its compensation committee and corporate governance committee. The rules permit a "controlled company" to be exempt from these requirements.
Thomson is controlled by Kenneth R. Thomson, who directly and indirectly controlled approximately 69% of our common shares as of March 17, 2004. TheBoard has determined that it is appropriate to rely upon the controlled company exemption. One-half of our directors are independent of both management andthe controlling shareholder with the result that 50% of the directors independently represent the 31% interest in our company held by shareholders other than theThomson family.
COMMITTEES
Each Board committee operates under a written charter. A thorough review of each committee's charter was undertaken in 2003 and in January 2004, theBoard approved new charters. All of these charters are available on our website at www.thomson.com. The charters will be reviewed annually by the relevantcommittee and the corporate governance committee, which may make recommendations to the Board for changes. Below is a brief description of theresponsibilities of each committee.
AUDIT COMMITTEE. The audit committee is responsible for assisting the Board in fulfilling its oversight responsibilities in relation to the integrity of ourfinancial statements, our compliance with legal and regulatory requirements, the qualifications and independence of our external auditor, the performance of ourinternal audit function and independent auditor, and any additional matters delegated to the audit committee by the Board.
The charter establishes that the audit committee is responsible for the hiring of the external auditor and includes a requirement for direct communicationbetween the committee and the external
26
auditor. The charter also provides that the committee is responsible for overseeing management reporting and internal control systems.
In 2003, the audit committee adopted procedures for the receipt, retention and treatment of any complaints received by our company regarding accounting,internal accounting controls, or auditing matters, as well as the confidential, anonymous submission by our employees of concerns regarding questionableaccounting or auditing matters. These procedures are set forth in our Code of Business Conduct and Ethics, which is discussed below.
The Board has determined that all members of the audit committee are financially literate, as this term is defined in our corporate governance guidelines. Inaddition, the Board has concluded that Richard M. Thomson is qualified as an audit committee financial expert (within the meaning of applicable SEC rules) andthat he has accounting or related financial management expertise (within the meaning of the NYSE's rules).
In recognition of the workload carried by this committee, the remuneration of the chair of the committee and the attendance fees paid to its members wereincreased in 2002.
The members of the audit committee are Vance K. Opperman (Chair), Ron D. Barbaro, Roger L. Martin, John M. Thompson and Richard M. Thomson. TheBoard has determined that all of the committee members are independent. The committee met six times in 2003.
CORPORATE GOVERNANCE COMMITTEE. The corporate governance committee is responsible for assisting the Board in fulfilling its oversightresponsibilities in relation to the size, composition and structure of the Board and its committees, our overall approach to corporate governance, related partytransactions and other matters involving conflicts of interest, orientation and continuing education for directors, director compensation and any additional mattersdelegated to the corporate governance committee by the Board.

The members of the corporate governance committee are John M. Thompson (Chair), Ron D. Barbaro, W. Geoffrey Beattie, John F. Fraser and V. MaureenKempston Darkes. The Board has determined that all of the committee members, except for Mr. Beattie, are independent. The committee met three times in 2003.
HUMAN RESOURCES COMMITTEE. The human resources committee is responsible for assisting the Board in fulfilling its oversight responsibilities in relationto the selection and retention of senior management, the compensation of senior management, professional development for senior management, the managementof pension and benefit plans for employees, and any additional matters delegated to the human resources committee by the Board. These responsibilities includeconsidering policies and procedures for succession planning.
The committee assists the Chairman and Deputy Chairman of the Board in setting objectives each year for the President and Chief Executive Officer. Thecommittee also evaluates the performance of the chief executive officer against those objectives at year-end. The Chairman and Deputy Chairman report to thefull Board on the objectives for the forthcoming year and the performance against objectives in the preceding year. The human resources committee is developinga detailed position description for the President and Chief Executive Officer.
The members of the human resources committee are Steven A. Denning (Chair), W. Geoffrey Beattie, V. Maureen Kempston Darkes, Richard M. Thomsonand John A. Tory. The Board has determined that all of the committee members, except for Messrs. Tory and Beattie, are independent. The committee met threetimes in 2003.
FINANCE COMMITTEE. The finance committee is responsible for considering, and if thought fit, approving matters of a banking or treasury nature within alimited scope, as well as appropriate matters
27
that have been approved in principle by the Board and that require action between regularly scheduled meetings of the Board.
The members of the finance committee are W. Geoffrey Beattie (Chair), David K.R. Thomson and John A. Tory, all of whom are employed by corporationscontrolled by Kenneth R. Thomson.
Assessment Process
Prior to 2004 the performance of the Board and its committees was assessed pursuant to an informal annual process coordinated with the Chairman, DeputyChairman and the corporate governance committee. This year, the corporate governance committee undertook a more structured review process. Questionnairesaddressing the effectiveness of the Board and its committees were developed and completed. The questionnaires addressed issues such as supervision of seniormanagement, strategic planning, risk management, financial reporting, disclosure, governance and conduct of meetings. The individual responses, which areconfidential, were consolidated by the Secretary to the Board and will be reported on to the corporate governance committee and the Board.
Director Qualifications and Board Size
The corporate governance committee is responsible for assessing the need for new directors, and the preferred experience and qualifications of new directors.The committee recommends candidates for initial Board membership and Board members for renomination. Recommendations are based on character, integrity,judgment, business experience, record of achievement and any other skills or talent that would enhance the Board and overall management of the business andaffairs of our company.
The corporate governance committee is responsible for maintaining an understanding of the anticipated tenure of current directors, and the needs of theBoard as a whole. Particular candidates are considered in light of the Board's current and anticipated needs. The Board is currently of the view that its optimalsize for effective decision-making and committee work is 14 to 16 members and that it may need to increase beyond that from time to time in anticipation ofretirements from the Board.
We provide new directors with orientation materials describing the business of our company, its corporate governance structure and related policies andinformation. New directors also have meetings with our chief executive officer, chief financial officer and other senior executives including heads of our majorbusiness groups. Early in their tenure, opportunities are provided to new directors to visit some of our major facilities and meet with operations management.
Director Attendance
Attendance at Board and committee meetings in 2003 averaged 92%.
All directors are expected to attend Board and relevant committee meetings and the annual meeting of shareholders, except where the failure to attend is dueto unavoidable circumstances. All but one member of the Board attended our 2003 annual meeting of shareholders.
Code of Business Conduct and Ethics
In 2003, we adopted a Code of Business Conduct and Ethics that applies to all employees, directors and officers, including our chief executive officer, chieffinancial officer and principal accounting officer. The Code is available on our website at www.thomson.com.
28
Communications with the Board
You may contact our Board or our non-management directors as a group by writing to them c/o Secretary to the Board of Directors, The ThomsonCorporation, Suite 2706, Toronto Dominion Bank Tower, P.O. Box 24, Toronto-Dominion Centre, Toronto, Ontario M5K 1A1 Canada.
Additional Information
Financial information is provided in our comparative consolidated financial statements and management's discussion and analysis (MD&A). You can obtaincopies of these financial statements and our MD&A by contacting us at [email protected]. You will also find these documents and additionalinformation about Thomson at www.thomson.com.
Our other continuous disclosure materials are available on our website, on the Canadian Securities Administrators' website, www.sedar.com, and in theEDGAR section of the SEC's website at www.sec.gov.
Directors' Approval
The contents and sending of this circular to shareholders of the company have been approved by the Board of Directors of the company.
David W. Binet Secretary to the Board of Directors
Toronto, Ontario
April 2, 2004
29
The Thomson Corporation
Metro CenterOne Station PlaceStamford, Connecticut 06902United Statestel 203.539.8000
Suite 2706, Toronto Dominion Bank TowerP.O. Box 24, Toronto-Dominion CentreToronto, Ontario M5K 1A1Canadatel 416.360.8700
www.thomson.com
30
QuickLinks
Exhibit 99.2
Notice of Annual Meeting of Shareholders and Management Information Circular
QuickLinks -- Click here to rapidly navigate through this document
Exhibit 99.3
Computershare Trust Company of Canada9th Floor, 100 University Avenue
Toronto, Ontario M5J 2Y1Facsimile 1-866-249-7775
416-263-9524www.computershare.com
Security Class
Holder Account Number
Please print in ink. Print inCAPITAL letters inside thegrey areas as shown in thisexample.
A B C 1 2 3 X
Form of Proxy—Annual Meeting of Shareholders to be held on Wednesday, May 5, 2004
Roy Thomson Hall, 60 Simcoe Street, Toronto, Ontario, Canada—12:00 p.m., Eastern Daylight TimeNotes to Proxy
1. Every holder has the right to appoint some other person of their choice, who need not be a holder, to attend and act on their behalf at themeeting. If you wish to appoint a person other than the persons whose names are printed herein, please insert the name of your chosenproxyholder in the space provided (see reverse).
2. If the securities are registered in the name of more than one owner (for example, joint ownership, trustees, executors, etc.), then all those registered shouldsign this proxy. If you are voting on behalf of a corporation or another individual, you may be required to provide documentation evidencing your powerto sign this proxy with signing capacity stated.
3. This proxy should be signed in the exact manner as the name appears on the proxy.
4. If this proxy is not dated, it will be deemed to bear the date on which it is mailed by Management to the holder.
5. The securities represented by this proxy will be voted as directed by the holder, however, if such a direction is not made in respect of any matter,this proxy will be voted as recommended by Management.
VOTE USING THE TELEPHONE OR INTERNET 24 HOURS A DAY 7 DAYS A WEEK!
Voting by mail is the only method for holdings held in the name of a corporation or holdings being voted on behalf of another individual.
Voting by mail or by Internet are the only methods by which a holder may appoint a person as proxyholder other than the Management nominees named on thereverse of this proxy. Instead of mailing this proxy, you may choose one of the two voting methods outlined below to vote this proxy. Have this proxy in handwhen you call.
Receive Documents Electronically—You can enroll to receive future securityholder communication electronically, after you vote using the Internet. If you don'tvote online, you can still enroll for this service. Follow the instructions below.
To Vote Using the Telephone (Within Canadaand U.S.)
To Vote Using the Internet To Receive Documents Electronically
• Call the toll free number listed BELOWfrom a touch tone telephone. There isNO CHARGE for this call.
• Go to the following web site:www.computershare.com/ca/proxy
• You can enroll to receive future securityholdercommunication electronically, after you voteusing the Internet. If you don't vote online, youcan still enroll by visitingwww.computershare.com—click "Investors" andthen "Electronic Shareholder Communications".
You will need to provide your HOLDER ACCOUNT NUMBER and PROXYACCESS NUMBER listed below.
If you vote by telephone or the Internet, DO NOT mail or fax back this proxy.
Proxies submitted must be received by Computershare by 5:00 p.m., Eastern Daylight Time, on Monday, May 3, 2004.
THANK YOU
This Form of Proxy is solicited by and on behalf of Management.
Appointment of Proxyholder
I/We being holder(s) of common shares of The ThomsonCorporation hereby appoint: Mr. David K.R. Thomson, or failing him Mr. OR Print the name of the person you are appointing if it is
W. Geoffrey Beattie, or failing himMr. Richard J. Harrington
someone else.
as my/our proxyholder with full power of substitution and to vote in accordance with the following direction (or if no directions have been given, as theproxyholder sees fit) and all other matters that may properly come before the Annual Meeting of Shareholders of Thomson to be held at Roy Thomson Hall, 60Simcoe Street, Toronto, Ontario, Canada on May 5, 2004 at 12:00 p.m., Eastern Daylight Time, and at any adjournment thereof.
1. Election of Directors
For Withhold For Withhold For Withhold
01. Mr. David K.R.Thomson o o 07. Mr. John F. Fraser, O.C. o o 12. Mr. John M. Thompson o o
02. Mr. W. GeoffreyBeattie o o
08. Mrs. V. Maureen Kempston Darkes,O.C. o o 13. Mr. Kenneth R. Thomson o o
03. Mr. Richard J.Harrington o o 09. Mr. Roger L. Martin o o 14. Mr. Peter J. Thomson o o
04. Mr. Ron D. Barbaro o o 10. Mr. Vance K. Opperman o o 15. Mr. Richard M. Thomson, O.C. o o
05. Mr. Robert D. Daleo o o 11. Mr. David H. Shaffer o o 16. Mr. John A. Tory o o
06. Mr. Steven A. Denning o o
2. Appointment of Auditors For Withhold Appointment of PricewaterhouseCoopers LLP as auditors and authorization of the directors to fix theirremuneration o o
Authorized Signature(s)—Sign Here—This section must be completed for your instructions to be executed.
I/We authorize you to act in accordance with my/our instructions set out above. I/We hereby revoke any proxy previously given with respect to the Meeting. If novoting instructions are indicated above, this Proxy will be voted as recommended by Management.
Signature(s) Date - Day Month Year
/ /
Interim Financial Statements Request In accordance with Canadian securities regulations, shareholders mayelect annually to receive interim financial statements, if they so request.If you wish to receive such mailings, please mark your selection.
o Mark this box if you would like to receiveQuarterly Financial Statements by mail.
You can also receive these documents electronically—see reverse for instructions to enroll for electronic delivery.
TOCQ
QuickLinks
Exhibit 99.3

QuickLinks -- Click here to rapidly navigate through this document
Exhibit 99.4
In accordance with Canadian securities regulations, beneficial shareholders may elect annually to receive interim financial statements if they so request. Ifyou wish to receive such mailings, please complete and return this form OR register online at www.computershare.com/ca/mailinglist. Computershare will use theinformation collected solely for the mailing of such financial statements. You may view our Privacy Code online or by requesting that we mail you a copy. Ratherthen receiving financial statements by mail, you may also choose to access them at www.thomson.com.
Conformément à la réglementation sur les valeurs mobilières au Canada, les actionnaires véritables peuvent choisir annuellement de recevoir les étatsfinanciers intermédiaires, s'ils le désirent. Si vous voulez recevoir ces documents annuellement, veuillez remplir ce formulaire et le retourner, OU inscrivez-vousen ligne, à www.computershare.com/ca/mailinglist. Computershare utilisera les renseignements recueillis uniquement aux fins de l'envoi de ces états financiers.Vous pouvez prendre connaissance de notre Code de confidentialité en ligne ou nous demander de vous en faire parvenir un exemplaire par la poste. Plutôt que derecevoir les états financiers par la poste, vous pouvez choisir d'avoir accès à ces documents à www.thomson.com.
Name / Nom
Apt. / App. Street Number / Numéro civique Street Name / Rue
City / Ville Prov. / State Postal Code / Code postal / Zip Code
TOCQ 1 B B N
QuickLinks
Exhibit 99.4