Embed Size (px)
Citation preview
THE THERMAL EMISSION IMAGING SYSTEM (THEMIS) FOR THEMARS 2001 ODYSSEY MISSION
PHILIP R. CHRISTENSEN1∗, BRUCE M. JAKOSKY2, HUGH H. KIEFFER3,MICHAEL C. MALIN4, HARRY Y. MCSWEEN, JR.5, KENNETH NEALSON6,
GREG L. MEHALL7, STEVEN H. SILVERMAN8, STEVEN FERRY8,MICHAEL CAPLINGER4 and MICHAEL RAVINE4
1Department of Geological Sciences, Arizona State University, Tempe, AZ 85287-1404, U.S.A.2Laboratory of Atmospheric and space Physics and Department of Geological Sciences, University
of Colorado, Boulder, CO 80309, U.S.A.3U.S. Geological Survey, Flagstaff, AZ 86001, U.S.A.
4Malin Space Science Systems, San Diego, CA 92121, U.S.A.5Department of Geological Sciences, University of Tennessee, Knoxville, TN 37996-1410, U.S.A.
6Jet Propulsion Laboratory, Pasadena, CA 91006, U.S.A.7Department of Geological Sciences, Arizona State University, Tempe, AZ 85287-1404, U.S.A.
8Raytheon Santa Barbara Remote Sensing, Goleta, CA, U.S.A.(∗Author for correspondence, E-mail: [email protected])
(Received 4 August 2001; Accepted in final form 6 December 2002)
Abstract. The Thermal Emission Imaging System (THEMIS) on 2001 Mars Odyssey will invest-igate the surface mineralogy and physical properties of Mars using multi-spectral thermal-infraredimages in nine wavelengths centered from 6.8 to 14.9 µm, and visible/near-infrared images in fivebands centered from 0.42 to 0.86 µm. THEMIS will map the entire planet in both day and nightmulti-spectral infrared images at 100-m per pixel resolution, 60% of the planet in one-band visibleimages at 18-m per pixel, and several percent of the planet in 5-band visible color. Most geologic ma-terials, including carbonates, silicates, sulfates, phosphates, and hydroxides have strong fundamentalvibrational absorption bands in the thermal-infrared spectral region that provide diagnostic inform-ation on mineral composition. The ability to identify a wide range of minerals allows key aqueousminerals, such as carbonates and hydrothermal silica, to be placed into their proper geologic context.The specific objectives of this investigation are to: (1) determine the mineralogy and petrology oflocalized deposits associated with hydrothermal or sub-aqueous environments, and to identify futurelanding sites likely to represent these environments; (2) search for thermal anomalies associatedwith active sub-surface hydrothermal systems; (3) study small-scale geologic processes and landingsite characteristics using morphologic and thermophysical properties; and (4) investigate polar capprocesses at all seasons. THEMIS follows the Mars Global Surveyor Thermal Emission Spectro-meter (TES) and Mars Orbiter Camera (MOC) experiments, providing substantially higher spatialresolution IR multi-spectral images to complement TES hyperspectral (143-band) global mapping,and regional visible imaging at scales intermediate between the Viking and MOC cameras.
The THEMIS uses an uncooled microbolometer detector array for the IR focal plane. The opticsconsists of all-reflective, three-mirror anastigmat telescope with a 12-cm effective aperture and aspeed of f/1.6. The IR and visible cameras share the optics and housing, but have independent powerand data interfaces to the spacecraft. The IR focal plane has 320 cross-track pixels and 240 down-track pixels covered by 10 ∼1-µm-bandwidth strip filters in nine different wavelengths. The visiblecamera has a 1024 × 1024 pixel array with 5 filters. The instrument weighs 11.2 kg, is 29 cm by37 cm by 55 cm in size, and consumes an orbital average power of 14 W.
Space Science Reviews 110: 85–130, 2004.© 2004 Kluwer Academic Publishers. Printed in the Netherlands.
86 P.R. CHRISTENSEN ET AL.
1. Introduction
A major goal of the Mars Exploration Program is to obtain data that will helpdetermine whether life ever existed on Mars. This goal will ultimately be addressedvia detailed in situ studies and eventual return to the Earth of samples of the martiansurface. It is therefore essential to identify future landing sites with the highestprobability of containing samples indicative of early pre-biotic or biotic envir-onments. Of particular interest are aqueous and/or hydrothermal environments inwhich life could have existed, or regions of current near-surface water and/or heatsources [Exobiology Working Group, 1995]. The search for these environmentsrequires detailed geologic mapping of key sites and accurate interpretations of thecomposition and history of these sites in a global context.
The Thermal Emission Imaging System (THEMIS) will contribute to thesegoals through the global mapping of unique compositional units and the identi-fication of key minerals and rock types. This mapping will be accomplished atspatial scales that permit mineral and rock distributions to be related to the geologicprocesses and history of Mars. The specific objectives of the THEMIS investigationare to: (1) determine the mineralogy of localized deposits associated with hydro-thermal or sub-aqueous environments, and to identify future landing sites likely torepresent these environments; (2) search for pre-dawn thermal anomalies associ-ated with active sub-surface hydrothermal systems; (3) study small-scale geologicprocesses and landing site characteristics using morphologic and thermophysicalproperties; (4) investigate polar cap processes at all seasons using infrared ob-servations at high spatial resolution; and (5) provide a direct link to the globalhyperspectral mineral mapping from the Mars Global Surveyor (MGS) ThermalEmission Spectrometer (TES) investigation by utilizing a significant portion of theinfrared spectral region at high (100 m per pixel) spatial resolution.
These objectives will be addressed using thermal infrared (6.3–15.3 µm) multi-spectral observations in nine wavelengths at 100-m per pixel spatial resolution,together with 18-m per pixel visible imagery in up to five colors. The thermal-infrared spectral region was selected for mineral mapping because virtually allgeologic materials, including carbonates, hydrothermal silica, sulfates, phosphates,hydroxides, and silicates have fundamental infrared absorption bands that are dia-gnostic of mineral composition. THEMIS visible imaging provides regional cov-erage (with global coverage a goal) at spatial scales that are intermediate betweenthose of Viking and the detailed views from the MGS Mars Orbiter Camera (MOC)(Malin and Edgett, 2001).
THEMIS builds upon a wealth of data form previous experiments, including theMariner 6/7 Infrared Spectrometer (Pimentel et al., 1974) the Mariner 9 InfraredInterferometer Spectrometer (IRIS) (Hanel et al., 1972; Conrath et al., 1973), theViking Infrared Thermal Mapper (IRTM) (Kieffer et al., 1977), the Phobos Termo-scan (Selivanov et al., 1989), the MGS TES (Christensen et al., 2001a; Smith et al.,2001c; Bandfield et al., 2000a; Christensen et al., 2000b, 2001b), and the MGS
THERMAL EMISSION IMAGING 87
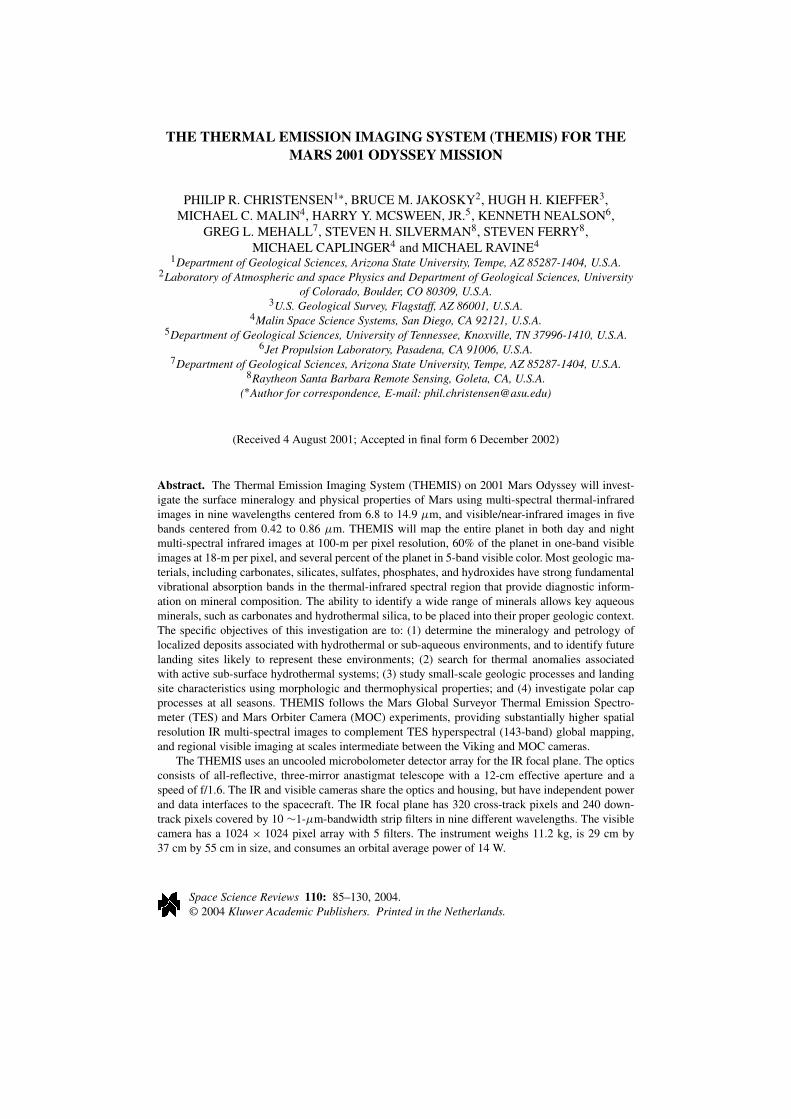
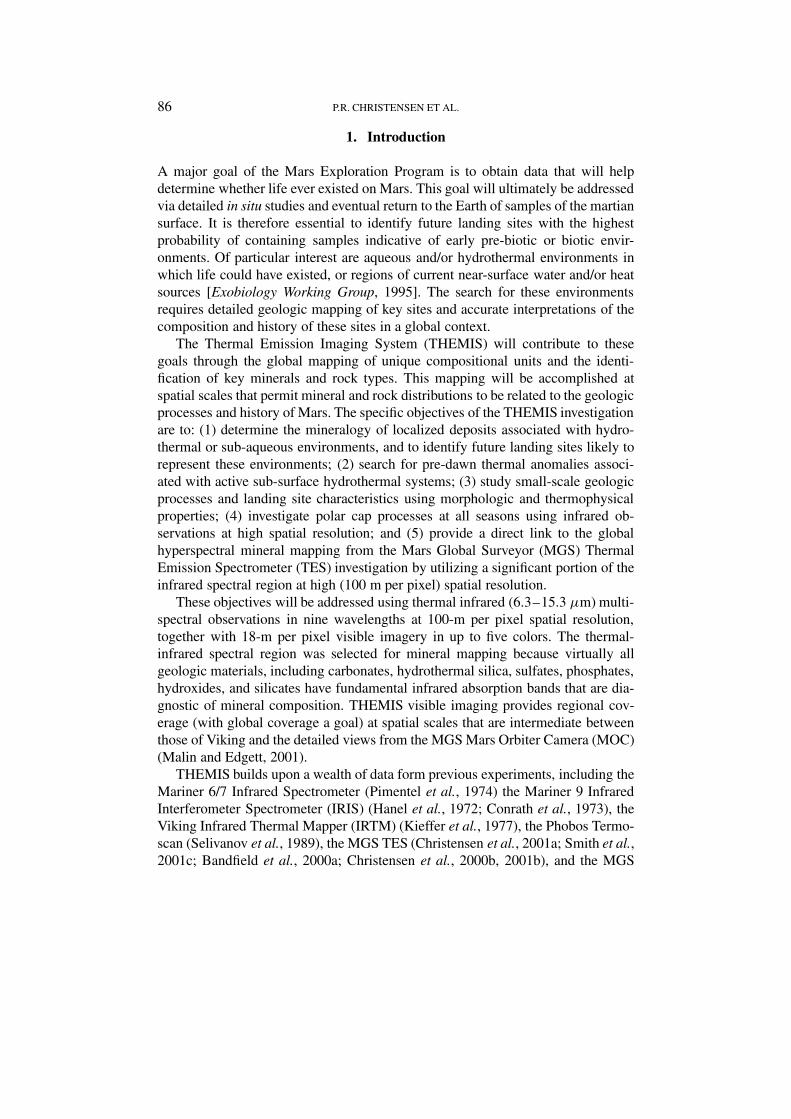
Figure 1. TES mineral map of the Syrtis Major region of Mars. The fraction of the surface coveredby basalt is shown as derived from deconvolution of TES spectra. Data are from Bandfield et al.(2000). (a) Regional view. Black region is area shown in Figure 1b. (b) 60 km × 60 km region atTES resolution.
MOC (Malin and Edgett, 2001). In particular, the TES instrument has collectedhyperspectral images (143 and 286 spectral bands) of the entire martian surface atwavelengths from 6 to 50 micrometers, providing an initial global reconnaissanceof mineralogy and thermophysical properties (Christensen et al., 2000b, d, 2001a;Bandfield et al., 2000a; Bandfield, 2002; Ruff and Christensen, 2002; Jakoskyet al., 2000; Mellon et al., 2000). By covering the key 6.3 to 15.0 µm region inboth instruments it is possible to combine the high spectral resolution of TES withthe high spatial resolution of THEMIS to achieve the goals of a global mineralogicinventory at the spatial scales necessary for detailed geologic studies within theOdyssey data resources.
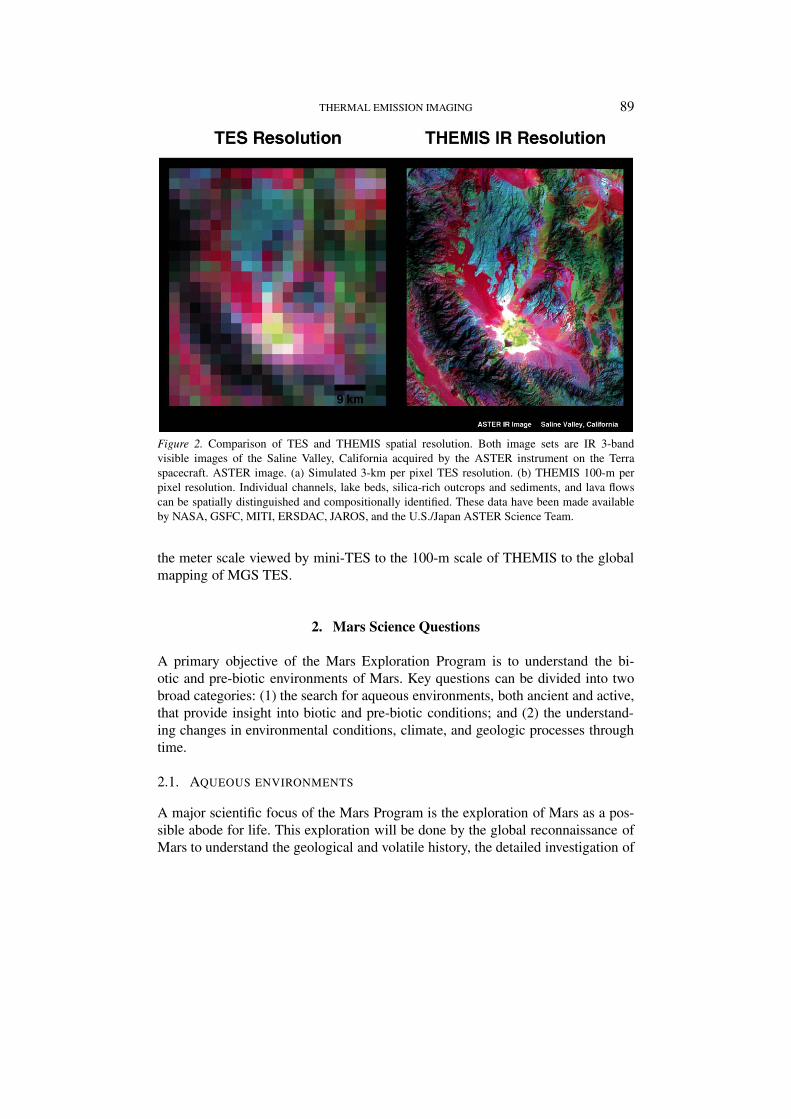
Figure 1 shows a basalt abundance map derived from TES data of a regionof Mars centered on Syrtis Major, illustrating the global-scale reconnaissance ob-tained from TES. Figure 1b shows a 60 km × 60 km region within Syrtis Major.Figure 2a shows an orbital infrared image of a 60 by 60 km area on Earth, degradedto 3 km per pixel. Figure 2b shows the same scene at 100-m per pixel THEMIS
88 P.R. CHRISTENSEN ET AL.
Figure 1. Continued.
resolution. Comparison of scenes at TES and THEMIS resolutions illustrates thedramatic improvement in geologic unit discrimination that is possible at THEMISspatial resolution, and the difficulties encountered in attempting detailed studiesfor geologic interpretation and landing site selection using TES data alone. AtTHEMIS scale, terrestrial lake beds, hydrothermally altered zones, carbonate out-crops, silica-rich rocks, channel floors, and other indications of ancient aqueousenvironments can be readily identified and mapped using multi-spectral IR images.THEMIS can provide similar detection of such systems on Mars, if they are presentat similar scales and exposed at the surface.
THEMIS data will be used to identify and map sites for future rovers andsample- return missions, beginning with the Mars 2003 Rovers, by aiding in theevaluation of the science rationale, hazards (e.g. rocks and dust), and morphologyof these sites. These data will also provide information to adjust the exact locationof the landing ellipses to maximize the science return, plan the ’03 Rover traverses,and aid in the extrapolation of the Rover results. The Rover payloads contain mini-ature versions of the MGS TES instrument (Silverman et al., 1999) covering theTHEMIS spectral region. If both the Miniature-TES and THEMIS (and possiblyTES) instruments are operating simultaneously, there will be a powerful link from
THERMAL EMISSION IMAGING 89
Figure 2. Comparison of TES and THEMIS spatial resolution. Both image sets are IR 3-bandvisible images of the Saline Valley, California acquired by the ASTER instrument on the Terraspacecraft. ASTER image. (a) Simulated 3-km per pixel TES resolution. (b) THEMIS 100-m perpixel resolution. Individual channels, lake beds, silica-rich outcrops and sediments, and lava flowscan be spatially distinguished and compositionally identified. These data have been made availableby NASA, GSFC, MITI, ERSDAC, JAROS, and the U.S./Japan ASTER Science Team.
the meter scale viewed by mini-TES to the 100-m scale of THEMIS to the globalmapping of MGS TES.
2. Mars Science Questions
A primary objective of the Mars Exploration Program is to understand the bi-otic and pre-biotic environments of Mars. Key questions can be divided into twobroad categories: (1) the search for aqueous environments, both ancient and active,that provide insight into biotic and pre-biotic conditions; and (2) the understand-ing changes in environmental conditions, climate, and geologic processes throughtime.
2.1. AQUEOUS ENVIRONMENTS
A major scientific focus of the Mars Program is the exploration of Mars as a pos-sible abode for life. This exploration will be done by the global reconnaissance ofMars to understand the geological and volatile history, the detailed investigation of
90 P.R. CHRISTENSEN ET AL.
sites of exobiological interest, and the in-depth in situ exploration of some of thesesites using rovers, culminating in the return of samples from one or more sites.
Although there is much that we do not know about the origin of life, the ne-cessary environmental conditions appear to consist of: (i) the presence of liquidwater, as a medium of transport for nutrients and waste products; (ii) the presenceof the biogenic elements, consisting of C, H, O, N, S, P, Ca, Fe, and other traceelements that participate in life; and (iii) a source of energy that can drive chemicaldisequilibrium, so that the ‘slide’ back towards equilibrium can drive biochemicalreactions (e.g., Jakosky, 1998). Mars appears to have (or have had) all of theseingredients:
(i) Evidence for liquid water is widespread on Mars (e.g. Carr, 1996). The an-cient, heavily cratered surfaces (older than about 3.5 b.y.) are dissected by valleynetworks; the role of liquid water in their formation is clear, even though the exactmechanism of formation is being debated (Malin and Carr, 1999). In addition, therehas been dramatic sedimentation and erosion on these surfaces, evidenced by thepresence of extensive layered deposits (Malin and Edgett, 2000), the distributionof small impact craters, and the severe degradation of larger craters (e.g. Craddockand Maxwell, 1993; Craddock et al., 1997). The high deposition and erosion rates,the catastrophic outflow channels, and the presence of morphological features suchas layers and gullies in partly eroded craters, can best be explained by liquid water(e.g. Carr, 1996). Apparently, water was more stable and abundant near the surfaceof early Mars than it is today.
(ii) Mars appears to have all of the biogenic elements readily accessible at thesurface or in the crust. This is not surprising given the active geological environ-ment that has existed for 4 b.y. In particular, carbon is present in the atmospherein a readily usable form (CO2) that also can dissolve in water and percolate intothe crust. In addition, in situ measurements from the Viking and Pathfinder landers,together with studies of the martian meteorites, indicate the presence of all of theother elements necessary to support life (e.g. McSween, 1994; Bell et al., 2000).
(iii) Volcanism has occurred on Mars throughout time, and can provide a readysource of easily accessed geothermal energy. On Earth, volcanic heat is tapped bythe circulation of water through hydrothermal systems. As the water is releasedback to the surface, chemical potential drives the formation of organic moleculesthat can serve as a reducing agent to do useful work (Shock, 1997). Such hydro-thermal systems may have served as the location for the terrestrial origin of life,and may have been widespread on Mars given the abundant volcanism and crustalwater (Jakosky and Shock, 1998).
Among the most likely sites to search for life are regions where liquid waterwas present for substantial periods of time. A great deal of work has been doneto define the characteristics of such sites and to identify the environments that areconducive both to the sustenance of life and to the preservation of evidence ofthis life (McKay et al., 1996; Boston et al., 1992; Walter and Des Marais, 1993).Lacustrine sediments have been identified as logical targets both as evidence of an

THERMAL EMISSION IMAGING 91
aqueous environment and because fossils are often preserved there. A second highpriority target would be ancient thermal springs, where life could have existed andbe well preserved in unique, remotely identifiable mineral deposits (Walter and DesMarais, 1993).
The characteristics of terrestrial spring deposits provide a context in which tosearch for similar martian deposits. These deposits derive from the intense hydro-thermal weathering of the country rock. Silica, in the form of amorphous silica,quartz, chalcedony, and opaline silica, is the most common precipitate formed involcanic terrains (Ellis and McMahon, 1977), due to both the high solubility ofsilica in hot water and the rapid decrease in solubility with decreasing temperature.Silica is also an excellent preservation media and is an ideal candidate site in thesearch for ancient life on Mars (Walter and Des Marais, 1993). Silica-depositingsprings are abundant in a wide range of volcanic compositions on Earth, occurringin both rhyolitic (e.g., Yellowstone) and basaltic (e.g., Iceland) regions (Brock,1978). The Yellowstone region is an excellent example of a THEMIS target. Itcontains ∼ 3,000 springs spread over an 80 by 100 km area, with zones of intensehydrothermal alteration up to several km in size (White et al., 1988).
Calcium carbonate deposits (travertine) are also common in hydrothermal sys-tems. Hydrothermal travertine forms by degassing of hot (∼60–100 ◦C) Ca- andCO2-rich groundwater, followed by precipitation of calcium carbonate (Ellis andMcMahon, 1977; Pentecost, 1996). Studies of travertine have indicated the com-mon presence of organic material, including microfossils (Pentecost, 1996; Bargar,1978).
An additional location to search for evidence of life would be deep beneath thesurface, where martian biota might survive (and perhaps even thrive) in much thesame way that some deep-subsurface bacteria thrive on the Earth–by metabolizinghydrogen produced by interactions between water and basalt in the pore spaces ofthe rock (Stevens and McKinley, 1995). Such locales on Mars might be observablein the walls of Valles Marineris, for example, where there is up to 10 km of verticalexposure of rock that were previously buried.
2.2. SURFACE MORPHOLOGY AND THE EVOLUTION OF CLIMATE
2.2.1. Aqueous Environments and MorphologyAqueous environments can be distinguished by a variety of unique morphologicfeatures. These include flow indicators, such as streamlined depositional or erosionfeatures, layered sediments, strand lines, and delta deposits. These features can bedetected with 18 m resolution, as demonstrated by the correlation between pre-dictions for the Pathfinder site based on 38 m Viking Orbiter imagery (Golombeket al., 1997) and the actual Pathfinder surface observations. Paleohydrology will bestudied using images of the sequence of sediments deposited by various stagesof fluvial processes. These will include variations in flow hydraulics, sedimenttransport characteristics, and the properties and distribution of deposits (Komatsu
92 P.R. CHRISTENSEN ET AL.
and Baker, 1997). The visible images also provide excellent context images for the100-m multi-spectral IR and nighttime temperature images, allowing the distribu-tion of compositionally unique outcrops, deposits, or disseminated materials to beinterpreted in relationship to the landscape processes.
2.2.2. Aeolian Sediments and MorphologySedimentary deposits on Mars range from micron thick dust coatings to km-thickunits of layered sediments from the equator (e.g. Tanaka and Leonard, 1995; Tanaka,1997; Malin and Edgett, 2000) to the poles (Herkenhoff and Murray, 1990b; Thomaset al., 1992). Transport has been important in moving material for much of Mars’history and the transport has been global in scale. Deciphering the materials andstratigraphy of the wide variety of sedimentary deposits on Mars is crucial to un-derstanding the geological influences of climate on Mars and the relationship ofcurrent processes to past ones.
Transport of sediments in the current climate is presently dominated by Hadleycirculation in southern summer (Thomas and Gierasch, 1995; Greeley et al., 1992).Many dune deposits, wind streaks, and other deposits of likely aeolian (or possiblylacustrine) origin occur. A primary goal of any study of such deposits is the searchfor compositional or morphologic clues to their origin, transport, and deposition. Amajor question exists as to the origin and depositional environments of older sedi-mentary rocks. Multi-spectral IR, nighttime temperature, and visible observationswill be used to map the morphologies, compositional units, and physical propertiesin key areas identified from earlier missions.
The polar deposits, thought to be climatically sensitive because of their as-sociation with frost deposition, include at least two non-volatile components asindicated by Viking Orbiter color data (Herkenhoff and Murray, 1990a; Thomasand Weitz, 1989). The layered deposits appear to reflect cycles of deposition anderosion on a variety of time scales, and their overall extent has been reduced frompreviously larger deposits (Thomas et al., 1992). Coverage of selected areas of thelayered deposits, chasmata, deposits marginal to the layered deposits, and polardunes with up to 14 visible and IR filters will provide discrimination of surfaceunits beyond what is possible using Viking images, TES 5-km resolution spectra,and MOC panchromatic images. The additional compositional and particle texturediscrimination available in the infrared and color image will improve the ability todiscriminate and interpret spectrally distinct surface units. A spatial resolution of18 meters per pixel permits local morphology to be associated with compositionalunits. This is particularly useful in relating materials exposed on dunes and windstreaks to current wind regimes, and relating morphologies to source areas, andin examining small-scale features thought to be related to seasonal frost cycling(Thomas et al., 2000).
THERMAL EMISSION IMAGING 93
2.2.3. Craters as Stratigraphic ProbesIn addition to layered materials revealed by erosion in crater interior deposits,canyon walls, along faults, and in the polar deposits, additional stratigraphic in-formation can be gleaned from morphological and compositional studies of impactcraters. The interior walls of such craters often reveal the layering of the materialsthat were impacted, while the ejecta blankets show radial compositional gradationsreflecting the inversion of stratigraphy in the ejecta (e.g. Shoemaker, 1963). Thevisible and IR observations can be combined with spatial studies (i.e., observationsof nearby craters of similar size) to trace subsurface composition and structure.
2.3. TEMPERATURE ANOMALIES
The Mars Odyssey orbit is ideally suited for the detection of pre-dawn temperatureanomalies not associated with solar heating. Multi-spectral temperature maps witha noise-equivalent delta temperature (NE�T) of 1 K will be produced for theentire planet. These data will allow identification of sites of active hydrothermalsystems and potential near-surface igneous activity using the spatial distribution oftemperature differences (e.g., along linear zones) to distinguish them from physicalproperties such as rock abundance. The discovery of active systems would radicallyalter our current models of the near- surface environment, and we will undertake anexploration for temperature anomalies using pre-dawn temperature measurements.
Regions to be mapped for thermal anomalies will initially focus on young vol-canic sites, where mobilization of ground ice would result from intrusive or ex-trusive volcanic activity. Although it may be unlikely that thermal anomalies arepresent, their detection would so heavily influence future sampling strategies thata search for them is of high priority.
2.4. POLAR PROCESSES
The two volatiles that are key to understanding Mars climate and evolution areCO2, as the major agent for transport and storage of energy, and H2O, as an im-portant geomorphic agent. Models of their physical properties, their sublimation,and their seasonal behavior have been developed which agree with the generalfeatures of existing observations, and allow some extrapolation into the past (e.g.Davies et al., 1977; Kieffer, 1979, 1990; James and North, 1982; Haberle andJakosky, 1990; Kieffer and Zent, 1992; Kieffer et al., 2000). At present, however,our understanding of the martian poles is sufficiently incomplete to prevent detailedmodeling and predictions of volatile behavior in either time or space. Several geo-physical processes remain to be fully understood, such as the origin and seasonalbehavior of unusual ‘Cryptic’ regions (Kieffer et al., 2000), the complex physicalnature of the polar ices (Kieffer et al., 2000; Titus et al., 2001), the incorporation ofdust and water ice into the seasonal polar caps, the influence of suspended aerosolson the radiation balance over the winter cap (e.g. Paige and Ingersoll, 1985) andthe processes which cause the major polar outliers.
94 P.R. CHRISTENSEN ET AL.
The THEMIS investigation will address a variety of polar cap processes usingmoderate spectral and spatial resolution observations. Specific questions include:(1) what is the spatial and seasonal variation of polar condensates? (2) what pro-duces the observed differences in the physical state of the surface condensates (e.g.the south polar Cryptic region (Kieffer et al., 2000)); (3) what is the energy balancein the cap-atmosphere system? (4) what is the role of dust in influencing the surfacefrost accumulation and sublimation? and (5) what is the abundance and variabilityof atmospheric dust over the polar caps?
2.5. ATMOSPHERIC TEMPERATURE AND OPACITY
A range of atmospheric properties will be addressed by the THEMIS experiment,including: (1) the abundance and distribution of atmospheric dust, (2) the distri-bution and condensate abundance of H2O clouds; and (3) the atmospheric temper-ature, which will be used to study atmospheric dynamics. THEMIS extends thesystematic monitoring of temperature, dust, and water-ice clouds in the martianatmosphere begun by the Mariner 9 IRIS (Conrath et al., 1973), Viking IRTM(Kieffer et al., 1977; Martin, 1986), and TES investigations (Conrath et al., 2000;Smith et al., 2001a, 2002; Pearl et al., 2001). The THEMIS instrument is greatlylimited in its ability to map the vertical distribution of temperature and to observewater vapor relative to the TES. THEMIS does, however, provide observations sim-ilar to IRTM for the mapping of temperature (Kieffer et al., 1977), ice (Christensenand Zurek, 1984; Tamppari et al., 2000), and dust (Martin, 1986) and will extendthe detailed year-to-year climate record begun by the MGS TES.
3. Thermal Infrared Remote Sensing
3.1. THERMAL INFRARED EMISSION SPECTROSCOPY
3.1.1. OverviewSurface composition can be determined remotely by two basic types of opticalspectroscopy: (1) moderate-energy electronic spectroscopy, which samples the elec-tron cloud surrounding the nucleus; and (2) low-energy vibrational spectroscopy,which samples bound atoms within a crystal structure.
Electronic transitions occur when a bound electron absorbs an incoming photonand transitions to a higher energy state. These energy states are quantized and varywith atomic composition and crystal structure, thus providing diagnostic informa-tion about the elemental and crystal structure. The transition metals, of which ironis common, have electronic transitions that occur in the visible and infrared (e.g.Burns, 1993), and visible and near-IR observations provide an excellent means forstudying Fe-bearing minerals (McCord et al., 1982; Singer, 1982; Morris et al.,1990; Clark et al., 1990; Bell et al., 1990; Mustard et al., 1993; Mustard andSunshine, 1995).

THERMAL EMISSION IMAGING 95
Figure 3. Thermal emission spectra of major mineral classes. These representative spectra showthe significant differences in the fundamental vibrational bands between different mineral groups.Individual spectra have been offset and scaled for clarity. The band depths in these coarse particu-late mineral samples have a band depth (emissivity minima) relative to the nearby local emissivitymaxima of 0.2 to 0.6.
Vibrational spectroscopy is based on the principle that vibrational motions oc-cur within a crystal lattice at frequencies that are directly related to the crystalstructure and elemental composition (i.e. mineralogy) (e.g. Wilson et al., 1955;Farmer, 1974). The fundamental frequencies of geologic materials typically cor-respond to wavelengths greater than ∼ 5 µm, and provide a diagnostic tool foridentifying virtually all minerals.
An extensive suite of studies over the past 35 years has demonstrated the utilityof vibrational spectroscopy for the quantitative determination of mineralogy andpetrology (e.g. Lyon, 1962; Lazerev, 1972; Vincent and Thompson, 1972; Farmer,1974; Hunt and Salisbury, 1976; Salisbury et al., 1987a, b, 1991; Salisbury andWalter, 1989; Bartholomew et al., 1989; Salisbury, 1993; Christensen and Har-rison, 1993; Lane and Christensen, 1997; Feely and Christensen, 1999; Christensenet al., 2000a; Hamilton, 2000; Hamilton and Christensen, 2000; Wyatt et al., 2001;Hamilton et al., 2001). The fundamental vibrations within different anion groups,such as CO3, SO4, PO4, and SiO4, produce unique, well separated spectral bands

96 P.R. CHRISTENSEN ET AL.
Figure 4. Thermal emission spectra of key minerals. Representative hydrothermal and aqueous min-erals are shown, along with examples of the major volcanic-rock forming minerals. Individual spectrahave been offset and scaled for clarity.
that allow carbonates, sulfates, phosphates, silicates, and hydroxides to be readilyidentified (Figure 3). Additional stretching and bending modes involving majorcations, such as Mg, Fe, Ca, and Na, allow further mineral identification, such asthe excellent discriminability of minerals within the silicate and carbonate groups(Figure 4). Significant progress also has been made in the development of quantitat-ive models to predict and interpret the vibrational spectra produced by emission ofenergy from complex, natural surfaces (e.g. Conel, 1969; Henderson et al., 1992;Hapke, 1993; Salisbury et al., 1994; Moersch and Christensen, 1995; Wald andSalisbury, 1995; Mustard and Hays, 1997).
The fundamental vibrations of geologic materials typically occur between ∼ 6and 100 µm. In addition to these modes, overtone and combination vibrations, suchas the 2.35 µm (3ν3) and 2.55 µm (ν1+2ν3) combination tones in carbonates (Gaf-fey, 1984) and the 4.5 µm (2ν3) overtone in sulfate (Blaney and McCord, 1995),also occur. These vibrations typically occur between ∼ 2 and ∼ 6 µm (Roush et al.,1993). While they also contain important diagnostic information, these modesare typically much less populated than the fundamental vibrations (Wilson et al.,
THERMAL EMISSION IMAGING 97
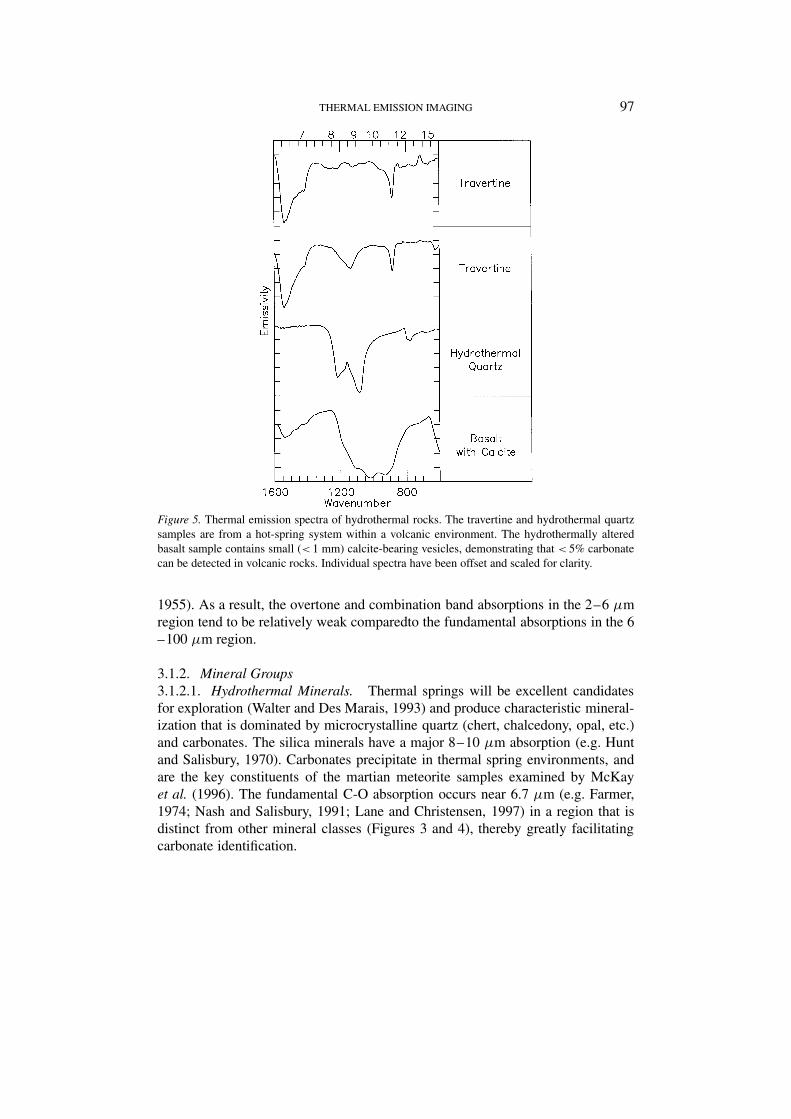
Figure 5. Thermal emission spectra of hydrothermal rocks. The travertine and hydrothermal quartzsamples are from a hot-spring system within a volcanic environment. The hydrothermally alteredbasalt sample contains small (< 1 mm) calcite-bearing vesicles, demonstrating that < 5% carbonatecan be detected in volcanic rocks. Individual spectra have been offset and scaled for clarity.
1955). As a result, the overtone and combination band absorptions in the 2–6 µmregion tend to be relatively weak comparedto the fundamental absorptions in the 6–100 µm region.
3.1.2. Mineral Groups3.1.2.1. Hydrothermal Minerals. Thermal springs will be excellent candidatesfor exploration (Walter and Des Marais, 1993) and produce characteristic mineral-ization that is dominated by microcrystalline quartz (chert, chalcedony, opal, etc.)and carbonates. The silica minerals have a major 8–10 µm absorption (e.g. Huntand Salisbury, 1970). Carbonates precipitate in thermal spring environments, andare the key constituents of the martian meteorite samples examined by McKayet al. (1996). The fundamental C-O absorption occurs near 6.7 µm (e.g. Farmer,1974; Nash and Salisbury, 1991; Lane and Christensen, 1997) in a region that isdistinct from other mineral classes (Figures 3 and 4), thereby greatly facilitatingcarbonate identification.
98 P.R. CHRISTENSEN ET AL.
Figure 5 shows laboratory thermal emission spectra of travertine and hydro-thermal silica samples collected from the Castle Hot Springs Volcanic Field ofcentral Arizona. The distinctive spectral character of both types of hydrothermaldeposits in the thermal infrared are apparent. Travertine samples are characterizedby the broad absorption features typical of carbonates (calcite). The hydrothermalsilica spectrum clearly exhibits the major absorption features typical of quartz.The basalt sample is an excellent analog for hydrothermal alteration on Mars. Itcontains small (< 1 mm) calcite-bearing vesicles and veins, similar to those foundin the SNC sample ALH84001 (McKay et al., 1996). The spectrum of this rockdemonstrates that a small amount of carbonate (< 5%) can be detected in volcanicrocks using thermal-IR spectra.
3.1.2.2. Evaporite Minerals. This broad class of minerals includes the followingimportant groups: carbonates, sulfates, chlorides, and phosphates that are precipit-ated by the evaporation of marine or nonmarine waters. As such, they are the mostobvious and direct mineralogical evidence for standing water. In the search forcandidate sites for sample return, locating evaporite minerals is a high priority. Theabundance of any one of these minerals in an evaporite basin is a function of thedissolved chemical constituents contained in the water as well as the history of thebasin inundation/denudation. Therefore, the identification and quantification of thedifferent evaporite minerals can yield information about the environment in whichthey were produced. Thermal-infrared spectra provide distinguishing characterist-ics for the different groups. Sulfates (gypsum) and phosphates (apatite) have deep,well-defined features in the 8.3 to 10 µm region that vary with position based oncomposition (Figure 4).
3.1.2.3. Hydrous Silicates. Minerals that incorporate hydroxyl (OH)- anions intotheir structure give clues about the availability of water during their formation.The majority of such minerals occur in the silicate class and most of these are inthe phyllosilicate group. Within the phyllosilicates, the clay, mica, serpentine, andchlorite groups are all important. Serpentine minerals form through the activityof H2O and ultramafic igneous rocks, so they may provide additional evidence ofhydrothermal activity on Mars. Though all the hydrous silicates have the hydroxylanion as their common trait, they range widely in their mode of occurrence. Someform as primary constituents of igneous rocks, giving clues about the magmaticconditions under which the rock was formed. Most hydrous silicates crystallizeas secondary products of metamorphism and hydrothermal alteration and theircomposition provides insight into the pressure and temperature where they formed.Thus, the hydrous silicates serve as excellent pathfinder minerals for hydrous activ-ity. All have characteristic mid-IR features (e.g. Figure 4) due to fundamentalbending modes of (OH)− attached to various metal ions, such as an AL-O-H bend-ing mode near 11 µm in kaolinite clay (e.g. Farmer, 1974; Van der Marel andBeeutelspacher, 1976).

THERMAL EMISSION IMAGING 99
3.1.2.4. Igneous Silicates. The primary silicate minerals associated with igneousrocks are the most abundant mineral class found on Mars (Christensen et al., 2000b,2001a; Bandfield et al., 2000a; Bandfield, 2002). The majority of martian rockslikely will vary by only relatively subtle differences in bulk mineralogy, represen-ted by the common rock forming minerals. An ability to distinguish and quantifyolivines, pyroxenes, and feldspars is crucial to describing the geological characterof the planet. Without this overview, the locations of hydrous activity are withoutcontext. All silicates have Si-O stretching modes between 8 and 12 µm that varyin position with mineral structure (e.g. Figure 4). This absorption shifts to higherfrequency (shorter wavelength) as bond strength increases for isolated, chain, sheet,and framework tetrahedron structure. These shifts allow for detailed identificationof the igneous silicates, including variations within the solid solution series.
3.1.3. Quantitative Analysis of IR SpectraA key strength of mid-infrared spectroscopy for quantitative mineral mapping liesin the fact that mid-infrared spectra of mixtures are linear combinations of theindividual components (Thomson and Salisbury, 1993; Ramsey, 1996; Feely andChristensen, 1999; Hamilton and Christensen, 2000). The mid-IR fundamental vi-bration bands have very high absorption coefficients and therefore much of theemitted energy only interacts with a single grain. When absorption coefficientsare low, as is the case for overtone/combination bands, the energy is transmittedthrough numerous grains and the spectra become complex, non-linear combina-tions of the spectral properties of the mixture. The linear nature of the thermalspectral emission of mineral mixtures has been demonstrated experimentally inparticulates for mixtures of up to five components (Thomson and Salisbury, 1993;Ramsey, 1996). In these experiments the mineral abundance could be quantitativelyretrieved using linear deconvolution techniques to within 5% on average. The linearmixing of mineral components in rock spectra has also been confirmed (Feely andChristensen, 1999; Hamilton and Christensen, 2000; Wyatt et al., 2001; Hamiltonet al., 2001), with retrieved mineral abundances that are accurate to 5–10% inlaboratory spectra.
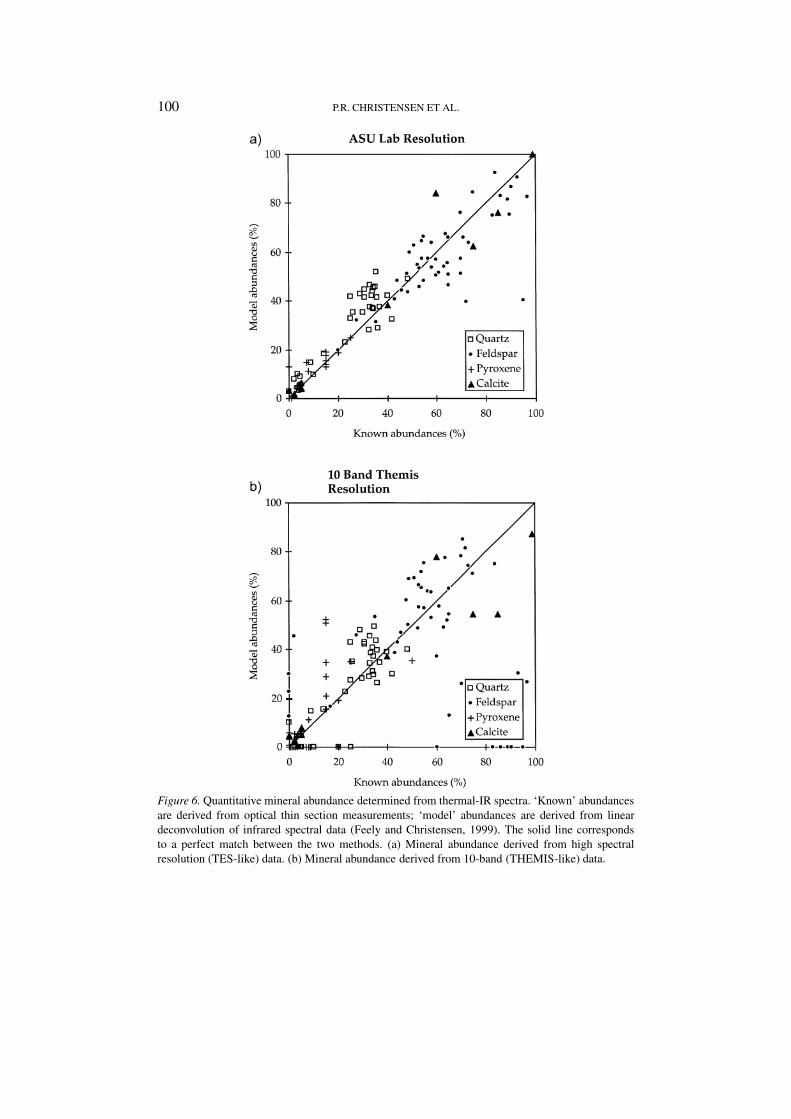
The successful determination of mineral composition and abundance is illus-trated in Figure 6. Mineral composition and abundance were determined both spec-troscopically and using traditional thin-section techniques for a suite of 96 igneousand metamorphic rocks (Feely and Christensen, 1999). The rocks were used intheir original condition; no sample cutting, polishing, or powdering was performed,and weathered surfaces were observed where available to best simulate remoteobservations. Comparison of the mineral abundances determined spectroscopic-ally with the petrographically estimated modes for each sample gave an excellentagreement using high-resolution data (Figure 6a). The spectroscopically determ-ined compositions matched the petrologic results to within 8–14% for quartz,carbonates, feldspar, pyroxene, hornblende, micas, olivine, and garnets. These val-
100 P.R. CHRISTENSEN ET AL.
Figure 6. Quantitative mineral abundance determined from thermal-IR spectra. ‘Known’ abundancesare derived from optical thin section measurements; ‘model’ abundances are derived from lineardeconvolution of infrared spectral data (Feely and Christensen, 1999). The solid line correspondsto a perfect match between the two methods. (a) Mineral abundance derived from high spectralresolution (TES-like) data. (b) Mineral abundance derived from 10-band (THEMIS-like) data.
THERMAL EMISSION IMAGING 101
ues are comparable to the 5–15% errors typically quoted for traditional thin sectionestimates.
The mineral abundances derived using 10-band THEMIS-like resolution for thesame hand sample rock suite are shown in Figure 6b. These results demonstratethat mineral abundance can be determined to within 15% using only 10 thermal-IR spectral bands on naturally-occurring rock surfaces. Similar results have beenachieved for remotely-sensed aircraft observations on Earth through an atmosphereon a planetary surface (Ramsey et al., 1999). Laboratory studies have also shownthat a signal-to-noise ratio (SNR) of 35-100, corresponding to a noise-equivalentdelta emissivity (NE�ε) of 0.03 to 0.01, is sufficient to identify minerals usingthermal-IR data (Feely and Christensen, 1999).
3.1.4. Environmental EffectsVariations in particle size and porosity produce variations in the spectra of ma-terials at all wavelengths. Numerous quantitative models have been developed toinvestigate these effects (Vincent and Hunt, 1968; Hunt and Vincent, 1968; Conel,1969; Hunt and Logan, 1972; Hapke, 1981, 1993; Salisbury and Eastes, 1985;Salisbury and Wald, 1992; Salisbury et al., 1994; Moersch and Christensen, 1995;Wald and Salisbury, 1995; Mustard and Hays, 1997) and have demonstrated the im-portance of specular reflectance and scattering. Two basic behaviors are observedwith decreasing grain size: (1) strong bands (high absorption) tend to get shallower;and (2) weak bands (low absorption) increase in contrast, but appear as emissionmaxima and reflectance minima (Vincent and Hunt, 1968).
Dust coatings and weathering rinds present a potential problem for any op-tical remotely-sensed measurements of Mars. However, the thickness of materialthrough which sub-surface energy can escape increases linearly with wavelength.Thermal IR spectral measurements through coatings have been studied using mech-anically deposited dust (Ramsey and Christensen, 1992; Johnson et al., in press)and terrestrial desert varnish (Christensen and Harrison, 1993) as analogs to mar-tian rock coatings. These results have shown that thermal-IR spectral observationscan penetrate relatively thick (mean thickness up to ∼ 40–50 µm) layers of thesematerials to reveal the composition of the underlying rock.
Atmospheric dust is also an issue in the remote sensing of the martian surface(Bandfield et al., 2000b; Smith et al., 2000; Christensen et al., 2000b). How-ever, scattering and absorption by fine-grained (< 5 µm) dust suspended in theatmosphere at typical opacities of < 0.2 (Smith et al., 2001b, c) produces a linearcontribution to the infrared spectrum (Smith et al., 2000), and methods have beendeveloped to quantitatively remove this contribution from THEMIS multi-spectralIR images (Smith et al., 2000; Bandfield, 2002).
102 P.R. CHRISTENSEN ET AL.
3.2. THERMAL INFRARED MULTI-SPECTRAL IMAGING
It has been established that minerals can be accurately identified in mixtures givenhigh spectral resolution data, such as are available in a laboratory or from the MGSTES instrument (Ramsey and Christensen, 1998; Feely and Christensen, 1999;Hamilton, 1999; Christensen et al., 2000b, c; Bandfield et al., 2000a; Bandfield,2002). The key question regarding the use of multi-spectral imaging is to determinewhat spectral resolution is sufficient to determine the presence and abundance ofaqueous minerals. Thermal-infrared observations acquired in six spectral bandsfrom 8 to 12 µm have proven extremely powerful for geologic mapping on Earth,and have clearly demonstrated that subtle differences in rock composition can bemapped (Gillespie et al., 1984; Kahle et al., 1980; Crisp et al., 1990; Hook et al.,1994; Edgett and Christensen, 1995; Kahle et al., 1993; Ramsey, 1996).
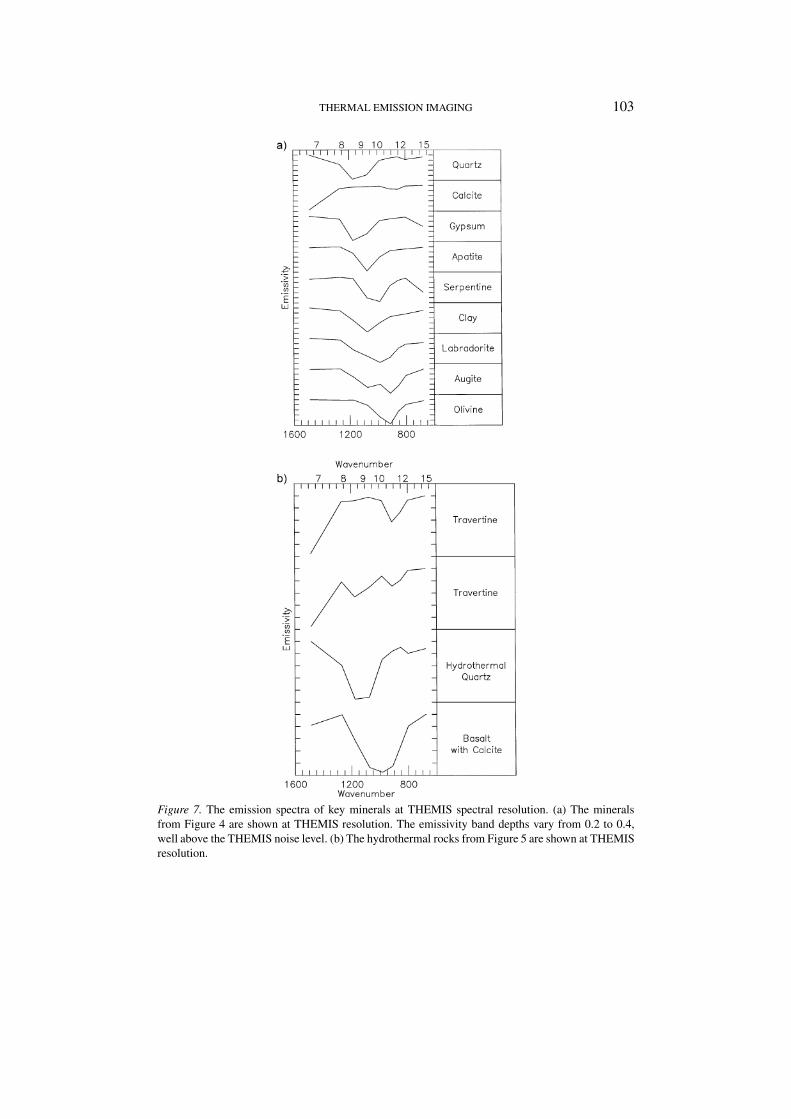
The spectra of the key minerals shown in Figures 4 and 5 at TES spectralresolution are reproduced in Figure 7 at THEMIS resolution by convolving thelaboratory spectra with the THEMIS filter response functions (see Section 4.2).Carbonates are identified using bands in calcite absorption (6.6 µm) and the con-tinuum (7.5 µm) region. Silica (quartz) is also readily separated at this resolutionfrom the other silicates, which have lower frequency absorptions. Key evaporiteminerals, gypsum and apatite, also have well defined bands. Hydrated minerals(serpentine and clay) have unique absorption band shapes and positions, as dothe common volcanic minerals, labradorite and augite, which have two very welldefined absorptions in this spectral range.
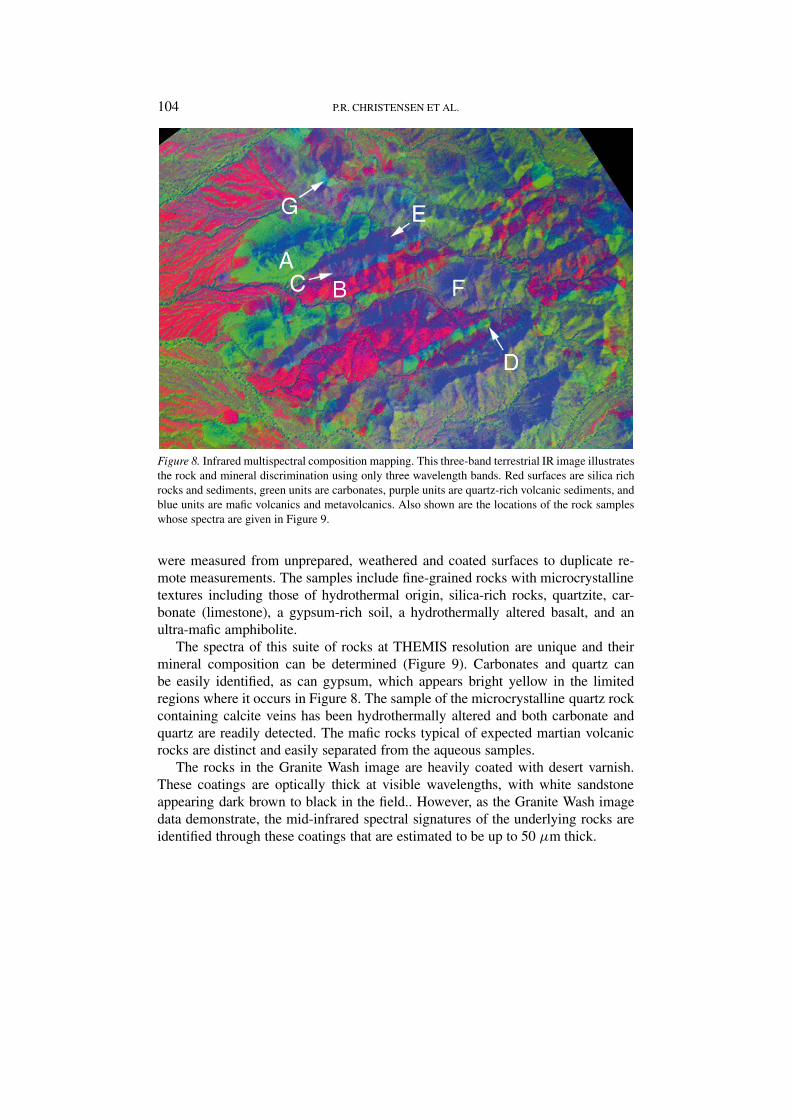
Figure 8 provides an example of the rock composition mapping that can beachieved using broad-band multi-spectral thermal-IR data. This image was ac-quired using the 6-band Thermal Infrared Multispectral Scanner (TIMS) imageroperating from 8–14 µm (Palluconi and Meeks, 1985) over the Granite WashMountains, Arizona. Three bands centered at ∼ 8, 9, and 10 µm are displayedin blue, green, and red, respectively. Different rock types are readily identifiedand their spatial distribution mapped using these thermal-IR multispectral data,as confirmed by detailed geologic mapping.
This image illustrates an important attribute of thermal-IR spectroscopy, wherethe spectra are sensitive to the major rock-forming minerals, rather than minorimpurities, stains, and coatings. The 3-band data clearly discriminate carbonate(green), quartz-rich (red), and clay-rich (light blue), sedimentary rocks (purple/yel-low), as well as basaltic (blue) and andesitic volcanic rocks (pink/purple). Soilsurfaces of differing ages appear red to orange due to differing weathering pro-cesses that produce and remove clays and concentrate more resistant quartz-richclasts over time.
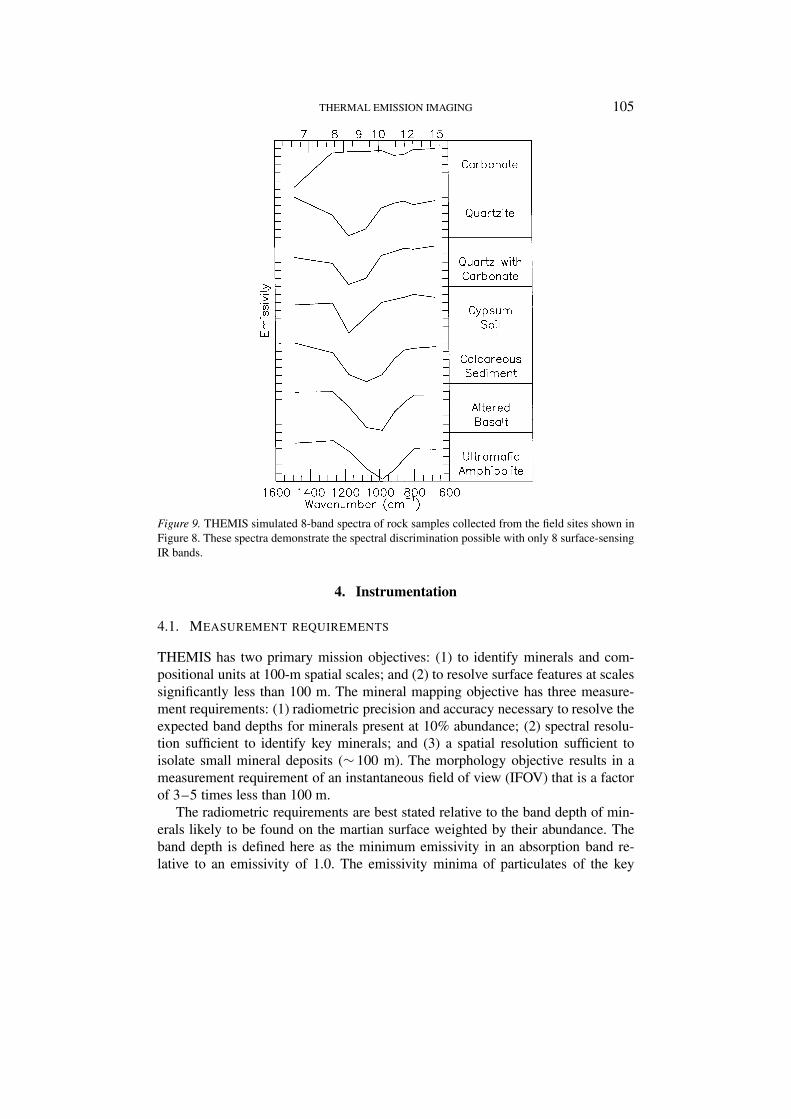
The THEMIS 8-wavelength spectra will allow mineral identification and a quant-itative determination of mineral abundance. The power of this combination ofimagery and spectroscopy can be seen using spectra of rocks from the Granite Washregion convolved to the THEMIS surface-sensing bandpasses (Figure 9). Spectra
THERMAL EMISSION IMAGING 103
Figure 7. The emission spectra of key minerals at THEMIS spectral resolution. (a) The mineralsfrom Figure 4 are shown at THEMIS resolution. The emissivity band depths vary from 0.2 to 0.4,well above the THEMIS noise level. (b) The hydrothermal rocks from Figure 5 are shown at THEMISresolution.
104 P.R. CHRISTENSEN ET AL.
Figure 8. Infrared multispectral composition mapping. This three-band terrestrial IR image illustratesthe rock and mineral discrimination using only three wavelength bands. Red surfaces are silica richrocks and sediments, green units are carbonates, purple units are quartz-rich volcanic sediments, andblue units are mafic volcanics and metavolcanics. Also shown are the locations of the rock sampleswhose spectra are given in Figure 9.
were measured from unprepared, weathered and coated surfaces to duplicate re-mote measurements. The samples include fine-grained rocks with microcrystallinetextures including those of hydrothermal origin, silica-rich rocks, quartzite, car-bonate (limestone), a gypsum-rich soil, a hydrothermally altered basalt, and anultra-mafic amphibolite.
The spectra of this suite of rocks at THEMIS resolution are unique and theirmineral composition can be determined (Figure 9). Carbonates and quartz canbe easily identified, as can gypsum, which appears bright yellow in the limitedregions where it occurs in Figure 8. The sample of the microcrystalline quartz rockcontaining calcite veins has been hydrothermally altered and both carbonate andquartz are readily detected. The mafic rocks typical of expected martian volcanicrocks are distinct and easily separated from the aqueous samples.
The rocks in the Granite Wash image are heavily coated with desert varnish.These coatings are optically thick at visible wavelengths, with white sandstoneappearing dark brown to black in the field.. However, as the Granite Wash imagedata demonstrate, the mid-infrared spectral signatures of the underlying rocks areidentified through these coatings that are estimated to be up to 50 µm thick.
THERMAL EMISSION IMAGING 105
Figure 9. THEMIS simulated 8-band spectra of rock samples collected from the field sites shown inFigure 8. These spectra demonstrate the spectral discrimination possible with only 8 surface-sensingIR bands.
4. Instrumentation
4.1. MEASUREMENT REQUIREMENTS
THEMIS has two primary mission objectives: (1) to identify minerals and com-positional units at 100-m spatial scales; and (2) to resolve surface features at scalessignificantly less than 100 m. The mineral mapping objective has three measure-ment requirements: (1) radiometric precision and accuracy necessary to resolve theexpected band depths for minerals present at 10% abundance; (2) spectral resolu-tion sufficient to identify key minerals; and (3) a spatial resolution sufficient toisolate small mineral deposits (∼ 100 m). The morphology objective results in ameasurement requirement of an instantaneous field of view (IFOV) that is a factorof 3–5 times less than 100 m.
The radiometric requirements are best stated relative to the band depth of min-erals likely to be found on the martian surface weighted by their abundance. Theband depth is defined here as the minimum emissivity in an absorption band re-lative to an emissivity of 1.0. The emissivity minima of particulates of the key
106 P.R. CHRISTENSEN ET AL.
quartz and carbonate minerals are ∼ 0.5 (band depth 0.5) in the 6–14 µm range;sulfates, phosphates, and clays are ∼ 0.6 (band depth 0.4) ; typical volcanic min-erals pyroxene, plagioclase, and olivine range from 0.7–0.8 (band depth 0.3–0.2).A surface containing carbonate grains at 10% abundance with an emissivity of 0.5at 6.6 µm, mixed with 90% silicate with an emissivity of 1.0 would produce anabsorption feature with an emissivity of 0.95. In order to observe this absorptionfeature, a noise equivalent delta emissivity (NE�ε of ∼ 0.02 would be required.(Note that the signal-to-noise ratio (SNR) is the reciprocal of NE�ε). The imagingnature of THEMIS will permit spatial aggregation of pixels and a spatial contextto be developed, again increasing the acceptable noise level in each pixel (the de-tection of interesting sites will not depend on the occurrence of 10% carbonate ina single pixel). Near 10 µm where a number of minerals have absorption features,it is desired to have a higher NE�ε to allow mineral discrimination. Thus, theminimum NE�ε requirement for THEMIS is 0.02 (SNR = 50) in the 6.6 µm bandand 0.007 (SNR = 143) in the 8–12.5 µm bands for each pixel.
The average local time of the THEMIS multi-spectral observations is 4:30 PM.The surface temperature follows the sub-solar point, but remains ≥ 245 K at thistime over a wide latitude range for all thermal inertia surfaces (Kieffer et al., 1977).For example, at 4:30 PM in southern hemisphere summer, the temperatures arebetween 245 and 270 from 45◦ S to 30◦ N, and in northern hemisphere summer thetemperatures range from 235 to 250 K between 0◦ and 45◦ N. These latitude rangesencompass expected future rover/lander allowable ranges, and include 70% of thetotal surface area of Mars. A conservative requirement of a surface temperature of245 K has been selected to set the instrument performance requirements.
The NE�ε requirement translates to a NE�T requirement of 0.9 K at 7 µm and0.5 K at 10 µm for a surface temperature of 245 K. The identification of nighttimetemperature anomalies can be achieved with a NE�T of 1 K at a typical nighttimesurface temperature of 180 K.
4.2. GENERAL DESCRIPTION
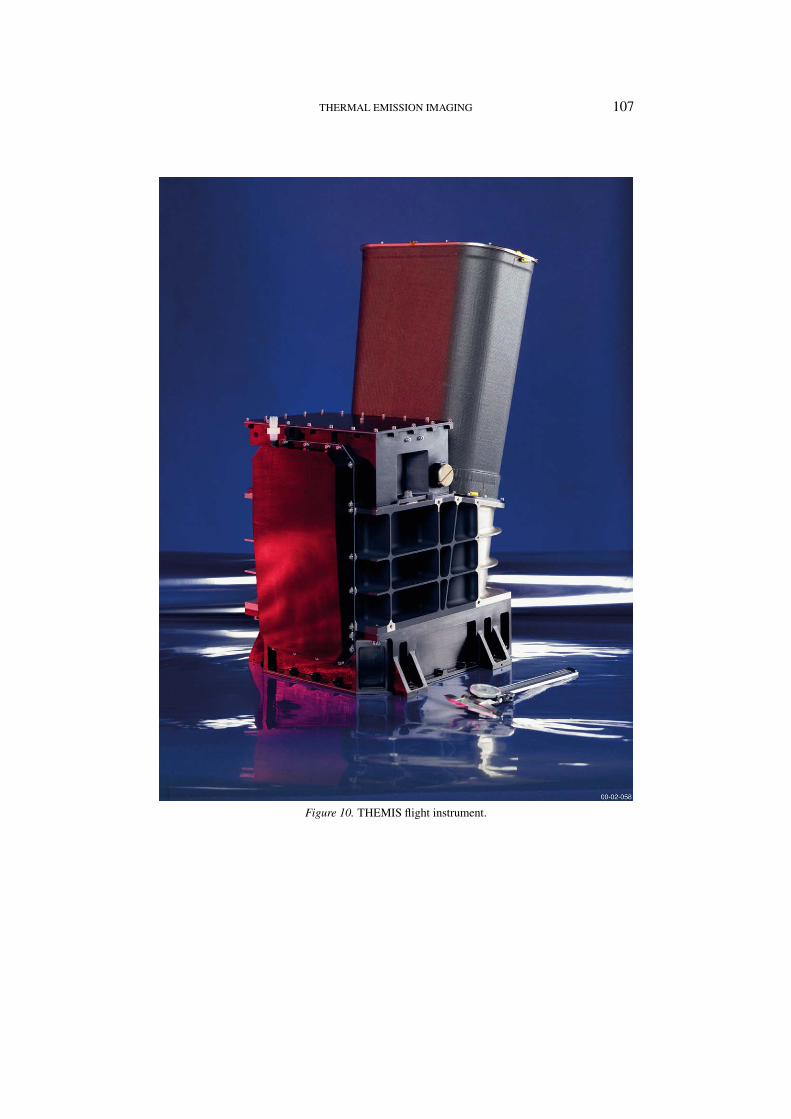
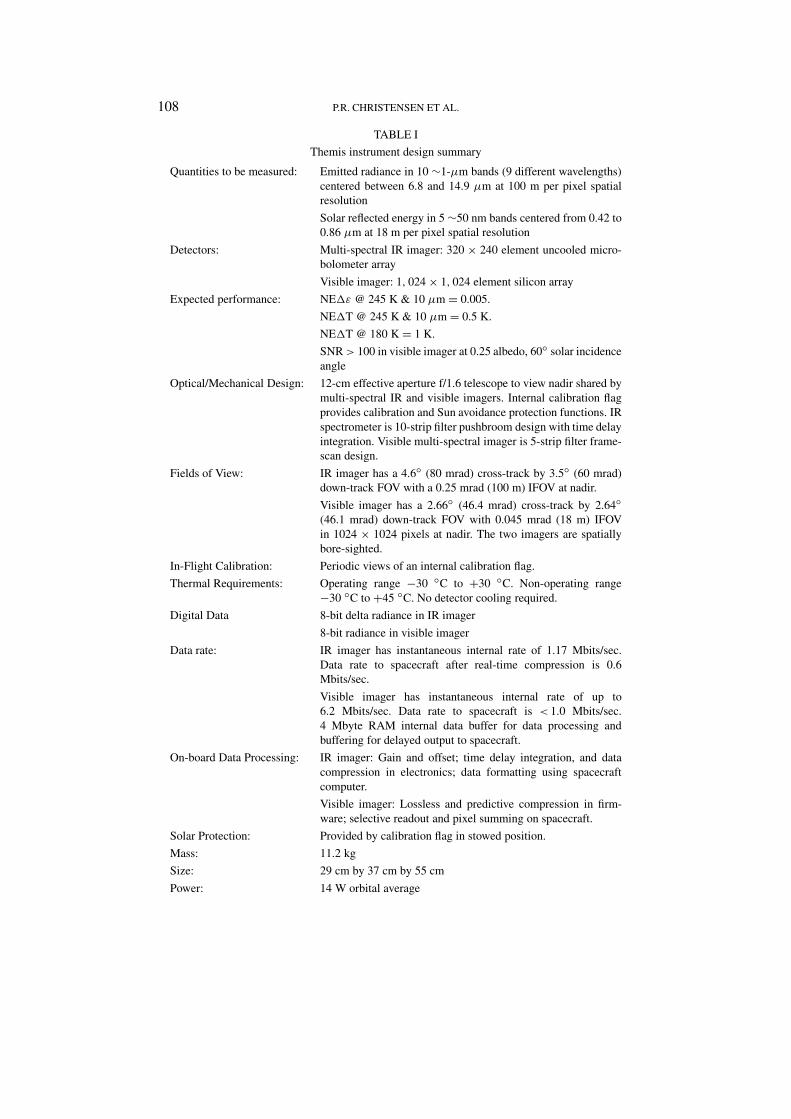
The design of the THEMIS is intentionally conservative. We have adopted a multi-spectral, rather than hyperspectral, approach that is sufficient to quantitatively de-termine mineralogy and allows global coverage within the available data volume.The THEMIS flight instrument, shown in Figure 10, consists of infrared and vis-ible multi-spectral imagers that share the optics and housing but have independentpower and data interfaces to the spacecraft to provide system redundancy. Thedetails of the instrument design are given in Table 1. The telescope is a three-mirroranastigmat with a 12-cm effective aperture and a speed of f/1.6. A calibration flag,the only moving part in the instrument, provides thermal calibration and is used toprotect the detectors from direct illumination from the Sun. The electronics providedigital data collection and processing as well as the instrument control and data
THERMAL EMISSION IMAGING 107
Figure 10. THEMIS flight instrument.
108 P.R. CHRISTENSEN ET AL.
TABLE I
Themis instrument design summary
Quantities to be measured: Emitted radiance in 10 ∼1-µm bands (9 different wavelengths)centered between 6.8 and 14.9 µm at 100 m per pixel spatialresolution
Solar reflected energy in 5 ∼50 nm bands centered from 0.42 to0.86 µm at 18 m per pixel spatial resolution
Detectors: Multi-spectral IR imager: 320 × 240 element uncooled micro-bolometer array
Visible imager: 1, 024 × 1, 024 element silicon array
Expected performance: NE�ε @ 245 K & 10 µm = 0.005.
NE�T @ 245 K & 10 µm = 0.5 K.
NE�T @ 180 K = 1 K.
SNR > 100 in visible imager at 0.25 albedo, 60◦ solar incidenceangle
Optical/Mechanical Design: 12-cm effective aperture f/1.6 telescope to view nadir shared bymulti-spectral IR and visible imagers. Internal calibration flagprovides calibration and Sun avoidance protection functions. IRspectrometer is 10-strip filter pushbroom design with time delayintegration. Visible multi-spectral imager is 5-strip filter frame-scan design.
Fields of View: IR imager has a 4.6◦ (80 mrad) cross-track by 3.5◦ (60 mrad)down-track FOV with a 0.25 mrad (100 m) IFOV at nadir.
Visible imager has a 2.66◦ (46.4 mrad) cross-track by 2.64◦(46.1 mrad) down-track FOV with 0.045 mrad (18 m) IFOVin 1024 × 1024 pixels at nadir. The two imagers are spatiallybore-sighted.
In-Flight Calibration: Periodic views of an internal calibration flag.
Thermal Requirements: Operating range −30 ◦C to +30 ◦C. Non-operating range−30 ◦C to +45 ◦C. No detector cooling required.
Digital Data 8-bit delta radiance in IR imager
8-bit radiance in visible imager
Data rate: IR imager has instantaneous internal rate of 1.17 Mbits/sec.Data rate to spacecraft after real-time compression is 0.6Mbits/sec.
Visible imager has instantaneous internal rate of up to6.2 Mbits/sec. Data rate to spacecraft is < 1.0 Mbits/sec.4 Mbyte RAM internal data buffer for data processing andbuffering for delayed output to spacecraft.
On-board Data Processing: IR imager: Gain and offset; time delay integration, and datacompression in electronics; data formatting using spacecraftcomputer.
Visible imager: Lossless and predictive compression in firm-ware; selective readout and pixel summing on spacecraft.
Solar Protection: Provided by calibration flag in stowed position.
Mass: 11.2 kg
Size: 29 cm by 37 cm by 55 cm
Power: 14 W orbital average
THERMAL EMISSION IMAGING 109
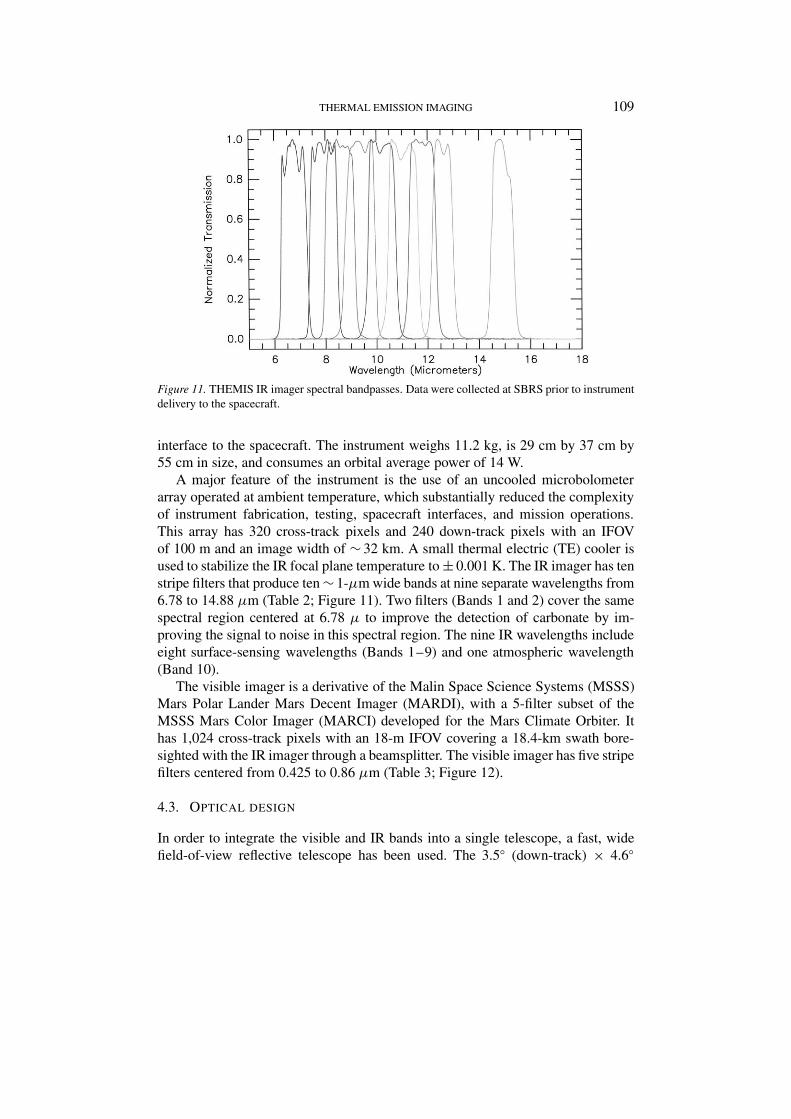
Figure 11. THEMIS IR imager spectral bandpasses. Data were collected at SBRS prior to instrumentdelivery to the spacecraft.
interface to the spacecraft. The instrument weighs 11.2 kg, is 29 cm by 37 cm by55 cm in size, and consumes an orbital average power of 14 W.
A major feature of the instrument is the use of an uncooled microbolometerarray operated at ambient temperature, which substantially reduced the complexityof instrument fabrication, testing, spacecraft interfaces, and mission operations.This array has 320 cross-track pixels and 240 down-track pixels with an IFOVof 100 m and an image width of ∼ 32 km. A small thermal electric (TE) cooler isused to stabilize the IR focal plane temperature to ± 0.001 K. The IR imager has tenstripe filters that produce ten ∼ 1-µm wide bands at nine separate wavelengths from6.78 to 14.88 µm (Table 2; Figure 11). Two filters (Bands 1 and 2) cover the samespectral region centered at 6.78 µ to improve the detection of carbonate by im-proving the signal to noise in this spectral region. The nine IR wavelengths includeeight surface-sensing wavelengths (Bands 1–9) and one atmospheric wavelength(Band 10).
The visible imager is a derivative of the Malin Space Science Systems (MSSS)Mars Polar Lander Mars Decent Imager (MARDI), with a 5-filter subset of theMSSS Mars Color Imager (MARCI) developed for the Mars Climate Orbiter. Ithas 1,024 cross-track pixels with an 18-m IFOV covering a 18.4-km swath bore-sighted with the IR imager through a beamsplitter. The visible imager has five stripefilters centered from 0.425 to 0.86 µm (Table 3; Figure 12).
4.3. OPTICAL DESIGN
In order to integrate the visible and IR bands into a single telescope, a fast, widefield-of-view reflective telescope has been used. The 3.5◦ (down-track) × 4.6◦

110 P.R. CHRISTENSEN ET AL.
TABLE II
THEMIS infrared band characteristics
Band Center Half Power Half Power Band Width SNR
Wavelength Point – Short Point – Long (Full Width Half Max)
Wavelength Wavelength
(µm) (µm) (µm) (µm)
1 6.78 6.27 7.28 1.01 33
2 6.78 6.27 7.28 1.01 34
3 7.93 7.38 8.47 1.09 104
4 8.56 7.98 9.14 1.16 163
5 9.35 8.75 9.95 1.20 186
6 10.21 9.66 10.76 1.10 179
7 11.04 10.45 11.64 1.19 193
8 11.79 11.26 12.33 1.07 171
9 12.57 12.17 12.98 0.81 132
10 14.88 14.45 15.32 0.87 128
(cross-track) field of view is achieved with a 3 mirror f/1.6 anastigmat telescopewith an effective aperture of 12 cm and a 20-cm effective focal length. The designallows for excellent baffling to minimize scattered light. It is based on a diamond-
Figure 12. THEMIS visible imager spectral bandpasses. Data were collected at MSSS prior to visiblesensor delivery to SBRS.
THERMAL EMISSION IMAGING 111
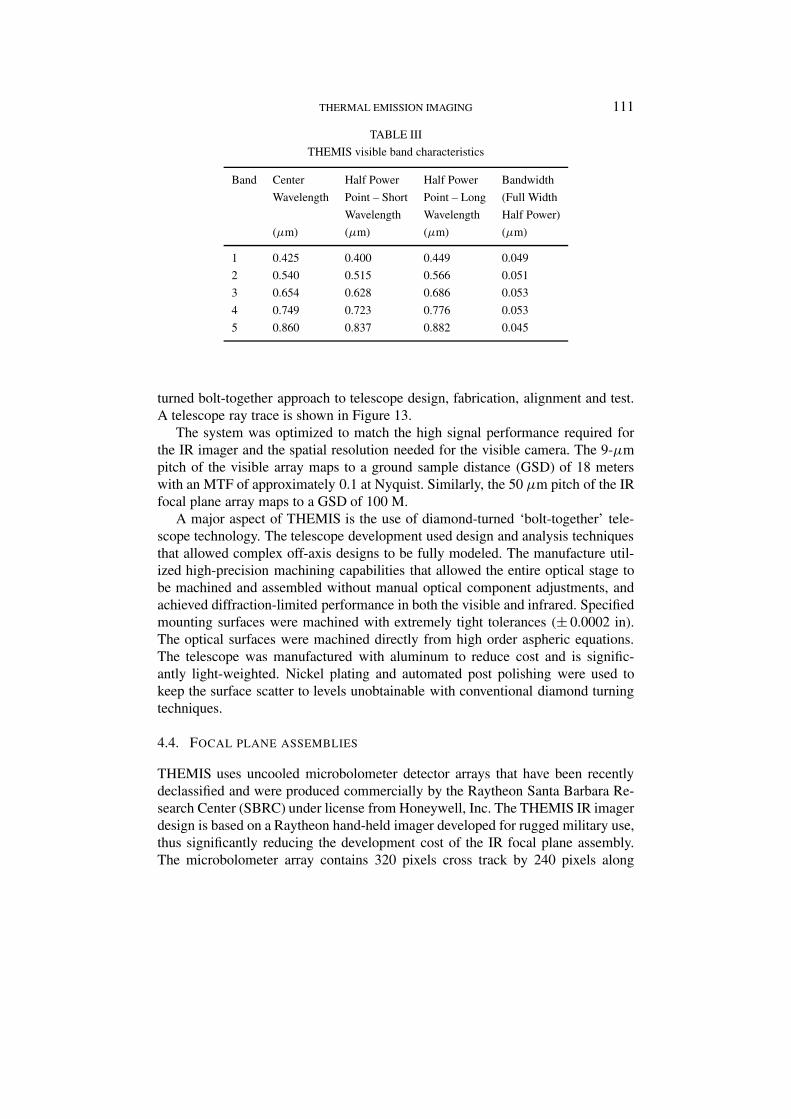
TABLE III
THEMIS visible band characteristics
Band Center Half Power Half Power Bandwidth
Wavelength Point – Short Point – Long (Full Width
Wavelength Wavelength Half Power)
(µm) (µm) (µm) (µm)
1 0.425 0.400 0.449 0.049
2 0.540 0.515 0.566 0.051
3 0.654 0.628 0.686 0.053
4 0.749 0.723 0.776 0.053
5 0.860 0.837 0.882 0.045
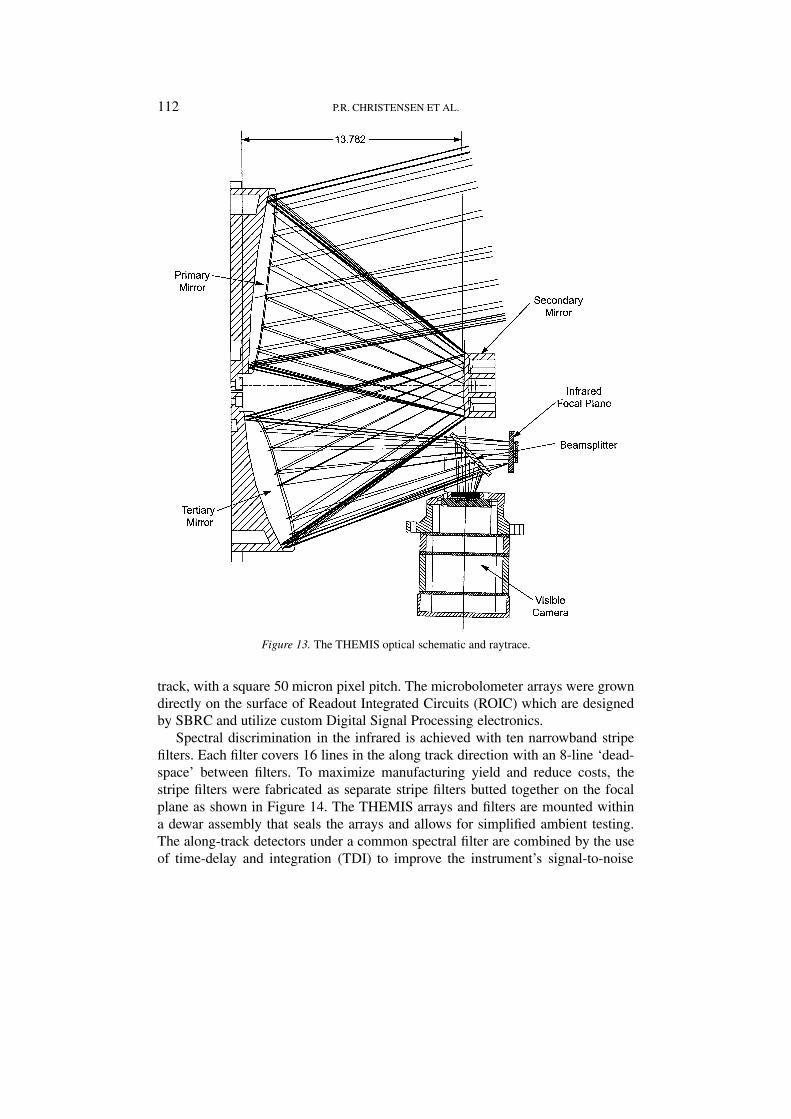
turned bolt-together approach to telescope design, fabrication, alignment and test.A telescope ray trace is shown in Figure 13.
The system was optimized to match the high signal performance required forthe IR imager and the spatial resolution needed for the visible camera. The 9-µmpitch of the visible array maps to a ground sample distance (GSD) of 18 meterswith an MTF of approximately 0.1 at Nyquist. Similarly, the 50 µm pitch of the IRfocal plane array maps to a GSD of 100 M.
A major aspect of THEMIS is the use of diamond-turned ‘bolt-together’ tele-scope technology. The telescope development used design and analysis techniquesthat allowed complex off-axis designs to be fully modeled. The manufacture util-ized high-precision machining capabilities that allowed the entire optical stage tobe machined and assembled without manual optical component adjustments, andachieved diffraction-limited performance in both the visible and infrared. Specifiedmounting surfaces were machined with extremely tight tolerances (± 0.0002 in).The optical surfaces were machined directly from high order aspheric equations.The telescope was manufactured with aluminum to reduce cost and is signific-antly light-weighted. Nickel plating and automated post polishing were used tokeep the surface scatter to levels unobtainable with conventional diamond turningtechniques.
4.4. FOCAL PLANE ASSEMBLIES
THEMIS uses uncooled microbolometer detector arrays that have been recentlydeclassified and were produced commercially by the Raytheon Santa Barbara Re-search Center (SBRC) under license from Honeywell, Inc. The THEMIS IR imagerdesign is based on a Raytheon hand-held imager developed for rugged military use,thus significantly reducing the development cost of the IR focal plane assembly.The microbolometer array contains 320 pixels cross track by 240 pixels along
112 P.R. CHRISTENSEN ET AL.
Figure 13. The THEMIS optical schematic and raytrace.
track, with a square 50 micron pixel pitch. The microbolometer arrays were growndirectly on the surface of Readout Integrated Circuits (ROIC) which are designedby SBRC and utilize custom Digital Signal Processing electronics.
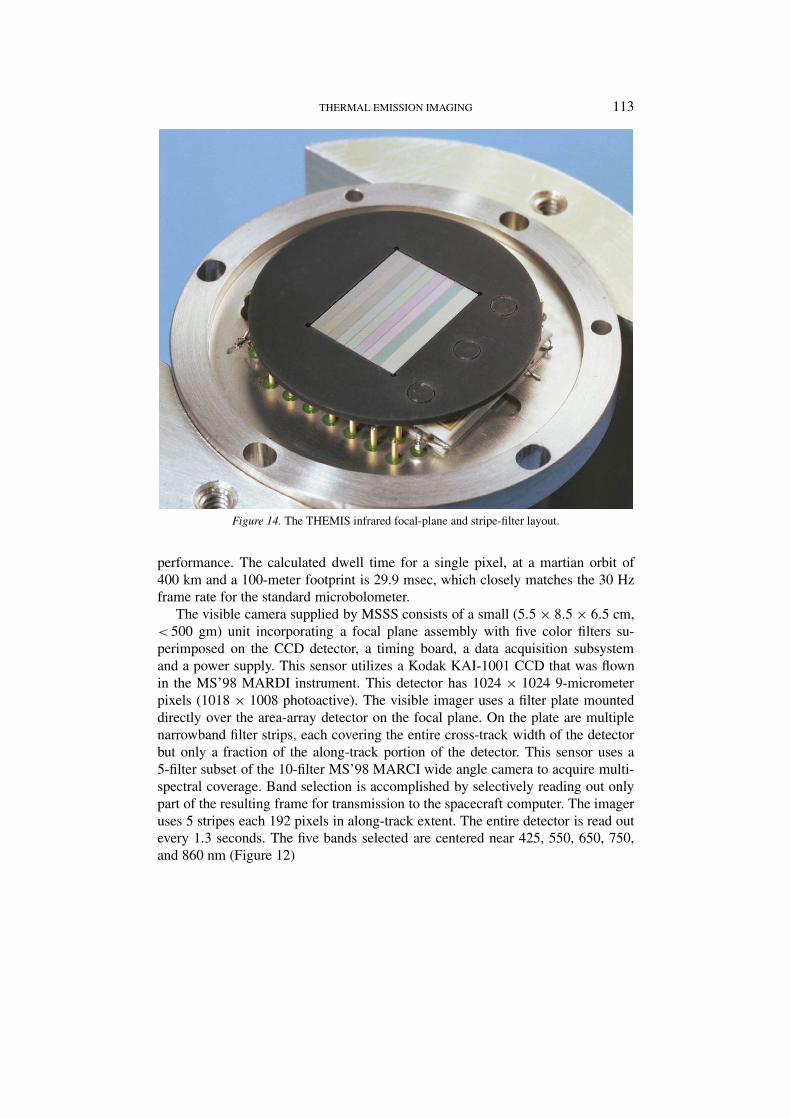
Spectral discrimination in the infrared is achieved with ten narrowband stripefilters. Each filter covers 16 lines in the along track direction with an 8-line ‘dead-space’ between filters. To maximize manufacturing yield and reduce costs, thestripe filters were fabricated as separate stripe filters butted together on the focalplane as shown in Figure 14. The THEMIS arrays and filters are mounted withina dewar assembly that seals the arrays and allows for simplified ambient testing.The along-track detectors under a common spectral filter are combined by the useof time-delay and integration (TDI) to improve the instrument’s signal-to-noise
THERMAL EMISSION IMAGING 113
Figure 14. The THEMIS infrared focal-plane and stripe-filter layout.
performance. The calculated dwell time for a single pixel, at a martian orbit of400 km and a 100-meter footprint is 29.9 msec, which closely matches the 30 Hzframe rate for the standard microbolometer.
The visible camera supplied by MSSS consists of a small (5.5 × 8.5 × 6.5 cm,< 500 gm) unit incorporating a focal plane assembly with five color filters su-perimposed on the CCD detector, a timing board, a data acquisition subsystemand a power supply. This sensor utilizes a Kodak KAI-1001 CCD that was flownin the MS’98 MARDI instrument. This detector has 1024 × 1024 9-micrometerpixels (1018 × 1008 photoactive). The visible imager uses a filter plate mounteddirectly over the area-array detector on the focal plane. On the plate are multiplenarrowband filter strips, each covering the entire cross-track width of the detectorbut only a fraction of the along-track portion of the detector. This sensor uses a5-filter subset of the 10-filter MS’98 MARCI wide angle camera to acquire multi-spectral coverage. Band selection is accomplished by selectively reading out onlypart of the resulting frame for transmission to the spacecraft computer. The imageruses 5 stripes each 192 pixels in along-track extent. The entire detector is read outevery 1.3 seconds. The five bands selected are centered near 425, 550, 650, 750,and 860 nm (Figure 12)
114 P.R. CHRISTENSEN ET AL.
4.5. ELECTRONICS DESIGN
Both the visible and infrared cameras utilize commercial off-the-shelf electron-ics with modifications to accommodate space environmental requirements. Dedic-ated, miniaturized electronics provide ultra-stable, low-noise clock and bias signalsto the focal planes, stabilize IR focal plane temperature within ± 0.001 ◦C, andperform analog and digital processing of the output signals.
The IR signal change begins at the focal plane that generates an analog output.An initial 8-bit analog DC offset correction occurs on the focal plane, followed byanalog-to-digital conversion to 12-bit words, which are then corrected for gain andoffsets. This correction is provided by the electronics of the IR camera and consistsof a 12-bit fine offset and 8-bit gain and responsivity adjustment, performed in realtime on a pixel-by-pixel basis. This process eliminates all of the significant noiseelements with the exception of the fundamental random noise term. The outputfrom this processing is an 8-bit word for each pixel.
The spacecraft interface electronics supply final processing of the focal planedata, a data and command interface to the spacecraft, and overall instrument powerconditioning. Internal THEMIS data processing in firmware includes 16:1 TDIprocessing and lossless data compression for the IR bands using a hardware Ricedata compression algorithm chip. The bulk of the interface electronics is performedusing Actel Field Programmable Gate Arrays (FPGAs), that are packaged using amixture of conventional and Sealed Chip-On-Board, High-Density Multiple In-terconnect technology and chip stack memory. The visible and IR subsystemshave independent power supplies, the IR power supply uses off-the-shelf modulesand requires only a few discrete components for input filtering to assure electro-magnetic compatibility with the rest of the spacecraft. The spacecraft processorperforms final data stream formatting for both the IR and the visible data.
The visible sensor requires 7 clock signals: a two-phase vertical clock (V1/V2),a two-phase horizontal clock (H1/H2), a sub-state clear clock (S), a reset clock (R),and a fast- dump clock (F). In addition, the ADC requires a convert clock.
The amplified CCD signal is digitized by an Analog Devices AD1672 12-bitADC running at its maximum rate of 3 MSPS. For each pixel, both reset and videolevels are digitized and then subtracted in the digital domain to perform correlateddouble sampling (CDS).
The digital electronics are responsible for clock generation, sampling of theCCD signal, conversion of the 12-bit samples to 8-bit encoded pixels, storage ofthe pixels, and finally readout of the pixels to the spacecraft. The zero reference(‘reset’) level for each pixel is digitized and stored in a register. The sum of thevideo plus zero reference (‘video’) level is then digitized, and an arithmetic sub-traction is performed to produce the final result. The CCD output only requiresscaling to the ADC range; no analog sampling, delay or differencing is required.The digital signal processor within the visible sensor generates the CCD clocks,reads the reset and video levels from the ADC, performs the correlated double
THERMAL EMISSION IMAGING 115
sampling subtraction, reduces the pixel from 12 to 8 bits, applies optional 2 × 2or 4 × 4 pixel summinglossless (2:1) first-difference Huffman compression, andtransmits it digitally over the serial communication interface to the spacecraft CPU.
4.6. MECHANICAL DESIGN
The THEMIS main frame is composed of aluminum and provides the mountinginterface to the spacecraft as well as the telescope assembly, thermal blankets, andthermal control surface. The focal plane assemblies are mounted in the main frameusing brackets that provide for the necessary degrees of freedom for alignment tothe telescope. The calibration shutter flag is stored against a side wall that willmaintain a known temperature of the flag for calibration purposes. Aluminumcovers are installed over the electronics circuit cards to provide EMI, RFI, andradiation shielding as required. There is no reliance on the spacecraft for thermalcontrol of THEMIS, other than the application of replacement heater power whenthe instrument is off. The thermal control plan includes the use of multi-layer insu-lation blankets and appropriate thermal control surfaces to provide a stable thermalenvironment and a heatsink for the electronics and the TE temperature controlleron the focal plane arrays.
4.7. PERFORMANCE CHARACTERISTICS
The THEMIS IR performance was estimated in the design phase using expectedperformance values for the IR focal plane, filters, optical elements, TDI, and elec-tronics. The following equations define the parameters used to predict the noiseequivalent delta emissivity (NE�ε):
NE�ε = NEP
P∗sc
√nTDI
where
NEP = Noise equivalent power
Psc = scene power incident in the bolometer
nTDI = number of samples in TDI (16)
NEP = Vnz
R
where
Vnz = noise voltage in volts
R = bolometer responsivity in volts/mW
NEP for the microbolometer is a constant in this analysis for two reasons:(1) bolometer noise is not a function of photon flux (as it is for photon-limited
116 P.R. CHRISTENSEN ET AL.
PV detectors where the shot noise component of the flux dominates); and (2) theresponsivity of the bolometer over wavelength is taken as constant and based onthat measured in the ‘flat’ portion of the spectral curve for the bolometer.
The detector output is based on the Mars scene temperature, instrument para-meters, and predicted bolometer performance. The radiance calculation is basedon Planck’s law, multiplied by the optics solid angle (omega) for an average f1.6system, the area of the microbolometer, the overall optics transmission, and thespectral response predicted for the microbolometer. The resulting power is thendivided into the NEP, and improved by the square root of the number of samplesin TDI, to yield the NE�ε ratio. SNR is the reciprocal of this NE�ε. The scenepower incident on the bolometer in mW (Psc) is:
Psc = L(Tsc, lsc)∗Adet
∗�∗l Topt
∗Tfilt∗Tbol(lsc)
∗�
Where the radiance at instrument aperture (L) in mW/cm2-µm-sr is given by:
L(Tsc, lsc) = c1
l5sc
∗ 1
ec2/lscTsc − 1
∗1000
and
lsc = peak wavelength in µm
Tsc = scene temperature in ◦K
c1 = 2πhc2 = 37415 W-µm/cm4
c2 = ch/k = 14388 µm −◦ K
Adet = detector area in cm2
�l = bandwidth of the stripe filters in µm
Topt∗Tfilt = combined optics and filter transmission
Tbol = predicted spectral response of the bolometer
� = optics solid angle in sr
The predicted performance for the infrared bands produced NE�ε’s ranging from0.007 to 0.038 when viewing Mars at surface temperatures of 245K to 270 K.
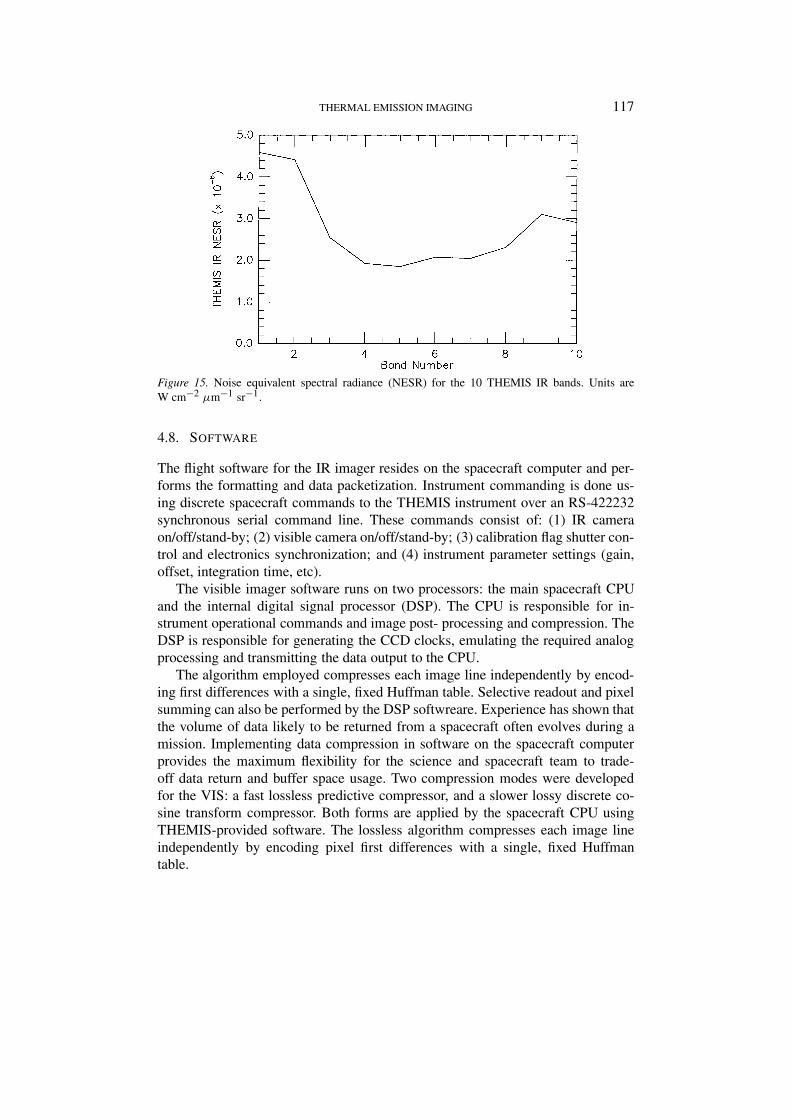
The measured noise equivalent spectral radiance (NESR) values are given inFigure 15. The measured SNR for a reference surface temperature of 245 K issummarized for each band in Table 3. Most of the variation in SNR between bandsis due to the variation in emitted energy for the 245 K reference temperature. Asseen from these results, the THEMIS IR imager exceeds the proposed measurementrequirements by a factor of two in most bands.
Signal-to-noise ratios for the visible imager were computed for a low albedo(0.25), flat-lying surface viewed at an incidence angle of 67.5◦ under aphelionconditions. The SNR values for this case vary from 200 to 400.
THERMAL EMISSION IMAGING 117
Figure 15. Noise equivalent spectral radiance (NESR) for the 10 THEMIS IR bands. Units areW cm−2 µm−1 sr−1.
4.8. SOFTWARE
The flight software for the IR imager resides on the spacecraft computer and per-forms the formatting and data packetization. Instrument commanding is done us-ing discrete spacecraft commands to the THEMIS instrument over an RS-422232synchronous serial command line. These commands consist of: (1) IR cameraon/off/stand-by; (2) visible camera on/off/stand-by; (3) calibration flag shutter con-trol and electronics synchronization; and (4) instrument parameter settings (gain,offset, integration time, etc).
The visible imager software runs on two processors: the main spacecraft CPUand the internal digital signal processor (DSP). The CPU is responsible for in-strument operational commands and image post- processing and compression. TheDSP is responsible for generating the CCD clocks, emulating the required analogprocessing and transmitting the data output to the CPU.
The algorithm employed compresses each image line independently by encod-ing first differences with a single, fixed Huffman table. Selective readout and pixelsumming can also be performed by the DSP softwreare. Experience has shown thatthe volume of data likely to be returned from a spacecraft often evolves during amission. Implementing data compression in software on the spacecraft computerprovides the maximum flexibility for the science and spacecraft team to trade-off data return and buffer space usage. Two compression modes were developedfor the VIS: a fast lossless predictive compressor, and a slower lossy discrete co-sine transform compressor. Both forms are applied by the spacecraft CPU usingTHEMIS-provided software. The lossless algorithm compresses each image lineindependently by encoding pixel first differences with a single, fixed Huffmantable.

118 P.R. CHRISTENSEN ET AL.
5. Mission Operations
5.1. OVERVIEW
The Mars Odyssey spacecraft is in a near-polar sun synchronous orbit with anapproximately 4:30 PM equator-crossing local time. From this orbit the THEMISinfrared imager will image 100% of the planet both day and night. In addition,THEMIS will be used for selective targeting throughout the mission for regions ofhigh-interest identified from TES, MOC, THEMIS, or other experiments.
Collection of THEMIS IR and visible data is flexible, based on scientific pri-orities, observing conditions, and data rates. Optimal observing conditions for IRmineralogic mapping occur during mission phases where the local true solar timeis the earliest in the afternoon, and when the atmosphere has the lowest dust andwater-ice opacity. Optimal conditions for visible imaging occur when the incidenceangles are between 60 and 80◦. Nighttime images can be acquired during all phasesof the mission, but will be emphasized when the daytime IR images are of lowerquality. Polar observations will be acquired through the martian year to observedall aspects of autumn cap growth, winter night, and spring retreat.
5.2. IMAGE COLLECTION
THEMIS IR images are acquired at selectable image lengths, in multiples of 256lines (25.6 km). The image width is 320 pixels (32 km from the nominal mappingorbit) and the length is variable, as given by ((# frames) ∗ 256 lines) - 240. Theallowable number of frames varies from 2 to 256, giving minimum and maximumimage lengths of 272 and 65,296 lines respectively (27.2 km and 6,530 km from thenominal mapping orbit). The bands returned to the ground are selectable. THEMISvisible images can be acquired simultaneously with IR images, but the spacecraftcan only transfer data from one of the two THEMIS imagers at a time. The IRimage transfers data as it is being collected, while the visible images are storedwithin an internal THEMIS buffer for later transfer to the spacecraft computer.
The visible images are acquired in framelets that are 1024 samples crosstrackby 192 lines downtrack in size. Framelets are typically taken at 1-sec intervals,resulting in 26 rows of downtrack overlap at a nominal orbit velocity of 3.0 km/sec.Images can be composed of any selectable combination of bands, image length, andinteger pixel summing that can be stored within 3.734 Mbytes THEMIS internalbuffer. The size of an image is given by:
[(1024∗192)∗#framelets∗#bands]/[summing2] = 3.734 Mbytes
Thus, for example, with no summing either a single-band, 19-framelet (∼ 60 km)image or a 5-band 3-framelet (8.5 km) image can be collected.
THEMIS images are calibrated using periodic views of the internal calibrationflag together with an instrument response function determined pre-launch. The flag
THERMAL EMISSION IMAGING 119
is closed, imaged, and reopened at selectable intervals throughout each orbit. Thisprocess produces gores in the surface observation lasting approximately 50 secondsfor each calibration. Calibration data typically are acquired at the beginning andend of each image, but can be spaced to meet the calibration accuracy requirements,while minimizing the loss of surface observations.
5.3. DATA ALLOCATION
THEMIS data collection will be distributed between the mineralogic, temperature,and morphologic science objectives in both targeted and global mapping modes.A baseline observing plan has been developed to prioritize the total data volumereturned by THEMIS between the different objectives. This plan devotes 62% ofthe total data to the IR imager and 38% to the visible, averaged over the course ofthe Primary Mission. In the baseline plan the IR data will be further sub-dividedinto 9-wavelength daytime mineralogic observations (47% of total data return) and3-wavelength nighttime and polar temperature mapping (15% of total data). Thevisible data will be sub-divided into panchromatic images (37% of total data) and5-band multi-spectral images (2%). In this example we have assumed a losslessdata compression factor of 1.7 for the IR imager and a combination of lossless(40%), and lossy with compression factors of 4× (30%) and 6× (30%) for thevisible imager. With these allocations THEMIS will fully map Mars in daytimeIR and will map the planet 1.5 times in nighttime IR. The visible imaging willcover ∼ 60% of the planet at 18-m resolution in one band (50,000 18 × 60kmframes) and < 1% in 5-band color. Tradeoffs between monochromatic and multi-spectra imaging, as well as variations in the degree of lossy compression and pixelsumming, will be made to maximize the science return from the visible imager.
5.4. FLIGHT OPERATIONS
The THEMIS instrument is operated from ASU, building on the facility and staffdeveloped and in place for the MGS TES investigation. No special spacecraft op-eration or orientation is required to obtain nominal THEMIS data. The instrumentalternates between data collection (≤ 3.5 hours per day) and idle modes based onavailable Deep Space Network (DSN) downlink rates. These modes will fall withinthe allocated resources (e.g. power), and do not require power cycling of the instru-ment. All instrument commands are generated at ASU, delivered electronically tothe Mars Odyssey Project, and transmitted to the spacecraft. Data are retrievedfrom the mission database and stored at ASU, where the health and welfare of theinstrument are monitored, the data are processed and calibrated, and the archivedatabase is created and stored.
120 P.R. CHRISTENSEN ET AL.
6. Data Reduction and Validation
6.1. OVERVIEW
The data received on the ground are in the form of compressed, scaled, 8-bit ‘datanumbers’ (DN) that represent the delta signal between the scene and the internalreference calibration flag. Data processing consists of decompression, radiometriccalibration, and systematic noise removal. For the final generation of geometricallycorrected, map-projected data products, each image is processed independentlyand multiple images can be concatenated together into mosaics. Distortions causedby optics and spacecraft motion are removed concurrently with map projection toavoid multiple resampling degradation.
6.2. DATA CALIBRATION
The THEMIS instrument was radiometrically, spectrally, and spatially calibratedprior to delivery. Three categories of calibration were performed: (1) spatial cal-ibration; (2) spectral calibration; and (3) radiometric calibration including the ab-solute radiometry, the relative precision (SNR), and the calibration stability duringan image collection. The data returned from the instrument in-flight are convertedto scene radiance by: (1) adjusting for the gain and offset that were applied in theinstrument to optimize the dynamic range and signal resolution for each scene;(2) correcting for drift or offset that occur between observations of the calibrationflag; and (3) converting signal to radiance using the instrument response functionsdetermined prior to instrument delivery using a thermal vacuum chamber at theSBRS facility.
Calibration data for the IR sensor were collected at five instrument temperatures(−30, −15, 0, 15, and 30 ◦C) and seven target temperatures (170, 190, 210, 247,262, 292, and 307 K). These temperatures were chosen to cover the range of operat-ing and scene temperatures expected at Mars. A full-aperture, calibrated blackbodywas placed inside the vacuum chamber and viewed directly by the THEMIS instru-ment. This blackbody was developed for the SBRS Moderate resolution ImagingSpectrometer (MODIS) instrument, and is a calibrated source traceable to NISTstandards with an uncertainty of ± 0.032 K (one sigma). Included in this assess-ment is a temperature uniformity of 0.020 K, a stability of 0.010 K and an emittance0.99995 ± 0.00005 (Young, 1999b, c).
For each calibration data set the instrument and blackbody were temperaturestabilized at < 0.1 ◦C. Observations were acquired of the THEMIS internal cal-ibration flag immediately before the collection of a set of calibration images. A10-sec image was acquired for each point in a matrix of five different gains withfive offsets (25 images total) that cover the range of values to be used at Mars.At the completion of this series of images, the calibration flag was reimaged todetermine any temperature drift or offset that occurred. The calibration data wereadjusted for these minor changes.
THERMAL EMISSION IMAGING 121
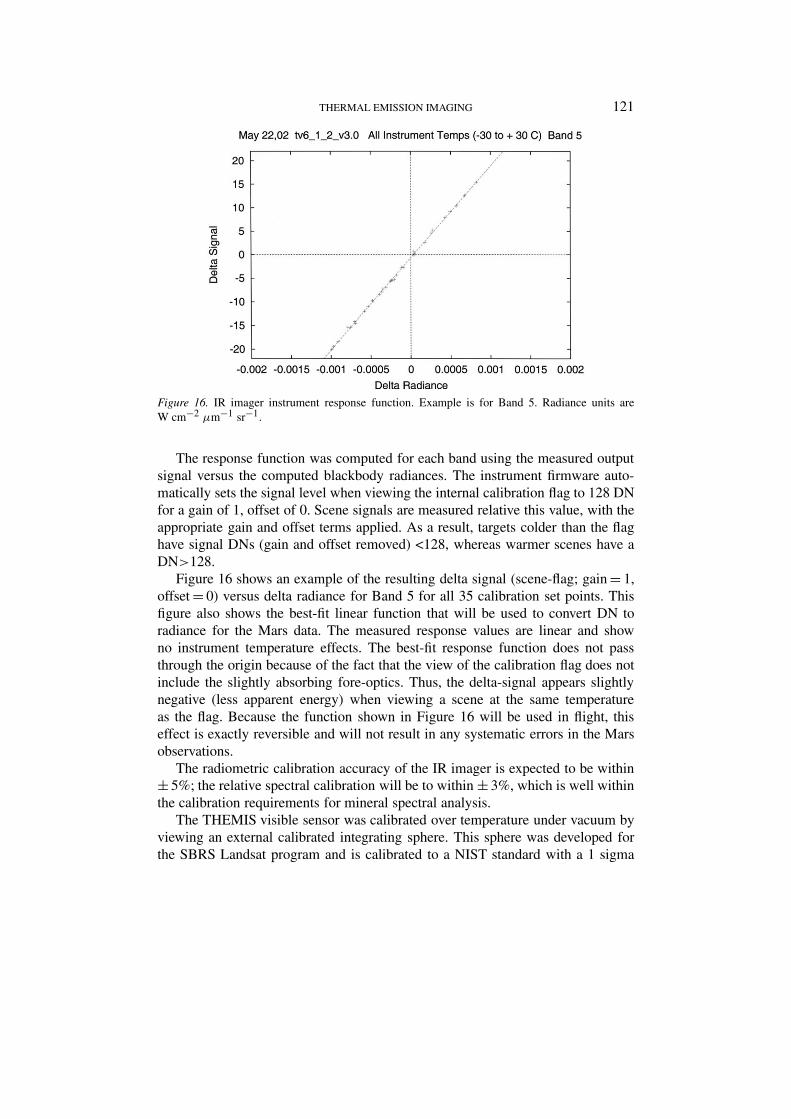
Figure 16. IR imager instrument response function. Example is for Band 5. Radiance units areW cm−2 µm−1 sr−1.
The response function was computed for each band using the measured outputsignal versus the computed blackbody radiances. The instrument firmware auto-matically sets the signal level when viewing the internal calibration flag to 128 DNfor a gain of 1, offset of 0. Scene signals are measured relative this value, with theappropriate gain and offset terms applied. As a result, targets colder than the flaghave signal DNs (gain and offset removed) <128, whereas warmer scenes have aDN>128.
Figure 16 shows an example of the resulting delta signal (scene-flag; gain = 1,offset = 0) versus delta radiance for Band 5 for all 35 calibration set points. Thisfigure also shows the best-fit linear function that will be used to convert DN toradiance for the Mars data. The measured response values are linear and showno instrument temperature effects. The best-fit response function does not passthrough the origin because of the fact that the view of the calibration flag does notinclude the slightly absorbing fore-optics. Thus, the delta-signal appears slightlynegative (less apparent energy) when viewing a scene at the same temperatureas the flag. Because the function shown in Figure 16 will be used in flight, thiseffect is exactly reversible and will not result in any systematic errors in the Marsobservations.
The radiometric calibration accuracy of the IR imager is expected to be within± 5%; the relative spectral calibration will be to within ± 3%, which is well withinthe calibration requirements for mineral spectral analysis.
The THEMIS visible sensor was calibrated over temperature under vacuum byviewing an external calibrated integrating sphere. This sphere was developed forthe SBRS Landsat program and is calibrated to a NIST standard with a 1 sigma
122 P.R. CHRISTENSEN ET AL.
accuracy of 3.5%. Short term stability is maintained at less than 1% over 14 days(Young, 1999a). Overall uniformity of illumination is better than 0.25% (Young,1999a).
The visible response function was calculated using a linear fit to the measuredsignal, with dark current removed, versus calibrated lamp radiance. The measuredvisible filter functions were integrated over the measured lamp output spectra toproduce band-integrated signal versus radiance functions.
6.3. STANDARD DATA PROCESSING
Ground data processing consists of a series of steps that include: depacketization,decompression, instrument health monitoring, radiance calibration, long-term per-formance monitoring, standard product generation, data quality verification, dataarchiving and distribution, and preliminary science analysis. These steps must beperformed at a rate designed to keep pace with the collection of data by the instru-ment. The IR data are calibrated to radiance, derived surface kinetic temperatureand spectral emissivity, and atmospheric temperature. Geologic processing pro-ceeds with mapping of spectral components, comparison of spectral emissivitywith a spectral library, component identification, and identification of temperatureanomalies.
6.4. DATA ARCHIVING
Data will be accumulated and archived routinely during standard mission oper-ations as described in the Mars 2001 Odyssey Project Data Archive Plan. Allproducts generated will conform to the standards developed for the Planetary DataSystem. Data validation and archiving will be performed at ASU. Standard productswill consist of images of calibrated radiance in the IR and visible, surface bright-ness temperature, and atmospheric brightness temperature.
7. Education/outreach
THEMIS investigation builds on the TES Arizona Mars K-12 Education Program,which has over 10 years experience doing highly-leveraged education outreachfor Mar Observer and MGS (Edgett, 1995; Edgett and Rice, 1995; Edgett andChristensen, 1996; Edgett et al., 1997). Activities have included: student visits toMGS TES facility; biannual teacher workshops; field trips; workshops at national,regional, and state teacher conferences; visits to schools, community, senior, andscience centers; annual teacher guides; lithographs; Spanish material; WWW site;a quarterly newsletter; and a quarterly, age-appropriate, National Standards-basedresource for K-8 children.
A major element of the THEMIS outreach program is the THEMIS StudentImaging Project. The objective of this program is to give students at the middle

THERMAL EMISSION IMAGING 123
school, high school, undergraduate, and graduate levels the opportunity to particip-ate in the exploration of Mars by planning, acquiring, and analyzing real imagesof Mars. The THEMIS Student Imaging Program provides background informa-tion and teacher mentoring on Mars science to enable classes to plan independentscience projects at Mars using THEMIS observations.
Individual classes (grades 5–12) throughout the U.S. research Mars and preparea short science rational for a target site in conjunction with mentoring and sup-port by the THEMIS staff. The THEMIS staff reviews the student proposals andselects participants. It is expected that approximately 150 classes will participateeach year, with high schools selected from each of the 50 states. When possible,selected members of these classes will travel to ASU during the week of imageacquisition. The remainder of class will participate in the data acquisition via theWeb and through emails, interactive interviews, journals, etc that are designed andimplemented by the students. Following the image acquisition, each class willanalyze their image in the context of the initial hypothesis- based question thatthey formulated.
Undergraduate and graduate students or classes participate at a higher level thatinvolves a more detailed specification of a Mars research project. These studentsprepare a short science rational for a target site and a specific hypothesis to betested. Students interact with the THEMIS staff to plan image acquisition, andtravel to ASU during image acquisition as appropriate or participate via Web in-teraction. The students analyze their images and participate in a yearly workshopheld at ASU. Where appropriate, these projects will be published in the scientificliterature.
Acknowledgements
We wish to extend our sincere thanks to all those individuals who have contrib-uted to the detailed design and implementation of this investigation. The highlydedicated team of engineers at Raytheon Santa Barbara Remote Sensing, led byTeresa Fortuna, Martin Greenfield, John Jeffryes, Robert Jensen, Bronislaus Ko-pra, Chris Laufer, Philip Mayner, Andy Mills, Bill O’Donnell, Paul Owens, MikePavlov, George Polchin, and Tom Sprafka, made major contributions to the hard-ware development. Paul Otjens and Jeff Lewis made major contributions to the VISengineering at MSSS. Dick Chandos and Spencer Lee provided significant assist-ance in the final instrument testing and integration. Noel Gorelick, Ben Steinberg,Michael Weiss-Malik, and Saadat Anwar have participated in software develop-ment at Arizona State University. Teresa Robinette, Nancy Walizer, and Tara Fishermade major contributions to the administration of this investigation. Carl Klossprovided excellent management of this investigation at the Jet Propulsion Labor-atory, and Tim Schofield provided the scientific interface with the Mars Global
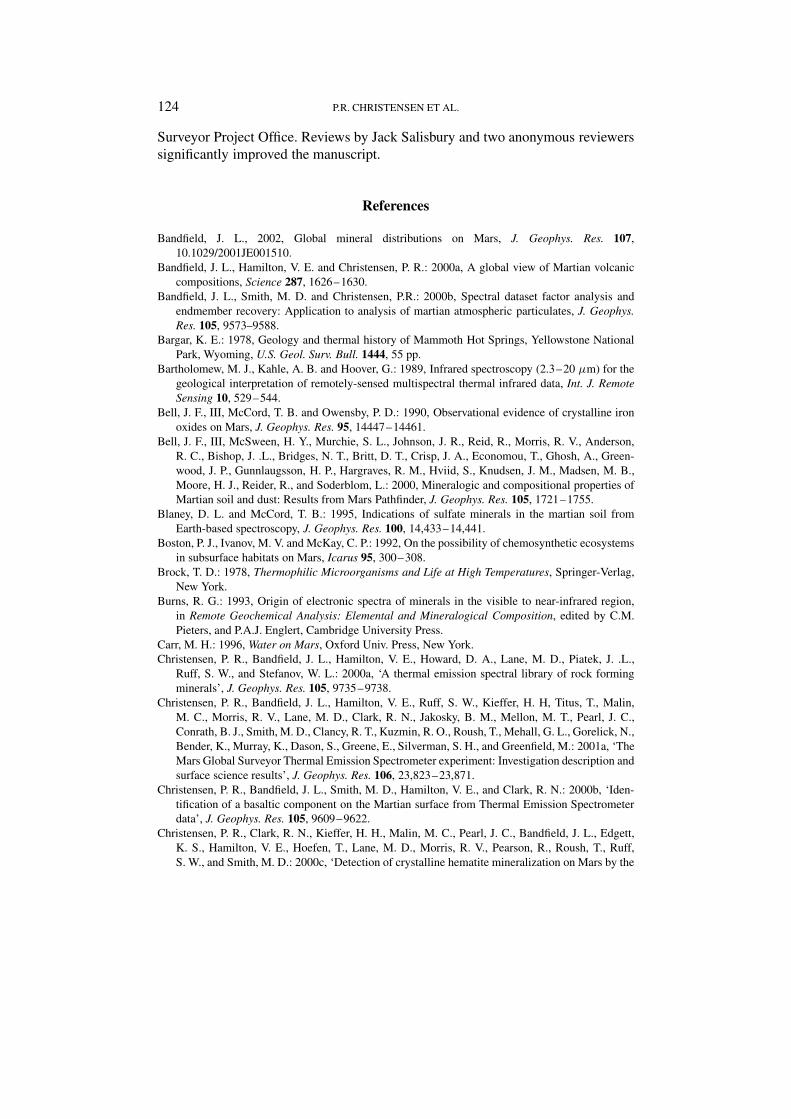
124 P.R. CHRISTENSEN ET AL.
Surveyor Project Office. Reviews by Jack Salisbury and two anonymous reviewerssignificantly improved the manuscript.
References
Bandfield, J. L., 2002, Global mineral distributions on Mars, J. Geophys. Res. 107,10.1029/2001JE001510.
Bandfield, J. L., Hamilton, V. E. and Christensen, P. R.: 2000a, A global view of Martian volcaniccompositions, Science 287, 1626–1630.
Bandfield, J. L., Smith, M. D. and Christensen, P.R.: 2000b, Spectral dataset factor analysis andendmember recovery: Application to analysis of martian atmospheric particulates, J. Geophys.Res. 105, 9573–9588.
Bargar, K. E.: 1978, Geology and thermal history of Mammoth Hot Springs, Yellowstone NationalPark, Wyoming, U.S. Geol. Surv. Bull. 1444, 55 pp.
Bartholomew, M. J., Kahle, A. B. and Hoover, G.: 1989, Infrared spectroscopy (2.3–20 µm) for thegeological interpretation of remotely-sensed multispectral thermal infrared data, Int. J. RemoteSensing 10, 529–544.
Bell, J. F., III, McCord, T. B. and Owensby, P. D.: 1990, Observational evidence of crystalline ironoxides on Mars, J. Geophys. Res. 95, 14447–14461.
Bell, J. F., III, McSween, H. Y., Murchie, S. L., Johnson, J. R., Reid, R., Morris, R. V., Anderson,R. C., Bishop, J. .L., Bridges, N. T., Britt, D. T., Crisp, J. A., Economou, T., Ghosh, A., Green-wood, J. P., Gunnlaugsson, H. P., Hargraves, R. M., Hviid, S., Knudsen, J. M., Madsen, M. B.,Moore, H. J., Reider, R., and Soderblom, L.: 2000, Mineralogic and compositional properties ofMartian soil and dust: Results from Mars Pathfinder, J. Geophys. Res. 105, 1721–1755.
Blaney, D. L. and McCord, T. B.: 1995, Indications of sulfate minerals in the martian soil fromEarth-based spectroscopy, J. Geophys. Res. 100, 14,433–14,441.
Boston, P. J., Ivanov, M. V. and McKay, C. P.: 1992, On the possibility of chemosynthetic ecosystemsin subsurface habitats on Mars, Icarus 95, 300–308.
Brock, T. D.: 1978, Thermophilic Microorganisms and Life at High Temperatures, Springer-Verlag,New York.
Burns, R. G.: 1993, Origin of electronic spectra of minerals in the visible to near-infrared region,in Remote Geochemical Analysis: Elemental and Mineralogical Composition, edited by C.M.Pieters, and P.A.J. Englert, Cambridge University Press.
Carr, M. H.: 1996, Water on Mars, Oxford Univ. Press, New York.Christensen, P. R., Bandfield, J. L., Hamilton, V. E., Howard, D. A., Lane, M. D., Piatek, J. .L.,
Ruff, S. W., and Stefanov, W. L.: 2000a, ‘A thermal emission spectral library of rock formingminerals’, J. Geophys. Res. 105, 9735–9738.
Christensen, P. R., Bandfield, J. L., Hamilton, V. E., Ruff, S. W., Kieffer, H. H, Titus, T., Malin,M. C., Morris, R. V., Lane, M. D., Clark, R. N., Jakosky, B. M., Mellon, M. T., Pearl, J. C.,Conrath, B. J., Smith, M. D., Clancy, R. T., Kuzmin, R. O., Roush, T., Mehall, G. L., Gorelick, N.,Bender, K., Murray, K., Dason, S., Greene, E., Silverman, S. H., and Greenfield, M.: 2001a, ‘TheMars Global Surveyor Thermal Emission Spectrometer experiment: Investigation description andsurface science results’, J. Geophys. Res. 106, 23,823–23,871.
Christensen, P. R., Bandfield, J. L., Smith, M. D., Hamilton, V. E., and Clark, R. N.: 2000b, ‘Iden-tification of a basaltic component on the Martian surface from Thermal Emission Spectrometerdata’, J. Geophys. Res. 105, 9609–9622.
Christensen, P. R., Clark, R. N., Kieffer, H. H., Malin, M. C., Pearl, J. C., Bandfield, J. L., Edgett,K. S., Hamilton, V. E., Hoefen, T., Lane, M. D., Morris, R. V., Pearson, R., Roush, T., Ruff,S. W., and Smith, M. D.: 2000c, ‘Detection of crystalline hematite mineralization on Mars by the
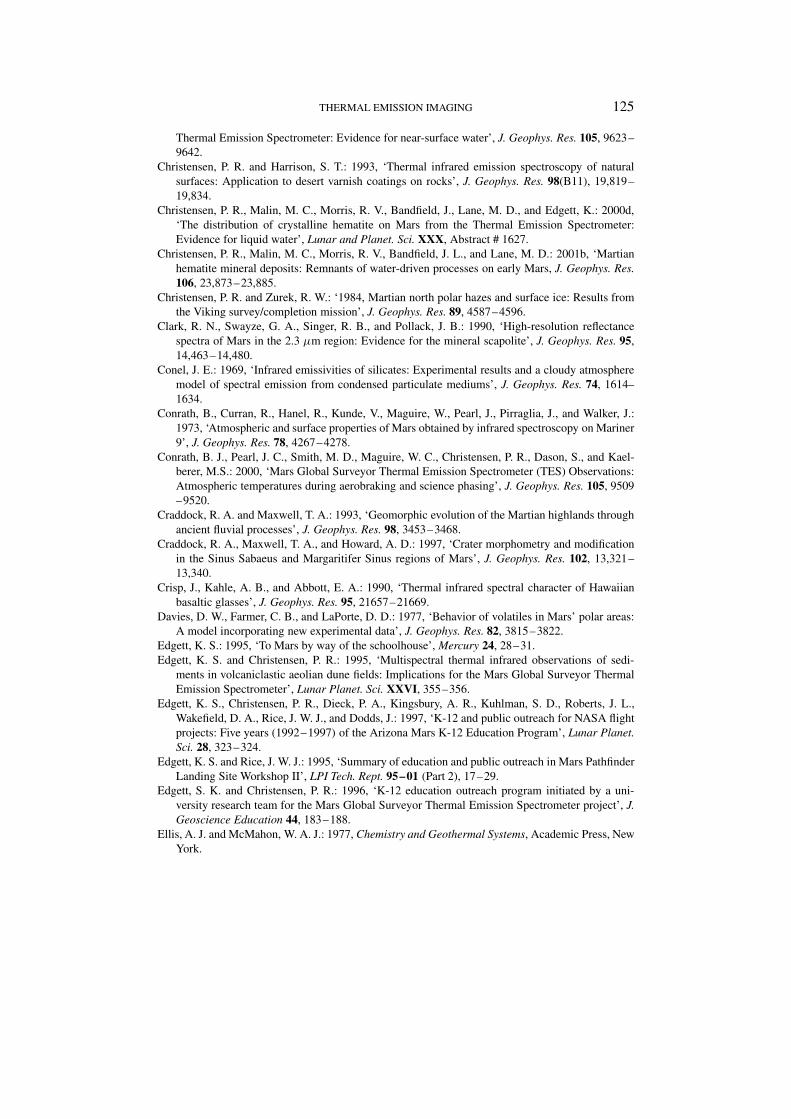
THERMAL EMISSION IMAGING 125
Thermal Emission Spectrometer: Evidence for near-surface water’, J. Geophys. Res. 105, 9623–9642.
Christensen, P. R. and Harrison, S. T.: 1993, ‘Thermal infrared emission spectroscopy of naturalsurfaces: Application to desert varnish coatings on rocks’, J. Geophys. Res. 98(B11), 19,819–19,834.
Christensen, P. R., Malin, M. C., Morris, R. V., Bandfield, J., Lane, M. D., and Edgett, K.: 2000d,‘The distribution of crystalline hematite on Mars from the Thermal Emission Spectrometer:Evidence for liquid water’, Lunar and Planet. Sci. XXX, Abstract # 1627.
Christensen, P. R., Malin, M. C., Morris, R. V., Bandfield, J. L., and Lane, M. D.: 2001b, ‘Martianhematite mineral deposits: Remnants of water-driven processes on early Mars, J. Geophys. Res.106, 23,873–23,885.
Christensen, P. R. and Zurek, R. W.: ‘1984, Martian north polar hazes and surface ice: Results fromthe Viking survey/completion mission’, J. Geophys. Res. 89, 4587–4596.
Clark, R. N., Swayze, G. A., Singer, R. B., and Pollack, J. B.: 1990, ‘High-resolution reflectancespectra of Mars in the 2.3 µm region: Evidence for the mineral scapolite’, J. Geophys. Res. 95,14,463–14,480.
Conel, J. E.: 1969, ‘Infrared emissivities of silicates: Experimental results and a cloudy atmospheremodel of spectral emission from condensed particulate mediums’, J. Geophys. Res. 74, 1614–1634.
Conrath, B., Curran, R., Hanel, R., Kunde, V., Maguire, W., Pearl, J., Pirraglia, J., and Walker, J.:1973, ‘Atmospheric and surface properties of Mars obtained by infrared spectroscopy on Mariner9’, J. Geophys. Res. 78, 4267–4278.
Conrath, B. J., Pearl, J. C., Smith, M. D., Maguire, W. C., Christensen, P. R., Dason, S., and Kael-berer, M.S.: 2000, ‘Mars Global Surveyor Thermal Emission Spectrometer (TES) Observations:Atmospheric temperatures during aerobraking and science phasing’, J. Geophys. Res. 105, 9509–9520.
Craddock, R. A. and Maxwell, T. A.: 1993, ‘Geomorphic evolution of the Martian highlands throughancient fluvial processes’, J. Geophys. Res. 98, 3453–3468.
Craddock, R. A., Maxwell, T. A., and Howard, A. D.: 1997, ‘Crater morphometry and modificationin the Sinus Sabaeus and Margaritifer Sinus regions of Mars’, J. Geophys. Res. 102, 13,321–13,340.
Crisp, J., Kahle, A. B., and Abbott, E. A.: 1990, ‘Thermal infrared spectral character of Hawaiianbasaltic glasses’, J. Geophys. Res. 95, 21657–21669.
Davies, D. W., Farmer, C. B., and LaPorte, D. D.: 1977, ‘Behavior of volatiles in Mars’ polar areas:A model incorporating new experimental data’, J. Geophys. Res. 82, 3815–3822.
Edgett, K. S.: 1995, ‘To Mars by way of the schoolhouse’, Mercury 24, 28–31.Edgett, K. S. and Christensen, P. R.: 1995, ‘Multispectral thermal infrared observations of sedi-
ments in volcaniclastic aeolian dune fields: Implications for the Mars Global Surveyor ThermalEmission Spectrometer’, Lunar Planet. Sci. XXVI, 355–356.
Edgett, K. S., Christensen, P. R., Dieck, P. A., Kingsbury, A. R., Kuhlman, S. D., Roberts, J. L.,Wakefield, D. A., Rice, J. W. J., and Dodds, J.: 1997, ‘K-12 and public outreach for NASA flightprojects: Five years (1992–1997) of the Arizona Mars K-12 Education Program’, Lunar Planet.Sci. 28, 323–324.
Edgett, K. S. and Rice, J. W. J.: 1995, ‘Summary of education and public outreach in Mars PathfinderLanding Site Workshop II’, LPI Tech. Rept. 95–01 (Part 2), 17–29.
Edgett, S. K. and Christensen, P. R.: 1996, ‘K-12 education outreach program initiated by a uni-versity research team for the Mars Global Surveyor Thermal Emission Spectrometer project’, J.Geoscience Education 44, 183–188.
Ellis, A. J. and McMahon, W. A. J.: 1977, Chemistry and Geothermal Systems, Academic Press, NewYork.
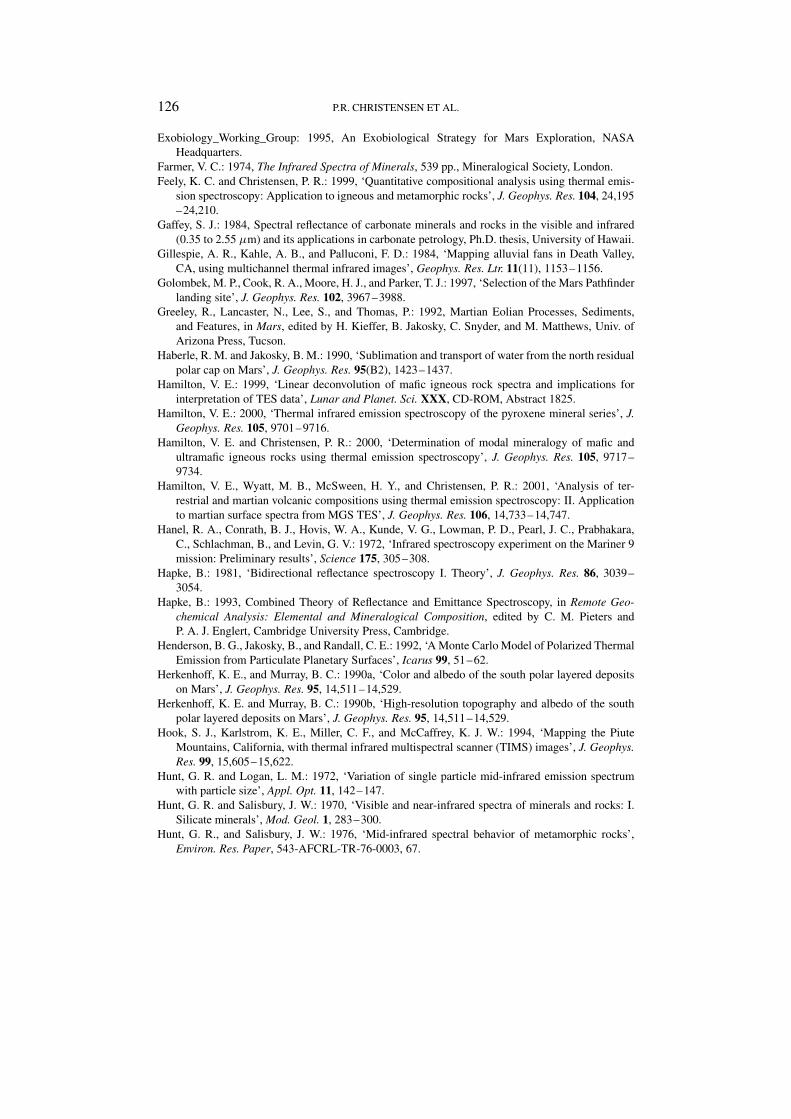
126 P.R. CHRISTENSEN ET AL.
Exobiology_Working_Group: 1995, An Exobiological Strategy for Mars Exploration, NASAHeadquarters.
Farmer, V. C.: 1974, The Infrared Spectra of Minerals, 539 pp., Mineralogical Society, London.Feely, K. C. and Christensen, P. R.: 1999, ‘Quantitative compositional analysis using thermal emis-
sion spectroscopy: Application to igneous and metamorphic rocks’, J. Geophys. Res. 104, 24,195–24,210.
Gaffey, S. J.: 1984, Spectral reflectance of carbonate minerals and rocks in the visible and infrared(0.35 to 2.55 µm) and its applications in carbonate petrology, Ph.D. thesis, University of Hawaii.
Gillespie, A. R., Kahle, A. B., and Palluconi, F. D.: 1984, ‘Mapping alluvial fans in Death Valley,CA, using multichannel thermal infrared images’, Geophys. Res. Ltr. 11(11), 1153–1156.
Golombek, M. P., Cook, R. A., Moore, H. J., and Parker, T. J.: 1997, ‘Selection of the Mars Pathfinderlanding site’, J. Geophys. Res. 102, 3967–3988.
Greeley, R., Lancaster, N., Lee, S., and Thomas, P.: 1992, Martian Eolian Processes, Sediments,and Features, in Mars, edited by H. Kieffer, B. Jakosky, C. Snyder, and M. Matthews, Univ. ofArizona Press, Tucson.
Haberle, R. M. and Jakosky, B. M.: 1990, ‘Sublimation and transport of water from the north residualpolar cap on Mars’, J. Geophys. Res. 95(B2), 1423–1437.
Hamilton, V. E.: 1999, ‘Linear deconvolution of mafic igneous rock spectra and implications forinterpretation of TES data’, Lunar and Planet. Sci. XXX, CD-ROM, Abstract 1825.
Hamilton, V. E.: 2000, ‘Thermal infrared emission spectroscopy of the pyroxene mineral series’, J.Geophys. Res. 105, 9701–9716.
Hamilton, V. E. and Christensen, P. R.: 2000, ‘Determination of modal mineralogy of mafic andultramafic igneous rocks using thermal emission spectroscopy’, J. Geophys. Res. 105, 9717–9734.
Hamilton, V. E., Wyatt, M. B., McSween, H. Y., and Christensen, P. R.: 2001, ‘Analysis of ter-restrial and martian volcanic compositions using thermal emission spectroscopy: II. Applicationto martian surface spectra from MGS TES’, J. Geophys. Res. 106, 14,733–14,747.
Hanel, R. A., Conrath, B. J., Hovis, W. A., Kunde, V. G., Lowman, P. D., Pearl, J. C., Prabhakara,C., Schlachman, B., and Levin, G. V.: 1972, ‘Infrared spectroscopy experiment on the Mariner 9mission: Preliminary results’, Science 175, 305–308.
Hapke, B.: 1981, ‘Bidirectional reflectance spectroscopy I. Theory’, J. Geophys. Res. 86, 3039–3054.
Hapke, B.: 1993, Combined Theory of Reflectance and Emittance Spectroscopy, in Remote Geo-chemical Analysis: Elemental and Mineralogical Composition, edited by C. M. Pieters andP. A. J. Englert, Cambridge University Press, Cambridge.
Henderson, B. G., Jakosky, B., and Randall, C. E.: 1992, ‘A Monte Carlo Model of Polarized ThermalEmission from Particulate Planetary Surfaces’, Icarus 99, 51–62.
Herkenhoff, K. E., and Murray, B. C.: 1990a, ‘Color and albedo of the south polar layered depositson Mars’, J. Geophys. Res. 95, 14,511–14,529.
Herkenhoff, K. E. and Murray, B. C.: 1990b, ‘High-resolution topography and albedo of the southpolar layered deposits on Mars’, J. Geophys. Res. 95, 14,511–14,529.
Hook, S. J., Karlstrom, K. E., Miller, C. F., and McCaffrey, K. J. W.: 1994, ‘Mapping the PiuteMountains, California, with thermal infrared multispectral scanner (TIMS) images’, J. Geophys.Res. 99, 15,605–15,622.
Hunt, G. R. and Logan, L. M.: 1972, ‘Variation of single particle mid-infrared emission spectrumwith particle size’, Appl. Opt. 11, 142–147.
Hunt, G. R. and Salisbury, J. W.: 1970, ‘Visible and near-infrared spectra of minerals and rocks: I.Silicate minerals’, Mod. Geol. 1, 283–300.
Hunt, G. R., and Salisbury, J. W.: 1976, ‘Mid-infrared spectral behavior of metamorphic rocks’,Environ. Res. Paper, 543-AFCRL-TR-76-0003, 67.
THERMAL EMISSION IMAGING 127
Hunt, G. R. and Vincent, R. K.: 1968, ‘The behavior of spectral features in the infrared emissionfrom particulate surfaces of various grain sizes’, J. Geophys. Res. 73, 6039–6046.
Jakosky, B. M.: 1998, The Search for Life on Other Planets, 336 pp., Cambridge Univ. Press.Jakosky, B. M., Mellon, M. T., Kieffer, H. H., Christensen, P. R., Varnes, E. S., and Lee, S. W.: 2000,
‘The thermal inertia of Mars from the Mars Global Surveyor Thermal Emission Spectrometer’,J. Geophys. Res. 105, 9643–9652.
Jakosky, B. M. and Shock, E. L.: 1998, ‘The biological potential of Mars, the early Earth, andEuropa’, J. Geophys. Res. 103, 19359–19364.
James, P. B. and North, G. R.: 1982, ‘The seasonal CO2 cycle on Mars: An application of an energybalance climate model’, J. Geophys. Res. 87, 10,271–10,284.
Johnson, J. R., Christensen, P. R., and Lucey, P. G.: in press, ‘Dust coatings on basalt and implicationsfor thermal infrared spectroscopy of Mars’, J. Geophys. Res.
Kahle, A., Palluconi, F. D., and Christensen, P. R.: 1993, Thermal emission spectroscopy: Ap-plication to Earth and Mars, in Remote Geochemical Analysis: Elemental and MineralogicalComposition, edited by C.M. Pieters, and P.A.J. Englert, pp. 99–120, Cambridge UniversityPress, Cambridge.
Kahle, A. B., Madura, D. P., and Soha, J. M.: 1980, ‘Middle infrared multispectral aircraft scannerdata: Analysis for geological applications’, Appl. Optics 19, 2279–2290.
Kieffer, H. H.: 1979, ‘Mars south polar spring and summer temperatures: A residual CO2 frost’, J.Geophys. Res. 84, 8263–8289.
Kieffer, H. H.: 1990, ‘H2O grain size and the amount of dust in Mars’ residual north polar cap’, J.Geophys. Res. 95, 1481–1494.
Kieffer, H. H., Martin, T. Z., Peterfreund, A. R., Jakosky, B. M., Miner, E. D., and Palluconi, F. D.:1977, ‘Thermal and albedo mapping of Mars during the Viking primary mission’, J. Geophys.Res. 82, 4249–4292.
Kieffer, H. H., Titus, T., Mullins, K., and Christensen, P. R.: 2000, ‘Mars south polar cap as observedby the Mars Global Surveyor Thermal Emission Spectrometer’, J. Geophys. Res. 105, 9653–9700.
Kieffer, H. H. and Zent, A. P.: 1992, ‘Quasi-periodic climatic change on Mars, in Mars, edited byH. H. Kieffer, B. M. Jakosky, C. W. Snyder, and M. S. Matthews, Univ. of Arizona Press, Tucson.
Komatsu, G. and Baker, V. R.: 1997, ‘Paleohydrology and flood geomorphology of Ares Vallis’, J.Geophys. Res. 102, 4151–4160.
Lane, M. D. and Christensen, P. R.: 1997, ‘Thermal infrared emission spectroscopy of anhydrouscarbonates’, J. Geophys. Res. 102, 25,581–25,592.
Lazerev, A. N.: 1972, Vibrational spectra and structure of silicates, 302 pp., Consultants Bureau,New York.
Lyon, R. J. P.: 1962, Evaluation of infrared spectroscopy for compositional analysis of lunar andplanetary soils, in Stanford Research Institute Final Report Contract NASr, Stanford ResearchInstitute.
Malin, M. C. and Carr, M. H.: 1999, ‘Groundwater formation of martian valleys’, Nature 397, 589–591.
Malin, M. C. and Edgett, K. S.: 2000, ‘Sedimentary rocks of early Mars’, Science 290, 1927–1937.Malin, M. C. and Edgett, K. S.: 2001, ‘Mars Global Surveyor Mars Orbiter Camera: Interplanetary
cruise through primary mission’, J. Geophys. Res. 106, 23,429–23,570.Martin, T. Z.: 1986, ‘Thermal infrared opacity of the mars atmosphere’, Icarus 66, 2–21.McCord, T. B., Clark, R. N., and Singer, R. B.: 1982, ‘Mars: Near-infrared reflectance spectra of
surface regions and compositional implications’, J. Geophys. Res. 87, 3021–3032.McKay, D. S., E. K. G. Jr., Thomas-Keprta, K. L., Vali, H., Romanek, C. S., Clemett, S. J., Chillier,
X. D. F., Maechling, C. R., and Zare, R. N.: 1996, ‘Search for past life on Mars: Possible relicbiogenic activity in martian meteorite ALH84001’, Science 273, 924–930.
128 P.R. CHRISTENSEN ET AL.
McSween, H. Y., Jr.: 1994, ‘What have we learned about Mars from SNC meteorites’, Meteoritics29, 757–779.
Mellon, M. T., Jakosky, B. M., Kieffer, H. H., and Christensen, P. R.: 2000, ‘High resolution thermalinertia mapping from the Mars Global Surveyor Thermal Emission Spectrometer’, Icarus 148,437–455.
Moersch, J. E. and Christensen, P. R.: 1995, ‘Thermal emission from particulate surfaces: Acomparison of scattering models with measured spectra’, J. Geophys. Res. 100, 7,465–7,477.
Morris, R. V., Gooding, J. L., Lauer, J. H. V., and Singer, R. B.: 1990, ‘Origins of Marslike spectraland magnetic properties of a Hawaiian palagonitic soil’, J. Geophys. Res. 95, 14,427–14,435.
Mustard, J. F., Erard, S., Bibring, J.-P., Head, J. W., Hurtrez, S., Langevin, Y., Pieters, C. M., andSotin, C. J.: 1993, ‘The surface of Syrtis Major: Composition of the volcanic substrate and mixingwith altered dust and soil’, J. Geophys. Res. 98, 3387–3400.
Mustard, J. F. and Hays, J. E.: 1997, ‘Effects of hyperfine particles on reflectance spectra from 0.3 to25 µm’, Icarus (125), 145–163.
Mustard, J. F. and Sunshine, J. M.: 1995, ‘Seeing through the dust: Martian crustal heterogeneity andlinks to the SNC meteorites’, Science 267, 1623–1626.
Nash, D. B. and Salisbury, J. W.: 1991, ‘Infrared reflectance spectra of plagioclase feldspars’,Geophys. Res. Lett. 18, 1151–1154.
Paige, D. A. and Ingersoll, A. P.: 1985, ‘Annual heat balance of martian polar caps: Vikingobservations’, Science 228, 1160–1168.
Palluconi, F. D. and Meeks, G. R.: 1985, Thermal infrared multispectral scanner (TIMS): Aninvestigator’s guide to TIMS data, Jet Propulsion Laboratory.
Pearl, J. C., Smith, M. D., Conrath, B. J., Bandfield, J. L., and Christensen, P. R.: 2001, ‘Observationsof water-ice clouds by the Mars Global Surveyor Thermal Emission Spectrometer experiment:The first martian year’, J. Geophys. Res. 12,325–12,338.
Pentecost, A.: 1996, High Temperature Ecosystems and their Chemical Interactions with their Envir-onment, in Evolution of Hydrothermal Ecosystems on Earth (and Mars?), edited by G. R. Bock,and J. A. Goode, pp. 99–111, John Wiley and Sons, Chichester.
Pimentel, G. C., Forney, P. B., and Herr, K. C.: 1974, ‘Evidence about hydrate and solid water inthe martian surface from the 1969 Mariner infrared spectrometer’, J. Geophys. Res. 79 (No. 11),1623–1634.
Ramsey, M. S.: 1996, Quantitative Analysis of Geologic Surfaces: A Deconvolution Algorithm forMidinfrared Remote Sensing Data, Ph.D Dissertation thesis, Arizona State University.
Ramsey, M. S. and Christensen, P. R.: 1992, The linear ‘un-mixing’ of laboratory thermal infraredspectra: Implications for the Thermal Emission Spectrometer (TES) experiment, Mars Observer,Lunar & Planet. Sci. XXIII, 1127–1128.
Ramsey, M. S. and Christensen, P. R.: 1998, ‘Mineral abundance determination: Quantitativedeconvolution of thermal emission spectra’, J. Geophys. Res. 103, 577–596.
Ramsey, M. S., Christensen, P. R., Lancaster, N., and Howard, D .A.: 1999, ‘Identification ofsand sources and transport pathways at Kelso Dunes, California using thermal infrared remotesensing’, Geol. Soc. Am. Bull. 111, 636–662.
Roush, T. L., Blaney, D. L., and Singer, R. B.: 1993, The surface composition of Mars as inferredfrom spectroscopic observations, in Remote Geochemical Analysis: Elemental and MineralogicalComposition, edited by C. M. Pieters, and P. A. J. Englert, Cambridge University Press.
Ruff, S. W. and Christensen, P. R.: 2002, ‘Bright and dark regions on Mars: Particle size and min-eralogical characteristics based on Thermal Emission Spectrometer data’, J. Geophys. Res., inpress.
Salisbury, J. W.: 1993, Mid-infrared spectroscopy: Laboratory data, in Remote Geochemical Ana-lysis: Elemental and Mineralogical Composition, edited by C. Pieters, and P. Englert, pp. Ch. 4,Cambridge University Press, Cambridge.

THERMAL EMISSION IMAGING 129
Salisbury, J. W., D’Aria, D. M., and Jarosewich, E.: 1991, ‘Mid-infrared (2.5–13.5 um) reflectancespectra of powdered stony meteorites’, Icarus 92, 280–297.
Salisbury, J. W. and Eastes, J. W.: 1985, ‘The effect of particle size and porosity on spectral contrastin the mid-infrared’, Icarus 64, 586–588.
Salisbury, J. W., Hapke, B., and Eastes, J. W.: 1987a, ‘Usefulness of weak bands in midinfraredremote sensing of particulate planetary surfaces’, J. Geophys. Res. 92, 702–710.
Salisbury, J. W. and Wald, A.: 1992, ‘The role of volume scattering in reducing spectral contrast ofreststrahlen bands in spectra of powdered minerals’, Icarus 96, 121–128.
Salisbury, J. W., Wald, A., and D’Aria, D. M.: 1994, ‘Thermal-infrared remote sensing andKirchhoff’s law 1. Laboratory measurements’, J. Geophys. Res. 99, 11897–11911.
Salisbury, J. W. and Walter, L. S.: 1989, ‘Thermal infrared (2.5–13.5 µm) spectroscopic remotesensing of igneous rock types on particulate planetary surfaces’, J. Geophys. Res. 94(No. B7),9192–9202.
Salisbury, J. W., Walter, L. S., and Vergo, N.: 1987b, Mid-infrared (2.1–25 µm) spectra of minerals:First Edition, in U.S.G.S., Open File Report, pp. 87–263, U. S. Geological Survey Open FileReport.
Selivanov, A. S., Naraeva, M. K., Panfilov, A. S., Gektin, Y. M., Kharlamov, V. D., Romanov, A. V.,Fomin, D. A., and Miroshnichenko, Y. Y.: 1989, ‘Thermal imaging of the surface of Mars’,Nature 341, 593–595.
Shock, E. L.: 1997, ‘High temperature life without photosynthesis as a model for Mars’, J. Geophys.Res.
Shoemaker, E. M.: 1963, Impact mechanics at Meteor Crater, Arizona, in The Moon, Meteorites, andComets, edited by B. M. Middlehurst, and G. P. Kuiper, pp. 301–336, Univ. of Chicago Press,Chicago.
Silverman, S., Bates, D., Schueler, C., O’Donnell, B., Christensen, P., Mehall, G., Tourville, T.and Cannon, G.: 1999, Miniature Thermal Emission Spectrometer for the Mars 2001 Lander,Proceedings of the IEEE.
Singer, R. B.: 1982, ‘Spectral evidence for the mineralogy of high-albedo soils and dust on Mars’, J.Geophys. Res. 87, 10,159–10,168.
Smith, M. D., Bandfield, J. L., and Christensen, P. R.: 2000, ‘Separation of atmospheric and sur-face spectral features in Mars Global Surveyor Thermal Emission Spectrometer (TES) spectra:Models and atmospheric properties’, J. Geophys. Res. 105, 9589–9608.
Smith, M. D., Conrath, B. J., Pearl, J. C., and Christensen, P. R.: 2002, ‘Thermal EmissionSpectrometer observations of martian planet-encircling dust storm 2001A’, Icarus 157, 259–263.
Smith, M. D., Pearl, J. C., Conrath, B. J., and Christensen, P. R.: 2001a, ‘Thermal Emission Spec-trometer results: Mars atmospheric thermal structure and aerosol distribution’, J. Geophys. Res.106, 23929–23945.
Smith, M. D., Pearl, J. C., Conrath, B. J., and Christensen, P. R.: 2001b, ‘One Martian year ofatmospheric observations by the Thermal Emission Spectrometer’, Geophys. Res. Letters 28,4263–4266.
Smith, M. D., Pearl, J. C., Conrath, B. J., and Christensen, P. R.: 2001c, ‘Thermal Emission Spec-trometer results: Atmospheric thermal structure and aerosol distribution’, J. Geophys. Res. 106,23,929–23,945.
Stevens, T. O. and McKinley, J. P.: 1995, ‘Lithoautotrophic microbial ecosystems in deep basaltaquifers’, Science 270, 450–454.
Tamppari, L. K., Zurek, R. W., and Paige, D. A.: 2000, ‘Viking era water ice clouds’, J. Geophys.Res. 105, 4087–4107.
Tanaka, K. L.: 1997, ‘Sedimentary history and mass flow structures of Chryse and Acidalia Planitiae’,Mars, J. Geophys. Res. 102, 4131–4149.
130 P.R. CHRISTENSEN ET AL.
Tanaka, K. L. and Leonard, G. J.: 1995, ‘Geology and landscape evolution of the Hellas region ofMars’, J. Geophys. Res. 100, 5407–5432.
Thomas, P. and Gierasch, P. J.: 1995, ‘Polar margin dunes and winds on Mars’, J. Geophys. Res. 100,5379–5406.
Thomas, P. C., Malin, M. C., and Edgett, K. S.: 2000, ‘North-south geological differences betweenthe residual polar caps on Mars’, Nature 404, 161–164.
Thomas, P. C., Squyres, S., Herkenhoff, K., Howard, A., and Murray, B.: 1992, Polar deposits ofMars in Mars, in Mars, edited by H. Kieffer, B. Jakosky, C. Snyder, and M. Matthews, pp. 767–795, Univ. Arizona Press, Tucson.
Thomas, P. C. and Weitz, C.: 1989, ‘Sand dune materials and polar layered deposits on Mars’, Icarus81, 185–215.
Thomson, J. L. and Salisbury, J. W.: 1993, ‘The mid-infrared reflectance of mineral mixtures (7–14 µm)’, Remote Sensing of Environment 45, 1–13.
Titus, T. N., Kieffer, H. H., Mullins, K. F., and Christensen, P. R.: 2001, ‘TES Pre-mapping data: Slabice and snow flurries in the Martian north polar night’, J. Geophys. Res. 106, 23,181–23,196.
Van der Marel, H. W. and Beeutelspacher, H.: 1976, Atlas of infrared spectroscopy of clay mineralsand their admixtures, 396pp., Elsevier Scientific Publishing Co., Amsterdam.
Vincent, R. K. and Hunt, G. R.: 1968, ‘Infrared reflectance from mat surfaces’, Appl. Opt. 7, 53–59.Vincent, R. K. and Thompson, F.: 1972, ‘Spectral compositional imaging of silicate rocks’, J.
Geophys. Res. 17 (No. 14), 2465–2472.Wald, A. E. and Salisbury, J. W.: 1995, ‘Thermal infrared emissivity of powdered quartz’, J. Geophys.
Res. 100, 24665–24675.Walter, M. R. and Des Marais, D. J.: 1993, ‘Preservation of biological information in thermal spring
deposits: Developing a strategy for the search for fossil life on Mars’, Icarus 101, 129–143.White, D. E., Hutchinson, R. A., and Keith, T. E. C.: 1988, The Geology and Remarkable Thermal
Acitivty of Norris Geyser Basin, Yellowstone National Park, U.S. Geol. Survey Prof. Paper 1456.Wilson, E. B., Jr., Decius, J. C., and Cross, P. C.: 1955, Molecular Vibrations: The Theory of Infrared
and Raman Vibrational Spectra, McGraw-Hill.Wyatt, M. B.„ Hamilton, V. E., McSween, J. H. Y., Christensen, P. R., and Taylor, L. A.: 2001,
‘Analysis of terrestrial and martian volcanic compositions using thermal emission spectroscopy:I. Determination of mineralogy, chemistry, and classification strategies’, J. Geophys. Res. 106,14,711–14,732.
Young, J.: 1999a, FM1 Absolute radiometric calibration reflectance region: uncertainty estimate,Raytheon Santa Barbara Remote Sensing, Santa Barbara.
Young, J.: 1999b, FM1 Absolute radiometric calibration thermal region: uncertainty estimate,Raytheon Santa Barbara Remote Sensing, Santa Barbara.
Young, J.: 1999c, Summary of the Blackbody Calibration Source (BCS) and Space View Source(SVS) refurbishment and calibration process, Raytheon Santa Barbara Remote Sensing, SantaBarbara.