Embed Size (px)
Citation preview

The Tennessee Commission on
Education Recovery and Innovation
Preliminary Report to the General Assembly:
Effects of the COVID-19 Pandemic
on Tennessee’s Educational Systems
December 24, 2020
Commissioners: Dr. Marie Chisholm-Burns; David Coffey; Todd Dickson; Youlanda Jones; Dr. Robert
Christopher Jones; Frank Rothermel; Glenn Swift; Dr. Joey Vaughn, Vice-Chair; Tara Scarlett, Chair.

2
Table of Contents
Introduction and Legal Authority .......................................................................................... 3
Executive Summary............................................................................................................... 4
National Context of Tennessee Education Pre-Pandemic ....................................................... 6
K-12 ...................................................................................................................................... 6 i. Data ............................................................................................................................................................ 7 ii. Federal CARES Act Provisions K-12 ......................................................................................................... 7 iii. K-12 Operations ......................................................................................................................................... 7 iv. Elementary Academics ............................................................................................................................... 9 v. High School .............................................................................................................................................. 10 vi. K-12 Enrollment ....................................................................................................................................... 14 vii. K-12 Staffing ............................................................................................................................................ 16
Tennessee Higher Education: Contextual Overview ............................................................. 16 i. Student/Institution Effects: Transitions and Resourcing .......................................................................... 17 ii. Fall 2020: Student Enrollment Trends ...................................................................................................... 19 iii. Fiscal Implications for Students: Tuition & Financial Aid ....................................................................... 20 iv. Fiscal Implications for Higher Education Institutions: State Funding & Tuition Revenues ..................... 20 v. Federal CARES Act Provisions Higher Education ................................................................................... 21
Tennessee Student Well-Being ............................................................................................. 22
Conclusions and Next Steps ................................................................................................. 23
Acknowledgements………………………………………………………………………………25
Acronym Glossary ............................................................................................................... 25
Appendices ……………………………………………… https://www.tn.gov/sbe/committees-
and-initiatives/education-recovery-and-innovation-commission/commission-reports.html

3
Introduction and Legal Authority
With the unprecedented spread of COVID-19, combined with tornadoes devasting the state of Tennessee
in the spring of 2020, the Governor and the Tennessee General Assembly took several steps to address the
effects of this public health crisis on the state's educational system for both the short- and the long-term.
Days before taking a two-month emergency recess, the legislature passed measures granting emergency
rulemaking authority to the State Board of Education (SBE) and allowed the Tennessee Higher Education
Commission (THEC) to make changes to attendance, operational timeframes and structures, and
graduation requirements. During this time of crisis, provisions to alter rules and policies necessary to
support ongoing operations of Tennessee's school districts and institutions of higher education were also
granted.
On June 17, 2020, the House of Representatives joined their Senate colleagues in unanimously passing
Senate Bill 11974, thereby creating the nine-member Tennessee Commission on Education Recovery and
Innovation to examine short-and long-term systemic effects on the state's educational systems of the
COVID-19 pandemic and natural disasters of 2020. This act later became Public Chapter 792, which
recognized in law the pandemic will likely affect students for the next twelve years and charged the new
commission to:
"advise and make recommendations to the general assembly, the state board of education, the
department of education, the Tennessee higher education commission, and the state institutions of
higher education on strategies to close educational gaps resulting from school closures, and to
modernize the state's educational structure from kindergarten to career to create more flexibility
in the delivery of education to students."
The commission's work involves three deliverable reports as detailed in the law:
"The commission shall submit an initial assessment of the effect the COVID-19 pandemic has had
on Tennessee's educational systems to the general assembly no later than January 1, 2021. The
commission shall submit a report on the commission's actions, findings, and recommendations to
the general assembly no later than January 1, 2022 and shall submit a final report on the
commission's actions, findings, and recommendations to the general assembly no later than June
30, 2022."
This report, the first of the three, is required by the statute and designed to provide an accurate snapshot
of Tennessee's educational situation. The commission recognizes as of December 2020 there is limited
data available to reflect the most current impact of COVID-19 on Tennessee's educational system; thus,
we plan on updating this report by 09/15/2021.
1 Public Chapter 792: https://publications.tnsosfiles.com/acts/111/pub/pc0792.pdf

4
Executive Summary
With the onset of the COVID-19 pandemic and the disruption caused by tornadoes in March 2020,
Tennessee's students, parents, teachers, administrators, and educational staff made extraordinary efforts to
support students at all levels from kindergarten through higher education. Our educators demonstrated
remarkable resilience, compassion, and innovation, and these heroic efforts are noted throughout this
report. These efforts, along with the Governor and General Assembly's extra support, have once again
proven Tennessee is largely unafraid to do what is right in the name of better student outcomes.
As we are still in the midst of the pandemic, we do not have final data regarding the effects of COVID-19
on the state’s education systems. The details provided utilize pre-pandemic information, national
education trends, and data collected from a survey sent to all Tennessee's superintendents. Collectively,
early information indicates our entire educational system needs a comprehensive assessment in light of
the pandemic, followed by a holistic kindergarten-to-career plan and substantially more support if we
expect all of Tennessee’s students to thrive in the future.
The Education Recovery and Innovation Commission (ERIC) identified four themes, which will be some
of our primary areas of focus over the next 18 months: learning loss, well-being, post-secondary and
career preparedness, and technology gaps. The one constant across each of these themes is the need to
reimagine support for our most vulnerable students. There continues to be a widening gap among specific
subpopulations, and we do not see this as a rectifiable path if we do not provide deliberate and greater
support for these students now.
For Tennessee to offer the best education to career possible, this commission identified some preliminary
observations/recommendations:
Learning Loss
• Helping prepare students for long-term success by ensuring students are proficient in literacy and
numeracy in kindergarten through third grade.
• Intensive assessment and remediation across the kindergarten through post-secondary education
systems need to occur as many students were behind academically before the pandemic.
• Implementing continuous quality improvement programs with definitive outcome measures in
schools and institutions to ensure all students have opportunities for success.
• New expectations in educator preparation need to include virtual teaching/learning and renewed
focus on early childhood education success.
Well-Being
• Providing greater attention to students, families, teachers, staff, and administrators emotional and
mental well-being as well as bolstering supportive programs that schools provide, which include
supplying meals, counseling services, etc.
Post-Secondary and Career Preparedness
• Improving education transitions as students progress through high school to traditional, career
and technical, and work-based learning pathways that translate into viable jobs and careers. • Identifying and assessing critical and competency-based measures of student success across the
K-12 through post-secondary education systems.
Technology Gaps
• In spite of added investment from state and federal sources, two of the most considerable barriers
to virtual learning are access to technology and high-speed Internet connectivity; thus,
overcoming these challenges (e.g., supply chain demands, ongoing support, etc.) must be taken
into account and addressed.

5
Tennessee is a great state that does not back down from challenges. The pandemic has challenged us in
many ways, but it also provides us with opportunities to improve and implement best practices. Our
children are our future, so our education expectations must match what we imagine our future to be. We
must align a high-quality K-12 education with higher education to tomorrow's jobs to provide economic
and emotional well-being to our citizens.
6
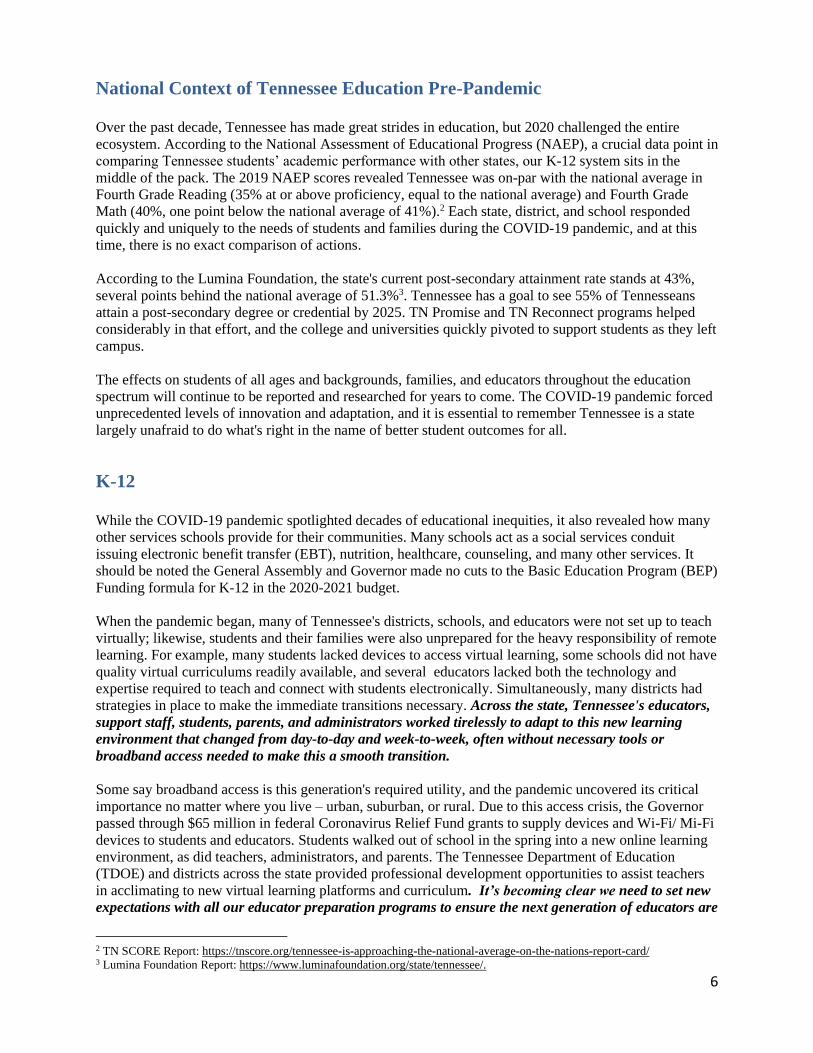
National Context of Tennessee Education Pre-Pandemic
Over the past decade, Tennessee has made great strides in education, but 2020 challenged the entire
ecosystem. According to the National Assessment of Educational Progress (NAEP), a crucial data point in
comparing Tennessee students’ academic performance with other states, our K-12 system sits in the
middle of the pack. The 2019 NAEP scores revealed Tennessee was on-par with the national average in
Fourth Grade Reading (35% at or above proficiency, equal to the national average) and Fourth Grade
Math (40%, one point below the national average of 41%).2 Each state, district, and school responded
quickly and uniquely to the needs of students and families during the COVID-19 pandemic, and at this
time, there is no exact comparison of actions.
According to the Lumina Foundation, the state's current post-secondary attainment rate stands at 43%,
several points behind the national average of 51.3%3. Tennessee has a goal to see 55% of Tennesseans
attain a post-secondary degree or credential by 2025. TN Promise and TN Reconnect programs helped
considerably in that effort, and the college and universities quickly pivoted to support students as they left
campus.
The effects on students of all ages and backgrounds, families, and educators throughout the education
spectrum will continue to be reported and researched for years to come. The COVID-19 pandemic forced
unprecedented levels of innovation and adaptation, and it is essential to remember Tennessee is a state
largely unafraid to do what's right in the name of better student outcomes for all.
K-12
While the COVID-19 pandemic spotlighted decades of educational inequities, it also revealed how many
other services schools provide for their communities. Many schools act as a social services conduit
issuing electronic benefit transfer (EBT), nutrition, healthcare, counseling, and many other services. It
should be noted the General Assembly and Governor made no cuts to the Basic Education Program (BEP)
Funding formula for K-12 in the 2020-2021 budget.
When the pandemic began, many of Tennessee's districts, schools, and educators were not set up to teach
virtually; likewise, students and their families were also unprepared for the heavy responsibility of remote
learning. For example, many students lacked devices to access virtual learning, some schools did not have
quality virtual curriculums readily available, and several educators lacked both the technology and
expertise required to teach and connect with students electronically. Simultaneously, many districts had
strategies in place to make the immediate transitions necessary. Across the state, Tennessee's educators,
support staff, students, parents, and administrators worked tirelessly to adapt to this new learning
environment that changed from day-to-day and week-to-week, often without necessary tools or
broadband access needed to make this a smooth transition.
Some say broadband access is this generation's required utility, and the pandemic uncovered its critical
importance no matter where you live – urban, suburban, or rural. Due to this access crisis, the Governor
passed through $65 million in federal Coronavirus Relief Fund grants to supply devices and Wi-Fi/ Mi-Fi
devices to students and educators. Students walked out of school in the spring into a new online learning
environment, as did teachers, administrators, and parents. The Tennessee Department of Education
(TDOE) and districts across the state provided professional development opportunities to assist teachers
in acclimating to new virtual learning platforms and curriculum. It’s becoming clear we need to set new
expectations with all our educator preparation programs to ensure the next generation of educators are
2 TN SCORE Report: https://tnscore.org/tennessee-is-approaching-the-national-average-on-the-nations-report-card/ 3 Lumina Foundation Report: https://www.luminafoundation.org/state/tennessee/.

7
prepared to teach in the virtual classroom setting in equal quality as the more traditional teaching
delivery model of in-person learning.
Tennessee has 147 school districts with varying numbers of schools and educators supporting
approximately one million students. As a result, quality of instruction and curriculums, as well as
teaching consistency and student experience vary across Tennessee's districts.
i. Data
This report used two primary data sources: TDOE report card and an ERIC district survey. To be clear, at
the time this report was written, TDOE did not have current data on the effects of COVID-19 on student
performance outcomes. As we are still in the midst of a school year and a pandemic, this report shares
historical data pre-pandemic with some additional national context when relevant. As more data becomes
available, we will update this report.
In November 2020, all 147 Tennessee superintendents received a voluntary survey from the ERIC. This
survey required districts to identify themselves as urban, rural, or suburban but did not require them to
disclose the district's name, nor did the survey require respondents to answer all questions (a full list of
questions is listed in the appendix). Eighty-one or 55.1% of the districts responded, of those, 6.17%
urban, 17.28% suburban, 76.54% rural. Readers note the “N” count for each of the charts represents the
number of respondents answering the specific question/item.
ii. Federal CARES Act Provisions K-12
The federal CARES act provided funding to Tennessee in three categories. The first was Elementary and
Secondary Schools Emergency Relief (ESSER) funding of $260 million for districts, $234 million passed
through directly to districts based on the proportion of Title I students. The remaining was used by TDOE
on a variety of resources for districts (see appendices for full list). The second funding category was the
Governor's Emergency Education Relief Fund (GEER), consisting of $64 million directed by the
Governor to various partner groups and strategic initiatives. The last category was the Coronavirus Relief
Fund (CRF), consisting of $155 million for K-12 to provide grants for technology, Internet connectivity,
and educator personal protective equipment (PPE).
iii. K-12 Operations
The pandemic disrupted teaching and instructional models, caused a sudden shutdown of school
buildings, and, in many districts, quickly forced extended building closures for the remainder of the 2019-
20 school year. Districts had to immediately shift how they provided instruction to their students,
resulting in various innovations among systems to ensure students had access to learning opportunities.
Two of the most considerable barriers to online learning include access to technology and high-speed
connectivity. Although the state awarded $65 million in grants supporting access to devices and Internet
connectively, Tennessee is still behind in broad technology adoption for education. Lack of high-speed
Internet and national supply-chain delays in device orders further contributed to technology barriers.

8
Governor Lee dedicated $200 million federal dollars in addition to the direct district dollars distributed
according to the CARES Act to support K-12 education. This helped fill some gaps associated with
technology devices (see Figure 1). However, there is a concern with the ongoing cost of technology
maintenance once the grant and federal dollars end. In addition to the lack of high-speed Internet in some
areas, the monthly cost of Internet service can also be prohibitive for students and families who face
inequities and barriers preventing them from experiencing optimal learning opportunities (e.g.,
disadvantaging conditions or underserved). Thus, even where high-speed Internet is available, many
students will likely not have regular access to it.
Figure 1 N=81
Source: ERIC district survey
As districts shifted their focus to the start of the 2020-21 school year, they had more time to plan how
instruction would occur. While some districts chose to delay the start of their school year, either due to
COVID-19 cases or increased preparation time for teachers, almost all districts had officially started
instruction at the end of August. By the end of September, the vast majority of districts, more than 90%,
were operating a parent-choice model, meaning each family decided whether to attend school in-person or
virtually. Within this model, ERIC district survey respondents noted an average of eighty to ninety
percent of their students attended in-person.
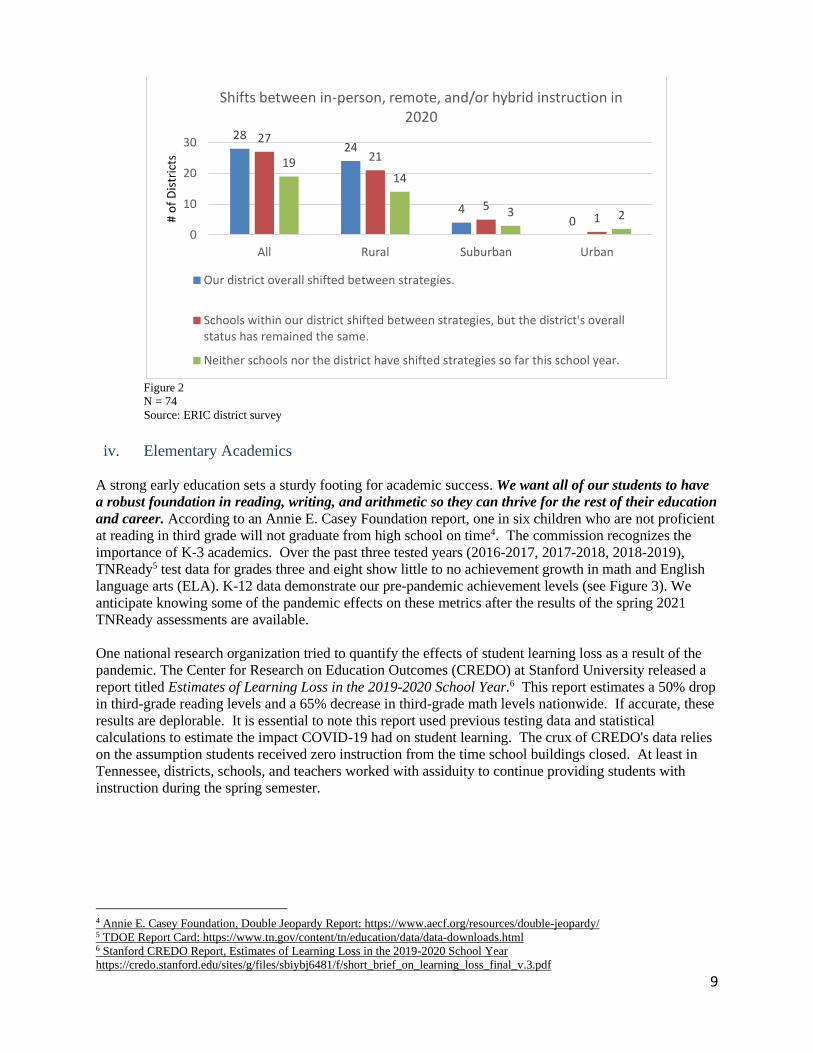
Beyond the complexities of operating both in-person and virtual instruction, entire districts and
countless schools within communities had to completely shift their instructional models from in-person
to a more virtual environment as COVID-19 infection rates increased (see Figure 2). This placed high
levels of stress on everyone, especially district leaders, teachers, staff, students, and families.
14
5 63
31
24
7
00 0 0 0
3633
1 2
0
10
20
30
40
All Rural Suburban Urban
# o
f D
istr
icts
Technology status as of November 2020
All students have access to devices AND all students have access to sufficient Internet speedsto participate in remote learning.
All students have access to devices, but not all students have access to sufficient Internetspeeds to participate in remote learning.
All students have access to sufficient Internet speeds to participate in remote learning, but notall students have access to devices.
Not all students have access to either devices or Internet speeds sufficient to participate inremote learning.
9
Figure 2
N = 74
Source: ERIC district survey
iv. Elementary Academics
A strong early education sets a sturdy footing for academic success. We want all of our students to have
a robust foundation in reading, writing, and arithmetic so they can thrive for the rest of their education
and career. According to an Annie E. Casey Foundation report, one in six children who are not proficient
at reading in third grade will not graduate from high school on time4. The commission recognizes the
importance of K-3 academics. Over the past three tested years (2016-2017, 2017-2018, 2018-2019),
TNReady5 test data for grades three and eight show little to no achievement growth in math and English
language arts (ELA). K-12 data demonstrate our pre-pandemic achievement levels (see Figure 3). We
anticipate knowing some of the pandemic effects on these metrics after the results of the spring 2021
TNReady assessments are available.
One national research organization tried to quantify the effects of student learning loss as a result of the
pandemic. The Center for Research on Education Outcomes (CREDO) at Stanford University released a
report titled Estimates of Learning Loss in the 2019-2020 School Year.6 This report estimates a 50% drop
in third-grade reading levels and a 65% decrease in third-grade math levels nationwide. If accurate, these
results are deplorable. It is essential to note this report used previous testing data and statistical
calculations to estimate the impact COVID-19 had on student learning. The crux of CREDO's data relies
on the assumption students received zero instruction from the time school buildings closed. At least in
Tennessee, districts, schools, and teachers worked with assiduity to continue providing students with
instruction during the spring semester.
4 Annie E. Casey Foundation, Double Jeopardy Report: https://www.aecf.org/resources/double-jeopardy/ 5 TDOE Report Card: https://www.tn.gov/content/tn/education/data/data-downloads.html 6 Stanford CREDO Report, Estimates of Learning Loss in the 2019-2020 School Year
https://credo.stanford.edu/sites/g/files/sbiybj6481/f/short_brief_on_learning_loss_final_v.3.pdf
2824
40
27
21
51
1914
3 2
0
10
20
30
All Rural Suburban Urban
# o
f D
istr
icts
Shifts between in-person, remote, and/or hybrid instruction in 2020
Our district overall shifted between strategies.
Schools within our district shifted between strategies, but the district's overallstatus has remained the same.
Neither schools nor the district have shifted strategies so far this school year.

10
Figure 3
*Lighter regions represent students not on-track/mastered TNReady Data
Source: https://www.tn.gov/content/tn/education/data/data-downloads.html
Demonstrating resilience, innovation and a collaborative mindset, educators and systems around the state
worked hard to find ways to teach students to read in an ever-changing remote environment.
Unconventional partnerships and programs were formed to assist in the process and find solutions. For
example, in an effort to reach students who may not have Internet access, the TDOE and Tennessee
teachers developed a suite of video lessons and partnered with the Public Broadcasting Service (PBS) of
Tennessee to launch a reading series for younger students. The department also teamed with the
Governor’s Early Literacy Foundation (GELF) to launch the ReadyRosie application that uses videos and
mobile technology to prepare students for school.
v. High School Academics
Several statewide academic performance measures including TNReady, ACT scores and graduation rates
indicate K-12 progress stalled from 2015 to 2019. Tennessee uses a "Ready Graduate" measure to
determine if students are prepared for college or career post-graduation (see Figure 4). Specifically, this is
measured based on ACT score. The ACT is a nationally normed college assessment and taking the ACT
is a requirement for high school graduation in Tennessee. Scoring 21 or above suggests a student is
academically ready for college. Due to COVID-19, ACT spring 2020 testing was canceled, but many
districts implemented alternative testing opportunities for the 2020-21 senior class. A large portion of
post-secondary admissions and scholarship funds typically rely on ACT scores, so it's vital for future
planning that students have every opportunity to take the ACT. According to the ERIC district survey,
many districts that held in-person instruction during fall 2020 offered expanded ACT preparation and free
ACT dates for 2021 seniors.
Over the past three years, Tennessee continues to see graduation rates close to 90%, while only 40% of
students are ready for a college experience based on the TDOE's "ready graduate" metric. A review of
last spring's graduation and ready graduate levels reveal little change from the previous year even
though many schools were operating virtually. During this time, an emergency rule passed by the State
Board of Education (SBE) froze student course grades for high school students based on last day of in-
person attendance. That meant the grade could only improve; it could not get worse.

11
Figure 4
Note: "Ready Graduate" uses a score of 21 or above on the ACT or the completion of 2-4 early post-secondary opportunities
combined with industry certifications or military readiness to determine whether students are ready for college and careers
after high school.
Source: TDOE
As a result of extended school closures and remote learning in spring 2020, the state dropped all testing
requirements for the 2019-20 school year, including both TNReady and ACT. Due to a lack of
assessment data from the 2019-20 school year, determining students' progress in the 2020-21 school year
will be difficult.
McKinsey & Company's COVID-19 and Student Learning in the United States: The hurt could last a
lifetime, attempts to quantify learning loss by assuming that K-12 students are receiving varying levels of
virtual instruction: average, low-quality, or no instruction. The report estimates if remote instruction were
to continue until January 2021, students would lose between three to 14 months of learning, depending on
the quality of virtual instruction. While the McKinsey report is a national report, it reflects what happened
in Tennessee where a vast majority of students received instruction of some kind since the spring school
closures. McKinsey's data also reminds us that low-income, Black and Hispanic students are most
likely to experience learning loss. They are less likely to have access to the devices, high-speed Internet,
and quiet learning spaces needed for successful remote learning. This loss of learning translates into
decreased future earnings and suggests long-term economic disparities costing students who are White,
Hispanic, and Black $1,348, $1,809, and $2,186, respectively, per year throughout a 40-year working
life7. Supporting the existence of inequities, Tennessee’s State Collaborative on Reforming Education
(SCORE), in Renewing Our Pledge 2021 State of Education in Tennessee, not only recognizes long-
standing inequities in Tennessee but also states that COVID-19 worsens racial and economic inequities in
education8. It is important to note that Tennessee and TDOE made great efforts to support students with
disabilities by providing eight million dollars in grants (see appendices).
7 McKinsey and Company, COVID-19 and Student Learning in the United States: https://www.mckinsey.com/industries/public-
and-social-sector/our-insights/covid-19-and-student-learning-in-the-united-states-the-hurt-could-last-a-lifetime 8 TN SCORE State of Education 2020 Report: https://tnscore.org/wp-content/uploads/2020/12/2021-
StateOfEducation_digital_FINAL.pdf
89.1 89.7 89.6
35.840.3 40.7
0
20
40
60
80
100
2017-2018 2018-2019 2019-2020
Comparison of high school graduation rate and ready graduates
Graduation Rate Ready Graduate

12
According to the 81 districts responding to the ERIC district survey, Tennessee students lost, on average,
forty to fifty instructional days (defined as a minimum of six and a half hours of instruction per day). See
Figure 5.
Figure 5
N = 81
Source: ERIC district survey results
This survey also revealed responding districts provided a combination of synchronous and asynchronous
learning opportunities from the time buildings closed through the end of the school year (see Figure 6).
Asynchronous learning is a self-paced, virtual model which does not require constant real-time
engagement. Synchronous learning is scheduled participation in real-time virtual classrooms.
Figure 6
N = 81
Source: ERIC district survey results
Because state-wide Spring 2020 assessment data is unavailable, it is more important than ever for districts
to administer and evaluate local benchmark testing. Of the 81 districts responding to the ERIC survey, the
5
2
2
11
25
13
2
2
3
1
3
6
1
1
2
1
1
0 5 10 15 20 25 30 35
0-9
10-19
20-29
30-39
40-49
50-59
60-69
70 or more
# of Districts
Approximate missed instructional days during spring 2020, due to the tornados and/or pandemic, according to respondents
Rural Suburban Urban
1 0 1 0
3328
41
38
27
83
9 7
1 10
10
20
30
40
All Rural Suburban Urban
# o
f D
istr
icts
Most consistently implemented remote learning strategies in Spring 2020
Synchronous learning only Asynchronous learning only
Both synchronous and asynchronous Did not implement remote learning

13
vast majority administered fall benchmark testing, whether virtually or in-person. Student performance
varied from district-to-district, but only one of the districts reported consistently higher results than
previous years (see Figure 7). Brookings Institute released a nationwide year over year comparison of
academic achievement and growth where the sourced data was from four million Measures of Academic
Progress (MAP) assessments9. According to Brookings, nationwide reading achievement levels are very
similar to the previous year, with some students making gains during 2020. Math, on the other hand, is
showing lower achievement and growth overall9. Brookings also notes, this is all still preliminary
information, and we have a lot more to learn.
The Center for Reinventing Public Education highlighted Tennessee as one of only 12 states in the
country to require instructional plans from districts. A Continuous Learning Plan process was a strong
partnership between the SBE, TDOE, and Tennessee's school districts. It was a critical step towards
ensuring substantial opportunities for children this year and an excellent example of state-wide
partnership and collaboration. During the spring and summer of 2020, a great deal of work was
undertaken by districts and teachers across the state to demonstrate how they would continue to teach
students in the pandemic environment.
Figure 7
N = 71
Source: ERIC district survey results
Although the full extent of learning loss due to COVID-19 school closures is still being measured,
anecdotal evidence suggests the pandemic negatively affected students. Tennessee must administer
state-wide testing in the 2020-21 school year so academic performance can be carefully evaluated to
accurately inform which educational practices and innovations will best serve students moving
forward.
Currently, there is no uniform way of collecting district mid-year benchmark assessment data across all
the Tennessee districts. Changing that would require legislation. There is great work being done across
the state by educators and districts, but not having a central data repository makes it hard to analyze and
share best practices.
9 Brookings Institute, How COVID is affecting student learning: https://www.brookings.edu/blog/brown-center-
chalkboard/2020/12/03/how-is-covid-19-affecting-student-learning/
0 0 0 01 0 1 0
1310
2 1
41
30
9
28 7
0 1
8 7
0 10
10
20
30
40
50
All Rural Suburban Urban
# o
f D
istr
icts
First-quarter assessment student learning results.
Much higher than in previous years. Somewhat higher than in previous years.
About the same as in previous years. Somewhat lower than in previous years.
Much lower than in previous years. Varied by grade and/or subject.

14
vi. K-12 Enrollment
Based on the October 1 enrollment count for the 2020-21 school year, the state experienced a projected
decrease in public-school enrollment of 35,000 students. These are projections, not final numbers, and are
typically finalized in the late spring by the TDOE. However, this, and other factors led the Basic
Education Program (BEP) Review Committee, in its 2020 report, to recommend the General Assembly
and administration hold school districts "harmless" for the 2021 budget by allocating the same funds as
the 2020 school year. At this point, it's unclear where the estimated 35,000 students have re-enrolled, if at
all. As more enrollment data becomes available, it may be possible to get a clearer picture of the
number of students not enrolled and display this data collectively and by specific subgroups to
determine adverse consequences superimposed on existing inequities prior to the pandemic.
Figure 8
Source: TDOE
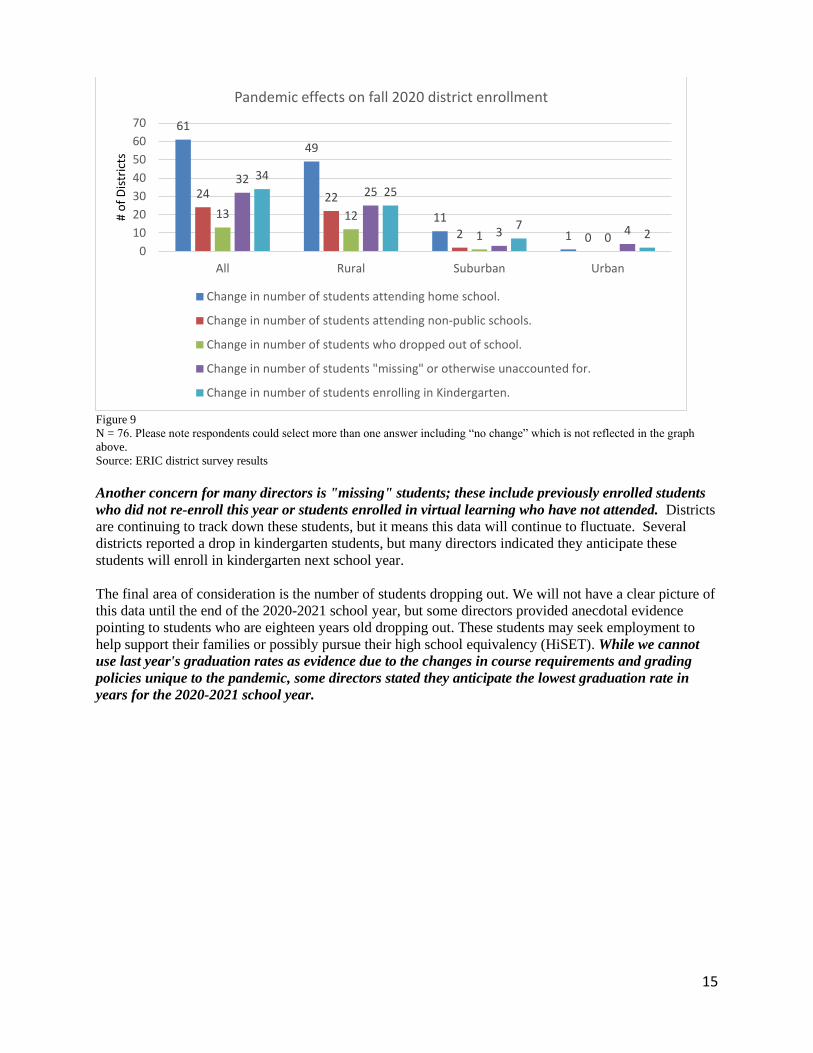
Although lacking validation, anecdotal data provided by directors of schools on the ERIC district survey,
suggest largest decreases in public-school enrollment is due to more students homeschooling (see Figure
9). Directors cited parents' unwillingness to expose children to COVID-19, coupled with dissatisfaction
with virtual options provided by the districts, as the impetus behind families choosing to homeschool.
According to the National Center for Educational Statistics, fewer than four percent of students in the
country are homeschooled. Though there are theories of a mass movement to this education method,
TDOE reports 11,096 students in Tennessee, double from the previous school year, withdrew to become
home schoolers. Owing to the varied nature of home-schooling programs, there is no state-wide criteria
for all homeschool curricula.10
10 National Center for Education Statistics Parent and Family Involvement in Education: Results from the National Household
Education Surveys Program of 2016: https://nces.ed.gov/pubs2017/2017102.pdf
996,627 1,001,562 1,001,967 1,007,624 1,014,744
979,760
800,000
850,000
900,000
950,000
1,000,000
1,050,000
2015-16 2016-17 2017-18 2018-19 2019-20 2020-21
Stu
den
ts
Public School Student Enrollment
October 1 Enrollment
15
Figure 9
N = 76. Please note respondents could select more than one answer including “no change” which is not reflected in the graph
above.
Source: ERIC district survey results
Another concern for many directors is "missing" students; these include previously enrolled students
who did not re-enroll this year or students enrolled in virtual learning who have not attended. Districts
are continuing to track down these students, but it means this data will continue to fluctuate. Several
districts reported a drop in kindergarten students, but many directors indicated they anticipate these
students will enroll in kindergarten next school year.
The final area of consideration is the number of students dropping out. We will not have a clear picture of
this data until the end of the 2020-2021 school year, but some directors provided anecdotal evidence
pointing to students who are eighteen years old dropping out. These students may seek employment to
help support their families or possibly pursue their high school equivalency (HiSET). While we cannot
use last year's graduation rates as evidence due to the changes in course requirements and grading
policies unique to the pandemic, some directors stated they anticipate the lowest graduation rate in
years for the 2020-2021 school year.
61
49
11
1
24 22
2 0
13 12
1 0
3225
3 4
3425
72
0
10
20
30
40
50
60
70
All Rural Suburban Urban
# o
f D
istr
icts
Pandemic effects on fall 2020 district enrollment
Change in number of students attending home school.
Change in number of students attending non-public schools.
Change in number of students who dropped out of school.
Change in number of students "missing" or otherwise unaccounted for.
Change in number of students enrolling in Kindergarten.

16
vii. K-12 Staffing
In addition to enrollment, staffing is one of the most challenging data points to measure before the end of
the school year. Because numerous factors contribute to K-12 staffing, it will be almost impossible to
definitively measure how the pandemic may affect this. The SBE and TDOE granted additional educator
licensure flexibility to allow more out-of-state teachers to teach in Tennessee. "Grow Your Own" grants
totaling two million dollars were used in some districts to help staffing concerns. Overall, districts shared
they did not significantly change the number of vacancies for licensed educators compared to previous
years. A few noted somewhat higher or much higher vacancies, but we are unable to connect those
directly to COVID-19 at this time (see Figure 10).
Figure 10
N = 79
Source: ERIC district survey
Tennessee Higher Education: Contextual Overview
For the better part of the last decade, Tennessee led the nation on higher education reforms related to
access, affordability, and cross-sector alignment of degree pathways10-15. For example, Tennessee has
repeatedly been recognized by the Southern Legislative Conference (SLC), the National Conference of
State Legislatures (NCSL), and the State Higher Education Executive Officers Association (SHEEO) for
the development of performance funding, TN Promise, and TN Reconnect programs. Successive State
Transformation in Action Recognition (STAR) Awards11 from the SLC and SHEEO’s recent designation
of THEC as the nation’s leading higher education agency12 are a testament to the significance of these
reforms.
Tennessee’s outcomes-based funding model shifted the determining factors for state appropriations away
from a purely enrollment-driven metric to an array of metrics driven by student success outcomes. As a
result of intentional and focused efforts, enrollment trends, retention rates year-over-year, and
11 THEC Wins STAR Award: https://www.tn.gov/thec/news/2019/7/29/tennessee-higher-education-commission-wins-slc-star-
award-for-third-consecutive-year.html 12 SHEEO Announcement: https://sheeo.org/sheeo-announces-excellence-awards-recipients/
1 1 0 03 2 0 1
55
42
10
3
1613
2 14 2 2 0
0
10
20
30
40
50
60
All Rural Suburban Urban
# o
f D
istr
icts
Licensed educator vacancies for the 2020-21 school year.
Much lower than in a typical year. Somewhat lower than in a typical year.
About the same as in a typical year. Somewhat higher than in a typical year.
Much higher than in a typical year.

17
graduation rates have steadily increased across Tennessee higher education13. Additionally, Tennessee
has seen five years of the lowest tuition increases in the modern era14. Policy efforts, coupled with a re-
imagined State Higher Education Master Plan, provided the framework for a THEC initiative to facilitate
maximum alignment between higher education, local and state workforce needs, and related state
initiatives and agencies: Future of Work (FOW).
THEC only recently begun to convene and engage with stakeholders around FOW when Governor Bill
Lee announced the first diagnosed case of COVID-19 in Tennessee on March 5 and just a week later,
declared a state of emergency. By Mid-March, all public universities and most Tennessee Board of
Regents (TBR) institutions announced a suspension of classes or extended Spring Break to allow more
time for developing appropriate protocols for transitioning to emergency remote teaching.
i. Student/Institution Effects: Transitions and Resourcing
On or around March 16, every public post-secondary institution notified its student and faculty
community of the decision to suspend on-campus instruction indefinitely and transition to a fully online
instructional model where possible. Most Universities informed faculty of new work-from-home
measures with exceptions for specific critical leadership and facilities personnel. Resident students on
each university campus were strongly encouraged to return home, given the ongoing shelter-in-place
orders from the administration and shift to online course delivery. Those students with no viable
alternative to campus residence for the term could remain subject to heightened restrictions on movement
throughout campus.
By mid-April, all universities elected to prorate or refund students for housing, dining, and other campus
access fees impacted by the transition to emergency remote learning. In total, universities refunded nearly
$50 million to students for these services. Eventually, all universities and TBR community colleges
announced plans to remain in remote learning posture through the summer semesters. The Tennessee
Colleges of Applied Technology returned to campus utilizing a hybrid model, which was a combination
of online, remote, and in-person learning, beginning May 4, 2020. Eventually, all universities and most
TBR institutions announced plans to remain in remote learning posture through the summer semesters.
The institutions would use the following two months to assess strategies for returning to campus and
setting up fall semester planning scenarios. In early May, for example, East Tennessee State University
announced that the Future Operations Workgroup would develop a plan on how to return to academic,
campus, and business operations safely. Chattanooga State Community College announced return-to-
campus phase-in plans to allow support personnel and faculty to return to campus safely. And UT
Knoxville convened the Re-Imagining Fall Task Force to brainstorm how the campus would re-open in
the fall.
In the weeks following Governor Lee's initial announcements and with the escalating nature of the
pandemic, the Governor chartered the Unified Command Group (UCG) and charged it with the
management of the pandemic and related activities. The THEC Executive Director, TDOE
Commissioner, and other state officials served on the UCG since inception and have been responsible for
coordinating with campuses and multiple state agencies in preparation for the fall return to campus and all
other COVID-19 related issues. As part of this planning, the Higher Education Liaison coordinated with
the Tennessee Emergency Management Agency (TEMA) to execute tabletop exercises at every
Tennessee Higher Education Institution or System and conducted numerous calls with each campus to
identify gaps in their respective COVID-19 emergency response plans.
13 TN Higher Education Fact Book: https://www.tn.gov/content/tn/thec/research/fact-book.html 14 Appendix Document: THEC-TSAC 2020 Budget Hearings_021220

18
Tabletop Exercises Overview:
Objectives:
1. Assess the institutional Emergency Response Plan in the context of COVID-19.
2. Assess how the existing campus structure will address the challenges of COVID-19.
3. Assess how institutions will coordinate their response with external partners (i.e., area
hospitals & public health agencies).
4. Identify the next steps in the planning process.
5. Clarify lines of accountability and communication to enable a timely, coordinated, and
effective response.
Outcomes: As a direct result of participating in these exercises, every campus identified gaps in
their planning, response, and/or coordination concerning COVID-19. Since those identified gaps
differed in depth and difficulty, campuses resolved what they could during the exercise and
resolved the more difficult or complex issues in follow-up planning meetings. THEC created a
Lessons Learned Document outlining common challenges and best practices to facilitate the
sharing of knowledge.
By mid-summer, most universities established on-campus working groups to determine viable working
plans for students' return. Most of the institutions moved forward with an altered fall semester, in which
academic courses would not break for Labor Day and Fall break, and students would not return to in-
person classes after Thanksgiving. All final exams would be online. Further, plans were deployed
allowing for both different modalities of instruction and, institutions to deliver content in a manner that
best aligns with their academic or technical program needs.
1. In-Person/On-Campus: Not all courses can be facilitated virtually, some classes and clinical
instruction will require in-person learning but with sufficient precautions.
2. Hybrid: Courses may be taught by remote learning except in specific competencies that must
be taught in-person. This would also include course sequences that could be deployed using
both virtual and on-campus learning as a mechanism to minimize class sizes.
3. Online/Remote:
a. Asynchronous: all student learning will occur virtually but shall be self-paced and
require no real-time engagement within the overall academic calendar.
b. Synchronous: student learning will be scheduled for a specific day and time for
participation in real-time virtual classrooms.
For the remainder of the summer, universities and community colleges and colleges of applied technology
implemented safety protocols in coordination with the Tennessee Pledge's Access Guidelines for Higher
Education15. They also planned for the expansion of testing upon student return, reserved quarantine
space for students potentially exposed to COVID-19 and implemented mask requirements for all students
and personnel.
The transition to online course delivery presented an additional disruptive obstacle to many students
across the state living in WIFI-challenged or broadband deficient areas. Likewise, students in urban and
suburban areas of the state are also often subjected to minimal computer and Internet access. To facilitate
student learning irrespective of the learning environment, most universities and community colleges,
and colleges of applied technology established laptop loan programs, and provided mobile broadband
hotspots. Several universities partnered with nonprofit agencies, businesses, and libraries, expanding Wi-
Fi capabilities enabling students to connect remotely from their parking lots. Additionally, campus
15 TN Pledge for Higher Education: https://www.tn.gov/content/dam/tn/governorsoffice-documents/covid-19-
assets/Pledge_Higher_Ed.pdf

19
resources related to IT help desks and digital library services remained operational for students, providing
full technical support and access to all available learning research resources.
ii. Fall 2020: Student Enrollment Trends
All public universities and community colleges submitted to THEC the fall 2020 14th day aggregate
enrollment data. Preliminary results indicate a state-wide decrease of 8,355 in total student headcount,
a 3.7% decline compared to fall 2019 14th day enrollment (see Figure 11). Specifically, the ongoing
COVID-19 pandemic appears to have primarily affected enrollment in our community colleges.
The TBR reports 78,772 students enrolled in community colleges this fall, a decrease of 9,046 students.
No Tennessee community colleges reported an increase in students year over year. This decline mirrors
national trends; analysis by the National Student Clearinghouse found public 2-year enrollment for
summer 2020 down 5.6% year over year. One critical factor in this decline is the significant number of
adult learners who have been economically impacted by the pandemic. Adult and non-traditional learners
can make up between 40 to 60 percent of the student headcount at a community college, and they often
face obstacles associated with work schedules, transportation, food insecurity, and childcare. These
factors have been compromised and exacerbated for thousands of our current TN Reconnect enrollees
who have to make hard decisions about work and school priorities. Interestingly, while many students at
colleges of applied technology face similar issues, TBR enrollment for fall 2020 (as of the second week
of September) indicates colleges of applied technology had an overall headcount student registration of
10,772, representing an increase of 3% as compared to fall 2019 16.
Figure 11
Source: THEC
Overall, headcount enrollment at the University of Tennessee (UT) institutions increased 2.7% over last
fall, with substantial variance across institutions. Undergraduate enrollment at UT institutions is up 2.3%,
while graduate student enrollment is up 4.0%. Among locally governed institutions (LGIs), notable
increases occurred at both the University of Memphis and Middle Tennessee State University (2.4% and
1.7% increases in overall enrollment, respectively). Graduate student enrollment, up 5.7% overall,
bolsters LGI enrollment, while undergraduate student enrollment is down 1.2%. Only Tennessee State
University (up 2.1%) and the University of Memphis (relatively flat but up 0.02%) registered an increase
16 TBR September 2020 quarterly meeting:
https://www.tbr.edu/sites/default/files/media/2020/10/2020_September_Policy%20and%20Strategy_Board%20Slides.pdf

20
in undergraduate enrollment. Overall, the LGIs are down less than a percent from fall 2019 14th day
enrollment.
iii. Fiscal Implications for Students: Tuition & Financial Aid
Upon the Governor's announcement of a “Declared Emergency,” THEC worked with leaders in the
General Assembly to stabilize the financial implications facing students and institutions at the outset of
the pandemic. Students were informed of abbreviated semesters, restricted housing, housing closures,
and distance learning—each of these carries critical financial implications for them personally and for
their student standing. The legislature adopted Public Chapter 632, which granted specific authority to the
THEC/TSAC Executive Director to approve waivers for individual relevant statutory and rule
requirements: Public Chapter 632—"the authority to temporarily suspend, modify, or waive any deadline
or other nonacademic requirement in statute, rule, or policy of any financial aid program…” for a
specified period of time as determined by the Executive Director of TSAC.
• Operationalized to Date:
o Deferred requirement for TN Promise Summer Community Service (3/25/2020)
o Modified GPA calculations for Lottery Scholarship Programs (3/26/2020)
o Suspended interest accrual and deadlines for loan-scholarships (4/1/2020)
o TN Promise Fall Community Service (5/28/2020)
o Qualifying ACT Exam Scores (7/16/2020)
Every higher education institution, and the Tennessee Student Assistance Corporation (TSAC),
reconsidered campus and financial aid policies to provide relief to students whose academic
performance might suffer due to the transition to emergency remote learning. For example, in April,
most of the institutions implemented pass/fail extensions, granting students the ability to reassess their
progress within an altered classroom experience without causing undue damage to their cumulative grade
point averages. Likewise, TSAC made several substantive changes and allowances within TN Promise
and the HOPE Scholarship to help students avoid the loss of crucial scholarship funding due to grades,
timing, and altered attendance measures.
iv. Fiscal Implications for Higher Education Institutions: State Funding & Tuition Revenues
While a full analysis of the fiscal impact from the COVID-19 pandemic will require additional
longitudinal data, Table 1 presents a snapshot of the most immediate fiscal impacts as of October 2020
for each university, community college, and TCAT (see Table 1). The first column reports funds
returned to students in the Spring and Summer semesters in response to the move to emergency remote
learning. These refunds include prorated housing and dining fees. The federal Coronavirus Aid, Relief,
and Economic Security (CARES) Act stipulated that the institutional portion of the Higher Education
Emergency Relief Fund (HEERF) could be used to reimburse such refunds. However, for nearly every
university, the total aid available did not meet the full refunds required.
The second column reports any known revenue loss and actual expenditures from the Spring and Summer
semester due to the pandemic. Lost tuition revenue from reduced enrollments and reduced auxiliary (e.g.,
dining, housing, athletics) utilization are included for revenue loss. Actual expenditures include, among
others, instruction and student support services and required cleaning and PPE. Finally, the third column
reports projected revenue loss and expenses for the fall semester. Most significant for universities are lost
housing and dining revenue and, for the University of Memphis and UT Knoxville specifically, athletic
revenue.
The primary cause of revenue loss for the community colleges is lost tuition dollars, as community
college enrollment is down nearly 10 percent from the previous fall semester. In total, the combined

21
actual and projected financial impact of all public higher education institutions as of October 2020
surpasses $330 million in lost revenues.
Table 1
v. Federal CARES Act Provisions Higher Education
The Federal CARES Act17 provided tremendous support to K-12, as cited earlier in this report. It was
signed into law on Friday, March 27, providing $30.75 billion for the Education Stabilization Fund.
Tennessee public institutions received $169 million through the Higher Education Emergency Relief
Fund (HEERF). At least half of an institution's HEERF allocation was distributed to students in the form
of emergency financial aid grants related to the disruption of campus operations, including eligible
expenses under a student's cost of attendance, such as food, housing, course materials, technology, health
care, and childcare. Institutions could spend the remaining portion on student refunds for room and board,
tuition, and other fees owed to the changes in instructional delivery due to the pandemic, or to reimburse
themselves for expenses related to providing students with technology, such as computers or Internet
service, required for the transition to online learning.
Minority-serving institutions, such as Tennessee State University and Southwest Tennessee Community
College, and institutions that qualify for the federal Strengthening Institutions Program, received an
additional $22.5 million through the HEERF. All of these funds could go to student grants, cost refunds,
or lost revenue due to disruption of campus operations. In total, institutions received nearly $200 million
through the CARES Act. With roughly half earmarked for student emergency grants, the CARES Act
provides less than a third of the revenue needed to meet the estimated financial deficit caused by the
17 Full text of law available here: https://www.congress.gov/bill/116th-congress/house-bill/748/text.
InstitutionsSpring & Summer
Refunds1
Spring & Summer
Revenue Loss & Actual
Expenditures2
Fall Estimated Revenue
Loss & Expenditures3 Total
LGIs
APSU 2,348,139$ 2,806,432$ 6,549,300$ 11,703,871$
ETSU 3,460,000$ 3,020,000$ 7,068,000$ 13,548,000$
MTSU 1,901,397$ 10,038,000$ 13,002,000$ 24,941,397$
TSU 3,877,000$ 6,872,660$ 23,679,000$ 34,428,660$
TTU 3,252,783$ 5,261,614$ 3,710,443$ 12,224,840$
UM 4,083,000$ 17,996,353$ 22,763,000$ 44,842,353$
LGI Total 18,922,319$ 45,995,059$ 76,771,743$ 141,689,121$
UT Institutions
UTC 5,938,000$ 2,357,965$ 9,795,102$ 18,091,068$
UTK 21,251,000$ 29,767,000$ 66,619,000$ 117,637,000$
UTM 2,222,000$ 2,234,750$ 1,501,000$ 5,957,750$
UTHSC 116,872$ 4,701,221$ -$ 4,818,093$
UT Total 29,527,872$ 39,060,936$ 77,915,102$ 146,503,910$
Community Colleges
CHSCC 4,000$ 748,000$ 4,565,000$ 5,317,000$ CLSCC -$ 679,000$ 1,168,000$ 1,847,000$
COSCC 4,000$ 337,187$ 2,022,500$ 2,363,687$
DSCC -$ 386,000$ 713,000$ 1,099,000$
JSCC -$ 185,755$ 1,311,118$ 1,496,873$
MSCC -$ 219,240$ 3,392,140$ 3,611,380$
NASCC -$ 80,000$ 2,225,000$ 2,305,000$
NESCC -$ $ 33,545 1,281,134$ 1,314,679$
PSCC -$ 1,774,600$ 2,762,000$ 4,536,600$
RSCC -$ 819,000$ 3,408,000$ 4,227,000$
STCC 20,000$ 1,967,625$ 5,205,000$ 7,192,625$
VSCC -$ 1,531,298$ 2,600,000$ 4,131,298$
WSCC -$ 867,687$ 600,000$ 1,467,687$
CC Total 28,000$ 9,628,937$ 31,252,892$ 40,909,829$
1 - Funds returned to students in the Spring & Summer semesters in response to the move to emergency remote learning.
3 - Estimated foregone revenue, revenue losses, bad debt, or losses due to installment tuition agreements for the Fall 2020 semester.
COVID19 Financial Impacts - October 2020
2 - Includes foregone revenue and revenue losses from the Spring and Summer semesters as well as realized expenditures in response to COVID-19 (e.g.
funds expended to limit the spread of PPE or to help students, faculty and staff response to an online learning environment).

22
pandemic—approximately $330 million as of October. Of the funding available through the CARES
Act, THEC is administering $21.4 million through the Coronavirus Relief Fund (CRF), authorized by the
Coronavirus Aid, Relief, and Economic Security (CARES) Act, to assist the Tennessee higher education
enterprise in dealing with challenges related to:
Social distancing:
• Adapting classroom configurations,
• Modifying student housing to comply with COVID-19 health precautions,
• Supporting physical plant costs, or
• Subsidizing non-executive payroll expenses for faculty/staff dedicated to mitigating COVID-19.
Transition to online learning:
• Expanding and supporting online instruction,
• Increasing students' access to technology, including laptops, Wi-Fi hotspots, and digital
subscriptions, or
• Subsidizing payroll expenses for new personnel or extended duties of existing non-executive
personnel.
CRF grants were open to the accredited public and private, nonprofit institutions of higher education
(IHEs) domiciled in Tennessee. All eligible institutions that opted to submit a grant proposal were
ultimately approved for funding after a thorough THEC staff review. Funds were awarded based on the
proportionate share of low-income students the institution serves. THEC staff communicates regularly
with campus program directors and are monitoring all institutions through monthly reports.
Tennessee Student Well-Being
Pandemic-related school closures not only affected students' academic performance but their social and
emotional well-being. When in school, students of all ages have access to a variety of support services,
including meal programs or food pantries, medical or emotional counseling, social support from
friends/teachers/staff and therapeutic services for students with disabilities. In spite of the use of phone
line counseling, telehealth services, and extraordinary efforts to provide nutrition services through the
TDOE’s “SchoolMealFinder.com” program, because of school building closures, some students were not
receiving these essential services, which is likely to have a negative effect on their mental and emotional
health.
While some reporting on emotional well-being for students has started, it will take years to conduct
comprehensive research. According to the Tennessee Child Wellbeing Task Force report18 and The
Communities in Schools of Tennessee COVID-19 Report19, economic hardships, isolation, domestic
violence, and other factors contribute to adverse experiences that can have long-term effects on students.
The Tennessee Education Research Alliance (TERA) conducted a survey20 of educators in Spring 2020
that included questions on the impact of COVID-19. The teachers’ top three concerns were students
missing critical services such as meals and counseling, maintaining relationships with students amid
uncertainty, and barriers preventing students from accessing remote learning. The report goes on to
state:
Educators expressed concern for the physical and mental health of students and their families in
their open-ended comments. Teachers and leaders indicated necessities—including adequate
18 TN Child Well-Bring Task Force Report: https://www.tn.gov/content/dam/tn/education/health-&-safety/CWTF_Summary.pdf 19 Communities in School of TN Report: https://76bb3e70-87ed-449f-
b8d26293d7d730cb.filesusr.com/ugd/c9b4b6_1898fb4495a04f6e9aa7772bdf34e3d2.pdf 20 TERA, Teaching Through a Global Pandemic:https://peabody.vanderbilt.edu/TERA/files/TES2020_COVID_Brief_FINAL.pdf
23
nutrition, security, and supervision—are crucial to ensure students can successfully engage in
remote learning.
The TERA report shows how profoundly concerned Tennessee teachers are about students' well-being.
Undoubtedly, our educators are not only struggling with student attendance and attentiveness, but also
students’ well-being during this pandemic with varying shifts of educational delivery from in-person to
virtual. Studies have shown a correlation between student health and wellness and academic
performance.21 Without addressing the social-emotional strains the pandemic has on students, these
challenges are likely to continue affecting their academic performance negatively for years beyond the
pandemic.
In post-secondary institutions nationwide, mental health and well-being has been an ongoing discussion
prior to COVID-19. Research22 suggests these students were already susceptible to mental and emotional
health concerns and the pandemic revealed considerable stress and worry which is negatively impacting
student academics and overall well-being.
Conclusions and Next Steps
The events of 2020 presented unprecedented challenges, and Tennessee's kindergarten-to-career
education ecosystem has been stretched to the limit. The purpose of this first report is to provide an
accurate snapshot of the educational situation in Tennessee. Because we are still in the midst of a
pandemic and do not have all the information needed to provide a clear picture, we relied, on pre-
pandemic statistics, national education trends, and survey data from superintendents in Tennessee.
Based on national research, some students may be excelling academically, especially in reading, though
we fear many, mostly those who experience inequities, increased barriers to learning and those who are
economically challenged, may fall even further behind.
Every school in Tennessee at the K-12 and post-secondary levels stepped up during this crisis and we
applaud those efforts. After ten months of worrying, wearing masks, and keeping our distance,
educators, students and their families are understandably exhausted but determined. Though we may
not have all the data on the effects of COVID, our educators have identified and launched new and
innovative solutions to support their student communities. The state leaned in with increased funding and
federal grants, the TDOE propped up supplemental programs and partnerships, and the educators
supported students of all ages.
The Education Recovery and Innovation Commission will be exploring applicable education and industry
best practices that address the identified barriers and opportunities. Sharing a sense of urgency and
focused attention to support those students who are most vulnerable, some of the primary themes surfaced
from this report are:
1- Learning Loss: Tennessee needs to aggressively address learning loss with a keen focus on
early literacy and those students who are our most vulnerable. The General Assembly,
Governor, SBE, and TDOE are involved in setting Tennessee's K-12 direction, however, our
governance structure allows for each district to operate independently and, in their
community’s best interest. Our school K-12 districts have worked hard to create some
21 Langford R, Bonell CP, Jones HE, Pouliou T, Murphy SM, Waters E, Komro KA, Gibbs LF, Magnus D, Campbell R. The
WHO Health Promoting School framework for improving the health and well-being of students and their academic achievement.
Cochrane Database of Systematic Reviews 2014, Issue 4. Art. No.: CD008958. 22 Changwon Son, Sudeep Hegde, Alec Smith, Xiaomei Wang, Farzan Sasangohar. Effects of COVID-19 on College Students
Mental Health in the United States: Interview Survey Study (http://www.jmir.org), 03.09.2020.

24
normalcy while still laser-focused on educating Tennessee's children in an ever-changing
environment. Educators' efforts remain focused on educating and supporting students despite
this pandemic. To minimize learning loss, specific measures of success must be identified,
remediation interventions must be applied and associated with outcomes measuring success.
Continuous quality improvement programs must be established and assessed.
2- Well-Being: Tennessee needs to fully assess and support the social and emotional state of our
students, families, and educators. As with any high impact event that includes job loss, loss
of life, or extreme social isolation, the emotional effects will be long term. Further the
projected loss of learning, increase stress levels and decrease loss of future earnings is
concerning and interventions to counteract and proactively prevent harm should be
implemented now.
3- Post-Secondary and Career Preparedness: Tennessee needs to ensure all our students are
graduating prepared for post-secondary and career which means we must make sure early
childhood education (K-3) is superior and successful, and our career opportunities are
connected to the education opportunities in secondary and postsecondary education.
Measurable success outcomes that represent progression and improvement must be clearly
identified and collected across the entire education ecosystem. This includes educational
assessment and quality improvement plans for K-12 and Tennessee's Higher Education
systems. We recognize the quick response by all parties to the changing environmental needs
faced with the pandemic. Specifically, Tennessee's higher educational systems transformed
from traditional to almost entirely online delivery in a mere two weeks; this is remarkable for
post-secondary education which is traditionally intransigent in the face of change. Granted,
some schools already had online infrastructure, which helped, while other schools did not.
Such a transition was particularly challenging and provided unique learning opportunities for
colleges of applied technology and health professional colleges which have a significant
focus and reliance on “hands on” or clinical learning in health care environments. While
communication from administration to students varied in its effectiveness, all institutions
provided some level of disaster response thanks to the assistance rendered by THEC through
tabletop exercises and help from other institutions. As we progress through the pandemic, we
must keep sight on data measurement, assessment, and improving educational outcomes for
all of our students. Careful attention to transitions of education as students progress from K-
12 to post-secondary education and eventually into job placement must be evaluated using
specific outcome and competency-based measures of success including well-being
assessments.
4- Technology Gaps: Tennessee needs to strategically address the gaps in technology
availability and application, and access to high-speed Internet at all levels of education.
Across the board, one of the largest gaps to learning is technology. Many students of all ages
lacked basic computer technology, and access to broadband, or high-speed Internet, necessary
for access to online education. The state was able to pull together support, but we need a
sustainable solution. Many schools lacked seamless curriculum transfer from in-class
instruction to online instruction, not to mention some educators, like students, did not have a
device or access to broadband at home.
Tennessee is in the midst of an ongoing crisis that has revealed many gaps in our kindergarten-to-career
operations, including the need for real-time data across the education continuum, which often requires
legislative authorization. The best-laid plans are based on available data, and in the absence of that
information, setting a course is challenging. As noted by Governor Lee, Tennessee must administer state-
wide testing in the 2020-21 school year so academic performance can be carefully evaluated to accurately
inform which educational practices and innovations will best serve all students moving forward.
Tennessee needs to align a consistent, high-quality K-12 competency-based education with higher

25
education to the jobs of tomorrow so our students can thrive financially with high growth opportunities
and optimal health and well-being.
Acknowledgements This report relies on data from numerous sources and the commission gratefully acknowledges the
contributions made by The State Board of Education, The Tennessee Department of Education, the
Tennessee Higher Education Commission, the State Collaborative on Reforming Education, Tennessee’s
superintendents, the Tennessee Home Education Association, the Tennessee Education Research Alliance
and others for their integral contributions to the work. We commend the work of other organizations and
specifically Tennessee SCORE and recommend reading “Renewing our Pledge State of Education in
Tennessee 2021 Report”.
Acronym Glossary
ACT American College Test
APSU Austin Peay State University
BEP Basic Education Program -- Tennessee’s K-12 Funding Formula
CARES Federal Coronavirus Aid, Relief, And Economic Security Act
CCTA Complete College Tennessee Act Of 2010
CREDO The Stanford University Center for Research on Education Outcomes
CRF Coronavirus Relief Fund
EBT Electronic Benefit Transfer
ERIC Education Recovery and Innovation Commission
ESSER Elementary and Secondary Schools Emergency Relief
ETSU East Tennessee State University
FAFSA Federal Financial Aid Application
FOW Future of Work
GEER Governor's Emergency Education Relief Fund
GELF Governor’s Early Literacy Foundation
HEERF Higher Education Emergency Relief Fund
HiSET High School Equivalency Test
HOPE Helping Outstanding Pupils Educationally
IHEs Institutions of higher education
K-12 Kindergarten through grade 12
LGIs Locally Governed Institutions
MAP Measures of Academic Progress
NAEP National Assessment of Educational Progress
NCSL National Conference of State Legislatures
PPE Personal Protective Equipment
SARS-CoV-2 (Covid-19) Severe Acute Respiratory Syndrome Coronavirus 2
SBE Tennessee State Board of Education
SCORE State Collaborative on Reforming Education
SHEEO State Higher Education Executive Officers
SLC Southern Legislative Conference
STAR State Transformation in Action Recognition

26
TBR Tennessee Board of Regents
TCAT Tennessee Colleges of Applied Technology
TDOE Tennessee Department of Education
TEMA Tennessee Emergency Management Agency
TERA Tennessee Education Research Alliance
THEC Tennessee Higher Education Commission
TSAC Tennessee Student Assistance Corporation
TSU Tennessee State University
TTU Tennessee Tech University
UCG Governor’s Unified Command Group
UM University of Memphis
UT University of Tennessee
UTC University of Tennessee Chattanooga
UTHSC University of Tennessee Health Science Center
UTM University of Tennessee Martin