Embed Size (px)
Citation preview
The teacher pay gap is widerthan everTeachers’ pay continues to fall further behind pay ofcomparable workers
Report • By Sylvia A. Allegretto and Lawrence Mishel • August 9, 2016
• Washington, DC View this report at epi.org/110964
SECTIONS
1. Summary • 1
2. Introduction and keyfindings • 1
3. Data sources • 4
4. Recent trends inrelative weekly wages• 6
5. Relative teacherwages • 7
6. State wage analysis:Ratios overall and bystate • 13
7. Adding benefits to thepicture • 14
8. Conclusion • 19
About the authors • 20
Appendix A • 20
Appendix B • 24
Appendix C • 25
Endnotes • 26
References • 27
SummaryWhat this report finds: The teacher pay penalty is biggerthan ever. In 2015, public school teachers’ weekly wageswere 17.0 percent lower than those of comparableworkers—compared with just 1.8 percent lower in 1994.This erosion of relative teacher wages has fallen moreheavily on experienced teachers than on entry-levelteachers. Importantly, collective bargaining can help toabate this teacher wage penalty. Some of the increase inthe teacher wage penalty may be attributed to a trade-offbetween wages and benefits. Even so, teachers’compensation (wages plus benefits) was 11.1 percent lowerthan that of comparable workers in 2015.
Why this matters: An effective teacher is the mostimportant school-based determinant of educationoutcomes. It is therefore crucial that school districts recruitand retain high-quality teachers. This is particularly difficultat a time when the supply of teachers is constrained byhigh turnover rates, annual retirements of longtimeteachers, and a decline in students opting for a teachingcareer—and when demand for teachers is rising due torigorous national student performance standards and manylocales’ mandates to shrink class sizes. In light of thesechallenges, providing adequate wages and benefits is acrucial tool for attracting and keeping the teachersAmerica’s children need.
Introduction and keyfindingsAn effective teacher is the most important school-baseddeterminant of education outcomes.1 Therefore it is crucialthat school districts recruit and retain high-quality teachers.This is increasingly challenging given that the supply ofteachers has been greatly affected by high early to mid-career turnover rates, annual retirements of longtimeteachers, and a decline in students opting for a teachingcareer.2 At the same time, many factors are increasing thedemand for teachers, including shrinking class sizes, thedesire to improve diversity, and the need to meet high
1
standards. In short, the demand for teachers is escalating, while simultaneously the supplyof teachers is faltering.
The supply of teachers is diminishing at every stage of the career ladder. On the front end,fewer students are entering the profession. Generally speaking, the small fraction of themost cognitively skilled college students who elect to become teachers has declined fordecades (Corcoran, Evans, and Schwab 2004). Several factors have helped to drive thistrend. Over the long run, employment opportunities for women have greatly expanded,and thus the teaching profession can no longer rely on what was a somewhat captivelabor pool. At the same time, teachers are less satisfied and more stressed asstandardized testing has been elevated as a tool for student, school, and teacherevaluations.3
On the back end, teachers are aging and retiring along with the workforce overall. Teacherretirements recently peaked, going from 35,000 in 1988–1989 to 87,000 in 2004–2005(and down very slightly to 85,000 in 2008–2009) (Ingersoll, Merrill, and Stuckey 2014).Ingersoll, Merrill, and Stuckey (2014) argue that retiring teachers, who represent fewer thanone-third of those who leave the profession, are not the primary driver behind teachershortages. Regardless, they do represent a nontrivial annual reduction in the teacherworkforce. Moreover, as teachers retire, they are replaced by newcomers, and the highattrition rate among this group is a particularly critical issue.
Teacher staffing is significantly affected by early and mid-career teachers who leave theprofession for non-retirement reasons. Ingersoll, Merrill, and Stuckey (2014, 7) documentthat “from 1988-89 to 2008-09, annual attrition from the teaching force as a whole rose by41 percent, from 6.4 percent to 9 percent,” a trend driven primarily by non-retirementturnover. They conclude that teachers, who represent one of the largest occupations inthe nation, have been leaving at relatively high rates, and these rates have steadilyincreased in recent decades. The increasing rates of attrition foster a growing instability inthe teaching profession that affects classroom efficacy.
More recently, the outward flow of teachers was worsened during the Great Recessionand the ensuing slow recovery. Many states made austere cuts in public spending, whichincluded major teacher layoffs. Eight years after the economic implosion, many states haveyet to return to their prerecession teacher levels, even as demand has increased.4
Darling-Hammond et al. (2016, iii) in their study of California aptly summarized the overallsituation:
“On the supply side, overall desirability of teaching as a profession is the mostimportant factor; others include ease of entry, competitiveness of salaries, andteaching conditions. Highly publicized teacher layoffs during the budget downturnleft a mark on the public psyche, including that of individuals who might have beenconsidering a teaching career. In addition, salaries were frozen and workingconditions suffered during the era of cutbacks, as resource limitations led toincreased class sizes, along with fewer materials and instructional supports. Onesign of the impact is that only 5 percent of the students in a recent survey of
2
college-bound students were interested in pursuing a career in education, adecrease of 16 percent between 2010 and 2014.”
At the same time, there are many important factors placing pressures on the current andfuture demand for teachers overall, and in selected fields and for selected purposes. First,rigorous national standards and school-based accountability for student performance haveraised the demand for talented teachers.
Second, an increasingly diverse workforce and student population should be met with amore diverse teacher workforce, increasing the demand for certain types of teachers. Asshown in Allegretto and Tojerow (2014), whites are overrepresented as teachers(compared with their representation in the overall workforce and, especially, the studentpopulation). Conversely, blacks are underrepresented as teachers and Latinos even moreso. As Ingersoll, Merrill, and Stuckey (2014) note, there have been successful recruitingefforts of minority teachers, and these teachers are more likely to work in underservedurban communities with high poverty rates. More such efforts are required. It is alsocurious that nearly three-fourths of teachers are female, and that share has actuallyincreased over time as the small share of male teachers has shrunk. One may think thatmore male teachers would benefit all students, but the lack of males in the profession isnot well understood.
Furthermore, many locales’ mandate to shrink class sizes also affects teacher demand.Class sizes in many schools across the nation are far too large. Lastly, broadening thescope of teacher demand is the constant need to fill specialized positions, such as in math,science, and special education—positions that are increasingly difficult to fill.5 These areamong the many reasons we may expect demand for teachers to continue to outstripsupply.
To address teacher shortages, it is necessary to focus on both recruiting and retaininghigh-quality teachers. Many policies are needed to accomplish this goal, and providingappropriate compensation is a necessary, major tool in addressing shortages. As Darling-Hammond et al. (2016, 18) note:
“Even if teachers may be more motivated by altruism than some other workers,teaching must compete with other occupations for talented college and universitygraduates. … Teachers are more likely to quit when they work in districts with lowerwages and when their salaries are low relative to alternative wage opportunities,especially in high-demand fields like math and science.”
The compensation issues affecting the worsening teacher shortage concern relativeteacher pay—that is, teacher pay compared with the pay of other career opportunities forpotential and current teachers. For over a decade, starting with How Does Teacher PayCompare (Allegretto, Corcoran, and Mishel 2004), we have studied the long-term trends inteacher pay. We followed this up with The Teaching Penalty, published in 2008 using2006 data, and have updated our findings occasionally in other papers.6 Our body of workhas documented the relative erosion of teacher pay. In 1960, female teachers enjoyed awage premium compared with other college graduates. By the early 1980s, the teacher
3
premium became a penalty, and the female teacher pay gap post-1996 has widenedconsiderably.
Here we extend our analysis through 2015 and update our work on both wages and totalcompensation (wages plus benefits). (Note that throughout this report, “pay” is used as ageneric term to refer to wages or compensation.) With this update, we continue todocument trends in relative teacher pay and sound the alarm regarding the long-rungrowth in the wage and compensation penalty (also referred to in this report as a wage orcompensation “gap”)—the percent by which public school teachers are paid less thancomparable workers. Specifically:
Average weekly wages (inflation adjusted) of public-sector teachers decreased $30per week from 1996 to 2015, from $1,122 to $1,092 (in 2015 dollars). In contrast,weekly wages of all college graduates rose from $1,292 to $1,416 over this period.
For all public-sector teachers, the relative wage gap (regression adjusted foreducation, experience, and other factors) has grown substantially since themid-1990s: It was ‑1.8 percent in 1994 and grew to a record ‑17.0 percent in 2015.
The relative wage gap for female teachers went from a premium in 1960 to a largeand growing wage penalty in the 2000s. Female teachers earned 14.7 percent morein weekly wages than comparable female workers in 1960. In 2015, we estimate a‑13.9 percent wage gap for female teachers.
The wage penalty for male teachers is much larger. The male teacher wage gap was-22.1 percent in 1979 and improved to ‑15.0 percent in the mid-1990s, but worsened in
the late 1990s into the early 2000s. It stood at ‑24.5 percent in 2015.
While relative teacher wage gaps have widened, some of the difference may beattributed to a tradeoff between pay and benefits. Non-wage benefits as a share oftotal compensation in 2015 were more important for teachers (26.6 percent) than forother professionals (21.6 percent). The total teacher compensation penalty was arecord-high 11.1 percent in 2015 (composed of a 17.0 percent wage penalty plus a 5.9percent benefit advantage). The bottom line is that the teacher compensation penaltygrew by 11 percentage points from 1994 to 2015.
The erosion of relative teacher wages has fallen more heavily on experiencedteachers than on entry-level teachers. The relative wage of the most experiencedteachers has steadily deteriorated—from a 1.9 percent advantage in 1996 to a 17.8percent penalty in 2015.
Collective bargaining helps to abate the teacher wage gap. In 2015, teachers notrepresented by a union had a ‑25.5 percent wage gap—and the gap was 6
percentage points smaller for unionized teachers.
Data sourcesWe first provide a brief overview of the two sources of data used in this analysis. For ourwage analysis we use data from the Current Population Survey (CPS), and we use the
4
Employer Costs for Employee Compensation survey to analyze benefits. Both are from theBureau of Labor Statistics (BLS).
For our wage analysis we use CPS data on individual workers from 1979 through 2015.The CPS is a monthly survey of more than 60,000 households conducted by the CensusBureau for the BLS. We specifically employ the “Outgoing Rotation Groups” sample, orCPS-ORG. The CPS-ORG is one of the data sources most widely used by economists tostudy wages and employment. The CPS-ORG data are particularly useful due to their largesample and information on weekly wages. We pool monthly data into a series of annualdata with over 150,000 workers for each year. This analysis restricts the sample to all full-time workers age 18 to 64 (defining “full time” as working at least 35 hours per week).Teachers are identified using detailed Census occupation codes, and include onlyelementary, middle, and secondary teachers (pre-kindergarten and kindergarten teachers,adult educators, and special education teachers are excluded). We also focus only onpublic school teachers (private school teachers—who on average earn less than publicschool teachers—are excluded).7 We also restrict our analysis to data reported by surveyrespondents and thus do not include imputed data. A more extended discussion regardingthe CPS-ORG data can be found in Appendix A of this paper and also in Appendix A ofAllegretto, Corcoran, and Mishel (2008).
There are several measurement and data issues regarding the CPS that require somefurther discussion. First, as in our earlier work, we justify our choice of comparing weekly,as opposed to annual or hourly, earnings. Second, we discuss the method and data usedin our benefits calculation.
Weekly wageOur analysis of the relative wage of teachers relies on comparisons of weekly earnings,and not on annual or hourly earnings as analyzed by some researchers. As discussed inour prior work, we elect to use weekly wages to avoid measurement issues regardingdifferences in annual weeks worked (teachers’ traditional “summers off”) and the numberof hours worked per week that arise in many studies of teacher pay. It is often noted thatthe annual earnings of teachers cannot be directly compared with those of non-teachers,given that teachers are typically only contracted to work a nine-month year. Butdifferences arise over exactly how much time teachers devote to their position outside oftheir nine contracted months of teaching—and they are afforded little time off during theteaching year compared with other professionals. Teachers also spend some of theirsummer months in class preparation, professional development, or other activitiesexpected of a professional teacher. Similarly, attempts to compare the hourly pay ofteachers and other professionals have resulted in considerable controversy by setting offan unproductive debate about the number of hours teachers work at home versus otherprofessionals.8 Importantly, decisions regarding pay interval (weekly, annual, or hourly)become mostly irrelevant when considering changes in relative pay over time. Changes inrelative wages can be expected to be similar as long as the relative work time (betweenteachers and comparable professionals) remains constant.9
5
BenefitsOur analysis examines the relative wages of teachers but also examines how differencesin benefits affect total compensation. We utilize the Employer Costs for EmployeeCompensation (ECEC) survey from the BLS to analyze the benefits of teachers comparedwith the benefits received by other professionals. The ECEC is a quarterly survey thatreports employers’ average hourly cost for total compensation and its components. Itprovides cost data in dollar amounts and as percentages of compensation. The ECECdecomposes total compensation costs into wages and benefits. Data are reportedseparately for broad benefit categories such as paid leave, supplemental pay, insurance,retirement and savings, paid holidays, health insurance, defined benefit pension, andworkers’ compensation. The ECEC reports compensation statistics for public- and private-sector workers and also provides data by occupation, including “primary, secondary andspecial education” teachers specifically. This allows us to compare relative teacherbenefits. Our estimates of relative teacher wages and benefits give us a measure ofrelative total compensation of teachers as compared with other professionals.
Recent trends in relative weekly wagesWe begin by analyzing average weekly wages (adjusted for inflation) for teachers andcomparable workers. Figure A presents average wages for full-time workers age 18–64 forthree groups: all workers, college graduates (not including public school teachers), andpublic school teachers. In 1979, all workers earned (in 2015 dollars) an average of $825per week, compared with $911 and $1,159 for public school teachers and other collegegraduates, respectively. As noted in Appendix A non-imputed data are not available for1994 and 1995; data points for these years have been extrapolated and are representedby dotted lines in the figure.
In 1979 teachers earned 10.3 percent more than all workers—which includes all levels ofeducation. The gap between the higher wages of teachers compared with all workerswidened to nearly 26 percent before narrowing to just 5.7 percent in 2015. The averageweekly wage for all workers increased from $891 to $1,034 from 1996 to 2015—whileteachers’ wages decreased $30 per week, from $1,122 to $1,092. Thus, in 2015 teachersearned, on average, $59 more per week as compared with all workers—down from a $231difference in 1996.
The most relevant comparison, however, is between teachers and other collegegraduates. In 1979 teachers earned 21.4 percent less than other college graduates. Thegap between teachers and other college graduates narrowed into the mid-1990s but thenwidened considerably during the tight labor markets of the late 1990s into the early2000s.10 There was a 53 percent jump in wages for non-teacher college graduates from1979 to 2002 during an unusual recent time of exceptional wage growth. This was a timewhen inflation-adjusted wages grew strongly among low-, middle-, and high-wageearners—but this was not the case for teachers. This is due to the long-term contractsteachers have and the fact that public-sector wages are not as volatile (both up and down)
6
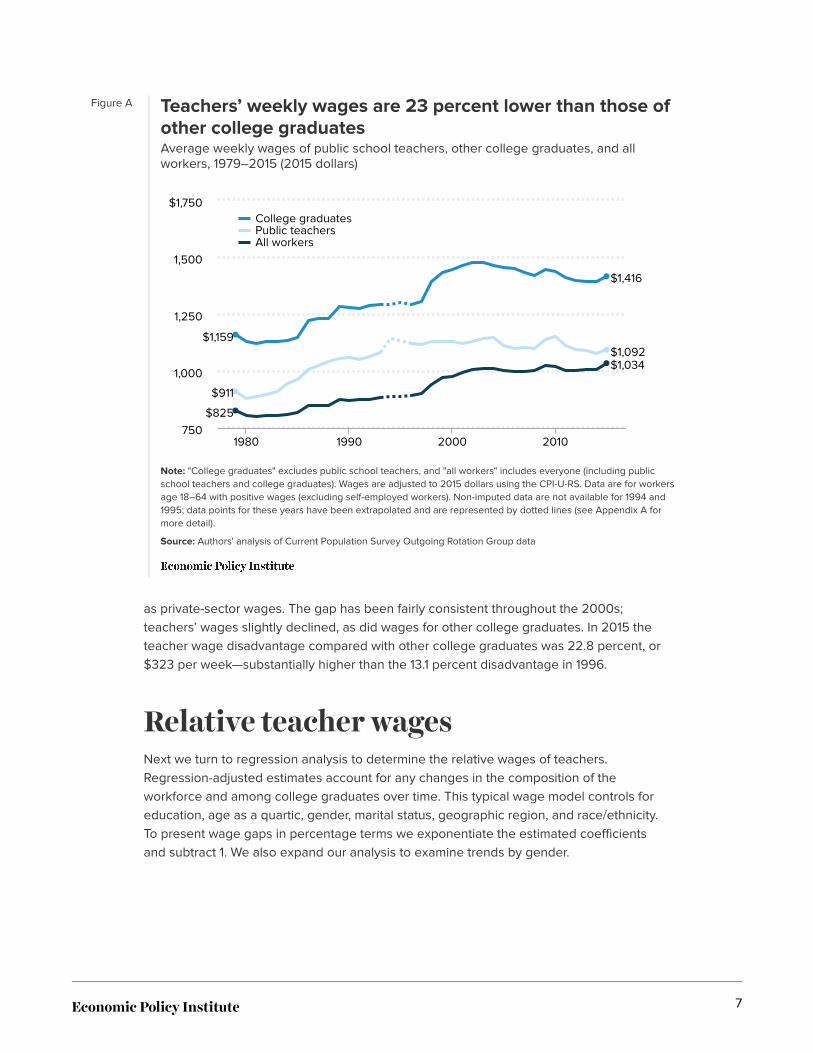
Figure A Teachers’ weekly wages are 23 percent lower than those ofother college graduatesAverage weekly wages of public school teachers, other college graduates, and allworkers, 1979–2015 (2015 dollars)
Note: "College graduates" excludes public school teachers, and "all workers" includes everyone (including publicschool teachers and college graduates). Wages are adjusted to 2015 dollars using the CPI-U-RS. Data are for workersage 18–64 with positive wages (excluding self-employed workers). Non-imputed data are not available for 1994 and1995; data points for these years have been extrapolated and are represented by dotted lines (see Appendix A formore detail).
Source: Authors' analysis of Current Population Survey Outgoing Rotation Group data
Year
Collegegraduates Public
teachers
Allworkers
Collegegraduates1993-1996
Publicteachers
1993-1996
Allworkers
1993-1996
Collegegraduates1996-2015
Publicteachers
1996-2015All workers1996-2015
1979 $1,159.28 $910.71 $825.41
1980 $1,127.66 $878.95 $804.27
1981 $1,121.37 $885.72 $798.02
1982 $1,127.64 $897.94 $804.04
1983 $1,127.76 $909.05 $805.43
1984 $1,133.64 $942.59 $809.26
1985 $1,145.26 $962.77 $816.31
1986 $1,219.36 $1,004.44 $845.37
1987 $1,230.49 $1,024.64 $848.58
1988 $1,230.00 $1,040.33 $849.52
1989 $1,283.22 $1,052.79 $874.08
1990 $1,279.18 $1,056.51 $870.21
1991 $1,275.22 $1,050.92 $872.23
1992 $1,285.44 $1,061.32 $874.97
1993 $1,289.63 $1,081.41 $882.46 $1,289.63 $1,081.41 $882.46
1994 $1,292.00 $1,142.80 $886.88
1995 $1,298.49 $1,132.49 $888.16
1996 $1,291.66 $1,122.15 $891.45 $1,291.66 $1,122.15 $891.45
1997 $1,304.36 $1,114.51 $900.08
1998 $1,393.47 $1,127.98 $940.64
1999 $1,433.74 $1,130.44 $969.87
2000 $1,446.58 $1,130.42 $973.99
2001 $1,464.99 $1,118.32 $992.11
2002 $1,474.18 $1,128.45 $1,004.25
2003 $1,474.20 $1,141.19 $1,009.01
2004 $1,464.86 $1,147.04 $1,008.86
2005 $1,455.38 $1,112.30 $1,001.44
2006 $1,448.64 $1,099.21 $998.23
2007 $1,433.08 $1,104.06 $996.73
2008 $1,420.76 $1,096.40 $999.33
2009 $1,447.42 $1,136.25 $1,024.73
2010 $1,438.30 $1,152.53 $1,019.01
2011 $1,409.30 $1,110.35 $1,002.78
2012 $1,395.91 $1,094.73 $1,002.84
2013 $1,394.79 $1,089.08 $1,004.13
2014 $1,392.11 $1,074.60 $1,005.98
2015 $1,415.73 $1,092.35 $1,033.60
$1,416
$1,092$1,034
$1,159
$911
$825
College graduatesPublic teachersAll workers
1980 1990 2000 2010
1,000
750
1,250
1,500
$1,750
as private-sector wages. The gap has been fairly consistent throughout the 2000s;teachers’ wages slightly declined, as did wages for other college graduates. In 2015 theteacher wage disadvantage compared with other college graduates was 22.8 percent, or$323 per week—substantially higher than the 13.1 percent disadvantage in 1996.
Relative teacher wagesNext we turn to regression analysis to determine the relative wages of teachers.Regression-adjusted estimates account for any changes in the composition of theworkforce and among college graduates over time. This typical wage model controls foreducation, age as a quartic, gender, marital status, geographic region, and race/ethnicity.To present wage gaps in percentage terms we exponentiate the estimated coefficientsand subtract 1. We also expand our analysis to examine trends by gender.
7
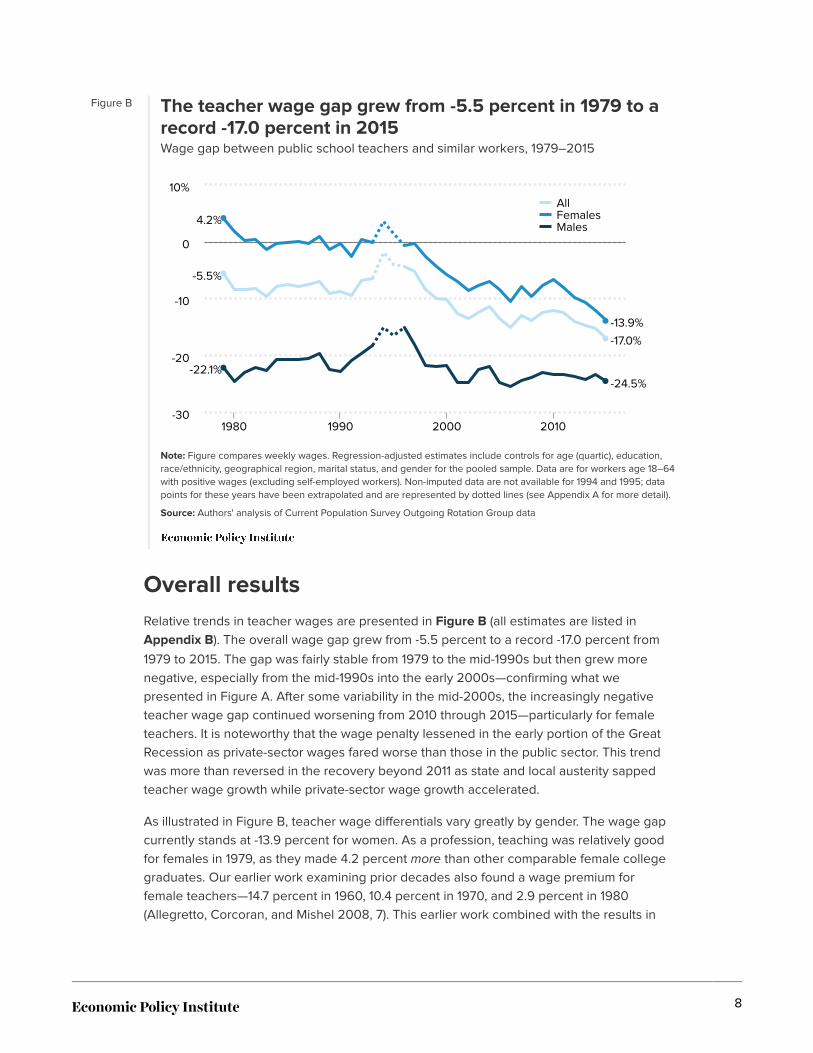
Figure B The teacher wage gap grew from -5.5 percent in 1979 to arecord -17.0 percent in 2015Wage gap between public school teachers and similar workers, 1979–2015
Note: Figure compares weekly wages. Regression-adjusted estimates include controls for age (quartic), education,race/ethnicity, geographical region, marital status, and gender for the pooled sample. Data are for workers age 18–64with positive wages (excluding self-employed workers). Non-imputed data are not available for 1994 and 1995; datapoints for these years have been extrapolated and are represented by dotted lines (see Appendix A for more detail).
Source: Authors' analysis of Current Population Survey Outgoing Rotation Group data
Year AllFemales
Males
All1993-1996
Females1993-1996
Males1993-1996
All1996-2015
Females1996-2015
Males1996-2015
1979 -5.55% 4.18% -22.14%
1980 -8.47% 1.76% -24.57%
1981 -8.45% 0.29% -22.97%
1982 -8.22% 0.32% -22.04%
1983 -9.64% -1.40% -22.68%
1984 -7.87% -0.22% -20.74%
1985 -7.57% -0.16% -20.66%
1986 -7.78% 0.01% -20.73%
1987 -7.58% -0.34% -20.60%
1988 -6.99% 0.91% -19.71%
1989 -9.13% -1.30% -22.42%
1990 -8.81% -0.23% -22.80%
1991 -9.52% -2.54% -20.84%
1992 -6.80% 0.49% -19.62%
1993 -6.37% -0.07% -18.22% -6.37% -0.07% -18.22%
1994 -1.81% 3.65% -15.08%
1995 -3.96% 1.47% -16.56%
1996 -4.32% -0.66% -15.08% -4.32% -0.66% -15.08%
1997 -5.26% -0.38% -18.09%
1998 -8.43% -2.53% -21.81%
1999 -9.97% -4.31% -21.90%
2000 -10.19% -5.67% -21.73%
2001 -12.56% -7.00% -24.75%
2002 -13.55% -8.63% -24.78%
2003 -12.39% -7.60% -22.49%
2004 -11.42% -6.93% -21.95%
2005 -13.43% -8.37% -24.75%
2006 -15.05% -10.55% -25.52%
2007 -12.96% -7.94% -24.37%
2008 -13.77% -9.67% -23.80%
2009 -12.36% -7.69% -23.04%
2010 -12.10% -6.61% -23.26%
2011 -12.52% -8.08% -23.34%
2012 -14.06% -9.85% -23.70%
2013 -14.68% -10.66% -24.27%
2014 -15.33% -12.05% -23.42%
2015 -17.02% -13.90% -24.49%
-5.5%
4.2%
-22.1%
-13.9%
-17.0%
-24.5%
AllFemalesMales
-30
-20
-10
0
10%
1980 1990 2000 2010
Overall resultsRelative trends in teacher wages are presented in Figure B (all estimates are listed inAppendix B). The overall wage gap grew from ‑5.5 percent to a record ‑17.0 percent from
1979 to 2015. The gap was fairly stable from 1979 to the mid-1990s but then grew morenegative, especially from the mid-1990s into the early 2000s—confirming what wepresented in Figure A. After some variability in the mid-2000s, the increasingly negativeteacher wage gap continued worsening from 2010 through 2015—particularly for femaleteachers. It is noteworthy that the wage penalty lessened in the early portion of the GreatRecession as private-sector wages fared worse than those in the public sector. This trendwas more than reversed in the recovery beyond 2011 as state and local austerity sappedteacher wage growth while private-sector wage growth accelerated.
As illustrated in Figure B, teacher wage differentials vary greatly by gender. The wage gapcurrently stands at -13.9 percent for women. As a profession, teaching was relatively goodfor females in 1979, as they made 4.2 percent more than other comparable female collegegraduates. Our earlier work examining prior decades also found a wage premium forfemale teachers—14.7 percent in 1960, 10.4 percent in 1970, and 2.9 percent in 1980(Allegretto, Corcoran, and Mishel 2008, 7). This earlier work combined with the results in
8
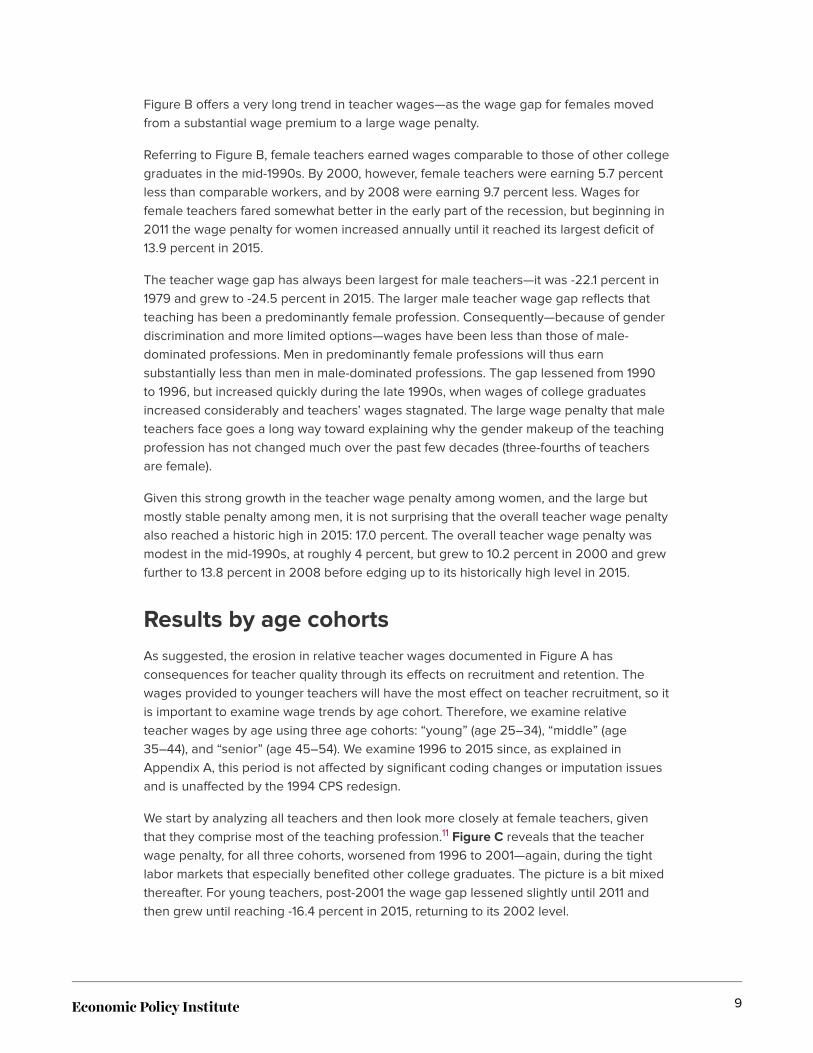
Figure B offers a very long trend in teacher wages—as the wage gap for females movedfrom a substantial wage premium to a large wage penalty.
Referring to Figure B, female teachers earned wages comparable to those of other collegegraduates in the mid-1990s. By 2000, however, female teachers were earning 5.7 percentless than comparable workers, and by 2008 were earning 9.7 percent less. Wages forfemale teachers fared somewhat better in the early part of the recession, but beginning in2011 the wage penalty for women increased annually until it reached its largest deficit of13.9 percent in 2015.
The teacher wage gap has always been largest for male teachers—it was -22.1 percent in1979 and grew to -24.5 percent in 2015. The larger male teacher wage gap reflects thatteaching has been a predominantly female profession. Consequently—because of genderdiscrimination and more limited options—wages have been less than those of male-dominated professions. Men in predominantly female professions will thus earnsubstantially less than men in male-dominated professions. The gap lessened from 1990to 1996, but increased quickly during the late 1990s, when wages of college graduatesincreased considerably and teachers’ wages stagnated. The large wage penalty that maleteachers face goes a long way toward explaining why the gender makeup of the teachingprofession has not changed much over the past few decades (three-fourths of teachersare female).
Given this strong growth in the teacher wage penalty among women, and the large butmostly stable penalty among men, it is not surprising that the overall teacher wage penaltyalso reached a historic high in 2015: 17.0 percent. The overall teacher wage penalty wasmodest in the mid-1990s, at roughly 4 percent, but grew to 10.2 percent in 2000 and grewfurther to 13.8 percent in 2008 before edging up to its historically high level in 2015.
Results by age cohortsAs suggested, the erosion in relative teacher wages documented in Figure A hasconsequences for teacher quality through its effects on recruitment and retention. Thewages provided to younger teachers will have the most effect on teacher recruitment, so itis important to examine wage trends by age cohort. Therefore, we examine relativeteacher wages by age using three age cohorts: “young” (age 25–34), “middle” (age35–44), and “senior” (age 45–54). We examine 1996 to 2015 since, as explained inAppendix A, this period is not affected by significant coding changes or imputation issuesand is unaffected by the 1994 CPS redesign.
We start by analyzing all teachers and then look more closely at female teachers, giventhat they comprise most of the teaching profession.11 Figure C reveals that the teacherwage penalty, for all three cohorts, worsened from 1996 to 2001—again, during the tightlabor markets that especially benefited other college graduates. The picture is a bit mixedthereafter. For young teachers, post-2001 the wage gap lessened slightly until 2011 andthen grew until reaching ‑16.4 percent in 2015, returning to its 2002 level.
9
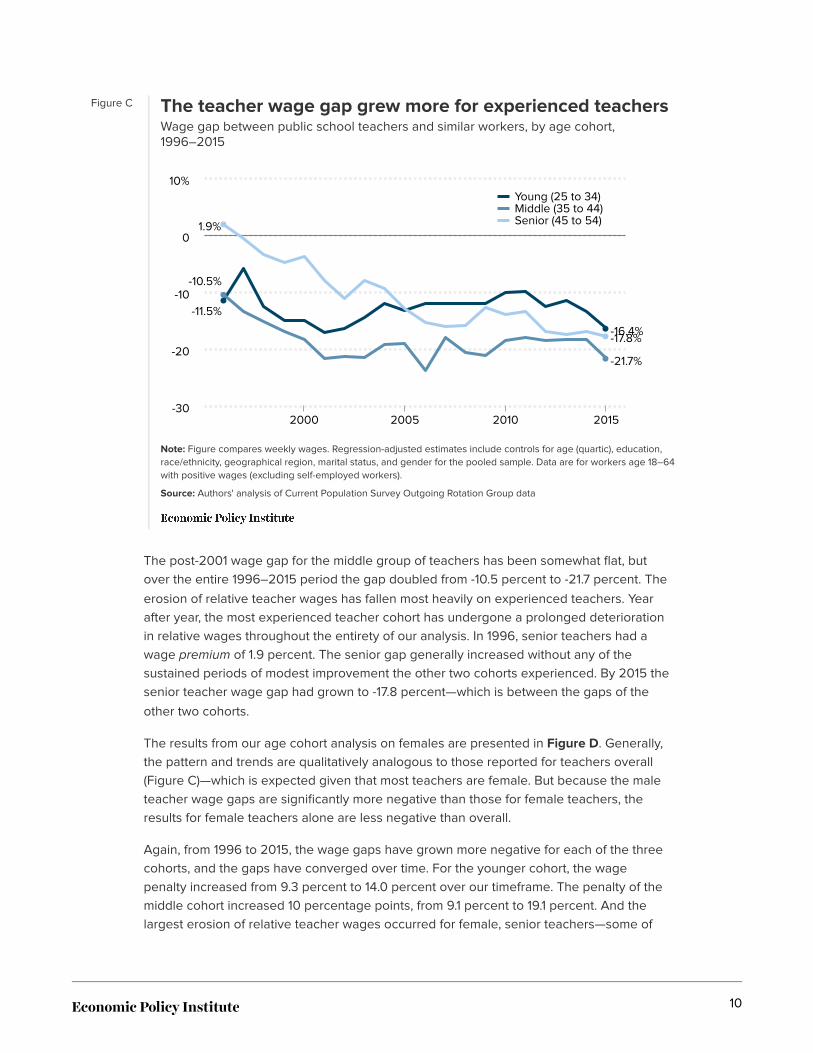
Figure C The teacher wage gap grew more for experienced teachersWage gap between public school teachers and similar workers, by age cohort,1996–2015
Note: Figure compares weekly wages. Regression-adjusted estimates include controls for age (quartic), education,race/ethnicity, geographical region, marital status, and gender for the pooled sample. Data are for workers age 18–64with positive wages (excluding self-employed workers).
Source: Authors' analysis of Current Population Survey Outgoing Rotation Group data
Year
Young(25 to
34)
Middle(35 to
44)
Senior(45 to
54)
1996 -11.49% -10.49% 1.91%
1997 -5.83% -13.37% -0.49%
1998 -12.47% -15.14% -3.34%
1999 -15.05% -16.91% -4.80%
2000 -14.92% -18.39% -3.66%
2001 -17.13% -21.69% -8.01%
2002 -16.38% -21.29% -11.15%
2003 -14.52% -21.50% -7.88%
2004 -12.02% -19.20% -9.31%
2005 -13.19% -19.03% -12.89%
2006 -11.95% -23.84% -15.39%
2007 -12.00% -17.91% -16.12%
2008 -12.00% -20.70% -15.94%
2009 -12.06% -21.15% -12.75%
2010 -10.13% -18.45% -13.89%
2011 -9.93% -18.01% -13.33%
2012 -12.59% -18.56% -16.90%
2013 -11.54% -18.29% -17.44%
2014 -13.38% -18.33% -16.86%
2015 -16.44% -21.71% -17.80%
-11.5%
-16.4%
-10.5%
-21.7%
1.9%
-17.8%
Young (25 to 34)Middle (35 to 44)Senior (45 to 54)
-30
-20
-10
0
10%
2000 2005 2010 2015
The post-2001 wage gap for the middle group of teachers has been somewhat flat, butover the entire 1996–2015 period the gap doubled from ‑10.5 percent to ‑21.7 percent. The
erosion of relative teacher wages has fallen most heavily on experienced teachers. Yearafter year, the most experienced teacher cohort has undergone a prolonged deteriorationin relative wages throughout the entirety of our analysis. In 1996, senior teachers had awage premium of 1.9 percent. The senior gap generally increased without any of thesustained periods of modest improvement the other two cohorts experienced. By 2015 thesenior teacher wage gap had grown to ‑17.8 percent—which is between the gaps of the
other two cohorts.
The results from our age cohort analysis on females are presented in Figure D. Generally,the pattern and trends are qualitatively analogous to those reported for teachers overall(Figure C)—which is expected given that most teachers are female. But because the maleteacher wage gaps are significantly more negative than those for female teachers, theresults for female teachers alone are less negative than overall.
Again, from 1996 to 2015, the wage gaps have grown more negative for each of the threecohorts, and the gaps have converged over time. For the younger cohort, the wagepenalty increased from 9.3 percent to 14.0 percent over our timeframe. The penalty of themiddle cohort increased 10 percentage points, from 9.1 percent to 19.1 percent. And thelargest erosion of relative teacher wages occurred for female, senior teachers—some of
10
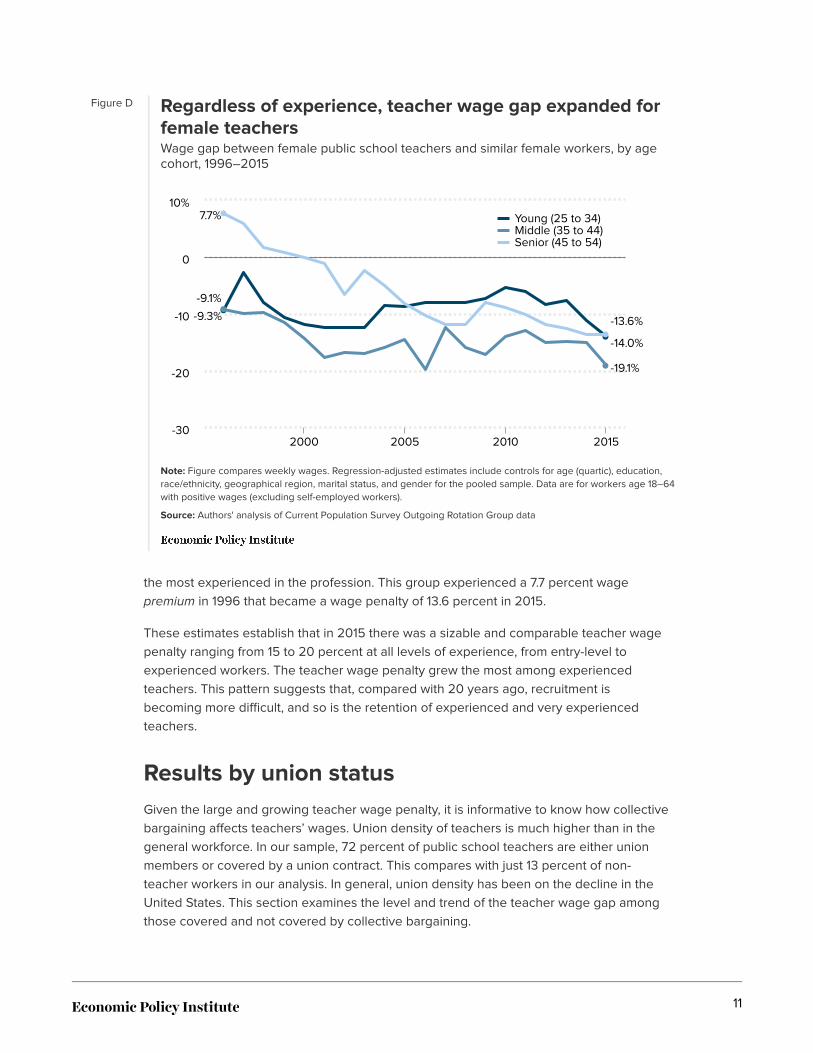
Figure D Regardless of experience, teacher wage gap expanded forfemale teachersWage gap between female public school teachers and similar female workers, by agecohort, 1996–2015
Note: Figure compares weekly wages. Regression-adjusted estimates include controls for age (quartic), education,race/ethnicity, geographical region, marital status, and gender for the pooled sample. Data are for workers age 18–64with positive wages (excluding self-employed workers).
Source: Authors' analysis of Current Population Survey Outgoing Rotation Group data
Year
Young(25 to
34)
Middle(35 to
44)
Senior(45 to
54)
1996 -9.35% -9.15% 7.69%
1997 -2.72% -9.85% 5.99%
1998 -8.04% -9.77% 1.65%
1999 -10.64% -11.53% 0.85%
2000 -11.78% -14.31% -0.01%
2001 -12.32% -17.70% -1.20%
2002 -12.33% -16.83% -6.56%
2003 -12.34% -16.87% -2.35%
2004 -8.46% -15.88% -5.01%
2005 -8.63% -14.52% -8.23%
2006 -7.98% -19.75% -10.34%
2007 -7.93% -12.45% -11.77%
2008 -7.99% -15.93% -11.94%
2009 -7.33% -17.18% -8.02%
2010 -5.27% -13.95% -8.88%
2011 -6.05% -12.87% -10.01%
2012 -8.39% -15.03% -11.79%
2013 -7.69% -14.89% -12.61%
2014 -11.22% -14.99% -13.53%
2015-14.00% -19.10% -13.6%
-9.3%
-14.0%
-9.1%
-19.1%
7.7%
-13.6%
Young (25 to 34)Middle (35 to 44)Senior (45 to 54)
-30
-20
-10
0
10%
2000 2005 2010 2015
the most experienced in the profession. This group experienced a 7.7 percent wagepremium in 1996 that became a wage penalty of 13.6 percent in 2015.
These estimates establish that in 2015 there was a sizable and comparable teacher wagepenalty ranging from 15 to 20 percent at all levels of experience, from entry-level toexperienced workers. The teacher wage penalty grew the most among experiencedteachers. This pattern suggests that, compared with 20 years ago, recruitment isbecoming more difficult, and so is the retention of experienced and very experiencedteachers.
Results by union statusGiven the large and growing teacher wage penalty, it is informative to know how collectivebargaining affects teachers’ wages. Union density of teachers is much higher than in thegeneral workforce. In our sample, 72 percent of public school teachers are either unionmembers or covered by a union contract. This compares with just 13 percent of non-teacher workers in our analysis. In general, union density has been on the decline in theUnited States. This section examines the level and trend of the teacher wage gap amongthose covered and not covered by collective bargaining.
11
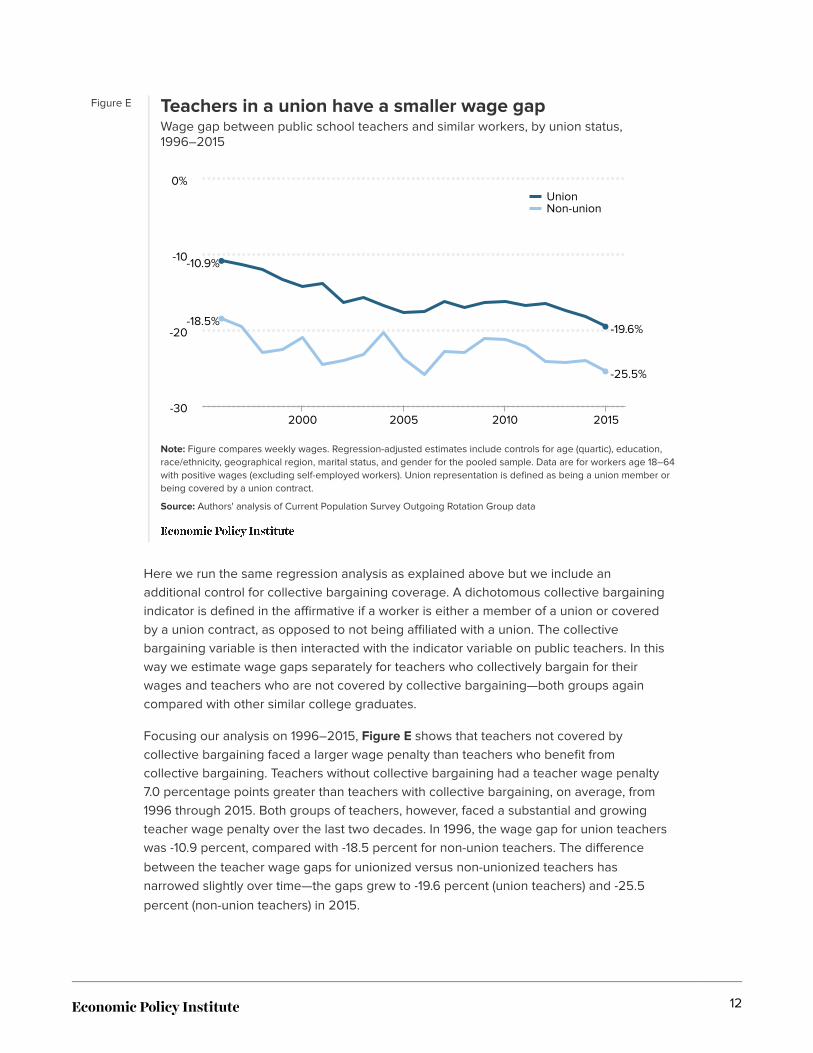
Figure E Teachers in a union have a smaller wage gapWage gap between public school teachers and similar workers, by union status,1996–2015
Note: Figure compares weekly wages. Regression-adjusted estimates include controls for age (quartic), education,race/ethnicity, geographical region, marital status, and gender for the pooled sample. Data are for workers age 18–64with positive wages (excluding self-employed workers). Union representation is defined as being a union member orbeing covered by a union contract.
Source: Authors' analysis of Current Population Survey Outgoing Rotation Group data
Year Union Non-union
1996 -10.89% -18.51%
1997 -11.42% -19.57%
1998 -12.05% -22.91%
1999 -13.37% -22.51%
2000 -14.25% -21.03%
2001 -13.86% -24.52%
2002 -16.39% -24.01%
2003 -15.75% -23.19%
2004 -16.72% -20.37%
2005 -17.63% -23.70%
2006 -17.60% -25.81%
2007 -16.30% -22.89%
2008 -17.01% -22.96%
2009 -16.38% -21.11%
2010 -16.21% -21.23%
2011 -16.76% -22.22%
2012 -16.45% -24.12%
2013 -17.39% -24.33%
2014 -18.28% -24.05%
2015 -19.56% -25.47%
-10.9%
-19.6%-18.5%
-25.5%
UnionNon-union
2000 2005 2010 2015-30
-20
-10
0%
Here we run the same regression analysis as explained above but we include anadditional control for collective bargaining coverage. A dichotomous collective bargainingindicator is defined in the affirmative if a worker is either a member of a union or coveredby a union contract, as opposed to not being affiliated with a union. The collectivebargaining variable is then interacted with the indicator variable on public teachers. In thisway we estimate wage gaps separately for teachers who collectively bargain for theirwages and teachers who are not covered by collective bargaining—both groups againcompared with other similar college graduates.
Focusing our analysis on 1996–2015, Figure E shows that teachers not covered bycollective bargaining faced a larger wage penalty than teachers who benefit fromcollective bargaining. Teachers without collective bargaining had a teacher wage penalty7.0 percentage points greater than teachers with collective bargaining, on average, from1996 through 2015. Both groups of teachers, however, faced a substantial and growingteacher wage penalty over the last two decades. In 1996, the wage gap for union teacherswas ‑10.9 percent, compared with ‑18.5 percent for non-union teachers. The difference
between the teacher wage gaps for unionized versus non-unionized teachers hasnarrowed slightly over time—the gaps grew to ‑19.6 percent (union teachers) and ‑25.5
percent (non-union teachers) in 2015.
12
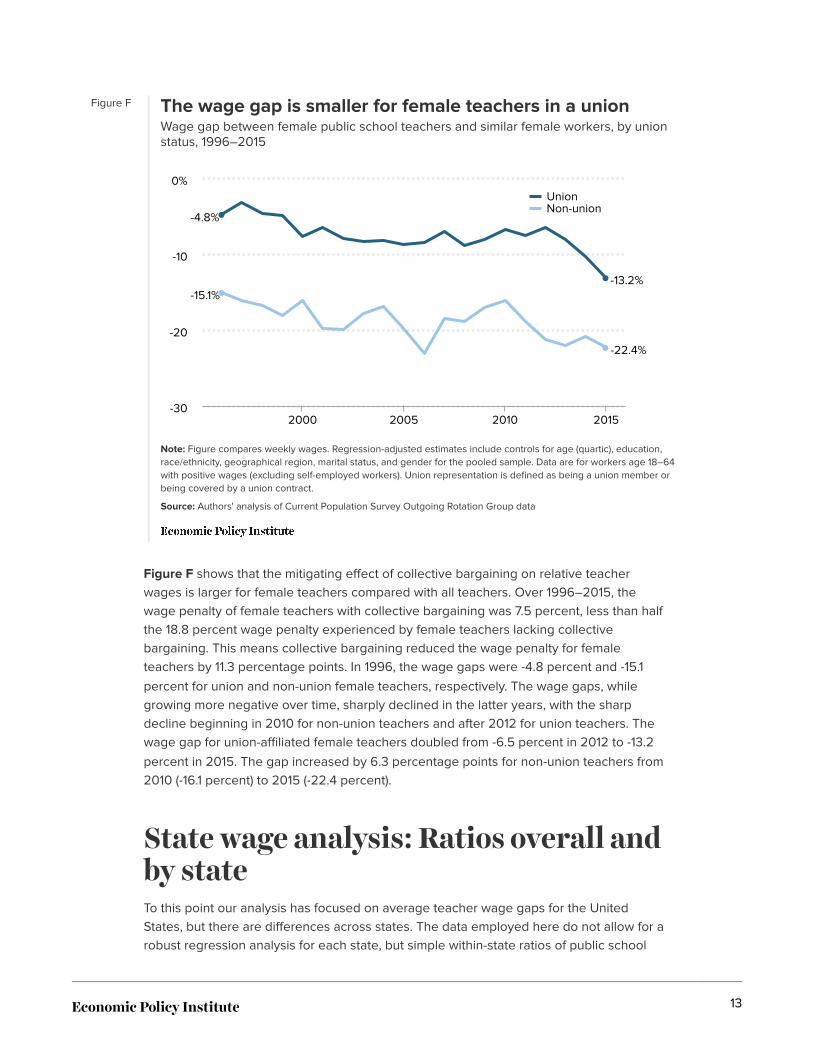
Figure F The wage gap is smaller for female teachers in a unionWage gap between female public school teachers and similar female workers, by unionstatus, 1996–2015
Note: Figure compares weekly wages. Regression-adjusted estimates include controls for age (quartic), education,race/ethnicity, geographical region, marital status, and gender for the pooled sample. Data are for workers age 18–64with positive wages (excluding self-employed workers). Union representation is defined as being a union member orbeing covered by a union contract.
Source: Authors' analysis of Current Population Survey Outgoing Rotation Group data
Year Union Non-union
1996 -4.8239% -15.1142%
1997 -3.1197% -16.1238%
1998 -4.6490% -16.7834%
1999 -4.8905% -18.0698%
2000 -7.6943% -16.0569%
2001 -6.5381% -19.8071%
2002 -7.8680% -19.9737%
2003 -8.2807% -17.7961%
2004 -8.2197% -16.9125%
2005 -8.7760% -19.8453%
2006 -8.3984% -23.0571%
2007 -7.0411% -18.4240%
2008 -8.8047% -18.8815%
2009 -8.0873% -17.0013%
2010 -6.7949% -16.0536%
2011 -7.5807% -18.8937%
2012 -6.5180% -21.2190%
2013 -8.0988% -22.0175%
2014 -10.3119% -20.8320%
2015 -13.1726% -22.3684%
-4.8%
-13.2%-15.1%
-22.4%
UnionNon-union
2000 2005 2010 2015-30
-20
-10
0%
Figure F shows that the mitigating effect of collective bargaining on relative teacherwages is larger for female teachers compared with all teachers. Over 1996–2015, thewage penalty of female teachers with collective bargaining was 7.5 percent, less than halfthe 18.8 percent wage penalty experienced by female teachers lacking collectivebargaining. This means collective bargaining reduced the wage penalty for femaleteachers by 11.3 percentage points. In 1996, the wage gaps were ‑4.8 percent and ‑15.1
percent for union and non-union female teachers, respectively. The wage gaps, whilegrowing more negative over time, sharply declined in the latter years, with the sharpdecline beginning in 2010 for non-union teachers and after 2012 for union teachers. Thewage gap for union-affiliated female teachers doubled from ‑6.5 percent in 2012 to ‑13.2
percent in 2015. The gap increased by 6.3 percentage points for non-union teachers from2010 (‑16.1 percent) to 2015 (‑22.4 percent).
State wage analysis: Ratios overall andby stateTo this point our analysis has focused on average teacher wage gaps for the UnitedStates, but there are differences across states. The data employed here do not allow for arobust regression analysis for each state, but simple within-state ratios of public school
13
teachers to other college graduates are informative. We used pooled 2011–2015 CPS-ORGdata to calculate state wage ratios shown in Figure G.12 The ratio for the overall UnitedStates is 0.77, meaning that, on average, teachers earn just 77 percent of what othercollege graduates earn in wages. Arizona (0.63) has the lowest ratio, while Wyoming (0.99)has the highest. In 18 states, public school teacher weekly wages lag by more than 25percent. In contrast, there are only five states where teacher weekly wages are less than10 percent behind, and no state where teacher wages are equal to or better than those ofother college graduates. Appendix C lists state ratios and reports weekly wages forteachers and other college graduates by bachelor and master degree.
Adding benefits to the pictureOur analysis of relative teacher pay thus far has focused entirely on the wages of teacherscompared to other workers. Yet benefits such as pensions and health insurance are anincreasingly important component of the total compensation package. Teachers do enjoymore attractive benefit packages than other professionals; thus, our measure of relativeteacher wages overstates the teacher disadvantage in total compensation. The differentnatures of wages and benefits should be kept in mind, as it is only wages that may bespent or saved. Thus, the growing wage penalty is always of importance.
This section examines how our estimates of relative teacher wages should be adjusted toreflect differences in total compensation; that is, it measures the size of the advantageteachers have in benefits, relative to other professionals, and adjusts the wage penalty toderive an overall compensation penalty. We draw heavily on our prior work analyzing the“benefits bias” (Allegretto, Corcoran, and Mishel 2004, 2008) and update our calculationsto 2015.
Basic facts on non-wage benefits and the“benefits bias”Table 1 provides the basic information necessary to compare benefits packages—as ashare of overall compensation—of primary, secondary, and special education teachers andcomparable workers (specifically, professional workers).13 This table uses the BLSEmployer Costs for Employee Compensation (ECEC) series to disaggregate the overallcost of compensation into its various components, such as wages, benefits, and employertaxes. These shares allow us to estimate the benefits advantage not taken intoconsideration in the wage-only comparisons presented earlier. This section presentsestimates of the benefits advantage for 1994–2015 to enable estimates of the overallteacher compensation (wages and benefits) penalty.
14
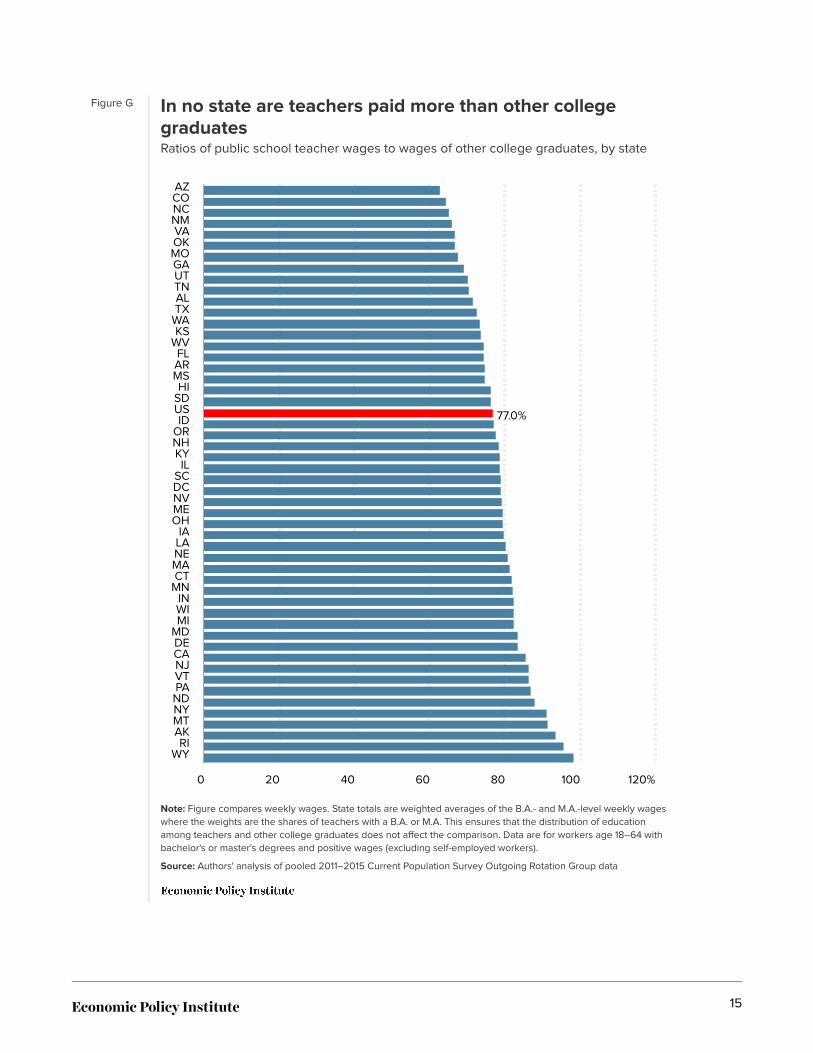
Figure G In no state are teachers paid more than other collegegraduatesRatios of public school teacher wages to wages of other college graduates, by state
Note: Figure compares weekly wages. State totals are weighted averages of the B.A.- and M.A.-level weekly wageswhere the weights are the shares of teachers with a B.A. or M.A. This ensures that the distribution of educationamong teachers and other college graduates does not affect the comparison. Data are for workers age 18–64 withbachelor's or master's degrees and positive wages (excluding self-employed workers).
Source: Authors' analysis of pooled 2011–2015 Current Population Survey Outgoing Rotation Group data
State Ratio
AZ 62.8273%
CO 64.5359%
NC 65.3831%
NM 66.1615%
VA 66.8668%
OK 66.9839%
MO 67.8059%
GA 69.2528%
UT 70.3109%
TN 70.6913%
AL 71.7913%
TX 72.8042%
WA 73.5180%
KS 73.8709%
WV 74.6167%
FL 74.6369%
AR 74.8076%
MS 74.8438%
HI 76.3628%
SD 76.3800%
US 77.0171%
ID 77.3277%
OR 77.9107%
NH 78.5277%
KY 78.7610%
IL 78.9697%
SC 79.1601%
DC 79.1998%
NV 79.3665%
ME 79.7165%
OH 79.7357%
IA 80.0012%
LA 80.5429%
NE 80.8519%
MA 81.6090%
CT 82.0540%
MN 82.2927%
IN 82.4501%
WI 82.5462%
MI 82.6941%
MD 83.5838%
DE 83.6782%
CA 85.7933%
NJ 86.5113%
VT 86.5898%
PA 87.0534%
ND 88.1751%
NY 91.2595%
MT 91.6600%
AK 93.8367%
RI 95.7748%
WY 98.6246%
77.0%
AZCONCNMVAOKMOGAUTTNALTX
WAKS
WVFLARMSHI
SDUSID
ORNHKYIL
SCDCNVMEOH
IALANEMACT
MNINWIMI
MDDECANJVTPANDNYMTAKRI
WY
0 20 40 60 80 100 120%
15
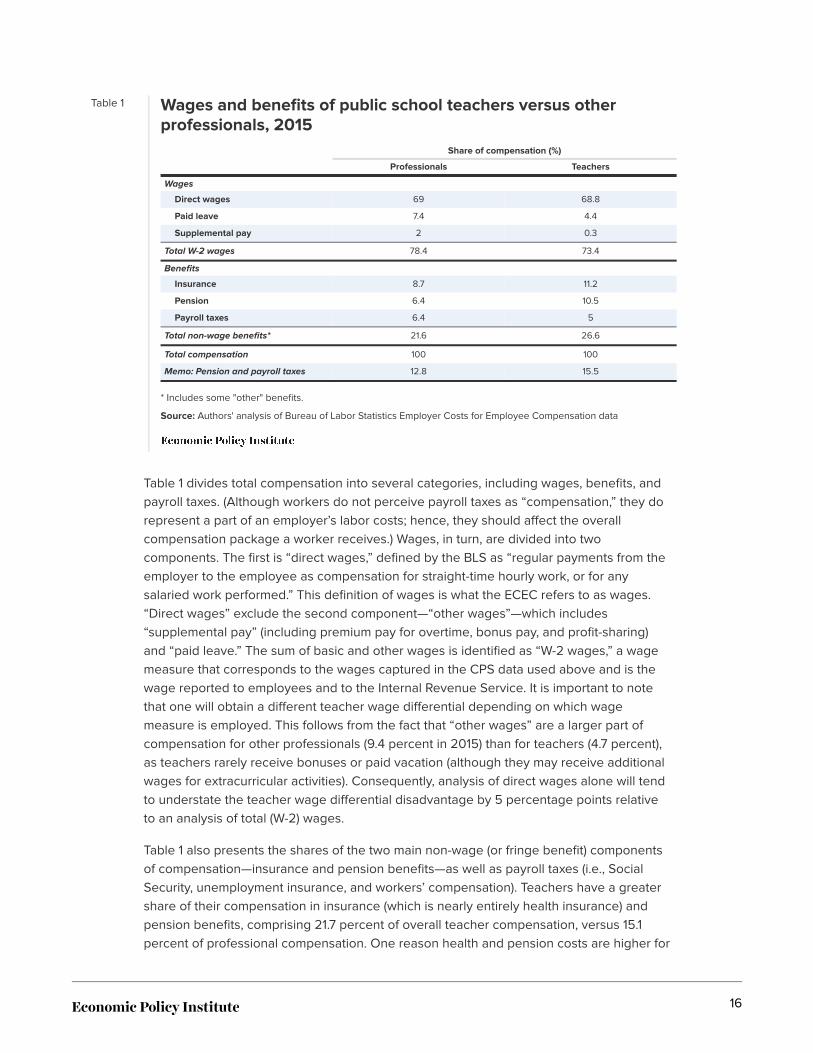
Table 1 Wages and benefits of public school teachers versus otherprofessionals, 2015
Share of compensation (%)
Professionals Teachers
Wages
Direct wages 69 68.8
Paid leave 7.4 4.4
Supplemental pay 2 0.3
Total W-2 wages 78.4 73.4
Benefits
Insurance 8.7 11.2
Pension 6.4 10.5
Payroll taxes 6.4 5
Total non-wage benefits* 21.6 26.6
Total compensation 100 100
Memo: Pension and payroll taxes 12.8 15.5
* Includes some "other" benefits.
Source: Authors' analysis of Bureau of Labor Statistics Employer Costs for Employee Compensation data
Table 1 divides total compensation into several categories, including wages, benefits, andpayroll taxes. (Although workers do not perceive payroll taxes as “compensation,” they dorepresent a part of an employer’s labor costs; hence, they should affect the overallcompensation package a worker receives.) Wages, in turn, are divided into twocomponents. The first is “direct wages,” defined by the BLS as “regular payments from theemployer to the employee as compensation for straight-time hourly work, or for anysalaried work performed.” This definition of wages is what the ECEC refers to as wages.“Direct wages” exclude the second component—“other wages”—which includes“supplemental pay” (including premium pay for overtime, bonus pay, and profit-sharing)and “paid leave.” The sum of basic and other wages is identified as “W-2 wages,” a wagemeasure that corresponds to the wages captured in the CPS data used above and is thewage reported to employees and to the Internal Revenue Service. It is important to notethat one will obtain a different teacher wage differential depending on which wagemeasure is employed. This follows from the fact that “other wages” are a larger part ofcompensation for other professionals (9.4 percent in 2015) than for teachers (4.7 percent),as teachers rarely receive bonuses or paid vacation (although they may receive additionalwages for extracurricular activities). Consequently, analysis of direct wages alone will tendto understate the teacher wage differential disadvantage by 5 percentage points relativeto an analysis of total (W-2) wages.
Table 1 also presents the shares of the two main non-wage (or fringe benefit) componentsof compensation—insurance and pension benefits—as well as payroll taxes (i.e., SocialSecurity, unemployment insurance, and workers’ compensation). Teachers have a greatershare of their compensation in insurance (which is nearly entirely health insurance) andpension benefits, comprising 21.7 percent of overall teacher compensation, versus 15.1percent of professional compensation. One reason health and pension costs are higher for
16
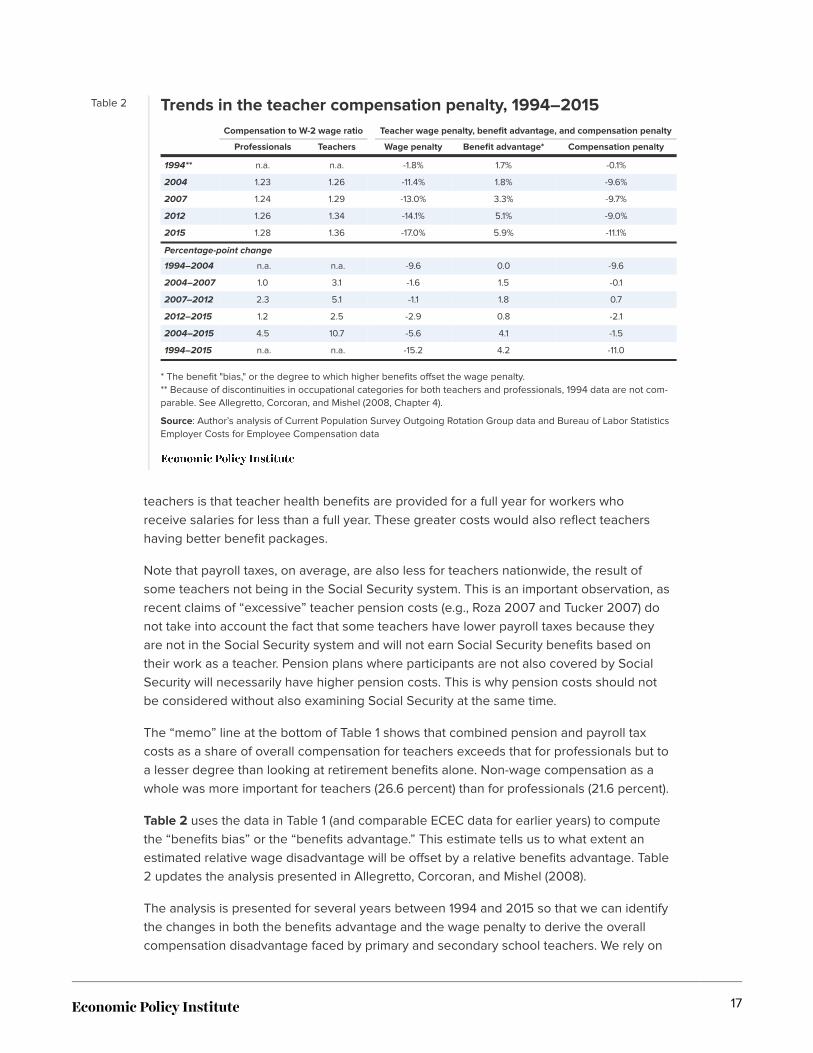
Table 2 Trends in the teacher compensation penalty, 1994–2015Compensation to W-2 wage ratio Teacher wage penalty, benefit advantage, and compensation penalty
Professionals Teachers Wage penalty Benefit advantage* Compensation penalty
1994** n.a. n.a. -1.8% 1.7% -0.1%
2004 1.23 1.26 -11.4% 1.8% -9.6%
2007 1.24 1.29 -13.0% 3.3% -9.7%
2012 1.26 1.34 -14.1% 5.1% -9.0%
2015 1.28 1.36 -17.0% 5.9% -11.1%
Percentage-point change
1994–2004 n.a. n.a. -9.6 0.0 -9.6
2004–2007 1.0 3.1 -1.6 1.5 -0.1
2007–2012 2.3 5.1 -1.1 1.8 0.7
2012–2015 1.2 2.5 -2.9 0.8 -2.1
2004–2015 4.5 10.7 -5.6 4.1 -1.5
1994–2015 n.a. n.a. -15.2 4.2 -11.0
* The benefit "bias," or the degree to which higher benefits offset the wage penalty.** Because of discontinuities in occupational categories for both teachers and professionals, 1994 data are not com-parable. See Allegretto, Corcoran, and Mishel (2008, Chapter 4).
Source: Author’s analysis of Current Population Survey Outgoing Rotation Group data and Bureau of Labor StatisticsEmployer Costs for Employee Compensation data
teachers is that teacher health benefits are provided for a full year for workers whoreceive salaries for less than a full year. These greater costs would also reflect teachershaving better benefit packages.
Note that payroll taxes, on average, are also less for teachers nationwide, the result ofsome teachers not being in the Social Security system. This is an important observation, asrecent claims of “excessive” teacher pension costs (e.g., Roza 2007 and Tucker 2007) donot take into account the fact that some teachers have lower payroll taxes because theyare not in the Social Security system and will not earn Social Security benefits based ontheir work as a teacher. Pension plans where participants are not also covered by SocialSecurity will necessarily have higher pension costs. This is why pension costs should notbe considered without also examining Social Security at the same time.
The “memo” line at the bottom of Table 1 shows that combined pension and payroll taxcosts as a share of overall compensation for teachers exceeds that for professionals but toa lesser degree than looking at retirement benefits alone. Non-wage compensation as awhole was more important for teachers (26.6 percent) than for professionals (21.6 percent).
Table 2 uses the data in Table 1 (and comparable ECEC data for earlier years) to computethe “benefits bias” or the “benefits advantage.” This estimate tells us to what extent anestimated relative wage disadvantage will be offset by a relative benefits advantage. Table2 updates the analysis presented in Allegretto, Corcoran, and Mishel (2008).
The analysis is presented for several years between 1994 and 2015 so that we can identifythe changes in both the benefits advantage and the wage penalty to derive the overallcompensation disadvantage faced by primary and secondary school teachers. We rely on
17
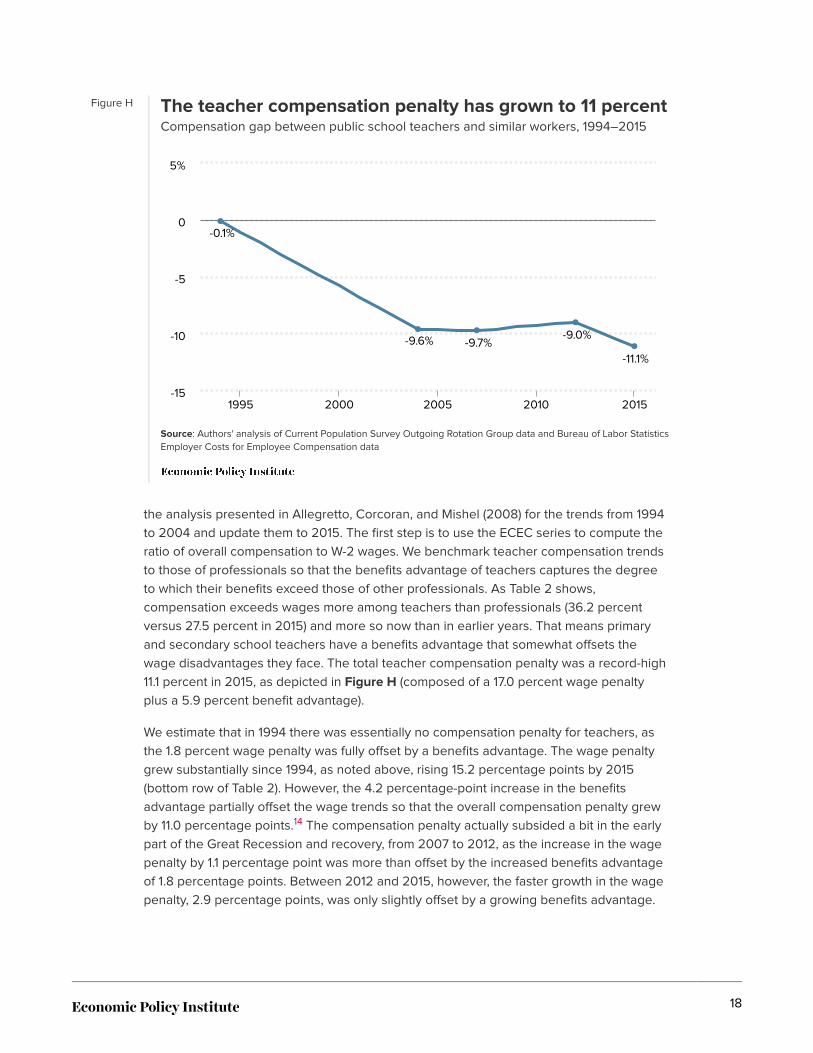
Figure H The teacher compensation penalty has grown to 11 percentCompensation gap between public school teachers and similar workers, 1994–2015
Source: Authors' analysis of Current Population Survey Outgoing Rotation Group data and Bureau of Labor StatisticsEmployer Costs for Employee Compensation data
Year
Teachercompensation
penalty
1994 -0.1%
1995 -1.1%
1996 -2.0%
1997 -3.0%
1998 -3.9%
1999 -4.9%
2000 -5.8%
2001 -6.8%
2002 -7.7%
2003 -8.7%
2004 -9.6%
2005 -9.6%
2006 -9.7%
2007 -9.7%
2008 -9.6%
2009 -9.4%
2010 -9.3%
2011 -9.1%
2012 -9.0%
2013 -9.7%
2014 -10.4%
2015 -11.1%
-0.1%
-9.6% -9.7%-9.0%
-11.1%
-10
-5
0
-15
5%
1995 2000 2005 2010 2015
the analysis presented in Allegretto, Corcoran, and Mishel (2008) for the trends from 1994to 2004 and update them to 2015. The first step is to use the ECEC series to compute theratio of overall compensation to W-2 wages. We benchmark teacher compensation trendsto those of professionals so that the benefits advantage of teachers captures the degreeto which their benefits exceed those of other professionals. As Table 2 shows,compensation exceeds wages more among teachers than professionals (36.2 percentversus 27.5 percent in 2015) and more so now than in earlier years. That means primaryand secondary school teachers have a benefits advantage that somewhat offsets thewage disadvantages they face. The total teacher compensation penalty was a record-high11.1 percent in 2015, as depicted in Figure H (composed of a 17.0 percent wage penaltyplus a 5.9 percent benefit advantage).
We estimate that in 1994 there was essentially no compensation penalty for teachers, asthe 1.8 percent wage penalty was fully offset by a benefits advantage. The wage penaltygrew substantially since 1994, as noted above, rising 15.2 percentage points by 2015(bottom row of Table 2). However, the 4.2 percentage-point increase in the benefitsadvantage partially offset the wage trends so that the overall compensation penalty grewby 11.0 percentage points.14 The compensation penalty actually subsided a bit in the earlypart of the Great Recession and recovery, from 2007 to 2012, as the increase in the wagepenalty by 1.1 percentage point was more than offset by the increased benefits advantageof 1.8 percentage points. Between 2012 and 2015, however, the faster growth in the wagepenalty, 2.9 percentage points, was only slightly offset by a growing benefits advantage.
18
These trends in wages and benefits are probably related. Recent years have seen extremepressure on school district budgets to curtail hiring and costs. It may be the case thatteachers and school districts have sought to preserve benefits by restraining wage costs.If this were the case relative to the employers of professionals we would observe a greaterteacher wage penalty with a partially offsetting increased benefits advantage. The bottomline is that since 1994 there has been an erosion of teacher compensation of 11 percentagepoints relative to other college graduates and professionals.
ConclusionThe opportunity cost of becoming a teacher and remaining in the profession becomesmore and more important as relative teacher pay falls further behind that of otherprofessions. The large negative wage gap for male teachers likely is a key reason why thegender mix of teachers has not changed much over time. That women, once a somewhatcaptive labor pool for the teaching profession, have many more opportunities outside theprofession today than in the past means that growing wage and compensationdifferentials will make it all the more difficult to recruit and retain high-quality teachers.Moreover, the ever-increasing costs of higher education and burdensome student loansare also a barrier to the teaching profession in light of a widening pay gap.
The recent trends we document represent only a small part of a much larger long-rundecline in the relative pay of teachers. U.S. decennial Census data show that the wagegap between female public school teachers and comparably educated women—for whomthe labor market dramatically changed over 1960–2000—grew by nearly 28 percentagepoints, from a relative wage advantage of 14.7 percent in 1960 to a disadvantage of 13.2percent in 2000. Among all (male and female) public school teachers, the relative wagedisadvantage grew almost 20 percentage points over 1960–2000 (Allegretto, Corcoran,and Mishel 2008, 7). Our results show that the teacher wage penalty grew an additional7.0 and 9.6 percentage points, respectively, for all and female teachers since 2000.15
Improvements in the non-wage benefits of primary and secondary school teacherspartially offset the worsening wage disparities: The weekly total compensation (wagesplus benefits) disadvantage facing teachers in 2015 was about 11 percent, or roughly 6percentage points less than the 17 percent weekly wage disadvantage estimated for thatyear. It is good news that teachers are able to bargain a total compensation package—as itseems they may have forgone wage increases for benefits recently. But, as we’vedocumented, teacher wages have been stagnant since the mid-1990s. This makes thewage gap, on its own, critically important, as it is only earnings that help to make endsmeet regarding pecuniary expenses such as rents, food, and paying off student loans.
If the policy goal is to improve the quality of the entire teaching workforce, then raising thelevel of teacher compensation, including wages, is critical to recruiting and retaininghigher-quality teachers. Policies that solely focus on changing the composition of currentcompensation (e.g., merit or pay-for-performance schemes) without actually increasingcompensation levels are unlikely to be effective. Simply put, improving overall teacherquality requires correcting the teacher compensation disadvantage.
19
— The authors thank Saika Belal and Jessica Schieder for their valuable contributions tothis report.
About the authorsSylvia A. Allegretto is a labor economist and chair of the Center on Wage andEmployment Dynamics, which is housed at the Institute for Research on Labor andEmployment at the University of California, Berkeley. She is also a research associate ofthe Economic Policy Institute and is co-author of many EPI publications, including pasteditions of The State of Working America, How Does Teacher Pay Compare?, and TheTeaching Penalty: Teacher Pay Losing Ground. She has a Ph.D. in economics from theUniversity of Colorado at Boulder.
Lawrence Mishel, a nationally recognized economist, has been president of the EconomicPolicy Institute since 2002. Prior to that he was EPI’s first research director (starting in1987) and later became vice president. He is the co-author of all 12 editions of The State ofWorking America. He holds a Ph.D. in economics from the University of Wisconsin atMadison, and his articles have appeared in a variety of academic and non-academicjournals. His areas of research are labor economics, wage and income distribution,industrial relations, productivity growth, and the economics of education.
Appendix AIn this appendix we provide a summary of the data used in this analysis. Furtherdocumentation of each can be found in Allegretto, Corcoran, and Mishel (2008).
We use individual data from the Current Population Survey (CPS) from the Bureau of LaborStatistics (BLS), specifically the “Outgoing Rotation Group” sample, or CPS-ORG. Theteachers studied here are elementary, middle, and secondary school teachers (teachersnot included are kindergarten, early-education, and special education teachers). The CPSis the monthly survey administered by the BLS to more than 60,000 households tomeasure and report on unemployment. The CPS-ORG data used here are based onreports from nearly 145,000 workers each year. The CPS-ORG is one of the data sourcesmost widely used by economists to study wages and employment. The CPS-ORG data areparticularly useful due to their large sample and information on weekly wages. Since 1994,the CPS-ORG survey has asked respondents to report their wages on a weekly, biweekly,monthly, or annual basis (whichever the respondent finds most appropriate), from whichthe BLS then derives the weekly wage. More than half of teachers report an annual (asopposed to a monthly, bi-weekly, or weekly) wage to BLS. Respondents also report thehours they worked the previous week.
This analysis restricts the sample to all full-time workers between the age of 18 and 64(defining “full time” as working at least 35 hours per week). Teachers are identified usingdetailed Census occupation codes, and include only elementary and secondary teachers
20
(pre-kindergarten and kindergarten teachers, adult educators, and special educationteachers are excluded). This analysis also only focuses on public school teachers (privateschool teachers—who on average earn less than public school teachers—are excluded).16
There are several measurement issues that require some further discussion. First, as in ourearlier work, we limit our analysis to workers whose wage data were provided by therespondent and not “imputed,” or assigned by the Census Bureau, who imputes earningsfor the BLS. Second, we justify our choice of comparing weekly, as opposed to annual orhourly, earnings. Lastly, several coding changes over the period under study are worthnoting.
ImputationsThe CPS-ORG data used in this analysis are non-imputed data. When a survey respondentfails to report any earnings, the BLS imputes his or her earnings. The imputation procedureis based on a Census Bureau “hot deck” methodology that finds a respondent or “donor”in the survey who closely matches the non-respondent in characteristics such as location,age, race, and education. The problem arises here because occupation is not necessarilyone of the criteria used in imputing earnings—non-responding teachers are more oftenthan not assigned the average earnings of non-teacher college graduates. Givendifferences in the earnings and work year of teachers and non-teachers, this procedurecreates a systemic bias in the comparison of teacher earnings with that of otherprofessionals, as imputed teacher earnings are systemically overstated.17
In addition, the share of CPS earnings data that are imputed has grown markedly overtime; hence, the bias has worsened. In 1979, imputed earnings data in the CPS were 17percent; by 2000 imputations accounted for 33 percent of the sample, and in 2015 theymade up 41 percent of the sample. The implications for our analysis of the teacher wagegap are significant. In the early years, 1979 through 1993, the teacher wage gap differentialbetween using all the data available (without regard for imputations) and analyzing onlynon-imputed observations was at most a 2 percentage-point difference—meaning that theinclusion of imputed data lessened the teacher wage gap by 2 percentage points or less.But, post 1996 the gap steadily grew, and in 2015 the differential is larger than ever. For allteachers, the teacher pay gap of 17 percent reported in Figure B (estimated withoutimputed data) would be mitigated to a 10 percent gap had imputations been included. Thebias in closing the gap is 6 and 9 percentage points for female and male teachers,respectively.
Imputed data are not available in 1994 and only for the last four months of 1995. Thus, weextrapolate results for these two years by comparing output from using all the dataavailable to output from using non-imputed data only. We do this comparison for the yearsjust prior to and just after 1994 and 1995. Comparing the results gives us a reasonablerough estimate of what may be expected if non-imputed data were available for 1994 and1995.
21
Weekly wageThis analysis of the relative wage of teachers relies on comparisons of weekly earnings,rather than annual or hourly earnings, the approach taken by some authors (e.g.,Hanushek and Rivkin 1997; Greene and Winters 2007). As discussed in our prior work, weelect to use weekly wages to avoid measurement issues regarding differences in annualweeks worked (teachers’ traditional “summers off”) and the number of hours worked perweek that arise in many studies of teacher pay. It is often noted that the annual earnings ofteachers cannot be directly compared with those of non-teachers, given that teachers aretypically only contracted to work a nine-month year. But differences arise over exactly howmuch time teachers devote to their position outside of their nine contracted months ofteaching. Teachers spend some of their summer months in class preparation, professionaldevelopment, or other activities expected of a professional teacher. Teachers who maywish to earn additional income during the summer months can often do so, but areunlikely to be able to earn at the same rate of pay as in their teaching role. Similarly,attempts to compare the hourly pay of teachers and other professionals have resulted inconsiderable controversy by setting off an unproductive debate about the number ofhours teachers work at home versus other professionals.18 Such decisions regarding payinterval (weekly, annual, or hourly) become mostly irrelevant when considering changes inrelative pay over time.
Changes in relative wages can be expected to be similar as long as the relative work time(between teachers and comparable professionals) remains constant. For example, if theratio of weekly hours worked by teachers relative to those worked by comparable workersremains constant over time, then estimates of changes in hourly wages will be the sameas for weekly changes. Similarly, estimated changes in relative annual earnings will parallelthose for weekly earnings as long as the annual weeks and hours worked by teachershave not changed relative to those of comparable workers.
Some researchers (e.g., Podgursky and Tongrut 2006) have contended that the use of theCPS-ORG data downwardly biases teacher earnings. This issue is particularly relevant toCPS data prior to the 1994 CPS redesign (more on this below). In Allegretto, Corcoran, andMishel (2008) we benchmarked the CPS-ORG data to annual data from the March CPS.This extensive benchmarking exercise provided validation that the CPS-ORG data areconsistent with annual March data, which Hanushek and Rivkin (1997, 2004), Temin (2002,2003) and Podgursky and Tongrut (2006) have used in their analyses of teacher wagetrends. As expected, the annual wage gap is just the weekly wage gap multiplied by theratio of teacher and non-teacher annual weeks worked, with the caveat that we have moreconfidence in the post-redesign CPS data. Our benchmarking exercise leaves little doubtthat there has been deterioration in the relative earnings of teachers over time. Moreover,our use of weekly wage comparisons in all of our work on teacher pay allows us to avoidunproductive discussions of work years, summers off, and so on. Allegretto, Corcoran, andMishel (2008) also show in Chapter 2 that the long-term trends in the March CPS,decennial Census, and CPS-ORG data all yield similar findings regarding the relativeerosion of teacher wages.
22
CPS 1994 redesignThe CPS was redesigned in 1994. The change in the CPS survey question on earningsappears to have resulted in a significantly higher weekly wage among teachers, as teacherwages rose 10.2 percent between 1993 and 1994 (the year the redesigned survey was firstused)—far faster than the 2.2 percent increase among non-teacher college graduates. Theadditional 8 percent wage growth among teachers appears to represent the effects of acorrection for the underlying bias in the pre-1994 survey. Consequently, our estimatesincorporate the pre-1994 data in a way that does not allow this bias to be built into ourresults.
A second issue concerns the coding schemes regarding education. Prior to 1992 thesurvey asked for the “highest grade of school attended,” and in 1992 the question waschanged to “highest level of school completed or the highest degree received.” Thus,degrees are not known prior to 1992 even as a best guess crosswalk is used. For moreinformation on CPS coding schemes and the 1994 redesign, see Cohany, Polivka, andRothgeb (1994).
23
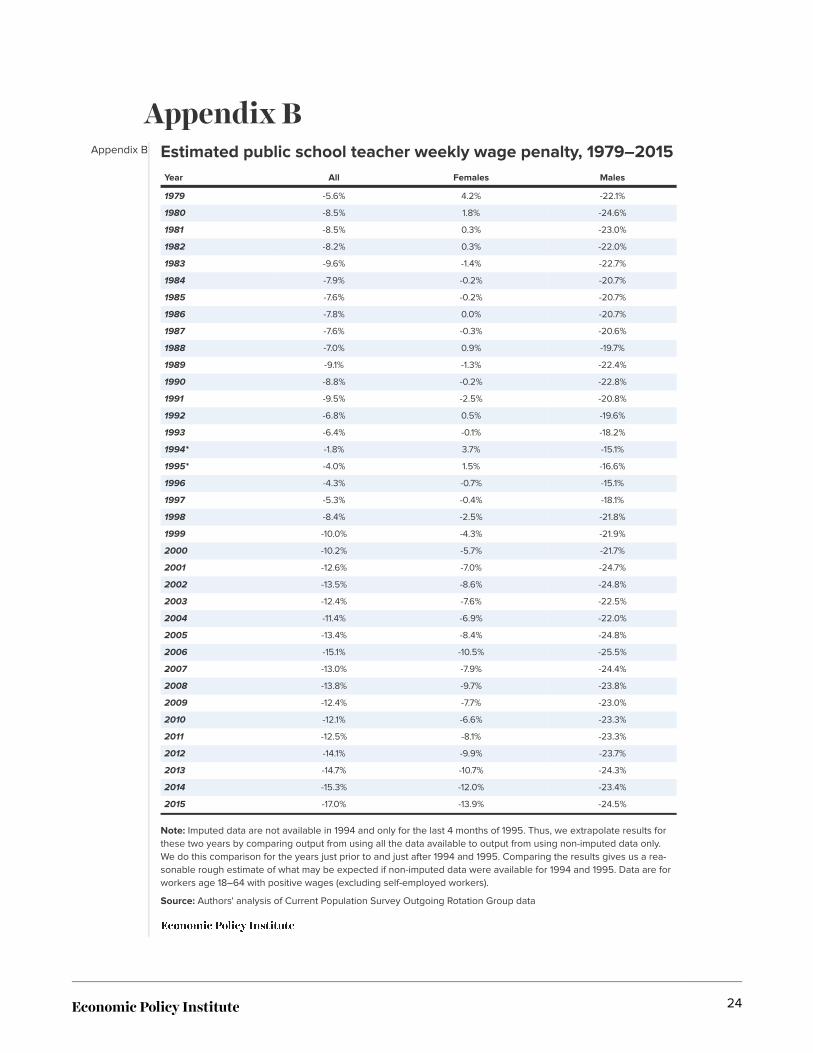
Appendix BAppendix B Estimated public school teacher weekly wage penalty, 1979–2015
Year All Females Males
1979 -5.6% 4.2% -22.1%
1980 -8.5% 1.8% -24.6%
1981 -8.5% 0.3% -23.0%
1982 -8.2% 0.3% -22.0%
1983 -9.6% -1.4% -22.7%
1984 -7.9% -0.2% -20.7%
1985 -7.6% -0.2% -20.7%
1986 -7.8% 0.0% -20.7%
1987 -7.6% -0.3% -20.6%
1988 -7.0% 0.9% -19.7%
1989 -9.1% -1.3% -22.4%
1990 -8.8% -0.2% -22.8%
1991 -9.5% -2.5% -20.8%
1992 -6.8% 0.5% -19.6%
1993 -6.4% -0.1% -18.2%
1994* -1.8% 3.7% -15.1%
1995* -4.0% 1.5% -16.6%
1996 -4.3% -0.7% -15.1%
1997 -5.3% -0.4% -18.1%
1998 -8.4% -2.5% -21.8%
1999 -10.0% -4.3% -21.9%
2000 -10.2% -5.7% -21.7%
2001 -12.6% -7.0% -24.7%
2002 -13.5% -8.6% -24.8%
2003 -12.4% -7.6% -22.5%
2004 -11.4% -6.9% -22.0%
2005 -13.4% -8.4% -24.8%
2006 -15.1% -10.5% -25.5%
2007 -13.0% -7.9% -24.4%
2008 -13.8% -9.7% -23.8%
2009 -12.4% -7.7% -23.0%
2010 -12.1% -6.6% -23.3%
2011 -12.5% -8.1% -23.3%
2012 -14.1% -9.9% -23.7%
2013 -14.7% -10.7% -24.3%
2014 -15.3% -12.0% -23.4%
2015 -17.0% -13.9% -24.5%
Note: Imputed data are not available in 1994 and only for the last 4 months of 1995. Thus, we extrapolate results forthese two years by comparing output from using all the data available to output from using non-imputed data only.We do this comparison for the years just prior to and just after 1994 and 1995. Comparing the results gives us a rea-sonable rough estimate of what may be expected if non-imputed data were available for 1994 and 1995. Data are forworkers age 18–64 with positive wages (excluding self-employed workers).
Source: Authors' analysis of Current Population Survey Outgoing Rotation Group data
24
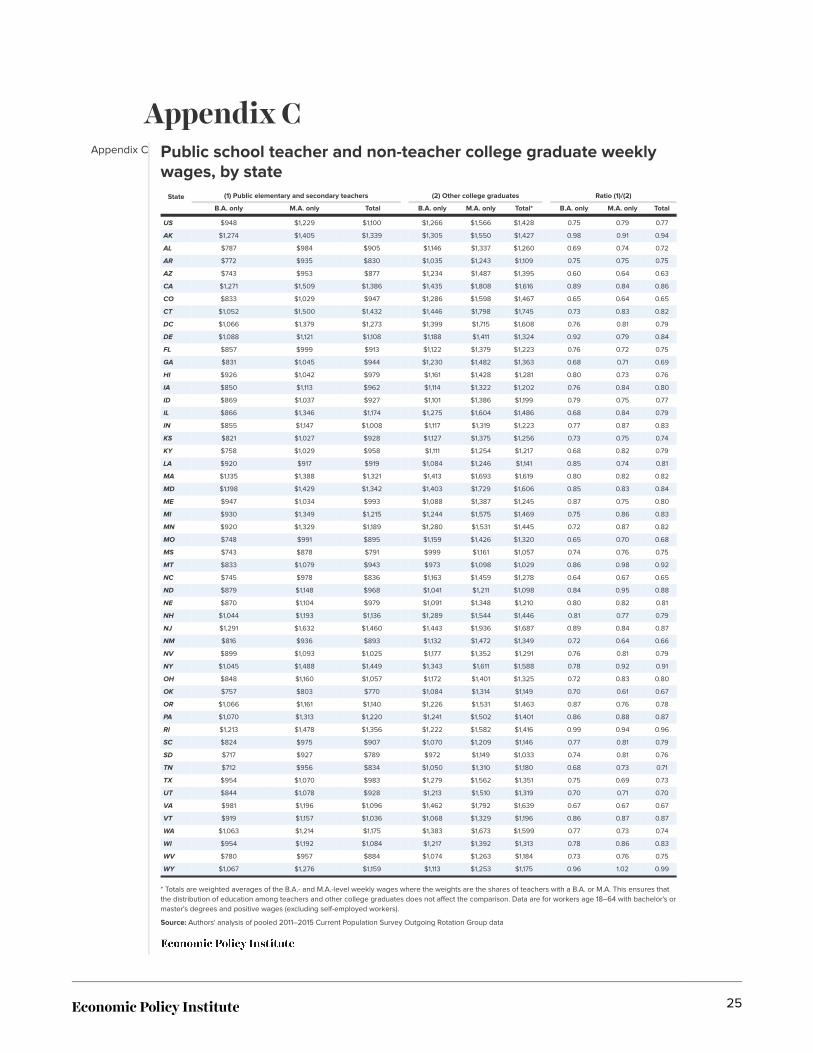
Appendix CAppendix C Public school teacher and non-teacher college graduate weekly
wages, by stateState (1) Public elementary and secondary teachers (2) Other college graduates Ratio (1)/(2)
B.A. only M.A. only Total B.A. only M.A. only Total* B.A. only M.A. only Total
US $948 $1,229 $1,100 $1,266 $1,566 $1,428 0.75 0.79 0.77
AK $1,274 $1,405 $1,339 $1,305 $1,550 $1,427 0.98 0.91 0.94
AL $787 $984 $905 $1,146 $1,337 $1,260 0.69 0.74 0.72
AR $772 $935 $830 $1,035 $1,243 $1,109 0.75 0.75 0.75
AZ $743 $953 $877 $1,234 $1,487 $1,395 0.60 0.64 0.63
CA $1,271 $1,509 $1,386 $1,435 $1,808 $1,616 0.89 0.84 0.86
CO $833 $1,029 $947 $1,286 $1,598 $1,467 0.65 0.64 0.65
CT $1,052 $1,500 $1,432 $1,446 $1,798 $1,745 0.73 0.83 0.82
DC $1,066 $1,379 $1,273 $1,399 $1,715 $1,608 0.76 0.81 0.79
DE $1,088 $1,121 $1,108 $1,188 $1,411 $1,324 0.92 0.79 0.84
FL $857 $999 $913 $1,122 $1,379 $1,223 0.76 0.72 0.75
GA $831 $1,045 $944 $1,230 $1,482 $1,363 0.68 0.71 0.69
HI $926 $1,042 $979 $1,161 $1,428 $1,281 0.80 0.73 0.76
IA $850 $1,113 $962 $1,114 $1,322 $1,202 0.76 0.84 0.80
ID $869 $1,037 $927 $1,101 $1,386 $1,199 0.79 0.75 0.77
IL $866 $1,346 $1,174 $1,275 $1,604 $1,486 0.68 0.84 0.79
IN $855 $1,147 $1,008 $1,117 $1,319 $1,223 0.77 0.87 0.83
KS $821 $1,027 $928 $1,127 $1,375 $1,256 0.73 0.75 0.74
KY $758 $1,029 $958 $1,111 $1,254 $1,217 0.68 0.82 0.79
LA $920 $917 $919 $1,084 $1,246 $1,141 0.85 0.74 0.81
MA $1,135 $1,388 $1,321 $1,413 $1,693 $1,619 0.80 0.82 0.82
MD $1,198 $1,429 $1,342 $1,403 $1,729 $1,606 0.85 0.83 0.84
ME $947 $1,034 $993 $1,088 $1,387 $1,245 0.87 0.75 0.80
MI $930 $1,349 $1,215 $1,244 $1,575 $1,469 0.75 0.86 0.83
MN $920 $1,329 $1,189 $1,280 $1,531 $1,445 0.72 0.87 0.82
MO $748 $991 $895 $1,159 $1,426 $1,320 0.65 0.70 0.68
MS $743 $878 $791 $999 $1,161 $1,057 0.74 0.76 0.75
MT $833 $1,079 $943 $973 $1,098 $1,029 0.86 0.98 0.92
NC $745 $978 $836 $1,163 $1,459 $1,278 0.64 0.67 0.65
ND $879 $1,148 $968 $1,041 $1,211 $1,098 0.84 0.95 0.88
NE $870 $1,104 $979 $1,091 $1,348 $1,210 0.80 0.82 0.81
NH $1,044 $1,193 $1,136 $1,289 $1,544 $1,446 0.81 0.77 0.79
NJ $1,291 $1,632 $1,460 $1,443 $1,936 $1,687 0.89 0.84 0.87
NM $816 $936 $893 $1,132 $1,472 $1,349 0.72 0.64 0.66
NV $899 $1,093 $1,025 $1,177 $1,352 $1,291 0.76 0.81 0.79
NY $1,045 $1,488 $1,449 $1,343 $1,611 $1,588 0.78 0.92 0.91
OH $848 $1,160 $1,057 $1,172 $1,401 $1,325 0.72 0.83 0.80
OK $757 $803 $770 $1,084 $1,314 $1,149 0.70 0.61 0.67
OR $1,066 $1,161 $1,140 $1,226 $1,531 $1,463 0.87 0.76 0.78
PA $1,070 $1,313 $1,220 $1,241 $1,502 $1,401 0.86 0.88 0.87
RI $1,213 $1,478 $1,356 $1,222 $1,582 $1,416 0.99 0.94 0.96
SC $824 $975 $907 $1,070 $1,209 $1,146 0.77 0.81 0.79
SD $717 $927 $789 $972 $1,149 $1,033 0.74 0.81 0.76
TN $712 $956 $834 $1,050 $1,310 $1,180 0.68 0.73 0.71
TX $954 $1,070 $983 $1,279 $1,562 $1,351 0.75 0.69 0.73
UT $844 $1,078 $928 $1,213 $1,510 $1,319 0.70 0.71 0.70
VA $981 $1,196 $1,096 $1,462 $1,792 $1,639 0.67 0.67 0.67
VT $919 $1,157 $1,036 $1,068 $1,329 $1,196 0.86 0.87 0.87
WA $1,063 $1,214 $1,175 $1,383 $1,673 $1,599 0.77 0.73 0.74
WI $954 $1,192 $1,084 $1,217 $1,392 $1,313 0.78 0.86 0.83
WV $780 $957 $884 $1,074 $1,263 $1,184 0.73 0.76 0.75
WY $1,067 $1,276 $1,159 $1,113 $1,253 $1,175 0.96 1.02 0.99
* Totals are weighted averages of the B.A.- and M.A.-level weekly wages where the weights are the shares of teachers with a B.A. or M.A. This ensures thatthe distribution of education among teachers and other college graduates does not affect the comparison. Data are for workers age 18–64 with bachelor's ormaster's degrees and positive wages (excluding self-employed workers).
Source: Authors' analysis of pooled 2011–2015 Current Population Survey Outgoing Rotation Group data
25
Endnotes1. We hear often that a strong teacher is the single biggest within-school factor influencing learning
and student achievement, and both research and common sense affirm this. It is important to keepin mind, however, that teachers operate within a complex ecosystem of fellow teachers, schoolleadership, curriculum, standards, and a range of resources, including parent and communityengagement, all of which have major impacts on teacher effectiveness. Indeed, as Anthony Brykand his colleagues found in their research on school reforms in Chicago, schoolimprovement—and thus increased achievement—is akin to baking a cake, with five essentialingredients that constantly interact (Bryk et al. 2010). So while it’s critically important to designpolicies to strengthen the teacher corps, that effort must be complemented by larger work toimprove school ecosystems as a whole.
2. The official Teacher Shortage Area list, which tracks open teacher positions across the UnitedStates, and by state since 1991, is available at http://www2.ed.gov/about/offices/list/ope/pol/tsa.html#list. In short, compared with the early 1990s, the list is growing (Strauss 2015). For manyschools the start of the school year has the added stress and pressure to fill vacant teacherpositions. At the last minute, many vacancies are filled with less-qualified teachers oradministrators.
3. NEA survey found that 75 percent of teachers are satisfied with their jobs (Walker 2014). Despitethe high level of overall satisfaction, nearly half (45 percent) of surveyed member teachers haveconsidered quitting because of standardized testing. For insights into the trends in teachersatisfaction, see Richmond (2013), which presents data from the MetLife Survey of the AmericanTeacher, conducted by Harris Interactive, which has been published annually since 1984 through2012.
4. Gould (2015) estimates that due to the Great Recession and the ensuing austerity at all levels ofgovernment, public education jobs are still 236,000 fewer than they were seven years ago. Thenumber of teachers rose by 41,700 over the last year. While this is clearly a positive sign, adding inthe number of public education jobs that should have been created just to keep up withenrollment, we are currently experiencing a 410,000 job shortfall in public education.
5. See Darling-Hammond et al. (2016)
6. See Allegretto, Corcoran, and Mishel (2011).
7. To find out more about public versus private school teachers, see an in-depth paper by Allegrettoand Tojerow (2014).
8. In Allegretto, Corcoran, and Mishel (2008), we compared the relative hourly pay of teachers usingCPS data on hourly wages and found no qualitative differences in our results.
9. In Appendix A in Allegretto, Corcoran, and Mishel (2008), we benchmarked CPS-ORG weeklywages to annual wages in the March CPS and found the two measures to be consistent.
10. Recall that the dotted lines are guesstimates, and CPS underwent a major redesign in 1994.
11. Additionally, the smaller sample size of male teachers makes it hard to break out the samplefurther by age groups and get precise estimates; however, the general pattern matches that ofoverall teachers (although the negative pay gaps are more negative for male teachers, asdepicted in Figure A).
26
12. State totals are weighted averages of the B.A.- and M.A.-level weekly wages where the weightsare the shares of teachers with a B.A. or M.A. This ensures that the distribution of educationamong teachers and other college graduates does not affect the comparison.
13. The ECEC provides compensation data for primary and secondary school teachers and for abroader category of “teachers.” We analyze the narrower category, which matches closely ourdefinition of teachers in our ORG data, except that the ECEC includes private school and specialeducation teachers.
14. As reviewed in Allegretto, Corcoran, Mishel (2008), there are discontinuities in the occupationalcodes in the ECEC series for both teachers and professionals. The data for teachers in 1994–2003is for all teachers, not just primary and secondary school teachers, and the definition ofprofessionals differs from the data starting in 2004. We use the changes in 1994–2003 and addthem to the 2004–2015 period to obtain the long-term change in the benefits advantage. Thisimplicitly assumes no change over 2003–2004. That is, the benefit bias grew by 0.1 percentagepoints from 1994 to 2003 for teachers overall (K–12, university, and others). We assume that wasthe change among primary and secondary school teachers and therefore subtract 0.1 percent fromthe benefit advantage in 2004 to obtain our estimate of the 1994 benefits advantage.
15. As measured from 1999 to 2015 to reflect the 2000 Census data measuring 1999 wages.
16. To find out more about public versus private teachers, see Allegretto and Tojerow (2014).
17. For more on imputations see Allegretto, Corcoran, and Mishel (2008, 10).
18. In Allegretto, Corcoran, and Mishel (2008) we compared the relative hourly pay of teachers usingCPS data on hourly wages and found no qualitative differences in our results.
ReferencesAllegretto, Sylvia A., and Ilan Tojerow. 2014. “Teacher Staffing and Pay Differences: Public and PrivateSchools.” Monthly Labor Review, September.
Allegretto, Sylvia A., Sean P. Corcoran, and Lawrence Mishel. 2004. How Does Teacher PayCompare? Methodological Challenges and Answers. Washington, D.C.: Economic Policy Institute.
Allegretto, Sylvia A., Sean P. Corcoran, and Lawrence Mishel. 2008. The Teaching Penalty: TeacherPay Losing Ground. Washington, D.C.: Economic Policy Institute.
Allegretto, Sylvia A., Sean P. Corcoran, and Lawrence Mishel. 2011. The Teaching Penalty: An UpdateThrough 2010. Economic Policy Institute, Issue Brief No. 298.
Bryk, Anthony S., Penny Bender Sebring, Elaine Allensworth, Stuart Luppescu, and John Q. Easton.2010. Organizing Schools for Improvement: Lessons from Chicago. Chicago: University of ChicagoPress.
Bureau of Labor Statistics. 1994–2015. Employer Costs for Employee Compensation data.Washington D.C.: U.S. Department of Labor.
Cohany, Sharon R., Anne E. Polivka, and Jennifer M. Rothgeb. 1994. “Revisions in the CurrentPopulation Survey.” Employment and Earnings, February.
27
Corcoran, Sean P., William N. Evans, and Robert M. Schwab. 2004. “Women, the Labor Market, andthe Declining Relative Quality of Teachers.” Journal of Policy Analysis and Management, vol. 23,449–470.
Current Population Survey basic monthly microdata. 1979–2015. Survey conducted by the Bureau ofthe Census for the Bureau of Labor Statistics [machine-readable microdata file]. Washington, D.C.:U.S. Census Bureau.
Darling-Hammond, Linda, Roberta Furger, Patrick M. Shields, and Leib Sutcher. 2016. AddressingCalifornia’s Emerging Teacher Shortage: An Analysis of Sources and Solutions. Learning PolicyInstitute.
Gould, Elise. 2015. “Disappointing Jobs Numbers and Not Enough Teachers.” Working Economics(Economic Policy Institute blog), October 2.
Greene, Jay P., and Marcus A. Winters. 2007. How Much Are Public School Teachers Paid? NewYork: Manhattan Institute.
Hanushek, Eric A., and Steven G. Rivkin. 1997. “Understanding the Twentieth-Century Growth in U.S.School Spending.” Journal of Human Resources, vol. 32, 35–68.
Hanushek, Eric A., and Steven G. Rivkin. 2004. “How to Improve the Supply of High-QualityTeachers,” in Brookings Papers on Education Policy, ed. D. Ravitch. Washington, D.C.: BrookingsInstitution Press.
Ingersoll, Richard, Lisa Merrill, and Daniel Stuckey. 2014. Seven Trends: The Transformation of theTeaching Force. Consortium for Policy Research in Education Research, Report #RR-80.
Podgursky, M., and R. Tongrut. 2006. “(Mis-)measuring the Relative Pay of Public School Teachers.”Education Finance and Policy, vol. 1, no. 4, 425–440.
Richmond, Emily. 2013. “Teacher Job Satisfaction Hits 25-Year Low.” The Atlantic, February 21.
Roza, Marguerite. 2007. Frozen Assets: Rethinking Teacher Contracts Could Free Billions for SchoolReform. Washington, D.C.: Education Sector.
Strauss, Valerie. 2015. “The Real Reasons Behind the U.S. Teacher Shortage.” Washington Post,August 24.
Temin, Peter. 2002. “Teacher Quality and the Future of America.” Eastern Economic Journal, vol. 28,no. 3, 285–300.
Temin, Peter. 2003. “Low Pay, Low Quality.” Education Next, vol. 3, 8–13.
Tucker, Marc. 2007. Tough Choices or Tough Times. Hoboken, N.J.: Jossey-Bass.
Walker, Tim. 2014. “NEA Survey: Nearly Half of Teachers Consider Leaving Profession Due toStandardized Testing.” NEA Today, November 2.
28