Embed Size (px)
Citation preview
Polymer International 44 (1997) 262È276
The Torsion Pendulum: a TechniqueTBAfor Characterizing the Cure and
Properties of Thermosetting Systems¤
John K. Gillham
Department of Chemical Engineering, Princeton University, Princeton, NJ 08544, USA
(Received 28 January 1997, revised version received 4 July 1997 ; accepted 4 July 1997)
Abstract : Generalizations on the cure and properties of thermosetting polymers,which have stemmed from the development and application of the torsionalbraid analysis (TBA) technique, have been formulated in terms of cureÈpropertyrelationships. They are the isothermal timeÈtemperatureÈtransformation (TTT)cure diagram, the continuous heating timeÈtemperatureÈtransformation (CHT)cure diagram, the conversionÈtemperatureÈproperty diagram, and the(TgTP)glass transition temperature versus conversion relationship. The relationships(Tg)may be used to design timeÈtemperature cure paths, that exploit gelation andvitriÐcation, to optimize cure processes and glassy state properties. Glassy stateproperties studied have included modulus, density and microcracking versus con-version, and the dynamics of submolecular motions as represented by physicalageing and transitions. Rubber modiÐcation and water absorption have alsobeen investigated. This review emphasizes results obtained by exploiting theability of the TBA technique to examine amorphous specimens in which materialchanges from liquid (or rubber) to glass, and vice versa.
Polym. Int. 44, 262È276 (1997)No. of Figures : 19. No. of Tables : 0. No. of References : 53
Key words : dynamic mechanical analysis, torsional braid analysis (TBA),thermosetting systems, gelation, vitriÐcation, transitions, timeÈtemperatureÈtransformation cure diagrams, temperatureÈconversionÈproperty diagram, Tgversus conversion, chemical ageing, physical ageing, thermal degradation, ther-mohysteresis, microcracking, water absorption, phase separation, rubber modiÐ-cation, design of thermosetting cure cycles, design of thermoset properties,molecular structureÈmacroscopic property relationships.
SYMBOLS AND DEFINITIONS
Gelation Molecular gelation occurs at a calcula-ble conversion according to FloryÏstheory of gelation. The glass transitiontemperature of the material at
Macroscopic gelationgelation4 gelTg .is a macroscopic consequence ofmolecular gelation and can be mea-
¤Dedicated to Professor Bob Stepto on the occasion of his60th birthday.
sured by the attainment of a Ðxed highviscosity, the development of rubberelasticity, etc. The conversion atmacroscopic gelation does not neces-sarily equal that at molecular gelation.
VitriÐcation VitriÐcation (solidiÐcation) on isother-mal cure is deÐned to occur when Tg \T
Tg Glass transition (relaxation) temperat-ure \ a measure of conversion
Tg0\ resinTg Initial glass transition temperature
gelTg Glass transition temperature of the
2621997 SCI. Polymer International 0959-8103/97/$17.50 Printed in Great Britain(
T BA torsion pendulum 263
material at the conversion correspond-ing to molecular gelation5
Tg= Maximum glass transition temperaturedue to cure
Tb Principal transition (relaxation) belowTgTb0 Initial value of Tb
gelTb Value of at gelationTbTb= Final value of TbTc Transition (relaxation) below TbTll LiquidÈliquid transition (relaxation)temperature above Tg 19
Tcyclohexyl Transition (relaxation) below due toTgrestricted motion of cyclohexyl group
TH2O Glassy-state transition (relaxation) dueto absorbed water
RubberTg Glass transition temperature of therubbery phase
eTg Isothermal conversion correspond-(Tg)ing to the end of the vitriÐcationprocess
Tcrack Temperature on cooling of onset ofmicrocracking
Theal Temperature on heating of completehealing of microcracking
Ts Temperature at which the time togelation\ time to onset of visualphase separation21
k1, k2 , k3 Rate constantsx Fractional conversionTTT TimeÈtemperatureÈtransformation iso-
thermal cure diagramCHT Continuous heating timeÈtemperatureÈ
transformation cure diagramTgTP ConversionÈtemperatureÈproperty
diagramTBA Torsional braid analysisf 2 f\ frequency of oscillation of a
damped wave ; f 24 relative rigidityp Period of oscillation in a damped wave
(seconds) ; p \ 1/fG@ Elastic shear modulusGA Loss shear modulus* Logarithmic decrement Bn tan d (see
text for *\ (1/n)ln(Ai/A
i`n))
d Phase angle between stress and strain*Cp= Di†erence between heat capacity of the
liquid or rubbery state and the glassystate at for the fully cured state.Tg*Cp0 Di†erence between heat capacity of theliquid or rubbery state and the glassystate at for the uncured stateTg
Ageing rate d[log modulus]/d[log t]Ageing rate [d[log *]/d[log t]Sol glass Glassy material consisting of Ðnite
molecular weight moleculesSol-gel glass Glassy material consisting of Ðnite and
inÐnite molecular weight molecules.
Sol-gel rubber Rubbery material consisting of Ðniteand inÐnite molecular weight mol-ecules.
Gel glass Glassy material consisting of inÐnitemolecular weight molecules
Gel rubber Rubbery material consisting of inÐnitemolecular weight molecules
Char Glassy material formed by thermaldegradation of polymer
INTRODUCTION
Torsional braid analysis (TBA)
The freely oscillating torsion pendulum, which is a con-venient, simple and sensitive dynamic mechanical tech-nique for characterizing solid polymers, is used in thequantitative mode to provide elastic and loss shearmoduli data for specimens versus temperature or time.The sensitivity is a consequence of the freely oscillatingtorsion pendulum being a resonance technique(measurements are made at the resonant frequency ofthe pendulum). For example, the technique is able toresolve minor transitions versus temperature, and tofollow small changes in moduli versus time, as duringphysical ageing.
The scope of the torsion pendulum is extended in thetorsional braid analysis (TBA) mode (Figs 1 and2)1,2,11,14,18,19,46 to overcome experimental limitationsimposed by load-limiting transitions, as in Ñuid orrubbery systems that change to glasses and vice versa,by using a composite specimen made simply by impreg-nating a heat-cleaned glass-Ðbre braid substrate withÑuid (e.g. a liquid epoxy/amine formation,33,34 as inFig. 3, or a solution in tetrahydrofuran of a cyclo-hexylmethyl ester of a polyamic acid,44 as in Fig. 4). Abraid is used because it has no torsional bias (clockwiseor anticlockwise). After mounting, specimens are verti-cally self-aligning under gravity. The anisotropy of thespecimen is responsible for the torsional rigidity beingdominated by the organic matrix, rather than by theÐlaments of the glass braid substrate.
A schematic diagram of the commercially availableautomated torsion pendulumÈTBA instrument is shownin Fig. 1. Temperature is controlled isothermally towithin ^0É05¡C from 25 to 400¡C, and may be ramped(heated or cooled) at rates of 0É1¡C/h to 5¡C/minbetween [180 and 400¡C (the quality of mechanicaldata depends largely on control of temperature).
An experiment consists of a series of intermittentlyinduced freely damped waves. The frequency anddamping of the oscillations change with temperatureand/or time as a result of physical or chemical changesin the specimen. An analogue electrical signal of themechanical oscillations is obtained using a friction-freeoptical transducer whereby a light beam passes througha pair of polarizers, one of which oscillates with the
POLYMER INTERNATIONAL VOL. 44, NO. 3, 1997
264 J. K. Gillham
Fig. 1. Schematic diagram of the automated torsionpendulumÈTBA instrument.46 (Reproduced with permissionfrom J. K. Gillham and J. B. Enns, T rends Polym. Sci., 2(1994) 406È419, Elsevier Science and Plastics Analysis(,
Instruments, Inc., Princeton, NJ (.)
specimen, to a photosensor.3 The analogue signal (Fig.2) is processed by a digital personal computer9,18 torepeatedly align the polarizers for linear responsethrough feed-back circuitry,7,8 initiate oscillations,1,7,8analyze the damped waves and provide the dynamicmechanical spectra9,10,18 (e.g., Figs 5, 6, 7, 14, 15, 17and 19). The elastic shear modulus G@ and the loss shearmodulus GA of a specimen are respectively related to thefrequency f and logarithmic decrement * of the oscil-lations by :
G@B Kf 2and
GA B K*/n
where K is a constant (for constant geometry) and
*\ (1/n)ln(Ai/A
i`n)
with and the amplitude of the ith and (i ] n)thAi
Ai`n
oscillations in a damped wave, respectively.4,18,19 Forsimplicity, the relative rigidity (4f 2) is used as a relativeelastic modulus in TBA experiments. The elastic shearmodulus is often referred to as the modulus ; the lossshear modulus, the logarithmic decrement, and tan
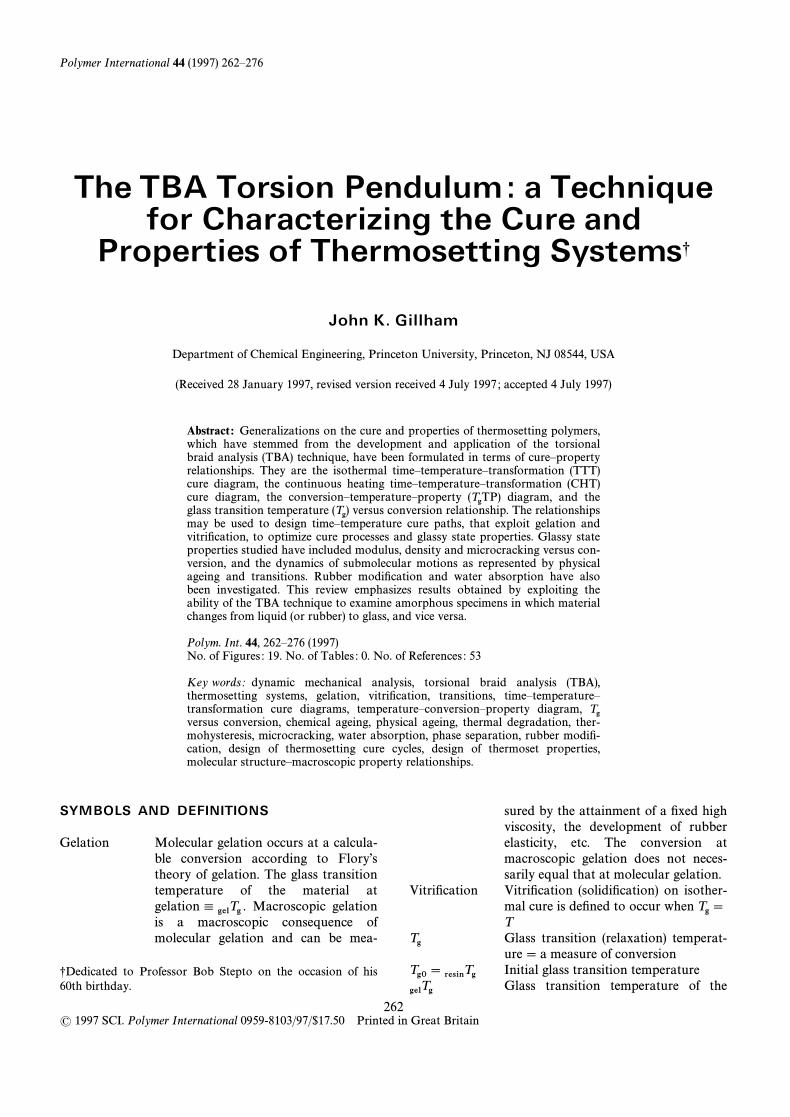
Fig. 2. Automated torsion pendulum control sequence (fromRef. 7). Output (Volts, V) versus time. Key : I, previous wavedecays, o†set from centre of linear region (at 0 V) of pair ofpolarizers detected and correction by rotation of one polarizerdisc begins ; II, reference level of polarizer pair reached (at0 V) ; III, wave initiating sequence begins by stretching aspring to a predetermined strain ; IV, decay of transients at theÐxed strain ; V, free oscillations begin about the centre of thelinear region after step-release of tension in the spring ; VI,data collected (and analysed) ; and VII, sequence repeated.(Reproduced with permission from C. L. M. Bell, J. K.Gillham and J. A. Benci, Am. Chem. Soc. Div. Polym. Chem.,
Prepr. 15 (1974) 542È548, American Chemical Society (.)
d(\GA/G@) where d is the phase angle between strainand stress, are often referred to as the mechanical loss.
In practice, the measured frequency of a specimenchanges from about 0É1 to 3 Hz during the transform-ation from liquid to glass (the glass transition tem-perature usually occurs at about 0É7 Hz in our TBATgexperiments). Transitions are assigned from maxima inthe mechanical loss data versus either time (e.g. Fig. 5)or temperature (e.g. Figs 6, 7, 15, 17 and 19) and thecorresponding frequencies. These assignments corre-spond approximately to halfway through the transitionsas seen in the modulus.
A series of reviews has been published on the devel-opment of the TBA torsion pendulum and its applica-tion to the cure and properties of thermosettingsystems.4,11,14,18,19,46 The initial versions of the appar-atus used a stop-watch to obtain the period (p) of theoscillations of an inertial bar which was attached hori-zontally to the lower end of the vertical specimen1(note : relative rigidity 4f 2\ 1/p2). The mechanicaldamping was obtained by counting visually the number(n) of discernable oscillations per wave2 (note :19*B 1/n for constant Good quality data wereA
i/A
i`n).
obtained, but tediously.2 The next stage was the devel-opment of an optical transducer to convert the mecha-nical waves to analogue electrical waves for recordingon a time-based strip-chart recorder.3 Data reductioninvolved measuring p and n from the traces. Automa-tion was accomplished initially by development of ananalogue computer7,8,14 and subsequently by use ofdigital computers.9,18 [Early data obtained using ananologue computer are reproduced here : a hollow
POLYMER INTERNATIONAL VOL. 44, NO. 3, 1997
T BA torsion pendulum 265
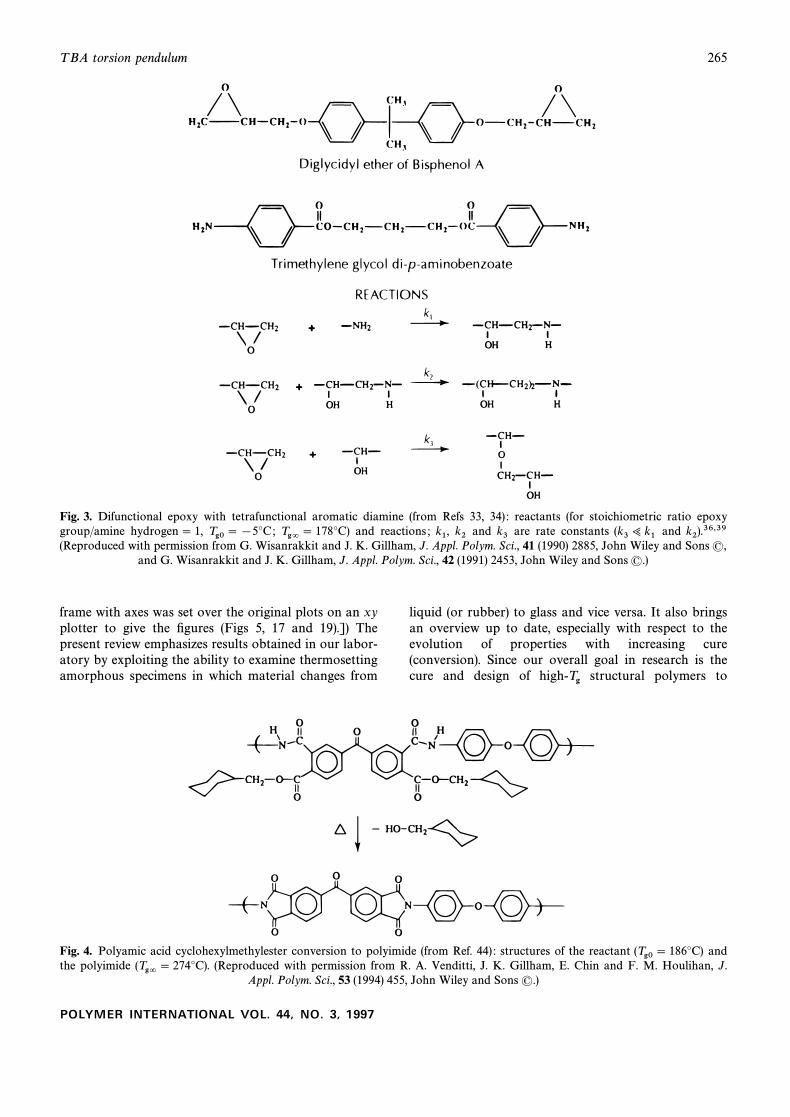
Fig. 3. Difunctional epoxy with tetrafunctional aromatic diamine (from Refs 33, 34) : reactants (for stoichiometric ratio epoxygroup/amine hydrogen \ 1, and reactions ; and are rate constants andTg0 \ [5¡C; Tg= \ 178¡C) k1, k2 k3 (k3> k1 k2).36,39(Reproduced with permission from G. Wisanrakkit and J. K. Gillham, J. Appl. Polym. Sci., 41 (1990) 2885, John Wiley and Sons (,
and G. Wisanrakkit and J. K. Gillham, J. Appl. Polym. Sci., 42 (1991) 2453, John Wiley and Sons (.)
frame with axes was set over the original plots on an xyplotter to give the Ðgures (Figs 5, 17 and 19).]) Thepresent review emphasizes results obtained in our labor-atory by exploiting the ability to examine thermosettingamorphous specimens in which material changes from
liquid (or rubber) to glass and vice versa. It also bringsan overview up to date, especially with respect to theevolution of properties with increasing cure(conversion). Since our overall goal in research is thecure and design of structural polymers tohigh-Tg
Fig. 4. Polyamic acid cyclohexylmethylester conversion to polyimide (from Ref. 44) : structures of the reactant and(Tg0 \ 186¡C)the polyimide (Reproduced with permission from R. A. Venditti, J. K. Gillham, E. Chin and F. M. Houlihan, J.(Tg= \ 274¡C).
Appl. Polym. Sci., 53 (1994) 455, John Wiley and Sons (.)
POLYMER INTERNATIONAL VOL. 44, NO. 3, 1997
266 J. K. Gillham
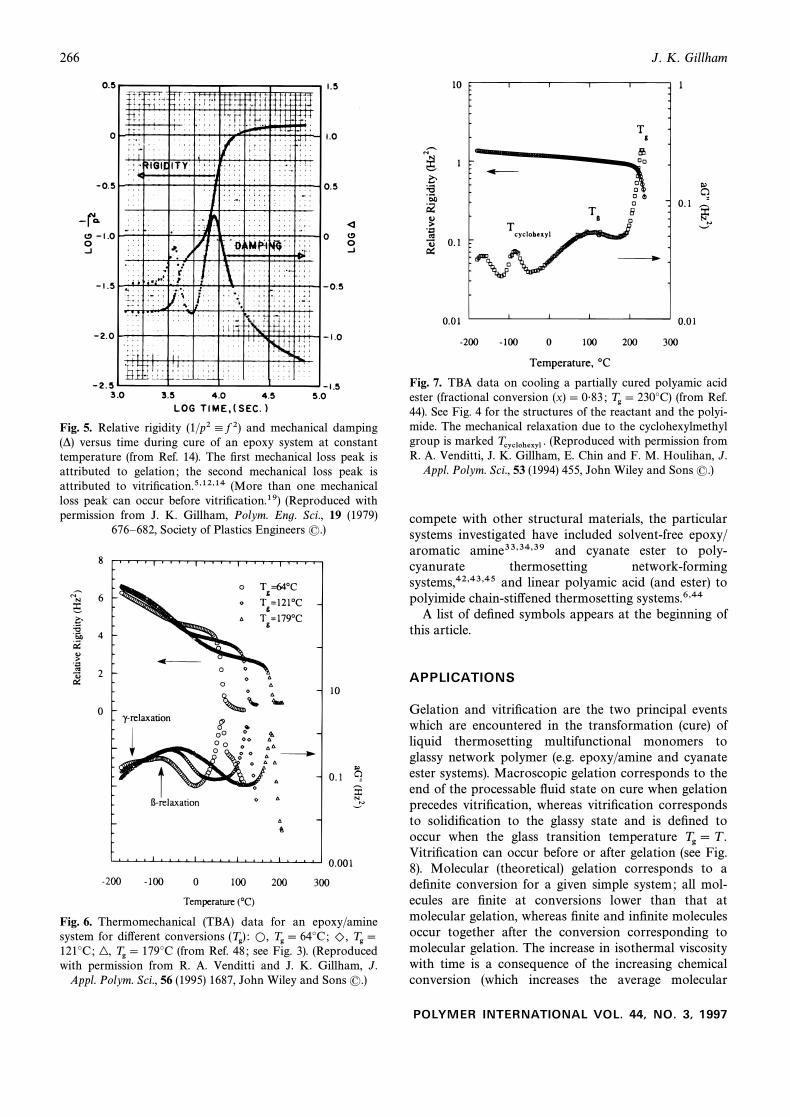
Fig. 5. Relative rigidity (1/p24 f 2) and mechanical damping(*) versus time during cure of an epoxy system at constanttemperature (from Ref. 14). The Ðrst mechanical loss peak isattributed to gelation ; the second mechanical loss peak isattributed to vitriÐcation.5,12,14 (More than one mechanicalloss peak can occur before vitriÐcation.19) (Reproduced withpermission from J. K. Gillham, Polym. Eng. Sci., 19 (1979)
676È682, Society of Plastics Engineers (.)
Fig. 6. Thermomechanical (TBA) data for an epoxy/aminesystem for di†erent conversions (Tg) : L, Tg \ 64¡C; ), Tg \121¡C; (from Ref. 48 ; see Fig. 3). (Reproduced|, Tg \ 179¡Cwith permission from R. A. Venditti and J. K. Gillham, J.
Appl. Polym. Sci., 56 (1995) 1687, John Wiley and Sons (.)
Fig. 7. TBA data on cooling a partially cured polyamic acidester (fractional conversion (x) \ 0É83 ; (from Ref.Tg \ 230¡C)44). See Fig. 4 for the structures of the reactant and the polyi-mide. The mechanical relaxation due to the cyclohexylmethylgroup is marked (Reproduced with permission fromTcyclohexyl .R. A. Venditti, J. K. Gillham, E. Chin and F. M. Houlihan, J.
Appl. Polym. Sci., 53 (1994) 455, John Wiley and Sons (.)
compete with other structural materials, the particularsystems investigated have included solvent-free epoxy/aromatic amine33,34,39 and cyanate ester to poly-cyanurate thermosetting network-formingsystems,42,43,45 and linear polyamic acid (and ester) topolyimide chain-sti†ened thermosetting systems.6,44
A list of deÐned symbols appears at the beginning ofthis article.
APPLICATIONS
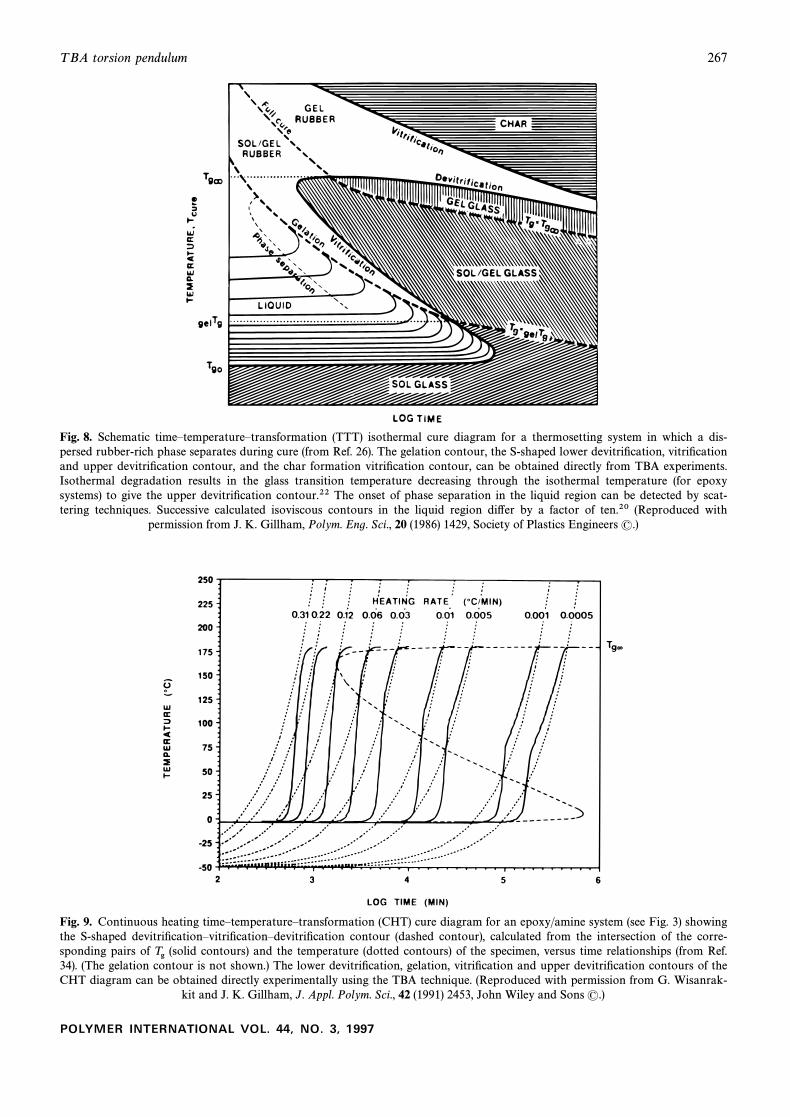
Gelation and vitriÐcation are the two principal eventswhich are encountered in the transformation (cure) ofliquid thermosetting multifunctional monomers toglassy network polymer (e.g. epoxy/amine and cyanateester systems). Macroscopic gelation corresponds to theend of the processable Ñuid state on cure when gelationprecedes vitriÐcation, whereas vitriÐcation correspondsto solidiÐcation to the glassy state and is deÐned tooccur when the glass transition temperature Tg \T .VitriÐcation can occur before or after gelation (see Fig.8). Molecular (theoretical) gelation corresponds to adeÐnite conversion for a given simple system; all mol-ecules are Ðnite at conversions lower than that atmolecular gelation, whereas Ðnite and inÐnite moleculesoccur together after the conversion corresponding tomolecular gelation. The increase in isothermal viscositywith time is a consequence of the increasing chemicalconversion (which increases the average molecular
POLYMER INTERNATIONAL VOL. 44, NO. 3, 1997
T BA torsion pendulum 267
Fig. 8. Schematic timeÈtemperatureÈtransformation (TTT) isothermal cure diagram for a thermosetting system in which a dis-persed rubber-rich phase separates during cure (from Ref. 26). The gelation contour, the S-shaped lower devitriÐcation, vitriÐcationand upper devitriÐcation contour, and the char formation vitriÐcation contour, can be obtained directly from TBA experiments.Isothermal degradation results in the glass transition temperature decreasing through the isothermal temperature (for epoxysystems) to give the upper devitriÐcation contour.22 The onset of phase separation in the liquid region can be detected by scat-tering techniques. Successive calculated isoviscous contours in the liquid region di†er by a factor of ten.20 (Reproduced with
permission from J. K. Gillham, Polym. Eng. Sci., 20 (1986) 1429, Society of Plastics Engineers (.)
Fig. 9. Continuous heating timeÈtemperatureÈtransformation (CHT) cure diagram for an epoxy/amine system (see Fig. 3) showingthe S-shaped devitriÐcationÈvitriÐcationÈdevitriÐcation contour (dashed contour), calculated from the intersection of the corre-sponding pairs of (solid contours) and the temperature (dotted contours) of the specimen, versus time relationships (from Ref.Tg34). (The gelation contour is not shown.) The lower devitriÐcation, gelation, vitriÐcation and upper devitriÐcation contours of theCHT diagram can be obtained directly experimentally using the TBA technique. (Reproduced with permission from G. Wisanrak-
kit and J. K. Gillham, J. Appl. Polym. Sci., 42 (1991) 2453, John Wiley and Sons (.)
POLYMER INTERNATIONAL VOL. 44, NO. 3, 1997
268 J. K. Gillham
weight)14 and the inÑuence of the glass transition tem-perature as it rises to the temperature of reaction.20 Theconversion from unreacted Ñuid monomers to fullyreacted network glass involves the glass transition tem-perature increasing from its initial value to its(Tg0)maximum value (Tg=).
The ability to obtain data during the transformationof thermosetting reactive liquids to glasses provides adirect basis for measuring the time to macroscopicgelation and the time to vitriÐcation during isothermalcure from the corresponding maxima in the TBAmechanical loss data5,12,14 (Fig. 5). Experiments at dif-ferent isothermal temperatures (T ) on di†erent speci-mens having the same initial chemical composition leaddirectly to the kinetic timeÈtemperatureÈtransformation(TTT) isothermal cure diagram (Fig. 8), the two prin-cipal contours in which are the time to gelation and thetime to vitriÐcation. Temperature scans at di†erentrates on di†erent initially unreacted frozen specimenssimilarly provide, at various heating rates, the tem-peratures of macroscopic gelation, and of devitri-Ðcation, vitriÐcation and devitriÐcation, which form thebases of the two principal contours in the kinetic con-tinuous heating timeÈtemperatureÈtransformation(CHT) cure diagram (Fig. 9). DevitriÐcation on heatingcan arise when the chemical reactivity is sufficientlydepleted to give or on completion of the cureTg \T ,reactions (at approximately or on thermal degra-Tg=),dation.22,28 Because the process of vitriÐcation usuallydrastically lowers the reaction rate, complete cureusually involves temperatures in the vicinity of themaximum glass transition temperature For the(Tg=).same reason, after vitriÐcation does not rise muchTgabove the rising temperature in temperature scans, as inthe calculated CHT diagram of Fig. 9.34 Large quan-tities (e.g. more than 1 ton) of exothermic thermosettingsystems can be fully reacted by raising the temperatureduring cure such that (i.e. vitriÐcation-controlledTg [ Treaction).46 Furthermore, curing under conditionswhere obviates the need for a containingTg [Tmould,46 and gives the material the highest densitybecause the maximum physical ageing rate is just below
(see later).34 It is noted that for high systems (e.g.Tg Tg=molecularly sti† polyimides) the necessity to cure aboveapproximately in order to avoid vitriÐcation, oftenTg= ,precludes full cure being attained because of competitivethermal degradation reactions.6,22,28,31
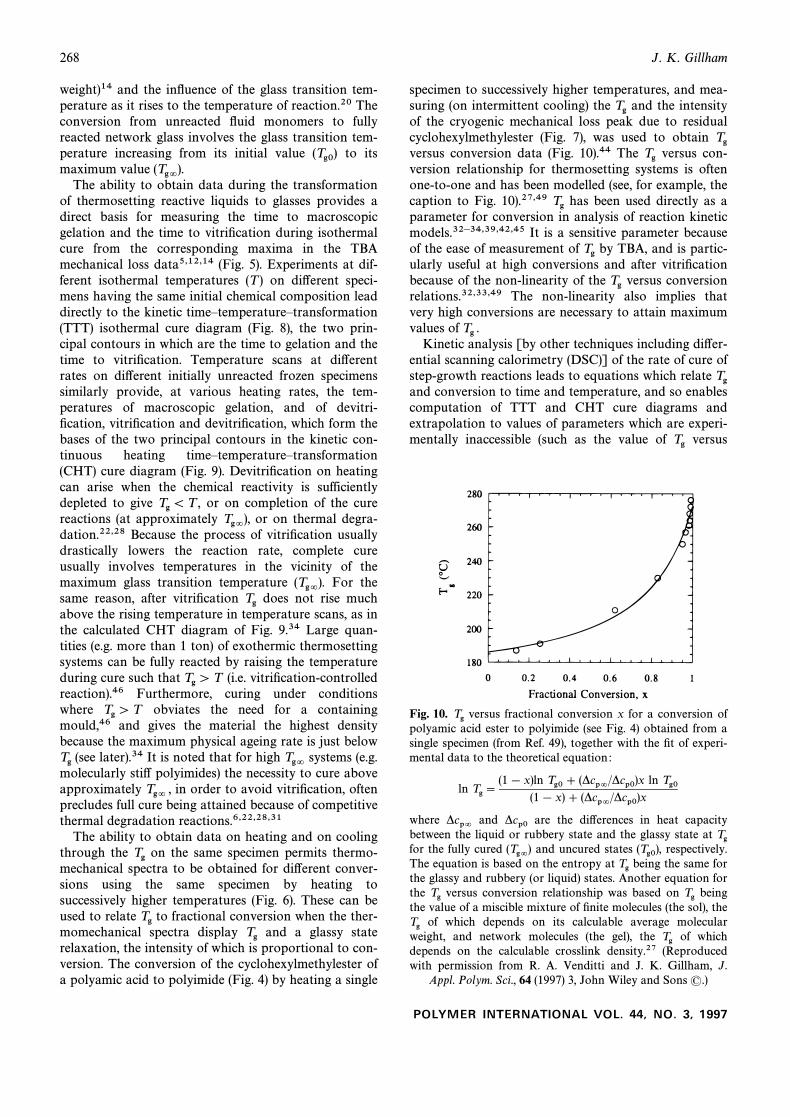
The ability to obtain data on heating and on coolingthrough the on the same specimen permits thermo-Tgmechanical spectra to be obtained for di†erent conver-sions using the same specimen by heating tosuccessively higher temperatures (Fig. 6). These can beused to relate to fractional conversion when the ther-Tgmomechanical spectra display and a glassy stateTgrelaxation, the intensity of which is proportional to con-version. The conversion of the cyclohexylmethylester ofa polyamic acid to polyimide (Fig. 4) by heating a single
specimen to successively higher temperatures, and mea-suring (on intermittent cooling) the and the intensityTgof the cryogenic mechanical loss peak due to residualcyclohexylmethylester (Fig. 7), was used to obtain Tgversus conversion data (Fig. 10).44 The versus con-Tgversion relationship for thermosetting systems is oftenone-to-one and has been modelled (see, for example, thecaption to Fig. 10).27,49 has been used directly as aTgparameter for conversion in analysis of reaction kineticmodels.32h34,39,42,45 It is a sensitive parameter becauseof the ease of measurement of by TBA, and is partic-Tgularly useful at high conversions and after vitriÐcationbecause of the non-linearity of the versus conversionTgrelations.32,33,49 The non-linearity also implies thatvery high conversions are necessary to attain maximumvalues of Tg .
Kinetic analysis [by other techniques including di†er-ential scanning calorimetry (DSC)] of the rate of cure ofstep-growth reactions leads to equations which relate Tgand conversion to time and temperature, and so enablescomputation of TTT and CHT cure diagrams andextrapolation to values of parameters which are experi-mentally inaccessible (such as the value of versusTg
versus fractional conversion x for a conversion ofFig. 10. Tgpolyamic acid ester to polyimide (see Fig. 4) obtained from asingle specimen (from Ref. 49), together with the Ðt of experi-mental data to the theoretical equation :
ln Tg \(1 [ x)ln Tg0 ] (*cp=/*cp0)x ln Tg0
(1 [ x) ] (*cp=/*cp0)x
where and are the di†erences in heat capacity*cp= *cp0between the liquid or rubbery state and the glassy state at Tgfor the fully cured and uncured states respectively.(Tg=) (Tg0),The equation is based on the entropy at being the same forTgthe glassy and rubbery (or liquid) states. Another equation forthe versus conversion relationship was based on beingTg Tgthe value of a miscible mixture of Ðnite molecules (the sol), the
of which depends on its calculable average molecularTgweight, and network molecules (the gel), the of whichTgdepends on the calculable crosslink density.27 (Reproducedwith permission from R. A. Venditti and J. K. Gillham, J.
Appl. Polym. Sci., 64 (1997) 3, John Wiley and Sons (.)
POLYMER INTERNATIONAL VOL. 44, NO. 3, 1997
T BA torsion pendulum 269
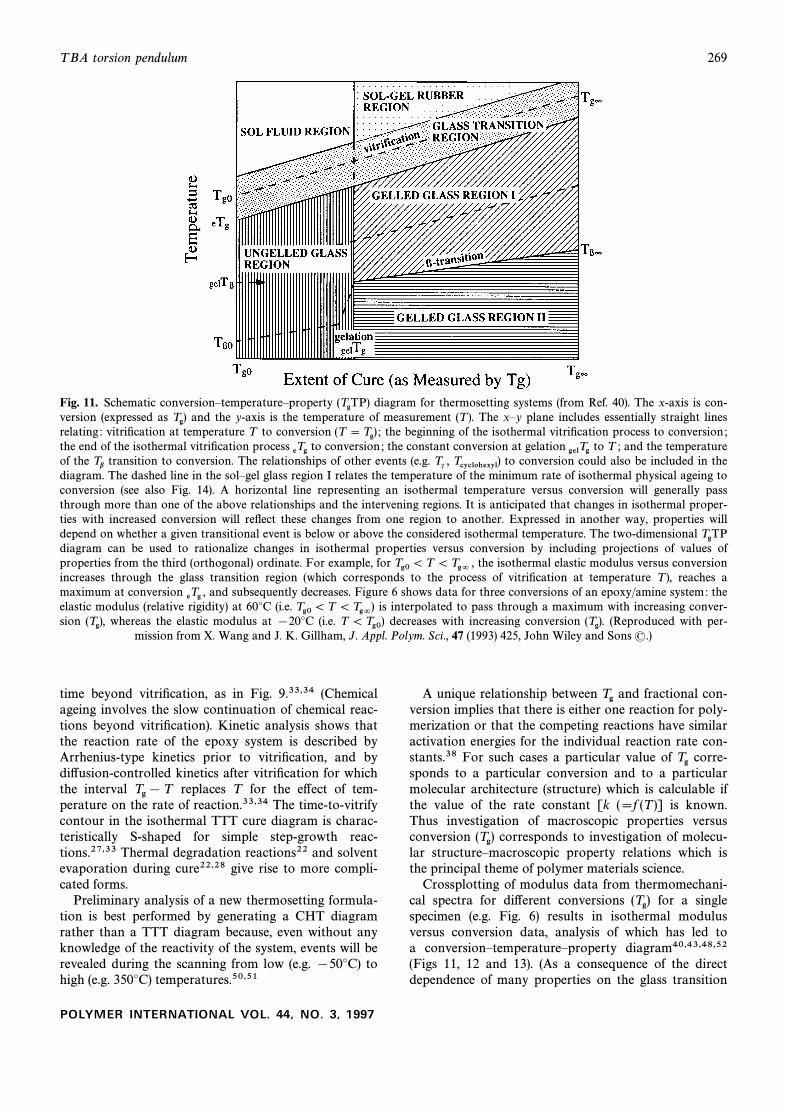
Fig. 11. Schematic conversionÈtemperatureÈproperty diagram for thermosetting systems (from Ref. 40). The x-axis is con-(TgTP)version (expressed as and the y-axis is the temperature of measurement (T ). The xÈy plane includes essentially straight linesTg)relating : vitriÐcation at temperature T to conversion the beginning of the isothermal vitriÐcation process to conversion ;(T \ Tg) ;the end of the isothermal vitriÐcation process to conversion ; the constant conversion at gelation to T ; and the temperatureeTg gelTgof the transition to conversion. The relationships of other events (e.g. to conversion could also be included in theTb Tc , Tcyclohexyl)diagram. The dashed line in the solÈgel glass region I relates the temperature of the minimum rate of isothermal physical ageing toconversion (see also Fig. 14). A horizontal line representing an isothermal temperature versus conversion will generally passthrough more than one of the above relationships and the intervening regions. It is anticipated that changes in isothermal proper-ties with increased conversion will reÑect these changes from one region to another. Expressed in another way, properties willdepend on whether a given transitional event is below or above the considered isothermal temperature. The two-dimensional TgTPdiagram can be used to rationalize changes in isothermal properties versus conversion by including projections of values ofproperties from the third (orthogonal) ordinate. For example, for the isothermal elastic modulus versus conversionTg0 \ T \Tg= ,increases through the glass transition region (which corresponds to the process of vitriÐcation at temperature T ), reaches amaximum at conversion and subsequently decreases. Figure 6 shows data for three conversions of an epoxy/amine system: theeTg ,elastic modulus (relative rigidity) at 60¡C (i.e. is interpolated to pass through a maximum with increasing conver-Tg0\ T \ Tg=)sion whereas the elastic modulus at [20¡C (i.e. decreases with increasing conversion (Reproduced with per-(Tg), T \ Tg0) (Tg).
mission from X. Wang and J. K. Gillham, J. Appl. Polym. Sci., 47 (1993) 425, John Wiley and Sons (.)
time beyond vitriÐcation, as in Fig. 9.33,34 (Chemicalageing involves the slow continuation of chemical reac-tions beyond vitriÐcation). Kinetic analysis shows thatthe reaction rate of the epoxy system is described byArrhenius-type kinetics prior to vitriÐcation, and bydi†usion-controlled kinetics after vitriÐcation for whichthe interval replaces T for the e†ect of tem-Tg[ Tperature on the rate of reaction.33,34 The time-to-vitrifycontour in the isothermal TTT cure diagram is charac-teristically S-shaped for simple step-growth reac-tions.27,33 Thermal degradation reactions22 and solventevaporation during cure22,28 give rise to more compli-cated forms.
Preliminary analysis of a new thermosetting formula-tion is best performed by generating a CHT diagramrather than a TTT diagram because, even without anyknowledge of the reactivity of the system, events will berevealed during the scanning from low (e.g. [50¡C) tohigh (e.g. 350¡C) temperatures.50,51
A unique relationship between and fractional con-Tgversion implies that there is either one reaction for poly-merization or that the competing reactions have similaractivation energies for the individual reaction rate con-stants.38 For such cases a particular value of corre-Tgsponds to a particular conversion and to a particularmolecular architecture (structure) which is calculable ifthe value of the rate constant [k (\f (T )] is known.Thus investigation of macroscopic properties versusconversion corresponds to investigation of molecu-(Tg)lar structureÈmacroscopic property relations which isthe principal theme of polymer materials science.
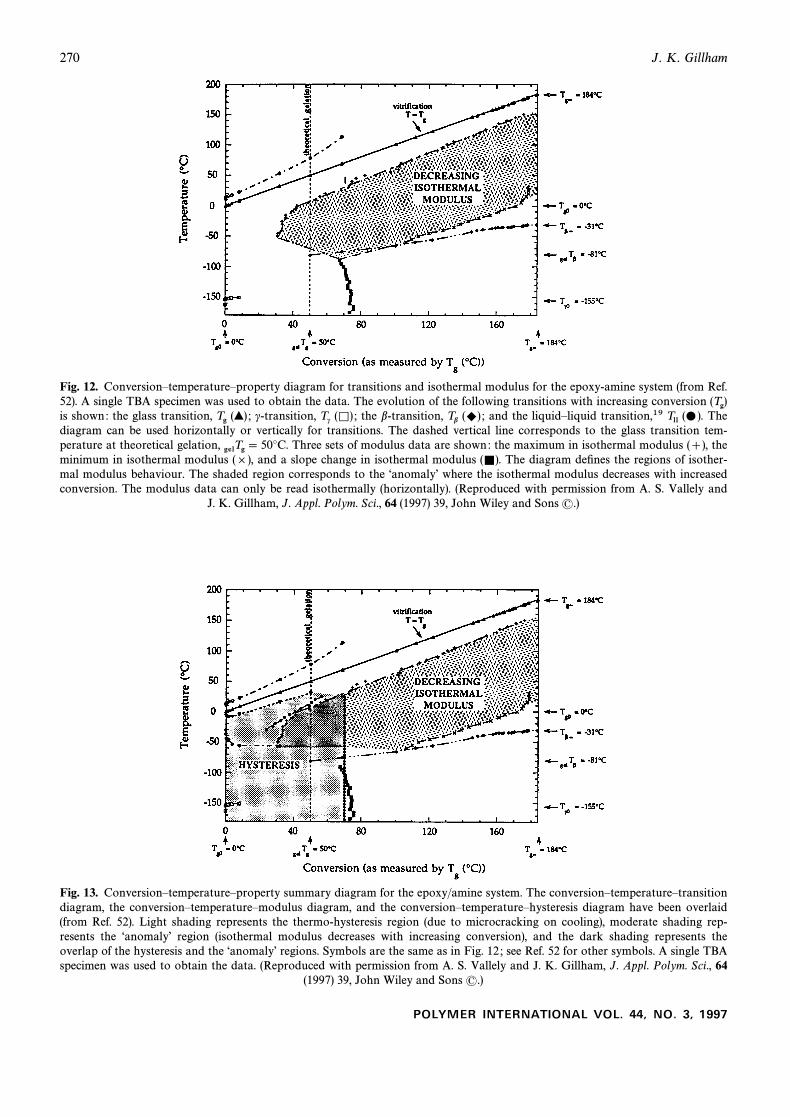
Crossplotting of modulus data from thermomechani-cal spectra for di†erent conversions for a single(Tg)specimen (e.g. Fig. 6) results in isothermal modulusversus conversion data, analysis of which has led toa conversionÈtemperatureÈproperty diagram40,43,48,52(Figs 11, 12 and 13). (As a consequence of the directdependence of many properties on the glass transition
POLYMER INTERNATIONAL VOL. 44, NO. 3, 1997
270 J. K. Gillham
Fig. 12. ConversionÈtemperatureÈproperty diagram for transitions and isothermal modulus for the epoxy-amine system (from Ref.52). A single TBA specimen was used to obtain the data. The evolution of the following transitions with increasing conversion (Tg)is shown: the glass transition, c-transition, the b-transition, and the liquidÈliquid transition,19 TheTg (>) ; Tc (K) ; Tb (+) ; Tll (…).diagram can be used horizontally or vertically for transitions. The dashed vertical line corresponds to the glass transition tem-perature at theoretical gelation, Three sets of modulus data are shown: the maximum in isothermal modulus (]), thegelTg \ 50¡C.minimum in isothermal modulus (]), and a slope change in isothermal modulus The diagram deÐnes the regions of isother-(=).mal modulus behaviour. The shaded region corresponds to the “anomalyÏ where the isothermal modulus decreases with increasedconversion. The modulus data can only be read isothermally (horizontally). (Reproduced with permission from A. S. Vallely and
J. K. Gillham, J. Appl. Polym. Sci., 64 (1997) 39, John Wiley and Sons (.)
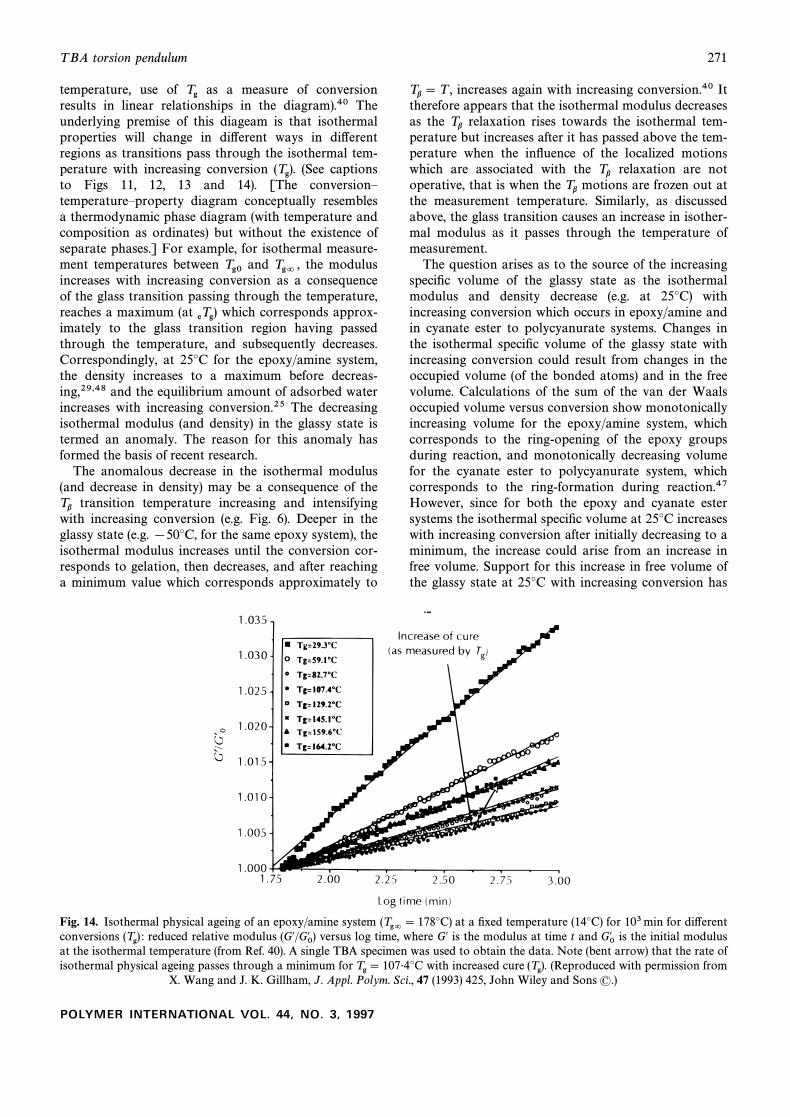
Fig. 13. ConversionÈtemperatureÈproperty summary diagram for the epoxy/amine system. The conversionÈtemperatureÈtransitiondiagram, the conversionÈtemperatureÈmodulus diagram, and the conversionÈtemperatureÈhysteresis diagram have been overlaid(from Ref. 52). Light shading represents the thermo-hysteresis region (due to microcracking on cooling), moderate shading rep-resents the “anomalyÏ region (isothermal modulus decreases with increasing conversion), and the dark shading represents theoverlap of the hysteresis and the “anomalyÏ regions. Symbols are the same as in Fig. 12 ; see Ref. 52 for other symbols. A single TBAspecimen was used to obtain the data. (Reproduced with permission from A. S. Vallely and J. K. Gillham, J. Appl. Polym. Sci., 64
(1997) 39, John Wiley and Sons (.)
POLYMER INTERNATIONAL VOL. 44, NO. 3, 1997
T BA torsion pendulum 271
temperature, use of as a measure of conversionTgresults in linear relationships in the diagram).40 Theunderlying premise of this diageam is that isothermalproperties will change in di†erent ways in di†erentregions as transitions pass through the isothermal tem-perature with increasing conversion (See captions(Tg).to Figs 11, 12, 13 and 14). [The conversionÈtemperatureÈproperty diagram conceptually resemblesa thermodynamic phase diagram (with temperature andcomposition as ordinates) but without the existence ofseparate phases.] For example, for isothermal measure-ment temperatures between and the modulusTg0 Tg= ,increases with increasing conversion as a consequenceof the glass transition passing through the temperature,reaches a maximum (at which corresponds approx-eTg)imately to the glass transition region having passedthrough the temperature, and subsequently decreases.Correspondingly, at 25¡C for the epoxy/amine system,the density increases to a maximum before decreas-ing,29,48 and the equilibrium amount of adsorbed waterincreases with increasing conversion.25 The decreasingisothermal modulus (and density) in the glassy state istermed an anomaly. The reason for this anomaly hasformed the basis of recent research.
The anomalous decrease in the isothermal modulus(and decrease in density) may be a consequence of the
transition temperature increasing and intensifyingTbwith increasing conversion (e.g. Fig. 6). Deeper in theglassy state (e.g. [50¡C, for the same epoxy system), theisothermal modulus increases until the conversion cor-responds to gelation, then decreases, and after reachinga minimum value which corresponds approximately to
increases again with increasing conversion.40 ItTb\ T ,therefore appears that the isothermal modulus decreasesas the relaxation rises towards the isothermal tem-Tbperature but increases after it has passed above the tem-perature when the inÑuence of the localized motionswhich are associated with the relaxation are notTboperative, that is when the motions are frozen out atTbthe measurement temperature. Similarly, as discussedabove, the glass transition causes an increase in isother-mal modulus as it passes through the temperature ofmeasurement.
The question arises as to the source of the increasingspeciÐc volume of the glassy state as the isothermalmodulus and density decrease (e.g. at 25¡C) withincreasing conversion which occurs in epoxy/amine andin cyanate ester to polycyanurate systems. Changes inthe isothermal speciÐc volume of the glassy state withincreasing conversion could result from changes in theoccupied volume (of the bonded atoms) and in the freevolume. Calculations of the sum of the van der Waalsoccupied volume versus conversion show monotonicallyincreasing volume for the epoxy/amine system, whichcorresponds to the ring-opening of the epoxy groupsduring reaction, and monotonically decreasing volumefor the cyanate ester to polycyanurate system, whichcorresponds to the ring-formation during reaction.47However, since for both the epoxy and cyanate estersystems the isothermal speciÐc volume at 25¡C increaseswith increasing conversion after initially decreasing to aminimum, the increase could arise from an increase infree volume. Support for this increase in free volume ofthe glassy state at 25¡C with increasing conversion has
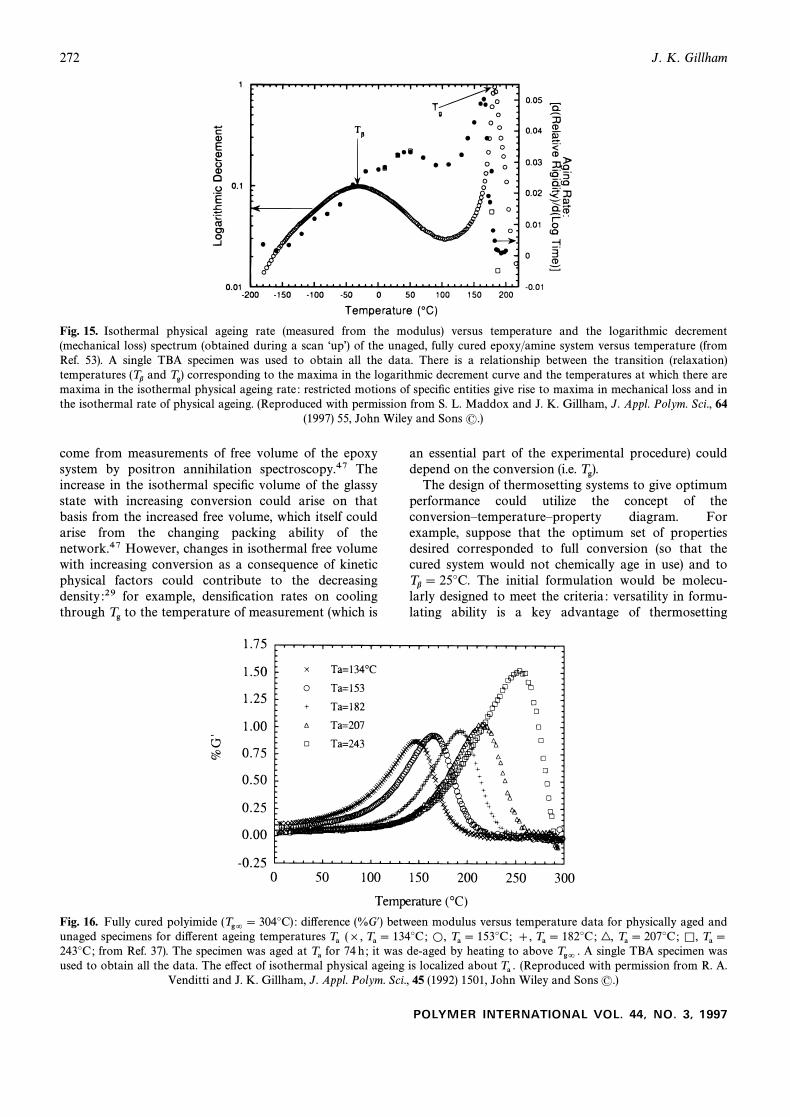
Fig. 14. Isothermal physical ageing of an epoxy/amine system at a Ðxed temperature (14¡C) for 103min for di†erent(Tg= \ 178¡C)conversions reduced relative modulus versus log time, where G@ is the modulus at time t and is the initial modulus(Tg) : (G@/G0@ ) G0@at the isothermal temperature (from Ref. 40). A single TBA specimen was used to obtain the data. Note (bent arrow) that the rate ofisothermal physical ageing passes through a minimum for with increased cure (Reproduced with permission fromTg \ 107É4¡C (Tg).
X. Wang and J. K. Gillham, J. Appl. Polym. Sci., 47 (1993) 425, John Wiley and Sons (.)
POLYMER INTERNATIONAL VOL. 44, NO. 3, 1997
272 J. K. Gillham
Fig. 15. Isothermal physical ageing rate (measured from the modulus) versus temperature and the logarithmic decrement(mechanical loss) spectrum (obtained during a scan “upÏ) of the unaged, fully cured epoxy/amine system versus temperature (fromRef. 53). A single TBA specimen was used to obtain all the data. There is a relationship between the transition (relaxation)temperatures and corresponding to the maxima in the logarithmic decrement curve and the temperatures at which there are(Tb Tg)maxima in the isothermal physical ageing rate : restricted motions of speciÐc entities give rise to maxima in mechanical loss and inthe isothermal rate of physical ageing. (Reproduced with permission from S. L. Maddox and J. K. Gillham, J. Appl. Polym. Sci., 64
(1997) 55, John Wiley and Sons (.)
come from measurements of free volume of the epoxysystem by positron annihilation spectroscopy.47 Theincrease in the isothermal speciÐc volume of the glassystate with increasing conversion could arise on thatbasis from the increased free volume, which itself couldarise from the changing packing ability of thenetwork.47 However, changes in isothermal free volumewith increasing conversion as a consequence of kineticphysical factors could contribute to the decreasingdensity :29 for example, densiÐcation rates on coolingthrough to the temperature of measurement (which isTg
an essential part of the experimental procedure) coulddepend on the conversion (i.e. Tg).
The design of thermosetting systems to give optimumperformance could utilize the concept of theconversionÈtemperatureÈproperty diagram. Forexample, suppose that the optimum set of propertiesdesired corresponded to full conversion (so that thecured system would not chemically age in use) and to
The initial formulation would be molecu-Tb\ 25¡C.larly designed to meet the criteria : versatility in formu-lating ability is a key advantage of thermosetting
Fig. 16. Fully cured polyimide di†erence (%G@) between modulus versus temperature data for physically aged and(Tg= \ 304¡C) :unaged specimens for di†erent ageing temperatures (], ],Ta Ta \ 134¡C; L, Ta \ 153¡C; Ta \ 182¡C; |, Ta \ 207¡C; K, Ta \243¡C; from Ref. 37). The specimen was aged at for 74 h ; it was de-aged by heating to above A single TBA specimen wasTa Tg= .used to obtain all the data. The e†ect of isothermal physical ageing is localized about (Reproduced with permission from R. A.Ta .
Venditti and J. K. Gillham, J. Appl. Polym. Sci., 45 (1992) 1501, John Wiley and Sons (.)
POLYMER INTERNATIONAL VOL. 44, NO. 3, 1997
T BA torsion pendulum 273
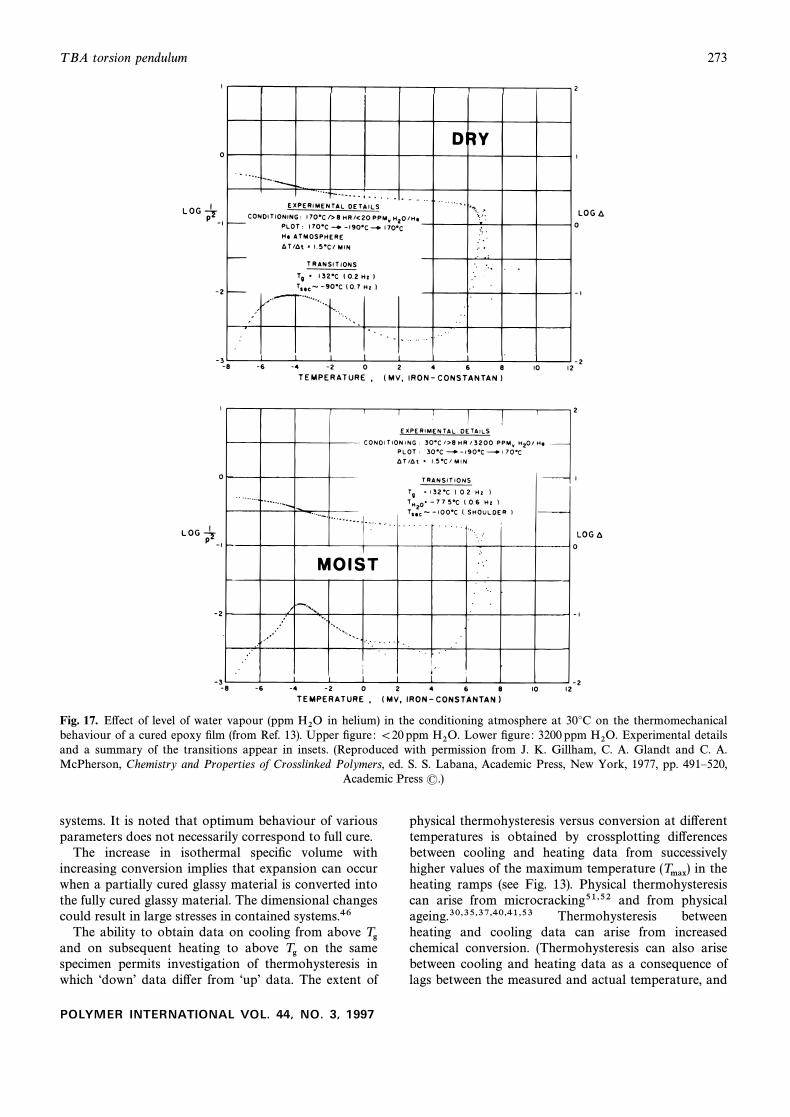
Fig. 17. E†ect of level of water vapour (ppm in helium) in the conditioning atmosphere at 30¡C on the thermomechanicalH2Obehaviour of a cured epoxy Ðlm (from Ref. 13). Upper Ðgure : \20 ppm Lower Ðgure : 3200 ppm Experimental detailsH2O. H2O.and a summary of the transitions appear in insets. (Reproduced with permission from J. K. Gillham, C. A. Glandt and C. A.McPherson, Chemistry and Properties of Crosslinked Polymers, ed. S. S. Labana, Academic Press, New York, 1977, pp. 491È520,
Academic Press (.)
systems. It is noted that optimum behaviour of variousparameters does not necessarily correspond to full cure.
The increase in isothermal speciÐc volume withincreasing conversion implies that expansion can occurwhen a partially cured glassy material is converted intothe fully cured glassy material. The dimensional changescould result in large stresses in contained systems.46
The ability to obtain data on cooling from above Tgand on subsequent heating to above on the sameTgspecimen permits investigation of thermohysteresis inwhich “downÏ data di†er from “upÏ data. The extent of
physical thermohysteresis versus conversion at di†erenttemperatures is obtained by crossplotting di†erencesbetween cooling and heating data from successivelyhigher values of the maximum temperature in the(Tmax)heating ramps (see Fig. 13). Physical thermohysteresiscan arise from microcracking51,52 and from physicalageing.30,35,37,40,41,53 Thermohysteresis betweenheating and cooling data can arise from increasedchemical conversion. (Thermohysteresis can also arisebetween cooling and heating data as a consequence oflags between the measured and actual temperature, and
POLYMER INTERNATIONAL VOL. 44, NO. 3, 1997
274 J. K. Gillham
from the presence of water vapor in the atmosphere sur-rounding the specimen.13,15)
A single specimen can also be used to study isother-mal physical ageing (the spontaneous densiÐcation ofthe non-equilibrium glassy state) for di†erent conver-sions because ageing e†ects can be removed and(Tg)conversion can be increased by heating to above (orTgeven to below The isothermal ageing rate at aTg).37,53given temperature does not change monotonically withincreasing conversion40,41 (Fig. 14) or with increasingtemperature53 (Fig. 15). The isothermal ageing rate atconstant conversion for a given conversion gives(Tg)maxima versus temperature which correlate with thetransitions and of the polymeric glass53 (Fig. 15).(Tb Tg)The correlation is a consequence of both the relaxations
and as measured by mechanical loss, and the(Tb Tg)physical ageing process, being determined by restrictedspeciÐc submolecular motions.53 The e†ect of isother-mal ageing on subsequent thermomechanical behaviourappears to be localized about the isothermal ageingtemperature37,53 (Fig. 16) : this is also a consequence ofdi†erent sets of submolecular motion being operative atdi†erent temperatures of isothermal physical ageing.
A single specimen can also be used to investigate thee†ect of water absorbed from a water vapour-ladengaseous atmosphere at di†erent levels of humiditybecause absorbed water can be removed reversibly byheating to above Small amounts of isothermallyTg .absorbed water result in an additional cryogenic mecha-nical loss peak, designated in the thermomechani-TH2Ocal spectra of a fully cured free epoxy Ðlm13 (Fig. 17)(fully cured thermosets are self-supporting) and a fullycured polyimide TBA specimen15 (data not shownhere). The principal transitions for the epoxy systemwere (0É2 Hz), (0É7 Hz) andTg\ 132¡C Tb B [90¡C
(0É6 Hz) ; for the polyimide systemTH2O \[77¡C Tg \(0É6 Hz), (1É1 Hz) and319¡C Tb \ 135¡C TH2O \(1É0 Hz). The location of the relaxation[122¡C TH2O
therefore depends on the polymer type. The intensity ofthe mechanical loss peak increases rapidly withTH2Oincreasing (but small) water levels to a maximum for3000 p.p.m. of in the conditioning atmosphere. ForH2Othe epoxy system, the and relaxations wereTb TH2Ocoupled such that as the intensity of the relaxationTH2Oincreased that of the relaxation decreased : this sug-Tbgested that the relaxation involved the sameTH2Orestricted motions of the relaxation but the movingTbsegment di†ered in having a higher mass due toabsorbed water.
This review has so far considered the cure and evolu-tion of properties for essentially homogeneous thermo-setting systems. Phase separation can occur during cureand be used to modify and control properties, forexample in rubber-modiÐed epoxies in which an initiallyunreacted homogeneous epoxy/reactive rubber systemproduces a dispersion of rubber-rich domains in anepoxy-rich matrix as a consequence of the decreasingcompatibility of the constituents with increasing conver-
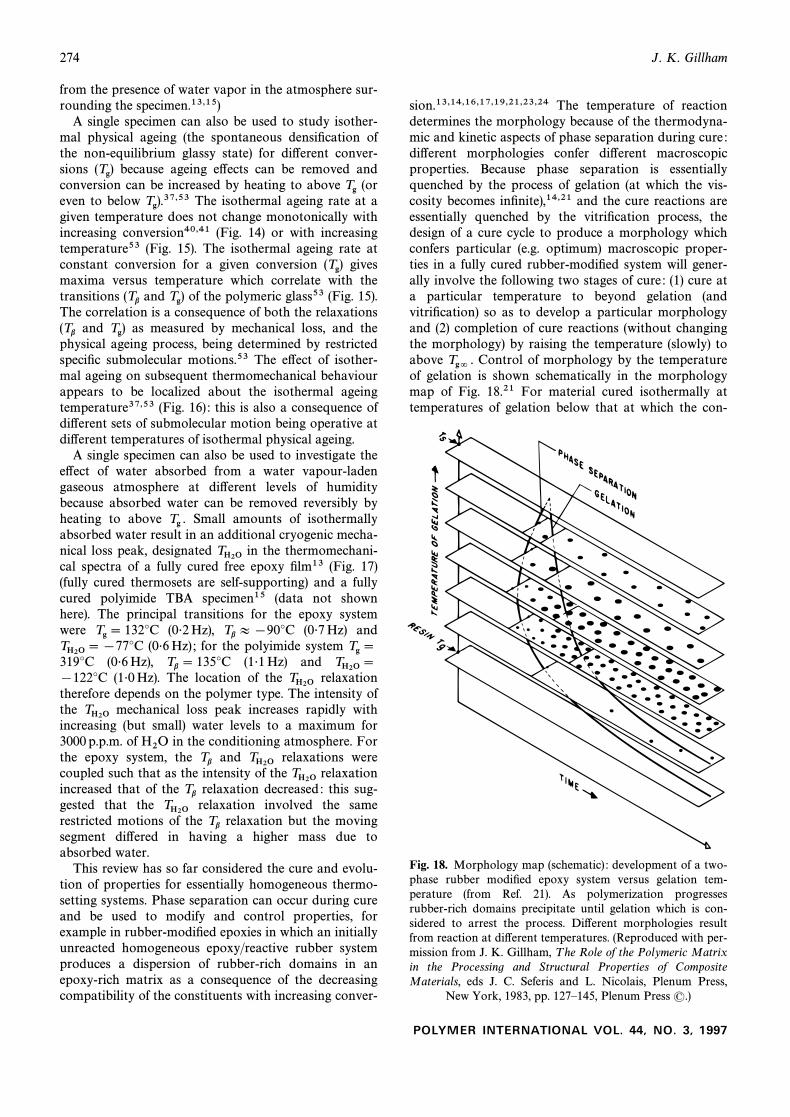
sion.13,14,16,17,19,21,23,24 The temperature of reactiondetermines the morphology because of the thermodyna-mic and kinetic aspects of phase separation during cure :di†erent morphologies confer di†erent macroscopicproperties. Because phase separation is essentiallyquenched by the process of gelation (at which the vis-cosity becomes inÐnite),14,21 and the cure reactions areessentially quenched by the vitriÐcation process, thedesign of a cure cycle to produce a morphology whichconfers particular (e.g. optimum) macroscopic proper-ties in a fully cured rubber-modiÐed system will gener-ally involve the following two stages of cure : (1) cure ata particular temperature to beyond gelation (andvitriÐcation) so as to develop a particular morphologyand (2) completion of cure reactions (without changingthe morphology) by raising the temperature (slowly) toabove Control of morphology by the temperatureTg= .of gelation is shown schematically in the morphologymap of Fig. 18.21 For material cured isothermally attemperatures of gelation below that at which the con-
Fig. 18. Morphology map (schematic) : development of a two-phase rubber modiÐed epoxy system versus gelation tem-perature (from Ref. 21). As polymerization progressesrubber-rich domains precipitate until gelation which is con-sidered to arrest the process. Di†erent morphologies resultfrom reaction at di†erent temperatures. (Reproduced with per-mission from J. K. Gillham, T he Role of the Polymeric Matrixin the Processing and Structural Properties of CompositeMaterials, eds J. C. Seferis and L. Nicolais, Plenum Press,
New York, 1983, pp. 127È145, Plenum Press (.)
POLYMER INTERNATIONAL VOL. 44, NO. 3, 1997
T BA torsion pendulum 275
tours of the time to gelation and the time to the onset ofphase separation intersect, (Figs 8, 18), rubber-T \Tsrich domains are dispersed in a glassy matrix, whereasat higher cure temperatures the cured material is essen-tially a rubber-plasticized glass : the former is visuallyopaque or translucent whereas the latter is optically
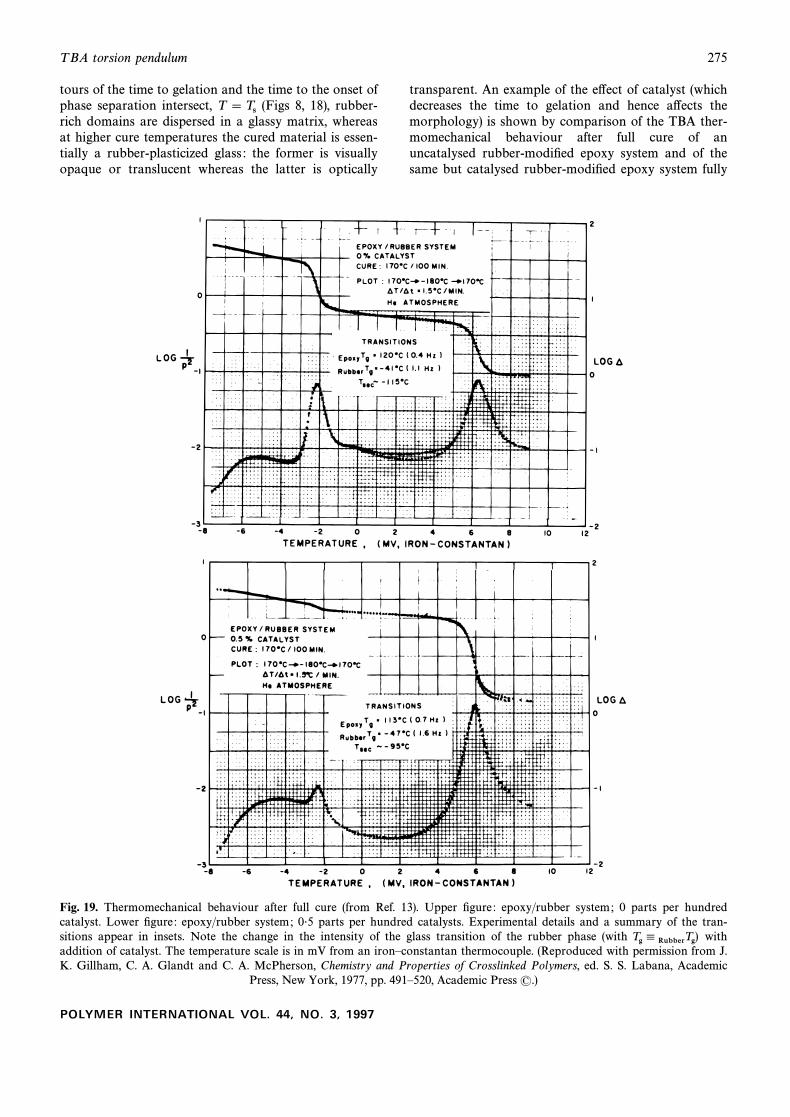
transparent. An example of the e†ect of catalyst (whichdecreases the time to gelation and hence a†ects themorphology) is shown by comparison of the TBA ther-momechanical behaviour after full cure of anuncatalysed rubber-modiÐed epoxy system and of thesame but catalysed rubber-modiÐed epoxy system fully
Fig. 19. Thermomechanical behaviour after full cure (from Ref. 13). Upper Ðgure : epoxy/rubber system; 0 parts per hundredcatalyst. Lower Ðgure : epoxy/rubber system; 0É5 parts per hundred catalysts. Experimental details and a summary of the tran-sitions appear in insets. Note the change in the intensity of the glass transition of the rubber phase (with withTg 4 RubberTg)addition of catalyst. The temperature scale is in mV from an ironÈconstantan thermocouple. (Reproduced with permission from J.K. Gillham, C. A. Glandt and C. A. McPherson, Chemistry and Properties of Crosslinked Polymers, ed. S. S. Labana, Academic
Press, New York, 1977, pp. 491È520, Academic Press (.)
POLYMER INTERNATIONAL VOL. 44, NO. 3, 1997
276 J. K. Gillham
cured the same way (Fig. 19).14,21
CONCLUSIONS
The ability to traverse the change from solid to liquid(or rubber) and vice versa has presented a simple andefficient mechanical means for investigating the processof cure, and the evolution and control of properties ofthermosetting systems with cure. The point of viewdeveloped in our laboratory over the years with respectto understanding thermosetting systems in a generalizedway has been the direct consequence of concurrentlydeveloping and exploiting the TBA torsion pendulumtechnique. Automation in the late 1960s and early 1970sstimulated the automation, commercial availability andimportance of dynamic mechanical analysis, which isnow a major technique in polymer science and engin-eering.
DEDICATION
It is a pleasure to dedicate this article to Bob Stepto.We overlapped as students at Sutton Grammar Schoolin the late 1940s.
REFERENCES
1 Lewis, A. F. & Gillham, J. K., J. Appl. Polym. Sci., 6 (1962) 422.2 Gillham, J. K., Science, 139 (1963) 494.3 Roller, M. B. & Gillham, J. K., Polym. Eng. Sci., 11 (1971) 295.4 Gillham, J. K., Critical Reviews in Macromolecular Science, Vol. 1,
Issue 1, 1972, pp. 83È172.5 Babayevsky, P. G. & Gillham, J. K., J. Appl. Polym. Sci., 17 (1973)
2067.6 Gillham, J. K. & Gillham, H. C., Polym. Eng. Sci., 13 (1973) 447.7 Bell, C. L. M., Gillham, J. K. & Benci, J. A., Am. Chem. Soc., Div.
Polym. Chem., Prepr., 15(1) (1974) 542È548.8 Bell, C. L. M., Gillham, J. K. & Benci, J. A., T ech. Pap. Annu.
T ech. Conf., Soc. Plast. Eng., 20 (1974) 598È600.9 Hazony, Y., Stadnicki, S. J. & Gillham, J. K., Am. Chem. Soc., Div.
Polym. Chem., Prepr., 15(1) (1974) 549È561.10 Gillham, J. K., Stadnicki, S. J. & Hazony, Y., Am. Chem. Soc., Div.
Polym. Chem., Prepr., 15(1) (1974) 562È569.11 Gillham, J. K., Am. Inst. Chem. Eng. J., 20(6) (1974) 1066È1079.12 Gillham, J. K. & Benci, J. A., J. Polym. Sci., Symp., 46 (1974) 279.13 Gillham, J. K., Glandt, C. A. & McPherson, C. A., in Chemistry
and Properties of Crosslinked Polymers, ed. S. S. Labana, AcademicPress, New York, 1977, pp. 491È520.
14 Gillham, J. K., Polym. Eng. Sci., 19(10) (1979) 676È682.
15 Ozari, Y., Chow, R. H. & Gillham, J. K., J. Appl. Polym. Sci., 23(1979) 1189.
16 Manzione, L. T., Gillham, J. K. & McPherson, C. A., J. Appl.Polym. Sci., 26 (1981) 889.
17 Manzione, L. T., Gillham, J. K. & McPherson, C. A., J. Appl.Polym. Sci., 26 (1981) 907.
18 Enns, J. B. & Gillham, J. K., in Computer Applications in AppliedPolymer Science, ed. T. Provder, American Chemical Society Sym-posium Series, No. 197, 1982, pp. 329È352.
19 Gillham, J. K., in Developments in Polymer Characterisation, Vol.3, ed. J. V. Dawkins, Applied Science Publishers, London, 1982,pp. 159È227.
20 Enns, J. B. & Gillham, J. K., J. Appl. Polym. Sci., 28 (1983) 2567.21 Gillham, J. K., in T he Role of the Polymeric Matrix in the Pro-
cessing and Structural Properties of Composite Materials, eds J. C.Seferis & L. Nicolais, Plenum Press, New York, 1983, pp. 127È145.
22 Chan, L. C., Nae� , H. N. & Gillham, J. K., J. Appl. Polym. Sci., 29(1984) 3307.
23 Chan, L. C., Gillham, J. K., Kinloch, A. J. & Shaw, S. J., inRubber-ModiÐed T hermoset Resins, eds C. K. Riew & J. K.Gillham, American Chemical Society Advances in ChemistrySeries, Vol. 208, 1984, pp. 235È260.
24 Chan, L. C., Gillham, J. K., Kinloch, A. J. & Shaw, S. J., inRubber-ModiÐed T hermoset Resins, eds C. K. Riew & J. K.Gillham, American Chemical Society Advances in ChemistrySeries, Vol. 208, 1984, pp. 261È279.
25 Aronhime, M. T., Peng, X., Gillham, J. K. & Small, R. D., J. Appl.Polym. Sci., 32 (1986) 3589.
26 Gillham, J. K., Polym. Eng. Sci., 20 (1986) 1429.27 Aronhime, M. T. & Gillham, J. K., Adv. Polym. Sci., 78 (1986) 83.28 Gan, S., Gillham, J. K. & Prime, R. D., J. Appl. Polym. Sci., 37
(1989) 803.29 Pang, K. P. & Gillham, J. K., J. Appl. Polym. Sci., 37 (1989) 1969.30 Pang, K. P. & Gillham, J. K., J. Appl. Polym. Sci., 38 (1989) 2115.31 Pang, K. P. & Gillham, J. K., J. Appl. Polym. Sci., 39 (1990) 909.32 Wisanrakkit, G., Gillham, J. K. & Enns, J. B., J. Appl. Polym. Sci.,
41 (1990) 1895.33 Wisanrakkit, G. & Gillham, J. K., J. Appl. Polym. Sci., 41 (1990)
2885.34 Wisanrakkit, G. & Gillham, J. K., J. Appl. Polym. Sci., 42 (1991)
2453.35 Wisanrakkit, G. & Gillham, J. K., J. Appl. Polym. Sci., 42 (1991)
2465.36 Wang, X. & Gillham, J. K., J. Appl. Polym. Sci., 43 (1991) 2267.37 Venditti, R. A. & Gillham, J. K., J. Appl. Polym. Sci., 45 (1992)
1501.38 Wang, X. & Gillham, J. K., J. Appl. Polym. Sci., 45 (1992) 2127.39 Simon, S. L. & Gillham, J. K., J. Appl. Polym. Sci., 46 (1992) 1245.40 Wang, X. & Gillham, J. K., J. Appl. Polym. Sci., 47 (1993) 425.41 Wang. X & Gillham, J. K., J. Appl. Polym. Sci., 47 (1993) 447.42 Simon, S. L. & Gillham, J. K., J. Appl. Polym. Sci., 47 (1993) 461.43 Simon, S. L. & Gillham, J. K., J. Appl. Polym. Sci., 51, (1994) 1741.44 Venditti, R. A., Gillham, J. K., Chin, E. & Houlihan, F. M., J.
Appl. Polym. Sci., 53 (1994) 455.45 Simon, S. L. & Gillham, J. K., J. Appl. Polym. Sci., 53 (1994) 709.46 Gillham, J. K. & Enns, J. B., T rends Polym. Sci., 2(12) (1994) 406È
419.47 Venditti, R. A., Gillham, J. K., Jean, Y. C. & Lou, Y., J. Appl.
Polym. Sci., 56 (1995) 1207.48 Venditti, R. A. & Gillham, J. K., J. Appl. Polym. Sci., 56 (1995)
1687.49 Venditti, R. A. & Gillham, J. K., J. Appl. Polym. Sci., 64(1) (1997) 3.50 DeMeuse, M., Gillham, J. K. & Parodi, F., J. Appl. Polym. Sci.,
64(1) (1997) 15.51 DeMeuse, M., Gillham, J. K. & Parodi, F., J. Appl. Polym. Sci.,
64(1) (1997) 27.52 Vallely, A. S. & Gillham, J. K., J. Appl. Polym. Sci., 64(1) (1997) 39.53 Maddox, S. L. & Gillham, J. K., J. Appl. Polym. Sci., 64(1) (1997)
55.
POLYMER INTERNATIONAL VOL. 44, NO. 3, 1997