Embed Size (px)
Citation preview
THE TAX CREDITTURNS 30Lessons learned from the first 30 years of the Low Income Housing Tax Credit program and implications for public policy
December 2017www.chpc.net

This report takes a look back at the first 30 years of operation of the Low Income Housing Tax Credit (Housing Credit) to find out what happened to the first generation of developments in California that received allocations of Housing Credits from 1987 to 1989. Some of these developments were lost to conversion to market rate after only 15 years, and many others of which are nearing the end of their 30-year affordability terms today.
This analysis demonstrates that the risk of Housing Credit-financed developments converting to market rate at the end of their required rent affordability terms, also known as “rent restriction” terms, is very real in California’s supply-constricted housing markets—which include seven of the ten most expensive rental housing markets in the country.1
Patterns in conversion to market rate among first-generation Housing Credit developments also reveal lessons for how affordable housing stakeholders should assess risk in the existing stock moving forward—and what social and economic benefits may be at risk unless deliberate action is taken to preserve these developments as affordable housing.
ABOUT THE CALIFORNIA HOUSING PARTNERSHIPThe State created the California Housing Partnership Corporation (CHPC) in 1988 as a private nonprofit organization with a public mission: to help preserve California’s existing supply of affordable homes and to provide leadership on affordable housing policy and resource issues. CHPC is unique in combining on-the-ground technical assistance with advocacy leadership at the state and national level to increase the supply of affordable homes. Since 1988, CHPC has partnered with hundreds of nonprofit and government housing agencies statewide to lever-age more than $14 billion in public and private financing that resulted in the creation or pres-ervation of more than 70,000 homes affordable to low-income Californians.
FIGURE 1: CALIFORNIA NEEDS 1.54 MILLION MORE AFFORDABLE
RENTAL HOMES
Source: NLIHC analysis of 2014 PUMS data.
ABOUT THIS REPORT
2
Given California’s deficit of more than 1.5 million affordable homes (see Figure 1 below), it is clear that Housing Credit properties must be preserved, rehabilitated, and maintained as affordable rental housing for many years to come.

In 1986, Congress struggled mightily with the question of how to overhaul the nation’s tax system. Many observers then thought tax reform would not happen given the complexity of issues and interests and did not bother to engage deeply in the debate. Luckily for affordable housing advocates, a few more far-sighted advocates saw an opportunity to make lemonade out of lemons by proposing a new tax credit that would stimulate the production and preservation of affordable housing. This credit was proposed in part to replace tax benefits for producing multifamily rental housing that were being eliminated in the same bill.2 Some liberals balked at the idea, seeing it at best as a distraction and at worst as a betrayal, believing that what was really needed was for the federal government to make direct grants to nonprofit housing organizations—a valid policy perspective that was nonetheless politically infeasible in Congress at that moment.
As improbable as it seemed at the time, that proposal (with a few modifications) went on to become the law of the land, enabling the new-born Low Income Housing Tax Credit (Housing Credit) to take its first awkward steps in 1987. Writing in 2017, thirty years later, we can safely say we owe a debt to the architects of the
Housing Credit, which has become the largest source of federal funding to support the cost of developing homes that are affordable to low-income people. Since its creation as part of the Tax Reform Act of 1986, the program has helped create and rehabilitate nearly three million affordable rental homes across the country. This production has come through both the competitive 9% Housing Credit, which is allocated by the IRS on a per capita basis to each state, and the 4% Housing Credit. The 4% Housing Credit provides a subsidy of less than half the value as the 9% Housing Credit but has the advantage of having functioned as a virtually uncapped and non-competitive resource because developers obtain it through an allocation of private activity tax-exempt mortgage revenue bonds, which have historically not been competitive.
The Housing Credit has helped create and rehabilitate 3 million affordable rental homes across the country.
INTRODUCTION
3
9% CREDITS 4% CREDITS
• Covers approximately 70% of a development’s eligible basis (meaning all costs excluding land and most non-depreciable “soft” costs)
• Allocated on a competitive basis, according to State housing finance agency criteria that create incentives to meet policy objectives such as serving the neediest households, being located near key amenities, and efficiently using funds
• Covers approximately 30% of a develop-ment’s eligible basis
• Allocated on a non-competitive basis but always paired with Tax-Exempt Bonds, which can be competitive
• Typically paired with other competitive State and/or local funding sources that require or incentivize meeting various policy objectives

In California alone, the Housing Credit has contributed to the production and preservation of more than 335,000 homes in 4,200 developments. Thanks to new strategies to increase the use of the 4% Housing Credit, the volume of Housing Credit-financed developments has steadily increased to the point where in 2016 it helped create and preserve 25,000 affordable rental homes in the state.
While this level of production still falls well short of meeting the needs of California’s lowest income renters—most of whom currently spend more than half their incomes on rent3—no other housing program today can produce affordable rental homes on this scale. Other federal programs supporting affordable housing production in the private market have either been eliminated (e.g., subsidized mortgage programs) or have faced cuts or moratoriums that have reduced their impact (e.g., Section 8 Project-Based Rental Assistance contracts).
Further, although rental assistance from federal Housing Choice Voucher (HVC) program is more effective at relieving rent burdens for the lowest income households, this program is primarily a tenant-based subsidy and is thus limited as a tool to produce housing. The HCV program also
struggles to maintain funding levels through annual Congressional appropriations, whereas the Housing Credit has grown steadily each year primarily because it operates through the tax code. However, beginning in the late 1990s, developers learned that they can combine the strengths of both programs—deep income targeting and rent burden relief from the Housing Choice Voucher program and flexible capital subsidies from the Housing Credit—and have done so successfully in thousands of affordable homes in California.
The Housing Credit’s versatility has enabled it to be used not only for the production of new affordable homes but also for the revitalization of public housing; the refinancing and preservation of aging affordable developments; and the stabilization of low-income communities in the face of gentrification. Part of the Housing Credit’s success in California stems from California’s creation of a matching State Housing Credit in 1987. Funded at an initial $50 million per year and indexed for inflation, the CA Housing Credit is playing an important role in helping to complement the federal Housing Credit and to provide additional support for the production of affordable homes.
4
THE HOUSING CREDIT’S IMPACT IN CALIFORNIA
Half Moon Village - 160 affordable apartments for seniors in Half Moon Bay.
Photo courtsey of MidPen Housing

SOCIAL AND ECONOMIC IMPACTS
The benefits of Housing Credit-financed affordable homes for low-income households lucky enough to access them come first in the form of relief from homelessness or housing instability (if they face these challenges), and then as more income to spend on essentials such as food, health care, child enrichment, and transportation. According to national data, severely cost-burdened low-income households (who pay more than half their income on rent) spend 53 percent less on these essentials than their low-income counterparts who live in housing that is affordable to them.4 While the Housing Credit program does not guarantee that tenants will pay no more than 30% of income the way it does for Section 8 residents and some Housing Choice Voucher holders, it does generally reduce rent burdens to 30-40% of income.
In addition to helping families get by, research has shown that stable and affordable housing can also help low-income families, seniors and disabled people get ahead by generating advantages that accumulate over time —including higher academic performance and long-term earnings increases for children, and improvements to physical and mental health for both children and adults.5 Some of these benefits come by virtue of location, when affordable homes financed with Housing Credits help low-income families gain footholds in high-opportunity neighborhoods with good schools that offer the best chance at economic mobility.6 In other cases, Housing Credit developments act as a bulwark against displacement pressure in transit- and amenity-rich communities experiencing gentrification.
The Housing Credit is also an economic and environmental boon to California. Since its inception in 1987, the program has supported more than 375,000 jobs, created over $36 million in wages and business income, and generated over $14 billion in tax revenue.7 State and local initiatives to develop Housing Credit-financed affordable developments adjacent to transit,
and weatherize existing developments, are also critical tools in California’s fight against climate change and have produced significant reductions in greenhouse gas emissions.8 Contrary to not-in-my-backyard rhetoric, Housing Credit developments do not have a negative effect on nearby property values9 and can even have modest revitalizing effects in high-poverty neighborhoods.10
375,000 JOBS
$36 Million in WAGES & BUSINESS INCOME
$14 Billion in TAX REVENUE
5

During the first three years that Housing Credits were available (1987-1989), the State of California Treasurer’s Office allocated them on a non-competitive basis to applicants who met the basic threshold criteria specified in Internal Revenue Code (IRC) Section 42 and in regulations established by the California Tax Credit Allocation Committee (TCAC), which administers the program for the Treasurer’s Office. Since TCAC did not impose affordability terms longer than the federally required minimum of 15 years until 1990,11 many first-generation developments without other federal, state, or local financing carrying longer rent restriction terms were at particularly high risk of conversion 15 years after they began serving residents—that is, beginning in 2002.
OVERALL LOSS OF AFFORDABLE HOMES: TESTING PREDICTIONS AGAINST REALITY
In the 2001 report The Tax Credit Turns Fifteen, the California Housing Partnership estimated that 30% of rental homes in the state’s first generation of Housing Credit -financed developments were at high risk of conversion when their 15-year rent restrictions terms expired. This estimate proved to be roughly on target: 3,650 (25%) of affordable rental homes financed with Housing Credits between 1987 and 1989 were lost and are no longer affordable to low-income households in 2017.12
As shown in Chart 2, 10,822 of the 14,472 (75%) affordable homes in developments that received Housing Credits during the first three years of the program are still being operated as affordable housing today. Of those that remain affordable, 8,434 (78%) are still participating in the Housing Credit program. Of this subtotal, 4,983 are in developments that have been resyndicated with new Housing Credits versus 3,451 that have not yet resyndicated. Forty-five developments containing 2,388 homes (17%) remain affordable but have left the Housing Credit program. These affordable properties that have left the Housing Credit program typically maintain their affordable rents because they are required to do so by the terms of other public financing that requires longer rent restriction terms.
LOST SOCIAL BENEFITS
Had developments that converted instead remained affordable through present day, low-income households would have collectively saved approximately $145 million (in 2017 dollars) in the intervening years by avoiding paying market rental prices.13 These savings would have put food on the table, covered transportation costs, and functioned as a down payment on families’ long-term success.
In addition to the forgone rent savings, four converted developments that were targeted
6
Chart 2: Loss of Affordable Homes in First-Generation Housing Credit Developments
14,472
3,451 4,983 2,388 3,650
Lost
Affordable w/o Housing Credits
Affordable w/ Housing Credits (Resyndicated)
Affordable w/ Housing Credits (Not Resyndicated)
In Developments Allocated Housing Credits 1987-1989
Status in 2017
WHAT HAPPENED TO FIRST-GENERATION HOUSING CREDIT DEVELOPMENTS IN CALIFORNIA?

to families with children were located in areas identified as “high” or “highest” resource in TCAC’s opportunity maps, which are defined as being especially supportive of child development and long-term economic mobility based on neighborhood effects research.14 These areas are typically more affluent and contain few housing options that are affordable to low-income families. Developing affordable homes in these areas also costs up to $60,000 more per bedroom in California’s most markets. The loss of Housing Credit-financed developments in these areas represent an even greater harm to the community because they are so costly to replace.15
CONVERSION PATTERNS AND LESSONS FOR ASSESING RISK
More than three quarters (63 of 82) of first-generation Housing Credit properties that converted to market-rate housing, accounting for 88% of affordable homes lost due to conversion, were developed by profit-motivated entities in non-rural areas, typically without other public sources of funding that would have extended the rent affordability term beyond the minimum 15-year requirement. The following section
describes how these results compare with expectations from the 2001 risk assessment by analyzing conversion rates according to key variables.
NONPROFIT VS FOR-PROFIT DEVELOPERS
As predicted in the 2001 report, The Tax Credit Turns 15, an analysis of first-generation Housing Credit developments reveals a higher rate of loss for properties developed by for-profit entities than nonprofit developers because the latter are typically motivated by their missions of providing affordable homes to low-income families and individuals rather than seeking and taking profits for distribution to owners, investors and—in some cases—shareholders. As shown in Chart 3 below, 30% of affordable homes in developments created by for-profits converted, compared to a 13% conversion rate for those created and controlled by nonprofits. Excluding nonprofits with for-profit characteristics16 (often created by for-profits for the primary purpose of taking advantage of the exemption California provides nonprofits operating low-income housing from property taxes), the rate of conversion for nonprofit-controlled developments drops to just 4%.
7
Chart 3: Loss of Housing Credit-Financed Homes by Developer Ownership Type
Affordable w/o Housing Credits
WHAT HAPPENED TO FIRST-GENERATION HOUSING CREDIT DEVELOPMENTS IN CALIFORNIA?
Lost
Affordable w/o Housing Credits
Affordable w/ Housing Credits (Resyndicated)
Affordable w/ Housing Credits (Not Resyndicated)
In Developments Allocated Housing Credits 1987-1989
Status in 2017 Status in 2017
NONPROFIT OWNEDFOR-PROFIT OWNED
10,421
3,137
1,771
3,662
1,851
4,051 1,321
1,600
617513
In Developments Allocated Housing Credits 1987-1989
Affo
rdab
le H
omes
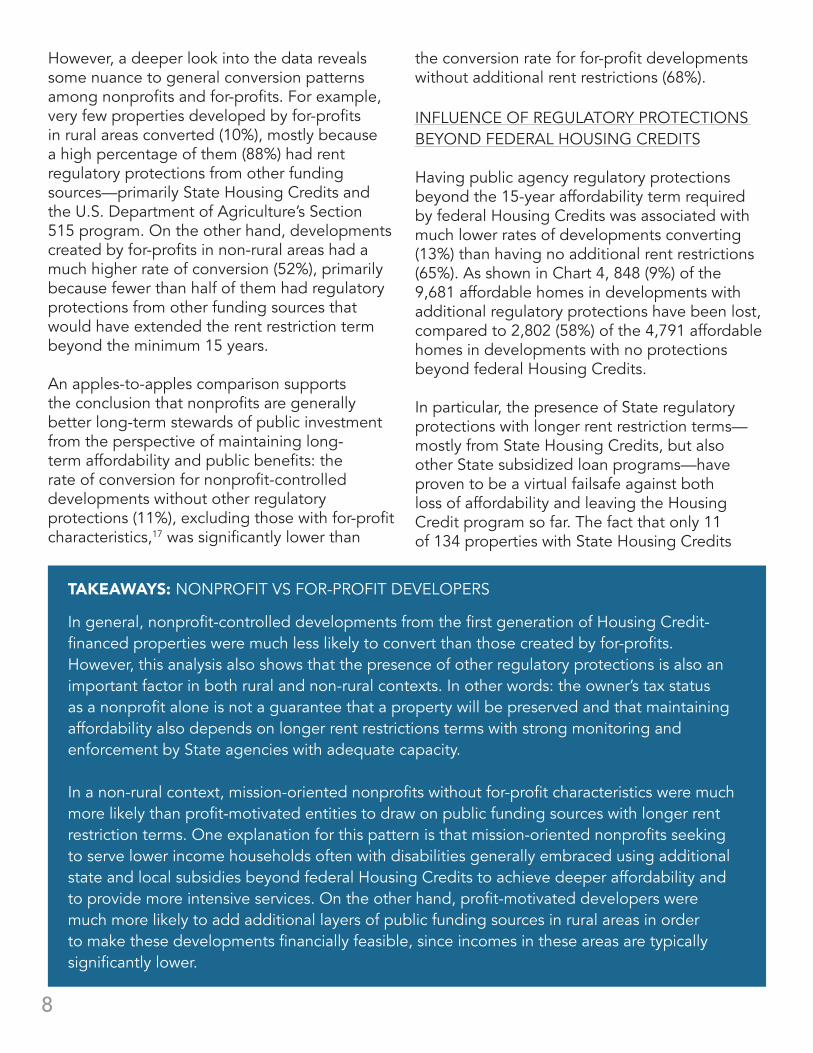
However, a deeper look into the data reveals some nuance to general conversion patterns among nonprofits and for-profits. For example, very few properties developed by for-profits in rural areas converted (10%), mostly because a high percentage of them (88%) had rent regulatory protections from other funding sources—primarily State Housing Credits and the U.S. Department of Agriculture’s Section 515 program. On the other hand, developments created by for-profits in non-rural areas had a much higher rate of conversion (52%), primarily because fewer than half of them had regulatory protections from other funding sources that would have extended the rent restriction term beyond the minimum 15 years.
An apples-to-apples comparison supports the conclusion that nonprofits are generally better long-term stewards of public investment from the perspective of maintaining long-term affordability and public benefits: the rate of conversion for nonprofit-controlled developments without other regulatory protections (11%), excluding those with for-profit characteristics,17 was significantly lower than
In general, nonprofit-controlled developments from the first generation of Housing Credit-financed properties were much less likely to convert than those created by for-profits. However, this analysis also shows that the presence of other regulatory protections is also an important factor in both rural and non-rural contexts. In other words: the owner’s tax status as a nonprofit alone is not a guarantee that a property will be preserved and that maintaining affordability also depends on longer rent restrictions terms with strong monitoring and enforcement by State agencies with adequate capacity.
In a non-rural context, mission-oriented nonprofits without for-profit characteristics were much more likely than profit-motivated entities to draw on public funding sources with longer rent restriction terms. One explanation for this pattern is that mission-oriented nonprofits seeking to serve lower income households often with disabilities generally embraced using additional state and local subsidies beyond federal Housing Credits to achieve deeper affordability and to provide more intensive services. On the other hand, profit-motivated developers were much more likely to add additional layers of public funding sources in rural areas in order to make these developments financially feasible, since incomes in these areas are typically significantly lower.
the conversion rate for for-profit developments without additional rent restrictions (68%).
INFLUENCE OF REGULATORY PROTECTIONS BEYOND FEDERAL HOUSING CREDITS
Having public agency regulatory protections beyond the 15-year affordability term required by federal Housing Credits was associated with much lower rates of developments converting (13%) than having no additional rent restrictions (65%). As shown in Chart 4, 848 (9%) of the 9,681 affordable homes in developments with additional regulatory protections have been lost, compared to 2,802 (58%) of the 4,791 affordable homes in developments with no protections beyond federal Housing Credits.
In particular, the presence of State regulatory protections with longer rent restriction terms—mostly from State Housing Credits, but also other State subsidized loan programs—have proven to be a virtual failsafe against both loss of affordability and leaving the Housing Credit program so far. The fact that only 11 of 134 properties with State Housing Credits
8
TAKEAWAYS: NONPROFIT VS FOR-PROFIT DEVELOPERS

9
TAKEAWAYS: IMPACT OF ADDITIONAL REGULATORY PROTECTIONS
requiring commitments to 30-year regulatory protections are no longer affordable today is on the one hand a victory; on the other hand, it is a clear demonstration that the looser approach to regulating first-generation Housing Credit developments contributed to these losses.18 The presence of rent restrictions imposed in return for mortgage subsidies provided through the United States Department of Agriculture’s Section 515 Program is an even better predictor of the retention of affordability than State restrictions. Although ten of the 19 first generation Housing Credit properties that also participated in the Section 515 left the Housing Credit program after 15 years, all of them are still operated as affordable housing today—even if some are theoretically at high risk of converting due to the owners’ right to prepay their USDA
mortgages. Properties with local or unknown rent restrictions were more likely to convert than those with State or USDA financing, but the rate of loss (40%) was still much lower than the conversion rate for properties with no additional regulatory protections (65%).
The absence of additional regulatory protections also appears to explain why (1) mixed-income properties had higher rates of loss when compared to 100 percent affordable properties; (2) non-targeted properties converted more often compared to large-family, senior, and single-room occupancy developments; and (3) for-profit developments in non-rural areas had much higher rates of loss than those in rural areas.
Chart 4: Loss of Affordable Homes by Presence of Additional Regulatory Protections
Lost
Affordable w/o Housing Credits
Affordable w/ Housing Credits (Resyndicated)
Affordable w/ Housing Credits (Not Resyndicated)
In Developments Allocated Housing Credits 1987-1989
Status in 2017 In Developments Allocated Housing Credits 1987-1989
Status in 2017
No Additional Regulatory Protections
Additional Regulatory Protections in Place
9,681
1,162819
2,8024,791
3,443
3,821
1,569
848
Affo
rdab
le H
omes
As anticipated in the risk assessment in the 2001 report, the Tax Credit Turns 15, the presence of additional regulatory protections was highly correlated with first-generation Housing Credit properties in California remaining affordable beyond the required 15-year term—and was probably the single largest factor explaining different rates of loss across geographies, nonprofit status of developers, and population served.

WHAT IS AT RISK OF CONVERSION TODAY?To assess conversion risk in the remaining first generation (1987-1989) and second generation (post-1990) of Housing Credit-financed developments with 30-year rent restrictions expiring 2018-2023, the California Housing Partnership used the following rating categories and criteria that draw on lessons revealed by conversion patterns among the first generation of Housing Credit properties in California.19
The good news is that using the above criteria, the vast majority of the existing Housing Credit portfolio in California is not at serious risk of conversion in the next five years. Of the approximately 4,100 developments and 332,000 homes remaining in the statewide Housing Credit portfolio, only 45 developments (1.1%) containing 1,568 affordable homes (0.5%) are currently at high or very high risk of conversion over the next one to five years.20
These developments at high or very high risk of conversion have the following characteristics:
• They are concentrated in Los Angeles County (14 developments, 462 affordable homes), the San Francisco Bay Area (12 developments, affordable 492 homes), and the Central Valley (nine developments, 274 affordable homes)
• They primarily serve families (24 developments, 572 affordable homes), seniors (8 developments, 287 affordable homes), or are non-targeted (11 developments, 504 affordable homes)
Eighty-six properties containing 6,398 affordable homes are at moderate risk of converting, and 3,995 properties containing 324,260 affordable homes are at low risk of converting.
VERY HIGH RISK• Regulatory agreement ends in less than
365 days; and
• Property is not owned by a large, stable, mission-driven nonprofit developer; and
• Property does not have overlapping HUD or USDA financing that extends affordability beyond 365 days.
HIGH RISK• Regulatory Agreement Ends in 366 days
to 1827 days from today (1-5 years); and
• Property is not owned by a large, stable non-profit, mission driven developer; and
• Property does not have overlapping HUD or USDA financing that extends affordability beyond 5 years.
MODERATE RISK• Regulatory Agreement Ends in 1828 days
to 3650 days from today (5-10 years); and
• Property is not owned by a large, stable non-profit, mission driven developer; and
• Property does not have overlapping HUD or USDA financing that extends affordability beyond 10 years.
LOW RISK• Regulatory Agreement Extends beyond
3650 days from today (more than 10 years); or
• Property is owned by a large, stable non-profit, mission driven developer; or
• Property has overlapping HUD or USDA financing that extends affordability beyond 10 years.
10

SOCIAL BENEFITS AT RISK
Losing properties identified as high or very high risk of conversion would represent a significant loss to residents and the surrounding communities. Low-income families and individuals living in these properties would lose approximately $6.8 million in annual savings that they currently enjoy by virtue of living in housing that is affordable to them.21 Furthermore, communities already suffering from large deficits of affordable homes will see these deficits grow larger, further imperiling their ability to provide housing for seniors on fixed incomes, low-income workers, and disabled persons.
The location of these at-risk developments is also a policy and planning concern. For example, of the 492 affordable homes at high or very high risk of conversion in the San
Francisco Bay Area, 352 (72%) of them are located in census tracts identified by the UC Berkeley Urban Displacement Project as being places where low-income households are either already experiencing displacement in the face of gentrification, or where they are at risk of displacement.22
Finally, two at-risk developments serving large families with children are located in areas identified as “high” resource on TCAC’s opportunity maps. Losing these developments would not only mean a loss of affordability, but also a loss at a chance for low-income children to grow up in resource-rich neighborhoods most supportive of their development and long-term economic success. Furthermore, as previously noted, replacing these developments will cost up to $60,000 more per bedroom than building them elsewhere, if they can be built at all.
11

GENERAL RECOMMENDATIONS
1. The State should prioritize access to the Housing Credit and related resources for large, stable, mission-driven nonprofits with successful track records owning and operating Housing Credit-financed properties because history has shown that these types of owners are less likely to convert developments to market rate when rent affordability restrictions expire.
2. The State should use the passage of Assembly Bill 1521 to make its monitoring and enforcement of rent affordability restriction terms even more rigorous.
RECOMMENDATIONS TO PRESERVE HOUSING CREDIT-FINANCED PROPERTIES AT RISK OF CONVERSION
3. Provide acquisition funding to mission-driven nonprofits to preserve at-risk properties: Given the results of our analysis that mission-driven nonprofits are much more likely to maintain affordability over the long term, both the State of California and local governments should prioritize make more funding available for mission-driven nonprofits to acquire properties at high or very high risk of converting to
market rate in the next 1-5 years. Because statistical and anecdotal data reveals that mission-driven nonprofits—even the highest capacity ones with access to credit—are routinely outbid in sales of older Housing Credit properties by institutional investors and Real Estate Investment Trusts who are able to offer higher purchase prices due to their operating models, for this funding to be effective it needs to provide more flexible terms including higher loan-to-value ratios underwritten against the post-rehab value of the property and be approvable in a very short period of time.23 Some key differences between profit-motivated purchases and mission-driven nonprofit purchasers are shown in Table 5 below:
4. Prioritize preserving properties in gentrifying and high-resource areas: Local government agencies should prioritize preserving at-risk properties located in gentrifying and transit-accessible areas, as well as family-targeted properties in high or highest resource areas. This approach will help ensure that limited resources available for preservation achieve the dual goal of maintaining housing affordability and preserving access to resource- and amenity-rich neighborhoods increasingly out of reach for low-income Californians.
12
For-Profit Purchasers Mission-Driven Nonprofits
Hold Period/Disposition Short to mid-term hold with focus on cash flow and re-sale
Long-term ownership with no plans to sell
Capital Improvements Minimal with focus on finishes and code requirements to operate
Significant upgrades and restoration of structures and amenities
Operating Expenses Bare minimum to operate Includes services and living wages
Rent Restrictions Opt-out whenever profitable Renew whenever possible
Table 5: Comparison of Purchaser Strategies
TURNING LESSONS INTO ACTION

5. Actively track preservation risks: Local governments should develop the capacity to proactively track and monitor the risk of conversion to existing Housing Credit properties as well as to enforce local and state rent affordability restrictions in court. This should involve hiring or designating a Preservation Coordinator with sufficient time and experience to undertake the following activities: a. Analyze the risk of conversion to the highest risk properties on an annual basis; b. Register with State HCD as a Qualified Preservation Entity (QPE) to receive notices of properties facing a potential loss of affordability; and c. Develop a relationship with owners and managers of at-risk properties to obtain early
13
warning of potential conversions and to explore preservation options either through extending rent regulatory terms or sale to a QPE; d. Develop close relationships with nonprofit QPEs, bring them into negotiate with owners of at-risk properties open to selling, and be ready to assist them with acquisition and gap financing on short notice.
6. Provide preservation technical assistance to low-income tenants: Local governments should provide technical assistance to tenants by providing legal services, training, and organizing support to tenants living in at-risk properties; on conversations with owners of at-risk properties.
ENDNOTES
1 Salviati, Chris. 2017. “Apartment List National Rent Report.” November 1. Website: https://www.apartmentlist.com/rentonomics/national-rent-data/2 Khadduri, Jill, Carissa Climaco, and Kimberly Burnett. 2012. What Happens to Low-Income Housing Tax Credit Properties at Year 15 and Beyond? Abt Associates Inc. in partnership with VIVA Consulting. Prepared for U.S. Department of Housing and Urban Development.
3 California Housing Partnership. 2016. Confronting California’s Rent and Poverty Crisis: A Call for State Rein-vestment in Affordable Homes.
4 Joint Center for Housing Studies of Harvard Univer-sity. The State of the Nation’s Housing 2017. Harvard Joint Center, State of the Nation’s Housing.
5 See, for example: How Housing Matters, a clear-inghouse of research on housing’s benefits supported by the MacArthur Foundation and the Urban Institute: https://howhousingmatters.org; a 2017 report on the connection of housing and health from the Bipartisan Policy Center called Building the Case: Low-Income Housing Tax Credits and Health, available at https://bipartisanpolicy.org.
6 For research on how neighborhoods shape out-comes for recipients of housing assistance, see for exam-ple: Chetty, Hendren, and Katz. 2015. The Effects of Expo-sure to Better Neighborhoods on Children: New Evidence
from the Moving to Opportunity Experiment. The Equality of Opportunity Project. May; and Sanbonmatsu, et al. 2011. Moving to Opportunity for Fair Housing Demonstra-tion Program: Final Impacts Evaluation. Prepared for: U.S. Department of Housing and Urban Development, Office of Policy Development & Research7 National Association of Home Builders, as reported in National Council of State Housing Agencies 2015 Fact-book.
8 See, for example, the State’s Affordable Housing and Sustainable Communities (AHSC) program, adminis-tered by the California Strategic Growth Council. Website: http://sgc.ca.gov/Grant-Programs/AHSC-Program.html
9 Young, Cheryl. 2016. There Doesn’t Go the Neigh-borhood: Low-Income Housing Has No Impact on Nearby Home Values. Trulia.
10 Ellen, et al. 2016. Poverty Concentration and the Low Income Housing Tax Credit: Effects of Siting and Tenant Composition. Journal of Housing Economics. 34, 49-59.
11 TCAC did impose 30-year affordability terms on developments that received allocations of State Housing Credits, which worked in tandem with federal Housing Credits.

12 Results based on data provided by TCAC, the Cal-ifornia Housing Partnership preservation database, internet research, and phone calls to properties. In addition, this total does not include 116 homes in single-family develop-ments with 1-4 units, which were assumed to convert after 15 years because they were all developed by for-profit en-tities. Twenty-one (18%) of these homes are still affordable today, although they remain at high risk of conversion. Pre-serving these developments as affordable will be difficult because of the lack of economy of scale.
13 This estimate uses unit size-adjusted HUD-desig-nated Fair Market Rents (FMR) as a proxy for the “market price” that a low-income household would reasonably pay (because FMRs are set significantly lower than the top of the market), and assumes that all restricted rents are set at the unit size-adjusted affordable rent for households earning 60 percent of area median income—the minimum level of affordability required for assisted units in pre-1990 Housing Credit developments in California.
14 TCAC, in partnership with the California Depart-ment of Housing and Community Development (HCD), oversaw the creation of these maps in 2017. They will be used to inform efforts within State housing funding pro-grams to increase access to higher resource neighborhoods for low-income families with children. For more information and the methodology behind the maps, see the TCAC website: http://www.treasurer.ca.gov/ctcac/opportunity.asp
15 Rinzler, Dan. 2017. “New Tax Credit Regs Make Progress, More to be Done.” California Housing Partner-ship. Website: https://chpc.net/new-tax-credit-regs-make-progress-done/
16 These organizations were identified based on board composition, board and staff compensation com-pared with responsibilities, staff capacity to adequately maintain their portfolios, as well as the frequency with which they engaged in joint ventures with for-profits but did not play a significant role in development or operation of the properties.
17 Again, these nonprofits were often created by for-profits for the primary purpose of taking advantage of California’s property tax exemption for nonprofits operating low-income housing.
18 For example, owners of first-generation properties that were allocated federal and State Housing Credits prior to 1990 were not required to sign regulatory agreements. In addition, several of these converted properties were foreclosed upon, triggering an exit from the Housing Credit program.
19 The California Housing Partnership is in the process of gathering and incorporating data on State programs into its risk analysis, but this data was not available at the time
of report preparation. In addition, developments allocat-ed Housing Credits from 1987 to 1989 with no additional regulatory protections were not more likely to convert after 15 years if restricted rents were significantly below local market prices for rental housing. However, the California Housing Partnership will monitor this relationship moving forward among developments that were allocated Housing Credits after 1989—and if a clear pattern emerges, it will incorporate local rental housing market dynamics into its risk methodology.
20 The average number of homes per development is artificially depressed by the presence of several at-risk single-family rental properties with very few homes.
21 Savings are calculated as the difference between Fair Market Rent (FMR) and the restricted rent, assumed to be set at 60% AMI for all pre-1990 and post-1990 4% credit developments, and at 50% AMI for post-1990 9% credit developments. All developments at high or very high risk of conversion were allocated Housing Credits between 1987 and 1992.
22 UC Berkeley Urban Displacement Project. 2017. Website: http://www.urbandisplacement.org/map/sf23 CBRE Affordable Housing. 2017.
14
ACKNOWLEDGEMENTS
Senior Policy Analyst Dan Rinzler (Lead Author)Housing Data Analyst Danielle MazzellaPresident & CEO Matt SchwartzSouthern California Director, Paul BeesemyerDirector of Operations Chris Maxwell (graphic design)
Special thanks to the California Tax Credit Allocation Committee, National Housing Law Project, and the National Low Income Housing Coalition for their contributions to this report.


![IOWA STATE KANSAS KANSAS STATE MISSOURI ...Duck Commander 300 Race [30 turns] Wells Fargo 500 Race [50 turns] Sea World 450 Race [45 turns] American General 250 Race [ 25 turns ] 1970](https://img.pdfslide.us/doc/110x75/5fadcc24c30c205d663592ef/iowa-state-kansas-kansas-state-missouri-duck-commander-300-race-30-turns-wells.jpg)