Embed Size (px)
Citation preview
The Tangle of Growth: A Dynamic Analysis
Growth, Sprawl, Transportation, Housing, Farm Policy and Wages
Robert E. Powell, Ph.D., MBA [email protected]
April 26, 2001 (revised 01/06/03)

Bob Powell, Ph.D., MBA • • Continuous Improvement Associates © 2003 • • [email protected] • • 719 599-0977 • • Rev 01/06/03 • • page 2
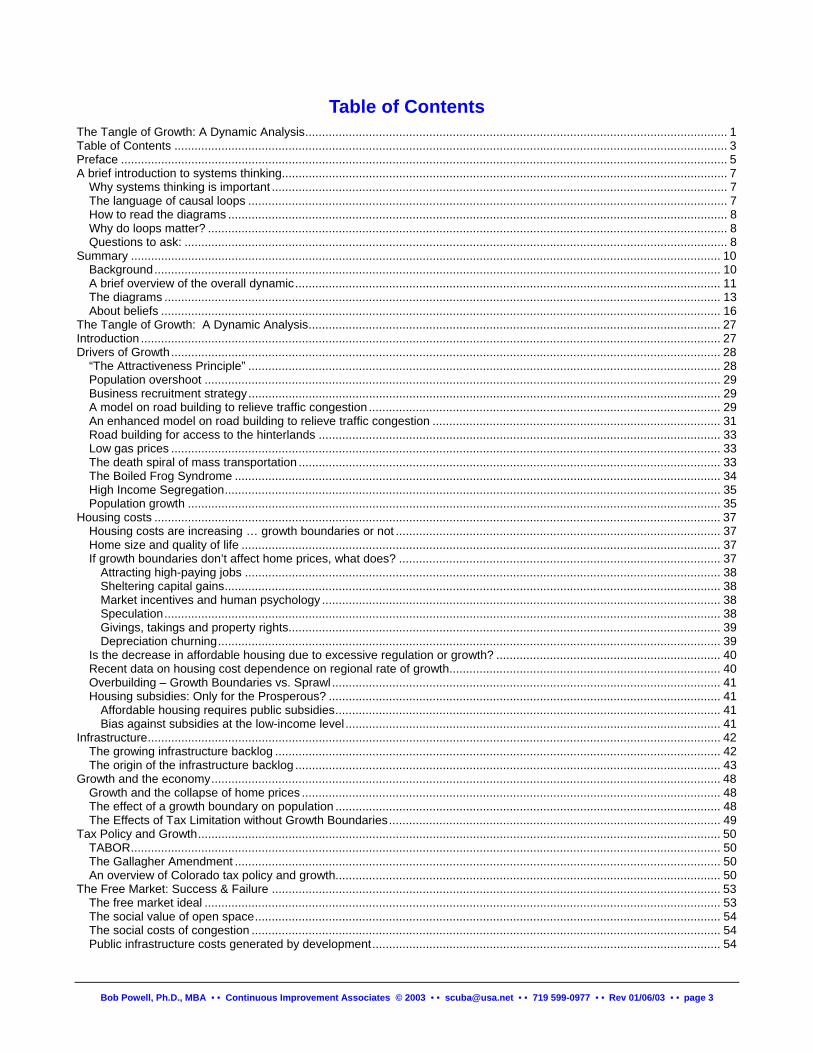
Table of Contents The Tangle of Growth: A Dynamic Analysis.............................................................................................................................. 1 Table of Contents ..................................................................................................................................................................... 3 Preface ..................................................................................................................................................................................... 5 A brief introduction to systems thinking..................................................................................................................................... 7
Why systems thinking is important ........................................................................................................................................ 7 The language of causal loops ............................................................................................................................................... 7 How to read the diagrams ..................................................................................................................................................... 8 Why do loops matter? ........................................................................................................................................................... 8 Questions to ask: .................................................................................................................................................................. 8
Summary ................................................................................................................................................................................ 10 Background......................................................................................................................................................................... 10 A brief overview of the overall dynamic............................................................................................................................... 11 The diagrams ...................................................................................................................................................................... 13 About beliefs ....................................................................................................................................................................... 16
The Tangle of Growth: A Dynamic Analysis........................................................................................................................... 27 Introduction ............................................................................................................................................................................. 27 Drivers of Growth.................................................................................................................................................................... 28
“The Attractiveness Principle” ............................................................................................................................................. 28 Population overshoot .......................................................................................................................................................... 29 Business recruitment strategy............................................................................................................................................. 29 A model on road building to relieve traffic congestion ......................................................................................................... 29 An enhanced model on road building to relieve traffic congestion ...................................................................................... 31 Road building for access to the hinterlands ........................................................................................................................ 33 Low gas prices .................................................................................................................................................................... 33 The death spiral of mass transportation .............................................................................................................................. 33 The Boiled Frog Syndrome ................................................................................................................................................. 34 High Income Segregation.................................................................................................................................................... 35 Population growth ............................................................................................................................................................... 35
Housing costs ......................................................................................................................................................................... 37 Housing costs are increasing … growth boundaries or not ................................................................................................. 37 Home size and quality of life ............................................................................................................................................... 37 If growth boundaries don’t affect home prices, what does? ................................................................................................ 37
Attracting high-paying jobs .............................................................................................................................................. 38 Sheltering capital gains.................................................................................................................................................... 38 Market incentives and human psychology ....................................................................................................................... 38 Speculation...................................................................................................................................................................... 38 Givings, takings and property rights................................................................................................................................. 39 Depreciation churning...................................................................................................................................................... 39
Is the decrease in affordable housing due to excessive regulation or growth? ................................................................... 40 Recent data on housing cost dependence on regional rate of growth................................................................................. 40 Overbuilding – Growth Boundaries vs. Sprawl .................................................................................................................... 41 Housing subsidies: Only for the Prosperous? ..................................................................................................................... 41
Affordable housing requires public subsidies................................................................................................................... 41 Bias against subsidies at the low-income level ................................................................................................................ 41
Infrastructure........................................................................................................................................................................... 42 The growing infrastructure backlog ..................................................................................................................................... 42 The origin of the infrastructure backlog ............................................................................................................................... 43
Growth and the economy........................................................................................................................................................ 48 Growth and the collapse of home prices ............................................................................................................................. 48 The effect of a growth boundary on population ................................................................................................................... 48 The Effects of Tax Limitation without Growth Boundaries................................................................................................... 49
Tax Policy and Growth............................................................................................................................................................ 50 TABOR................................................................................................................................................................................ 50 The Gallagher Amendment ................................................................................................................................................. 50 An overview of Colorado tax policy and growth................................................................................................................... 50
The Free Market: Success & Failure ...................................................................................................................................... 53 The free market ideal .......................................................................................................................................................... 53 The social value of open space........................................................................................................................................... 54 The social costs of congestion ............................................................................................................................................ 54 Public infrastructure costs generated by development........................................................................................................ 54
Bob Powell, Ph.D., MBA • • Continuous Improvement Associates © 2003 • • [email protected] • • 719 599-0977 • • Rev 01/06/03 • • page 3
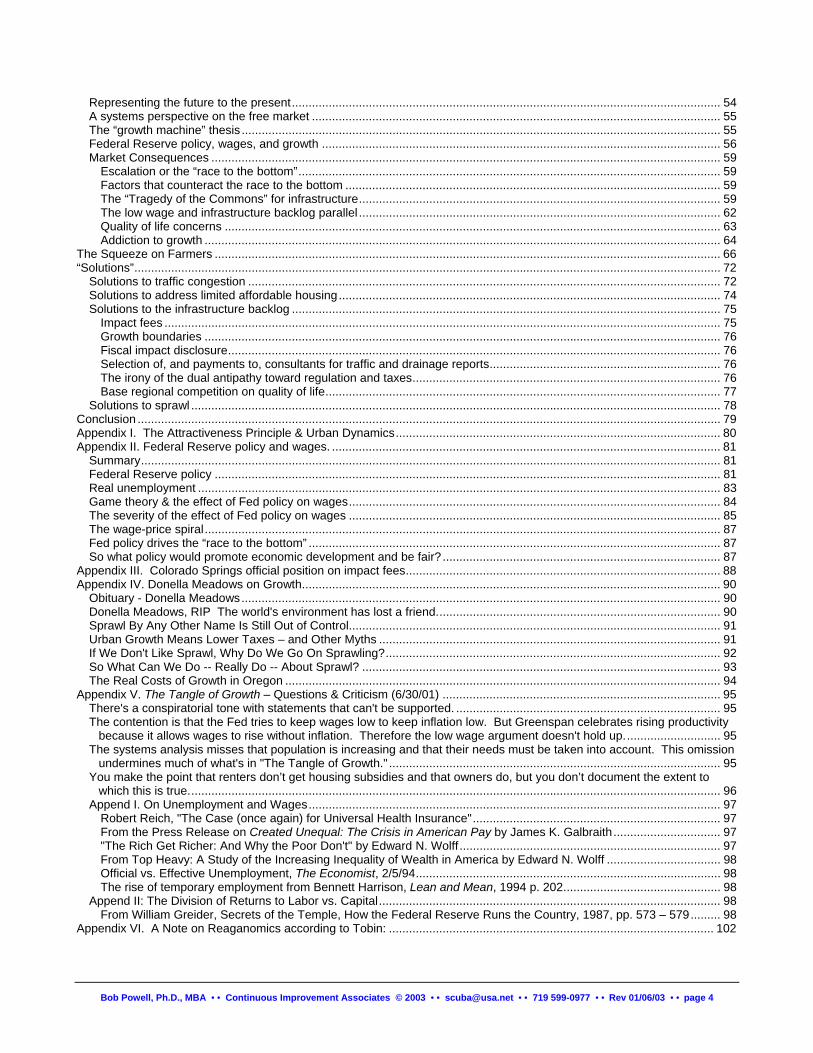
Representing the future to the present................................................................................................................................ 54 A systems perspective on the free market .......................................................................................................................... 55 The “growth machine” thesis ............................................................................................................................................... 55 Federal Reserve policy, wages, and growth ....................................................................................................................... 56 Market Consequences ........................................................................................................................................................ 59
Escalation or the “race to the bottom”.............................................................................................................................. 59 Factors that counteract the race to the bottom ................................................................................................................ 59 The “Tragedy of the Commons” for infrastructure............................................................................................................ 59 The low wage and infrastructure backlog parallel ............................................................................................................ 62 Quality of life concerns .................................................................................................................................................... 63 Addiction to growth .......................................................................................................................................................... 64
The Squeeze on Farmers ....................................................................................................................................................... 66 “Solutions”............................................................................................................................................................................... 72
Solutions to traffic congestion ............................................................................................................................................. 72 Solutions to address limited affordable housing.................................................................................................................. 74 Solutions to the infrastructure backlog ................................................................................................................................ 75
Impact fees ...................................................................................................................................................................... 75 Growth boundaries .......................................................................................................................................................... 76 Fiscal impact disclosure................................................................................................................................................... 76 Selection of, and payments to, consultants for traffic and drainage reports..................................................................... 76 The irony of the dual antipathy toward regulation and taxes............................................................................................ 76 Base regional competition on quality of life...................................................................................................................... 77
Solutions to sprawl .............................................................................................................................................................. 78 Conclusion .............................................................................................................................................................................. 79 Appendix I. The Attractiveness Principle & Urban Dynamics................................................................................................. 80 Appendix II. Federal Reserve policy and wages. .................................................................................................................... 81
Summary............................................................................................................................................................................. 81 Federal Reserve policy ....................................................................................................................................................... 81 Real unemployment ............................................................................................................................................................ 83 Game theory & the effect of Fed policy on wages............................................................................................................... 84 The severity of the effect of Fed policy on wages ............................................................................................................... 85 The wage-price spiral.......................................................................................................................................................... 87 Fed policy drives the “race to the bottom” ........................................................................................................................... 87 So what policy would promote economic development and be fair? ................................................................................... 87
Appendix III. Colorado Springs official position on impact fees.............................................................................................. 88 Appendix IV. Donella Meadows on Growth............................................................................................................................. 90
Obituary - Donella Meadows............................................................................................................................................... 90 Donella Meadows, RIP The world's environment has lost a friend..................................................................................... 90 Sprawl By Any Other Name Is Still Out of Control............................................................................................................... 91 Urban Growth Means Lower Taxes – and Other Myths ...................................................................................................... 91 If We Don't Like Sprawl, Why Do We Go On Sprawling?.................................................................................................... 92 So What Can We Do -- Really Do -- About Sprawl? ........................................................................................................... 93 The Real Costs of Growth in Oregon .................................................................................................................................. 94
Appendix V. The Tangle of Growth – Questions & Criticism (6/30/01) ................................................................................... 95 There's a conspiratorial tone with statements that can't be supported. ............................................................................... 95 The contention is that the Fed tries to keep wages low to keep inflation low. But Greenspan celebrates rising productivity
because it allows wages to rise without inflation. Therefore the low wage argument doesn't hold up............................. 95 The systems analysis misses that population is increasing and that their needs must be taken into account. This omission
undermines much of what's in "The Tangle of Growth." ................................................................................................... 95 You make the point that renters don’t get housing subsidies and that owners do, but you don’t document the extent to
which this is true............................................................................................................................................................... 96 Append I. On Unemployment and Wages........................................................................................................................... 97
Robert Reich, "The Case (once again) for Universal Health Insurance".......................................................................... 97 From the Press Release on Created Unequal: The Crisis in American Pay by James K. Galbraith................................ 97 "The Rich Get Richer: And Why the Poor Don't" by Edward N. Wolff .............................................................................. 97 From Top Heavy: A Study of the Increasing Inequality of Wealth in America by Edward N. Wolff .................................. 98 Official vs. Effective Unemployment, The Economist, 2/5/94........................................................................................... 98 The rise of temporary employment from Bennett Harrison, Lean and Mean, 1994 p. 202............................................... 98
Append II: The Division of Returns to Labor vs. Capital...................................................................................................... 98 From William Greider, Secrets of the Temple, How the Federal Reserve Runs the Country, 1987, pp. 573 – 579......... 98
Appendix VI. A Note on Reaganomics according to Tobin: ................................................................................................. 102
Bob Powell, Ph.D., MBA • • Continuous Improvement Associates © 2003 • • [email protected] • • 719 599-0977 • • Rev 01/06/03 • • page 4
Preface I know, I know. This paper is too long for anyone to ever read and the diagrams are too complicated. I didn’t mean to write a book. Really … I didn’t. In defense of the length and complication, there are lots of issues involved, it’s a complex sub-ject; and the diagrams tell the stories of what’s happening in a way that’s appropriate and efficient … once you become familiar with the language and how to read them. So please bear with it.
Developing this material has been challenging, to say the least ... challenging in many ways. As noted, one challenge is that the issues are complicated; in fact, I began writing this paper simply as a way to identify and reflect on the many issues that are raised in discussions of growth and sprawl. I couldn’t keep them straight in my head. The second challenge has been that, in looking at the issues, I have had to question many of the things I’ve believed. Some of the points of view expressed in this paper are counterintuitive and outside the current paradigm. I rejected some of them myself at first. I found I was sur-prised, even shocked, by many of the things I came to understand while working on this paper, and so I will not be surprised if others reject some of the assertions made here.
And finally, because some of the understandings to which I came are not considered “okay” to talk about, I found myself wanting to reject them as too politically sensitive. In the end it got so complicated to figure out what was okay to say and what was not, that I said, “The heck with it.” So what you have here is unexpurgated, not the “politically correct” version.
One of the things I’ve come to understand in studying systems thinking is that belief, or ideology, tends to trump reason and data most of the time. Beliefs are so powerful that, for example, we continue to think we can solve the traffic congestion problem by building roads, even though we can look at other, larger cities and see that has never worked. Or we think we can continue current policy and halt the destruction of family farms, even as we continue to see them fail.
“Insanity: Doing the same thing over and over again and expecting different results."
Albert Einstein (1879 - 1955)
The late Donella Meadows wrote of her difficulty in getting system dynam-ics concepts across to the public in her columns. The paper in the System Dynamics Review is based on her invited address to the 1988 System Dy-namics Conference.1 She noted about one of her columns:
That column, written shortly after the 1987 stock market crash, was one of the most unpopular I ever produced. Many papers did not print it. I learned a les-son from that – you can’t challenge the prevailing paradigm too directly. But you can challenge it indirectly, bit by bit, again and again, presenting more and more evidence. Thomas Kuhn, who wrote the seminal book about para-digms that has inspired many system dynamicists,2 says that what ultimately causes a paradigm to change is the accumulation of anomalies – observations that do not fit into and cannot be explained by the prevailing paradigm. The anomalies have to be presented over and over, because there is a social de-termination not to see them. Challenging a paradigm is not part-time work. It is not sufficient to make your point once and then blame the world for not getting it. The world has a vested interest in not getting it; the point has to be made patiently and repeatedly, day after day after day.
Her words make it clear that there’s a lot more to be done than making points in a paper such as this, which has been seen as more appropriate for an academic than for a popular audience.
As I worked on this paper, I began to see some of the relationships between a systems thinking structures (archetypes) that affect the behavior of parts of theable to weave them together, at least tentatively, into an overall framework tha
Bob Powell, Ph.D., MBA • • Continuous Improvement Associates © 2003 • • scuba@us
1 Donella Meadows, “System dynamics meets the press”, System Dynamics Review, 5, W
refers is included in the section on “A systems perspective of the free market.” 2 Kuhn, T. S., The structure of Scientific Revolutions, Univ. of Chicago Press, 1970
Insanity in individuals is something rare – but in groups, parties, nations and
epochs, it is the rule. Friedrich Nietzsche (1844 - 1900)
t
"The greatest leverage for improvement lies not in changing the way we work,
but how we think."
W. Edwards Deming
few sys exp
a.net
inte
"Our problems are not so much in finding new ideas as in escaping from old ones."
John Maynard Keynes
of the issues … to identify several basic tem. To my surprise, I believe I’ve been lains the major dynamics of growth.
• • 719 599-0977 • • Rev 01/06/03 • • page 5
r 1989, pp. 69-80. The column to which she
In the editing I’ve found many of things in early drafts that were incorrect or incomplete, and I expect I will continue to find other things that are wrong. I expect you will, too. I will appreciate being informed of the errors you find.
This paper has been a much greater investment than I ever intended to make. I guess I’ve done so for three reasons:
• In addition to important environmental and sustainability issues, many lives are negatively affected by the prob-lems related to growth and the zero-sum-games that promote uneven prosperity at best.
"Why isn't system dynamics spreading like wildfire?”
“We live in institutions whose fundamental way of being is antithetical to the tools ...
other than that no big problem."
Peter Senge - author of The Fifth Discipline 1996 Power of Systems Thinking Conference
• The systems approach is the way to think about com-plex problems. Despite its power, it has not caught on as is warranted. Perhaps, by applying it to an issue that people care deeply about, it will promote its use for ad-dressing other societal and organizational issues.
• Yes, it’s a mess; but it’s a really fascinating mess.
"We live in an era of massive institutional failure."
Dee Hock - Founder and CEO Emeritusof VISA USA and VISA International
1996 Systems Thinking in Action Conference
Bob Powell Colorado Springs, CO
Bob Powell, Ph.D., MBA • • Continuous Improvement Associates © 2003 • • [email protected] • • 719 599-0977 • • Rev 01/06/03 • • page 6
A brief introduction to systems thinking
Why systems thinking is important What is systems thinking?
Seeking to understand system behavior by examining “the whole” … instead of by analyzing the parts.
Societies, organizations, and persons are systems. The essence of the sys-tems approach is to understand the “structure” of the system by understand-ing the relationships and interactions between its parts.
The premise, a key principle of system dynamics, is that the behavior of the system is determined primarily by its internal structure, not by external influences. It’s not that external influences do not affect system behavior, it’s that first we look for how the system itself may be creating (or will create) behavior. When an external influence is considered, the premise is that the system’s response to that external influence is determined by its internal structure, not by the external influence. “Struc-ture” is used in a very specific way in this context; it consists of the influences of system variable on each other. For exam-ple, all else being equal, increasing “travel time” decreases the “attractiveness of driving.”
Because everything is connected to everything else, we can’t simply “map or model the system.” Determining the boundary of the system is a major, but necessary, challenge. We establish a system boundary by defining the problem to be ad-dressed, not the system to be understood.
understandstructure
understandbehavior
designpolicy
What is structure? The influences and interde-pendencies among actions and measures, including feedbacks, that determine system behavior.
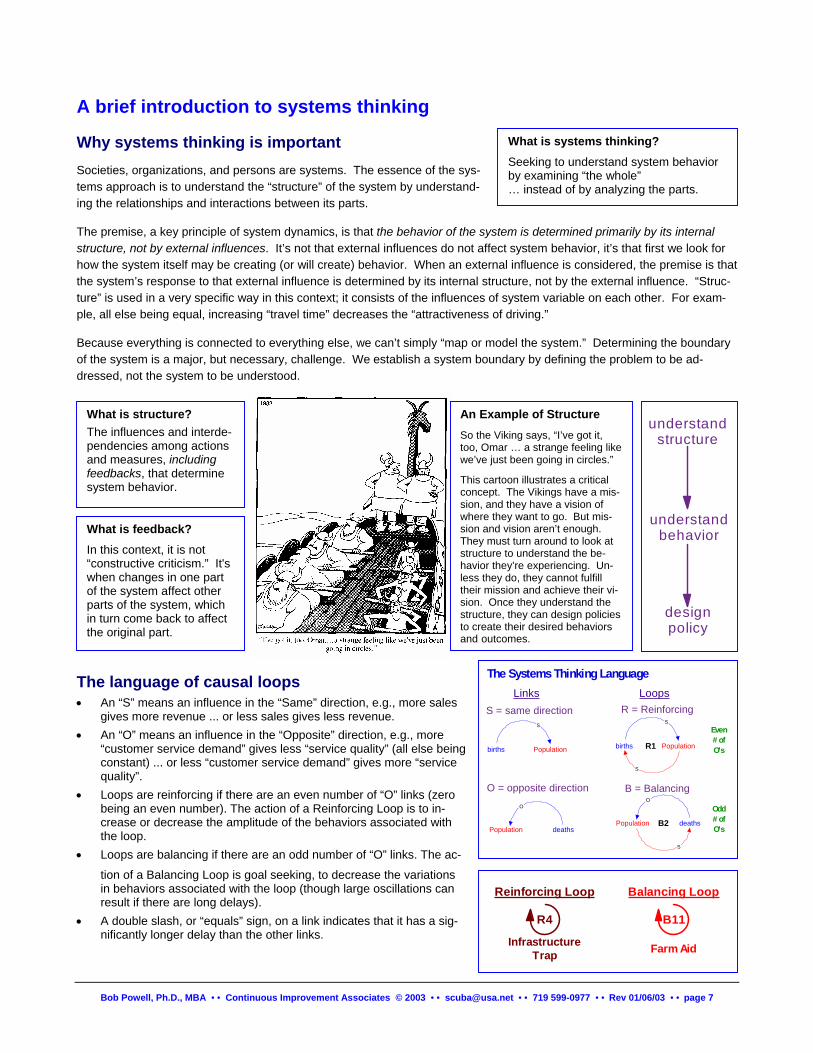
An Example of Structure So the Viking says, “I’ve got it, too, Omar … a strange feeling like we’ve just been going in circles.”
This cartoon illustrates a critical concept. The Vikings have a mis-sion, and they have a vision of where they want to go. But mis-sion and vision aren’t enough. They must turn around to look at structure to understand the be-havior they’re experiencing. Un-less they do, they cannot fulfill their mission and achieve their vi-sion. Once they understand the structure, they can design policieto create their desired behaviors and outcom
What is feedback?
In this context, it is not “constructive criticism.” It's when changes in one part of the system affect other parts of the system, which in turn come back to affect the original part.
s
es.
O = opposite direction
S = same directionLinks
The Systems Thinking Language
B = Balancing
R = Reinforcing Loops
S
births
deaths
O
S
R1
S
births
B2 deaths
O
S
Odd# ofO's
Even# ofO's
The language of causal loops • An “S” means an influence in the “Same” direction, e.g., more sales
gives more revenue ... or less sales gives less revenue. • An “O” means an influence in the “Opposite” direction, e.g., more
“customer service demand” gives less “service quality” (all else being constant) ... or less “customer service demand” gives more “service quality”.
Population
Population
Population
Population
Farm Aid
Balancing Loop
B11
• Loops are reinforcing if there are an even number of “O” links (zero being an even number). The action of a Reinforcing Loop is to in-crease or decrease the amplitude of the behaviors associated with the loop.
• Loops are balancing if there are an odd number of “O” links. The ac-tion of a Balancing Loop is goal seeking, to decrease the variations in behaviors associated with the loop (though large oscillations can result if there are long delays).
Reinforcing Loop
R4
InfrastructureTrap
• A double slash, or “equals” sign, on a link indicates that it has a sig-nificantly longer delay than the other links.
Bob Powell, Ph.D., MBA • • Continuous Improvement Associates © 2003 • • [email protected] • • 719 599-0977 • • Rev 01/06/03 • • page 7
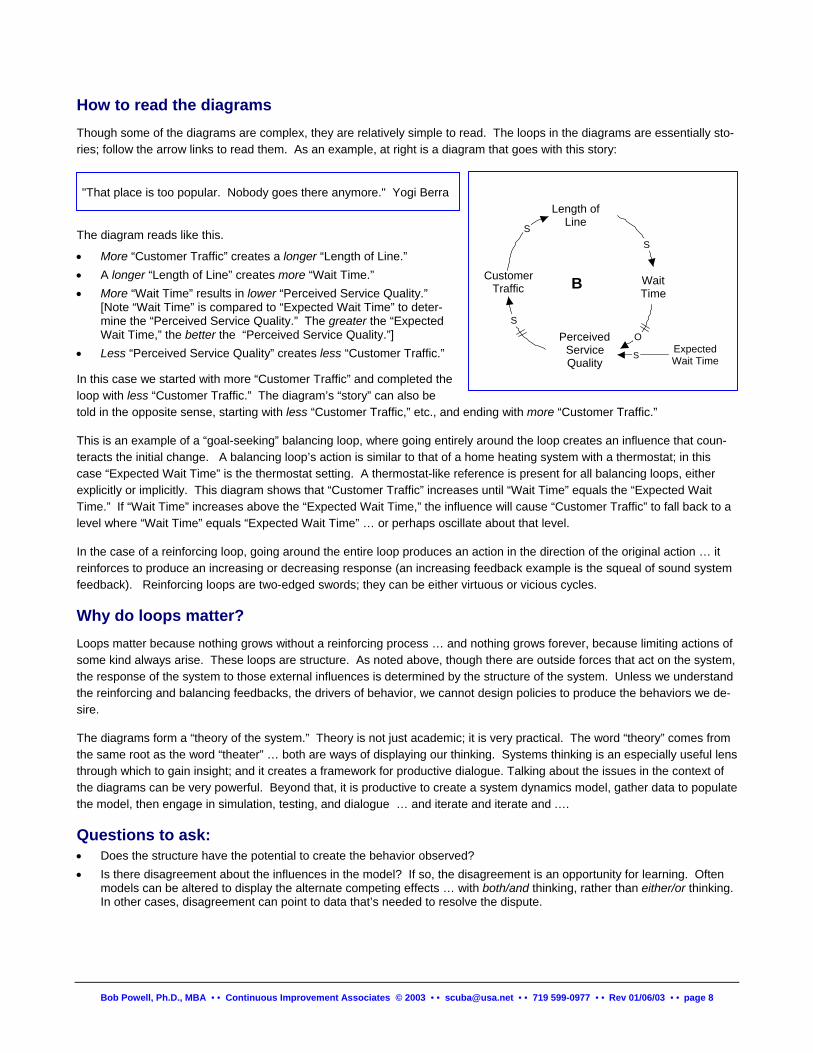
How to read the diagrams Though some of the diagrams are complex, they are relatively simple to read. The loops in the diagrams are essentially sto-ries; follow the arrow links to read them. As an example, at right is a diagram that goes with this story:
The diagram reads like this.
• More “Customer Traffic” creates a longer “Length of Line.” • A longer “Length of Line” creates more “Wait Time.” • More “Wait Time” results in lower “Perceived Service Quality.”
[Note “Wait Time” is compared to “Expected Wait Time” to deter-mine the “Perceived Service Quality.” The greater the “Expected Wait Time,” the better the “Perceived Service Quality.”]
• Less “Perceived Service Quality” creates less “Customer Traffic.”
In this case we started with more “Customer Traffic” and completed the loop with less “Customer Traffic.” The diagram’s “story” can also be told in the opposite sense, starting with less “Customer Traffic,” etc., and ending with more “Customer Traffic.”
CustomerTraffic
S
Length ofLine
WaitTime
S
OPerceivedServiceQuality
S
B
S Expected Wait Time
"That place is too popular. Nobody goes there anymore." Yogi Berra
This is an example of a “goal-seeking” balancing loop, where going entirely around the loop creates an influence that coun-teracts the initial change. A balancing loop’s action is similar to that of a home heating system with a thermostat; in this case “Expected Wait Time” is the thermostat setting. A thermostat-like reference is present for all balancing loops, either explicitly or implicitly. This diagram shows that “Customer Traffic” increases until “Wait Time” equals the “Expected Wait Time.” If “Wait Time” increases above the “Expected Wait Time,” the influence will cause “Customer Traffic” to fall back to a level where “Wait Time” equals “Expected Wait Time” … or perhaps oscillate about that level.
In the case of a reinforcing loop, going around the entire loop produces an action in the direction of the original action … it reinforces to produce an increasing or decreasing response (an increasing feedback example is the squeal of sound system feedback). Reinforcing loops are two-edged swords; they can be either virtuous or vicious cycles.
Why do loops matter? Loops matter because nothing grows without a reinforcing process … and nothing grows forever, because limiting actions of some kind always arise. These loops are structure. As noted above, though there are outside forces that act on the system, the response of the system to those external influences is determined by the structure of the system. Unless we understand the reinforcing and balancing feedbacks, the drivers of behavior, we cannot design policies to produce the behaviors we de-sire.
The diagrams form a “theory of the system.” Theory is not just academic; it is very practical. The word “theory” comes from the same root as the word “theater” … both are ways of displaying our thinking. Systems thinking is an especially useful lens through which to gain insight; and it creates a framework for productive dialogue. Talking about the issues in the context of the diagrams can be very powerful. Beyond that, it is productive to create a system dynamics model, gather data to populate the model, then engage in simulation, testing, and dialogue … and iterate and iterate and .…
Questions to ask: • Does the structure have the potential to create the behavior observed? • Is there disagreement about the influences in the model? If so, the disagreement is an opportunity for learning. Often
models can be altered to display the alternate competing effects … with both/and thinking, rather than either/or thinking. In other cases, disagreement can point to data that’s needed to resolve the dispute.
Bob Powell, Ph.D., MBA • • Continuous Improvement Associates © 2003 • • [email protected] • • 719 599-0977 • • Rev 01/06/03 • • page 8
• What measures are we missing that are needed to track what’s happening? There’s so much data than could be taken, we need theory to guide us in selecting the data to collect … the data that will be most useful in confirming or disconfirming theory.3
• Are there latent potential feedbacks that are not yet activated? They could affect the future behavior of the system.4
Models are always incorrect. They are only approximations, not the real thing. So they’re not about their absolute correct-ness, but about their usefulness for as a foundation for dialogue and understanding the root of system behavior with respect to the problem being addressed.
3 Every measurement is guided by some explicit or implicit theory that tells us that the measure is important. Unfortunately, we often man-
age based on the measures we happen to have, rather than the measures that are important. 4 This points to a difficult aspect of modeling. Just because a model predicts the past does not mean it can tell us what will happen in the fu-
ture. Dormant loops often become active and produce what we perceive as “surprising behavior.” For this reason, using spreadsheets of past performance and projecting into the future with regression formulas is like driving while looking through the rear view mirror. This is a major weakness of econometrics.
Bob Powell, Ph.D., MBA • • Continuous Improvement Associates © 2003 • • [email protected] • • 719 599-0977 • • Rev 01/06/03 • • page 9
Summary
Background The Problem: How can we explain why growth produces traffic congestion, infrastructure backlogs, higher taxes, declining quality of life, consumes farmland, raises costs (including the cost of housing, making it unaffordable), and sprawl.
The Approach: A systems thinking approach is appropriate for un-derstanding why a system behaves as it does (see previous section).
A Premise: Because we see similar problems (though at different stages of evolution) all across the country, it’s a major hint that the roots of the problem associated with growth and sprawl are driven, at least in part, by national policy and by similar state and local policies.
What’s presented here: The major structures that interact to create the behaviors we observe and data relevant to the structures.
Suggestions on how to read this paper: First, start by reading the brief summary below. Before reading the next section on “The diagrams,” be sure you’ve read “A brief introduction to sys-tems thinking” so you’ll know how to read the diagrams. They’re off-putting, I know (especially Figure 2), but it may help to look at the loops as simply a way to tell stories about how influences play out in the system. They really are fairly easy to read once you get the hang of it. If it’s any consolation, they are a whole lot easier to read than to create. Printing the dia-grams can provide a useful reference as you read.
“… you can analyze the whole into its constitu-ent parts, and that’s a completely valid en-deavor. But then you have parts, not the whole. You can take a watch apart and analyze its parts, but they won’t tell you the time of day. … The wholeness … is not found in any of [the] parts, and that puts an end to a certain reduc-tionistic frenzy that has plagued Western sci-ence virtually from its inception.” Ken Wilber, A Brief History of Everything, 1996, p. 25.
After that, if you can read the whole paper straight through, good for you. If that looks like too much, you could read the slutions section … going from there to the more detailed material in main paper that’s of most interest. Or, simply start reaing in a section in which you are most interested.
o-d-
If you think you’ve found a mistake in one of the diagrams, you very well may have … I do every almost every time I look at one I’ve created. Make a note and let me know if you would. I’ve attempted to include what I think are the major effects, but I don’t pretend that all effects are shown in the diagrams; you’ll surely see ones that are omitted, which doesn’t mean at all that I would think they’re invalid.
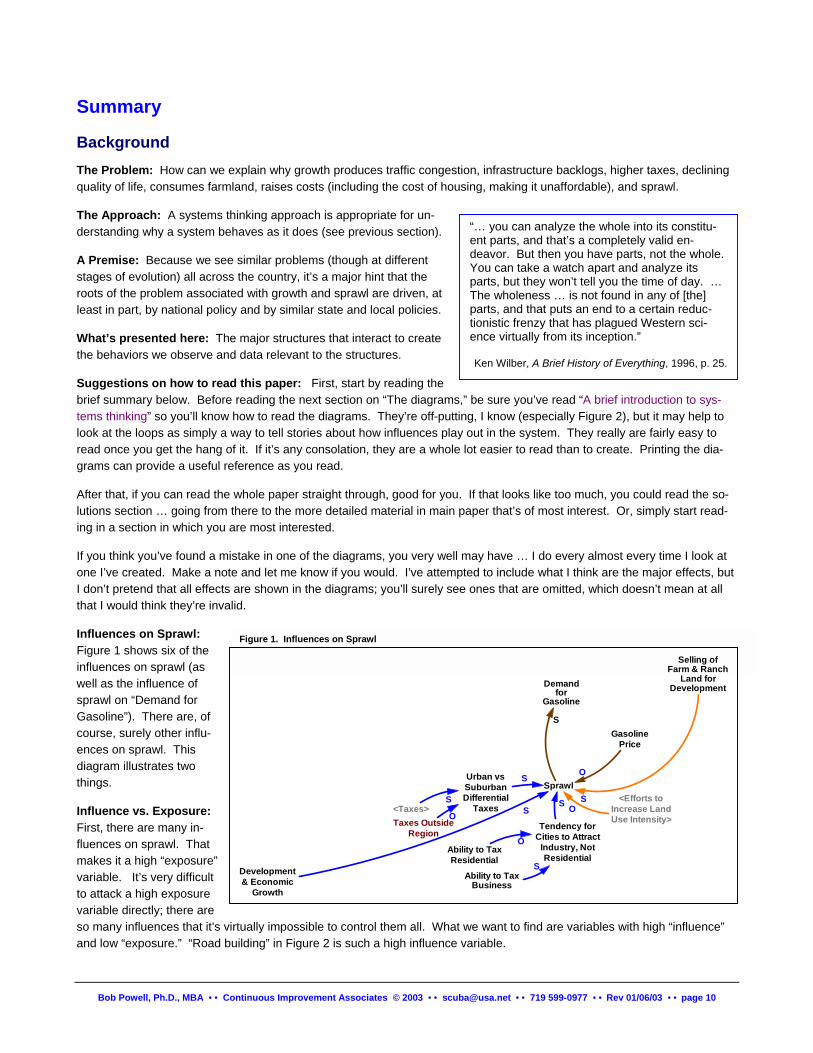
Influences on Sprawl: Figure 1 shows six of the influences on sprawl (as well as the influence of sprawl on “Demand for Gasoline”). There are, of course, surely other influ-ences on sprawl. This diagram illustrates two things.
Influence vs. Exposure: First, there are many in-fluences on sprawl. That makes it a high “exposure” variable. It’s very difficult to attack a high exposure variable directly; there are so many influences that it’s virtually impossible to control them all. What we want to find are variables with high “influence” and low “exposure.” “Road building” in Figure 2 is such a high influence variable.
Development& Economic
Growth
Sprawl
Selling ofFarm & Ranch
Land forDevelopment
S
GasolinePrice
O
Demandfor
Gasoline
S
Urban vsSuburbanDifferential
Taxes
S
eO
SS
<Efforts toIncrease LandUse Intensity>
O
Tendency forCities to Attract
Industry, NotResidential
Ability to TaxResidential
Ability to TaxBusiness
O
S
S<Taxes>
Figure 1. Influences on Sprawl
Taxes OutsidRegion
Bob Powell, Ph.D., MBA • • Continuous Improvement Associates © 2003 • • [email protected] • • 719 599-0977 • • Rev 01/06/03 • • page 10
Causes: Second, while Figure 1 shows us some of the influences, it tells us little about the causes. Sprawl is a symptom for which we wish to understand the causes. The causes of the behaviors we observe are internal feedback loops that drive systems behavior. In some cases an internal feedback is set in motion by external influences (such as Federal and State road building) … the internal feedback might be dormant otherwise. This means that an effective solution must either change internal policies to neutralize or break the internal feedback loops or else change the external policies so that they no longer provoke the action of the internal feedback loops in the same way.
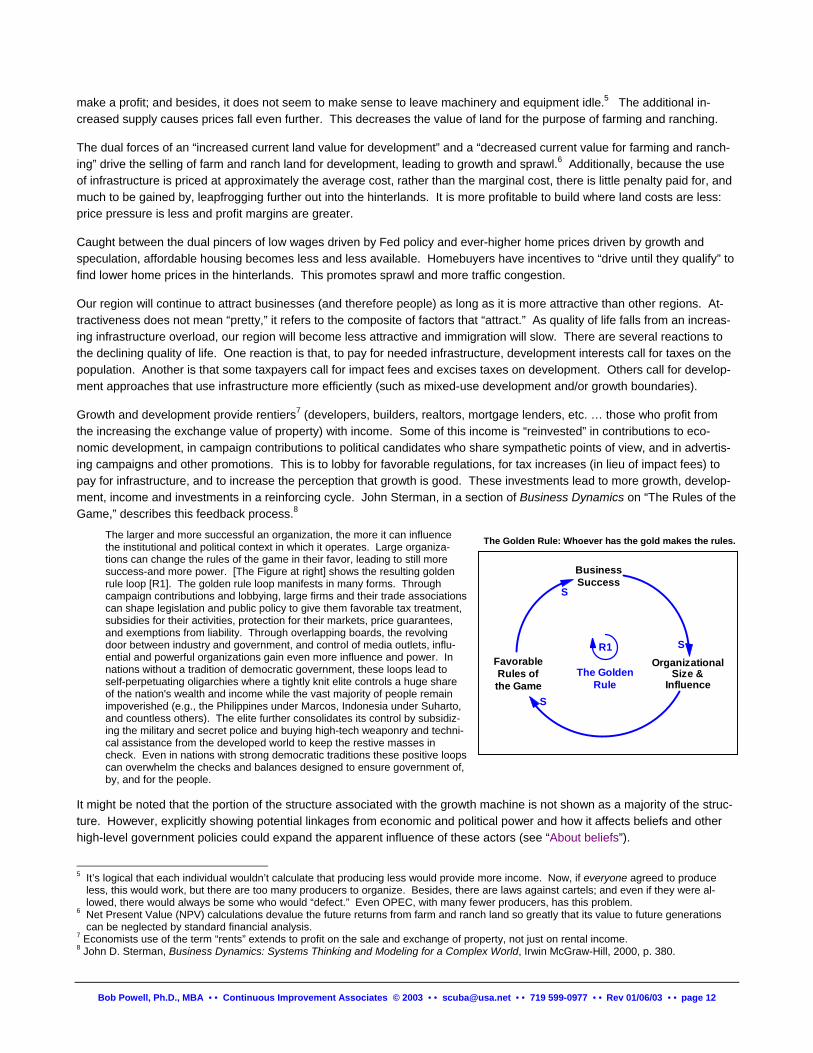
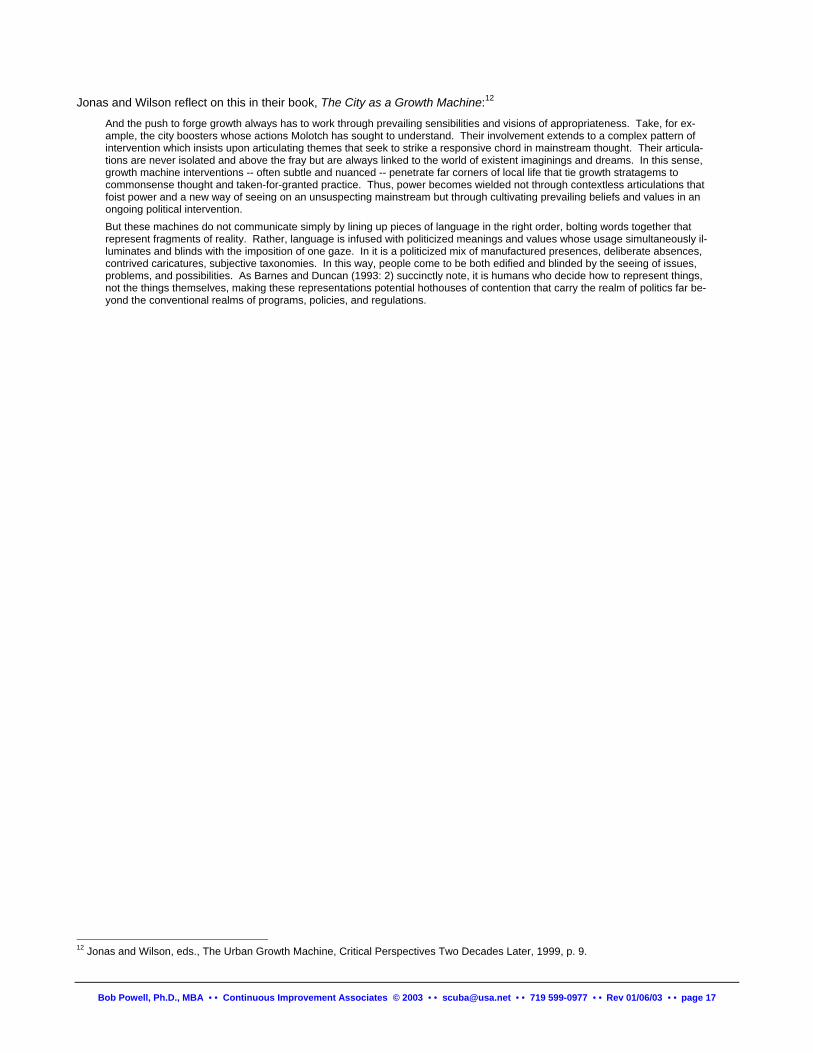
A brief overview of the overall dynamic This section attempts to describe the main stories shown in Figure 2.
Based on its fear of setting off an inflationary wage-price spiral, the Federal Reserve maintains policies that assure there are fewer jobs than people. Because only so much economic growth is allowed, people and regions must compete for the jobs and growth that are possible; and the competition escalates. People are led to be willing to do work for less pay. Regions attract companies by offering ever more “business friendly” environments with lower taxes, less regulation and weaker worker protections. These situations parallel each other in that the escalation drives both peoples’ wages and regional taxes, that might be called “regional wages,” toward zero. A minimum wage was established because wages are driven to-ward zero. Too often these wages are not a “living wage” in that people cannot afford basic services, such as housing and health care, and regions cannot afford to maintain infrastructure and services.
As regional infrastructure backlog grows and services decline, regions are led to promote more development in order to gain tax revenue. This provides some immediate relief, but years later the increased load on the infrastructure creates an even larger backlog. This prompts regions to promote even more growth for more immediate relief. This is called “addiction.” It is the same structure as addiction to drugs: feel good in the short term even though long term health suffers. Because there’s a long delay before the infrastructure demands arise, it’s easy to ignore, and/or obfuscate, the connection. Of course, addic-tion of any kind is not a solution. No one can sell a product at a loss and make it up in volume.
One aspect of the infrastructure backlog is traffic congestion. There is only so much road capacity, it is a “commons” that becomes overloaded by the continuing development. This leads to pressure to build more roads to relieve the congestion. Federal and state investment in roads in response to the pressure can help for a short time, but this makes driving more at-tractive, which induces more traffic in more trips and longer trips. The improved access makes the region larger, which pro-vides better access to the hinterlands, making more growth possible with the increased traffic that accompanies it. And a larger region makes existing public transportation less adequate and leads more people to make the choice to drive. This leads to an upward spiral of traffic congestion, road building, and growth … and to a death spiral in the use of public trans-portation.
The preference for driving relative to public transit is also reinforced by a low price of gas that does not take into account the cost of all of the negative externalities associated with driving (e.g., health problems due to pollution). Additionally, the even-tual costs that will be associated with redesigning/retrofitting a region that depends on low gas prices is not taken into ac-count.
Continuing regional growth leads to speculation that land prices will rise, and even to “structural speculation” that promotes specific road building and annexations to assure land prices will increase. Tax policy also increases speculation. Specula-tive profits are often taxed as long term capital gains and major expenses (such as property taxes and mortgage interest) can be deducted from income. Allowing deductions for depreciation of property (as if it were “used up”) not only reduces taxes, it artificially increases the “churning” of property that drives up demand. Churning is advantageous because, as prop-erty depreciation allowances decline with time, entrepreneurs sell each other the same stock of properties on approximately five-year cycles. These distortions drive up land prices (…in addition, they divert investment from the actual production of goods and services).
Other forces reduce the value of land for farming and ranching. Because farm and ranch capacity is so large and because efficiency is so great, commodity supplies far exceed demand. This depresses commodity prices. Switching to other crops or livestock may work for a while, but there is so much capacity that those markets are soon overwhelmed as well. Individual farmers and ranchers make the logical calculation that, if they can just produce a more and do so more efficiently, they can
Bob Powell, Ph.D., MBA • • Continuous Improvement Associates © 2003 • • [email protected] • • 719 599-0977 • • Rev 01/06/03 • • page 11
make a profit; and besides, it does not seem to make sense to leave machinery and equipment idle.5 The additional in-creased supply causes prices fall even further. This decreases the value of land for the purpose of farming and ranching.
The dual forces of an “increased current land value for development” and a “decreased current value for farming and ranch-ing” drive the selling of farm and ranch land for development, leading to growth and sprawl.6 Additionally, because the use of infrastructure is priced at approximately the average cost, rather than the marginal cost, there is little penalty paid for, and much to be gained by, leapfrogging further out into the hinterlands. It is more profitable to build where land costs are less: price pressure is less and profit margins are greater.
Caught between the dual pincers of low wages driven by Fed policy and ever-higher home prices driven by growth and speculation, affordable housing becomes less and less available. Homebuyers have incentives to “drive until they qualify” to find lower home prices in the hinterlands. This promotes sprawl and more traffic congestion.
Our region will continue to attract businesses (and therefore people) as long as it is more attractive than other regions. At-tractiveness does not mean “pretty,” it refers to the composite of factors that “attract.” As quality of life falls from an increas-ing infrastructure overload, our region will become less attractive and immigration will slow. There are several reactions to the declining quality of life. One reaction is that, to pay for needed infrastructure, development interests call for taxes on the population. Another is that some taxpayers call for impact fees and excises taxes on development. Others call for develop-ment approaches that use infrastructure more efficiently (such as mixed-use development and/or growth boundaries).
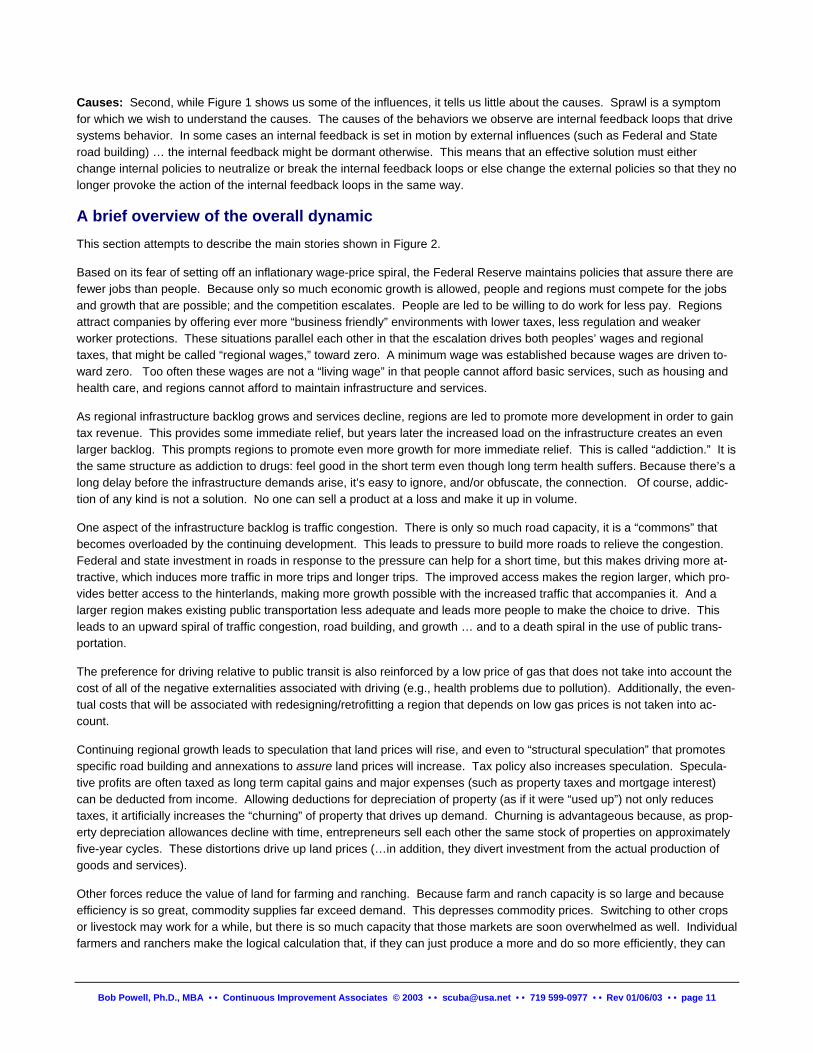
Growth and development provide rentiers7 (developers, builders, realtors, mortgage lenders, etc. … those who profit from the increasing the exchange value of property) with income. Some of this income is “reinvested” in contributions to eco-nomic development, in campaign contributions to political candidates who share sympathetic points of view, and in advertis-ing campaigns and other promotions. This is to lobby for favorable regulations, for tax increases (in lieu of impact fees) to pay for infrastructure, and to increase the perception that growth is good. These investments lead to more growth, develop-ment, income and investments in a reinforcing cycle. John Sterman, in a section of Business Dynamics on “The Rules of the Game,” describes this feedback process.8
The larger and more successful an organization, the more it can influence the institutional and political context in which it operates. Large organiza-tions can change the rules of the game in their favor, leading to still more success-and more power. [The Figure at right] shows the resulting golden rule loop [R1]. The golden rule loop manifests in many forms. Through campaign contributions and lobbying, large firms and their trade associations can shape legislation and public policy to give them favorable tax treatment, subsidies for their activities, protection for their markets, price guarantees, and exemptions from liability. Through overlapping boards, the revolving door between industry and government, and control of media outlets, influ-ential and powerful organizations gain even more influence and power. In nations without a tradition of democratic government, these loops lead to self-perpetuating oligarchies where a tightly knit elite controls a huge share of the nation's wealth and income while the vast majority of people remain impoverished (e.g., the Philippines under Marcos, Indonesia under Suharto, and countless others). The elite further consolidates its control by subsidiz-ing the military and secret police and buying high-tech weaponry and techni-cal assistance from the developed world to keep the restive masses in check. Even in nations with strong democratic traditions these positive loops can overwhelm the checks and balances designed to ensure government of, by, and for the people.
The Golden Rule: Whoever has the gold makes the rules.
BusinessSuccess
OrganizationalSize &
Influence
FavorableRules ofthe Game
S
S
S
R1
The GoldenRule
It might be noted that the portion of the structure associated with the growth machine is not shown as a majority of the struc-ture. However, explicitly showing potential linkages from economic and political power and how it affects beliefs and other high-level government policies could expand the apparent influence of these actors (see “About beliefs”).
5 It’s logical that each individual wouldn’t calculate that producing less would provide more income. Now, if everyone agreed to produce
less, this would work, but there are too many producers to organize. Besides, there are laws against cartels; and even if they were al-lowed, there would always be some who would “defect.” Even OPEC, with many fewer producers, has this problem.
6 Net Present Value (NPV) calculations devalue the future returns from farm and ranch land so greatly that its value to future generations can be neglected by standard financial analysis.
7 Economists use of the term “rents” extends to profit on the sale and exchange of property, not just on rental income. 8 John D. Sterman, Business Dynamics: Systems Thinking and Modeling for a Complex World, Irwin McGraw-Hill, 2000, p. 380.
Bob Powell, Ph.D., MBA • • Continuous Improvement Associates © 2003 • • [email protected] • • 719 599-0977 • • Rev 01/06/03 • • page 12
These major stories are described independently. But as can be seen in Figure 2, they’re highly interdependent.
The winners is this structure are: • Rentiers: Growth increases the returns from the ownership, sale, and exchange of property. • Other property owners: While increasing property values are not necessarily their main interest, they do benefit from
increasing property values. • Road building industries: More traffic congestion and growth leads to calls for more road building. • Immobile, volume dependent businesses: These include newspapers, utilities, even universities. • Corporations: They get low taxes and low-regulation environment, which increases returns to stockholders.
The above interests are described as “naturally organized” by the profit motives they share.
The losers are: • Renters: Renters see increasing rents, but do not participate in the gains from increasing property values. • “Use value” interests: Those whose interests are “use values” – that is, those in businesses not involving the ex-
change of property – lose quality of life. • Regions that wish to maintain quality of life: Regions are set against each other in a zero-sum-gain competition for
the economic growth that is allowed by Fed policy. This decreases regional ability to collect taxes and maintain envi-ronmental and worker protections.
• Unions: Workers and unions in different regions are set against each other in a zero-sum-gain competition for the jobs that are allowed by Fed policy. They are convinced by logical arguments that growth-friendly policies are necessary to create jobs, though such policies only affect the distribution of jobs. Higher growth rates do not significantly affect un-employment because workers are drawn from other, slower-growing regions (see data in the section “Federal Reserve policy, wages, and growth”). What the policies do accomplish is to depress wages, reduce worker protections and re-duce overall quality of life.
• Neighborhoods and neighborhood organizations that attempt to maintain quality of life: They are called NIMBYs. • Public transportation advocates: A growing infrastructure backlog means there will be no funds for transit. • Affordable housing advocates: With Fed policy depressing wages, rising home prices due to growth and speculation,
and increasing pressure on government to pay for infrastructure there will be no funds for public subsidies for low wage workers or for renters comparable to those for homeowners.
• Environmentalists: Business-friendly policies to attract companies are generally taken to stress the need to reduce or eliminate regulations that protect the environment. (This could change if “business friendly” is recast to emphasize maintaining quality of life to attract high-wage workers who have skills in high demand and who can choose among re-gions.)
These interests are described as “naturally disorganized” because they cannot make a direct profit from lobbying for their in-terests9 …instead they can only attempt to minimize their losses.
Depressed yet? The structures are so powerful that it all seems quite overwhelming. If we do not recognize these structures and their enormous power and then do something to change them, we are condemned to a hell of our own creation.
But there are things that can be done; see the section on “Solutions”.
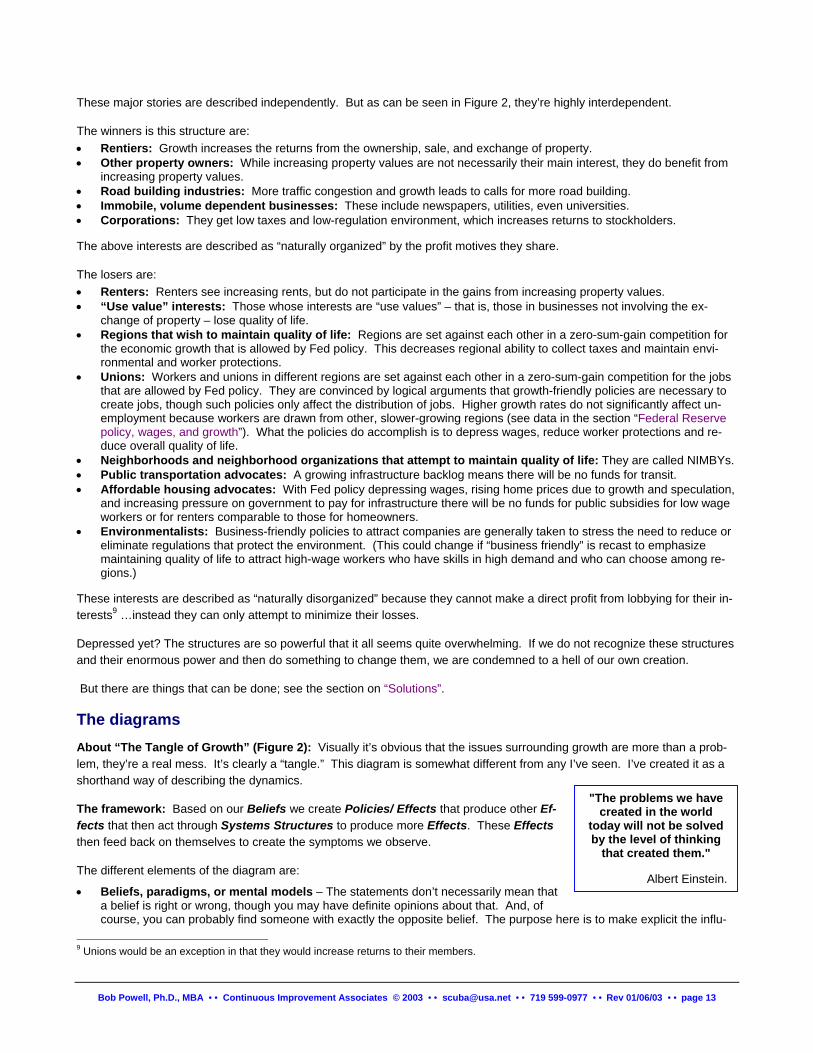
The diagrams About “The Tangle of Growth” (Figure 2): Visually it’s obvious that the issues surrounding growth are more than a prob-lem, they’re a real mess. It’s clearly a “tangle.” This diagram is somewhat different from any I’ve seen. I’ve created it as a shorthand way of describing the dynamics.
The framework: Based on our Beliefs we create Policies/ Effects that produce other Ef-fects that then act through Systems Structures to produce more Effects. These Effects then feed back on themselves to create the symptoms we observe.
The different elements of the diagram are:
• Beliefs, paradigms, or mental models – The statements don’t necessarily mean that a belief is right or wrong, though you may have definite opinions about that. And, of course, you can probably find someone with exactly the opposite belief. The purpose here
Bob Powell, Ph.D., MBA • • Continuous Improvement Associates © 2003 • • [email protected] • • 719 599-097
9 Unions would be an exception in that they would increase returns to their members.
"The problems we have created in the world
today will not be solved by the level of thinking
that created them."
Albert Einstein.
is to make explicit the influ-
7 • • Rev 01/06/03 • • page 13
ence of a belief. The statements only mean that, for an “S” link for example, the greater or lesser the belief, the greater or lesser the effect on the linked element of the diagram.
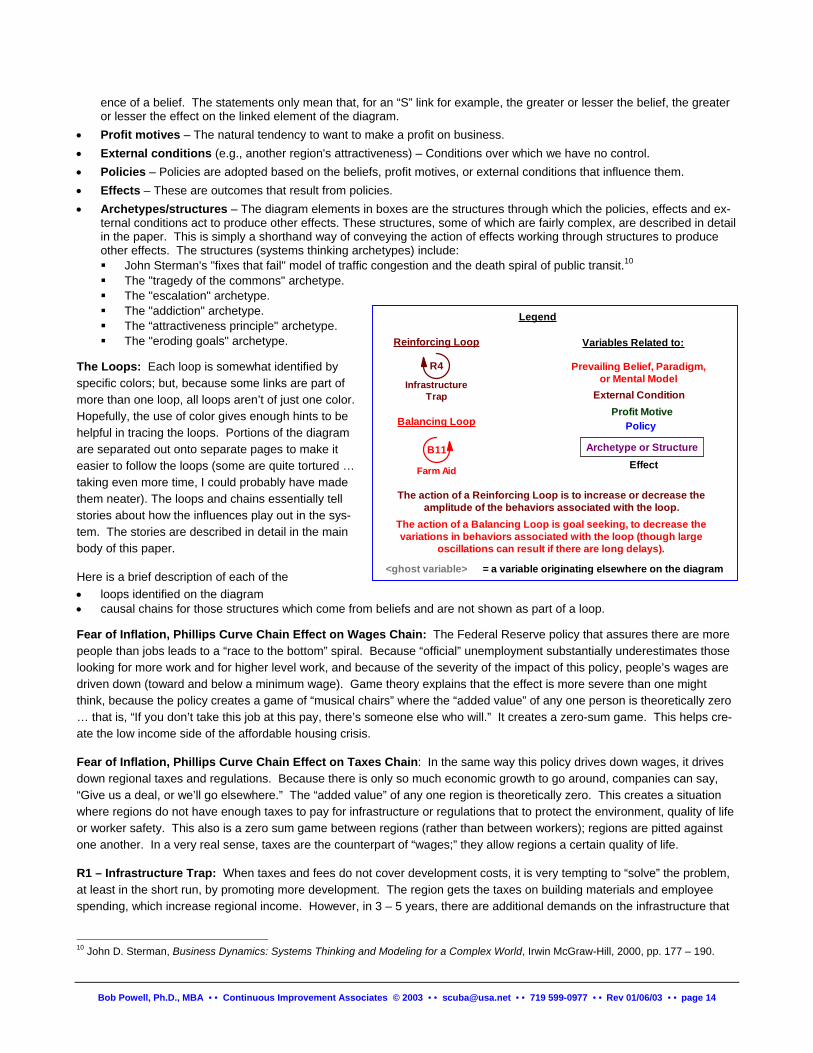
• Profit motives – The natural tendency to want to make a profit on business. • External conditions (e.g., another region's attractiveness) – Conditions over which we have no control. • Policies – Policies are adopted based on the beliefs, profit motives, or external conditions that influence them. • Effects – These are outcomes that result from policies. • Archetypes/structures – The diagram elements in boxes are the structures through which the policies, effects and ex-
ternal conditions act to produce other effects. These structures, some of which are fairly complex, are described in detail in the paper. This is simply a shorthand way of conveying the action of effects working through structures to produce other effects. The structures (systems thinking archetypes) include: ! John Sterman's "fixes that fail" model of traffic congestion and the death spiral of public transit.10 ! The "tragedy of the commons" archetype. ! The "escalation" archetype. ! The "addiction" archetype. ! The “attractiveness principle" archetype. ! The "eroding goals" archetype.
The Loops: Each loop is somewhat identified by specific colors; but, because some links are part of more than one loop, all loops aren’t of just one color. Hopefully, the use of color gives enough hints to be helpful in tracing the loops. Portions of the diagram are separated out onto separate pages to make it easier to follow the loops (some are quite tortured … taking even more time, I could probably have made them neater). The loops and chains essentially tell stories about how the influences play out in the sys-tem. The stories are described in detail in the main body of this paper.
Farm Aid
Prevailing Belief, Paradigm,or Mental Model
Balancing Loop
B11
The action of a Balancing Loop is goal seeking, to decrease thevariations in behaviors associated with the loop (though large
oscillations can result if there are long delays).
Policy
Archetype or StructureEffect
Legend
<ghost variable> = a variable originating elsewhere on the diagram
Variables Related to:
External Condition
Reinforcing Loop
R4
InfrastructureTrap
The action of a Reinforcing Loop is to increase or decrease theamplitude of the behaviors associated with the loop.
Profit Motive
Here is a brief description of each of the • loops identified on the diagram • causal chains for those structures which come from beliefs and are not shown as part of a loop.
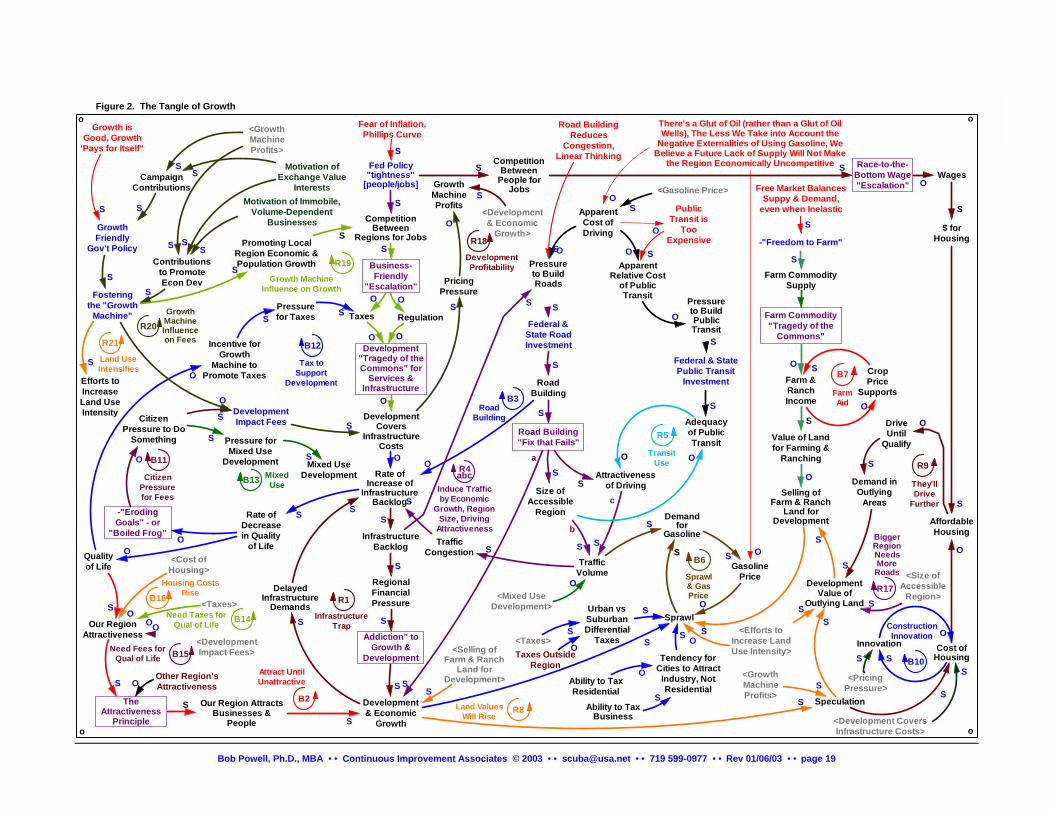
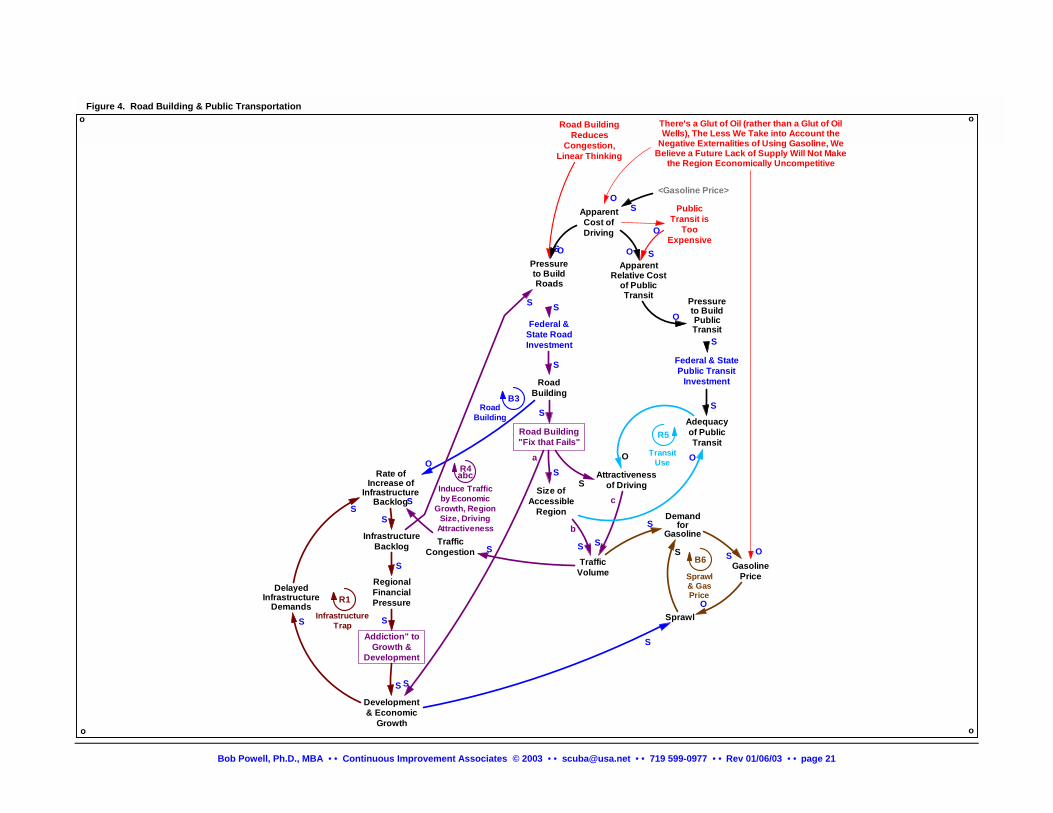
Fear of Inflation, Phillips Curve Chain Effect on Wages Chain:
The Federal Reserve policy that assures there are more people than jobs leads to a “race to the bottom” spiral. Because “official” unemployment substantially underestimates those looking for more work and for higher level work, and because of the severity of the impact of this policy, people’s wages are driven down (toward and below a minimum wage). Game theory explains that the effect is more severe than one might think, because the policy creates a game of “musical chairs” where the “added value” of any one person is theoretically zero … that is, “If you don’t take this job at this pay, there’s someone else who will.” It creates a zero-sum game. This helps cre-ate the low income side of the affordable housing crisis.
Fear of Inflation, Phillips Curve Chain Effect on Taxes Chain: In the same way this policy drives down wages, it drives down regional taxes and regulations. Because there is only so much economic growth to go around, companies can say, “Give us a deal, or we’ll go elsewhere.” The “added value” of any one region is theoretically zero. This creates a situation where regions do not have enough taxes to pay for infrastructure or regulations that to protect the environment, quality of life or worker safety. This also is a zero sum game between regions (rather than between workers); regions are pitted against one another. In a very real sense, taxes are the counterpart of “wages;” they allow regions a certain quality of life.
R1 – Infrastructure Trap: When taxes and fees do not cover development costs, it is very tempting to “solve” the problem, at least in the short run, by promoting more development. The region gets the taxes on building materials and employee spending, which increase regional income. However, in 3 – 5 years, there are additional demands on the infrastructure that
Bob Powell, Ph.D., MBA • • Continuous Improvement Associates © 2003 • • [email protected] • • 719 599-0977 • • Rev 01/06/03 • • page 14
10 John D. Sterman, Business Dynamics: Systems Thinking and Modeling for a Complex World, Irwin McGraw-Hill, 2000, pp. 177 – 190.
need to be addressed, which sets up the need to promote even more growth to pay for that. This structure is the same as the structure of addiction to drugs.
B2 – Attract Until Unattractive: This process cannot go on forever. One of the limitations is that, as the infrastructure backlog increases, it has a negative impact on quality of life, which decreases the attractiveness of our region, which re-duces our economic growth. [One loop that is omitted here (and should be added) is that, sensing the downturn, there are increased pressures to again lower taxes and regulation to be even more “business friendly.”]
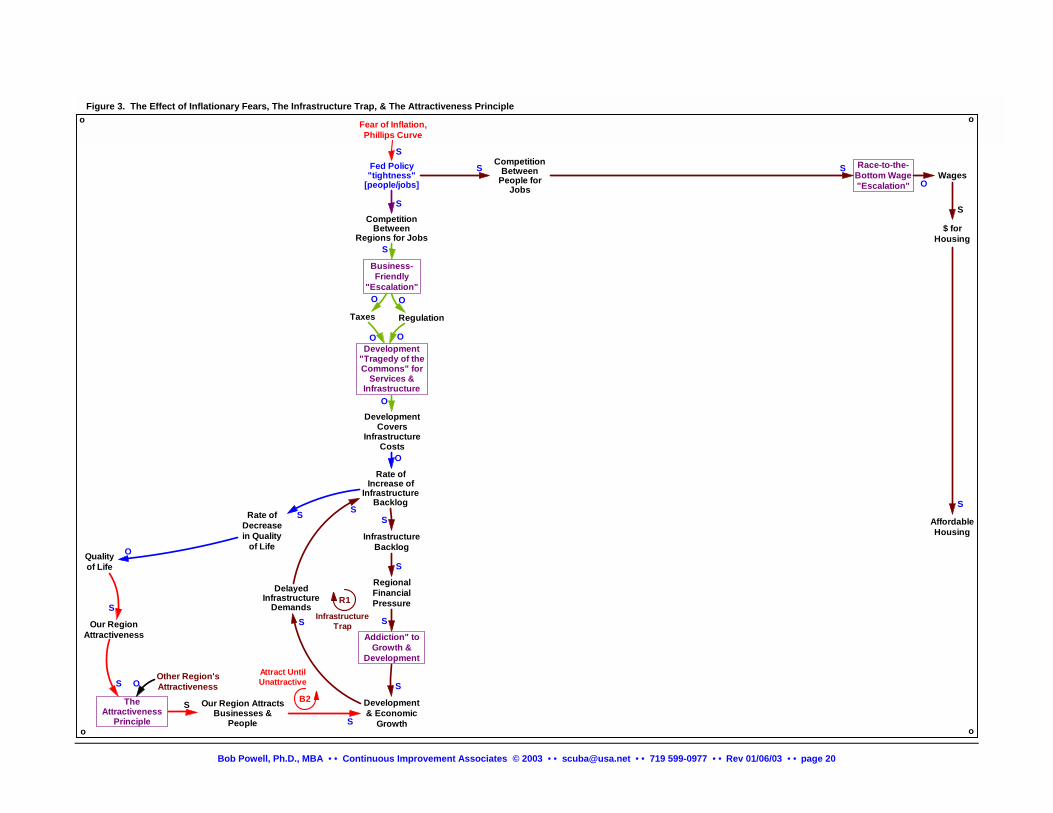
B3 – Road Building: One action to address the infrastructure backlog is to build roads. This is a balancing process that aims to correct the deficiency.
R4a, b, c – Induce Traffic by Economic Growth, Region Size, Driving Attractiveness: Unfortunately loop B3 is a “fix that fails.” More economic growth under the conditions described above, where infrastructure costs are not fully covered, further increases the backlog. More road building increases the size of the region, which creates more traffic volume, which causes more traffic congestion and creates a larger infrastructure backlog. Also, more road building makes driving more at-tractive, inducing more trips and longer trips to also increase traffic congestion.
R5 – Transit Use: As if this weren’t enough, as the region gets larger, public transit is less adequate. This also makes driv-ing more attractive and leads to more congestion … another failure of the “road-building fix.”
“There’s a Glut of Oil” Chain: Belief that gas prices will remain low, and that the long term cost of a transition from oil to other forms of energy is negligible, leads to a lower apparent cost of driving, to the belief that public transit is too expensive, and to less investment in public transit. This makes driving relatively more attractive and leads to more traffic congestion.
B6 – Sprawl and Gas Price: The belief that there are plentiful oil supplies into the foreseeable future keeps gas prices low, and makes it more feasible to live further out, feeding sprawl. This loop would limit sprawl if gas prices were not kept low (by plentiful oil wells): more sprawl would increase the demand for gasoline, raise the price of gas, and thus limit sprawl.
“Free Market Balances Supply and Demand even when Inelastic” Chain: Because there is so much farm commodity supply relative to demand, prices are low. Each farmer, acting independently and rationally, believes that the way to get more income is to put more acreage into production and be more efficient. Unfortunately, everyone doing this increases supply and leads to even lower prices. The “Freedom to Farm” act passed in 1996 unleashes this dynamic with a venge-ance. The low commodity prices lower the value of the land for farming and increase the selling of land for development.
B7 – Farm Aid: To balance this falling income, price supports keep prices higher in an attempt to raise prices high enough that too many farms don’t fail financially.
Growth is Good, Growth “Pays for Itself” Chain: This belief leads to growth-friendly government policy.
R8 – Land Values Will Rise: Some see growth as a sure thing that will eventually make land in the hinterlands more valu-able. This speculation increases the demand and increases the value of land for development, which leads to more farm-land being converted to development, which leads to more growth.
R9 – They’ll Drive Further: The less affordable housing, the further out people will drive to find an inexpensive home, which increases demand and increases the selling of land for development. This leads to more growth and more speculation and to even less affordable housing.
B10 – Construction Innovation: A higher cost of housing should lead to more innovation that would act to reduce costs. Note that if impact fees increase pricing pressure, this loop should help keep prices from rising as much as they otherwise would, just as Japanese competition gave Detroit incentive to improve cost and quality (though they have not yet achieved the quality and costs of this competition).
B11 – Citizen Pressure on Fees: When the rate of increase in infrastructure backlog is high, with a consequent rapid deg-radation in quality of life, citizens apply pressure for impact fees to stop the decline.
Bob Powell, Ph.D., MBA • • Continuous Improvement Associates © 2003 • • [email protected] • • 719 599-0977 • • Rev 01/06/03 • • page 15
B12 – Tax to Support Development: As quality of life decreases, growth interests realize it is threatening their ability to do business and they support tax increases to help address the backlog.
B13 – Mixed Use: Another (very long term) response to a rising infrastructure backlog and a falling quality of life is to push for mixed use development to reduce infrastructure costs. A push for growth boundaries that would make more efficient use of existing infrastructure could also be added here.
B14 –Need Taxes for Quality of Life: As our region is attractive compared to other regions, our region attracts more eco-nomic growth, which increases the infrastructure backlog, and decreases the quality of life. This increases pressure for taxes, which decreases our region’s comparative attractiveness.
B15 – Need Fees for Quality of Life: Increasing fees would have a similar effect.
B16 – Housing Costs Rise: As would higher housing costs.
R17 – Bigger Region Needs More Roads: More development and economic growth on farm and ranch land leads to more demand for improved roads, which makes farm and ranch land more valuable, leading to more growth and more roads.
R18 – Development Profitability: Profitable development provides funds to influence government policies to be more fa-vorable than they otherwise would be; this keeps impact fees down, which leads to a larger infrastructure backlog, which leads to pressure for more growth (to provide short-term tax benefits), which again increases profits.
R19 – Growth Machine Influence on Growth: Profitable development provides funds for economic development to fuel the competition between regions.
R20 – Growth Machine Influence on Fees: Profitable development provides funds to influence government policies to be more favorable than they otherwise would be; this keeps impact fees down and decreases pricing pressure to keep profits high.
R21 – Land Use Intensifies: Land use intensification makes land more valuable and fuels development profits.
These last four loops are the essence of “the growth machine.” For an explanation of this concept, see the section on “The “growth machine” thesis.”
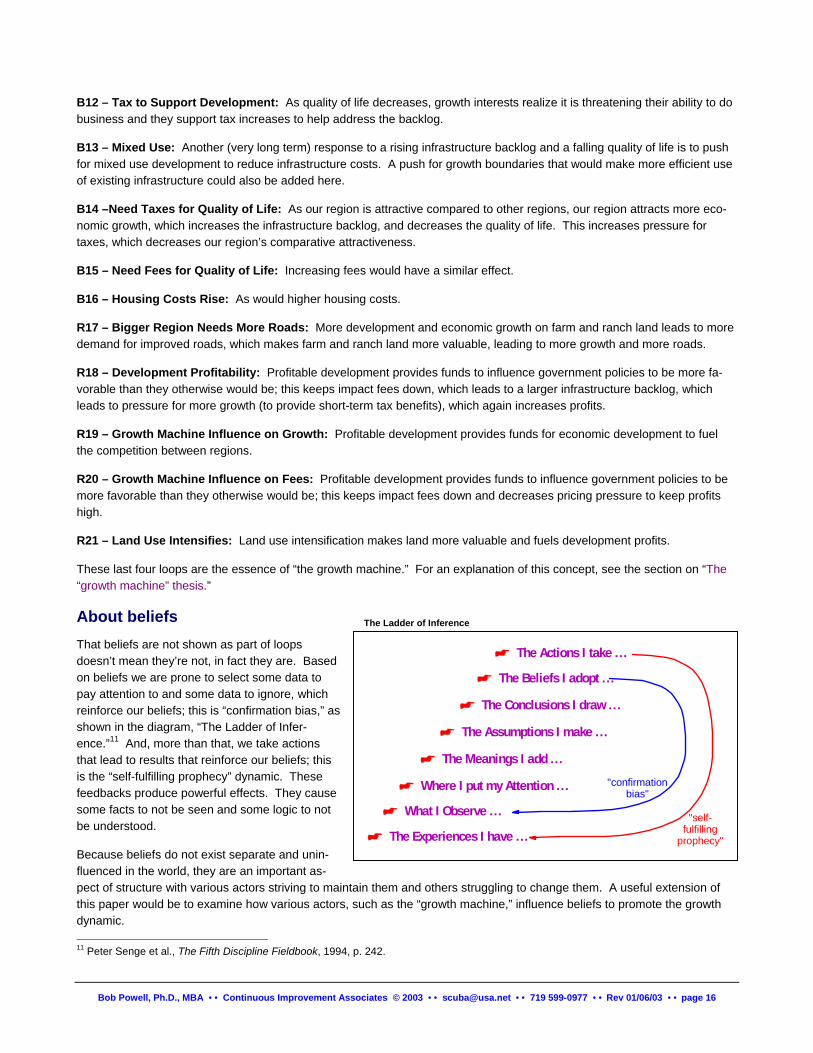
About beliefs The Ladder of Inference
That beliefs are not shown as part of loops doesn’t mean they’re not, in fact they are. Based on beliefs we are prone to select some data to pay attention to and some data to ignore, which reinforce our beliefs; this is “confirmation bias,” as shown in the diagram, “The Ladder of Infer-ence.”11 And, more than that, we take actions that lead to results that reinforce our beliefs; this is the “self-fulfilling prophecy” dynamic. These feedbacks produce powerful effects. They cause some facts to not be seen and some logic to not be understood.
Because beliefs do not exist separate and unin-fluenced in the world, they are an important as-pect of structure with various actors striving to maintain them and others struggling to change them. A useful extension of this paper would be to examine how various actors, such as the “growth machine,” influence beliefs to promote the growth dynamic.
The Actions I take ...
The Meanings I add ...
Where I put my Attention ...
What I Observe ...
The Beliefs I adopt ...
The Experiences I have ...
The Assumptions I make ...
The Conclusions I draw ...
"confirmationbias"
"self-fulfilling
prophecy"
Bob Powell, Ph.D., MBA • • Continuous Improvement Associates © 2003 • • [email protected] • • 719 599-0977 • • Rev 01/06/03 • • page 16
11 Peter Senge et al., The Fifth Discipline Fieldbook, 1994, p. 242.
Jonas and Wilson reflect on this in their book, The City as a Growth Machine:12
And the push to forge growth always has to work through prevailing sensibilities and visions of appropriateness. Take, for ex-ample, the city boosters whose actions Molotch has sought to understand. Their involvement extends to a complex pattern of intervention which insists upon articulating themes that seek to strike a responsive chord in mainstream thought. Their articula-tions are never isolated and above the fray but are always linked to the world of existent imaginings and dreams. In this sense, growth machine interventions -- often subtle and nuanced -- penetrate far corners of local life that tie growth stratagems to commonsense thought and taken-for-granted practice. Thus, power becomes wielded not through contextless articulations that foist power and a new way of seeing on an unsuspecting mainstream but through cultivating prevailing beliefs and values in an ongoing political intervention. But these machines do not communicate simply by lining up pieces of language in the right order, bolting words together that represent fragments of reality. Rather, language is infused with politicized meanings and values whose usage simultaneously il-luminates and blinds with the imposition of one gaze. In it is a politicized mix of manufactured presences, deliberate absences, contrived caricatures, subjective taxonomies. In this way, people come to be both edified and blinded by the seeing of issues, problems, and possibilities. As Barnes and Duncan (1993: 2) succinctly note, it is humans who decide how to represent things, not the things themselves, making these representations potential hothouses of contention that carry the realm of politics far be-yond the conventional realms of programs, policies, and regulations.
12 Jonas and Wilson, eds., The Urban Growth Machine, Critical Perspectives Two Decades Later, 1999, p. 9.
Bob Powell, Ph.D., MBA • • Continuous Improvement Associates © 2003 • • [email protected] • • 719 599-0977 • • Rev 01/06/03 • • page 17

Bob Powell, Ph.D., MBA • • Continuous Improvement Associates © 2003 • • [email protected] • • 719 599-0977 • • Rev 01/06/03 • • page 18
<Size ofAccessible
Region>
Demand inOutlying
Areas
R17
BiggerRegionNeedsMoreRoads
B15Need Fees forQual of Life
Fed Policy"tightness"
[people/jobs]
CompetitionBetween
Regions for Jobs
Business-Friendly
"Escalation"
Regulation
InfrastructureBacklog
Development"Tragedy of theCommons" for
Services &Infrastructure
DevelopmentCovers
InfrastructureCosts
RegionalFinancialPressure
Addiction" toGrowth &
Development
Development& Economic
Growth
Sprawl
-"Freedom to Farm"
Farm Commodity"Tragedy of the
Commons"
Farm &RanchIncome
Selling ofFarm & Ranch
Land forDevelopment
S
S
O
O
O
O
S
S
S
S
S
O
S
GasolinePrice
Demandfor
Gasoline
S S
SpeculationS
Wages
$ forHousing
AffordableHousing
Cost ofHousing
Efforts toIncreaseLand UseIntensity
Promoting LocalRegion Economic &Population Growth
S
S
S
S
O
DevelopmentValue of
Outlying Land
Value of Landfor Farming &
Ranching
S
S
O
DelayedInfrastructure
Demands
S
Fosteringthe "Growth
Machine"
SS
S
Road Building"Fix that Fails"
Federal &State RoadInvestment
DevelopmentImpact Fees S
Attractivenessof Driving
TrafficVolume
S
S
S
S
Adequacyof PublicTransit
O
TheAttractiveness
Principle
Our RegionAttractiveness
OS
S
Federal & StatePublic Transit
Investment
S
-"ErodingGoals" - or
"Boiled Frog"
Size ofAccessible
Region
CitizenPressure to Do
Something
O
S
Urban vsSuburbanDifferential
Taxes
S
Our Region AttractsBusinesses &
People
GrowthFriendly
Gov't Policy
CampaignContributions
SContributions
to PromoteEcon Dev
S
S
S
S
S
S
S S
S
Qualityof Life
S
GrowthMachineProfits
<GrowthMachineProfits>
S
DriveUntil
Qualify
S
S
S
S
Incentive forGrowth
Machine toPromote TaxesO
Taxes
O
O
Pressurefor TaxesS
S
O
Pressureto BuildRoads
Pressureto BuildPublicTransit
ApparentRelative Cost
of PublicTransit
ApparentCost ofDriving
S
O O
O
O
S
TrafficCongestion S
S
RoadBuilding
S
O
O
O
S
eO
S
S
S
B3Road
Building
R5
TransitUse
<Efforts toIncrease LandUse Intensity>
S
O
B10
ConstructionInnovation
S
PricinPressure
O
<GrowthMachineProfits>
S
S
xes for
CropPrice
SupportsO
S
<Gasoline Price>
S
SO
S
b
c
a
Tendency forCities to Attract
Industry, NotResidential
Ability to TaxResidential
Ability to TaxBusiness
O
S
S
Rate ofIncrease of
InfrastructureBacklog
Rate ofDecreasein Quality
of Life
SS
OO
<Development CoversInfrastructure Costs>
InnovationS
O
B12
Tax toSupport
Development
S
Farm CommoditySupply
Pressure forMixed Use
Development Mixed UseDevelopment
S
S
<Mixed UseDevelopment>
O
B13 MixedUse
<Development& Economic
Growth>
S
Land UseIntensifies
R21
<PricingPressure>
S
o
o
<Taxes>
<Taxes>
O
S
<Selling ofFarm & Ranch
Land forDevelopment>
S
S
Housing CostsRiseB16
R4abc
Induce Trafficby Economic
Growth, RegionSize, Driving
Attractiveness
O
<DevelopmentImpact Fees>
O
B11
CitizenPressurefor Fees
<Cost ofHousing>
O
Land ValuesWill Rise
R8
o
o
CompetitionBetween
People forJobs
Race-to-the-Bottom Wage"Escalation"
SO
Figure 2. The Tangle of Growth
Free Market BalancesSuppy & Demand,
even when Inelastic
Growth isGood, Growth
'Pays for Itself"
Fear of Inflation,Phillips Curve
Road BuildingReduces
Congestion,Linear Thinking
PublicTransit is
TooExpensive
There's a Glut of Oil (rather than a Glut of OilWells), The Less We Take into Account the
Negative Externalities of Using Gasoline, WeBelieve a Future Lack of Supply Will Not Make
the Region Economically Uncompetitive
B2
Attract UntilUnattractive
FarmAid
B7
Motivation ofExchange Value
InterestsMotivation of Immobile,
Volume-DependentBusinesses
Bob Powell, Ph.D., MBA • • Continuous Improvement Associates © 2003 • • [email protected] • • 719 599-0977 • • Rev 01/06/03 • • page 19
O
B6
Sprawl& GasPrice
Other Region'sAttractiveness
Taxes OutsidRegion
g
R9
They'llDrive
Further
R1
InfrastructureTrap
R18
DevelopmentProfitabilityR19
Growth MachineInfluence on Growth
R20GrowthMachineInfluenceon Fees
B14Need TaQual of Life
Fed Policy"tightness"
[people/jobs]
CompetitionBetween
Regions for Jobs
Business-Friendly
"Escalation"
Regulation
InfrastructureBacklog
Development"Tragedy of theCommons" for
Services &Infrastructure
DevelopmentCovers
InfrastructureCosts
RegionalFinancialPressure
Addiction" toGrowth &
Development
Development& Economic
Growth
S
S
O
O
O
O
S
S
S
Wages
$ forHousing
AffordableHousing
S
S
S
DelayedInfrastructure
Demands
S
TheAttractiveness
Principle
Our RegionAttractiveness
OS
S Our Region AttractsBusinesses &
People
S
Qualityof Life
S
S
Taxes
O
O
S
Rate ofIncrease of
InfrastructureBacklog
Rate ofDecreasein Quality
of Life
SS
O
o
o o
o
CompetitionBetween
People forJobs
Race-to-the-Bottom Wage"Escalation"
SO
Figure 3. The Effect of Inflationary Fears, The Infrastructure Trap, & The Attractiveness Principle
Other Region'sAttractiveness
R1
InfrastructureTrap
Fear of Inflation,Phillips Curve
B2
Attract UntilUnattractive
Bob Powell, Ph.D., MBA • • Continuous Improvement Associates © 2003 • • [email protected] • • 719 599-0977 • • Rev 01/06/03 • • page 20
InfrastructureBacklog
RegionalFinancialPressure
Addiction" toGrowth &
Development
Development& Economic
Growth
Sprawl
S
S
S
GasolinePrice
Demandfor
Gasoline
S S
DelayedInfrastructure
Demands
S
Road Building"Fix that Fails"
Federal &State RoadInvestment
Attractivenessof Driving
TrafficVolume
S
S
S
S
Adequacyof PublicTransit
O
Federal & StatePublic Transit
Investment
S
Size ofAccessible
Region
S SPressureto BuildRoads
Pressureto BuildPublicTransit
ApparentRelative Cost
of PublicTransit
ApparentCost ofDriving
S
O O
O
O
S
TrafficCongestion S
S
RoadBuilding
S
O
O
O
S
S
S
B3Road
Building
R5
TransitUse
<Gasoline Price>
S
SO
S
b
c
a
Rate ofIncrease of
InfrastructureBacklog
S
o
o
S
R4abc
Induce Trafficby Economic
Growth, RegionSize, Driving
Attractiveness
o
o
Figure 4. Road Building & Public Transportation
Road BuildingReduces
Congestion,Linear Thinking
PublicTransit is
TooExpensive
There's a Glut of Oil (rather than a Glut of OilWells), The Less We Take into Account the
Negative Externalities of Using Gasoline, WeBelieve a Future Lack of Supply Will Not Make
the Region Economically Uncompetitive
O
B6
Sprawl& GasPriceR1
InfrastructureTrap
Bob Powell, Ph.D., MBA • • Continuous Improvement Associates © 2003 • • [email protected] • • 719 599-0977 • • Rev 01/06/03 • • page 21
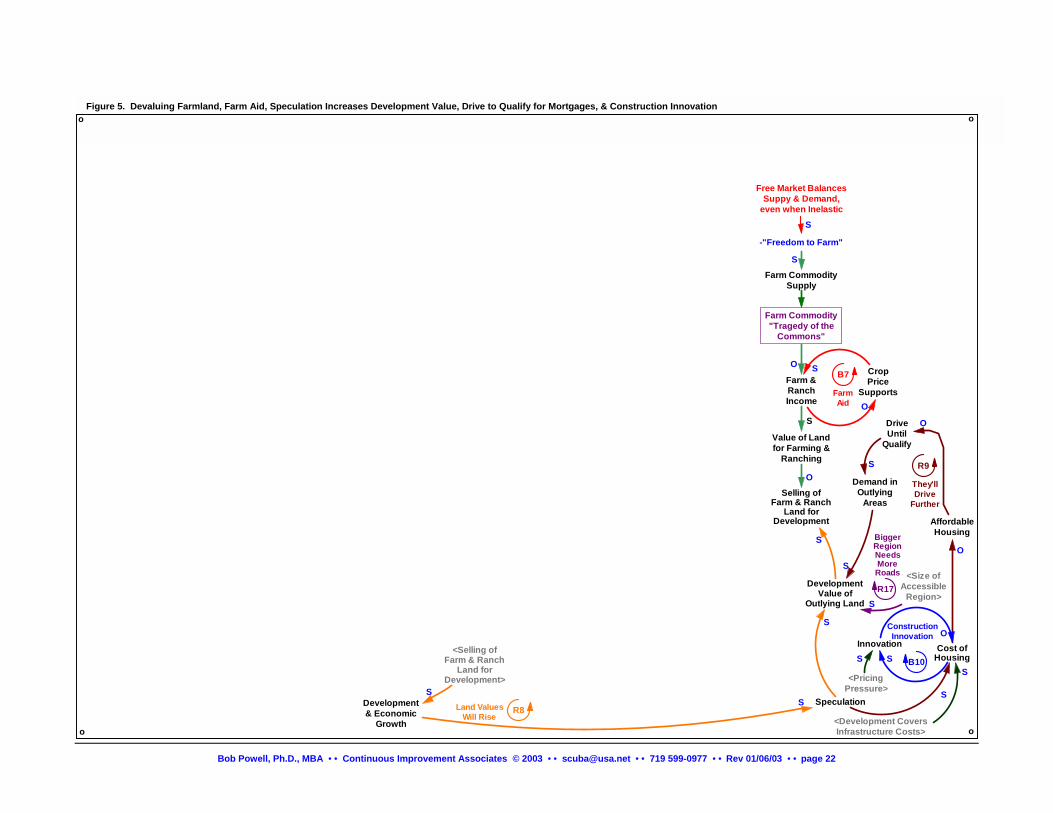
<Size ofAccessible
Region>
Demand inOutlying
Areas
R17
BiggerRegionNeedsMoreRoads
Development& Economic
Growth
-"Freedom to Farm"
Farm Commodity"Tragedy of the
Commons"
Farm &RanchIncome
Selling ofFarm & Ranch
Land forDevelopment
S
O
S
SpeculationS
AffordableHousing
Cost ofHousing
S
O
DevelopmentValue of
Outlying Land
Value of Landfor Farming &
Ranching
S
S
O
S
DriveUntil
Qualify
S
S
B10
ConstructionInnovation
CropPrice
SupportsO
S
<Development CoversInfrastructure Costs>
InnovationS
O
S
Farm CommoditySupply
<PricingPressure>
S
o
o
S
<Selling ofFarm & Ranch
Land forDevelopment>
S
O
Land ValuesWill Rise
R8
o
o
Figure 5. Devaluing Farmland, Farm Aid, Speculation Increases Development Value, Drive to Qualify for Mortgages, & Construction Innovation
Free Market BalancesSuppy & Demand,
even when Inelastic
FarmAid
B7
R9
They'llDrive
Further
Bob Powell, Ph.D., MBA • • Continuous Improvement Associates © 2003 • • [email protected] • • 719 599-0977 • • Rev 01/06/03 • • page 22
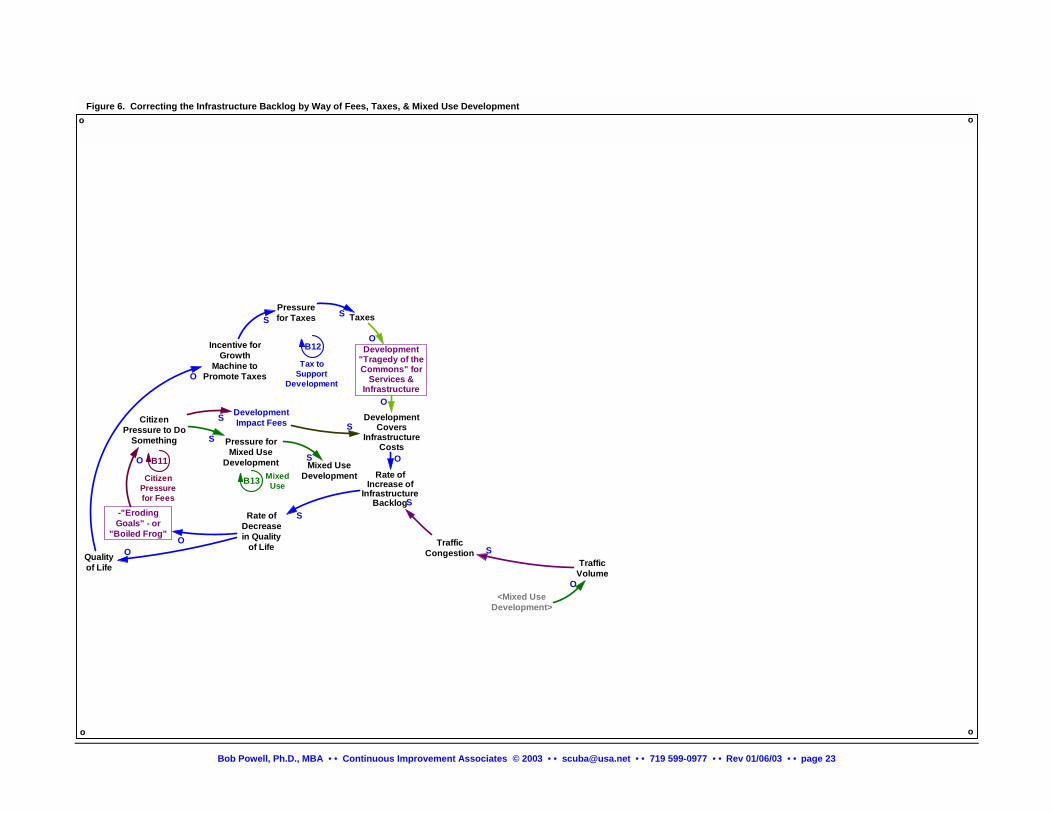
Development"Tragedy of theCommons" for
Services &Infrastructure
DevelopmentCovers
InfrastructureCosts
O
O
DevelopmentImpact Fees S
TrafficVolume
-"ErodingGoals" - or
"Boiled Frog"
CitizenPressure to Do
Something
O
S
Qualityof Life
Incentive forGrowth
Machine toPromote TaxesO
Taxes
O
Pressurefor TaxesS
S
TrafficCongestion S
S
Rate ofIncrease of
InfrastructureBacklog
Rate ofDecreasein Quality
of Life
S
OO
B12
Tax toSupport
Development
Pressure forMixed Use
Development Mixed UseDevelopment
S
S
<Mixed UseDevelopment>
O
B13 MixedUse
o
o
B11
CitizenPressurefor Fees
o
o
Figure 6. Correcting the Infrastructure Backlog by Way of Fees, Taxes, & Mixed Use Development
Bob Powell, Ph.D., MBA • • Continuous Improvement Associates © 2003 • • [email protected] • • 719 599-0977 • • Rev 01/06/03 • • page 23
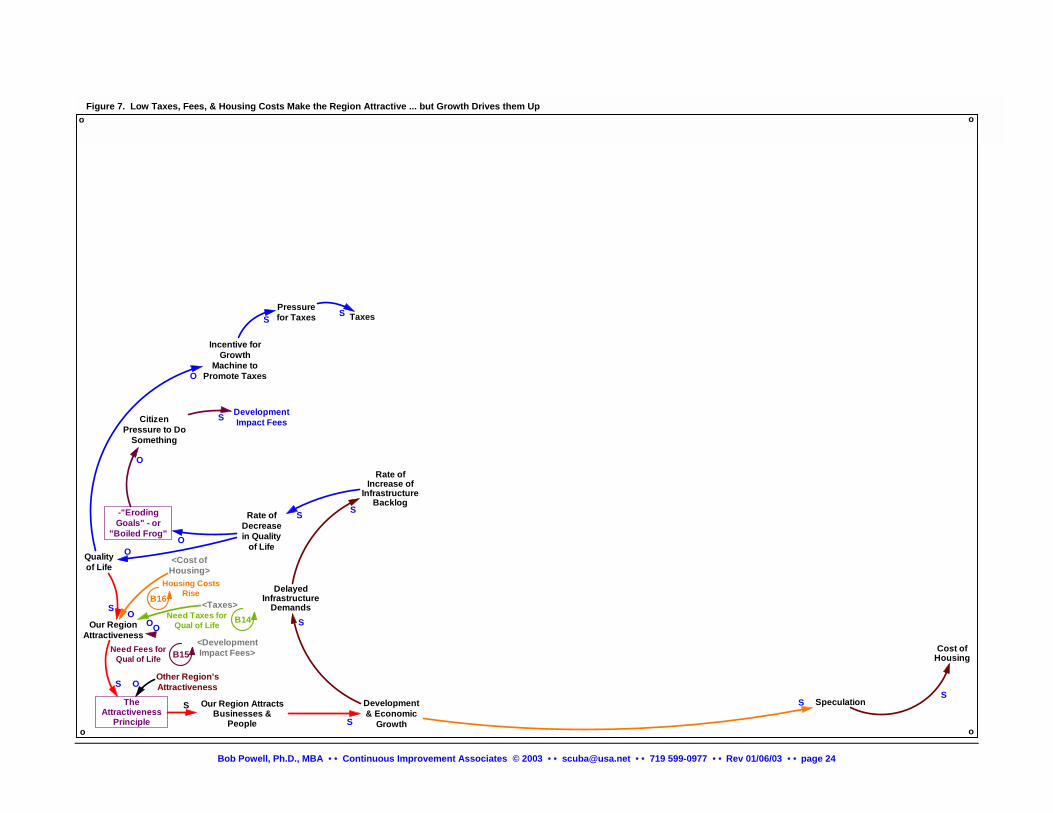
B15Need Fees forQual of Life
Development& Economic
Growth
SpeculationS
Cost ofHousing
S
DelayedInfrastructure
Demands
S
DevelopmentImpact Fees
TheAttractiveness
Principle
Our RegionAttractiveness
OS
S
-"ErodingGoals" - or
"Boiled Frog"
CitizenPressure to Do
Something
O
S
Our Region AttractsBusinesses &
People
Qualityof Life
S
S
Incentive forGrowth
Machine toPromote TaxesO
TaxesPressurefor TaxesS
S
Sxes for
Rate ofIncrease of
InfrastructureBacklog
Rate ofDecreasein Quality
of Life
S
OO
o
o
<Taxes>
O
Housing CostsRiseB16
<DevelopmentImpact Fees>
O
<Cost ofHousing>
O
o
o
Figure 7. Low Taxes, Fees, & Housing Costs Make the Region Attractive ... but Growth Drives them Up
B14Need TaQual of Life
Other Region'sAttractiveness
Bob Powell, Ph.D., MBA • • Continuous Improvement Associates © 2003 • • [email protected] • • 719 599-0977 • • Rev 01/06/03 • • page 24
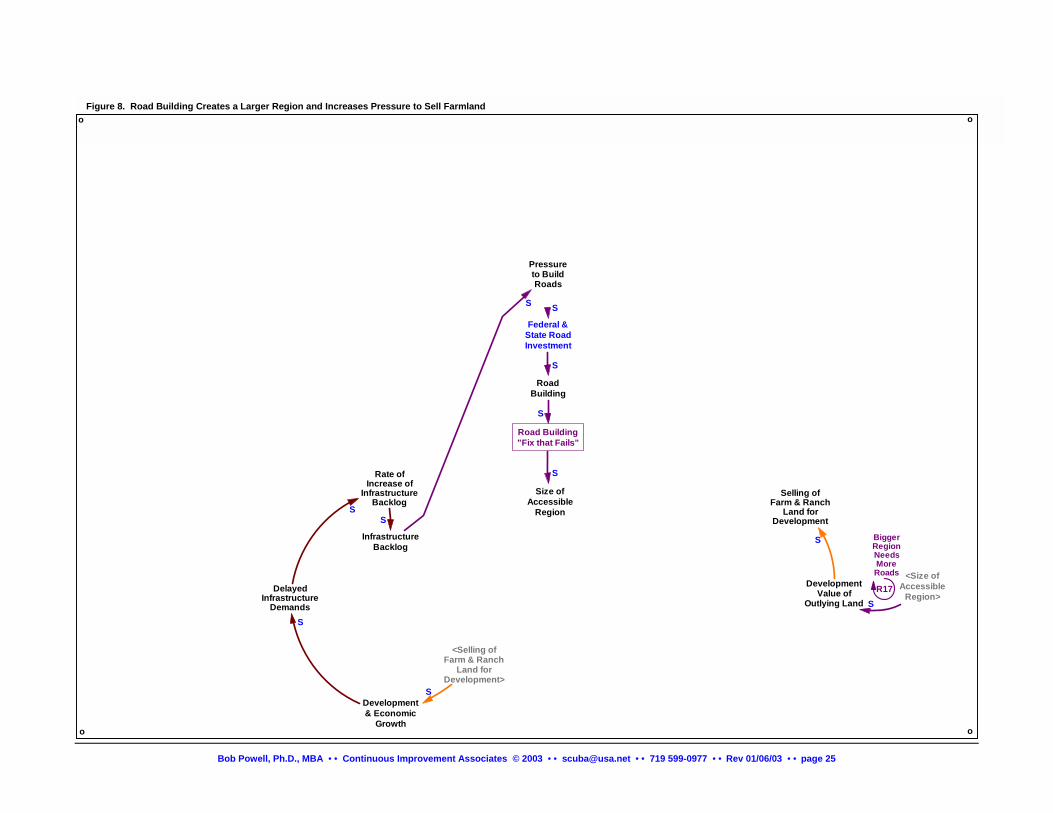
<Size ofAccessible
Region>R17
BiggerRegionNeedsMoreRoads
InfrastructureBacklog
Development& Economic
Growth
Selling ofFarm & Ranch
Land forDevelopment
DevelopmentValue of
Outlying Land
S
DelayedInfrastructure
Demands
S
Road Building"Fix that Fails"
Federal &State RoadInvestment
S
Size ofAccessible
Region
Pressureto BuildRoads
S
RoadBuilding
S
S
SRate ofIncrease of
InfrastructureBacklog
S
o
o
S
<Selling ofFarm & Ranch
Land forDevelopment>
S
S
o
o
Figure 8. Road Building Creates a Larger Region and Increases Pressure to Sell Farmland
Bob Powell, Ph.D., MBA • • Continuous Improvement Associates © 2003 • • [email protected] • • 719 599-0977 • • Rev 01/06/03 • • page 25
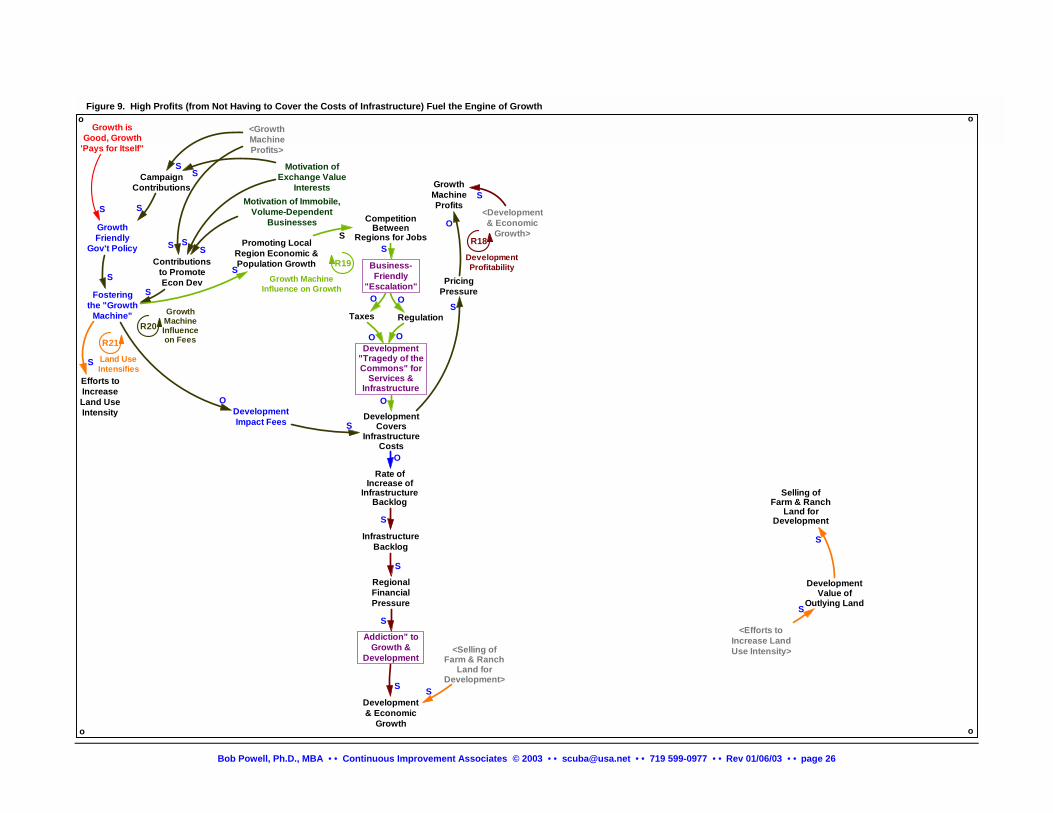
CompetitionBetween
Regions for Jobs
Business-Friendly
"Escalation"
Regulation
InfrastructureBacklog
Development"Tragedy of theCommons" for
Services &Infrastructure
DevelopmentCovers
InfrastructureCosts
RegionalFinancialPressure
Addiction" toGrowth &
Development
Development& Economic
Growth
Selling ofFarm & Ranch
Land forDevelopment
S
O
O
O
O
S
S
S
Efforts toIncreaseLand UseIntensity
Promoting LocalRegion Economic &Population Growth
DevelopmentValue of
Outlying Land
S
Fosteringthe "Growth
Machine"
SS
S
DevelopmentImpact Fees S
GrowthFriendly
Gov't Policy
CampaignContributions
SContributions
to PromoteEcon Dev
S
S
S
S
S
GrowthMachineProfits
<GrowthMachineProfits>
S
S
Taxes
O
O
O
<Efforts toIncrease LandUse Intensity>
S
S
PricinPressure
O
S
Rate ofIncrease of
InfrastructureBacklog
S
<Development& Economic
Growth>
S
Land UseIntensifies
R21
o
o
<Selling ofFarm & Ranch
Land forDevelopment>
S
o
o
Figure 9. High Profits (from Not Having to Cover the Costs of Infrastructure) Fuel the Engine of Growth
Growth isGood, Growth
'Pays for Itself"
Motivation ofExchange Value
InterestsMotivation of Immobile,
Volume-DependentBusinesses
g
R18
DevelopmentProfitabilityR19
Growth MachineInfluence on Growth
R20GrowthMachineInfluenceon Fees
Bob Powell, Ph.D., MBA • • Continuous Improvement Associates © 2003 • • [email protected] • • 719 599-0977 • • Rev 01/06/03 • • page 26
The Tangle of Growth: A Dynamic Analysis
Introduction The issues surrounding growth are complex … and that’s an understatement. Opponents of growth management, or growth limitations, often refer to “unintended consequences” as a basis for questioning limitations. However, political, economic and social “unintended consequences” of growth already abound. Our current policies affect growth, sprawl, housing prices, transportation congestion, infrastructure backlogs and many other observable problems in a variety of ways.
To understand why things are happening as they are, and develop effective policies, we must use systems thinking, rather than linear thinking. There are two reasons we need to make this shift: 13
First, our cognitive maps of the causal structure of systems are vastly simplified compared to the complexity of the systems themselves. Second, we are unable to infer correctly the dynamics of all but the simplest causal maps. Both are direct conse-quences of “bounded rationality” … Axelrod14 found virtually no feedback processes in the cognitive maps of political elites; rather people tended to formulate intuitive decision trees relating possible actions to probable consequences – an event level representation.
So we tend to see only part of the structure and not be aware of feedback processes or their impacts. And this isn’t just a problem for some of us; it’s the human condition. We can improve our intuition in dynamically complex situations, but it takes practice. And even then, system dynamics modeling and simulation are most often necessary, because in most cases the system is just too complex. Professor Sterman notes the problem is similar to one where, even if we know the laws of physics, we cannot figure out in our heads what happens when galaxies collide.
Short of full-scale simulations, the system diagrams in this paper make it possible to think together about what’s driving the behaviors we observe. It’s not that the diagrams are proven truth; they’re not. In fact, they’re innately wrong in that they are an approximation at best. The main point is that they provide a way to think about such dynamically complex problems, to make that thinking explicit, and to make the communication of that thinking practical. The alternative of describing the dy-namics in written paragraphs is extremely cumbersome.
Some of the models shown here are complex. That’s because the problems are complex. I have made an effort to provide a logical rationale for their structure and I have “tested” them with several persons to see if the logic is reasonable and coherent. But the main point is for others to test them against their own thinking and to change or enhance them to improve our under-standing of the problems we face. A disagreement will not necessarily indicate an invalid point of view, but instead it will in-dicate that other valid effects should be included.
Everything should be made as simple as possible, … but not simpler.
Albert Einstein, (1879 - 1955)
Bob Powell, Ph.D., MBA • • Continuous Improvement Associates © 2003 • • [email protected] • • 719 599-0977 • • Rev 01/06/03 • • page 27
13 John Sterman, “Learning in and about complex systems,” System Dynamics Review, Summer-Fall 1994. 14 Sterman reference: R. Axelrod, The Structure of Decision: The Cognitive Maps of Political Elites, 1976, Princeton University Press.
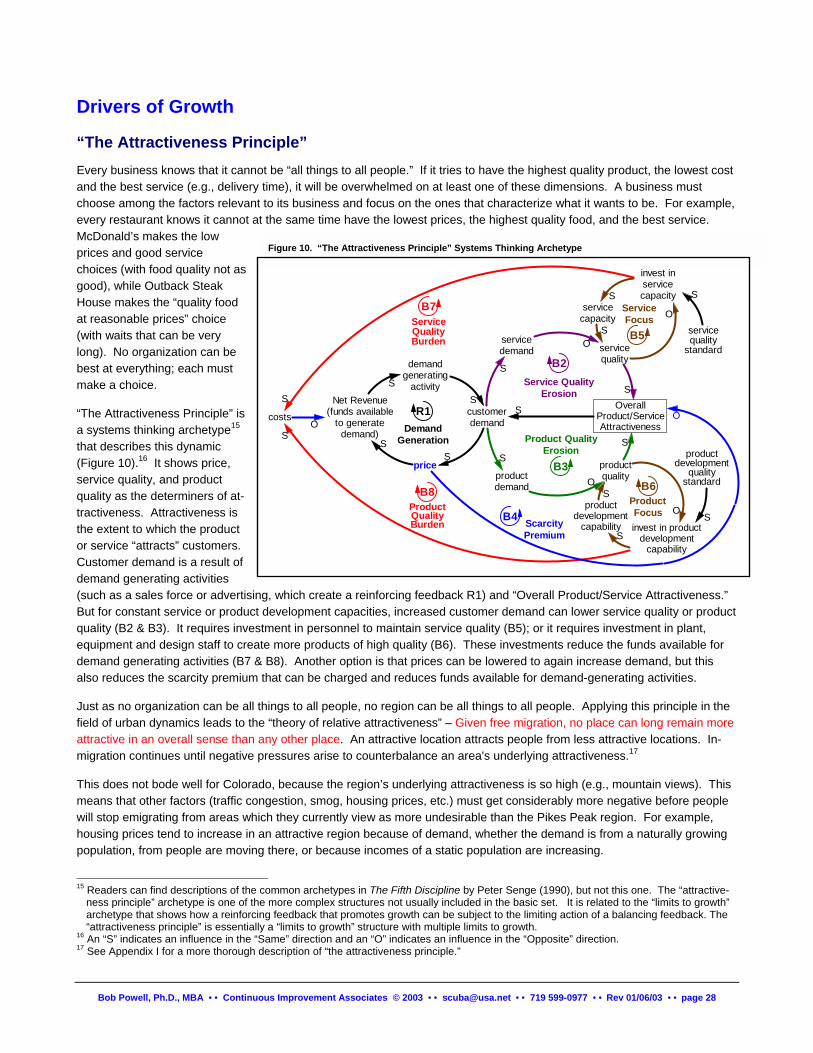
Drivers of Growth
“The Attractiveness Principle” Every business knows that it cannot be “all things to all people.” If it tries to have the highest quality product, the lowest cost and the best service (e.g., delivery time), it will be overwhelmed on at least one of these dimensions. A business must choose among the factors relevant to its business and focus on the ones that characterize what it wants to be. For example, every restaurant knows it cannot at the same time have the lowest prices, the highest quality food, and the best service. McDonald’s makes the low prices and good service choices (with food quality not as good), while Outback Steak House makes the “quality food at reasonable prices” choice (with waits that can be very long). No organization can be best at everything; each must make a choice.
“The Attractiveness Principle” is a systems thinking archetype15 that describes this dynamic (Figure 10).16 It shows price, service quality, and product quality as the determiners of at-tractiveness. Attractiveness is the extent to which the product or service “attracts” customers. Customer demand is a result of demand generating activities (such as a sales force or advertising, which create a reinforcing feedback R1) and “Overall Product/Service Attractiveness.” But for constant service or product development capacities, increased customer demand can lower service quality or product quality (B2 & B3). It requires investment in personnel to maintain service quality (B5); or it requires investment in plant, equipment and design staff to create more products of high quality (B6). These investments reduce the funds available for demand generating activities (B7 & B8). Another option is that prices can be lowered to again increase demand, but this also reduces the scarcity premium that can be charged and reduces funds available for demand-generating activities.
OverallProduct/ServiceAttractiveness
R1
B3
Product QualityErosion
price productquality
servicequality
customerdemand
demandgenerating
activityS
servicedemand
productdemand
invest inservicecapacity
invest in productdevelopment
capability
productdevelopment
qualitystandard
servicequality
standard
S
O
S
S
OS
costs
S
O
S
S
O
SS
SS
Service QualityErosion
B2
Net Revenue(funds available
to generatedemand)
O
S
S
ScarcityPremium
servicecapacity
S
productdevelopment
capability
S
S
DemandGeneration
B4
O
Figure 10. “The Attractiveness Principle” Systems Thinking Archetype
ProductQualityBurden
ServiceQualityBurden
B7
B8 B6ProductFocus
B5
ServiceFocus
Just as no organization can be all things to all people, no region can be all things to all people. Applying this principle in the field of urban dynamics leads to the “theory of relative attractiveness” – Given free migration, no place can long remain more attractive in an overall sense than any other place. An attractive location attracts people from less attractive locations. In-migration continues until negative pressures arise to counterbalance an area's underlying attractiveness.17
This does not bode well for Colorado, because the region’s underlying attractiveness is so high (e.g., mountain views). This means that other factors (traffic congestion, smog, housing prices, etc.) must get considerably more negative before people will stop emigrating from areas which they currently view as more undesirable than the Pikes Peak region. For example, housing prices tend to increase in an attractive region because of demand, whether the demand is from a naturally growing population, from people are moving there, or because incomes of a static population are increasing.
15 Readers can find descriptions of the common archetypes in The Fifth Discipline by Peter Senge (1990), but not this one. The “attractive-
ness principle” archetype is one of the more complex structures not usually included in the basic set. It is related to the “limits to growth” archetype that shows how a reinforcing feedback that promotes growth can be subject to the limiting action of a balancing feedback. The “attractiveness principle” is essentially a “limits to growth” structure with multiple limits to growth.
16 An “S” indicates an influence in the “Same” direction and an “O” indicates an influence in the “Opposite” direction. 17 See Appendix I for a more thorough description of “the attractiveness principle.”
Bob Powell, Ph.D., MBA • • Continuous Improvement Associates © 2003 • • [email protected] • • 719 599-0977 • • Rev 01/06/03 • • page 28
It’s important to understand that “attractive” does not mean “prettier.” It means that there is a composite set of factors that attract. A location could be ugly and still “attractive,” if other factors are favorable. The other factors could be the price of land, tax structure, cultural amenities, investment incentives or robust economic activity. In addition, attractiveness factors can be different for different industries. For example, once a critical mass of a given industry develops with a base of suppliers and customers, a region can be attractive for that economic cluster, even though it may not be attractive to other industries.18
Population overshoot In addition, perception delays can cause population to overshoot, thus exaggerating the negative impact of growth. In-migration in response to past attractiveness differentials can lead people continue to move to an area after population growth, congestion, and housing affordability have already worsened. Other delays are introduced because development can be approved, producing early increases in economic activity that boost sales taxes and construction wages; but years later, when the residents move in, there is increased load on infrastructure (e.g., schools and roads) and we feel the negative impacts.
Such delays create what’s known as “dynamic complexity” in a system. Even relatively simple situations can become dy-namically complex when delays are introduced. For example, most individuals can drive perfectly well under normal condi-tions, but not when reflexes are slowed due to the influence of alcohol. Delays make economies and organizations difficult to manage for the same reason humans cannot safely drive when drunk. An urban example is the well-known cycle of boom and bust in the real estate industry. Market boom and bust cycles are a major problem that led John Sterman to title a chap-ter in Business Dynamics as, “The invisible hand sometimes shakes.”
Business recruitment strategy The Greater Colorado Springs Economic Development Corporation uses this relative attractiveness to recruit companies and people from California and other parts of the U.S. As noted above, this is a selling point as Colorado Springs is more attrac-tive than LA, and other places from which people and companies come, but only as long as Colorado Springs is more attrac-tive than the other locations.
A model on road building to relieve traffic congestion The traffic problem in Colorado Springs is a local example of a national problem. The nation as a whole, including Colorado Springs, is in denial. Peter Schwartz describes the problem. He was a scenario planner at Royal Dutch/Shell Group and clearly a “systems thinker.”19
In Japan, I came to realize, people accepted their problems as challenges to be met. Through meeting them, people would grow and improve. I thought of the infrastructure problem in the United States, which most governments have ignored, hoping it would go away. Yet our highways and roads are literally disintegrating, and it will take hundreds of billions of dollars to repair the dam-age. We don't see that as a challenge to be overcome, as we did the space race, but as an ugly unsolvable problem to be denied. Predetermined elements [things that seems certain, no matter which scenario comes to pass] are fearful sometimes because people tend to deny them. The chickens coming home to roost is a predetermined element. So is the next payment on our loan, or a project deadline that we hoped might never arrive. Gridlock is also predetermined. To calculate the amount of gridlock in 2000, look at the number of people of driving age. Multiply it by the average number of cars per person in America. Then calcu-late the increase in highway mileage, based on construction projects started in the last five years. (It takes at least five years, and usually more, to build an urban highway.) Even if tomorrow the United States embarked on an unprecedented effort to build highways and mass transit systems, it would be too late; we can be certain that seven or eight large urban areas in the United States will be frozen with traffic gridlock.
A natural response to traffic congestion is to call for new roads and wider roads as a remedy. Linear thinking leads from the action, build roads, to the conclusion, less congestion. And that’s that.
However, common experience, as well as economic and system dynamics studies, tell us that road building does not relieve congestion. We can’t build roads fast enough to keep up with the new demands caused by increased traffic. That’s because any temporary reduction in congestion by reducing travel time leads to more traffic and more congestion. This is called “in-
18 Colorado Springs is focusing on developing several economic clusters to reinforce this attraction. 19 Peter Schwartz, The Art of the Long View, Planning for the Future in an Uncertain World, 1991, p. 74 and p. 113.
Bob Powell, Ph.D., MBA • • Continuous Improvement Associates © 2003 • • [email protected] • • 719 599-0977 • • Rev 01/06/03 • • page 29
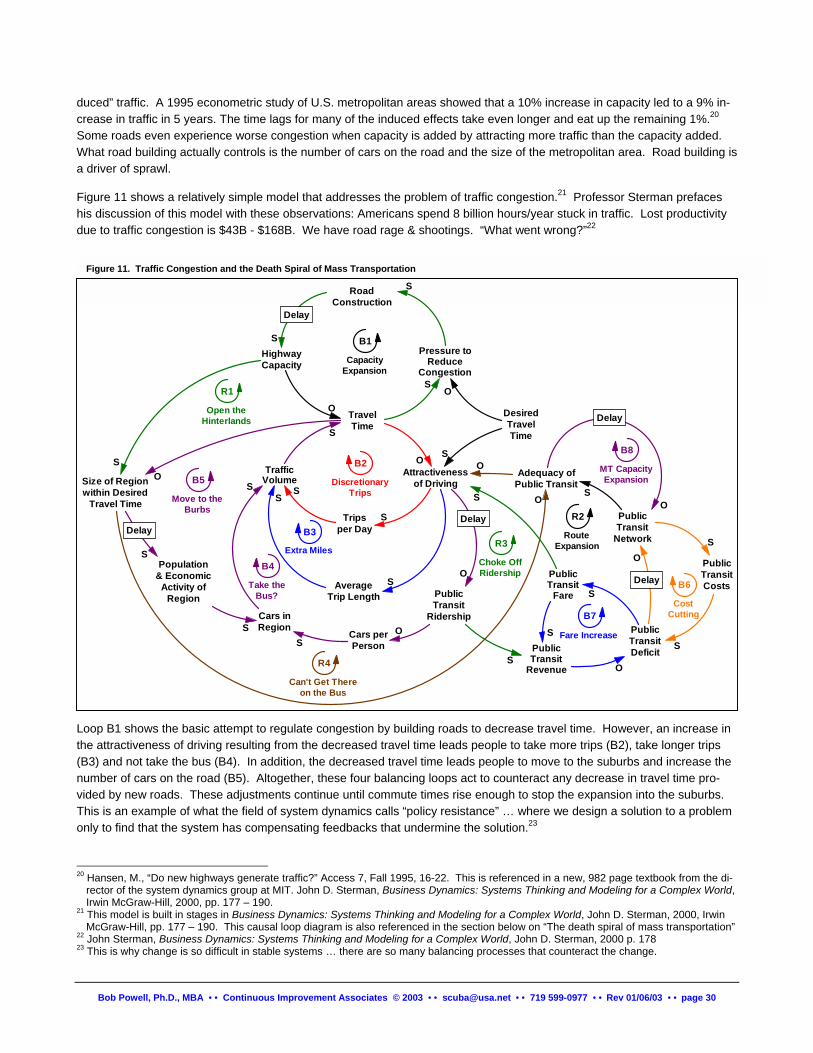
duced” traffic. A 1995 econometric study of U.S. metropolitan areas showed that a 10% increase in capacity led to a 9% in-crease in traffic in 5 years. The time lags for many of the induced effects take even longer and eat up the remaining 1%.20 Some roads even experience worse congestion when capacity is added by attracting more traffic than the capacity added. What road building actually controls is the number of cars on the road and the size of the metropolitan area. Road building is a driver of sprawl.
Figure 11 shows a relatively simple model that addresses the problem of traffic congestion.21 Professor Sterman prefaces his discussion of this model with these observations: Americans spend 8 billion hours/year stuck in traffic. Lost productivity due to traffic congestion is $43B - $168B. We have road rage & shootings. “What went wrong?”22
O
Delay
S
O
Delay
RoadConstruction
HighwayCapacity
Pressure toReduce
Congestion
TravelTime
Size of Regionwithin Desired
Travel Time
Population& Economic
Activity ofRegion
TrafficVolume
Tripsper Day
Attractivenessof Driving
Adequacy ofPublic Transit
PublicTransit
Network
PublicTransit
Fare
PublicTransit
Revenue
PublicTransitDeficit
PublicTransitCosts
PublicTransit
Ridership
Cars perPerson
Cars inRegion
DesiredTravelTime
AverageTrip Length
S
O
S
S
O
S
S
S
S
O
S
S
OS
S
S
SO
O
S
S
S
O
S
S
S
OSO
Delay
Delay
Delay
B1
CapacityExpansion
R1
Open theHinterlands
B5
Move to theBurbs
R2
RouteExpansion
B7
Fare Increase
R3
Choke OffRidership
B3
Extra Miles
B4
Take theBus?
B6
CostCutting
B8
MT CapacityExpansion
Figure 11. Traffic Congestion and the Death Spiral of Mass Transportation
B2
DiscretionaryTrips
R4
Can't Get Thereon the Bus
Loop B1 shows the basic attempt to regulate congestion by building roads to decrease travel time. However, an increase in the attractiveness of driving resulting from the decreased travel time leads people to take more trips (B2), take longer trips (B3) and not take the bus (B4). In addition, the decreased travel time leads people to move to the suburbs and increase the number of cars on the road (B5). Altogether, these four balancing loops act to counteract any decrease in travel time pro-vided by new roads. These adjustments continue until commute times rise enough to stop the expansion into the suburbs. This is an example of what the field of system dynamics calls “policy resistance” … where we design a solution to a problem only to find that the system has compensating feedbacks that undermine the solution.23
20 Hansen, M., “Do new highways generate traffic?” Access 7, Fall 1995, 16-22. This is referenced in a new, 982 page textbook from the di-
rector of the system dynamics group at MIT. John D. Sterman, Business Dynamics: Systems Thinking and Modeling for a Complex World, Irwin McGraw-Hill, 2000, pp. 177 – 190.
21 This model is built in stages in Business Dynamics: Systems Thinking and Modeling for a Complex World, John D. Sterman, 2000, Irwin McGraw-Hill, pp. 177 – 190. This causal loop diagram is also referenced in the section below on “The death spiral of mass transportation”
22 John Sterman, Business Dynamics: Systems Thinking and Modeling for a Complex World, John D. Sterman, 2000 p. 178 23 This is why change is so difficult in stable systems … there are so many balancing processes that counteract the change.
Bob Powell, Ph.D., MBA • • Continuous Improvement Associates © 2003 • • [email protected] • • 719 599-0977 • • Rev 01/06/03 • • page 30
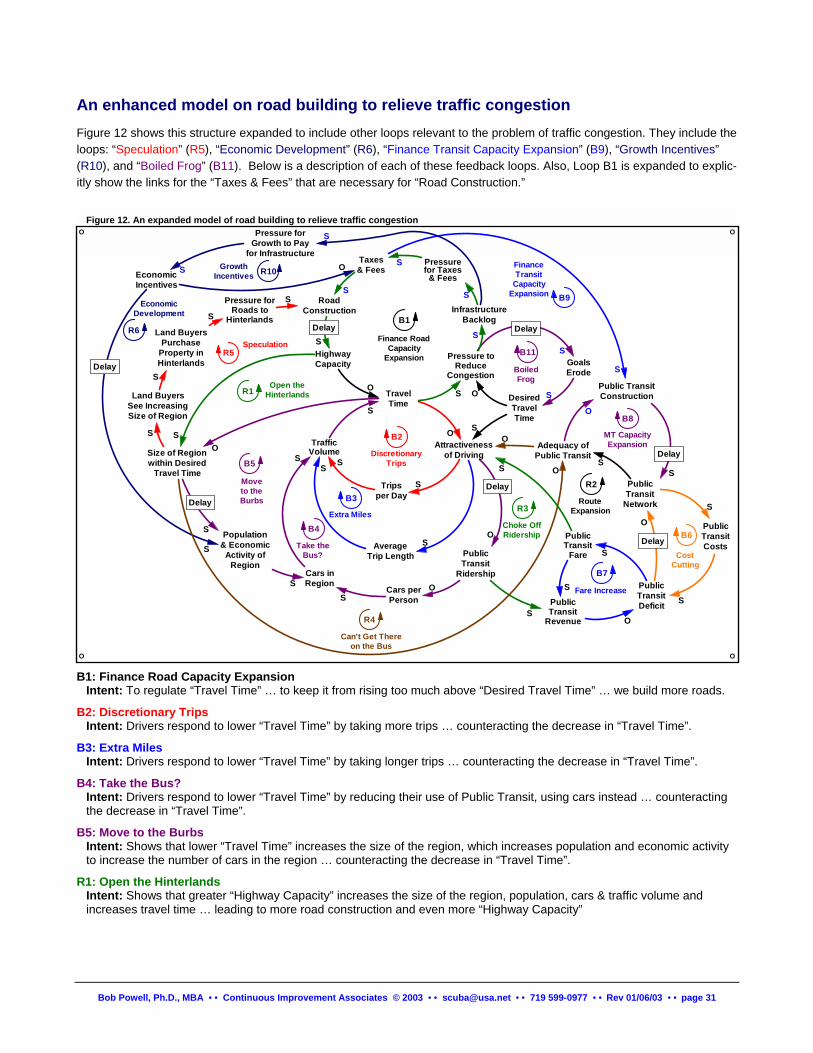
An enhanced model on road building to relieve traffic congestion Figure 12 shows this structure expanded to include other loops relevant to the problem of traffic congestion. They include the loops: “Speculation” (R5), “Economic Development” (R6), “Finance Transit Capacity Expansion” (B9), “Growth Incentives” (R10), and “Boiled Frog” (B11). Below is a description of each of these feedback loops. Also, Loop B1 is expanded to explic-itly show the links for the “Taxes & Fees” that are necessary for “Road Construction.”
S
Delay
S
O
DelayS O
RoadConstruction
HighwayCapacity
Pressure toReduce
Congestion
TravelTime
Size of Regionwithin Desired
Travel Time
Population& Economic
Activity ofRegion
TrafficVolume
Tripsper Day
Attractivenessof Driving
Adequacy ofPublic Transit
PublicTransit
Network
PublicTransit
Fare
PublicTransit
Revenue
PublicTransitDeficit
PublicTransitCosts
PublicTransit
Ridership
Cars perPerson
Cars inRegion
DesiredTravelTime
AverageTrip Length
S
O S
S
O
S
S
S
S
O
S
S
OS
S
S
SO
O
S
S
S
O
S
S
S
OS S
Delay
Delay
Delay
B1
FinanceTransit
CapacityExpansion
R1Open the
Hinterlands
B9
BoiledFrog
R2
RouteExpansion
R10GrowthIncentives
R3
Choke OffRidership
B3
Extra Miles
B4
Take theBus?
B6
CostCutting
B8
MT CapacityExpansion
Land BuyersPurchase
Property inHinterlands
Pressure forRoads to
HinterlandsS
S
Land BuyersSee IncreasingSize of Region
S
S
InfrastructureBacklog
Pressurefor Taxes
& Fees
Taxes& Fees
Pressure forGrowth to Pay
for Infrastructure
S
S
S
EconomicIncentives
S O
Public TransitConstruction
O
S
B7
Fare Increase
GoalsErode
S
R6
EconomicDevelopment
Finance RoadCapacity
Expansion B11
B5
Moveto theBurbs
Delay
Delay
O
O
O
O S
Figure 12. An expanded model of road building to relieve traffic congestion
B2
DiscretionaryTrips
R5Speculation
R4
Can't Get Thereon the Bus
B1: Finance Road Capacity Expansion Intent: To regulate “Travel Time” … to keep it from rising too much above “Desired Travel Time” … we build more roads.
B2: Discretionary Trips Intent: Drivers respond to lower “Travel Time” by taking more trips … counteracting the decrease in “Travel Time”.
B3: Extra Miles Intent: Drivers respond to lower “Travel Time” by taking longer trips … counteracting the decrease in “Travel Time”.
B4: Take the Bus? Intent: Drivers respond to lower “Travel Time” by reducing their use of Public Transit, using cars instead … counteracting the decrease in “Travel Time”.
B5: Move to the Burbs Intent: Shows that lower “Travel Time” increases the size of the region, which increases population and economic activity to increase the number of cars in the region … counteracting the decrease in “Travel Time”.
R1: Open the Hinterlands Intent: Shows that greater “Highway Capacity” increases the size of the region, population, cars & traffic volume and increases travel time … leading to more road construction and even more “Highway Capacity”
Bob Powell, Ph.D., MBA • • Continuous Improvement Associates © 2003 • • [email protected] • • 719 599-0977 • • Rev 01/06/03 • • page 31
R5: Speculation Intent: As speculators see the size of the region increasing, they purchase property and pressure government to build roads for better access … additional “Road Construction” further increases the size of the region.
R4: Can’t Get There on the Bus Intent: As a region gets larger, existing Public Transit becomes less adequate. This increases the attractiveness of driving, which leads to more & longer trips and more cars, again increasing pressure for more “Road Construction” to increase “Highway Capacity”. This makes Transit even less adequate.
B7: Fare Increase Intent: As Public Transit Ridership falls, revenue falls. Raising fares can provide more revenue.
R3: Choke Off Ridership Intent: But raising transit fares makes driving relatively more attractive, further decreasing Transit Ridership.
B6: Cost Cutting Intent: Intent: The transit system can respond to deficits by decreasing the size of the network to cut costs.
R2: Route Expansion Intent: Intent: But downsizing network makes driving relatively more attractive, further decreasing Transit Ridership.
B8: MT Capacity Expansion Intent: We can make Transit more attractive by more transit construction, but it takes lots of time and money.
B9: Finance Transit Capacity Expansion Intent: Shows the alternative to “Road Construction” spending.
R6: Economic Development Intent: As “Pressure for Taxes & Fees” mounts, there is more pressure economic incentives to promote growth to “pay for” infrastructure. After some delay, this increases the size of the region and the demand for more road construction.
R10: Growth Incentives Intent: Incentives reduce funds available for infrastructure.
B11: Boiled Frog Intent: Shows that increasing “Desired Travel Time” is one way to close the gap. This captures the “eroding goals” dynamic.
Bob Powell, Ph.D., MBA • • Continuous Improvement Associates © 2003 • • [email protected] • • 719 599-0977 • • Rev 01/06/03 • • page 32
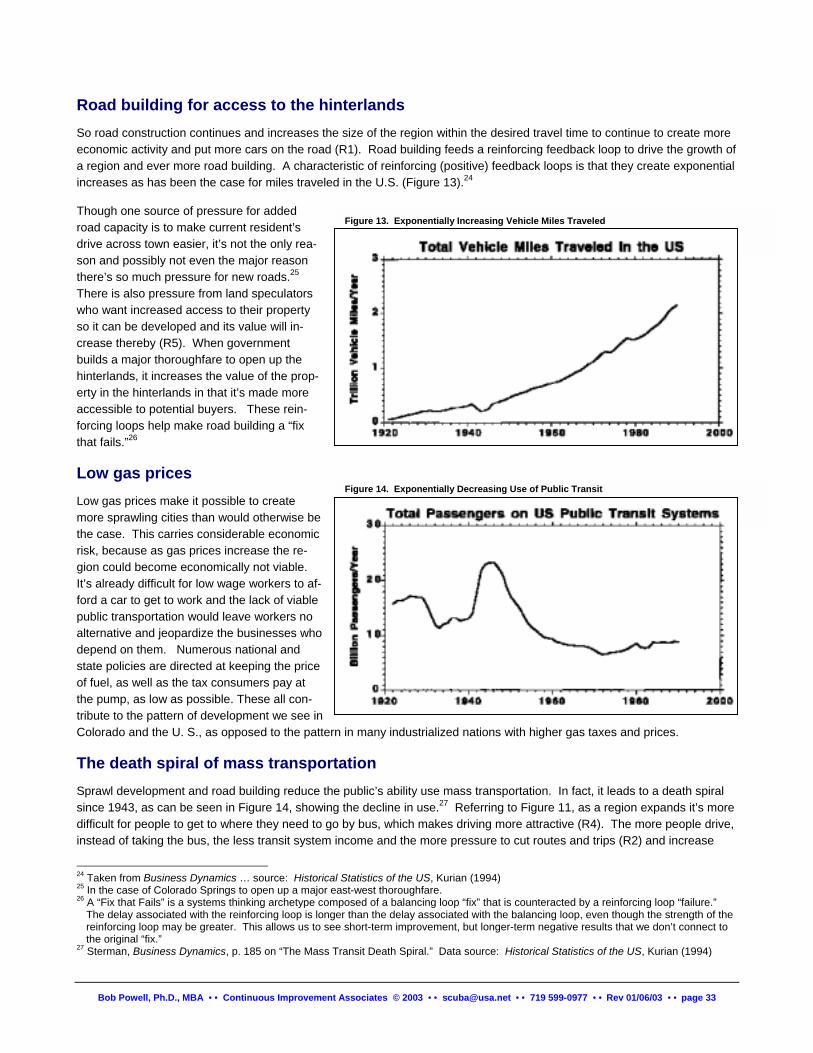
Road building for access to the hinterlands So road construction continues and increases the size of the region within the desired travel time to continue to create more economic activity and put more cars on the road (R1). Road building feeds a reinforcing feedback loop to drive the growth of a region and ever more road building. A characteristic of reinforcing (positive) feedback loops is that they create exponential increases as has been the case for miles traveled in the U.S. (Figure 13).24
Though one source of pressure for added road capacity is to make current resident’s drive across town easier, it’s not the only rea-son and possibly not even the major reason there’s so much pressure for new roads.25 There is also pressure from land speculators who want increased access to their property so it can be developed and its value will in-crease thereby (R5). When government builds a major thoroughfare to open up the hinterlands, it increases the value of the prop-erty in the hinterlands in that it’s made more accessible to potential buyers. These rein-forcing loops help make road building a “fix that fails.”26
Figure 13. Exponentially Increasing Vehicle Miles Traveled
Low gas prices Low gas prices make it possible to create more sprawling cities than would otherwise be the case. This carries considerable economic risk, because as gas prices increase the re-gion could become economically not viable. It’s already difficult for low wage workers to af-ford a car to get to work and the lack of viable public transportation would leave workers no alternative and jeopardize the businesses who depend on them. Numerous national and state policies are directed at keeping the price of fuel, as well as the tax consumers pay at the pump, as low as possible. These all con-tribute to the pattern of development we see in Colorado and the U. S., as opposed to the pattern in many industrialized nations with higher gas taxes and prices.
Figure 14. Exponentially Decreasing Use of Public Transit
The death spiral of mass transportation Sprawl development and road building reduce the public’s ability use mass transportation. In fact, it leads to a death spiral since 1943, as can be seen in Figure 14, showing the decline in use.27 Referring to Figure 11, as a region expands it’s more difficult for people to get to where they need to go by bus, which makes driving more attractive (R4). The more people drive, instead of taking the bus, the less transit system income and the more pressure to cut routes and trips (R2) and increase
24 Taken from Business Dynamics … source: Historical Statistics of the US, Kurian (1994) 25 In the case of Colorado Springs to open up a major east-west thoroughfare. 26 A “Fix that Fails” is a systems thinking archetype composed of a balancing loop “fix” that is counteracted by a reinforcing loop “failure.”
The delay associated with the reinforcing loop is longer than the delay associated with the balancing loop, even though the strength of the reinforcing loop may be greater. This allows us to see short-term improvement, but longer-term negative results that we don’t connect to the original “fix.”
27 Sterman, Business Dynamics, p. 185 on “The Mass Transit Death Spiral.” Data source: Historical Statistics of the US, Kurian (1994)
Bob Powell, Ph.D., MBA • • Continuous Improvement Associates © 2003 • • [email protected] • • 719 599-0977 • • Rev 01/06/03 • • page 33
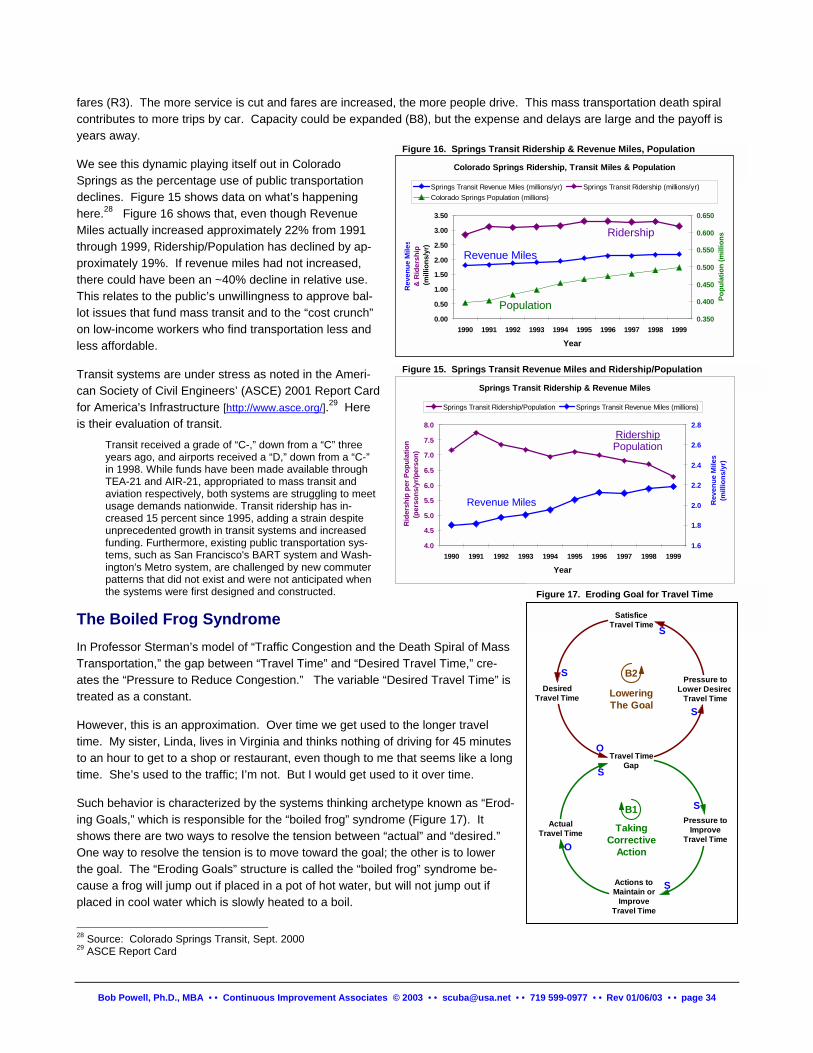
fares (R3). The more service is cut and fares are increased, the more people drive. This mass transportation death spiral contributes to more trips by car. Capacity could be expanded (B8), but the expense and delays are large and the payoff is years away.
Colorado Springs Ridership, Transit Miles & Population
0.00
0.50
1.00
1.50
2.00
2.50
3.00
3.50
1990 1991 1992 1993 1994 1995 1996 1997 1998 1999
Year
Rev
enue
Mile
s&
Rid
ersh
ip (m
illio
ns/y
r)
0.350
0.400
0.450
0.500
0.550
0.600
0.650
Popu
latio
n (m
illio
ns)
Springs Transit Revenue Miles (millions/yr) Springs Transit Ridership (millions/yr)Colorado Springs Population (millions)
Population
Revenue Miles
Ridership
Figure 16. Springs Transit Ridership & Revenue Miles, Population We see this dynamic playing itself out in Colorado Springs as the percentage use of public transportation declines. Figure 15 shows data on what’s happening here.28 Figure 16 shows that, even though Revenue Miles actually increased approximately 22% from 1991 through 1999, Ridership/Population has declined by ap-proximately 19%. If revenue miles had not increased, there could have been an ~40% decline in relative use. This relates to the public’s unwillingness to approve bal-lot issues that fund mass transit and to the “cost crunch” on low-income workers who find transportation less and less affordable.
Figure 15. Springs Transit Revenue Miles and Ridership/Population Transit systems are under stress as noted in the Ameri-can Society of Civil Engineers’ (ASCE) 2001 Report Card for America's Infrastructure [http://www.asce.org/].29 Here is their evaluation of transit.
Springs Transit Ridership & Revenue Miles
4.0
4.5
5.0
5.5
6.0
6.5
7.0
7.5
8.0
1990 1991 1992 1993 1994 1995 1996 1997 1998 1999
Year
Rid
ersh
ip p
er P
opul
atio
n(p
erso
ns/y
r/per
son)
1.6
1.8
2.0
2.2
2.4
2.6
2.8
Rev
enue
Mile
s(m
illio
ns/y
r)
Springs Transit Ridership/Population Springs Transit Revenue Miles (millions)
Revenue Miles
RidershipPopulationTransit received a grade of “C-,” down from a “C” three
years ago, and airports received a “D,” down from a “C-” in 1998. While funds have been made available through TEA-21 and AIR-21, appropriated to mass transit and aviation respectively, both systems are struggling to meet usage demands nationwide. Transit ridership has in-creased 15 percent since 1995, adding a strain despite unprecedented growth in transit systems and increased funding. Furthermore, existing public transportation sys-tems, such as San Francisco's BART system and Wash-ington's Metro system, are challenged by new commuter patterns that did not exist and were not anticipated when the systems were first designed and constructed. Figure 17. Eroding Goal for Travel Time
DesiredTravel Time
ActualTravel Time
Travel TimeGap
Pressure toImprove
Travel Time
Pressure toLower Desired
Travel Time
Actions toMaintain or
ImproveTravel Time
SatisficeTravel Time
S
S
S
O
S
S
S
O
B1
TakingCorrective
Action
The Boiled Frog Syndrome In Professor Sterman’s model of “Traffic Congestion and the Death Spiral of Mass Transportation,” the gap between “Travel Time” and “Desired Travel Time,” cre-ates the “Pressure to Reduce Congestion.” The variable “Desired Travel Time” is treated as a constant.
B2
LoweringThe Goal
However, this is an approximation. Over time we get used to the longer travel time. My sister, Linda, lives in Virginia and thinks nothing of driving for 45 minutes to an hour to get to a shop or restaurant, even though to me that seems like a long time. She’s used to the traffic; I’m not. But I would get used to it over time.
Such behavior is characterized by the systems thinking archetype known as “Erod-ing Goals,” which is responsible for the “boiled frog” syndrome (Figure 17). It shows there are two ways to resolve the tension between “actual” and “desired.” One way to resolve the tension is to move toward the goal; the other is to lower the goal. The “Eroding Goals” structure is called the “boiled frog” syndrome be-cause a frog will jump out if placed in a pot of hot water, but will not jump out if placed in cool water which is slowly heated to a boil.
Bob Powell, Ph.D., MBA • • Continuous Improvement Associates © 2003 • • [email protected] • • 719 599-0977 • • Rev 01/06/03 • • page 34
28 Source: Colorado Springs Transit, Sept. 2000 29 ASCE Report Card
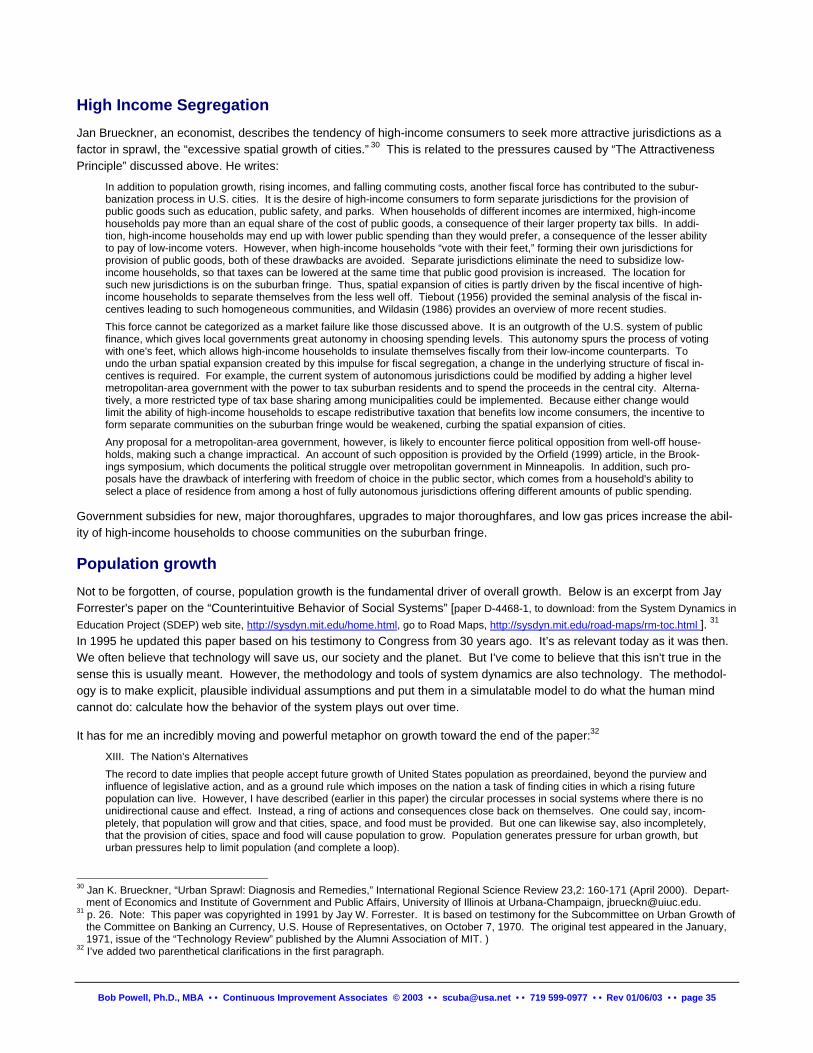
High Income Segregation Jan Brueckner, an economist, describes the tendency of high-income consumers to seek more attractive jurisdictions as a factor in sprawl, the “excessive spatial growth of cities.” 30 This is related to the pressures caused by “The Attractiveness Principle” discussed above. He writes:
In addition to population growth, rising incomes, and falling commuting costs, another fiscal force has contributed to the subur-banization process in U.S. cities. It is the desire of high-income consumers to form separate jurisdictions for the provision of public goods such as education, public safety, and parks. When households of different incomes are intermixed, high-income households pay more than an equal share of the cost of public goods, a consequence of their larger property tax bills. In addi-tion, high-income households may end up with lower public spending than they would prefer, a consequence of the lesser ability to pay of low-income voters. However, when high-income households “vote with their feet,” forming their own jurisdictions for provision of public goods, both of these drawbacks are avoided. Separate jurisdictions eliminate the need to subsidize low-income households, so that taxes can be lowered at the same time that public good provision is increased. The location for such new jurisdictions is on the suburban fringe. Thus, spatial expansion of cities is partly driven by the fiscal incentive of high-income households to separate themselves from the less well off. Tiebout (1956) provided the seminal analysis of the fiscal in-centives leading to such homogeneous communities, and Wildasin (1986) provides an overview of more recent studies. This force cannot be categorized as a market failure like those discussed above. It is an outgrowth of the U.S. system of public finance, which gives local governments great autonomy in choosing spending levels. This autonomy spurs the process of voting with one's feet, which allows high-income households to insulate themselves fiscally from their low-income counterparts. To undo the urban spatial expansion created by this impulse for fiscal segregation, a change in the underlying structure of fiscal in-centives is required. For example, the current system of autonomous jurisdictions could be modified by adding a higher level metropolitan-area government with the power to tax suburban residents and to spend the proceeds in the central city. Alterna-tively, a more restricted type of tax base sharing among municipalities could be implemented. Because either change would limit the ability of high-income households to escape redistributive taxation that benefits low income consumers, the incentive to form separate communities on the suburban fringe would be weakened, curbing the spatial expansion of cities. Any proposal for a metropolitan-area government, however, is likely to encounter fierce political opposition from well-off house-holds, making such a change impractical. An account of such opposition is provided by the Orfield (1999) article, in the Brook-ings symposium, which documents the political struggle over metropolitan government in Minneapolis. In addition, such pro-posals have the drawback of interfering with freedom of choice in the public sector, which comes from a household's ability to select a place of residence from among a host of fully autonomous jurisdictions offering different amounts of public spending.
Government subsidies for new, major thoroughfares, upgrades to major thoroughfares, and low gas prices increase the abil-ity of high-income households to choose communities on the suburban fringe.
Population growth Not to be forgotten, of course, population growth is the fundamental driver of overall growth. Below is an excerpt from Jay Forrester's paper on the “Counterintuitive Behavior of Social Systems” [paper D-4468-1, to download: from the System Dynamics in Education Project (SDEP) web site, http://sysdyn.mit.edu/home.html, go to Road Maps, http://sysdyn.mit.edu/road-maps/rm-toc.html ]. 31 In 1995 he updated this paper based on his testimony to Congress from 30 years ago. It’s as relevant today as it was then. We often believe that technology will save us, our society and the planet. But I've come to believe that this isn't true in the sense this is usually meant. However, the methodology and tools of system dynamics are also technology. The methodol-ogy is to make explicit, plausible individual assumptions and put them in a simulatable model to do what the human mind cannot do: calculate how the behavior of the system plays out over time.
It has for me an incredibly moving and powerful metaphor on growth toward the end of the paper:32
XIII. The Nation's Alternatives The record to date implies that people accept future growth of United States population as preordained, beyond the purview and influence of legislative action, and as a ground rule which imposes on the nation a task of finding cities in which a rising future population can live. However, I have described (earlier in this paper) the circular processes in social systems where there is no unidirectional cause and effect. Instead, a ring of actions and consequences close back on themselves. One could say, incom-pletely, that population will grow and that cities, space, and food must be provided. But one can likewise say, also incompletely, that the provision of cities, space and food will cause population to grow. Population generates pressure for urban growth, but urban pressures help to limit population (and complete a loop).
30 Jan K. Brueckner, “Urban Sprawl: Diagnosis and Remedies,” International Regional Science Review 23,2: 160-171 (April 2000). Depart-
ment of Economics and Institute of Government and Public Affairs, University of Illinois at Urbana-Champaign, [email protected]. 31 p. 26. Note: This paper was copyrighted in 1991 by Jay W. Forrester. It is based on testimony for the Subcommittee on Urban Growth of
the Committee on Banking an Currency, U.S. House of Representatives, on October 7, 1970. The original test appeared in the January, 1971, issue of the “Technology Review” published by the Alumni Association of MIT. )
32 I’ve added two parenthetical clarifications in the first paragraph.
Bob Powell, Ph.D., MBA • • Continuous Improvement Associates © 2003 • • [email protected] • • 719 599-0977 • • Rev 01/06/03 • • page 35
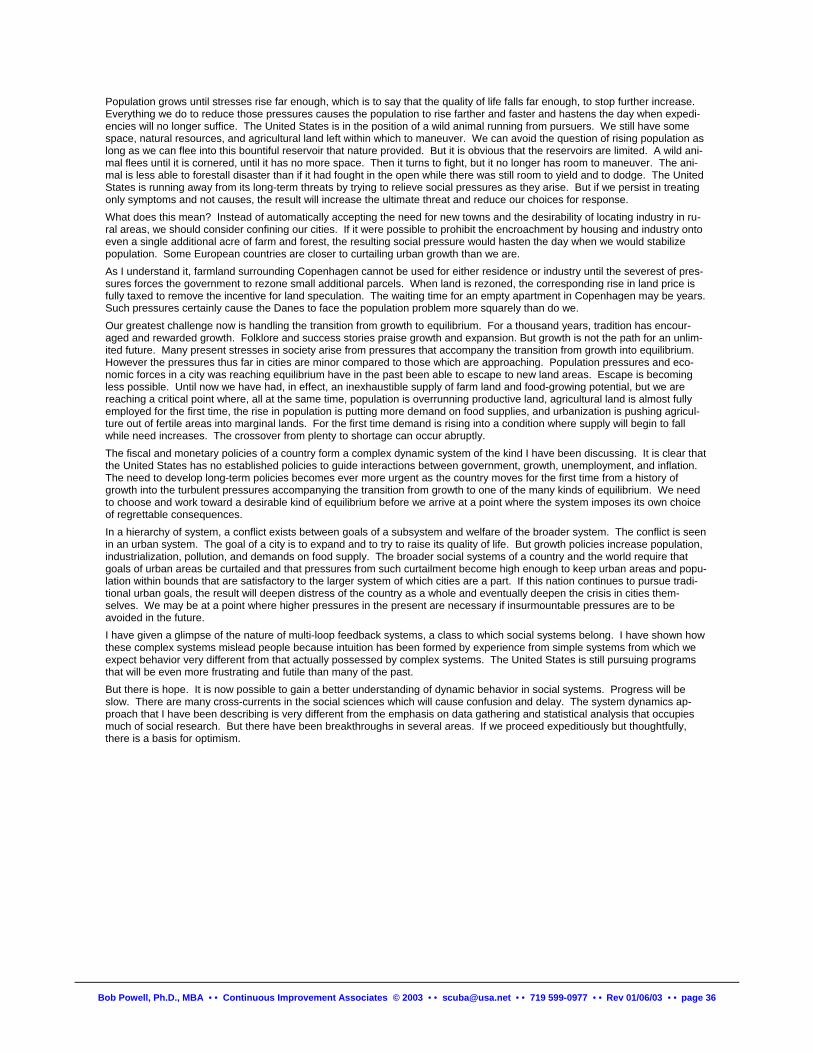
Population grows until stresses rise far enough, which is to say that the quality of life falls far enough, to stop further increase. Everything we do to reduce those pressures causes the population to rise farther and faster and hastens the day when expedi-encies will no longer suffice. The United States is in the position of a wild animal running from pursuers. We still have some space, natural resources, and agricultural land left within which to maneuver. We can avoid the question of rising population as long as we can flee into this bountiful reservoir that nature provided. But it is obvious that the reservoirs are limited. A wild ani-mal flees until it is cornered, until it has no more space. Then it turns to fight, but it no longer has room to maneuver. The ani-mal is less able to forestall disaster than if it had fought in the open while there was still room to yield and to dodge. The United States is running away from its long-term threats by trying to relieve social pressures as they arise. But if we persist in treating only symptoms and not causes, the result will increase the ultimate threat and reduce our choices for response. What does this mean? Instead of automatically accepting the need for new towns and the desirability of locating industry in ru-ral areas, we should consider confining our cities. If it were possible to prohibit the encroachment by housing and industry onto even a single additional acre of farm and forest, the resulting social pressure would hasten the day when we would stabilize population. Some European countries are closer to curtailing urban growth than we are. As I understand it, farmland surrounding Copenhagen cannot be used for either residence or industry until the severest of pres-sures forces the government to rezone small additional parcels. When land is rezoned, the corresponding rise in land price is fully taxed to remove the incentive for land speculation. The waiting time for an empty apartment in Copenhagen may be years. Such pressures certainly cause the Danes to face the population problem more squarely than do we. Our greatest challenge now is handling the transition from growth to equilibrium. For a thousand years, tradition has encour-aged and rewarded growth. Folklore and success stories praise growth and expansion. But growth is not the path for an unlim-ited future. Many present stresses in society arise from pressures that accompany the transition from growth into equilibrium. However the pressures thus far in cities are minor compared to those which are approaching. Population pressures and eco-nomic forces in a city was reaching equilibrium have in the past been able to escape to new land areas. Escape is becoming less possible. Until now we have had, in effect, an inexhaustible supply of farm land and food-growing potential, but we are reaching a critical point where, all at the same time, population is overrunning productive land, agricultural land is almost fully employed for the first time, the rise in population is putting more demand on food supplies, and urbanization is pushing agricul-ture out of fertile areas into marginal lands. For the first time demand is rising into a condition where supply will begin to fall while need increases. The crossover from plenty to shortage can occur abruptly. The fiscal and monetary policies of a country form a complex dynamic system of the kind I have been discussing. It is clear that the United States has no established policies to guide interactions between government, growth, unemployment, and inflation. The need to develop long-term policies becomes ever more urgent as the country moves for the first time from a history of growth into the turbulent pressures accompanying the transition from growth to one of the many kinds of equilibrium. We need to choose and work toward a desirable kind of equilibrium before we arrive at a point where the system imposes its own choice of regrettable consequences. In a hierarchy of system, a conflict exists between goals of a subsystem and welfare of the broader system. The conflict is seen in an urban system. The goal of a city is to expand and to try to raise its quality of life. But growth policies increase population, industrialization, pollution, and demands on food supply. The broader social systems of a country and the world require that goals of urban areas be curtailed and that pressures from such curtailment become high enough to keep urban areas and popu-lation within bounds that are satisfactory to the larger system of which cities are a part. If this nation continues to pursue tradi-tional urban goals, the result will deepen distress of the country as a whole and eventually deepen the crisis in cities them-selves. We may be at a point where higher pressures in the present are necessary if insurmountable pressures are to be avoided in the future. I have given a glimpse of the nature of multi-loop feedback systems, a class to which social systems belong. I have shown how these complex systems mislead people because intuition has been formed by experience from simple systems from which we expect behavior very different from that actually possessed by complex systems. The United States is still pursuing programs that will be even more frustrating and futile than many of the past. But there is hope. It is now possible to gain a better understanding of dynamic behavior in social systems. Progress will be slow. There are many cross-currents in the social sciences which will cause confusion and delay. The system dynamics ap-proach that I have been describing is very different from the emphasis on data gathering and statistical analysis that occupies much of social research. But there have been breakthroughs in several areas. If we proceed expeditiously but thoughtfully, there is a basis for optimism.
Bob Powell, Ph.D., MBA • • Continuous Improvement Associates © 2003 • • [email protected] • • 719 599-0977 • • Rev 01/06/03 • • page 36
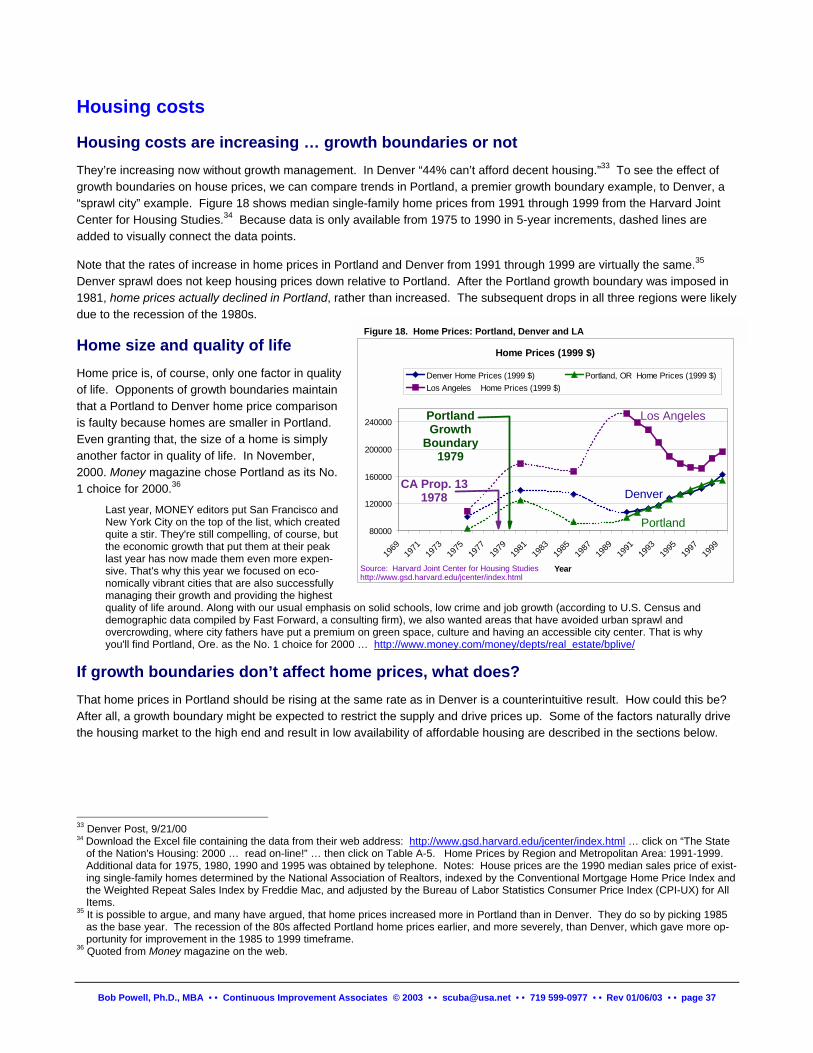
Housing costs
Housing costs are increasing … growth boundaries or not They’re increasing now without growth management. In Denver “44% can’t afford decent housing.”33 To see the effect of growth boundaries on house prices, we can compare trends in Portland, a premier growth boundary example, to Denver, a “sprawl city” example. Figure 18 shows median single-family home prices from 1991 through 1999 from the Harvard Joint Center for Housing Studies.34 Because data is only available from 1975 to 1990 in 5-year increments, dashed lines are added to visually connect the data points.
Note that the rates of increase in home prices in Portland and Denver from 1991 through 1999 are virtually the same.35 Denver sprawl does not keep housing prices down relative to Portland. After the Portland growth boundary was imposed in 1981, home prices actually declined in Portland, rather than increased. The subsequent drops in all three regions were likely due to the recession of the 1980s.
Home size and quality of life Home price is, of course, only one factor in quality of life. Opponents of growth boundaries maintain that a Portland to Denver home price comparison is faulty because homes are smaller in Portland. Even granting that, the size of a home is simply another factor in quality of life. In November, 2000. Money magazine chose Portland as its No. 1 choice for 2000.36
Last year, MONEY editors put San Francisco and New York City on the top of the list, which created quite a stir. They're still compelling, of course, but the economic growth that put them at their peak last year has now made them even more expen-sive. That's why this year we focused on eco-nomically vibrant cities that are also successfully managing their growth and providing the highest quality of life around. Along with our usual emphasis odemographic data compiled by Fast Forward, a consuovercrowding, where city fathers have put a premium you'll find Portland, Ore. as the No. 1 choice for 2000
If growth boundaries don’t affect homThat home prices in Portland should be rising at the sAfter all, a growth boundary might be expected to resthe housing market to the high end and result in low a
33 Denver Post, 9/21/00 34 Download the Excel file containing the data from their web
of the Nation's Housing: 2000 … read on-line!” … then clAdditional data for 1975, 1980, 1990 and 1995 was obtaining single-family homes determined by the National Assocthe Weighted Repeat Sales Index by Freddie Mac, and adItems.
35 It is possible to argue, and many have argued, that homeas the base year. The recession of the 80s affected Portlportunity for improvement in the 1985 to 1999 timeframe.
36 Quoted from Money magazine on the web.
Bob Powell, Ph.D., MBA • • Continuous Improvement Ass
Figure 18. Home Prices: Portland, Denver and LA
n solid schools, low crime and job growth (according to U.S. Census and lting firm), we also wanted areas that have avoided urban sprawl and on green space, culture and having an accessible city center. That is why … http://www.money.com/money/depts/real_estate/bplive/
Home Prices (1999 $)
80000
120000
160000
200000
240000
1969
1971
1973
1975
1977
1979
1981
1983
1985
1987
1989
1991
1993
1995
1997
1999
Year
Denver Home Prices (1999 $) Portland, OR Home Prices (1999 $)Los Angeles Home Prices (1999 $)
Portland
Denver
Los Angeles
CA Prop. 131978
Source: Harvard Joint Center for Housing Studieshttp://www.gsd.harvard.edu/jcenter/index.html
PortlandGrowth
Boundary1979
e prices, what does? ame rate as in Denver is a counterintuitive result. How could this be? trict the supply and drive prices up. Some of the factors naturally drive vailability of affordable housing are described in the sections below.
address: http://www.gsd.harvard.edu/jcenter/index.html … click on “The State ick on Table A-5. Home Prices by Region and Metropolitan Area: 1991-1999. ed by telephone. Notes: House prices are the 1990 median sales price of exist-iation of Realtors, indexed by the Conventional Mortgage Home Price Index and justed by the Bureau of Labor Statistics Consumer Price Index (CPI-UX) for All
prices increased more in Portland than in Denver. They do so by picking 1985 and home prices earlier, and more severely, than Denver, which gave more op-
ociates © 2003 • • [email protected] • • 719 599-0977 • • Rev 01/06/03 • • page 37
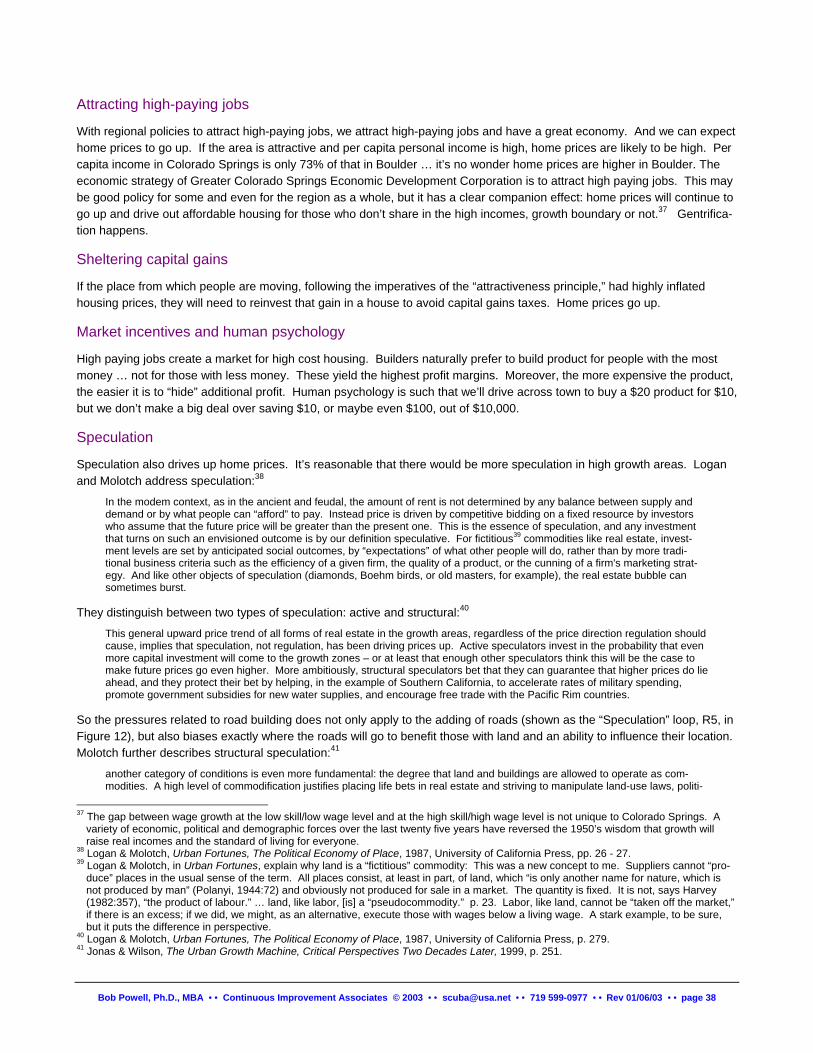
Attracting high-paying jobs
With regional policies to attract high-paying jobs, we attract high-paying jobs and have a great economy. And we can expect home prices to go up. If the area is attractive and per capita personal income is high, home prices are likely to be high. Per capita income in Colorado Springs is only 73% of that in Boulder … it’s no wonder home prices are higher in Boulder. The economic strategy of Greater Colorado Springs Economic Development Corporation is to attract high paying jobs. This may be good policy for some and even for the region as a whole, but it has a clear companion effect: home prices will continue to go up and drive out affordable housing for those who don’t share in the high incomes, growth boundary or not.37 Gentrifica-tion happens.
Sheltering capital gains
If the place from which people are moving, following the imperatives of the “attractiveness principle,” had highly inflated housing prices, they will need to reinvest that gain in a house to avoid capital gains taxes. Home prices go up.
Market incentives and human psychology
High paying jobs create a market for high cost housing. Builders naturally prefer to build product for people with the most money … not for those with less money. These yield the highest profit margins. Moreover, the more expensive the product, the easier it is to “hide” additional profit. Human psychology is such that we’ll drive across town to buy a $20 product for $10, but we don’t make a big deal over saving $10, or maybe even $100, out of $10,000.
Speculation
Speculation also drives up home prices. It’s reasonable that there would be more speculation in high growth areas. Logan and Molotch address speculation:38
In the modem context, as in the ancient and feudal, the amount of rent is not determined by any balance between supply and demand or by what people can “afford” to pay. Instead price is driven by competitive bidding on a fixed resource by investors who assume that the future price will be greater than the present one. This is the essence of speculation, and any investment that turns on such an envisioned outcome is by our definition speculative. For fictitious39 commodities like real estate, invest-ment levels are set by anticipated social outcomes, by “expectations” of what other people will do, rather than by more tradi-tional business criteria such as the efficiency of a given firm, the quality of a product, or the cunning of a firm's marketing strat-egy. And like other objects of speculation (diamonds, Boehm birds, or old masters, for example), the real estate bubble can sometimes burst.
They distinguish between two types of speculation: active and structural:40
This general upward price trend of all forms of real estate in the growth areas, regardless of the price direction regulation should cause, implies that speculation, not regulation, has been driving prices up. Active speculators invest in the probability that even more capital investment will come to the growth zones – or at least that enough other speculators think this will be the case to make future prices go even higher. More ambitiously, structural speculators bet that they can guarantee that higher prices do lie ahead, and they protect their bet by helping, in the example of Southern California, to accelerate rates of military spending, promote government subsidies for new water supplies, and encourage free trade with the Pacific Rim countries.
So the pressures related to road building does not only apply to the adding of roads (shown as the “Speculation” loop, R5, in Figure 12), but also biases exactly where the roads will go to benefit those with land and an ability to influence their location. Molotch further describes structural speculation:41
another category of conditions is even more fundamental: the degree that land and buildings are allowed to operate as com-modities. A high level of commodification justifies placing life bets in real estate and striving to manipulate land-use laws, politi-
37 The gap between wage growth at the low skill/low wage level and at the high skill/high wage level is not unique to Colorado Springs. A
variety of economic, political and demographic forces over the last twenty five years have reversed the 1950’s wisdom that growth will raise real incomes and the standard of living for everyone.
38 Logan & Molotch, Urban Fortunes, The Political Economy of Place, 1987, University of California Press, pp. 26 - 27. 39 Logan & Molotch, in Urban Fortunes, explain why land is a “fictitious” commodity: This was a new concept to me. Suppliers cannot “pro-
duce” places in the usual sense of the term. All places consist, at least in part, of land, which “is only another name for nature, which is not produced by man” (Polanyi, 1944:72) and obviously not produced for sale in a market. The quantity is fixed. It is not, says Harvey (1982:357), “the product of labour.” … land, like labor, [is] a “pseudocommodity.” p. 23. Labor, like land, cannot be “taken off the market,” if there is an excess; if we did, we might, as an alternative, execute those with wages below a living wage. A stark example, to be sure, but it puts the difference in perspective.
40 Logan & Molotch, Urban Fortunes, The Political Economy of Place, 1987, University of California Press, p. 279. 41 Jonas & Wilson, The Urban Growth Machine, Critical Perspectives Two Decades Later, 1999, p. 251.
Bob Powell, Ph.D., MBA • • Continuous Improvement Associates © 2003 • • [email protected] • • 719 599-0977 • • Rev 01/06/03 • • page 38
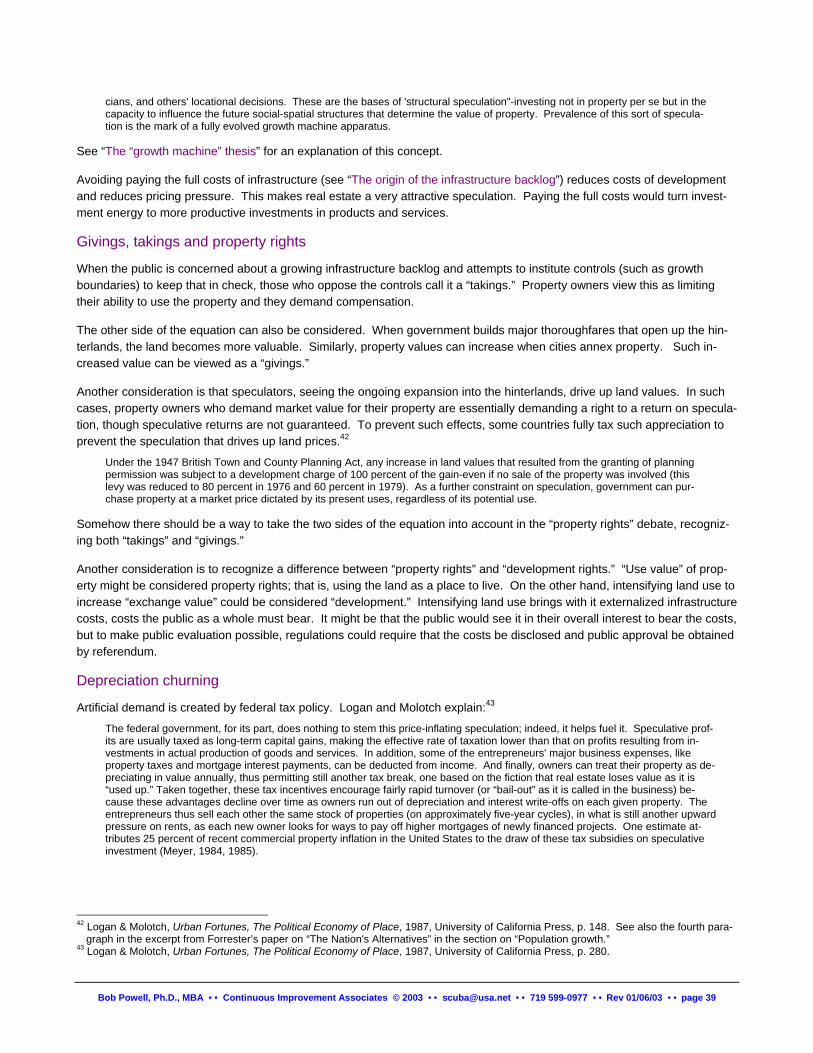
cians, and others' locational decisions. These are the bases of 'structural speculation"-investing not in property per se but in the capacity to influence the future social-spatial structures that determine the value of property. Prevalence of this sort of specula-tion is the mark of a fully evolved growth machine apparatus.
See “The “growth machine” thesis” for an explanation of this concept.
Avoiding paying the full costs of infrastructure (see “The origin of the infrastructure backlog”) reduces costs of development and reduces pricing pressure. This makes real estate a very attractive speculation. Paying the full costs would turn invest-ment energy to more productive investments in products and services.
Givings, takings and property rights
When the public is concerned about a growing infrastructure backlog and attempts to institute controls (such as growth boundaries) to keep that in check, those who oppose the controls call it a “takings.” Property owners view this as limiting their ability to use the property and they demand compensation.
The other side of the equation can also be considered. When government builds major thoroughfares that open up the hin-terlands, the land becomes more valuable. Similarly, property values can increase when cities annex property. Such in-creased value can be viewed as a “givings.”
Another consideration is that speculators, seeing the ongoing expansion into the hinterlands, drive up land values. In such cases, property owners who demand market value for their property are essentially demanding a right to a return on specula-tion, though speculative returns are not guaranteed. To prevent such effects, some countries fully tax such appreciation to prevent the speculation that drives up land prices.42
Under the 1947 British Town and County Planning Act, any increase in land values that resulted from the granting of planning permission was subject to a development charge of 100 percent of the gain-even if no sale of the property was involved (this levy was reduced to 80 percent in 1976 and 60 percent in 1979). As a further constraint on speculation, government can pur-chase property at a market price dictated by its present uses, regardless of its potential use.
Somehow there should be a way to take the two sides of the equation into account in the “property rights” debate, recogniz-ing both “takings” and “givings.”
Another consideration is to recognize a difference between “property rights” and “development rights.” “Use value” of prop-erty might be considered property rights; that is, using the land as a place to live. On the other hand, intensifying land use to increase “exchange value” could be considered “development.” Intensifying land use brings with it externalized infrastructure costs, costs the public as a whole must bear. It might be that the public would see it in their overall interest to bear the costs, but to make public evaluation possible, regulations could require that the costs be disclosed and public approval be obtained by referendum.
Depreciation churning
Artificial demand is created by federal tax policy. Logan and Molotch explain:43
The federal government, for its part, does nothing to stem this price-inflating speculation; indeed, it helps fuel it. Speculative prof-its are usually taxed as long-term capital gains, making the effective rate of taxation lower than that on profits resulting from in-vestments in actual production of goods and services. In addition, some of the entrepreneurs' major business expenses, like property taxes and mortgage interest payments, can be deducted from income. And finally, owners can treat their property as de-preciating in value annually, thus permitting still another tax break, one based on the fiction that real estate loses value as it is “used up.” Taken together, these tax incentives encourage fairly rapid turnover (or “bail-out” as it is called in the business) be-cause these advantages decline over time as owners run out of depreciation and interest write-offs on each given property. The entrepreneurs thus sell each other the same stock of properties (on approximately five-year cycles), in what is still another upward pressure on rents, as each new owner looks for ways to pay off higher mortgages of newly financed projects. One estimate at-tributes 25 percent of recent commercial property inflation in the United States to the draw of these tax subsidies on speculative investment (Meyer, 1984, 1985).
42 Logan & Molotch, Urban Fortunes, The Political Economy of Place, 1987, University of California Press, p. 148. See also the fourth para-
graph in the excerpt from Forrester’s paper on “The Nation's Alternatives” in the section on “Population growth.” 43 Logan & Molotch, Urban Fortunes, The Political Economy of Place, 1987, University of California Press, p. 280.
Bob Powell, Ph.D., MBA • • Continuous Improvement Associates © 2003 • • [email protected] • • 719 599-0977 • • Rev 01/06/03 • • page 39
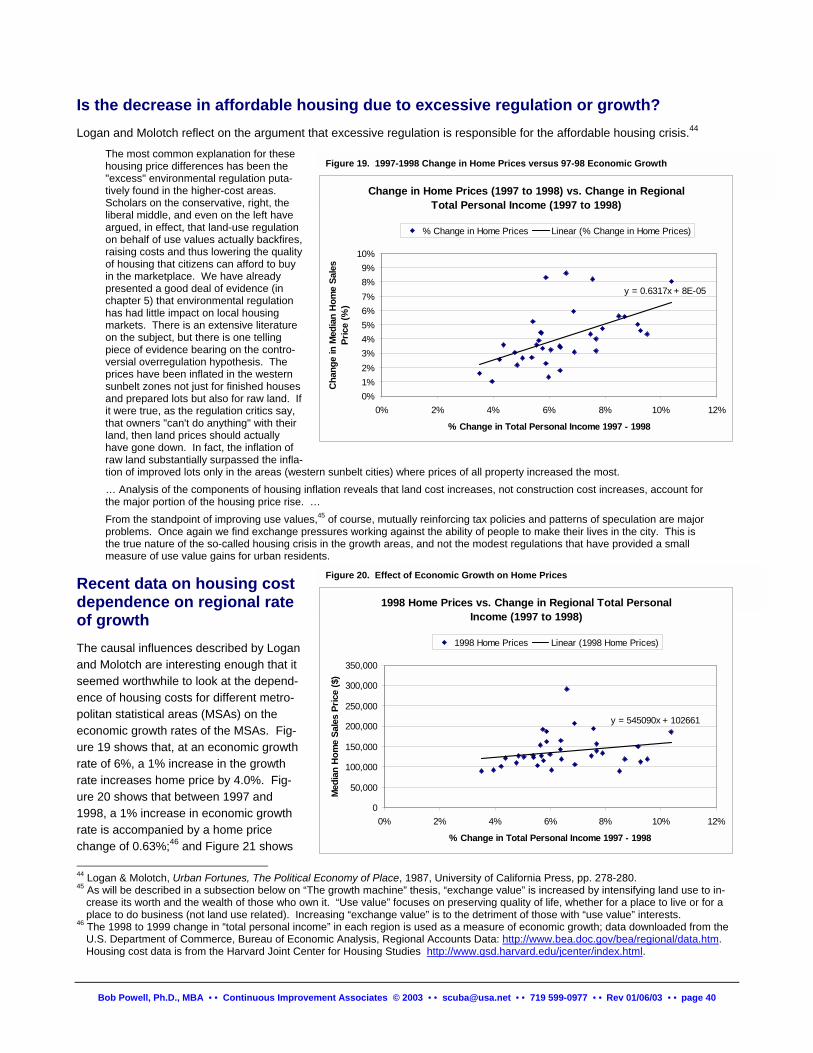
Is the decrease in affordable housing due to excessive regulation or growth? Logan and Molotch reflect on the argument that excessive regulation is responsible for the affordable housing crisis.44
The most common explanation for these housing price differences has been the "excess" environmental regulation puta-tively found in the higher-cost areas. Scholars on the conservative, right, the liberal middle, and even on the left have argued, in effect, that land-use regulation on behalf of use values actually backfires, raising costs and thus lowering the quality of housing that citizens can afford to buy in the marketplace. We have already presented a good deal of evidence (in chapter 5) that environmental regulation has had little impact on local housing markets. There is an extensive literature on the subject, but there is one telling piece of evidence bearing on the contro-versial overregulation hypothesis. The prices have been inflated in the western sunbelt zones not just for finished houses and prepared lots but also for raw land. If it were true, as the regulation critics say, that owners "can't do anything" with their land, then land prices should actually have gone down. In fact, the inflation of raw land substantially surpassed the infla-tion of improved lots only in the areas (western sunbelt cities) where prices of all property increased the most.
Change in Home Prices (1997 to 1998) vs. Change in Regional Total Personal Income (1997 to 1998)
y = 0.6317x + 8E-05
0%1%2%3%4%5%6%7%8%9%
10%
0% 2% 4% 6% 8% 10% 12%
% Change in Total Personal Income 1997 - 1998
Chan
ge in
Med
ian
Hom
e Sa
les
Pric
e (%
)
% Change in Home Prices Linear (% Change in Home Prices)
Figure 19. 1997-1998 Change in Home Prices versus 97-98 Economic Growth
… Analysis of the components of housing inflation reveals that land cost increases, not construction cost increases, account for the major portion of the housing price rise. … From the standpoint of improving use values,45 of course, mutually reinforcing tax policies and patterns of speculation are major problems. Once again we find exchange pressures working against the ability of people to make their lives in the city. This is the true nature of the so-called housing crisis in the growth areas, and not the modest regulations that have provided a small measure of use value gains for urban residents.
1998 Home Prices vs. Change in Regional Total Personal Income (1997 to 1998)
y = 545090x + 102661
0
50,000
100,000
150,000
200,000
250,000
300,000
350,000
0% 2% 4% 6% 8% 10% 12%
% Change in Total Personal Income 1997 - 1998
Med
ian
Hom
e Sa
les
Pric
e ($
)
1998 Home Prices Linear (1998 Home Prices)
Figure 20. Effect of Economic Growth on Home Prices Recent data on housing cost dependence on regional rate of growth The causal influences described by Logan and Molotch are interesting enough that it seemed worthwhile to look at the depend-ence of housing costs for different metro-politan statistical areas (MSAs) on the economic growth rates of the MSAs. Fig-ure 19 shows that, at an economic growth rate of 6%, a 1% increase in the growth rate increases home price by 4.0%. Fig-ure 20 shows that between 1997 and 1998, a 1% increase in economic growth rate is accompanied by a home price change of 0.63%;46 and Figure 21 shows 44 Logan & Molotch, Urban Fortunes, The Political Economy of Place, 1987, University of California Press, pp. 278-280. 45 As will be described in a subsection below on “The growth machine” thesis, “exchange value” is increased by intensifying land use to in-
crease its worth and the wealth of those who own it. “Use value” focuses on preserving quality of life, whether for a place to live or for a place to do business (not land use related). Increasing “exchange value” is to the detriment of those with “use value” interests.
46 The 1998 to 1999 change in “total personal income” in each region is used as a measure of economic growth; data downloaded from the U.S. Department of Commerce, Bureau of Economic Analysis, Regional Accounts Data: http://www.bea.doc.gov/bea/regional/data.htm. Housing cost data is from the Harvard Joint Center for Housing Studies http://www.gsd.harvard.edu/jcenter/index.html.
Bob Powell, Ph.D., MBA • • Continuous Improvement Associates © 2003 • • [email protected] • • 719 599-0977 • • Rev 01/06/03 • • page 40
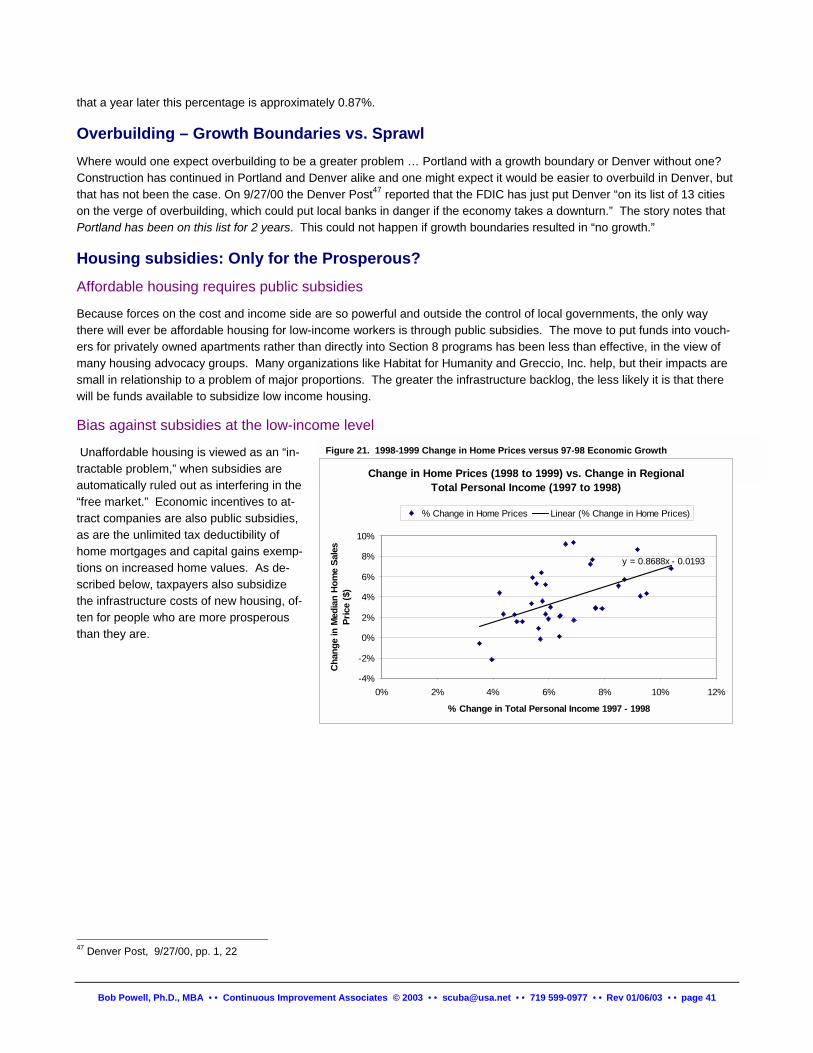
that a year later this percentage is approximately 0.87%.
Overbuilding – Growth Boundaries vs. Sprawl Where would one expect overbuilding to be a greater problem … Portland with a growth boundary or Denver without one? Construction has continued in Portland and Denver alike and one might expect it would be easier to overbuild in Denver, but that has not been the case. On 9/27/00 the Denver Post47 reported that the FDIC has just put Denver “on its list of 13 cities on the verge of overbuilding, which could put local banks in danger if the economy takes a downturn.” The story notes that Portland has been on this list for 2 years. This could not happen if growth boundaries resulted in “no growth.”
Housing subsidies: Only for the Prosperous? Affordable housing requires public subsidies
Because forces on the cost and income side are so powerful and outside the control of local governments, the only way there will ever be affordable housing for low-income workers is through public subsidies. The move to put funds into vouch-ers for privately owned apartments rather than directly into Section 8 programs has been less than effective, in the view of many housing advocacy groups. Many organizations like Habitat for Humanity and Greccio, Inc. help, but their impacts are small in relationship to a problem of major proportions. The greater the infrastructure backlog, the less likely it is that there will be funds available to subsidize low income housing.
Bias against subsidies at the low-inco Unaffordable housing is viewed as an “in-
tractable problem,” when subsidies are automatically ruled out as interfering in the “free market.” Economic incentives to at-tract companies are also public subsidies, as are the unlimited tax deductibility of home mortgages and capital gains exemp-tions on increased home values. As de-scribed below, taxpayers also subsidize the infrastructure costs of new housing, of-ten for people who are more prosperous than they are.
Bob Powell, Ph.D., MBA • • Continuous Improvem
47 Denver Post, 9/27/00, pp. 1, 22
me level Figure 21. 1998-1999 Change in Home Prices versus 97-98 Economic Growth
Change in Home Prices (1998 to 1999) vs. Change in Regional Total Personal Income (1997 to 1998)
y = 0.8688x - 0.0193
-4%
-2%
0%
2%
4%
6%
8%
10%
0% 2% 4% 6% 8% 10% 12%
% Change in Total Personal Income 1997 - 1998
Chan
ge in
Med
ian
Hom
e Sa
les
Pric
e ($
)
% Change in Home Prices Linear (% Change in Home Prices)
ent Associates © 2003 • • [email protected] • • 719 599-0977 • • Rev 01/06/03 • • page 41
Infrastructure
The growing infrastructure backlog We have the same combination of factors in Colorado Springs as in California: tax limitation and a growing infrastructure backlog. The infrastructure backlog in Colorado Springs continues to mount, and it may already be too late to avoid an on-coming bust. In January of 1996 the infrastructure backlog was estimated at $308M.48 We're now facing a $1B infrastruc-ture backlog in the next 10 - 20 years and, according to Dave Zelenok, Group Support Manager Public Works, if things keep going the way they are, we'll be facing a $3-4 billion backlog.49 It’s been standard practice to allow development without a source of funding for infrastructure to support it, whether that source is taxpayers or developers.
This is a nationwide problem. The American Society of Civil Engineers released a “report card” on the nation’s infrastructure problems on 3/08/01, with a state-by-state analysis [http://www.asce.org/] 50 An excerpt from their press release:
The American Society of Civil Engineers (ASCE) today released its 2001 Report Card for America's Infrastructure in which the nation's infrastructure received a cumulative grade of “D+” for twelve infrastructure areas. Causes for such a dismal grade in-clude: explosive population growth and school enrollment which outpace the rate and impact of current investment and mainte-nance efforts; local political opposition and redtape which stymie the development of effective solutions; and the growing obso-lescence of an aging system - evident in the breakdown of California's electrical generation system and the nation's decaying water infrastructure. “When you've got rolling blackouts in California, bridges crumbling in Milwaukee, and kids in Kansas City attending class in a former boys' restroom, something is desperately wrong,” says ASCE President Robert W. Bein, a civil engineer from Irvine, Cali-fornia. “The solutions to these problems involve more than money, but as with most things in life, you get what you pay for. America has been seriously under-investing in its infrastructure for decades and this report card reflects that.” To remedy America's current and looming problem, ASCE estimates a needed $ 1.3 trillion investment over the next five years and calls for a renewed partnership between citizens, local, state and federal governments, and the private sector.
Here is an NPR summary of one of their stories on the release of this report: [http://search.npr.org/cf/cmn/cmnpd01fm.cfm?PrgDate=03%2F08%2F2001&PrgID=2] 51
Traffic is overwhelming decaying roads and bridges, creating a deadly threat to American motorists and an impediment to eco-nomic growth. Three out of every four school buildings are either aging beyond repair or overstuffed with students. And the na-tion's water systems and sewers are seriously underfunded. Those are some of the dire warnings contained in a new report from the American Society of Civil Engineers, released yesterday. The study pinpoints 12 areas where the basic building blocks of society require replacement or repair. The engineers' group recommends spending more than $1 trillion over the next five years to launch meaningful remedies.
While the data shows Los Angeles and San Francisco home prices are recovering (though only toward the end of a decade of record economic growth), the Los Angeles Times reports that infrastructure neglect is creating a crisis.52
Amid the tumult of California's electricity ordeal, an important fact often is lost: Energy is far from the worst of the state's long-term infrastructure problems. Policy experts from all over the political spectrum agree there are greater threats to California's economy and quality of life over the next 20 years. Strained water supplies, crowded airports, jammed freeways, poor schools and costly housing could prove much more complicated to tackle than keeping the lights on. The challenge will be enormous considering that, by an important federal measure, the state ranks last nationally in infrastruc-ture spending per capita. Although California may be able to import electricity from other states or countries to case its power squeeze, it can't send its kids to classrooms in Oregon or divert flights to Arizona airports. “Compared to our other infrastructure problems, the energy problem is easily solvable.” said Ross C. DeVol, director of regional and demographic studies at the Milken Institute in Santa Monica. Accustomed to living on the edge, Californians always have proved to be an adaptable lot. New technologies and wiser use of resources may allow the population to leverage its existing facilities in innovative ways. Already, creative methods for financing projects are emerging. Those changes could help avert doomsday scenarios of the Golden State turning dark, dry and hope-lessly gridlocked. Yet the electricity debacle is a jolting reminder that California's failure to reinvest in itself has very real consequences. Looming fallout from decades of disinvestment has some legislators and business organizations urging the state to start spending big on public works while budget surpluses are available. The state's Department of Finance estimates that California will need to spend $82 billion over 10 years to shore up its aging infrastructure, though others put that figure at more than $100 billion.
48 “1999-2000 Capital improvement needs versus estimated funds,” City of Colorado Springs, Capital Improvements Division, January 1996.
Included in The Springs Community Action Plan, City Government Task Force, Strategic Planning Workbook, January 1996. 49 Woodmen Edition, 7/28/00 50 ASCE Report Card:; News Release: http://www.asce.org/reportcard/index.cfm?reaction=news&page=2; NPR story audio:. 51 Go to http://www.npr.org/search/ and search for “infrastructure” to find the story “Nation's Building Blocks Crumbling, Report Says.” 52 “Power just one of many crises facing California,” Maria Dickerson and Stuart Silverstein, Los Angeles Times, in the Denver Post, 3/10/01
Bob Powell, Ph.D., MBA • • Continuous Improvement Associates © 2003 • • [email protected] • • 719 599-0977 • • Rev 01/06/03 • • page 42
“The electricity crisis in the state is just a symptom of a more fundamental issue: our lack of planning for the rapid growth and change which has been under way for decades and is going to accelerate,” said Mark Baldassare, a pollster at the nonpartisan Public Policy Institute of California. How did California, home of concrete-pouring visionaries such as William Mulholland and Pat Brown, become the poster child for infrastructure neglect? Observers point to a variety of nuts-and-bolts factors, starting with the way projects are funded. With the exception of gasoline taxes for highways, there is no dedicated revenue stream for infrastructure flowing into state coffers. The anti-tax revolution sparked by Proposition 13 in 1978 still makes bond issues problematic. Some say term limits haven't helped matters, encouraging legislators to think short term. But the biggest change in the past 25 years, policymakers say, is the zeitgeist surrounding California's spectacular growth. Af-ter pouring vast sums into public works well into the 1970s - starting with aqueducts and then freeways - Californians saw their state being overrun and became ambivalent about the path it was on.
The origin of the infrastructure backlog The origin of the infrastructure backlog is disputed. Developers and the Housing and Building Association (HBA) maintain that growth pays for itself. For example, here’s a an assertion from the HBA:53
The growth debate is typically heavy on emotion and light on facts. Misstatements regarding growth have been repeated so of-ten that they've taken on an air of authority. One practically has to be an expert to begin to separate the myths from the reality. That's why I read with great interest the Peak Voices in which Daphne Greenwood proposed to debunk these myths ("Let's get at the facts in the growth debate," The Gazette, Feb. 28). Unfortunately, Greenwood's column ended up perpetuating many of the same inaccuracies that have hobbled our ability as a community to discuss these issues rationally and productively. For example, Greenwood repeated the oft-cited but never-supported claim that existing residents pay for roads and other im-provements built to serve new neighborhoods. The only study I'm aware of in Colorado Springs addressing that issue says the exact opposite. That study, by Mark Dotzour of Texas A&M and local consultant Dave Bamberger, found that sales tax on materials used in the construction of new homes more than covers the cost of providing public infrastructure for these homes, including parks, fire stations and police substa-tions. It also found that new homes in subdivisions studied actually provided more in annual tax revenue for city services than the av-erage home in the city. The 1999 Dotzour/Bamberger report reached that conclusion by analyzing the city's own numbers. Greenwood cited no figures to support her claim. … Like any community, Colorado Springs has intelligent and caring residents who - while driven by good intentions - may disagree on fundamental issues facing our community. Debate is good. Dialogue is productive. But when we discuss these vitally important issues, we should ensure that our ultimate goal is the truth.
However there are problems with using the Bamberger and Dotzour study to reach Mr. Hinton’s conclusion. The root of the problem is in statements such as: 54
• "Finding 1: Most of the new city infrastructure needed to support new growth is paid for by the landowner ...." And they show a table on who actually spent what. (Fiscal Impact Study, p.11)
• "To determine what the city had to build to support new home construction in the eight subdivisions in our study we re-viewed city budget document going back to 1988." (Fiscal Impact Study, p.15)
• "Our study looked at eight specific subdivisions and their impact. We could find no evidence that any of the subdivisions in our study triggered the need for any citywide infrastructure construction. These facilities benefit all residents of the city equally." (Bamberger & Dotzour "Response to HSG comments" p. 5)
The problem is that what the city actually spent isn't the relevant figure. "Most of the new city infrastructure needed" isn’t all of what’s needed. It's misleading to write of "what the city had to build" or "triggered the need for." There was infrastructure that was needed, even if the city didn't see they "had to build" it or even if the need wasn't "triggered." What's relevant is what the city should have spent to maintain traffic level of service, drainage protection against flooding, police and fire re-sponse times, school space, etc.
Brueckner describes how new development does not fully fund the infrastructure needed to support new development.55
53 Jack Hinton, President, Housing and Building Association of Colorado Springs, The Gazette, 3/13/01, Metro section, p.5. 54 Bamberger and Dotzour, “Fiscal Impact Study,” 1999. And "Response to HSG comments" dated 1/19/00 on the review comments made
by the consulting firm of Hammer, Siler, George Associates on the Bamberger and Dotzour “Fiscal Impact Study”. 55 Jan K. Brueckner, “Urban Sprawl: Diagnosis and Remedies,” International Regional Science Review 23,2: 160-171 (April 2000). Depart-
ment of Economics and Institute of Government and Public Affairs, University of Illinois at Urbana-Champaign, [email protected].
Bob Powell, Ph.D., MBA • • Continuous Improvement Associates © 2003 • • [email protected] • • 719 599-0977 • • Rev 01/06/03 • • page 43
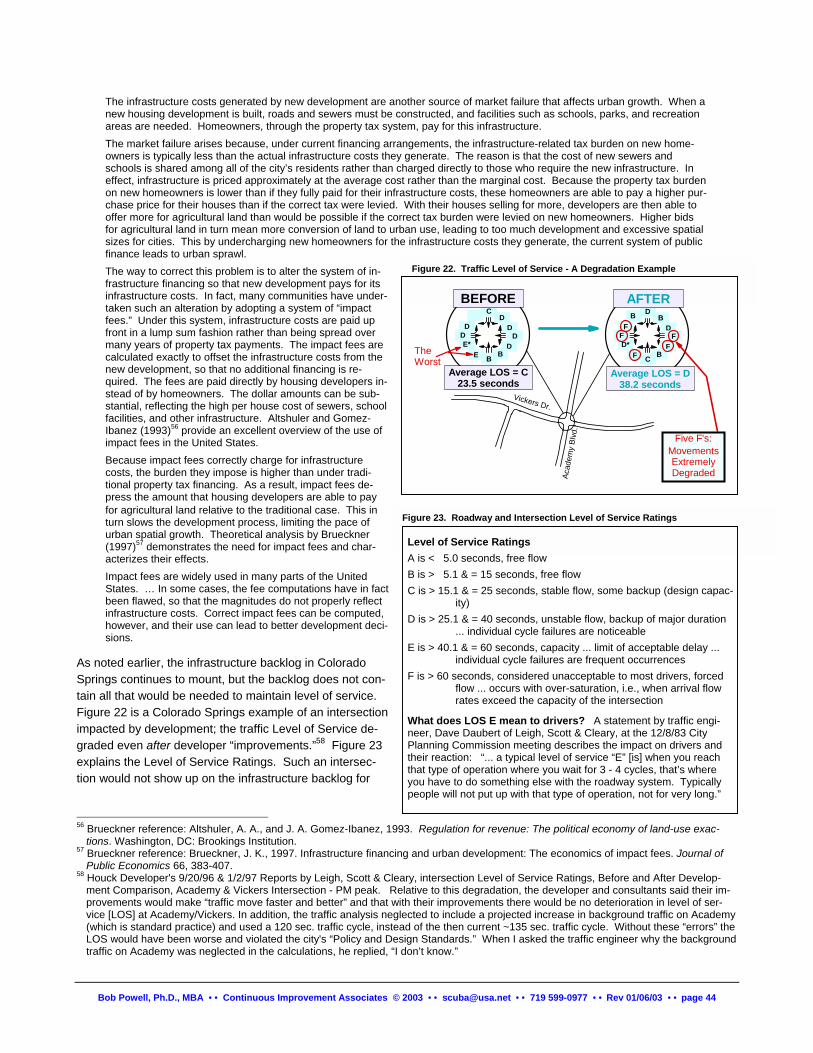
The infrastructure costs generated by new development are another source of market failure that affects urban growth. When a new housing development is built, roads and sewers must be constructed, and facilities such as schools, parks, and recreation areas are needed. Homeowners, through the property tax system, pay for this infrastructure. The market failure arises because, under current financing arrangements, the infrastructure-related tax burden on new home-owners is typically less than the actual infrastructure costs they generate. The reason is that the cost of new sewers and schools is shared among all of the city’s residents rather than charged directly to those who require the new infrastructure. In effect, infrastructure is priced approximately at the average cost rather than the marginal cost. Because the property tax burden on new homeowners is lower than if they fully paid for their infrastructure costs, these homeowners are able to pay a higher pur-chase price for their houses than if the correct tax were levied. With their houses selling for more, developers are then able to offer more for agricultural land than would be possible if the correct tax burden were levied on new homeowners. Higher bids for agricultural land in turn mean more conversion of land to urban use, leading to too much development and excessive spatial sizes for cities. This by undercharging new homeowners for the infrastructure costs they generate, the current system of public finance leads to urban sprawl. The way to correct this problem is to alter the system of in-frastructure financing so that new development pays for its infrastructure costs. In fact, many communities have under-taken such an alteration by adopting a system of “impact fees.” Under this system, infrastructure costs are paid up front in a lump sum fashion rather than being spread over many years of property tax payments. The impact fees are calculated exactly to offset the infrastructure costs from the new development, so that no additional financing is re-quired. The fees are paid directly by housing developers in-stead of by homeowners. The dollar amounts can be sub-stantial, reflecting the high per house cost of sewers, school facilities, and other infrastructure. Altshuler and Gomez-Ibanez (1993)56 provide an excellent overview of the use of impact fees in the United States. Because impact fees correctly charge for infrastructure costs, the burden they impose is higher than under tradi-tional property tax financing. As a result, impact fees de-press the amount that housing developers are able to pay for agricultural land relative to the traditional case. This in turn slows the development process, limiting the pace of urban spatial growth. Theoretical analysis by Brueckner (1997)57 demonstrates the need for impact fees and char-acterizes their effects. Impact fees are widely used in many parts of the United States. … In some cases, the fee computations have in fact been flawed, so that the magnitudes do not properly reflect infrastructure costs. Correct impact fees can be computed, however, and their use can lead to better development deci-sions.
As noted earlier, the infrastructure backlog in Colorado Springs continues to mount, but the backlog does not con-tain all that would be needed to maintain level of service. Figure 22 is a Colorado Springs example of an intersection impacted by development; the traffic Level of Service de-graded even after developer “improvements.”58 Figure 23 explains the Level of Service Ratings. Such an intersec-tion would not show up on the infrastructure backlog for
56 Brueckner reference: Altshuler, A. A., and J. A. Gomez-Ibanez, 199
tions. Washington, DC: Brookings Institution. 57 Brueckner reference: Brueckner, J. K., 1997. Infrastructure financing
Public Economics 66, 383-407. 58 Houck Developer's 9/20/96 & 1/2/97 Reports by Leigh, Scott & Clea
ment Comparison, Academy & Vickers Intersection - PM peak. Reprovements would make “traffic move faster and better” and that witvice [LOS] at Academy/Vickers. In addition, the traffic analysis negle(which is standard practice) and used a 120 sec. traffic cycle, insteaLOS would have been worse and violated the city's “Policy and Destraffic on Academy was neglected in the calculations, he replied, “I d
Figure 23. Roadway and Intersection Level of Service Ratings
Vickers Dr.
B BD
FBC
FF
FD*
D
Average LOS = D38.2 seconds
DD
DBBE
DD
DE*
CAFTER
Average LOS = C23.5 seconds
BEFORE
Acad
emy
Blvd
.
F
���������������������������������� ��������������������������
Figure 22. Traffic Level of Service - A Degradation Example
����������������������������������������
Five F's:MovementsExtremelyDegraded
TheWorst
-
Bob Powell, Ph.D., MBA • • Continuous Improvement Associates © 2
Level of Service Ratings A is < 5.0 seconds, free flow B is > 5.1 & = 15 seconds, free flow C is > 15.1 & = 25 seconds, stable flow, some backup (design capac
ity) D is > 25.1 & = 40 seconds, unstable flow, backup of major duration
... individual cycle failures are noticeable E is > 40.1 & = 60 seconds, capacity ... limit of acceptable delay ...
individual cycle failures are frequent occurrences F is > 60 seconds, considered unacceptable to most drivers, forced
flow ... occurs with over-saturation, i.e., when arrival flow rates exceed the capacity of the intersection
What does LOS E mean to drivers? A statement by traffic engi-neer, Dave Daubert of Leigh, Scott & Cleary, at the 12/8/83 City Planning Commission meeting describes the impact on drivers and their reaction: “... a typical level of service “E” [is] when you reach that type of operation where you wait for 3 - 4 cycles, that’s where you have to do something else with the roadway system. Typically people will not put up with that type of operation, not for very long.”
3. Regulation for revenue: The political economy of land-use exac-
and urban development: The economics of impact fees. Journal of
ry, intersection Level of Service Ratings, Before and After Develop-lative to this degradation, the developer and consultants said their im-h their improvements there would be no deterioration in level of ser-cted to include a projected increase in background traffic on Academy d of the then current ~135 sec. traffic cycle. Without these “errors” the ign Standards.” When I asked the traffic engineer why the background on’t know.”
003 • • [email protected] • • 719 599-0977 • • Rev 01/06/03 • • page 44
years, perhaps even a decade, after the development was approved.
This is a minor example. Problems of greater magnitude can show up sooner. Here is a report in the Denver Post on 4/14/01: [http://www.denverpost.com/Stories/0,1002,11%257E21587,00.html]59
Colorado's three largest shopping malls were designed for traffic gridlock. Even though the Park Meadows, Cherry Creek and FlatIron Crossing malls forecast serious road congestion, local politicians approved the projects without making developers fix all the expected problems, records show. And bad as the predictions were, the reality often is worse. At Denver's Cherry Creek mall, traffic today exceeds the city's "worst-case scenario," records show. Around Douglas County's Park Meadows mall, some intersections are clogged with up to 10 times more rush-hour traffic than the developer predicted. Those intersections were supposed to move traffic easily for 15 years. At the 8-month-old FlatIron Crossing mall, Broomfield officials still haven't checked most roads to see if the developer's traffic promises have come true. But FlatIron Crossing's own traffic studies predicted that several key roads and intersections around the mall eventually would operate at the worst possible level of service: "F." For years, the top complaint about Colorado's population boom has been traffic gridlock. The development of the Park Mead-ows, Cherry Creek and FlatIron Crossing malls shows how politicians eager for more taxes - and developers eager for business - combined to create some of the gridlock metro Denver suffers from today. "I don't know anyone who has done a job of holding a developer to what a developer said it would do in terms of accommodat-ing traffic," said Steve Rudy, a local transportation planner since 1976 who now works at the Denver Regional Council of Gov-ernments. "The belief that the developer had a basic responsibility to pay for infrastructure has shifted." Denver granted permission for a multimillion-dollar expansion of the Cherry Creek mall even as area traffic greatly exceeded the developer's original predictions. In Douglas County, where Park Meadows has refused to join the RTD mass-transit district, local officials want taxpayers, not the developer, to finance major road fixes that equal $130 for every county resident. Everyone blames somebody else. Local politicians say state government should spend more on state highway improvements. State politicians say cities and coun-ties made a mess of local streets and forced too much traffic on state highways. And developers wonder how there's any short-age of cash for road improvements when their malls pump out so much sales and property tax. The result is gridlock faced by thousands of metro Denver residents such as Melissa Gaskill, 33, a once-a-week Park Meadows shopper from Parker. "The traffic is ridiculous, just horrible," said Gaskill, carrying a Sbarro cup while leading three school-age daughters back to the family Lincoln Navigator parked outside the mall food court. "I was here the day it opened, but for a while I just wasn't coming, the drive was so bad. Now I'm always looking for the little detours to get me around all the traffic." Outside Park Meadows mall, where developer-financed roads were supposed to handle all expected new traffic, a taxpayer-financed study found that the area now needs $7.4 million of immediate road improvements, plus another $15.7 million of road widenings in the next 10 years. Those extra road costs are likely to be borne by taxpayers, not developers.
The costs of this are enormous as documented in the 4/16/01 follow-up story in the Denver Post:60 Now this is “business friendly." [http://www.denverpost.com/Stories/0,1002,165%257E22035,00.html]
Broomfield city officials were so gung-ho to attract the new FlatIron Crossing mall and neighboring stores that they agreed to pay developers one of the largest business subsidies in the history of Colorado - $279.5 million. That's a taxpayer subsidy of $7,300 for every man, woman and child in Broomfield over two decades. The subsidy is so vast, and so complex, that the mayor of Broomfield admitted he didn't know of one twist worth more than $100 million dollars until The Denver Post informed him of it. City officials acknowledge the subsidy is large, but bet that it will pay off: Broomfield eventually expects to net $379.6 million in new sales, property and use taxes from the mall and surrounding retailers. "For 35 years of our city's history, we were just a bedroom community. Now we've got an economic engine," said Broomfield Mayor Bill Berens. "If our citizens didn't like what their elected leaders are doing, they'd fire us. I think they like what we're doing." Westminster city officials, whose competing Westminster Mall has been hurt by the opening of FlatIron Crossing, said they're amazed and dismayed by the size of the Broomfield subsidy, which is to be paid over 21 years. "My gosh, that's huge. I just don't see how it makes good business sense," said Westminster city manager Bill Christopher. "If that deal were presented to Westminster, I'd tell our City Council, "No, don't approve that.'" In a metro area booming with new development, there is a widening debate about how - or whether - growth should pay its own way. On Sunday, The Post reported that some mall developers and local governments, eager for sales-tax dollars, underesti-mated traffic problems that taxpayers now are being asked to solve. The Broomfield deal for the FlatIron Crossing mall shows how far one city reached financially for a project that could build a bounty of new parks and schools - or go bust. Broomfield officials said they decided to start hunting for a mall developer after learning that the suburb collected less in sales taxes, per resident, than several other cities, including Englewood, Longmont and Wheat Ridge. Land owned by a rancher along U.S. 36 was identified by city officials as the ideal spot for a regional mall. Officials sought advice from Nordstrom, the na-tional retailer. A Nordstrom executive urged Broomfield to contact Westcor, an Arizona mall developer that recently had sealed a deal to bring the upper-end retailer to a new shopping center in Scottsdale.
59 “Shoppers in a jam at malls, Road forecasts ignored in the rush to build” by Mark Obmascik Denver Post Staff Writer 60 “Mall subsidy tops $279 million, Prospect of FlatIron riches led Broomfield to deal” by Mark Obmascik, Denver Post Staff Writer
Bob Powell, Ph.D., MBA • • Continuous Improvement Associates © 2003 • • [email protected] • • 719 599-0977 • • Rev 01/06/03 • • page 45
The Arizona developer expressed interest in the Broomfield site, but told city officials the deal likely would require a public sub-sidy. "It's just the nature of the regional mall business these days that the projects don't proceed without public investment," said Westcor senior vice president David Scholl. "We told Broomfield, "We require a certain rate of return on the capital in the project, and we want help to reach that target.'" Westcor said it needed a 12 percent return on the project. Broomfield city officials pulled out their calculators and started working a deal. Their solution: Let the developer build all the roads and water and sewer lines for the mall, and let the city repay the developer for the work over time. This arrangement differed from two other major mall deals. With the Park Meadows mall in Douglas County and the Cherry Creek mall in Denver, developers were required to pay for almost all road improvements. "It is a source of pride for us to say no public dollars were used for Cherry Creek," said mall manager Nick LeMasters. Douglas County administrator Douglas DeBord said, "There just weren't incentives offered for Park Meadows. In Douglas County, we haven't needed to offer subsidies." In Broomfield, though, city officials agreed to pay for the developer-required roads and plumbing and then some: The money will be repaid at 9 percent interest. City officials also wanted other developers to build stores around the mall. But those other de-velopers refused unless they got a sweeter deal than the mall. So Broomfield agreed to pay the other developers, Mid-Cities and the Midland Group, the 9 percent interest rate, plus construction management fees that boosted the cost of roads, water and sewer by 8 percent. Here's the result: The initial value of the city subsidy to the three developers is $149.8 million. By the time Broomfield pays the 8 percent construction fees and 9 percent interest, though, the city's total subsidy paid to developers over the next 21 years is $279.5 million. When asked about the construction fees and interest costs that added $129.7 million to the taxpayers' subsidy of the retail pro-jects, Berens, the Broomfield mayor, said, "I don't know what was negotiated. You have something I don't." Berens noted that the mayor of Broomfield is a part-time job that pays $500 a month. "We rely on our city staff to negotiate these deals," Berens said. Asked about the 8 percent construction management fee for development near the mall, Charles Ozaki, Broomfield assis-tant city manager, said, "It's because Westcor was first. It's a miracle the financing was put together." Payments to mall developers must be approved each year by Broomfield elected officials. The subsidy calls for the city to keep half the annual sales tax collected at the mall and two related developments. The other half is paid back at 9 percent interest to the three developers until their costs for roads and water and sewer lines are reimbursed. Taxpayer repayment to developers is scheduled to take up to 21 years, though that period can be shortened if the city issues its own bonds, at lower interest rates, to cover the debt. "The reimbursement agreements with the three developers are subject to annual appropriations and are risk-free to the city," Ozaki said. "If the projects do not generate sufficient revenues to pay off all obligations within 21 years, any remaining obligations expire." On top of the infrastructure subsidy, Broomfield agreed to give developers extra financial breaks. A cap on city water and sewer fees so far has saved the Mid-Cities developer $51,736. The city also agreed to exempt parking structures from calculations of "maximum allowable floor area" in the development, a clause that allows Mid-Cities to build the most possible retail space. In addition, Broomfield agreed to help Midland Group find enough fill dirt from other nearby properties to develop its retail tract. And the city has stationed seven police officers and one sergeant at the mall. The police presence costs $443,669 a year. The mall contributed $75,000 to defray those security costs, and Broomfield used a $175,000 federal grant from President Clinton's drive to add 100,000 police across America to help pay for FlatIron Crossing mall cops. Still, Broomfield city officials say they expect to net $23 million a year in new sales, use and property taxes from the three retail developments. City officials said they will spend the taxes on, among other things, open space purchases ($15.4 million), a rec-reation center and field construction ($40.8 million) and city government buildings ($5 million). With potential benefits like that, the FlatIron Crossing mall developer said the risks of the project are spread fairly between the city and business. "There's a standard joke in our company," said Scholl, the Westcor vice president. "We tell the local govern-ment, "Let's try this: You own our mall and collect the rents and work for the success of the business, and we'll collect the sales tax. Want to do it?' "They always take the tax."61
The overall cumulative effect of such policies is a major negative impact on quality of life. Logan and Molotch also note that development most often represents a net fiscal loss for a city.62
Systematic comparative analyses of government costs as a function of city size and growth have found that cost is positively re-lated to both size of place and rate of growth, at least for middle-size cities (see Appelbaum, 197663; Follett, 197664). Of course, the conditions of growth are important. The overall fiscal state of a city depends on the kind of growth involved (industrial versus residential, and the subtypes of each) and the existing capacities of the local infrastructure. In general, most studies (see Stuart and Teska, 197165) conclude that housing development represents a net fiscal loss because of the service costs that residents require, although housing for the rich is more lucrative than housing for the poor. Industrial and commercial growth, on the other hand, tends to produce net benefits for the tax base, but only if the costs of servicing additions to the local labor force are omit-
61 That’s a nice rhetorical flourish by the developer, but running a mall is not generally considered the purview of government and he would
have a fit if such an undertaking were even contemplated. 62 Logan & Molotch, Urban Fortunes, The Political Economy of Place, 1987, University of California Press, p. 86. 63 Logan & Molotch footnote: Appelbaum, Richard P., Jennifer Bigelow, Henry Kramer, Harven Molotch, and Paul Relis. 1976. The Effects
of Urban Growth, New York: Praeger. 64 Logan & Molotch footnote: Follett, Ross. 1976. “Social Consequences of Urban Size and Growth: An Analysis of U.S. Urban Areas.”
Ph.D. dissertation, Department of Sociology, University of California, Santa Barbara. 65 Logan & Molotch footnote: Stuart, Darwin, and Robert Teska. 1971. Who Pays for What: Cost Revenue Analysis of Suburban Land Use
Alternatives. Washington, D.C.: Urban Land Institute.
Bob Powell, Ph.D., MBA • • Continuous Improvement Associates © 2003 • • [email protected] • • 719 599-0977 • • Rev 01/06/03 • • page 46
ted from the calculations. If local government provides special tax incentives or other sorts of subsidies to attract new indus-tries, the fiscal costs of development will obviously be higher.
It is possible for development to have a positive fiscal impact for cities that have underutilized infrastructure.66
Growth can also at times save a local government money. A primary factor in this possibility is the existence of “unused capaci-ties.” If a town has a declining birth rate and thus a school district with empty classrooms, officials may try to attract additional families to increase the efficient use of the physical plant and thereby reduce the per capita costs. If a city is paying off a bonded debt on a sewer plant that could serve double its present demand, officials may seek additional users in order to spread the costs to a larger number and thus decrease the burden for current residents.
This is not the case for Colorado Springs. In Colorado Springs these costs have created the growing infrastructure backlog noted earlier. The costs are externalized onto the public with pressure for sales tax increases to pay for them. Increased taxes have led to an anti-government mentality and an antipathy toward government regulation. . There’s a certain irony that it is exactly this lack of regulation (assuring that impact fees do not allow the market to send the correct signals on the true cost of development) that is the root of the need for higher taxes.
Without growth management, the infrastructure backlog will continue to increase. There will be increasing pressure to spend tax dollars on infrastructure, rather than on subsidies for affordable housing, parks, public transportation, or on any of a wide range of other public services.
A growing infrastructure backlog has caused some movement toward mitigating impacts:67
A plan to have developers build needed road improvements in the Falcon area got a warm reception from the El Paso County Commission on Thursday. The commission – meeting in a work session where no formal action is taken – directed the staff to devise a plan to carry out recommendations of a traffic study that suggests roughly $15 million in road improvements be funded by developers in that area. New development in Meridian Ranch, Bennett Ranch, Falcon Hills and other subdivisions is expected to add 5,400 homes in the next 20 years. Those homes will create 100,000 more vehicle trips per day on the area's roads, according to a study by consult-ant URS of Colorado Springs. The study recommended 34.5 more lane miles of roads be built, including widening Woodmen, Meridian, Judge Orr, Stapleton and Eastonville roads. The county will help fund the Woodmen project. Consultants also suggested the cost should be split among developers, based on how much traffic their subdivisions generate. If approved by the County Commission, the plan would represent the county's most far-reaching road improvement program funded by developers to date. While developers already build roads within subdivisions, they aren't routinely tapped for im-provements to existing county roads.
66 Logan and Molotch, , Urban Fortunes, The Political Economy of Place, 1987, University of California Press, p. 86. 67 “County may tap builders,” The Gazette, 11/03/00
Bob Powell, Ph.D., MBA • • Continuous Improvement Associates © 2003 • • [email protected] • • 719 599-0977 • • Rev 01/06/03 • • page 47
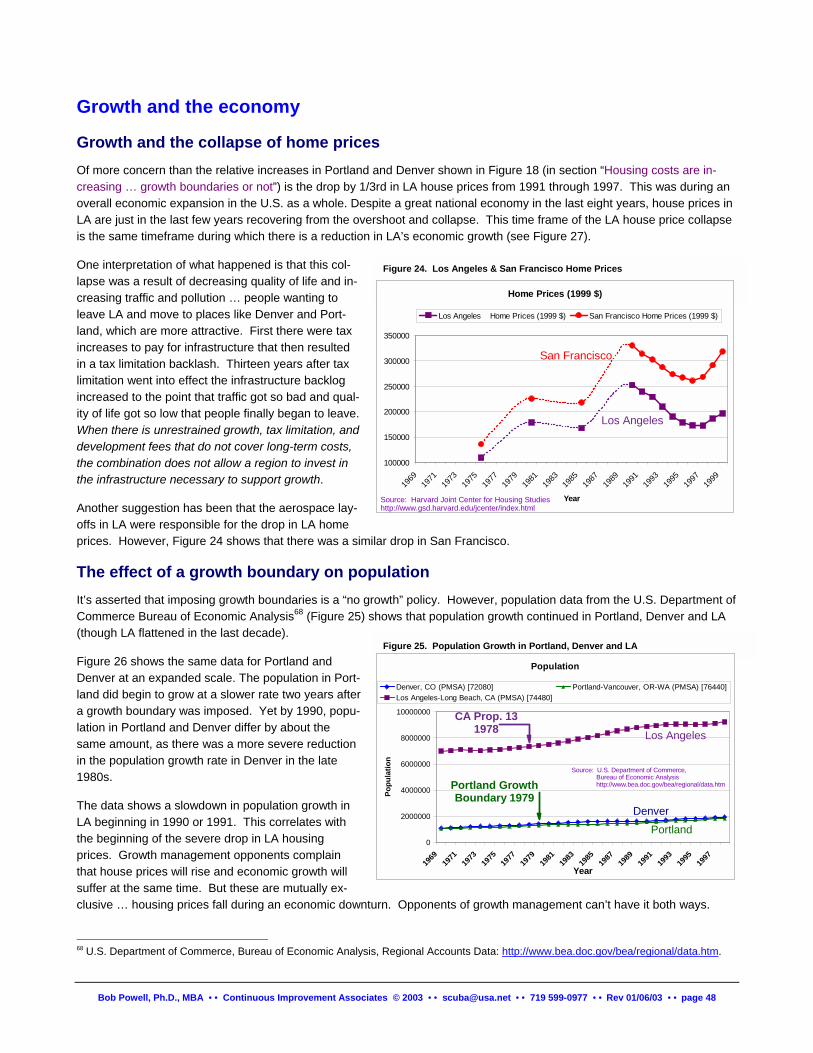
Growth and the economy
Growth and the collapse of home prices Of more concern than the relative increases in Portland and Denver shown in Figure 18 (in section “Housing costs are in-creasing … growth boundaries or not”) is the drop by 1/3rd in LA house prices from 1991 through 1997. This was during an overall economic expansion in the U.S. as a whole. Despite a great national economy in the last eight years, house prices in LA are just in the last few years recovering from the overshoot and collapse. This time frame of the LA house price collapse is the same timeframe during which there is a reduction in LA’s economic growth (see Figure 27).
One interpretation of what happened is that this col-lapse was a result of decreasing quality of life and in-creasing traffic and pollution … people wanting to leave LA and move to places like Denver and Port-land, which are more attractive. First there were tax increases to pay for infrastructure that then resulted in a tax limitation backlash. Thirteen years after tax limitation went into effect the infrastructure backlog increased to the point that traffic got so bad and qual-ity of life got so low that people finally began to leave. When there is unrestrained growth, tax limitation, and development fees that do not cover long-term costs, the combination does not allow a region to invest in the infrastructure necessary to support growth.
Figure 24. Los Angeles & San Francisco Home Prices
Another suggestion has been that the aerospace lay-offs in LA were responsible for the drop in LA home prices. However, Figure 24 shows that there was a similar drop in San Francisco.
Home Prices (1999 $)
100000
150000
200000
250000
300000
350000
1969
1971
1973
1975
1977
1979
1981
1983
1985
1987
1989
1991
1993
1995
1997
1999
Year
Los Angeles Home Prices (1999 $) San Francisco Home Prices (1999 $)
Source: Harvard Joint Center for Housing Studieshttp://www.gsd.harvard.edu/jcenter/index.html
San Francisco
Los Angeles
The effect of a growth boundary on population It’s asserted that imposing growth boundaries is a “no growth” policy. However, population data from the U.S. Department of Commerce Bureau of Economic Analysis68 (Figure 25) shows that population growth continued in Portland, Denver and LA (though LA flattened in the last decade).
Figure 26 shows the same data for Portland and Denver at an expanded scale. The population in Port-land did begin to grow at a slower rate two years after a growth boundary was imposed. Yet by 1990, popu-lation in Portland and Denver differ by about the same amount, as there was a more severe reduction in the population growth rate in Denver in the late 1980s.
The data shows a slowdown in population growth in LA beginning in 1990 or 1991. This correlates with the beginning of the severe drop in LA housing prices. Growth management opponents complain that house prices will rise and economic growth will suffer at the same time. But these are mutually ex-clusive … housing prices fall during an economic downtu
A
68 U.S. Department of Commerce, Bureau of Economic Analysis
Bob Powell, Ph.D., MBA • • Continuous Improvement Associa
Figure 25. Population Growth in Portland, Denver and L
rn. Opponents of growth management can’t have it both ways.
Population
0
2000000
4000000
6000000
8000000
10000000
1969
1971
1973
1975
1977
1979
1981
1983
1985
1987
1989
1991
1993
1995
1997
Year
Popu
latio
n
Denver, CO (PMSA) [72080] Portland-Vancouver, OR-WA (PMSA) [76440]Los Angeles-Long Beach, CA (PMSA) [74480]
CA Prop. 131978
Source: U.S. Department of Commerce, Bureau of Economic Analysis http://www.bea.doc.gov/bea/regional/data.htmPortland Growth
Boundary 1979
PortlandDenver
Los Angeles
, Regional Accounts Data: http://www.bea.doc.gov/bea/regional/data.htm.
tes © 2003 • • [email protected] • • 719 599-0977 • • Rev 01/06/03 • • page 48
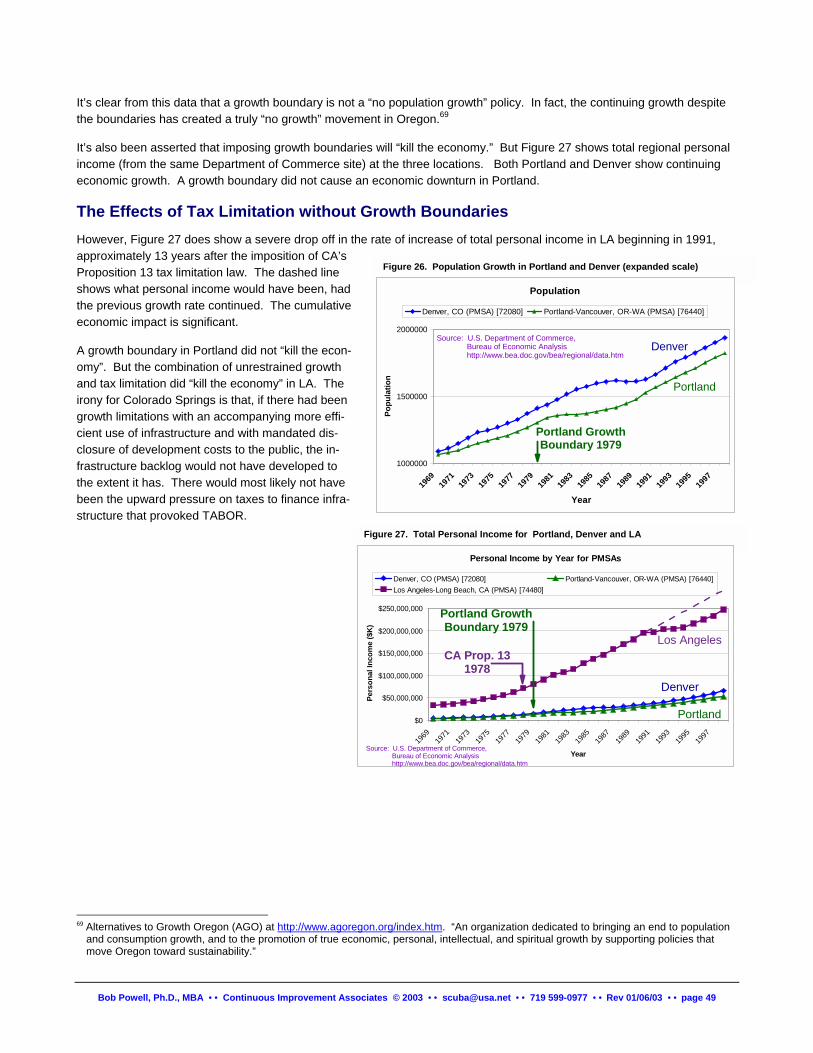
It’s clear from this data that a growth boundary is not a “no population growth” policy. In fact, the continuing growth despite the boundaries has created a truly “no growth” movement in Oregon.69
It’s also been asserted that imposing growth boundaries will “kill the economy.” But Figure 27 shows total regional personal income (from the same Department of Commerce site) at the three locations. Both Portland and Denver show continuing economic growth. A growth boundary did not cause an economic downturn in Portland.
The Effects of Tax Limitation without Growth Boundaries However, Figure 27 does show a severe drop off in the rate of increase of total personal income in LA beginning in 1991, approximately 13 years after the imposition of CA’s Proposition 13 tax limitation law. The dashed line shows what personal income would have been, had the previous growth rate continued. The cumulative economic impact is significant.
Population
1000000
1500000
2000000
1969
1971
1973
1975
1977
1979
1981
1983
1985
1987
1989
1991
1993
1995
1997
Year
Popu
latio
n
Denver, CO (PMSA) [72080] Portland-Vancouver, OR-WA (PMSA) [76440]
Portland GrowthBoundary 1979
Source: U.S. Department of Commerce, Bureau of Economic Analysis http://www.bea.doc.gov/bea/regional/data.htm
Portland
Denver
Figure 26. Population Growth in Portland and Denver (expanded scale)
A growth boundary in Portland did not “kill the econ-omy”. But the combination of unrestrained growth and tax limitation did “kill the economy” in LA. The irony for Colorado Springs is that, if there had been growth limitations with an accompanying more effi-cient use of infrastructure and with mandated dis-closure of development costs to the public, the in-frastructure backlog would not have developed to the extent it has. There would most likely not have been the upward pressure on taxes to finance infra-structure that provoked TABOR.
Personal Income by Year for PMSAs
$0
$50,000,000
$100,000,000
$150,000,000
$200,000,000
$250,000,000
1969
1971
1973
1975
1977
1979
1981
1983
1985
1987
1989
1991
1993
1995
1997
Year
Pers
onal
Inco
me
($K
)
Denver, CO (PMSA) [72080] Portland-Vancouver, OR-WA (PMSA) [76440]Los Angeles-Long Beach, CA (PMSA) [74480]
Portland GrowthBoundary 1979
CA Prop. 131978
Source: U.S. Department of Commerce, Bureau of Economic Analysis http://www.bea.doc.gov/bea/regional/data.htm
Portland
Denver
Los Angeles
Figure 27. Total Personal Income for Portland, Denver and LA
Bob Powell, Ph.D., MBA • • Continuous Improvement Associates © 2003 • • [email protected] • • 719 599-0977 • • Rev 01/06/03 • • page 49
69 Alternatives to Growth Oregon (AGO) at http://www.agoregon.org/index.htm. “An organization dedicated to bringing an end to population
and consumption growth, and to the promotion of true economic, personal, intellectual, and spiritual growth by supporting policies that move Oregon toward sustainability.”
Tax Policy and Growth
TABOR TABOR, the 1992 initiative that rewrote Article XX of the Colorado Constitution makes taxpayers think they’re protected. They’re not. The effect is somewhat like continuing to make purchases by credit card and at the same time deciding to not pay the bill … the unpaid balance continues to rise.
It may protect them from paying dollars, but instead they pay by waiting in traffic, by not having streets plowed in winter, by having sewage flood their homes, and by the loss of a myriad of other public services. Developments are approved and, in the near term, state and local governments get added revenue from taxes on materials and wages, because the TABOR formula allows tax increases for population growth. However, years later the infrastructure burden appears for roads, drain-age, schools, etc., but there is insufficient revenue and TABOR prevents raising taxes, or even retaining the revenue already raised, to pay the costs without specific voter approval.
Because of the long delays, the need for additional infrastructure is never linked to the original decision to approve develop-ment that created the need. TABOR exacerbates the addiction to growth (see the section on “Addiction to growth”).
The Gallagher Amendment The Gallagher amendment, passed in 1982, establishes a 55/45 ratio on the total assessed value of nonresidential (busi-ness) / residential property. That is, business property shall account for 55% of total assessed value of all property in the state. The assessed value of property is obtained by multiplying market value (set by each county assessor) by an assess-ment rate. The non-residential property assessment rate is set in the State Constitution at 29%, so the residential assess-ment rate is changed every two years to meet the 55/45 ratio required by Gallagher.
When statewide residential development, and therefore the total value of residential property, surges faster than the total value of business property, it pushes the statewide ratio of residential/business value higher. Therefore, to compensate, the residential assessment rate must be reduced. Since 1982 the residential assessment rate has dropped from 21% to 9.74%.
The impact of Gallagher is that communities prefer to attract business property that can be taxed at a higher rate than resi-dential. This pushes residential development into outlying areas that become overburdened with demands for public ser-vices but do not have a tax base sufficient to pay for them. This is a driver of sprawl. Opponents of growth boundaries com-plain they drive residential development out into smaller communities, but that’s already happening due to other tax policies.
An overview of Colorado tax policy and growth70 Colorado’s tax policy influences the amount of growth and where it goes; the following is an insightful summary that lays out the issues:71
The negative effects of growth and whether growth pays for itself top this year's legislative agenda. These new concerns have crowded out earlier concerns about Colorado's revenue-raising system, yet both are inextricably linked. “Smart growth” calls for tax policies to ensure that growth pays for itself. It calls for tax policies that encourage the protection of open space and clean air while discouraging patterns that result in traffic congestion and sprawl. Tax policy is about much more than how much is paid in taxes. The kinds of taxes we use to raise a given level of revenue af-fect economic decisions in different ways. That's one of the reasons why Colorado, like many states, has relied on the “three-legged stool” of income, sales and property taxes to finance public activities. At the state level, we rely heavily on the income tax and the state portion of the sales tax. Cities, counties and special districts rely on a mix of sales and property taxes. The prop-erty tax is the only direct source of revenue for school districts, although most receive operating-budget equalization dollars from the state. Keeping the legs of the stool relatively balanced helps us pay for growth and accommodates swings in the economy. In addition, inequities and inefficiencies in each tax are largely balanced out by the others. The Colorado system for collection of sales-tax revenue influences growth patterns and can make it difficult to pay for growth. The sales tax appears simple to the consumer who pays it. But it is a complex patchwork of rates levied in al most 300 individual jurisdictions, each added to the 2.9 percent state sales tax. This increases complexity for businesses operating in multiple juris-
70 Also see, “Does Colorado’s Tax Policy Encourage “Smart Growth?” Center for Colorado Policy Studies Working Paper, Daphne Green-
wood. Find the Center for Colorado Policy Studies on the web at web.uccs.edu/ccps. 71 Denver Post, 3/25/01, “'Smart growth' and Colorado tax policies,” by Daphne Greenwood
Bob Powell, Ph.D., MBA • • Continuous Improvement Associates © 2003 • • [email protected] • • 719 599-0977 • • Rev 01/06/03 • • page 50
dictions and influences local growth decisions. Local governments compete to receive the sales tax revenue from people who live in other jurisdictions. These shoppers drive home to the cities and counties that provide services to them, leaving their sales-tax dollars behind. Park Meadows mall is in Douglas County, but many of its customers live in Denver and Arapahoe counties. The mall contributes to traffic congestion in Arapahoe County, but its sales-tax revenues go entirely to Douglas County. In Montrose, Sterling and many other towns around Colorado, a new Wal-Mart attracts shoppers from a multi-county area and brings in their sales tax dollars. In many rural counties, the local sales tax is applied to groceries because they are the main source of retail sales. But this encourages residents to travel elsewhere for more variety and better prices, further hindering economic development in their home counties. A few cities (Thornton and Northglenn, for example) have hammered out revenue-sharing agreements for new properties such as a mall, but these remain the exception. They must be done one by one, between two governments at a time. Legislation in-troduced this year by Sen. Pat Pascoe would have required areas with more than a million in population to implement multi-jurisdictional revenue-sharing agreements when new development occurs. Agreements would have been voluntary in less densely populated areas but easier to accomplish. Growth legislation that doesn't include a provision along these lines will fail to deal with one of the major challenges facing Colorado. Differential assessment rates on commercial and residential property make it difficult to pay for growth. The 1982 Gallagher amendment requires that residential owners pay no more than 45 percent of the total statewide property tax, meaning that busi-nesses pay 55 percent. Since total residential property value increased much more rapidly than commercial and agricultural property value during the last two decades, the taxes assessed on residences are now only on 9.74 percent of market value vs. 21 percent of value in the early 1980s. Areas compete to attract commercial property, assessed at 29 percent of market value, in order to finance the services needed primarily by households. Some communities, like Broomfield, cap the growth in new homes and try to have as much high-value commercial property as possible. It is easy to see the effect that this has on affordable housing. Based on assessed property value, some areas have higher capacity to finance growth-driven infrastructure needs than others. A recent analysis by Dr. Tom Brown of the Center for Colorado Policy Studies shows the enormous variation among districts in bonding capacity and the relationship to income, racial and ethnic differences. The Vail-Eagle School District can finance up to $67,232 per pupil under the 20 percent limit, while neighboring Leadville has a limit of $9,963. Boulder Valley Schools can finance $21,257 per pupil, while Thornton-Northglenn has a bonding capacity of only $6,723. In El Paso County, Cheyenne Mountain can bond debt of $12,220 per pupil, while nearby Fountain/Fort Carson has one of the lowest capacities in the state at $2,736. Constitutional amendments affecting property taxes have added to the inherent confusion of mill levies, assessments and differ-ential assessment ratios. As a result, there are periodic calls for getting rid of the property tax altogether. However, eliminating any one tax raises two critical questions: How do we re place lost revenues with revenues from another tax? (That idea was never so popular as getting rid of the first tax.) And what about the overall equity and efficiency of the tax system if one leg of the stool is eliminated, or even considerably shortened? Local governments are relying less on property taxes and more on sales taxes. The 1992 TABOR amendment further reduces property-tax collections. It requires mill levies to fall when collections increase by more than inflation plus new growth, but does not allow them to rise when the reverse is true. The limit TABOR sets on local government revenues is a complex measure of local area growth based on property values, but does not include more population or higher incomes. Since the extra tax dollars automatically generated by new growth cannot be spent by local governments without special voter approval, growth cannot automatically pay for itself under TABOR. Because of TABOR's revenue limits, even impact fees paid by developers sometimes may not be used to pay for growth im-pacts, but must instead be refunded to taxpayers. This past year, Douglas County was required to refund millions of dollars from these fees that could have been used to pay for growth in one of the fastest-growing counties in the nation. Just because reve-nues come in doesn't mean they can be spent. The TABOR revenue limit for cities and counties favors annexations and new construction. If individuals or businesses rehab older, existing properties, this does not increase the local revenue limit the way that a new subdivision or office park does.72 This gives local governments an incentive to annex new areas and to permit new construction, rather than to support “in fill” or reha-bilitation of older neighborhoods. Local planning and land-use decisions end up being driven by tax policy as much as by com-munity needs. The increased reliance of local governments on sales vs. property taxes shortens the most stable leg of the stool. Sales-tax revenues rise and fall with the economy much more than property tax revenues. Many services of local governments, such as fire and police protection, require stable funding. Even though the spending on infrastructure that growth requires could be post-poned for a “good year,” the TABOR limit makes it difficult to do this. If the limit allows 4 percent growth in spending but slower growth provides only 2 percent more dollars, the budget ceiling is adjusted down permanently. Future revenue growth will be al-lowed only to the degree that inflation and the addition of new real properties through construction or annexation occurs, even if sales-tax revenues rebound. Our tax system affects the ability to plan for “smart growth” in two important ways. First, regional growth planning is more difficult with more than 1,900 different taxing entities in the state. While over all state and local taxes are somewhat below the national
72 The local “growth” limits of TABOR are not based on population, but on a formula dealing with new construction or annexation. At the
state level population is included and at the school district level pupil enrollment. – Daphne Greenwood, private e-mail communication, 3/28/01.
Bob Powell, Ph.D., MBA • • Continuous Improvement Associates © 2003 • • [email protected] • • 719 599-0977 • • Rev 01/06/03 • • page 51
average, our local taxes are among the highest in the nation. This is primarily due to the small pro portion of the sales tax that goes to the state, and the large proportion which remains where the tax was collected. While this system fosters local control, it has the negative effect of hampering cooperation and causing competition between local governments for retail and commercial establishments. Second, constitutional amendments such as TABOR and Gallagher make it difficult for state and local governments to adjust tax policy to changing times and needs. These can only be changed at the ballot box. The “single-subject rule” would require comprehensive tax policy changes to be voted on individually. Voters might approve lowering one tax but not approve replacing revenue with another. In such a climate, how likely is comprehensive tax reform? It is easy to say “not very likely.” However, the question is not whether to enact policies to influence growth - we already have them in our tax structure. The question is whether our current system encourages and ac-commodates citizen priorities about growth. If it doesn't, are we willing to tackle changing it?
Bob Powell, Ph.D., MBA • • Continuous Improvement Associates © 2003 • • [email protected] • • 719 599-0977 • • Rev 01/06/03 • • page 52
The Free Market: Success & Failure
The free market ideal Before looking at failures, here is Jan Brueckner’s description of how the free market works.73
For a city to grow spatially, developers must be able to bid away additional land from agricultural users. A successful bid by de-velopers means the land is worth more in urban use than in agriculture, reflecting a greater economic contribution in its devel-oped state. In this sense, land conversion is guided by the economist’s “invisible hand,” which directs resources to their highest and best use. The key implication of this principle is that urban growth is not an indiscriminate process, devouring agricultural land without re-gard to its worth. Although many critics of urban sprawl seem to hold this unfavorable view of the growth process the view is not consistent with the operation of a free market economy, where resources find their most productive uses. Buttressing this claim, evidence has shown that in regions where agricultural land is productive and its value high, cities are more spatially compact than in regions where agricultural land is unproductive and therefore cheap (Brueckner and Fansler 1983). Productive agricul-tural land is thus more resistant to urban expansion than unproductive land, reflecting the operation of the invisible hand. Concerns about loss of “scarce” farmland are also misplaced. Because the value of farm output is fully reflected in the amount that agricultural users are willing to pay for the land, a successful bid by developers means that society values the houses and other structures built on the land more than the farm output that is forgone. If farmland became truly scarce and in need of preservation, its selling price would be high, making the land resistant to urban encroachment. With only a tiny fraction of the U.S. land area occupied by cities, farmland scarcity is not a problem currently, nor is it likely to become a problem in the future. Although the allocation of land is governed by competition between urban and agricultural uses, the outcome has increasingly tipped in favor of urban use, leading to substantial spatial growth of cities and prompting criticism of urban sprawl. Economists believe that three underlying forces - population growth, rising household incomes and transportation improvements - are re-sponsible for this spatial growth (see Mieszkowski and Mills 1993). As the nation's population expands, cities must grow spa-tially to accommodate more people. In addition, rising incomes affect urban growth because residents of the city demand more living space as they become richer over time. By itself, the greater demand for space causes the city to expand spatially as dwelling sizes increase. This effect is reinforced by the residents' desire to carry out their greater housing consumption in a lo-cation where housing is cheap, namely the suburbs. So the spatial expansion due to rising incomes is strengthened by a price incentive favoring suburbanization. A similar phenomenon occurs in response to investment in freeways and other transportation infrastructure. Because such in-vestment makes travel faster and more convenient, thus reducing the cost of commuting, consumers can enjoy cheap housing in the suburbs while paying smaller commuting-cost penalties. As a result, suburban locations look increasingly attractive as commuting costs fall, which spurs suburbanization and leads to spatial growth of the city. Job suburbanization has also occurred as cities have grown spatially. This relocation of jobs to the suburbs has been due in part to changes in the transport orientation of businesses. Rather than shipping their output through centrally located rail depots and port facilities, firms increasingly rely on truck transport and, thus, prefer the easy highway access (as well as the low cost) of suburban locations, However, the evidence shows that jobs also follow people. In other words, job suburbanization is partly a response to the suburbanization of the population, which occurs for the reasons discussed above. Thus, unlike the fundamental forces driving urban expansion, job suburbanization is partly an effect rather than a cause of this growth. Thurston and Yezer (1994) provide a useful empirical analysis of the interaction between job and population decentralization. The confluence of an expanding national population, rising incomes, and falling commuting costs makes the rapid expansion of cities in recent decades unsurprising. The real question is whether this expansion has been too rapid. In other words, does the invisible hand, which guides the conversion of land to urban use, push too hard in the direction of bigger cities? Economists use the term market failure to describe a situation in which the invisible hand fails to allocate resources in a socially desirable manner, so as to maximize aggregate economic well-being. Market failure arises when economic agents face incen-tives that are distorted because of institutional failings or some other reason, leading to economic outcomes that are bad from society's point of view. The classic example of a market failure is air and water pollution, where a factory has little incentive to take account of the environmental damage it causes and, thus, ends up polluting too much. Is a similar market failure involved in the spatial expansion of cities? If so, the criticism of urban sprawl is justified, and measures are needed to restrict urban ex-pansion. Economists have, in fact, identified several market failures that may affect the urban growth process.
While Brueckner’s view is that “concerns about loss of ‘scarce’ farmland are also misplaced,” there are good reasons for concern. There are delays in recognizing the value of farmland; refer back to the excerpt above from Forrester’s paper on the “Counterintuitive Behavior of Social Systems” in the section on “Population growth.” Also, see the section below on “Representing the future to the present” that describes how standard economic analysis devalues future returns. In addition, cities tended to grow around the best farmland, not the worst; and therefore as cities grow they devour the land most suited to farming. It’s true that considerable land remains, but not necessarily the best land. Of most concern is the structure of our economic system that exerts overwhelmingly negative pressures on farmers, pressures that put undue pressure on them to sell their land because farming is unprofitable (see the section on “The Squeeze on Farmers”). 73 Jan K. Brueckner, “Urban Sprawl: Diagnosis and Remedies,” International Regional Science Review 23,2: 160-171 (April 2000). Depart-
ment of Economics and Institute of Government and Public Affairs, University of Illinois at Urbana-Champaign, [email protected].
Bob Powell, Ph.D., MBA • • Continuous Improvement Associates © 2003 • • [email protected] • • 719 599-0977 • • Rev 01/06/03 • • page 53
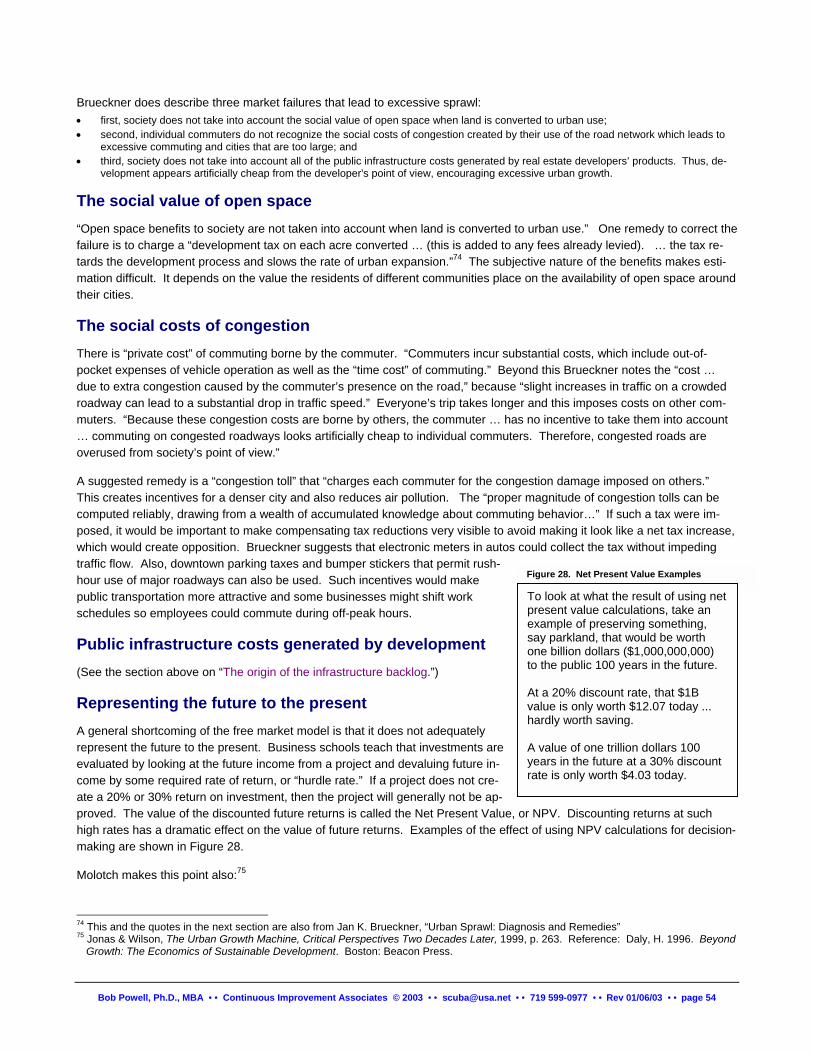
Brueckner does describe three market failures that lead to excessive sprawl: • first, society does not take into account the social value of open space when land is converted to urban use; • second, individual commuters do not recognize the social costs of congestion created by their use of the road network which leads to
excessive commuting and cities that are too large; and • third, society does not take into account all of the public infrastructure costs generated by real estate developers’ products. Thus, de-
velopment appears artificially cheap from the developer's point of view, encouraging excessive urban growth.
The social value of open space “Open space benefits to society are not taken into account when land is converted to urban use.” One remedy to correct the failure is to charge a “development tax on each acre converted … (this is added to any fees already levied). … the tax re-tards the development process and slows the rate of urban expansion.”74 The subjective nature of the benefits makes esti-mation difficult. It depends on the value the residents of different communities place on the availability of open space around their cities.
The social costs of congestion There is “private cost” of commuting borne by the commuter. “Commuters incur substantial costs, which include out-of-pocket expenses of vehicle operation as well as the “time cost” of commuting.” Beyond this Brueckner notes the “cost … due to extra congestion caused by the commuter’s presence on the road,” because “slight increases in traffic on a crowded roadway can lead to a substantial drop in traffic speed.” Everyone’s trip takes longer and this imposes costs on other com-muters. “Because these congestion costs are borne by others, the commuter … has no incentive to take them into account … commuting on congested roadways looks artificially cheap to individual commuters. Therefore, congested roads are overused from society’s point of view.”
A suggested remedy is a “congestion toll” that “charges each commuter for the congestion damage imposed on others.” This creates incentives for a denser city and also reduces air pollution. The “proper magnitude of congestion tolls can be computed reliably, drawing from a wealth of accumulated knowledge about commuting behavior…” If such a tax were im-posed, it would be important to make compensating tax reductions very visible to avoid making it look like a net tax increase, which would create opposition. Brueckner suggests that electronic meters in autos could collect the tax without impeding traffic flow. Also, downtown parking taxes and bumper stickers that permit rush-hour use of major roadways can also be used. Such incentives would make public transportation more attractive and some businesses might shift work schedules so employees could commute during off-peak hours.
Public infrastructure costs generated by development (See the section above on “The origin of the infrastructure backlog.”)
Representing the future to the present A general shortcoming of the free market model is that it does not adequately represent the future to the present. Business schools teach that investments are evaluated by looking at the future income from a project and devaluing future in-come by some required rate of return, or “hurdle rate.” If a project does not cre-ate a 20% or 30% return on investment, then the project will generally not be ap-proved. The value of the discounted future returns is called the Net Present Value, high rates has a dramatic effect on the value of future returns. Examples of the effemaking are shown in Figure 28.
s
Molotch makes this point also:75
Bob Powell, Ph.D., MBA • • Continuous Improvement Associates © 2003 • • [email protected] •
74 This and the quotes in the next section are also from Jan K. Brueckner, “Urban Sprawl: Diag75 Jonas & Wilson, The Urban Growth Machine, Critical Perspectives Two Decades Later, 199
Growth: The Economics of Sustainable Development. Boston: Beacon Press.
Figure 28. Net Present Value Example
or NPV. Discounting returns at such ct of using NPV calculations for decision-
To look at what the result of using net present value calculations, take an example of preserving something, say parkland, that would be worth one billion dollars ($1,000,000,000) to the public 100 years in the future. At a 20% discount rate, that $1B value is only worth $12.07 today ... hardly worth saving. A value of one trillion dollars 100 years in the future at a 30% discount rate is only worth $4.03 today.
• 719 599-0977 • • Rev 01/06/03 • • page 54
nosis and Remedies” 9, p. 263. Reference: Daly, H. 1996. Beyond

In terms of natural ecologies, we need a showing of true costs of disturbing systems and eroding resources, taking into account losses over the generations, rather than-as is now done under present-value analysis – treating near-term exploitation as more beneficial than long-term preservation (Daly 1996).
A systems perspective on the free market There are other problems with the free market. Actions based on our misperception that it is perfect are costly (as an exam-ple see the section on “The Squeeze on Farmers”). Donella Meadows has written a column on this.76
The free market is widely misunderstood, and it is a central feature of the modem industrial paradigm. I hammer at it regularly in my columns:
We are told, over and over, that the free market is a sort of natural wonder that guides the economy without need for gov-ernment interference. But, in fact, the market system is chronically, inherently unstable. All market economies oscillate, with 4-to-7-year business cycles, with longer cycles of construction and commodity production, and with 50-or-so-year-long waves that bring, among other things, major financial panics. The oscillations are inevitable because mutual adjustments of supply and demand are very slow. It takes time for producers to respond to shortages or surpluses by adjusting prices, and time for consumers to respond to price changes by buying more or less. It takes even longer for producers to gear up or down and for those responses to percolate through the sys-tem to suppliers and then to suppliers of suppliers. During the adjustment time – which can be years or even decades – shortages or surpluses go on getting worse, until the corrections begin to take hold. A huge economy cannot bring itself to a prompt supply-demand balance like the neat graphs in Economics 101 textbooks. Production and consumption yaw back and forth, seeking equilibrium, overshooting, correcting, undershooting, in cycles that affect everything from interest rates to opinions about the president to expectations in the stock market. If we are serious about understanding our economic system, stabilizing it, and bringing it under some kind of control, we'll have to start by admitting its imperfections. Doing so does not necessarily throw us from the roller coaster of untrammeled free enterprise straight into the gray, unproductive prison of central planning. There's a lot of space in between – in a region that could be called informed, regulated free enterprise. [November 21, 1987]
The “growth machine” thesis The concept, summarized in The Urban Growth Machine, 77 is that “Coalitions of land-based elites, tied to the economic pos-sibilities of places, drive urban politics in their quest to expand the local economy and accumulate wealth.” 78 Central to the growth machine thesis is that
… the “rentier” class – those centering around developers, realtors, and banks who have an interest in the exchange of land and property.79 Rentiers are supported by a number of auxiliary players, including the media, universities, utilities, professional sports franchises, chambers of commerce, and the like. This is the amalgam interested in growth – diverse kinds of middle and upper income growth – that can increase the value of land and revenue streams for growth machine members. But more than simply being interested in the material consequences of growth, rentiers want to ensure that the citizenry is receptive in the first instance to changes in their surroundings. With this in mind, the growth machine toils to generate solidarity among growth-receptive interests, to create, in other words, the “community ‘we feeling’” that Molotch viewed to be so essential for uniting lo-cals around the goal of growth.
There are two values of land: “use value” and “exchange value.” Individuals and groups differ on which aspect is most cru-cial to their own lives. The main focus of the growth industry is to maximize “exchange value.” Growth increases exchange value by more intensive land use to the primary benefit of those who own or control it. The other value is “use value” for residents as a “home,” rooted in the neighborhood as lived place; this value focuses primarily on preserving quality of life. Groups interested in maximizing “exchange value” are less concerned about preserving “use value” and quality of life. Ex-ample “use values” are:80
• The daily round: The place of residence is a focal point for the wider routine in which one’s concrete daily needs are satisfied, daily needs such as shopping, schooling, child care, and routine health needs.
76 Donella Meadows, “System dynamics meets the press”, System Dynamics Review, 5, Winter 1989, pp. 69-80. She included this observa-
tion of this column: “That column, written shortly after the 1987 stock market crash, was one of the most unpopular I ever produced. Many papers did not print it. I learned a lesson from that – you can’t challenge the prevailing paradigm too directly.”
77 Jonas & Wilson, The Urban Growth Machine, Critical Perspectives Two Decades Later, 1999, pp. 5-6. 78 Andrew Jonas and David Wilson, The Urban Growth Machine, Critical Perspectives Two Decades Later, State University of New York
Press, 1999, p. 3. 79 Jonas & Wilson reference note: Logan and Molotch, Urban Fortunes, The Political Economy of Place, 1987, University of California Press,
chapter 2. 80 Logan & Molotch, Urban Fortunes, The Political Economy of Place, 1987, University of California Press, pp. 103-110.
Bob Powell, Ph.D., MBA • • Continuous Improvement Associates © 2003 • • [email protected] • • 719 599-0977 • • Rev 01/06/03 • • page 55
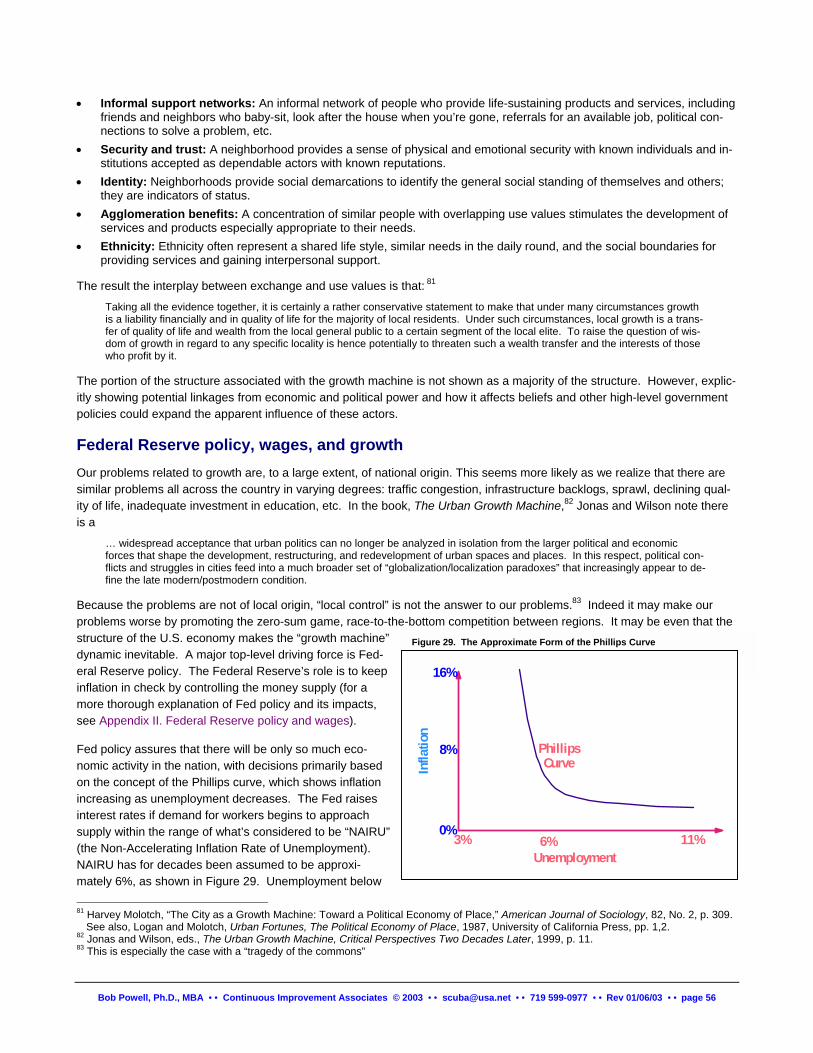
• Informal support networks: An informal network of people who provide life-sustaining products and services, including friends and neighbors who baby-sit, look after the house when you’re gone, referrals for an available job, political con-nections to solve a problem, etc.
• Security and trust: A neighborhood provides a sense of physical and emotional security with known individuals and in-stitutions accepted as dependable actors with known reputations.
• Identity: Neighborhoods provide social demarcations to identify the general social standing of themselves and others; they are indicators of status.
• Agglomeration benefits: A concentration of similar people with overlapping use values stimulates the development of services and products especially appropriate to their needs.
• Ethnicity: Ethnicity often represent a shared life style, similar needs in the daily round, and the social boundaries for providing services and gaining interpersonal support.
The result the interplay between exchange and use values is that: 81
Taking all the evidence together, it is certainly a rather conservative statement to make that under many circumstances growth is a liability financially and in quality of life for the majority of local residents. Under such circumstances, local growth is a trans-fer of quality of life and wealth from the local general public to a certain segment of the local elite. To raise the question of wis-dom of growth in regard to any specific locality is hence potentially to threaten such a wealth transfer and the interests of those who profit by it.
The portion of the structure associated with the growth machine is not shown as a majority of the structure. However, explic-itly showing potential linkages from economic and political power and how it affects beliefs and other high-level government policies could expand the apparent influence of these actors.
Federal Reserve policy, wages, and growth Our problems related to growth are, to a large extent, of national origin. This seems more likely as we realize that there are similar problems all across the country in varying degrees: traffic congestion, infrastructure backlogs, sprawl, declining qual-ity of life, inadequate investment in education, etc. In the book, The Urban Growth Machine,82 Jonas and Wilson note there is a
… widespread acceptance that urban politics can no longer be analyzed in isolation from the larger political and economic forces that shape the development, restructuring, and redevelopment of urban spaces and places. In this respect, political con-flicts and struggles in cities feed into a much broader set of “globalization/localization paradoxes” that increasingly appear to de-fine the late modern/postmodern condition.
Because the problems are not of local origin, “local control” is not the answer to our problems.83 Indeed it may make our problems worse by promoting the zero-sum game, race-to-the-bottom competition between regions. It may be even that the structure of the U.S. economy makes the “growth machine” dynamic inevitable. A major top-level driving force is Fed-eral Reserve policy. The Federal Reserve’s role is to keep inflation in check by controlling the money supply (for a more thorough explanation of Fed policy and its impacts, see Appendix II. Federal Reserve policy and wages).
Infla
tion
11%
PhillipsCurve
Unemployment
16%
6%
8%
3%0%
Figure 29. The Approximate Form of the Phillips Curve
Fed policy assures that there will be only so much eco-nomic activity in the nation, with decisions primarily based on the concept of the Phillips curve, which shows inflation increasing as unemployment decreases. The Fed raises interest rates if demand for workers begins to approach supply within the range of what’s considered to be “NAIRU” (the Non-Accelerating Inflation Rate of Unemployment). NAIRU has for decades been assumed to be approxi-mately 6%, as shown in Figure 29. Unemployment below 81 Harvey Molotch, “The City as a Growth Machine: Toward a Political Economy of Place,” American Journal of Sociology, 82, No. 2, p. 309.
See also, Logan and Molotch, Urban Fortunes, The Political Economy of Place, 1987, University of California Press, pp. 1,2. 82 Jonas and Wilson, eds., The Urban Growth Machine, Critical Perspectives Two Decades Later, 1999, p. 11. 83 This is especially the case with a “tragedy of the commons”
Bob Powell, Ph.D., MBA • • Continuous Improvement Associates © 2003 • • [email protected] • • 719 599-0977 • • Rev 01/06/03 • • page 56
this level is assumed to create a high enough demand for labor to create an inflationary spiral.
The problem is that official unemployment only counts those who are actively seeking work. “Effective” unemployment in-cludes “discouraged” & “involuntary part-time” workers (but not under-employed). In 1993 though U.S. “official” unemploy-ment was 6.4%, “effective” unemployment was 9.3%.84
But even this doesn’t take into account all unemployment. Real unemployment is largely invisible, because we are poor at counting the number of unemployed. Lester Thurow notes this is an extraordinary underestimate. He observes that if we add those who don't meet the “official test,” real unemployment is on the order of 30 percent.85
Improbable?
Not if we add those who are not considered “active in the workforce,” the part-time workers who would like full-time work, the self-employed who are really underemployed, the “missing males” existing in the census but not in labor statistics (essen-tially dropped out of the normal working economy, either homeless or in the illegal economy) and illegal immigrants. Alto-gether Thurow observes we have a “sea of unemployed workers, underemployed workers, and newcomers looking for work.”
Logan and Molotch describe the dynamic resulting from this Fed policy:86
The reality is that local growth does not make jobs: it only distributes them. In any given year the United States will see the con-struction of a certain number of new factories, office units, and highways-regardless of where they are put. Similarly, a given number of automobiles, missiles, and lamp shades will be made in this country, regardless of where they are manufactured. The number of jobs in this society, whether in the building trades or in any other economic sector, will therefore be determined by rates of return on investments, national trade policy, federal decisions affecting the money supply, and other factors unre-lated to local decision making. Except for introducing draconian measures that would replicate Third World labor conditions in U.S. cities (not as remote a possibility as we might think; see chapter 7), a locality can only compete with other localities for its share of newly created U.S. jobs. Aggregate employment is unaffected by the outcome of this competition among localities to “make” jobs. The bulk of studies that search, either through cross-sectional or longitudinal analysis, for relations between size or growth of places and unemployment rates fail to show significant relationships. But overall, even though local growth may sometimes have beneficial effects on specific individuals and subgroups, both the weight of empirical evidence and the logic of the process indicate that net benefits do not follow as a matter of course. Indeed, our conclusions reinforce what has been called the “unanimous” agreement among economists that “the only jurisdiction that should be concerned with the effects of its policies on the level of employment is the Federal government. Small jurisdictions do not have the power to effect significant changes in the level of unemployment” (Levy and Arnold, 1972:95).87 The real problem is that the United States is a society of constant joblessness, with unemployment rates conservatively esti-mated by the Department of Commerce at 4 to 11 percent of the work force defined as ordinarily active. A game of musical chairs is being played at all times, with workers circulating around the country, hoping to land in an empty position when the mu-sic stops. Redistributing the stock of jobs among places may move the chairs around, but it does not alter the number of chairs available to the players.
So Federal Reserve policy essentially creates a “game” of “musical chairs” that guarantees there are always fewer jobs (chairs) than people, a lot fewer as Lester Thurow explains.
But game theory shows how this policy – always having more people than jobs – has a much greater effect than we might initially expect. This is described in detail with a “card game” analogy in “Appendix II. Federal Reserve policy and wages,” but briefly the effect goes like this:88
The dean of a college divides a deck of cards between a professor and his class, 26 black cards to the professor and 26 red cards to each student. The dean says he will pay $100 for each red-black pair that is brought to him. In this situation the added value of any card would theoretically dictate a 50-50 split of the $100. However, because of the greater perceived bargaining power of the professor, experiments reveal that the students will accept on the order $20, because humans tend to misperceive the value they bring to the negotiation. The professor, however, can improve his position even more by altering the game; he can destroy a few (say 3) of his black cards. This lowers the value of the game from $2600 to $2300, but increases the profes-sor’s bargaining power. It does because the added value of any one student’s card is zero, $0. The professor can say to any one student, “Here’s $10, take it or leave it,” and even be generous doing that, because he can add, “If you don’t take it, that’s OK; three of you are going to get nothing.” Therefore the students take the $10. This allows him to get on the order of 90% of the $2300.
84 Amex Bank Review analysis using BLS data and referenced in The Economist, 2/5/94, p. 25 85 Lester Thurow, “The Crusade That’s Killing Prosperity,” The American Prospect, March-April 1996, pp. 54-59. 86 Logan and Molotch, Urban Fortunes, The Political Economy of Place, 1987. p. 89 – 90. 87 Logan and Molotch add in a footnote: “Further, new industrial investment in one city often eliminates jobs at another city, with no net gain.
This process is detailed in chapter 7.” 88 Described by Brandenburger & Nalebuff, Co-opetition, 1996, pp. 41-47
Bob Powell, Ph.D., MBA • • Continuous Improvement Associates © 2003 • • [email protected] • • 719 599-0977 • • Rev 01/06/03 • • page 57
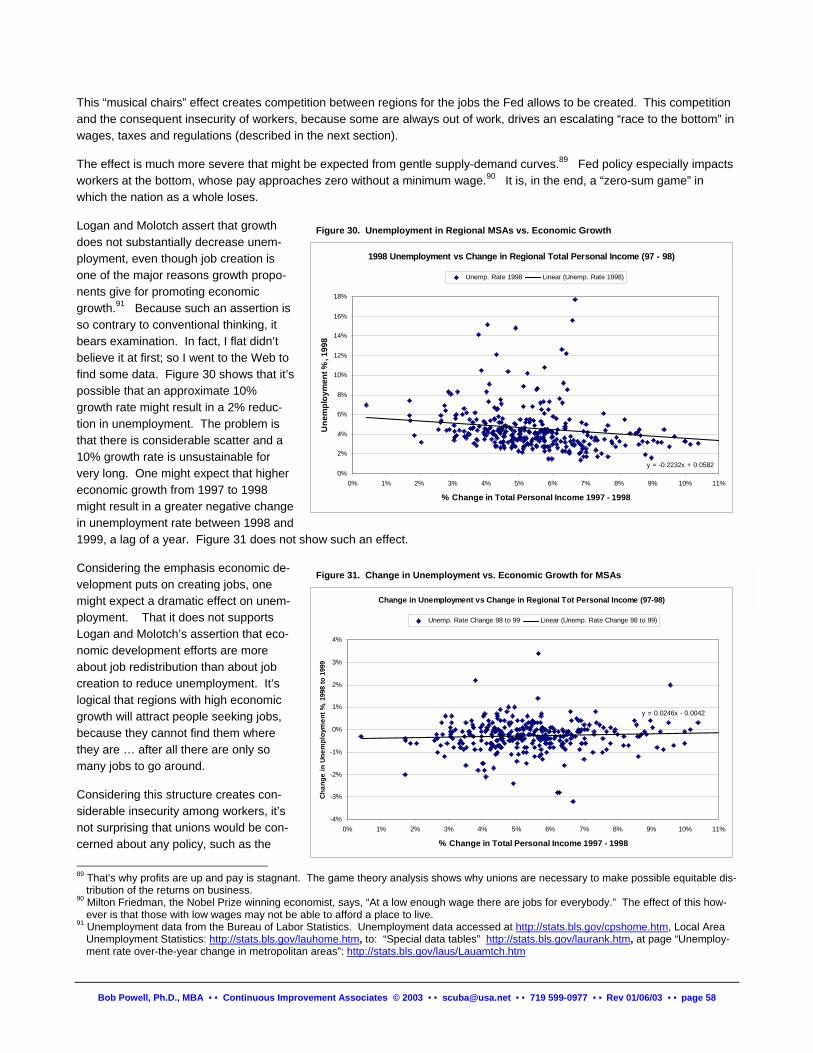
This “musical chairs” effect creates competition between regions for the jobs the Fed allows to be created. This competition and the consequent insecurity of workers, because some are always out of work, drives an escalating “race to the bottom” in wages, taxes and regulations (described in the next section).
The effect is much more severe that might be expected from gentle supply-demand curves.89 Fed policy especially impacts workers at the bottom, whose pay approaches zero without a minimum wage.90 It is, in the end, a “zero-sum game” in which the nation as a whole loses.
Logan and Molotch assert that growth does not substantially decrease unem-ployment, even though job creation is one of the major reasons growth propo-nents give for promoting economic growth.91 Because such an assertion is so contrary to conventional thinking, it bears examination. In fact, I flat didn’t believe it at first; so I went to the Web to find some data. Figure 30 shows that it’s possible that an approximate 10% growth rate might result in a 2% reduc-tion in unemployment. The problem is that there is considerable scatter and a 10% growth rate is unsustainable for very long. One might expect that higher economic growth from 1997 to 1998 might result in a greater negative change in unemployment rate between 1998 and 1999, a lag of a year. Figure 31 does not show such an effect.
1998 Unemployment vs Change in Regional Total Personal Income (97 - 98)
y = -0.2232x + 0.05820%
2%
4%
6%
8%
10%
12%
14%
16%
18%
0% 1% 2% 3% 4% 5% 6% 7% 8% 9% 10% 11%
% Change in Total Personal Income 1997 - 1998
Une
mpl
oym
ent %
, 199
8
Unemp. Rate 1998 Linear (Unemp. Rate 1998)
Figure 30. Unemployment in Regional MSAs vs. Economic Growth
Considering the emphasis economic de-velopment puts on creating jobs, one might expect a dramatic effect on unem-ployment. That it does not supports Logan and Molotch’s assertion that eco-nomic development efforts are more about job redistribution than about job creation to reduce unemployment. It’s logical that regions with high economic growth will attract people seeking jobs, because they cannot find them where they are … after all there are only so many jobs to go around.
Change in Unemployment vs Change in Regional Tot Personal Income (97-98)
y = 0.0246x - 0.0042
-4%
-3%
-2%
-1%
0%
1%
2%
3%
4%
0% 1% 2% 3% 4% 5% 6% 7% 8% 9% 10% 11%
% Change in Total Personal Income 1997 - 1998
Chan
ge in
Une
mpl
oym
ent %
, 199
8 to
199
9
Unemp. Rate Change 98 to 99 Linear (Unemp. Rate Change 98 to 99)
Figure 31. Change in Unemployment vs. Economic Growth for MSAs
Considering this structure creates con-siderable insecurity among workers, it’s not surprising that unions would be con-cerned about any policy, such as the
89 That's why profits are up and pay is stagnant. The game theory analysis shows why unions are necessary to make possible equitable dis-
tribution of the returns on business. 90 Milton Friedman, the Nobel Prize winning economist, says, “At a low enough wage there are jobs for everybody.” The effect of this how-
ever is that those with low wages may not be able to afford a place to live. 91 Unemployment data from the Bureau of Labor Statistics. Unemployment data accessed at http://stats.bls.gov/cpshome.htm, Local Area
Unemployment Statistics: http://stats.bls.gov/lauhome.htm, to: “Special data tables” http://stats.bls.gov/laurank.htm, at page “Unemploy-ment rate over-the-year change in metropolitan areas”: http://stats.bls.gov/laus/Lauamtch.htm
Bob Powell, Ph.D., MBA • • Continuous Improvement Associates © 2003 • • [email protected] • • 719 599-0977 • • Rev 01/06/03 • • page 58
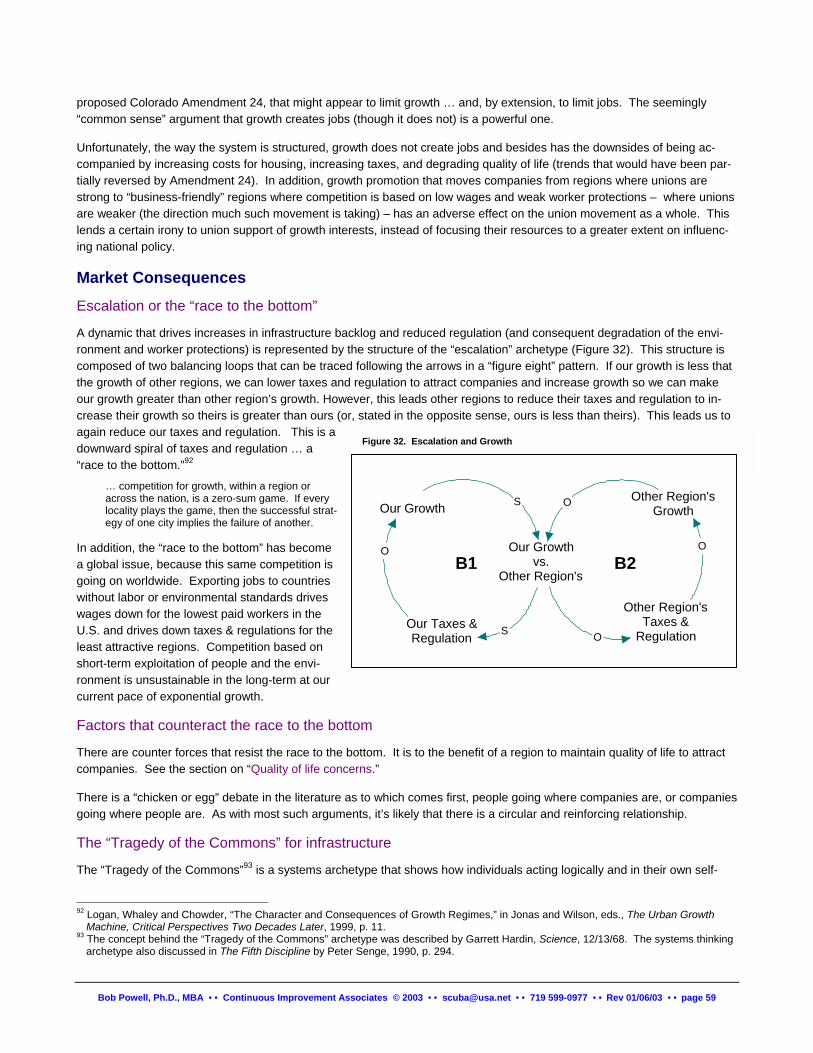
proposed Colorado Amendment 24, that might appear to limit growth … and, by extension, to limit jobs. The seemingly “common sense” argument that growth creates jobs (though it does not) is a powerful one.
Unfortunately, the way the system is structured, growth does not create jobs and besides has the downsides of being ac-companied by increasing costs for housing, increasing taxes, and degrading quality of life (trends that would have been par-tially reversed by Amendment 24). In addition, growth promotion that moves companies from regions where unions are strong to “business-friendly” regions where competition is based on low wages and weak worker protections – where unions are weaker (the direction much such movement is taking) – has an adverse effect on the union movement as a whole. This lends a certain irony to union support of growth interests, instead of focusing their resources to a greater extent on influenc-ing national policy.
Market Consequences Escalation or the “race to the bottom”
A dynamic that drives increases in infrastructure backlog and reduced regulation (and consequent degradation of the envi-ronment and worker protections) is represented by the structure of the “escalation” archetype (Figure 32). This structure is composed of two balancing loops that can be traced following the arrows in a “figure eight” pattern. If our growth is less that the growth of other regions, we can lower taxes and regulation to attract companies and increase growth so we can make our growth greater than other region’s growth. However, this leads other regions to reduce their taxes and regulation to in-crease their growth so theirs is greater than ours (or, stated in the opposite sense, ours is less than theirs). This leads us to again reduce our taxes and regulation. This is a downward spiral of taxes and regulation … a “race to the bottom.”92
Our Growth vs.
Other Region's
OB1
S Our Taxes & Regulation
Our Growth S O
O
B2O
Other Region's Taxes & Regulation
Other Region's Growth
Figure 32. Escalation and Growth
… competition for growth, within a region or across the nation, is a zero-sum game. If every locality plays the game, then the successful strat-egy of one city implies the failure of another.
In addition, the “race to the bottom” has become a global issue, because this same competition is going on worldwide. Exporting jobs to countries without labor or environmental standards drives wages down for the lowest paid workers in the U.S. and drives down taxes & regulations for the least attractive regions. Competition based on short-term exploitation of people and the envi-ronment is unsustainable in the long-term at our current pace of exponential growth.
Factors that counteract the race to the bottom
There are counter forces that resist the race to the bottom. It is to the benefit of a region to maintain quality of life to attract companies. See the section on “Quality of life concerns.”
There is a “chicken or egg” debate in the literature as to which comes first, people going where companies are, or companies going where people are. As with most such arguments, it’s likely that there is a circular and reinforcing relationship.
The “Tragedy of the Commons” for infrastructure
The “Tragedy of the Commons”93 is a systems archetype that shows how individuals acting logically and in their own self-
92 Logan, Whaley and Chowder, “The Character and Consequences of Growth Regimes,” in Jonas and Wilson, eds., The Urban Growth
Machine, Critical Perspectives Two Decades Later, 1999, p. 11. 93 The concept behind the “Tragedy of the Commons” archetype was described by Garrett Hardin, Science, 12/13/68. The systems thinking
archetype also discussed in The Fifth Discipline by Peter Senge, 1990, p. 294.
Bob Powell, Ph.D., MBA • • Continuous Improvement Associates © 2003 • • [email protected] • • 719 599-0977 • • Rev 01/06/03 • • page 59

interest can lead to impairment of the ability to utilize a common resource.94 This structure is implicit in the “Fixes that Fail” structures discussed in the sections on “A model on road building to relieve traffic congestion” and “
94 Or even to destruction of the common resource, e.g., fishing stock in the ocean.
Bob Powell, Ph.D., MBA • • Continuous Improvement Associates © 2003 • • [email protected] • • 719 599-0977 • • Rev 01/06/03 • • page 60
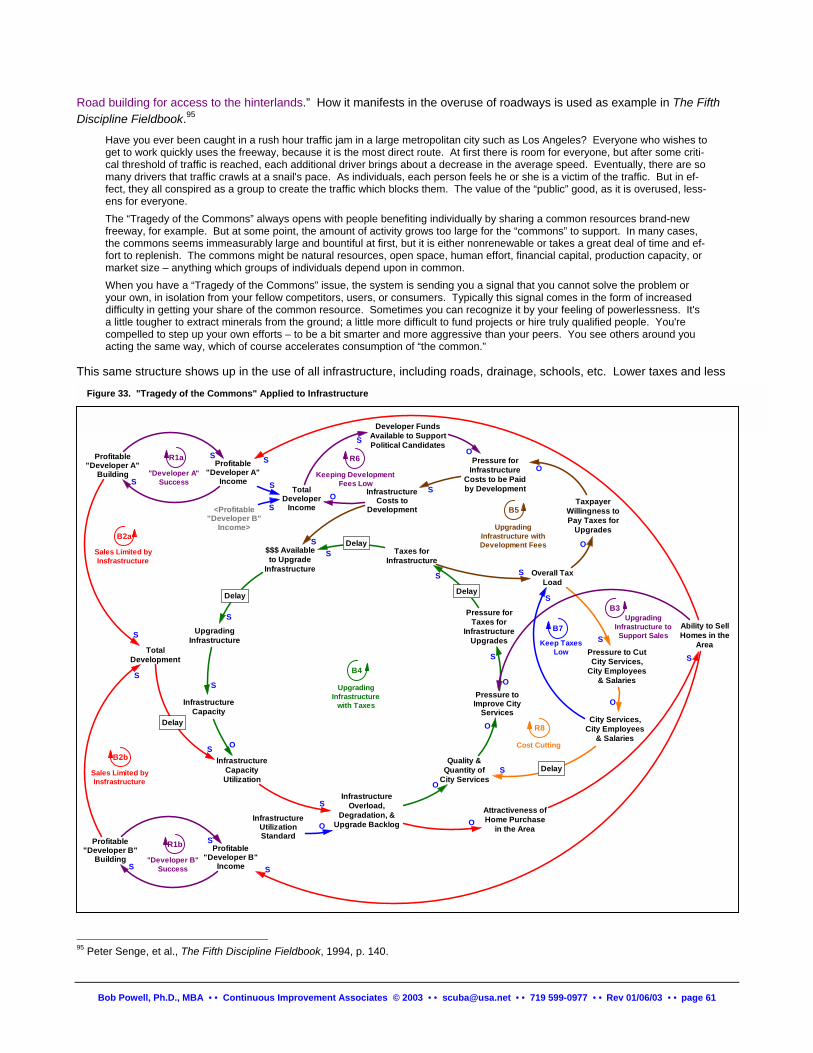
Road building for access to the hinterlands.” How it manifests in the overuse of roadways is used as example in The Fifth Discipline Fieldbook.95
Have you ever been caught in a rush hour traffic jam in a large metropolitan city such as Los Angeles? Everyone who wishes to get to work quickly uses the freeway, because it is the most direct route. At first there is room for everyone, but after some criti-cal threshold of traffic is reached, each additional driver brings about a decrease in the average speed. Eventually, there are so many drivers that traffic crawls at a snail's pace. As individuals, each person feels he or she is a victim of the traffic. But in ef-fect, they all conspired as a group to create the traffic which blocks them. The value of the “public” good, as it is overused, less-ens for everyone. The “Tragedy of the Commons” always opens with people benefiting individually by sharing a common resources brand-new freeway, for example. But at some point, the amount of activity grows too large for the “commons” to support. In many cases, the commons seems immeasurably large and bountiful at first, but it is either nonrenewable or takes a great deal of time and ef-fort to replenish. The commons might be natural resources, open space, human effort, financial capital, production capacity, or market size – anything which groups of individuals depend upon in common. When you have a “Tragedy of the Commons” issue, the system is sending you a signal that you cannot solve the problem or your own, in isolation from your fellow competitors, users, or consumers. Typically this signal comes in the form of increased difficulty in getting your share of the common resource. Sometimes you can recognize it by your feeling of powerlessness. It's a little tougher to extract minerals from the ground; a little more difficult to fund projects or hire truly qualified people. You're compelled to step up your own efforts – to be a bit smarter and more aggressive than your peers. You see others around you acting the same way, which of course accelerates consumption of “the common.”
This same structure shows up in the use of all infrastructure, including roads, drainage, schools, etc. Lower taxes and less
S
S
O
S
S
InfrastructureCosts to
Development
S
Delay
Delay
B4
UpgradingInfrastructure
with Taxes
B3Upgrading
Infrastructure toSupport Sales
R6
Keeping DevelopmentFees Low
R8
Cost Cutting
R1a
"Developer A"Success
Delay
TotalDevelopment
InfrastructureCapacityUtilization
InfrastructureOverload,
Degradation, &Upgrade Backlog
Quality &Quantity of
City Services
Pressure toImprove City
Services
TaxpayerWillingness toPay Taxes for
Upgrades
Taxes forInfrastructure
$$$ Availableto Upgrade
Infrastructure
UpgradingInfrastructure
InfrastructureCapacity
Pressure forTaxes for
InfrastructureUpgrades
Overall TaxLoad
Ability to SellHomes in the
Area
TotalDeveloper
Income
Profitable"Developer A"
BuildingProfitable
"Developer A"IncomeS
S
B7
Keep TaxesLow
Profitable"Developer B"
BuildingProfitable
"Developer B"IncomeS
S
S
S
O
S
O
S
S
S
O
S
SO
Pressure forInfrastructure
Costs to be Paidby Development
Pressure to CutCity Services,
City Employees& Salaries
S
InfrastructureUtilizationStandard
O
S
S
S
<Profitable"Developer B"
Income>
S
Developer FundsAvailable to SupportPolitical Candidates
O
S
O
Attractiveness ofHome Purchase
in the AreaO
S
O
O
Delay
Delay
City Services,City Employees
& Salaries
R1b
"Developer B"Success
S
Figure 33. "Tragedy of the Commons" Applied to Infrastructure
B5
UpgradingInfrastructure withDevelopment Fees
B2a
Sales Limited byInsfrastructure
B2b
Sales Limited byInsfrastructure
Bob Powell, Ph.D., MBA • • Continuous Improvement Associates © 2003 • • [email protected] • • 719 599-0977 • • Rev 01/06/03 • • page 61
95 Peter Senge, et al., The Fifth Discipline Fieldbook, 1994, p. 140.
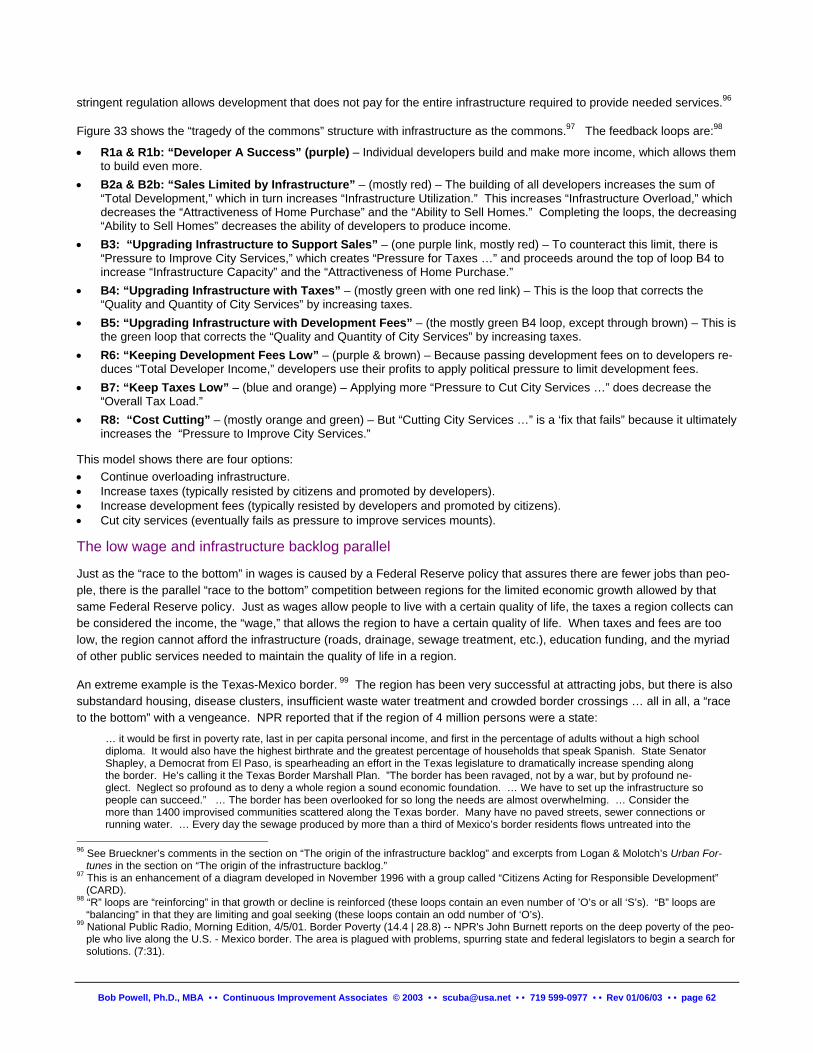
stringent regulation allows development that does not pay for the entire infrastructure required to provide needed services.96
Figure 33 shows the “tragedy of the commons” structure with infrastructure as the commons.97 The feedback loops are:98
• R1a & R1b: “Developer A Success” (purple) – Individual developers build and make more income, which allows them to build even more.
• B2a & B2b: “Sales Limited by Infrastructure” – (mostly red) – The building of all developers increases the sum of “Total Development,” which in turn increases “Infrastructure Utilization.” This increases “Infrastructure Overload,” which decreases the “Attractiveness of Home Purchase” and the “Ability to Sell Homes.” Completing the loops, the decreasing “Ability to Sell Homes” decreases the ability of developers to produce income.
• B3: “Upgrading Infrastructure to Support Sales” – (one purple link, mostly red) – To counteract this limit, there is “Pressure to Improve City Services,” which creates “Pressure for Taxes …” and proceeds around the top of loop B4 to increase “Infrastructure Capacity” and the “Attractiveness of Home Purchase.”
• B4: “Upgrading Infrastructure with Taxes” – (mostly green with one red link) – This is the loop that corrects the “Quality and Quantity of City Services” by increasing taxes.
• B5: “Upgrading Infrastructure with Development Fees” – (the mostly green B4 loop, except through brown) – This is the green loop that corrects the “Quality and Quantity of City Services” by increasing taxes.
• R6: “Keeping Development Fees Low” – (purple & brown) – Because passing development fees on to developers re-duces “Total Developer Income,” developers use their profits to apply political pressure to limit development fees.
• B7: “Keep Taxes Low” – (blue and orange) – Applying more “Pressure to Cut City Services …” does decrease the “Overall Tax Load.”
• R8: “Cost Cutting” – (mostly orange and green) – But “Cutting City Services …” is a ‘fix that fails” because it ultimately increases the “Pressure to Improve City Services.”
This model shows there are four options: • Continue overloading infrastructure. • Increase taxes (typically resisted by citizens and promoted by developers). • Increase development fees (typically resisted by developers and promoted by citizens). • Cut city services (eventually fails as pressure to improve services mounts).
The low wage and infrastructure backlog parallel
Just as the “race to the bottom” in wages is caused by a Federal Reserve policy that assures there are fewer jobs than peo-ple, there is the parallel “race to the bottom” competition between regions for the limited economic growth allowed by that same Federal Reserve policy. Just as wages allow people to live with a certain quality of life, the taxes a region collects can be considered the income, the “wage,” that allows the region to have a certain quality of life. When taxes and fees are too low, the region cannot afford the infrastructure (roads, drainage, sewage treatment, etc.), education funding, and the myriad of other public services needed to maintain the quality of life in a region.
An extreme example is the Texas-Mexico border. 99 The region has been very successful at attracting jobs, but there is also substandard housing, disease clusters, insufficient waste water treatment and crowded border crossings … all in all, a “race to the bottom” with a vengeance. NPR reported that if the region of 4 million persons were a state:
… it would be first in poverty rate, last in per capita personal income, and first in the percentage of adults without a high school diploma. It would also have the highest birthrate and the greatest percentage of households that speak Spanish. State Senator Shapley, a Democrat from El Paso, is spearheading an effort in the Texas legislature to dramatically increase spending along the border. He’s calling it the Texas Border Marshall Plan. ”The border has been ravaged, not by a war, but by profound ne-glect. Neglect so profound as to deny a whole region a sound economic foundation. … We have to set up the infrastructure so people can succeed.” … The border has been overlooked for so long the needs are almost overwhelming. … Consider the more than 1400 improvised communities scattered along the Texas border. Many have no paved streets, sewer connections or running water. … Every day the sewage produced by more than a third of Mexico’s border residents flows untreated into the
96 See Brueckner’s comments in the section on “The origin of the infrastructure backlog” and excerpts from Logan & Molotch’s Urban For-
tunes in the section on “The origin of the infrastructure backlog.” 97 This is an enhancement of a diagram developed in November 1996 with a group called “Citizens Acting for Responsible Development”
(CARD). 98 “R” loops are “reinforcing” in that growth or decline is reinforced (these loops contain an even number of ’O’s or all ‘S’s). “B” loops are
“balancing” in that they are limiting and goal seeking (these loops contain an odd number of ‘O’s). 99 National Public Radio, Morning Edition, 4/5/01. Border Poverty (14.4 | 28.8) -- NPR's John Burnett reports on the deep poverty of the peo-
ple who live along the U.S. - Mexico border. The area is plagued with problems, spurring state and federal legislators to begin a search for solutions. (7:31).
Bob Powell, Ph.D., MBA • • Continuous Improvement Associates © 2003 • • [email protected] • • 719 599-0977 • • Rev 01/06/03 • • page 62
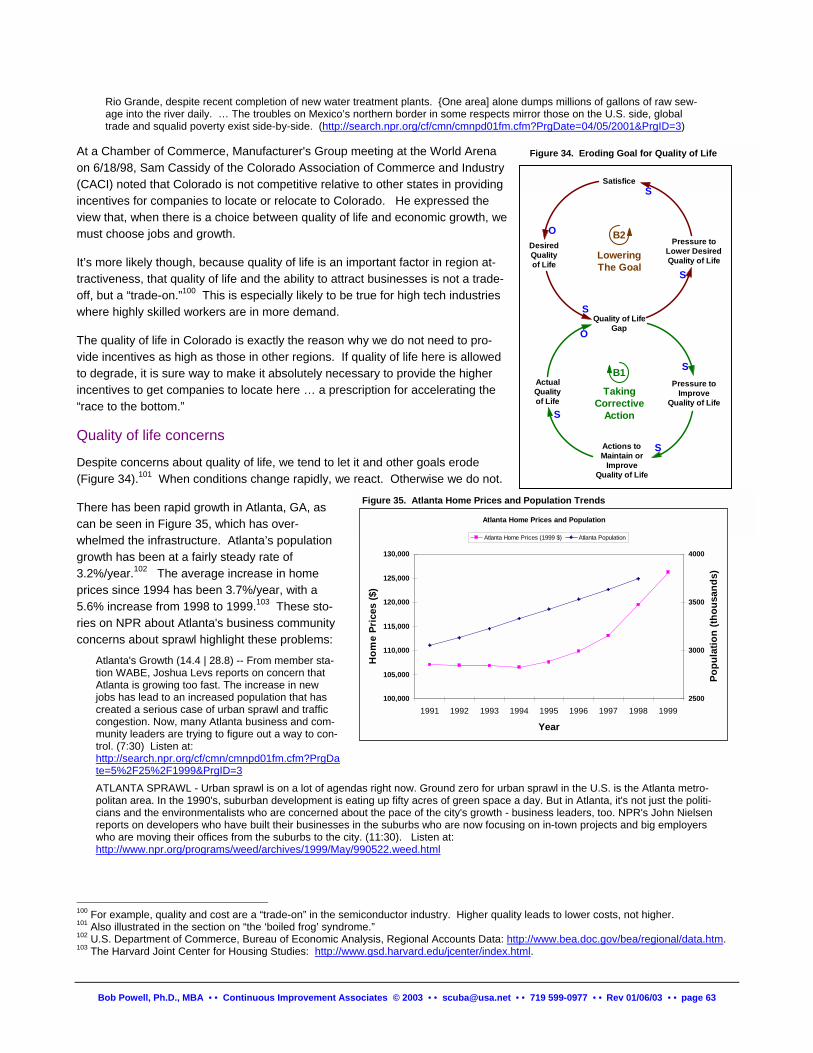
Rio Grande, despite recent completion of new water treatment plants. {One area] alone dumps millions of gallons of raw sew-age into the river daily. … The troubles on Mexico’s northern border in some respects mirror those on the U.S. side, global trade and squalid poverty exist side-by-side. (http://search.npr.org/cf/cmn/cmnpd01fm.cfm?PrgDate=04/05/2001&PrgID=3)
At a Chamber of Commerce, Manufacturer's Group meeting at the World Arena on 6/18/98, Sam Cassidy of the Colorado Association of Commerce and Industry (CACI) noted that Colorado is not competitive relative to other states in providing incentives for companies to locate or relocate to Colorado. He expressed the view that, when there is a choice between quality of life and economic growth, we must choose jobs and growth.
Figure 34. Eroding Goal for Quality of Life
DesiredQualityof Life
ActualQualityof Life
Quality of LifeGap
Pressure toImprove
Quality of Life
Pressure toLower DesiredQuality of Life
Actions toMaintain or
ImproveQuality of Life
Satisfice
S
S
O
S
O
S
S
S
B1
TakingCorrective
Action
B2
LoweringThe GoalIt’s more likely though, because quality of life is an important factor in region at-
tractiveness, that quality of life and the ability to attract businesses is not a trade-off, but a “trade-on.”100 This is especially likely to be true for high tech industries where highly skilled workers are in more demand.
The quality of life in Colorado is exactly the reason why we do not need to pro-vide incentives as high as those in other regions. If quality of life here is allowed to degrade, it is sure way to make it absolutely necessary to provide the higher incentives to get companies to locate here … a prescription for accelerating the “race to the bottom.”
Quality of life concerns
Despite concerns about quality of life, we tend to let it and other goals erode (Figure 34).101 When conditions change rapidly, we react. Otherwise we do not.
Atlanta Home Prices and Population
100,000
105,000
110,000
115,000
120,000
125,000
130,000
1991 1992 1993 1994 1995 1996 1997 1998 1999
Year
Hom
e Pr
ices
($)
2500
3000
3500
4000
Popu
latio
n (th
ousa
nds)
Atlanta Home Prices (1999 $) Atlanta Population
Figure 35. Atlanta Home Prices and Population Trends There has been rapid growth in Atlanta, GA, as can be seen in Figure 35, which has over-whelmed the infrastructure. Atlanta’s population growth has been at a fairly steady rate of 3.2%/year.102 The average increase in home prices since 1994 has been 3.7%/year, with a 5.6% increase from 1998 to 1999.103 These sto-ries on NPR about Atlanta's business community concerns about sprawl highlight these problems:
Atlanta's Growth (14.4 | 28.8) -- From member sta-tion WABE, Joshua Levs reports on concern that Atlanta is growing too fast. The increase in new jobs has lead to an increased population that has created a serious case of urban sprawl and traffic congestion. Now, many Atlanta business and com-munity leaders are trying to figure out a way to con-trol. (7:30) Listen at: http://search.npr.org/cf/cmn/cmnpd01fm.cfm?PrgDate=5%2F25%2F1999&PrgID=3 ATLANTA SPRAWL - Urban sprawl is on a lot of agendas right now. Ground zero for urban sprawl in the U.S. is the Atlanta metro-politan area. In the 1990's, suburban development is eating up fifty acres of green space a day. But in Atlanta, it's not just the politi-cians and the environmentalists who are concerned about the pace of the city's growth - business leaders, too. NPR's John Nielsen reports on developers who have built their businesses in the suburbs who are now focusing on in-town projects and big employers who are moving their offices from the suburbs to the city. (11:30). Listen at: http://www.npr.org/programs/weed/archives/1999/May/990522.weed.html
100 For example, quality and cost are a “trade-on” in the semiconductor industry. Higher quality leads to lower costs, not higher. 101 Also illustrated in the section on “the ‘boiled frog’ syndrome.” 102 U.S. Department of Commerce, Bureau of Economic Analysis, Regional Accounts Data: http://www.bea.doc.gov/bea/regional/data.htm. 103 The Harvard Joint Center for Housing Studies: http://www.gsd.harvard.edu/jcenter/index.html.
Bob Powell, Ph.D., MBA • • Continuous Improvement Associates © 2003 • • [email protected] • • 719 599-0977 • • Rev 01/06/03 • • page 63
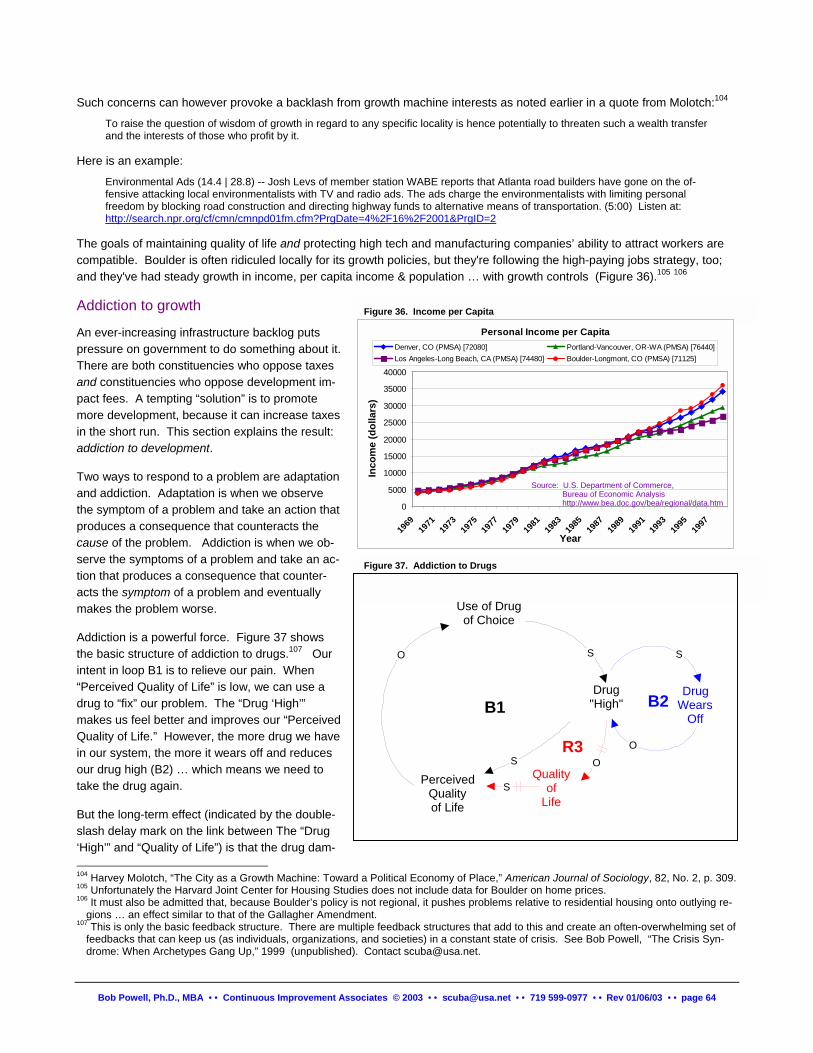
Such concerns can however provoke a backlash from growth machine interests as noted earlier in a quote from Molotch:104
To raise the question of wisdom of growth in regard to any specific locality is hence potentially to threaten such a wealth transfer and the interests of those who profit by it.
Here is an example:
Environmental Ads (14.4 | 28.8) -- Josh Levs of member station WABE reports that Atlanta road builders have gone on the of-fensive attacking local environmentalists with TV and radio ads. The ads charge the environmentalists with limiting personal freedom by blocking road construction and directing highway funds to alternative means of transportation. (5:00) Listen at: http://search.npr.org/cf/cmn/cmnpd01fm.cfm?PrgDate=4%2F16%2F2001&PrgID=2
The goals of maintaining quality of life and protecting high tech and manufacturing companies’ ability to attract workers are compatible. Boulder is often ridiculed locally for its growth policies, but they're following the high-paying jobs strategy, too; and they've had steady growth in income, per capita income & population … with growth controls (Figure 36).105 106
Addiction to growth a
An ever-increasing infrastructure backlog puts pressure on government to do something about it. There are both constituencies who oppose taxes and constituencies who oppose development im-pact fees. A tempting “solution” is to promote more development, because it can increase taxes in the short run. This section explains the result: addiction to development.
Two ways to respond to a problem are adaptation and addiction. Adaptation is when we observe the symptom of a problem and take an action that produces a consequence that counteracts the cause of the problem. Addiction is when we ob-serve the symptoms of a problem and take an ac-tion that produces a consequence that counter-acts the symptom of a problem and eventually makes the problem worse.
Addiction is a powerful force. Figure 37 shows the basic structure of addiction to drugs.107 Our intent in loop B1 is to relieve our pain. When “Perceived Quality of Life” is low, we can use a drug to “fix” our problem. The “Drug ‘High’” makes us feel better and improves our “Perceived Quality of Life.” However, the more drug we have in our system, the more it wears off and reduces our drug high (B2) … which means we need to take the drug again.
But the long-term effect (indicated by the double-slash delay mark on the link between The “Drug ‘High’” and “Quality of Life”) is that the drug dam- 104 Harvey Molotch, “The City as a Growth Machine: Toward105 Unfortunately the Harvard Joint Center for Housing Studi106 It must also be admitted that, because Boulder’s policy is
gions … an effect similar to that of the Gallagher Amendm107 This is only the basic feedback structure. There are mult
feedbacks that can keep us (as individuals, organizationsdrome: When Archetypes Gang Up,” 1999 (unpublished)
Bob Powell, Ph.D., MBA • • Continuous Improvement Ass
Figure 36. Income per Capit
Personal Income per Capita
0
5000
10000
15000
20000
25000
30000
35000
40000
1969
1971
1973
1975
1977
1979
1981
1983
1985
1987
1989
1991
1993
1995
1997
Year
Inco
me
(dol
lars
)
Denver, CO (PMSA) [72080] Portland-Vancouver, OR-WA (PMSA) [76440]Los Angeles-Long Beach, CA (PMSA) [74480] Boulder-Longmont, CO (PMSA) [71125]
Source: U.S. Department of Commerce, Bureau of Economic Analysis http://www.bea.doc.gov/bea/regional/data.htm
B1Drug
"High"
Use of Drugof Choice
PerceivedQualityof Life
O S
S
DrugWears
Off
S
O
B2
O
S
Figure 37. Addiction to Drugs
Qualityof
Life
R3
a Political Economy of Place,” American Journal of Sociology, 82, No. 2, p. 309. es does not include data for Boulder on home prices. not regional, it pushes problems relative to residential housing onto outlying re-ent. iple feedback structures that add to this and create an often-overwhelming set of , and societies) in a constant state of crisis. See Bob Powell, “The Crisis Syn-. Contact [email protected].
ociates © 2003 • • [email protected] • • 719 599-0977 • • Rev 01/06/03 • • page 64
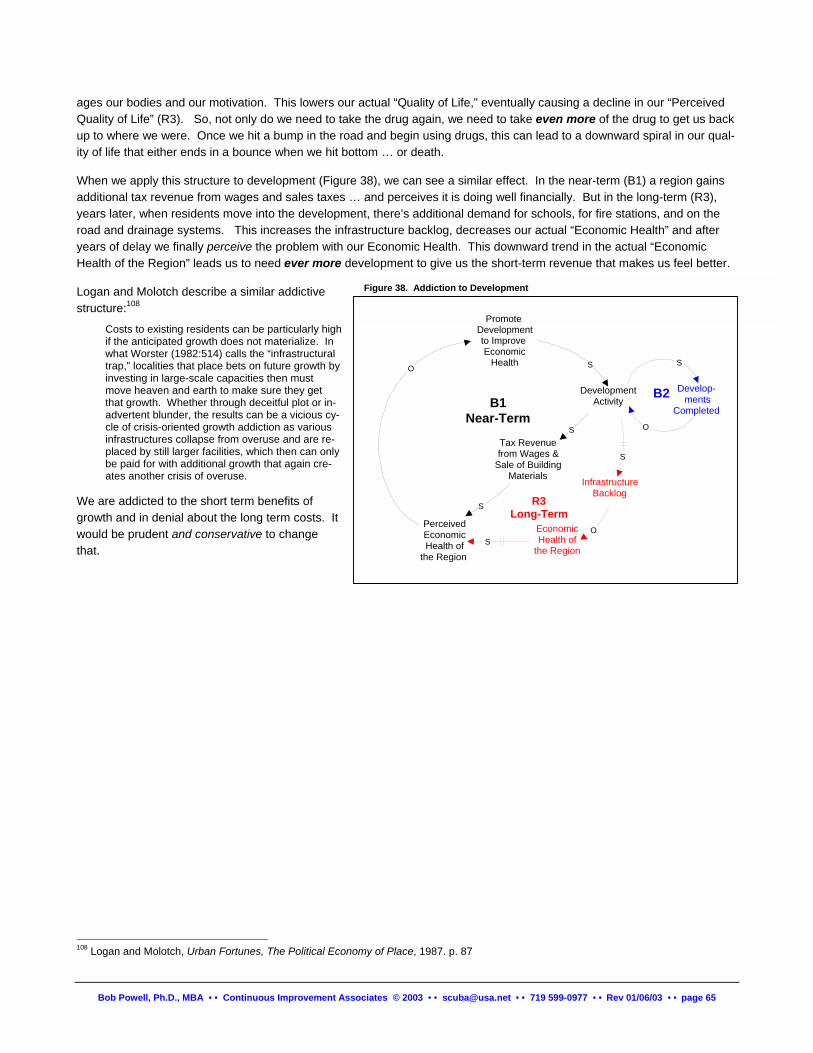
ages our bodies and our motivation. This lowers our actual “Quality of Life,” eventually causing a decline in our “Perceived Quality of Life” (R3). So, not only do we need to take the drug again, we need to take even more of the drug to get us back up to where we were. Once we hit a bump in the road and begin using drugs, this can lead to a downward spiral in our qual-ity of life that either ends in a bounce when we hit bottom … or death.
When we apply this structure to development (Figure 38), we can see a similar effect. In the near-term (B1) a region gains additional tax revenue from wages and sales taxes … and perceives it is doing well financially. But in the long-term (R3), years later, when residents move into the development, there’s additional demand for schools, for fire stations, and on the road and drainage systems. This increases the infrastructure backlog, decreases our actual “Economic Health” and after years of delay we finally perceive the problem with our Economic Health. This downward trend in the actual “Economic Health of the Region” leads us to need ever more development to give us the short-term revenue that makes us feel better.
Promote Development
to Improve Economic
HealthO
Development Activity
S
S Tax Revenue from Wages &
Sale of Building Materials
B1 Near-Term
S
Develop- ments
Completed
S
O
B2
S
S
Perceived EconomicHealth of
the Region
O
Figure 38. Addiction to Development Logan and Molotch describe a similar addictive structure:108
Costs to existing residents can be particularly high if the anticipated growth does not materialize. In what Worster (1982:514) calls the “infrastructural trap,” localities that place bets on future growth by investing in large-scale capacities then must move heaven and earth to make sure they get that growth. Whether through deceitful plot or in-advertent blunder, the results can be a vicious cy-cle of crisis-oriented growth addiction as various infrastructures collapse from overuse and are re-placed by still larger facilities, which then can only be paid for with additional growth that again cre-ates another crisis of overuse. Infrastructure
BacklogR3
Long-TermEconomicHealth of
the Region
We are addicted to the short term benefits of growth and in denial about the long term costs. It would be prudent and conservative to change that.
Bob Powell, Ph.D., MBA • • Continuous Improvement Associates © 2003 • • [email protected] • • 719 599-0977 • • Rev 01/06/03 • • page 65
108 Logan and Molotch, Urban Fortunes, The Political Economy of Place, 1987. p. 87
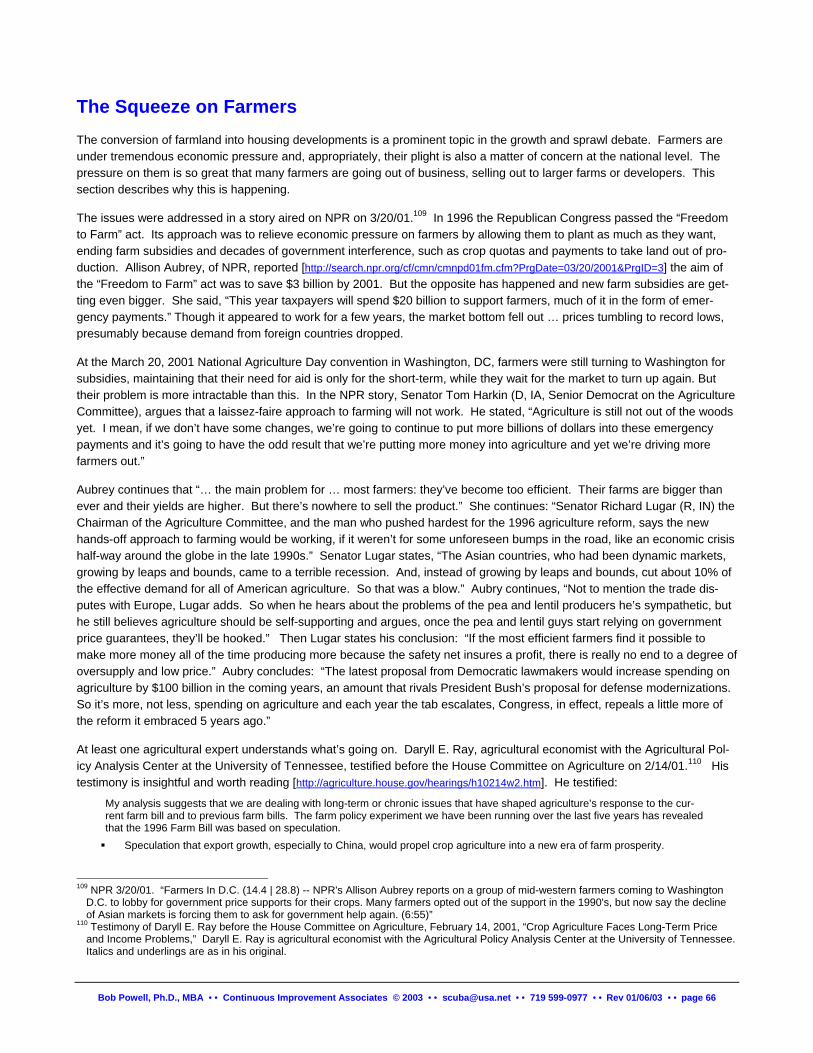
The Squeeze on Farmers The conversion of farmland into housing developments is a prominent topic in the growth and sprawl debate. Farmers are under tremendous economic pressure and, appropriately, their plight is also a matter of concern at the national level. The pressure on them is so great that many farmers are going out of business, selling out to larger farms or developers. This section describes why this is happening.
The issues were addressed in a story aired on NPR on 3/20/01.109 In 1996 the Republican Congress passed the “Freedom to Farm” act. Its approach was to relieve economic pressure on farmers by allowing them to plant as much as they want, ending farm subsidies and decades of government interference, such as crop quotas and payments to take land out of pro-duction. Allison Aubrey, of NPR, reported [http://search.npr.org/cf/cmn/cmnpd01fm.cfm?PrgDate=03/20/2001&PrgID=3] the aim of the “Freedom to Farm” act was to save $3 billion by 2001. But the opposite has happened and new farm subsidies are get-ting even bigger. She said, “This year taxpayers will spend $20 billion to support farmers, much of it in the form of emer-gency payments.” Though it appeared to work for a few years, the market bottom fell out … prices tumbling to record lows, presumably because demand from foreign countries dropped.
At the March 20, 2001 National Agriculture Day convention in Washington, DC, farmers were still turning to Washington for subsidies, maintaining that their need for aid is only for the short-term, while they wait for the market to turn up again. But their problem is more intractable than this. In the NPR story, Senator Tom Harkin (D, IA, Senior Democrat on the Agriculture Committee), argues that a laissez-faire approach to farming will not work. He stated, “Agriculture is still not out of the woods yet. I mean, if we don’t have some changes, we’re going to continue to put more billions of dollars into these emergency payments and it’s going to have the odd result that we’re putting more money into agriculture and yet we’re driving more farmers out.”
Aubrey continues that “… the main problem for … most farmers: they’ve become too efficient. Their farms are bigger than ever and their yields are higher. But there’s nowhere to sell the product.” She continues: “Senator Richard Lugar (R, IN) the Chairman of the Agriculture Committee, and the man who pushed hardest for the 1996 agriculture reform, says the new hands-off approach to farming would be working, if it weren’t for some unforeseen bumps in the road, like an economic crisis half-way around the globe in the late 1990s.” Senator Lugar states, “The Asian countries, who had been dynamic markets, growing by leaps and bounds, came to a terrible recession. And, instead of growing by leaps and bounds, cut about 10% of the effective demand for all of American agriculture. So that was a blow.” Aubry continues, “Not to mention the trade dis-putes with Europe, Lugar adds. So when he hears about the problems of the pea and lentil producers he’s sympathetic, but he still believes agriculture should be self-supporting and argues, once the pea and lentil guys start relying on government price guarantees, they’ll be hooked.” Then Lugar states his conclusion: “If the most efficient farmers find it possible to make more money all of the time producing more because the safety net insures a profit, there is really no end to a degree of oversupply and low price.” Aubry concludes: “The latest proposal from Democratic lawmakers would increase spending on agriculture by $100 billion in the coming years, an amount that rivals President Bush’s proposal for defense modernizations. So it’s more, not less, spending on agriculture and each year the tab escalates, Congress, in effect, repeals a little more of the reform it embraced 5 years ago.”
At least one agricultural expert understands what’s going on. Daryll E. Ray, agricultural economist with the Agricultural Pol-icy Analysis Center at the University of Tennessee, testified before the House Committee on Agriculture on 2/14/01.110 His testimony is insightful and worth reading [http://agriculture.house.gov/hearings/h10214w2.htm]. He testified:
My analysis suggests that we are dealing with long-term or chronic issues that have shaped agriculture’s response to the cur-rent farm bill and to previous farm bills. The farm policy experiment we have been running over the last five years has revealed that the 1996 Farm Bill was based on speculation. ! Speculation that export growth, especially to China, would propel crop agriculture into a new era of farm prosperity.
109 NPR 3/20/01. “Farmers In D.C. (14.4 | 28.8) -- NPR's Allison Aubrey reports on a group of mid-western farmers coming to Washington
D.C. to lobby for government price supports for their crops. Many farmers opted out of the support in the 1990's, but now say the decline of Asian markets is forcing them to ask for government help again. (6:55)”
110 Testimony of Daryll E. Ray before the House Committee on Agriculture, February 14, 2001, “Crop Agriculture Faces Long-Term Price and Income Problems,” Daryll E. Ray is agricultural economist with the Agricultural Policy Analysis Center at the University of Tennessee. Italics and underlings are as in his original.
Bob Powell, Ph.D., MBA • • Continuous Improvement Associates © 2003 • • [email protected] • • 719 599-0977 • • Rev 01/06/03 • • page 66
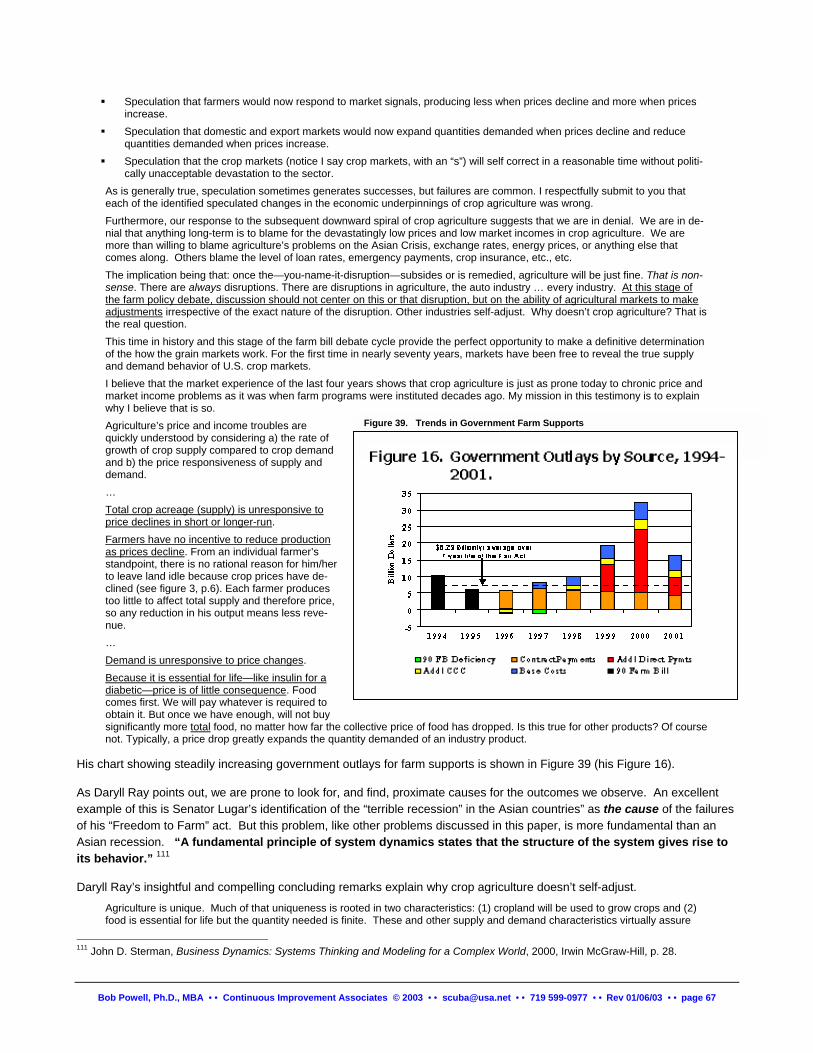
! Speculation that farmers would now respond to market signals, producing less when prices decline and more when prices increase.
! Speculation that domestic and export markets would now expand quantities demanded when prices decline and reduce quantities demanded when prices increase.
! Speculation that the crop markets (notice I say crop markets, with an “s”) will self correct in a reasonable time without politi-cally unacceptable devastation to the sector.
As is generally true, speculation sometimes generates successes, but failures are common. I respectfully submit to you that each of the identified speculated changes in the economic underpinnings of crop agriculture was wrong. Furthermore, our response to the subsequent downward spiral of crop agriculture suggests that we are in denial. We are in de-nial that anything long-term is to blame for the devastatingly low prices and low market incomes in crop agriculture. We are more than willing to blame agriculture’s problems on the Asian Crisis, exchange rates, energy prices, or anything else that comes along. Others blame the level of loan rates, emergency payments, crop insurance, etc., etc. The implication being that: once the—you-name-it-disruption—subsides or is remedied, agriculture will be just fine. That is non-sense. There are always disruptions. There are disruptions in agriculture, the auto industry … every industry. At this stage of the farm policy debate, discussion should not center on this or that disruption, but on the ability of agricultural markets to make adjustments irrespective of the exact nature of the disruption. Other industries self-adjust. Why doesn’t crop agriculture? That is the real question. This time in history and this stage of the farm bill debate cycle provide the perfect opportunity to make a definitive determination of the how the grain markets work. For the first time in nearly seventy years, markets have been free to reveal the true supply and demand behavior of U.S. crop markets. I believe that the market experience of the last four years shows that crop agriculture is just as prone today to chronic price and market income problems as it was when farm programs were instituted decades ago. My mission in this testimony is to explain why I believe that is so. Agriculture’s price and income troubles are quickly understood by considering a) the rate of growth of crop supply compared to crop demand and b) the price responsiveness of supply and demand. … Total crop acreage (supply) is unresponsive to price declines in short or longer-run. Farmers have no incentive to reduce production as prices decline. From an individual farmer’s standpoint, there is no rational reason for him/her to leave land idle because crop prices have de-clined (see figure 3, p.6). Each farmer produces too little to affect total supply and therefore price, so any reduction in his output means less reve-nue. … Demand is unresponsive to price changes. Because it is essential for life—like insulin for a diabetic—price is of little consequence. Food comes first. We will pay whatever is required to obtain it. But once we have enough, will not buy significantly more total food, no matter how far the collective price of food has dropped. Is this true for other products? Of course not. Typically, a price drop greatly expands the quantity demanded of an industry product.
Figure 39. Trends in Government Farm Supports
His chart showing steadily increasing government outlays for farm supports is shown in Figure 39 (his Figure 16).
As Daryll Ray points out, we are prone to look for, and find, proximate causes for the outcomes we observe. An excellent example of this is Senator Lugar’s identification of the “terrible recession” in the Asian countries” as the cause of the failures of his “Freedom to Farm” act. But this problem, like other problems discussed in this paper, is more fundamental than an Asian recession. “A fundamental principle of system dynamics states that the structure of the system gives rise to its behavior.” 111
Daryll Ray’s insightful and compelling concluding remarks explain why crop agriculture doesn’t self-adjust.
Agriculture is unique. Much of that uniqueness is rooted in two characteristics: (1) cropland will be used to grow crops and (2) food is essential for life but the quantity needed is finite. These and other supply and demand characteristics virtually assure
Bob Powell, Ph.D., MBA • • Continuous Improvement Associates © 2003 • • [email protected] • • 719 599-0977 • • Rev 01/06/03 • • page 67
111 John D. Sterman, Business Dynamics: Systems Thinking and Modeling for a Complex World, 2000, Irwin McGraw-Hill, p. 28.
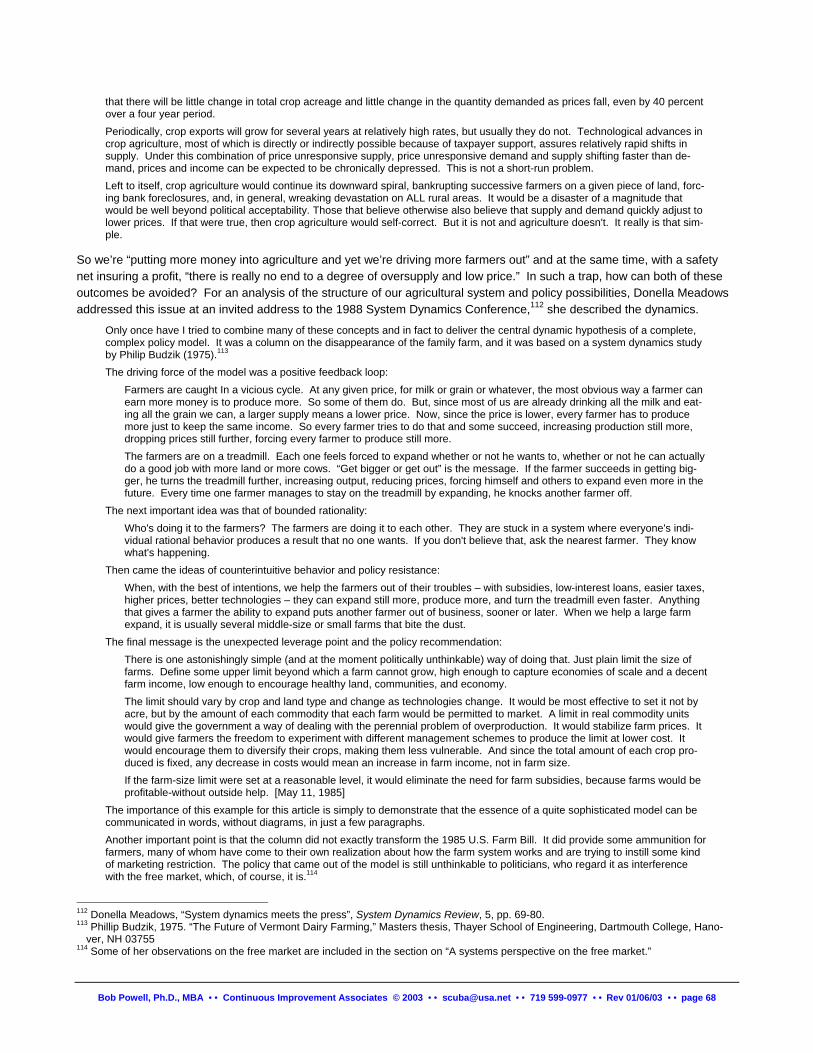
that there will be little change in total crop acreage and little change in the quantity demanded as prices fall, even by 40 percent over a four year period. Periodically, crop exports will grow for several years at relatively high rates, but usually they do not. Technological advances in crop agriculture, most of which is directly or indirectly possible because of taxpayer support, assures relatively rapid shifts in supply. Under this combination of price unresponsive supply, price unresponsive demand and supply shifting faster than de-mand, prices and income can be expected to be chronically depressed. This is not a short-run problem. Left to itself, crop agriculture would continue its downward spiral, bankrupting successive farmers on a given piece of land, forc-ing bank foreclosures, and, in general, wreaking devastation on ALL rural areas. It would be a disaster of a magnitude that would be well beyond political acceptability. Those that believe otherwise also believe that supply and demand quickly adjust to lower prices. If that were true, then crop agriculture would self-correct. But it is not and agriculture doesn't. It really is that sim-ple.
So we’re “putting more money into agriculture and yet we’re driving more farmers out” and at the same time, with a safety net insuring a profit, “there is really no end to a degree of oversupply and low price.” In such a trap, how can both of these outcomes be avoided? For an analysis of the structure of our agricultural system and policy possibilities, Donella Meadows addressed this issue at an invited address to the 1988 System Dynamics Conference,112 she described the dynamics.
Only once have I tried to combine many of these concepts and in fact to deliver the central dynamic hypothesis of a complete, complex policy model. It was a column on the disappearance of the family farm, and it was based on a system dynamics study by Philip Budzik (1975).113 The driving force of the model was a positive feedback loop:
Farmers are caught In a vicious cycle. At any given price, for milk or grain or whatever, the most obvious way a farmer can earn more money is to produce more. So some of them do. But, since most of us are already drinking all the milk and eat-ing all the grain we can, a larger supply means a lower price. Now, since the price is lower, every farmer has to produce more just to keep the same income. So every farmer tries to do that and some succeed, increasing production still more, dropping prices still further, forcing every farmer to produce still more. The farmers are on a treadmill. Each one feels forced to expand whether or not he wants to, whether or not he can actually do a good job with more land or more cows. “Get bigger or get out” is the message. If the farmer succeeds in getting big-ger, he turns the treadmill further, increasing output, reducing prices, forcing himself and others to expand even more in the future. Every time one farmer manages to stay on the treadmill by expanding, he knocks another farmer off.
The next important idea was that of bounded rationality: Who's doing it to the farmers? The farmers are doing it to each other. They are stuck in a system where everyone's indi-vidual rational behavior produces a result that no one wants. If you don't believe that, ask the nearest farmer. They know what's happening.
Then came the ideas of counterintuitive behavior and policy resistance: When, with the best of intentions, we help the farmers out of their troubles – with subsidies, low-interest loans, easier taxes, higher prices, better technologies – they can expand still more, produce more, and turn the treadmill even faster. Anything that gives a farmer the ability to expand puts another farmer out of business, sooner or later. When we help a large farm expand, it is usually several middle-size or small farms that bite the dust.
The final message is the unexpected leverage point and the policy recommendation: There is one astonishingly simple (and at the moment politically unthinkable) way of doing that. Just plain limit the size of farms. Define some upper limit beyond which a farm cannot grow, high enough to capture economies of scale and a decent farm income, low enough to encourage healthy land, communities, and economy. The limit should vary by crop and land type and change as technologies change. It would be most effective to set it not by acre, but by the amount of each commodity that each farm would be permitted to market. A limit in real commodity units would give the government a way of dealing with the perennial problem of overproduction. It would stabilize farm prices. It would give farmers the freedom to experiment with different management schemes to produce the limit at lower cost. It would encourage them to diversify their crops, making them less vulnerable. And since the total amount of each crop pro-duced is fixed, any decrease in costs would mean an increase in farm income, not in farm size. If the farm-size limit were set at a reasonable level, it would eliminate the need for farm subsidies, because farms would be profitable-without outside help. [May 11, 1985]
The importance of this example for this article is simply to demonstrate that the essence of a quite sophisticated model can be communicated in words, without diagrams, in just a few paragraphs. Another important point is that the column did not exactly transform the 1985 U.S. Farm Bill. It did provide some ammunition for farmers, many of whom have come to their own realization about how the farm system works and are trying to instill some kind of marketing restriction. The policy that came out of the model is still unthinkable to politicians, who regard it as interference with the free market, which, of course, it is.114
112 Donella Meadows, “System dynamics meets the press”, System Dynamics Review, 5, pp. 69-80. 113 Phillip Budzik, 1975. “The Future of Vermont Dairy Farming,” Masters thesis, Thayer School of Engineering, Dartmouth College, Hano-
ver, NH 03755 114 Some of her observations on the free market are included in the section on “A systems perspective on the free market.”
Bob Powell, Ph.D., MBA • • Continuous Improvement Associates © 2003 • • [email protected] • • 719 599-0977 • • Rev 01/06/03 • • page 68
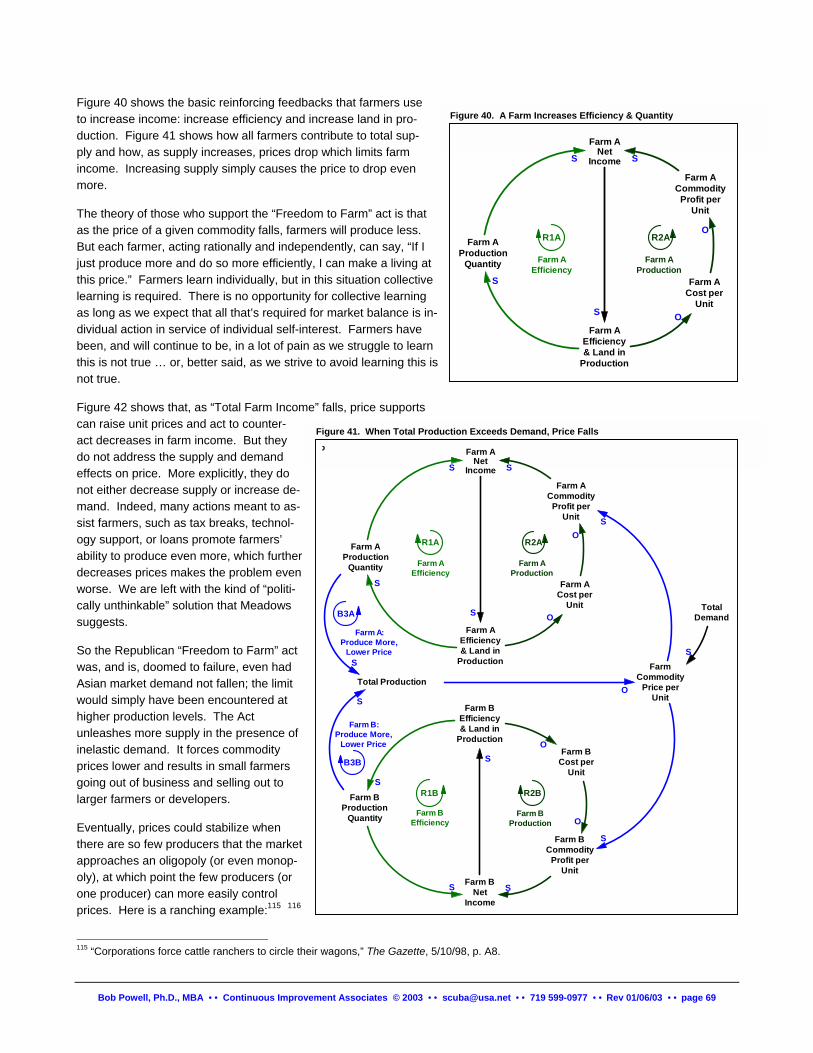
Figure 40 shows the basic reinforcing feedbacks that farmers use to increase income: increase efficiency and increase land in pro-duction. Figure 41 shows how all farmers contribute to total sup-ply and how, as supply increases, prices drop which limits farm income. Increasing supply simply causes the price to drop even more.
Figure 40. A Farm Increases Efficiency & Quantity
Farm ANet
Income
Farm AEfficiency& Land in
Production
Farm ACost per
Unit
S
O
S
Farm ACommodity
Profit perUnit
S
R1A
Farm AEfficiency
Farm AProduction
Quantity
O
S
The theory of those who support the “Freedom to Farm” act is that as the price of a given commodity falls, farmers will produce less. But each farmer, acting rationally and independently, can say, “If I just produce more and do so more efficiently, I can make a living at this price.” Farmers learn individually, but in this situation collective learning is required. There is no opportunity for collective learning as long as we expect that all that’s required for market balance is in-dividual action in service of individual self-interest. Farmers have been, and will continue to be, in a lot of pain as we struggle to learn this is not true … or, better said, as we strive to avoid learning this is not true.
Figure 42 shows that, as “Total Farm Income” falls, price supports can raise unit prices and act to counter-act decreases in farm income. But they do not address the supply and demand effects on price. More explicitly, they do not either decrease supply or increase de-mand. Indeed, many actions meant to as-sist farmers, such as tax breaks, technol-ogy support, or loans promote farmers’ ability to produce even more, which further decreases prices makes the problem even worse. We are left with the kind of “politi-cally unthinkable” solution that Meadows suggests.
Figure 41. When Total Production Exceeds Demand, Price Falls
R2A
Farm AProduction
R2A
Farm AProduction
R2B
Farm BProduction
Farm ANet
Income
Farm AEfficiency& Land in
Production
Farm ACost per
Unit
S
O
S
Farm ACommodity
Profit perUnit
S
R1A
Farm AEfficiency
Farm AProduction
Quantity
FarmCommodity
Price perUnit
S
O
S
Farm BNet
Income
Farm BEfficiency& Land in
ProductionFarm B
Cost perUnit
S
O
S
Farm BCommodity
Profit perUnit
S
R1B
Farm BEfficiency
Farm BProduction
Quantity
O
S
TotalDemand
S
S
Total Production
S
SO
B3A
Farm A:Produce More,
Lower Price
B3B
Farm B:Produce More,
Lower Price
o
So the Republican “Freedom to Farm” act was, and is, doomed to failure, even had Asian market demand not fallen; the limit would simply have been encountered at higher production levels. The Act unleashes more supply in the presence of inelastic demand. It forces commodity prices lower and results in small farmers going out of business and selling out to larger farmers or developers.
Eventually, prices could stabilize when there are so few producers that the market approaches an oligopoly (or even monop-oly), at which point the few producers (or one producer) can more easily control prices. Here is a ranching example:115 116
Bob Powell, Ph.D., MBA • • Continuous Improvement Associates © 2003 • • [email protected] • • 719 599-0977 • • Rev 01/06/03 • • page 69
115 “Corporations force cattle ranchers to circle their wagons,” The Gazette, 5/10/98, p. A8.
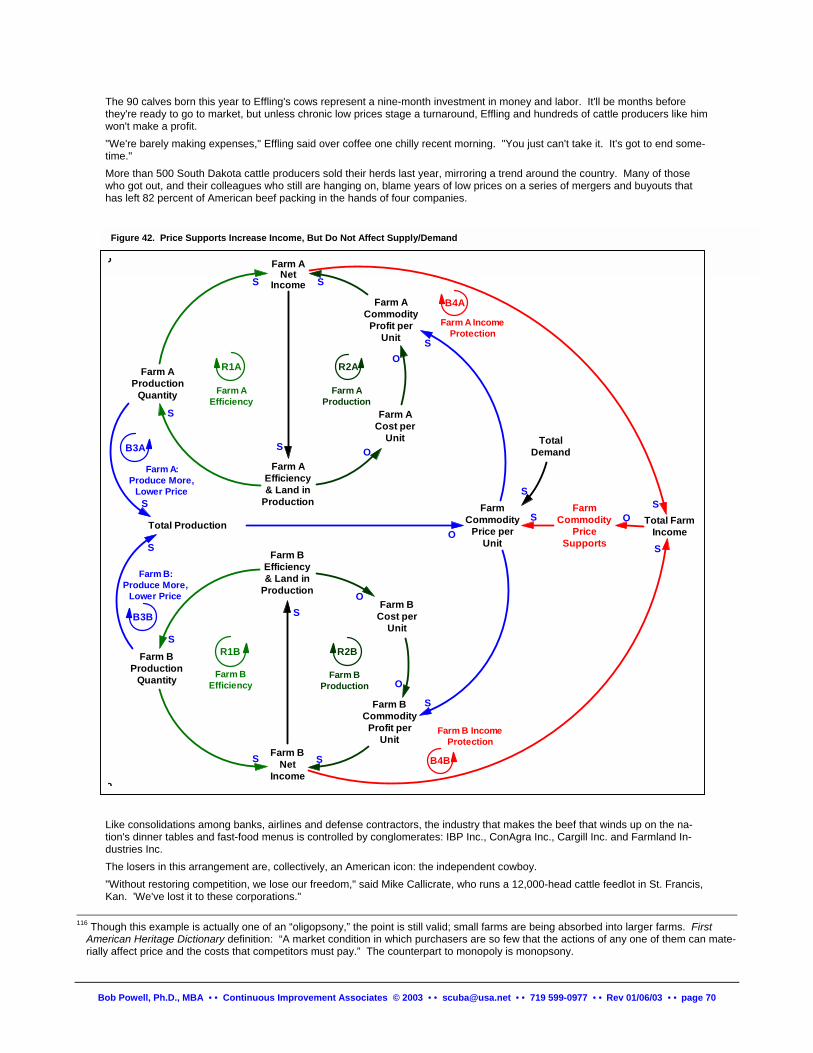
The 90 calves born this year to Effling's cows represent a nine-month investment in money and labor. It'll be months before they're ready to go to market, but unless chronic low prices stage a turnaround, Effling and hundreds of cattle producers like him won't make a profit. "We're barely making expenses," Effling said over coffee one chilly recent morning. "You just can't take it. It's got to end some-time." More than 500 South Dakota cattle producers sold their herds last year, mirroring a trend around the country. Many of those who got out, and their colleagues who still are hanging on, blame years of low prices on a series of mergers and buyouts that has left 82 percent of American beef packing in the hands of four companies.
Farm ANet
Income
Farm AEfficiency& Land in
Production
Farm ACost per
Unit
S
O
S
Farm ACommodity
Profit perUnit
S
R1A
Farm AEfficiency
Farm AProduction
Quantity
FarmCommodity
Price perUnit
S
O
S
Farm BNet
Income
Farm BEfficiency& Land in
ProductionFarm B
Cost perUnit
S
O
S
Farm BCommodity
Profit perUnit
S
R1B
Farm BEfficiency
Farm BProduction
Quantity
O
S
TotalDemand
S
S
Total Production
S
SO
S
B3A
Farm A:Produce More,
Lower Price
Total FarmIncome
S
S
O
B3B
Farm B:Produce More,
Lower Price
o
o
Figure 42. Price Supports Increase Income, But Do Not Affect Supply/Demand
FarmCommodity
PriceSupports
B4B
Farm B IncomeProtection
B4A
Farm A IncomeProtection
R2A
Farm AProduction
R2B
Farm BProduction
Like consolidations among banks, airlines and defense contractors, the industry that makes the beef that winds up on the na-tion's dinner tables and fast-food menus is controlled by conglomerates: IBP Inc., ConAgra Inc., Cargill Inc. and Farmland In-dustries Inc. The losers in this arrangement are, collectively, an American icon: the independent cowboy. "Without restoring competition, we lose our freedom," said Mike Callicrate, who runs a 12,000-head cattle feedlot in St. Francis, Kan. 'We've lost it to these corporations."
Bob Powell, Ph.D., MBA • • Continuous Improvement Associates © 2003 • • [email protected] • • 719 599-0977 • • Rev 01/06/03 • • page 70
116 Though this example is actually one of an “oligopsony,” the point is still valid; small farms are being absorbed into larger farms. First
American Heritage Dictionary definition: “A market condition in which purchasers are so few that the actions of any one of them can mate-rially affect price and the costs that competitors must pay.” The counterpart to monopoly is monopsony.
Many cattle producers believe the big packers manipulate the system to depress prices, by using forward contracts to keep prices secret and provide them a captive supply of cattle. About a third of cattle are now sold this way, instead of through the traditional stockyards cash auction, and the trend is expected to grow.
Another limit could be reached when so much land is consumed by development that no more can be put into production and when efficiency is so high that production cannot be effectively increased. At such limits, farm commodity prices could rise to the point where farming is profitable without government subsidies or interference; however because of inelastic de-mand and limited supply, prices would rise drastically, prompting government action of some sort to address the shortage. Because of the inelasticity of both supply and demand, as well as the delays inherent in trying to adjust either supply or de-mand, it’s a precarious and difficult-to-manage balancing act.117
What current policy does with respect to growth is to convert near-in farmers and ranchers, the owners of land with the greatest profit potential if converted to residential or industrial uses, into serendipitous speculators. The only way they see to get out of the death spiral is to sell off land to development.
Our policies don’t allow farmers and ranchers to be “profitable farmers and ranchers.” It practically forces them to oppose growth controls that discourage the loss of land for agriculture purposes. They’re in a terrible predicament … as is our soci-ety.
117 Similar problems with electric and gas power have arisen in early 2001 in California due to the same kind of inelasticity. California's elec-
tricity ordeal is referred to in the LA Times story in the section on “The growing infrastructure backlog.”
Bob Powell, Ph.D., MBA • • Continuous Improvement Associates © 2003 • • [email protected] • • 719 599-0977 • • Rev 01/06/03 • • page 71
“Solutions” It’s almost ludicrous to even think of recommending solutions for problems of the magnitude of those that accompany growth. Systems diagrams can help us to understand the structures that drive the behaviors we experience and they can lead us to policy solution; but, even when there is a logical solution, our beliefs, our ideology, can be so strong as to reject them.
An additional problem is that: "Too often, it is tempting to choose solutions that were tried before, but that actually makes it impossible for the new phase of growth to evolve." 118 It is frequently overwhelmingly tempting, because solutions we've used in the past were what brought us success. Without a shared understanding of future challenges, it is easy for societies, organizations and individuals to fall back on the "tried and true." But, "trying to drive by looking only in the rearview mirror is likely to cause even worse accidents."119 At every phase organizations and societies can trigger decline by not negotiating the required revolution.
Something to remember relative to many of our problems – where we are trapped in structures such as Escalation or a Tragedy of the Commons – is that actions taken by individuals acting rationally in their own self-interest are the cause of the problem, not the solution. Recall a portion of a quote from The Fifth Discipline Fieldbook: 120
When you have a “Tragedy of the Commons” issue, the system is sending you a signal that you cannot solve the problem or your own, in isolation from your fellow competitors, users, or consumers.
Similarly, it’s often true for addictive structures that individual action is insufficient to escape … frequently we need outside help. Another structure where external intervention can help is when we have a problem of “eroding goals.” For example, clear and enforced national and state standards (rather than “local control”) for clean air, clean water and traffic level of ser-vice could counteract the “race to the bottom” and set up a level playing field.
If beliefs in “freedom,” “individual rights,” and the “free market” are so strong that we cannot recognize such very real and powerful aspects of reality, we are doomed to what is essentially a hell of our own making based on flawed paradigms and faulty reasoning.
Because many of the problems are driven at the national level by Federal Reserve policy, they are difficult to address by changes in local policy. The best we may be able to do, short of changing national policy, is to mitigate the problems. In addition, “solutions” is in quotes be-cause sometimes they don’t look like solutions. They can be unattractive in that they don’t “solve” the problem in a way that seems suitable to the problem solver. Even if solutions could be definitively stated here, it’s likely that no change would re-sult. What’s really needed is to:
A thought about addiction:
The trouble with instant gratification
is that it takes too long.
• engage people with the power to change policy in a way that develops shared understandings and changes their own mental models,
• identify and gather information and data that’s needed, but not known, to guide policy, • build full, validated, system dynamics models, and • engage those people with the power to change policy in generating and testing, with simulation, policy ideas to improve
outcomes.
That said, the resources cited and the preliminary diagrams do suggest some ideas.
Solutions to traffic congestion Advanced technology is often suggested as a way to relieve our congestion problems. The counterintuitive fact is that it is not a solution. Professor Sterman, referring to the model in the section on “A model on road building to relieve traffic con-gestion,” notes:121
118 Larry E. Greiner, "Evolution and revolution as organizations grow," Harvard Business Review, May-June 1998, pp. 55 - 68. 119 Ken Wilber, A Brief History of Everything, 1996, p. 50. 120 Peter Senge, et al., The Fifth Discipline Fieldbook, 1994, p. 140. 121 John Sterman, Business Dynamics, p. 188.
Bob Powell, Ph.D., MBA • • Continuous Improvement Associates © 2003 • • [email protected] • • 719 599-0977 • • Rev 01/06/03 • • page 72
Many are motivated by the need to increase highway capacity in cities where building new roads and adding new lanes is no longer possible: under computer control, the technologists promise, cars could zip safely along at 70 miles per hour only inches apart, greatly expanding the capacity of existing highways. The model shows the futility of these hopes. There is no technological solution to the congestion problem. The more effectively these technologies increase highway capacity, the more trips will be taken, the more people will buy cars, the less attractive public transit will be, and the more countryside will be developed into bedroom communities for commuters. The volume of traffic will swiftly rise to absorb all the new capacity technology can yield. We might zip along the freeway at seventy, but we'll be stuck in much longer lines at the entrance ramp and on secondary routes. On the roadways of the future we may ride more safely and more comfortably, but we won't ride more swiftly.
And, as stated earlier, “... attempts to control congestion through road building are vain. Any reduction in congestion leads to more trips and more cars, swiftly building congestion back up. What road construction actually controls is the size of the metropolitan area and the number of cars on the road.”122
Oh, no! If even technology fails us, what's a mother to do to deal with traffic congestion? Few of us want to hear it, but some of the most effective “solutions” for traffic congestion involve making driving less attractive … relative to alternatives. So there are two approaches to reducing traffic congestion.
We can make driving, or driving alone, less attractive: • Impose tolls (… but this has regressive effects). • Increase travel times by using traffic speed bumps or traffic circles (… but we don’t want to get there slower). • Increase gas taxes (… again this is regressive … and who wants to pay more?). • Impose a surcharge on single occupant vehicles (… regressive and inconvenient). • Designate HOV lanes123 (… takes up a lane and also makes the roads more congested for others).
These are of course unattractive alternatives. And that’s just the point: make driving unattractive compared to alternatives.
But we don’t have to do it this way. We can make the alternatives more attractive than driving: • Upgrade public transit (… considered too expensive, especially with gas prices held artificially low and many of the
negative externalized effects not taken into account in the costs of driving autos). • Build bike paths (… it costs and only a relative few ride a bike; but perhaps many more would, if it were more attractive). • Create incentives for building multiuse neighborhoods that require less driving (… requires the political will to take a new
approach to zoning … and it takes a long time to have an effect). • Create incentives for clustered, multiuse neighborhoods as “pedestrian sheds” with mass transit between clusters (…
again, requires political will and takes a long time to have an effect).
Relative to transit, the argument can be made that everyone wants someone else to use transit. They don’t want to use it themselves. Instead of being hypocritical, that is an expression of the fact that transit is not very attractive, but they want it to be. As described in the section on “The death spiral of mass transportation,” we have made the region larger without suffi-ciently upgrading public transit to make it an attractive alternative. You can’t get there on the bus. That can be changed by making it so convenient and inexpensive that people want to ride transit. It would be great to do so before we make driving here as miserable an experience as it is in Dallas.
Anything we do to make the region more energy-efficient will be a long-term competitive advantage as the price of oil rises. When we purchase gas, we ship dollars out of the region, altering the balance of payments and making this a less prosperous region.
A topic of current interest is the increasing prevalence of people who run red lights. This behavior does not, of course, just happen. It is related to our policies. As the traffic load increases, the city lengthens the traffic cycle along major thoroughfares so more cars can be pumped along these roads in each traffic cycle. This does keeps the overall level of service higher than it would otherwise be … but at a price. First, it negatively affects the ability of other traffic to get on and off the major roads. More importantly, because there's a long delay if someone misses the light, he or she has more incentive to want to get through in the current cycle … they’re tempted to try to squeeze through the yellow, and even squeek thorugh the red light. We're good at blaming people, but we're actually setting up the conditions which make it inevitable that more people will run red lights.
122 John Sterman, Business Dynamics, p. 189 123 An effect of this is that, though there are multiple occupants in a vehicle, it still encourages driving.
Bob Powell, Ph.D., MBA • • Continuous Improvement Associates © 2003 • • [email protected] • • 719 599-0977 • • Rev 01/06/03 • • page 73
It would be conservative to promote alternatives to address traffic congestion before we have no alternative.
Solutions to address limited affordable housing As long as Federal Reserve policy depresses wages and speculation forces home prices up, affordable housing will be a problem. With more and more growth, people are increasingly caught between these dual pincers. Providing affordable housing will require subsidies. And as long as there are rising infrastructure backlogs, there will be no funds available for such subsidies, much less for the infrastructure itself.
One can complain that such subsidies interfere in the free market. However, Fed policy is itself interferes in the free market; it structurally assures low wages for workers and low “tax wages” for regions because of the escalating “race to the bottom” competitions between workers and regions for artificially limited economic growth and jobs.
We do not have to settle for “full employment” being an “official” 6% … or an unofficial 20 – 30% (see “Appendix II. Federal Reserve policy and wages”). We have done so because we have been captured by the eroding goals structure. Peter Senge writes in The Fifth Discipline:124
Societies collude in eroding goals all the time: witness the lowered standards for “full employment” in the United States. The federal full-employment target slid from 4 percent in the 1960s to 6 to 7 percent by the early 1980s. (In other words, we were willing to tolerate 50 to 75 percent more unemployment as “natural.”)
It is an irony that Habitat for Humanity opposed the proposed Colorado Amendment 24. It would have helped curtail the in-creasing infrastructure backlog and made it more likely that funds would be available for social purposes. The “logic of sup-ply and demand” was used to argue that restricting the supply of land would drive up prices. Opponents of growth controls painted 24 as a measure to restrict supply, even though it would not have. Even Portland’s more stringent growth boundary did not stop growth; Portland continued to grow as fast or faster than Denver (see the sections on “The effect of a growth boundary on population” and “Overbuilding – Growth Boundaries vs. Sprawl”). It’s such a powerful belief, that even raising the specter of restricting supply was enough to be convincing.
However, the data show that the rates of increase in home prices in Portland and Denver from 1991 through 1999 are virtu-ally the same (see the section on “Housing costs are increasing … growth boundaries or not”). In fact, regions with greater economic growth have higher home prices and greater rates of increase in home prices (see the section on “Recent data on housing cost dependence on regional rate of growth”).
There are many factors that do drive up home prices (see the section “If growth boundaries don’t affect home prices, what does?”). Some of these could be addressed. Recognizing and taxing “givings” could cut increased costs due to speculation. Changing tax policy to reduce demand caused by “depreciation churning” would also lower prices. Molotch notes that “the Japanese have high real estate capital gains taxes that punish rapid turnover ….”125 A growth boundary that promotes more efficient use of infrastructure could actually reduce costs and therefore prices.
Taking into account transportation costs in approving mortgages can make housing more affordable. It can also help reduce traffic congestion and the “Drive Until Qualify” driver of sprawl.126
Currently running as a pilot program in Chicago, Los Angeles, San Francisco and Seattle, the Location Efficient Mortgage (LEM) program is increasing the size of mortgage loans available to low-income workers by taking into account transportation cost sav-ings from owning a home close to one s workplace or to public transportation. LEM will be available in Portland, Ore., and At-lanta by March '02 and in Philadelphia a few months later. Pending Fannie Mae's approval, the program will go nationwide, probably by '04.
124 Peter Senge, The Fifth Discipline, 1990, p. 108. 125 Harvey Molotch, “Growth Machine Links” in Jonas and Wilson, eds., The Urban Growth Machine, Critical Perspectives Two Decades
Later, 1999, p. 253. 126 An excerpt from Kiplinger Business Forecasts on the web around 4/13/01. This was forwarded to me; I cannot give a complete refer-
ence because I do not have a subscription.
Bob Powell, Ph.D., MBA • • Continuous Improvement Associates © 2003 • • [email protected] • • 719 599-0977 • • Rev 01/06/03 • • page 74
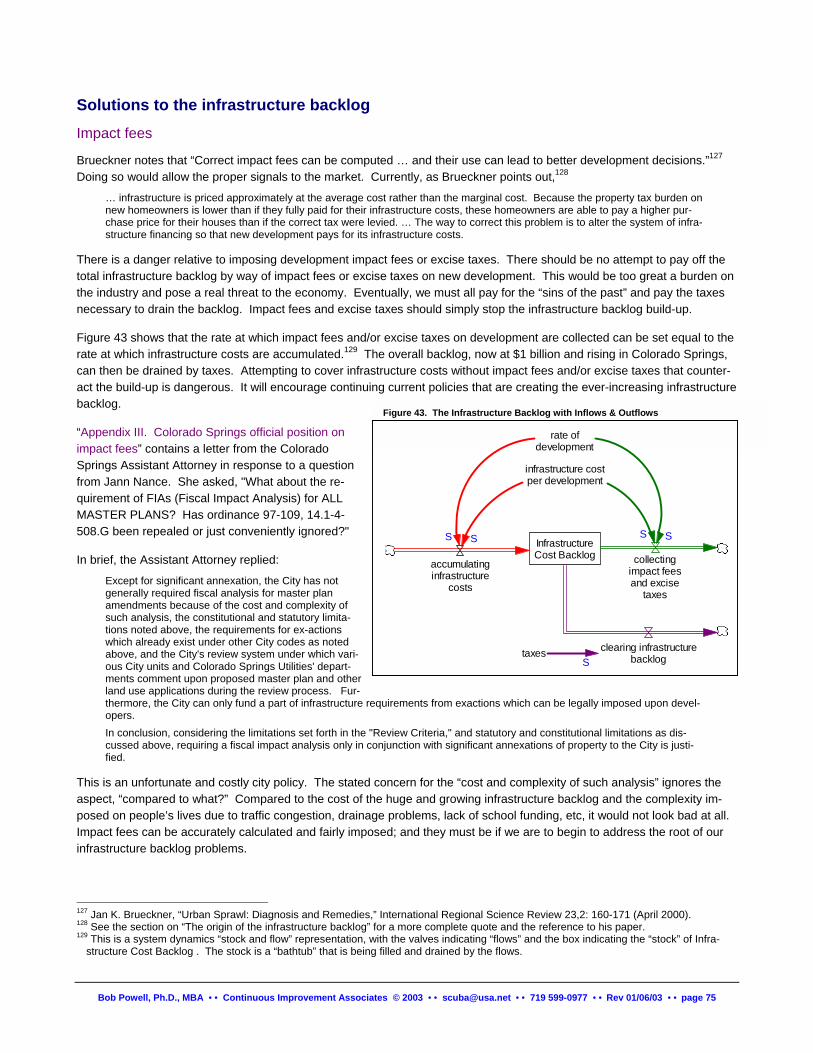
Solutions to the infrastructure backlog Impact fees
Brueckner notes that “Correct impact fees can be computed … and their use can lead to better development decisions.”127 Doing so would allow the proper signals to the market. Currently, as Brueckner points out,128
… infrastructure is priced approximately at the average cost rather than the marginal cost. Because the property tax burden on new homeowners is lower than if they fully paid for their infrastructure costs, these homeowners are able to pay a higher pur-chase price for their houses than if the correct tax were levied. … The way to correct this problem is to alter the system of infra-structure financing so that new development pays for its infrastructure costs.
There is a danger relative to imposing development impact fees or excise taxes. There should be no attempt to pay off the total infrastructure backlog by way of impact fees or excise taxes on new development. This would be too great a burden on the industry and pose a real threat to the economy. Eventually, we must all pay for the “sins of the past” and pay the taxes necessary to drain the backlog. Impact fees and excise taxes should simply stop the infrastructure backlog build-up.
Figure 43 shows that the rate at which impact fees and/or excise taxes on development are collected can be set equal to the rate at which infrastructure costs are accumulated.129 The overall backlog, now at $1 billion and rising in Colorado Springs, can then be drained by taxes. Attempting to cover infrastructure costs without impact fees and/or excise taxes that counter-act the build-up is dangerous. It will encourage continuing current policies that are creating the ever-increasing infrastructure backlog.
“Appendix III. Colorado Springs official position on impact fees” contains a letter from the Colorado Springs Assistant Attorney in response to a question from Jann Nance. She asked, "What about the re-quirement of FIAs (Fiscal Impact Analysis) for ALL MASTER PLANS? Has ordinance 97-109, 14.1-4-508.G been repealed or just conveniently ignored?"
In brief, the Assistant Attorney replied:
Except for significant annexation, the City has not generally required fiscal analysis for master plan amendments because of the cost and complexity of such analysis, the constitutional and statutory limita-tions noted above, the requirements for ex-actions which already exist under other City codes as noted above, and the City's review system under which vari-ous City units and Colorado Springs Utilities' depart-ments comment upon proposed master plan and other land use applications during the review process. Fur-thermore, the City can only fund a part of infrastructure requirements from exactions which can be legally imposed upon devel-opers.
rate ofdevelopment
InfrastructureCost Backlog collecting
impact feesand excise
taxes
accumulatinginfrastructure
costs
S S
infrastructure costper development
S S
clearing infrastructurebacklogtaxes
S
Figure 43. The Infrastructure Backlog with Inflows & Outflows
In conclusion, considering the limitations set forth in the "Review Criteria," and statutory and constitutional limitations as dis-cussed above, requiring a fiscal impact analysis only in conjunction with significant annexations of property to the City is justi-fied.
This is an unfortunate and costly city policy. The stated concern for the “cost and complexity of such analysis” ignores the aspect, “compared to what?” Compared to the cost of the huge and growing infrastructure backlog and the complexity im-posed on people’s lives due to traffic congestion, drainage problems, lack of school funding, etc, it would not look bad at all. Impact fees can be accurately calculated and fairly imposed; and they must be if we are to begin to address the root of our infrastructure backlog problems.
127 Jan K. Brueckner, “Urban Sprawl: Diagnosis and Remedies,” International Regional Science Review 23,2: 160-171 (April 2000). 128 See the section on “The origin of the infrastructure backlog” for a more complete quote and the reference to his paper. 129 This is a system dynamics “stock and flow” representation, with the valves indicating “flows” and the box indicating the “stock” of Infra-
structure Cost Backlog . The stock is a “bathtub” that is being filled and drained by the flows.
Bob Powell, Ph.D., MBA • • Continuous Improvement Associates © 2003 • • [email protected] • • 719 599-0977 • • Rev 01/06/03 • • page 75
Some call for government to run like a business.130 If this were the case, Molotch observes that we would have a different situation.131
Instead, the conventional call is for cities (and states) to be run "like a business," which really means being run for business. If a real business analogy were to be used urban governments would work for their citizen shareholders by discriminating which types of investments result in public gains versus public loss.
TABOR is a problem in imposing impact fees and excise taxes, because (as Greenwood notes in the section on “An over-view of Colorado tax policy and growth,” it would require refunds rather than applying the funds to infrastructure needs. A repeal of TABOR will meet resistance, which might be lessened if the voters know that the root of the need for taxes is prop-erly addressed.
Growth boundaries
The main purpose of a growth boundary is to promote the optimal use of infrastructure. A boundary would help avoid the problem to which Brueckner points: “infrastructure is priced approximately at the average cost rather than the marginal cost.”
In the debate on Amendment 24, the argument was made that there should be no limitations on growth because some re-gions of the state need more growth and that limitations would negatively affect their ability to improve their economic condi-tion. However, the competition between regions for the jobs the Federal Reserve does allow to be created (described in the section on “Federal Reserve policy, wages, and growth”) means that the increased economic activity in some regions guar-antees decreased economic activity in other regions … it’s a zero-sum game. A positive aspect of Amendment 24 was that it treated small areas differently. A problem though could have been that it treated them differently in a way that still allowed them to develop infrastructure backlogs and it really did not restrict economic growth in the more successful regions.
Fiscal impact disclosure
Full disclosure of the fiscal impact of development would be a major positive step. As just noted, this is required by Colo-rado Springs’ Master Plans, but the requirement is ignored. This would have been mandatory, had Amendment 24 been ap-proved. If people taxpayers knew what development would really cost, they would apply appropriate pressure on elected of-ficials, who might in turn act differently.
If there were full disclosure of the cost to the public, or better yet, charging based on the full marginal cost, market forces would promote an efficient “effective boundary” based on infrastructure availability.
Selection of, and payments to, consultants for traffic and drainage reports
When consultants are directly selected by, and paid by, developers to prepare the legally required reports, it puts the con-sultant in a difficult position. If a report does not show an outcome that is favorable to the developer in keeping costs down, the developer may never again hire that consultant. At the very least it presents the appearance of a conflict of interest. Having the cost of such reports paid by the developer, but having contract selection and payment by government would be a beneficial step.
The irony of the dual antipathy toward regulation and taxes
As noted in the section on “The origin of the infrastructure backlog,” when impact fees are not imposed and, instead, the costs are externalized onto the public, there is pressure for sales tax increases to pay for the needed infrastructure.
There’s a certain irony that increasing taxes to address infrastructure problems have led to an anti-government mentality and to an antipathy toward government regulation.132 But it is exactly the lack of regulation that is the root of the need for higher taxes. Impact fees and/or excise taxes would assure that the market sends the correct signals on the true cost of develop-ment. Regulation could prevent the burden being shifted onto the public. 130 Of course, government is not a business and should not be managed as one. It is fundamentally different. See Henry Mintzberg, “Man-
aging Government, Governing Management,” Harvard Business Review, May-June 1996, pp. 75-83. 131 Harvey Molotch, “Growth Machine Links” in Jonas and Wilson, eds., The Urban Growth Machine, Critical Perspectives Two Decades
Later, 1999, p. 258.
Bob Powell, Ph.D., MBA • • Continuous Improvement Associates © 2003 • • [email protected] • • 719 599-0977 • • Rev 01/06/03 • • page 76
Base regional competition on quality of life
Quality of life is a regional competitive advantage. Companies are drawn to a region by the availability of a skilled workforce. Points to consider:
• Regional growth is largely influenced by migration, which in turn appears to be for reasons unrelated to pure economics. Muth states that “Changes in employment, rather, must result from shifts in a region's labor supply function. Differential shifts in regional labor supply are by far the most likely to arise from migration. [Therefore,] it is to the causes of mi-gration, not shifts in the demand for exportables, that we should look for an explanation of [regional growth, such as in] the sunbelt/snowbelt....",133
• People are migrating Colorado Springs and want to stay here (Westech Statistics),134 and • The quality of the workforce is the major factor influencing company relocation and expansion.135
The need to maintain quality of life is also consistent with the economic thesis of Thomas Power, professor at the University of Montana.136 He argues that economic health requires "avoiding needless damage to the natural – and therefore human – environment." People have preferences as to where they live and the natural environment attracts people. In addition, it at-tracts people who are willing to work at lower wages because they are also “paid” in quality of life; this provides opportunities for competitive companies to be created and/or attracted without additional incentives.
So there is good evidence and a good rationale that economic health and quality of life are “trade-ons,” not “trade-offs.”
Some want to eliminate economic development activity to attract companies. But there is a real danger associated with do-ing so. Current Federal Reserve policy sets up competition between regions for limited economic growth in that it does not allow as many jobs as there are people seeking more employment. And current “local control” policies set up regions to compete against one another for those jobs, which allows independent competing regions to provide tax breaks that do not cover long-term infrastructure. Molotch recommends:137
There should be no place competition that does not benefit the commonwealth. Public investment must add value rather than merely spatially reallocate rents. If it would be necessary to trade on legal precedents, the lawyers might say that use of local government authority to lure business from other localities is an "interference" in the stability of interstate commerce. It certainly is an interference in the market; on the occasions when incentives do turn out be effective, it means government has been used to locate facilities where efficiency criteria would cause them not to be. The United States needs a Constitutional amendment or its equivalent to provide a more perfect federalism (and market) by banning such maneuvers.
As long as these conditions exist, regions must compete actively. To not do so would be unilateral disarmament.
It is tempting to try to compete based on the basis of what’s called a “business friendly,” low tax and minimal regulation basis as recommended by some economic development professionals. [See the CACI view in the section on “The low wage and infrastructure backlog parallel.”] But such a policy exacerbates the escalating “race to the bottom” and does not provide the expected results.138
Several studies have examined the relative economic success of U.S. places defined as having "good business climates' by standard business-ranking systems (e.g., Fantus and Inc.) – low taxes, low spending, weaker environmental controls, fast growth rates, pro-business "receptivity." Freudenburg (1993) determined that, if anything, a good state business climate pre-dicted bad economic outcomes in subsequent years. A comparable study by Skoro concluded that business climate indicators "are useless as predictors ... [and] worse than useful as guides to state and local government action" (Skoro 1988: 151; see also Meyer, forthcoming). Other analyses indicate that local governments' efforts to attract projects are similarly without positive consequence even in a narrow economic sense, and sometimes a source of fiscal disaster (Fasenfest 1986; Squires 1989; Humphrey and Krannich 1980; Summers 1976).
132 Government regulation here does not refer to all regulation, only regulation that protects the public interest against the negative external-
ties of private action. It, of course, does not include the government regulations that protect property rights. 133 Richard Muth, "Regional Supply-Side Economics," Journal of Urban Economics, 29, (1991) pp. 63-69 134 Westech Attendee & Exhibitor Statistic, 1992 (The EDC has this document) 135 Survey & Analysis of Site Selections & Group Moves: Policies, Costs, & Trends, Runzheimer International (1991) 136 Thomas Michael Power, Lost Landscapes and Failed Economies : The Search for a Value of Place, Island Press (1998) 137 Harvey Molotch, “Growth Machine Links” in Jonas and Wilson, eds., The Urban Growth Machine, Critical Perspectives Two Decades
Later, 1999, p. 261. 138 Harvey Molotch, “Growth Machine Links” in Jonas and Wilson, eds., The Urban Growth Machine, Critical Perspectives Two Decades
Later, 1999, p. 261.
Bob Powell, Ph.D., MBA • • Continuous Improvement Associates © 2003 • • [email protected] • • 719 599-0977 • • Rev 01/06/03 • • page 77
Instead, it’s important that economic development professionals promote Colorado Springs based on its quality of life and work for responsible growth that protects that quality of life. In the competition between regions, it is the quality of life that gives Colorado Springs competitive advantage.
Colorado can do this, though some other regions cannot, because of the beauty of Colorado. Other regions without this component of attractiveness are stuck as long as Federal policy allows the zero-sum-game competition between regions. If we allow the infrastructure backlog to continue to grow and degrade quality of life, or increase taxes to pay for what should be paid for by development fees, we will “kill the goose that laid the golden egg” and eventually we’ll be no better off than other regions.
A complementary approach is to fully tax the speculative gains when roads are built and when land is annexed as a source of funding to pay for the infrastructure.
Solutions to sprawl As noted in the section, “Solutions to address limited affordable housing,” taking into account transportation costs in approv-ing mortgages would reduce sprawl.
Brueckner observed tax sharing over a larger metropolitan area would curb sprawl (quoted also in the section on “High In-come Segregation”),
To undo the urban spatial expansion created by this impulse for fiscal segregation, a change in the underlying structure of fiscal incentives is required. For example, the current system of autonomous jurisdictions could be modified by adding a higher level metropolitan-area government with the power to tax suburban residents and to spend the proceeds in the central city. Alterna-tively, a more restricted type of tax base sharing among municipalities could be implemented. Because either change would limit the ability of high-income households to escape redistributive taxation that benefits low income consumers, the incentive to form separate communities on the suburban fringe would be weakened, curbing the spatial expansion of cities.
The Gallagher Amendment distorts the balance of taxation between businesses and housing. It encourages regions to re-cruit businesses and push the residences onto surrounding areas that must provide services, but which do not have the tax base to do so.
It’s easy to understand why Gallagher was popular enough to be passed. Faced with seemingly ever-increasing taxes to pay for infrastructure (including road improvements to handle the traffic, schools, and other services), residents wanted some way to say, “Stop!” Unfortunately Gallagher distorts the burden, putting too much of a proportion onto businesses, espe-cially capital intensive industries, such as semiconductor manufacture. An argument could be made that proper impact fees could allow Gallagher to be repealed or modified to lower the proportion of taxes on businesses.
With proper impact fees in place, TABOR will need to be repealed to allow tax increases to clear the infrastructure backlog. This will be painful, to say the least, but will be necessary because the taxes needed will exceed the rate of population growth and inflation because we have allowed the backlog to grow so large.
Raising gas prices (see Figures 2 and 4) would provide balancing feedback to limit reduce sprawl. There would be other so-cial benefits as well, as indicated by the 4/16/01 release of a report by Redefining Progress:139
Accurate Prices Issue Brief: Driving fees should be linked to the negative effects caused to society and the environment by automobile use [http://www.rprogress.org/]
OAKLAND, Calif.—Despite seemingly expensive gas prices, drivers pay less than half of the costs created by the use of their automobiles when the total costs of driving-including increased congestion, space covered by pavement, accidents, and pollu-tion-are considered. A Redefining Progress issue brief released today explains how everyone (non-drivers, taxpayers, and other drivers) pays every time a driver gets behind the wheel. The issue brief, Beyond Gas Taxes: Linking Driving Fees to Externalities, explores other options that charge drivers for the so-cial costs created by automobile use. While in the past this option has meant higher gas taxes, the paper argues for other pric-ing options tailored toward preventing specific harms. For example, charging for highway use during rush hour could be used to ease traffic problems, and pay-as-you-drive insurance could reduce automobile crashes.
139 Redefining Progress web site. Redefining Progress is a nonpartisan, nonprofit organization based in Oakland, Calif., that develops poli-
cies and tools that reorient the economy to value people and nature first. RP does this by developing policies that capture the economy's hidden social and environmental costs, that transform the human use and distribution of the Earth's natural resources, and that restore the value of shared social and natural assets. CONTACT: Craig Cheslog, 510-444-3041, x305 or [email protected]
Bob Powell, Ph.D., MBA • • Continuous Improvement Associates © 2003 • • [email protected] • • 719 599-0977 • • Rev 01/06/03 • • page 78
"A driver pays for gasoline, insurance, and repairs in order to derive the benefits of driving, but not for the traffic and pollution that affect nearby people," writes Redefining Progress Accurate Prices Program Director Mark M. Glickman. "They're simply aren't financial incentives for drivers to take these costs into account when they drive, so as a society we all drive more than we would like." The issue brief also addresses the regressivity of driving fees. While this is a serious concern, doing nothing to improve our transportation problems will also affect low-income households disproportionately. The paper argues that while there is a need to soften the financial impact of any new driving fees on lower-income people, it is also create viable, convenient, and affordable alternatives to owning and using cars.
While difficult to influence, ending road-building projects funded by Federal and State government would reduce sprawl. But this policy will be difficult to end because there is significant political pressure from those who profit from road building, those in road building industries and from those who benefit from the “givings” associated with the improved access to their proper-ties and helps them realize their speculative intent.
Our national farm policy, also difficult to influence, effectively leads to a lower value of land for farming and ranching, be-cause these activities cannot be profitable. Not only does it drive farmers out of business, the best land for farming is lost for future generations. National farm policy could take into account the cost of such losses. Farm subsidies were over $30 bil-lion in 2000, and with current policy, price supports must continue or small farmers and ranchers will continue go out of busi-ness. If they do, producers will become so large that the very competition we want to promote will be absent. Considering the structure of the system, as described in the section on “The Squeeze on Farmers,” is necessary for developing a policy that both benefits our national interests and the interests of individual farmers and ranchers.
Additional sprawl reduction ideas are in Appendix IV Section, “So What Can We Do -- Really Do -- About Sprawl?”
Conclusion This paper has examined some of the complex interrelationships involved with growth. They are complex because “growth” is not simply a “problem,” where a problem is a “gap between goal and actual.” It is not even simply a “mess,” where a “mess” is a “tangled set of interrelated problems,” that is, a system of problems. It is what is called in the systems literature a “wicked” problem, though perhaps it would be more appropriately called a “wicked mess” … a mess that exists in a coer-cive environment due to inequalities of economic and political power.
Therefore, growth is not a problem to be solved. It is not even a mess to be managed. And rather than being about predict-ing a predetermined future and preparing for it, it is more usefully a matter of defining a desired future and creating it. If we have the collective will to do so.
Bob Powell earned a Ph.D. in Physics from Case Western Reserve University and MBA from Florida Institute of Technology.
His company, Continuous Improvement Associates, uses the lens of systems thinking to create exponential process improvement and strategic alignment. The idea is to design structures & strategies to improve organizational performance in ways that support Values and Purpose. The approach defines explicit feedbacks and creates specific measures to both foster organizational performance im-
provement and monitor that the improvement strategy is working.
He has worked with high tech companies to facilitate action on process and organizational issues, and with the Economic Development Corporation on labor market economics, the structure of the workforce system, and the structure of economic clusters.
For more information and updates, e-mail: Bob Powell, [email protected] or call 719 599-0977
Bob Powell, Ph.D., MBA • • Continuous Improvement Associates © 2003 • • [email protected] • • 719 599-0977 • • Rev 01/06/03 • • page 79
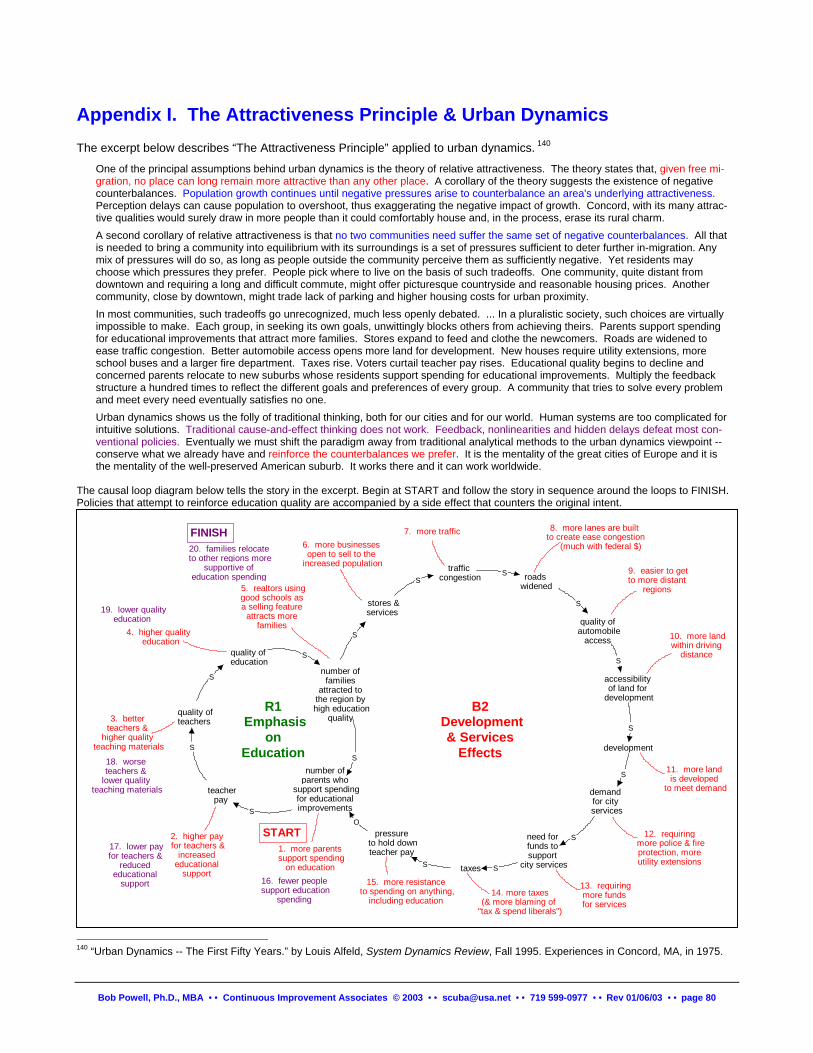
Appendix I. The Attractiveness Principle & Urban Dynamics The excerpt below describes “The Attractiveness Principle” applied to urban dynamics. 140
One of the principal assumptions behind urban dynamics is the theory of relative attractiveness. The theory states that, given free mi-gration, no place can long remain more attractive than any other place. A corollary of the theory suggests the existence of negative counterbalances. Population growth continues until negative pressures arise to counterbalance an area's underlying attractiveness. Perception delays can cause population to overshoot, thus exaggerating the negative impact of growth. Concord, with its many attrac-tive qualities would surely draw in more people than it could comfortably house and, in the process, erase its rural charm. A second corollary of relative attractiveness is that no two communities need suffer the same set of negative counterbalances. All that is needed to bring a community into equilibrium with its surroundings is a set of pressures sufficient to deter further in-migration. Any mix of pressures will do so, as long as people outside the community perceive them as sufficiently negative. Yet residents may choose which pressures they prefer. People pick where to live on the basis of such tradeoffs. One community, quite distant from downtown and requiring a long and difficult commute, might offer picturesque countryside and reasonable housing prices. Another community, close by downtown, might trade lack of parking and higher housing costs for urban proximity. In most communities, such tradeoffs go unrecognized, much less openly debated. ... In a pluralistic society, such choices are virtually impossible to make. Each group, in seeking its own goals, unwittingly blocks others from achieving theirs. Parents support spending for educational improvements that attract more families. Stores expand to feed and clothe the newcomers. Roads are widened to ease traffic congestion. Better automobile access opens more land for development. New houses require utility extensions, more school buses and a larger fire department. Taxes rise. Voters curtail teacher pay rises. Educational quality begins to decline and concerned parents relocate to new suburbs whose residents support spending for educational improvements. Multiply the feedback structure a hundred times to reflect the different goals and preferences of every group. A community that tries to solve every problem and meet every need eventually satisfies no one. Urban dynamics shows us the folly of traditional thinking, both for our cities and for our world. Human systems are too complicated for intuitive solutions. Traditional cause-and-effect thinking does not work. Feedback, nonlinearities and hidden delays defeat most con-ventional policies. Eventually we must shift the paradigm away from traditional analytical methods to the urban dynamics viewpoint -- conserve what we already have and reinforce the counterbalances we prefer. It is the mentality of the great cities of Europe and it is the mentality of the well-preserved American suburb. It works there and it can work worldwide.
The causal loop diagram below tells the story in the excerpt. Begin at START and follow the story in sequence around the loops to FINISH. Policies that attempt to reinforce education quality are accompanied by a side effect that counters the original intent.
S
stores &services
S
number offamilies
attracted tothe region by
high educationquality
number ofparents who
support spendingfor educationalimprovements
O
traffic congestion roads
widened
quality of automobile
access
accessibilityof land for
development
development
demandfor city
services
need forfunds tosupport
city services taxes
teacherpay
pressure to hold downteacher pay
quality ofteachers
quality of education
S
SS
SS
S
S
S
S
S
S
S
S
16. fewer people support education
spending
17. lower payfor teachers &
reducededucational
support
18. worseteachers &
lower quality teaching materials
19. lower qualityeducation
20. families relocate to other regions more
supportive ofeducation spending
FINISH
R1 Emphasis
onEducation
1. more parents support spending
on education
2. higher pay for teachers &
increasededucational
support
3. betterteachers &
higher quality teaching materials
4. higher quality education
5. realtors usinggood schools asa selling feature
attracts morefamilies
6. more businessesopen to sell to the
increased population
7. more traffic 8. more lanes are built to create ease congestion (much with federal $)
9. easier to getto more distant
regions
10. more landwithin driving
distance
11. more landis developed
to meet demand
12. requiring more police & fireprotection, moreutility extensions
13. requiringmore fundsfor services
14. more taxes(& more blaming of
"tax & spend liberals")
15. more resistance to spending on anything,
including education
START
B2 Development
& ServicesEffects
Bob Powell, Ph.D., MBA • • Continuous Improvement Associates © 2003 • • [email protected] • • 719 599-0977 • • Rev 01/06/03 • • page 80
140 “Urban Dynamics -- The First Fifty Years.” by Louis Alfeld, System Dynamics Review, Fall 1995. Experiences in Concord, MA, in 1975.
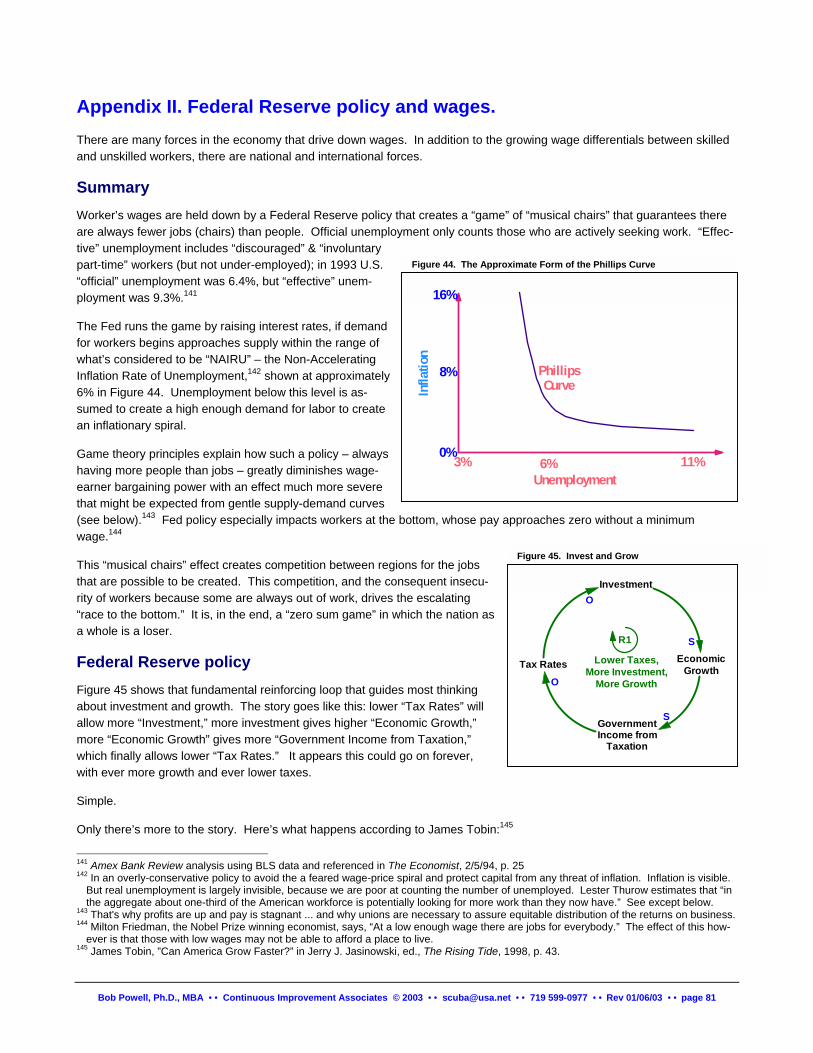
Appendix II. Federal Reserve policy and wages. There are many forces in the economy that drive down wages. In addition to the growing wage differentials between skilled and unskilled workers, there are national and international forces.
Summary Worker’s wages are held down by a Federal Reserve policy that creates a “game” of “musical chairs” that guarantees there are always fewer jobs (chairs) than people. Official unemployment only counts those who are actively seeking work. “Effec-tive” unemployment includes “discouraged” & “involuntary part-time” workers (but not under-employed); in 1993 U.S. “official” unemployment was 6.4%, but “effective” unem-ployment was 9.3%.141
The Fed runs the game by raising interest rates, if demand for workers begins approaches supply within the range of what’s considered to be “NAIRU” – the Non-Accelerating Inflation Rate of Unemployment,142 shown at approximately 6% in Figure 44. Unemployment below this level is as-sumed to create a high enough demand for labor to create an inflationary spiral.
Game theory principles explain how such a policy – always having more people than jobs – greatly diminishes wage-earner bargaining power with an effect much more severe that might be expected from gentle supply-demand curves (see below).143 Fed policy especially impacts workers at the bottom, whose pay approaches zero without a minimum wage.144
Infla
tion
11%
PhillipsCurve
Unemployment
16%
6%
8%
3%0%
Figure 44. The Approximate Form of the Phillips Curve
Figure 45. Invest and Grow
Investment
EconomicGrowth
GovernmentIncome from
Taxation
Tax Rates
S
S
O
O
R1
Lower Taxes,More Investment,
More Growth
This “musical chairs” effect creates competition between regions for the jobs that are possible to be created. This competition, and the consequent insecu-rity of workers because some are always out of work, drives the escalating “race to the bottom.” It is, in the end, a “zero sum game” in which the nation as a whole is a loser.
Federal Reserve policy Figure 45 shows that fundamental reinforcing loop that guides most thinking about investment and growth. The story goes like this: lower “Tax Rates” will allow more “Investment,” more investment gives higher “Economic Growth,” more “Economic Growth” gives more “Government Income from Taxation,” which finally allows lower “Tax Rates.” It appears this could go on forever, with ever more growth and ever lower taxes.
Simple.
Only there’s more to the story. Here’s what happens according to James Tobin:145
141 Amex Bank Review analysis using BLS data and referenced in The Economist, 2/5/94, p. 25 142 In an overly-conservative policy to avoid the a feared wage-price spiral and protect capital from any threat of inflation. Inflation is visible.
But real unemployment is largely invisible, because we are poor at counting the number of unemployed. Lester Thurow estimates that “in the aggregate about one-third of the American workforce is potentially looking for more work than they now have.” See except below.
143 That's why profits are up and pay is stagnant ... and why unions are necessary to assure equitable distribution of the returns on business. 144 Milton Friedman, the Nobel Prize winning economist, says, “At a low enough wage there are jobs for everybody.” The effect of this how-
ever is that those with low wages may not be able to afford a place to live. 145 James Tobin, ”Can America Grow Faster?” in Jerry J. Jasinowski, ed., The Rising Tide, 1998, p. 43.
Bob Powell, Ph.D., MBA • • Continuous Improvement Associates © 2003 • • [email protected] • • 719 599-0977 • • Rev 01/06/03 • • page 81
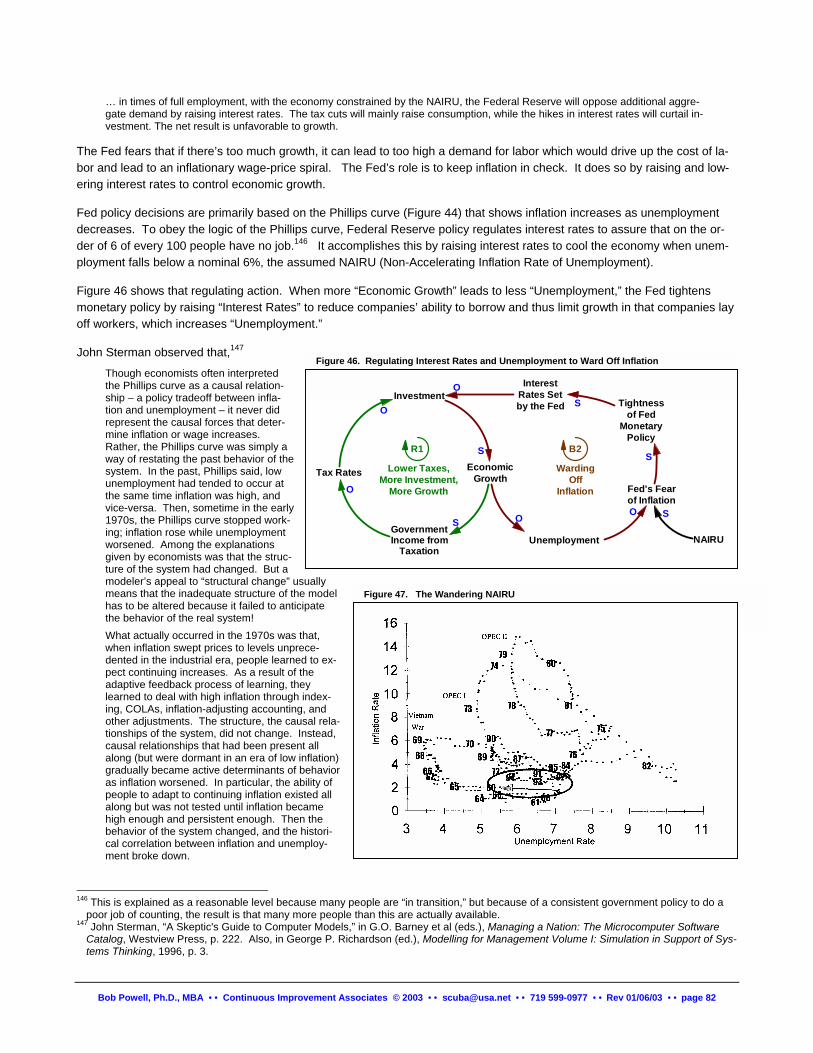
… in times of full employment, with the economy constrained by the NAIRU, the Federal Reserve will oppose additional aggre-gate demand by raising interest rates. The tax cuts will mainly raise consumption, while the hikes in interest rates will curtail in-vestment. The net result is unfavorable to growth.
The Fed fears that if there’s too much growth, it can lead to too high a demand for labor which would drive up the cost of la-bor and lead to an inflationary wage-price spiral. The Fed’s role is to keep inflation in check. It does so by raising and low-ering interest rates to control economic growth.
B2
WardingOff
Inflation
Fed policy decisions are primarily based on the Phillips curve (Figure 44) that shows inflation increases as unemployment decreases. To obey the logic of the Phillips curve, Federal Reserve policy regulates interest rates to assure that on the or-der of 6 of every 100 people have no job.146 It accomplishes this by raising interest rates to cool the economy when unem-ployment falls below a nominal 6%, the assumed NAIRU (Non-Accelerating Inflation Rate of Unemployment).
Figure 46 shows that regulating action. When more “Economic Growth” leads to less “Unemployment,” the Fed tightens monetary policy by raising “Interest Rates” to reduce companies’ ability to borrow and thus limit growth in that companies lay off workers, which increases “Unemployment.”
John Sterman observed that,147
Though economists often interpreted the Phillips curve as a causal relation-ship – a policy tradeoff between infla-tion and unemployment – it never did represent the causal forces that deter-mine inflation or wage increases. Rather, the Phillips curve was simply a way of restating the past behavior of the system. In the past, Phillips said, low unemployment had tended to occur at the same time inflation was high, and vice-versa. Then, sometime in the early 1970s, the Phillips curve stopped work-ing; inflation rose while unemployment worsened. Among the explanations given by economists was that the struc-ture of the system had changed. But a modeler’s appeal to “structural change” usually means that the inadequate structure of the model has to be altered because it failed to anticipate the behavior of the real system!
InterestRates Setby the Fed
Investment
EconomicGrowth
GovernmentIncome from
TaxationUnemployment
Tax Rates
Tightnessof Fed
MonetaryPolicy
O O
SO
S
S
O
O
R1
Lower Taxes,More Investment,
More Growth
NAIRU
S
Fed's Fearof Inflation
S
Figure 46. Regulating Interest Rates and Unemployment to Ward Off Inflation
Figure 47. The Wandering NAIRU
What actually occurred in the 1970s was that, when inflation swept prices to levels unprece-dented in the industrial era, people learned to ex-pect continuing increases. As a result of the adaptive feedback process of learning, they learned to deal with high inflation through index-ing, COLAs, inflation-adjusting accounting, and other adjustments. The structure, the causal rela-tionships of the system, did not change. Instead, causal relationships that had been present all along (but were dormant in an era of low inflation) gradually became active determinants of behavior as inflation worsened. In particular, the ability of people to adapt to continuing inflation existed all along but was not tested until inflation became high enough and persistent enough. Then the behavior of the system changed, and the histori-cal correlation between inflation and unemploy-ment broke down.
146 This is explained as a reasonable level because many people are “in transition,” but because of a consistent government policy to do a
poor job of counting, the result is that many more people than this are actually available. 147 John Sterman, “A Skeptic's Guide to Computer Models,” in G.O. Barney et al (eds.), Managing a Nation: The Microcomputer Software
Catalog, Westview Press, p. 222. Also, in George P. Richardson (ed.), Modelling for Management Volume I: Simulation in Support of Sys-tems Thinking, 1996, p. 3.
Bob Powell, Ph.D., MBA • • Continuous Improvement Associates © 2003 • • [email protected] • • 719 599-0977 • • Rev 01/06/03 • • page 82
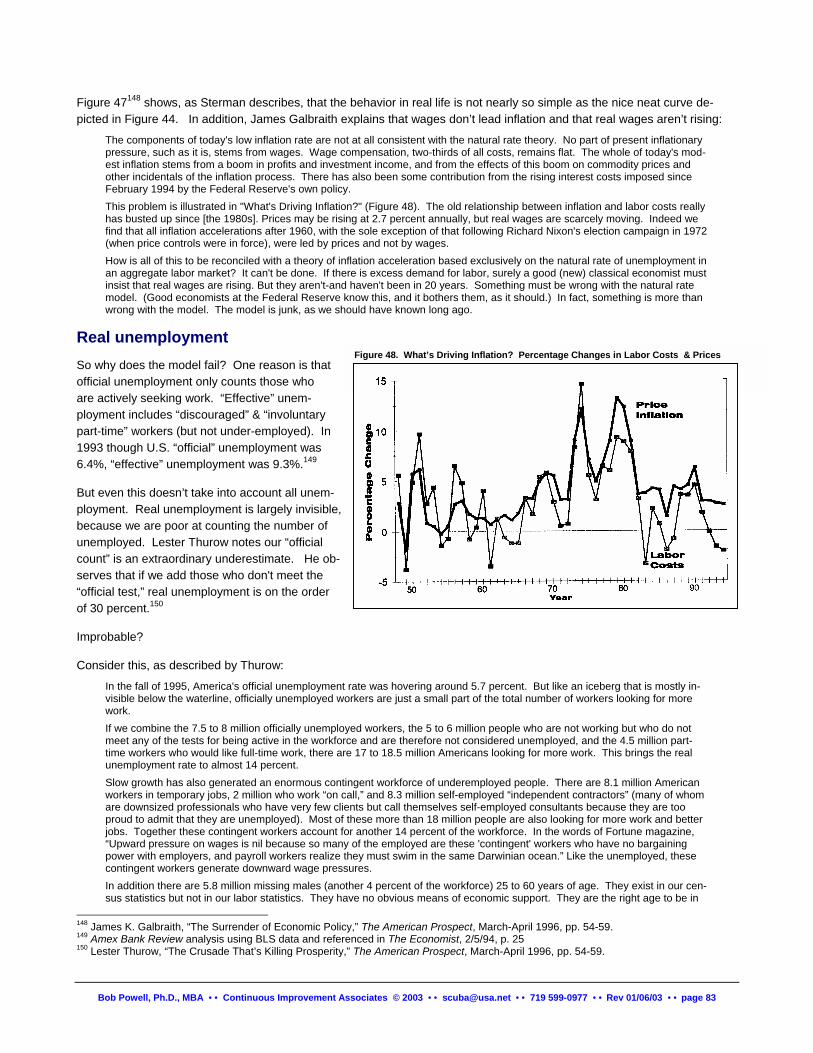
Figure 47148 shows, as Sterman describes, that the behavior in real life is not nearly so simple as the nice neat curve de-picted in Figure 44. In addition, James Galbraith explains that wages don’t lead inflation and that real wages aren’t rising:
The components of today's low inflation rate are not at all consistent with the natural rate theory. No part of present inflationary pressure, such as it is, stems from wages. Wage compensation, two-thirds of all costs, remains flat. The whole of today's mod-est inflation stems from a boom in profits and investment income, and from the effects of this boom on commodity prices and other incidentals of the inflation process. There has also been some contribution from the rising interest costs imposed since February 1994 by the Federal Reserve's own policy. This problem is illustrated in "What's Driving Inflation?" (Figure 48). The old relationship between inflation and labor costs really has busted up since [the 1980s]. Prices may be rising at 2.7 percent annually, but real wages are scarcely moving. Indeed we find that all inflation accelerations after 1960, with the sole exception of that following Richard Nixon's election campaign in 1972 (when price controls were in force), were led by prices and not by wages. How is all of this to be reconciled with a theory of inflation acceleration based exclusively on the natural rate of unemployment in an aggregate labor market? It can't be done. If there is excess demand for labor, surely a good (new) classical economist must insist that real wages are rising. But they aren't-and haven't been in 20 years. Something must be wrong with the natural rate model. (Good economists at the Federal Reserve know this, and it bothers them, as it should.) In fact, something is more than wrong with the model. The model is junk, as we should have known long ago.
Real unemployment So why does the model fail? One reason is that official unemployment only counts those who are actively seeking work. “Effective” unem-ployment includes “discouraged” & “involuntary part-time” workers (but not under-employed). In 1993 though U.S. “official” unemployment was 6.4%, “effective” unemployment was 9.3%.149
But even this doesn’t take into account all unem-ployment. Real unemployment is largely invisible, because we are poor at counting the number of unemployed. Lester Thurow notes our “official count” is an extraordinary underestimate. He ob-serves that if we add those who don't meet the “official test,” real unemployment is on the order of 30 percent.150
Figure 48. What’s Driving Inflation? Percentage Changes in Labor Costs & Prices
Improbable?
Consider this, as described by Thurow:
In the fall of 1995, America's official unemployment rate was hovering around 5.7 percent. But like an iceberg that is mostly in-visible below the waterline, officially unemployed workers are just a small part of the total number of workers looking for more work. If we combine the 7.5 to 8 million officially unemployed workers, the 5 to 6 million people who are not working but who do not meet any of the tests for being active in the workforce and are therefore not considered unemployed, and the 4.5 million part-time workers who would like full-time work, there are 17 to 18.5 million Americans looking for more work. This brings the real unemployment rate to almost 14 percent. Slow growth has also generated an enormous contingent workforce of underemployed people. There are 8.1 million American workers in temporary jobs, 2 million who work “on call,” and 8.3 million self-employed “independent contractors” (many of whom are downsized professionals who have very few clients but call themselves self-employed consultants because they are too proud to admit that they are unemployed). Most of these more than 18 million people are also looking for more work and better jobs. Together these contingent workers account for another 14 percent of the workforce. In the words of Fortune magazine, “Upward pressure on wages is nil because so many of the employed are these 'contingent' workers who have no bargaining power with employers, and payroll workers realize they must swim in the same Darwinian ocean.” Like the unemployed, these contingent workers generate downward wage pressures. In addition there are 5.8 million missing males (another 4 percent of the workforce) 25 to 60 years of age. They exist in our cen-sus statistics but not in our labor statistics. They have no obvious means of economic support. They are the right age to be in
Bob Powell, Ph.D., MBA • • Continuous Improvement Associates © 2003 • • [email protected] • • 719 599-0977 • • Rev 01/06/03 • • page 83
148 James K. Galbraith, “The Surrender of Economic Policy,” The American Prospect, March-April 1996, pp. 54-59. 149 Amex Bank Review analysis using BLS data and referenced in The Economist, 2/5/94, p. 25 150 Lester Thurow, “The Crusade That’s Killing Prosperity,” The American Prospect, March-April 1996, pp. 54-59.
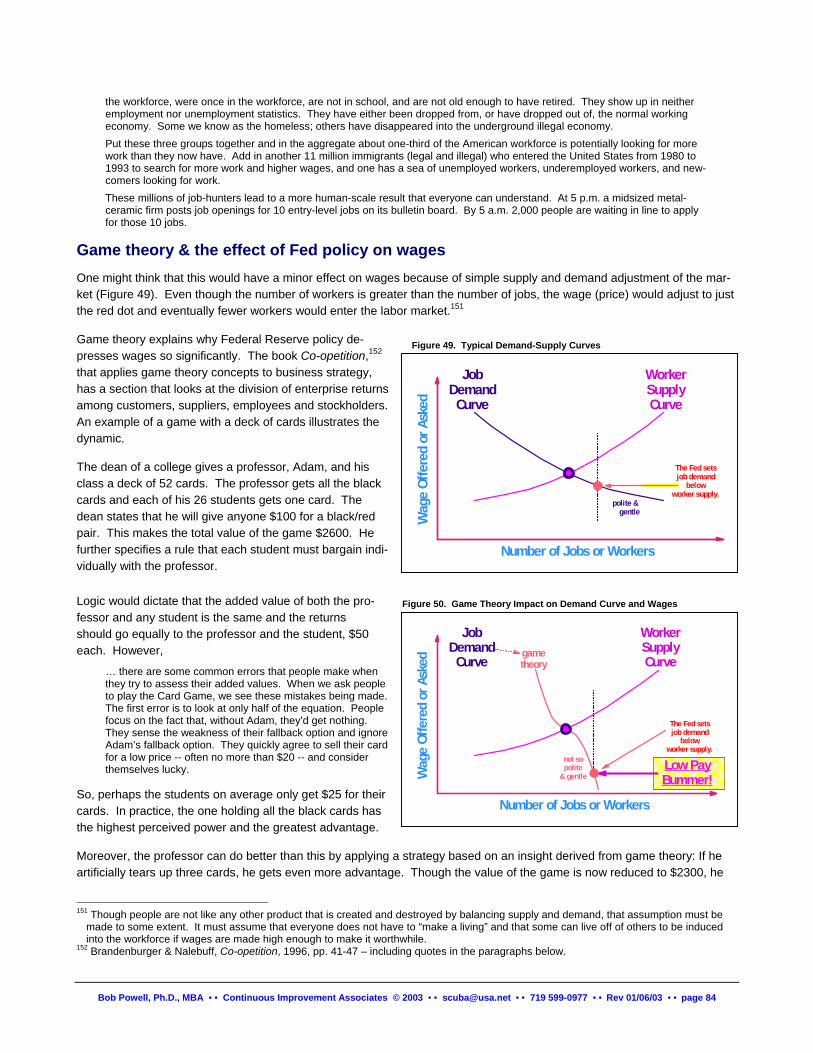
the workforce, were once in the workforce, are not in school, and are not old enough to have retired. They show up in neither employment nor unemployment statistics. They have either been dropped from, or have dropped out of, the normal working economy. Some we know as the homeless; others have disappeared into the underground illegal economy. Put these three groups together and in the aggregate about one-third of the American workforce is potentially looking for more work than they now have. Add in another 11 million immigrants (legal and illegal) who entered the United States from 1980 to 1993 to search for more work and higher wages, and one has a sea of unemployed workers, underemployed workers, and new-comers looking for work. These millions of job-hunters lead to a more human-scale result that everyone can understand. At 5 p.m. a midsized metal-ceramic firm posts job openings for 10 entry-level jobs on its bulletin board. By 5 a.m. 2,000 people are waiting in line to apply for those 10 jobs.
Game theory & the effect of Fed policy on wages One might think that this would have a minor effect on wages because of simple supply and demand adjustment of the mar-ket (Figure 49). Even though the number of workers is greater than the number of jobs, the wage (price) would adjust to just the red dot and eventually fewer workers would enter the labor market.151
Game theory explains why Federal Reserve policy de-presses wages so significantly. The book Co-opetition,152 that applies game theory concepts to business strategy, has a section that looks at the division of enterprise returns among customers, suppliers, employees and stockholders. An example of a game with a deck of cards illustrates the dynamic.
WorkerSupplyCurve
Wag
e O
ffer
ed o
r As
ked
JobDemand
Curve
Number of Jobs or Workers
polite & gentle
Figure 49. Typical Demand-Supply Curves
The dean of a college gives a professor, Adam, and his class a deck of 52 cards. The professor gets all the black cards and each of his 26 students gets one card. The dean states that he will give anyone $100 for a black/red pair. This makes the total value of the game $2600. He further specifies a rule that each student must bargain indi-vidually with the professor.
Logic would dictate that the added value of both the pro-fessor and any student is the same and the returns should go equally to the professor and the student, $50 each. However,
Figure 50. Game Theory Impact on Demand Curve and Wages
The Fed setsjob demand
belowworker supply.
The Fed setsjob demand
belowworker supply.
not sopolite
& gentle
WorkerSupplyCurve
JobDemand
Curvegametheory
���������������������������������������������������������������������������������������Low Pay
Bummer!Wag
e O
ffer
ed o
r As
ked
Number of Jobs or Workers
… there are some common errors that people make when they try to assess their added values. When we ask people to play the Card Game, we see these mistakes being made. The first error is to look at only half of the equation. People focus on the fact that, without Adam, they’d get nothing. They sense the weakness of their fallback option and ignore Adam’s fallback option. They quickly agree to sell their card for a low price -- often no more than $20 -- and consider themselves lucky.
So, perhaps the students on average only get $25 for their cards. In practice, the one holding all the black cards has the highest perceived power and the greatest advantage.
Moreover, the professor can do better than this by applying a strategy based on an insight derived from game theory: If he artificially tears up three cards, he gets even more advantage. Though the value of the game is now reduced to $2300, he
151 Though people are not like any other product that is created and destroyed by balancing supply and demand, that assumption must be
made to some extent. It must assume that everyone does not have to “make a living” and that some can live off of others to be induced into the workforce if wages are made high enough to make it worthwhile.
152 Brandenburger & Nalebuff, Co-opetition, 1996, pp. 41-47 – including quotes in the paragraphs below.
Bob Powell, Ph.D., MBA • • Continuous Improvement Associates © 2003 • • [email protected] • • 719 599-0977 • • Rev 01/06/03 • • page 84
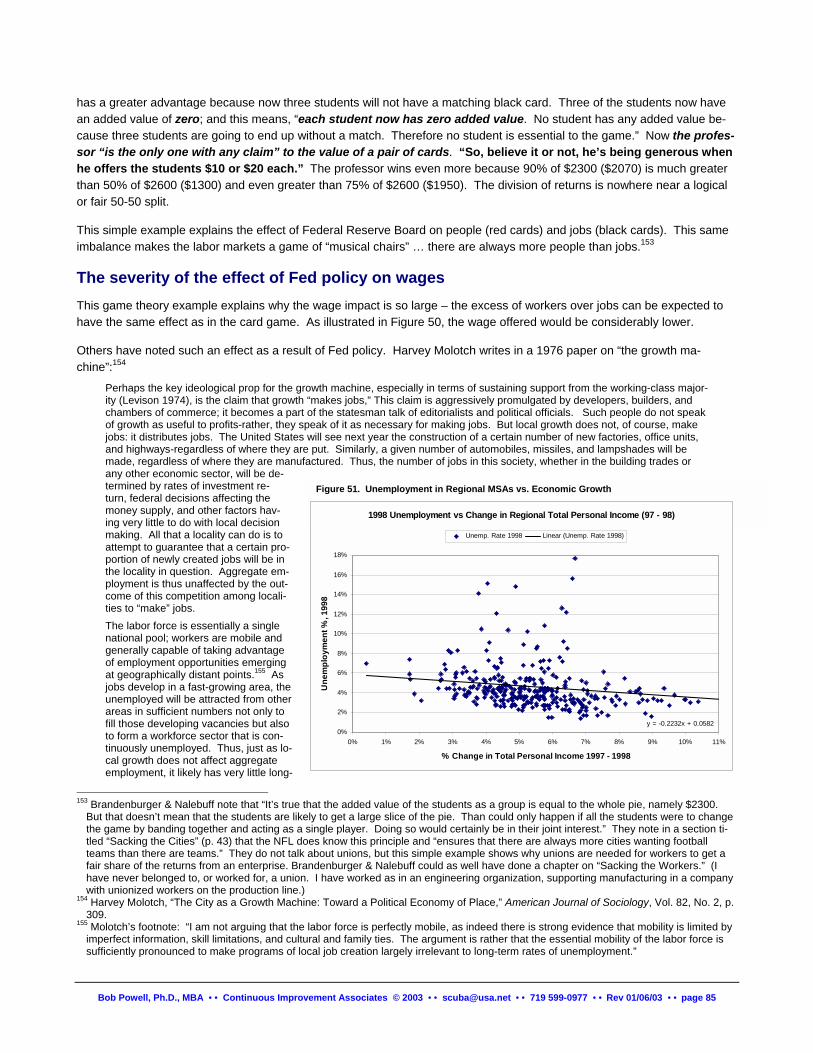
has a greater advantage because now three students will not have a matching black card. Three of the students now have an added value of zero; and this means, “each student now has zero added value. No student has any added value be-cause three students are going to end up without a match. Therefore no student is essential to the game.” Now the profes-sor “is the only one with any claim” to the value of a pair of cards. “So, believe it or not, he’s being generous when he offers the students $10 or $20 each.” The professor wins even more because 90% of $2300 ($2070) is much greater than 50% of $2600 ($1300) and even greater than 75% of $2600 ($1950). The division of returns is nowhere near a logical or fair 50-50 split.
This simple example explains the effect of Federal Reserve Board on people (red cards) and jobs (black cards). This same imbalance makes the labor markets a game of “musical chairs” … there are always more people than jobs.153
The severity of the effect of Fed policy on wages This game theory example explains why the wage impact is so large – the excess of workers over jobs can be expected to have the same effect as in the card game. As illustrated in Figure 50, the wage offered would be considerably lower.
Others have noted such an effect as a result of Fed policy. Harvey Molotch writes in a 1976 paper on “the growth ma-chine”:154
Perhaps the key ideological prop for the growth machine, especially in terms of sustaining support from the working-class major-ity (Levison 1974), is the claim that growth “makes jobs,” This claim is aggressively promulgated by developers, builders, and chambers of commerce; it becomes a part of the statesman talk of editorialists and political officials. Such people do not speak of growth as useful to profits-rather, they speak of it as necessary for making jobs. But local growth does not, of course, make jobs: it distributes jobs. The United States will see next year the construction of a certain number of new factories, office units, and highways-regardless of where they are put. Similarly, a given number of automobiles, missiles, and lampshades will be made, regardless of where they are manufactured. Thus, the number of jobs in this society, whether in the building trades or any other economic sector, will be de-termined by rates of investment re-turn, federal decisions affecting the money supply, and other factors hav-ing very little to do with local decision making. All that a locality can do is to attempt to guarantee that a certain pro-portion of newly created jobs will be in the locality in question. Aggregate em-ployment is thus unaffected by the out-come of this competition among locali-ties to “make” jobs.
1998 Unemployment vs Change in Regional Total Personal Income (97 - 98)
y = -0.2232x + 0.05820%
2%
4%
6%
8%
10%
12%
14%
16%
18%
0% 1% 2% 3% 4% 5% 6% 7% 8% 9% 10% 11%
% Change in Total Personal Income 1997 - 1998
Une
mpl
oym
ent %
, 199
8
Unemp. Rate 1998 Linear (Unemp. Rate 1998)
Figure 51. Unemployment in Regional MSAs vs. Economic Growth
The labor force is essentially a single national pool; workers are mobile and generally capable of taking advantage of employment opportunities emerging at geographically distant points.155 As jobs develop in a fast-growing area, the unemployed will be attracted from other areas in sufficient numbers not only to fill those developing vacancies but also to form a workforce sector that is con-tinuously unemployed. Thus, just as lo-cal growth does not affect aggregate employment, it likely has very little long-
153 Brandenburger & Nalebuff note that “It’s true that the added value of the students as a group is equal to the whole pie, namely $2300.
But that doesn’t mean that the students are likely to get a large slice of the pie. Than could only happen if all the students were to change the game by banding together and acting as a single player. Doing so would certainly be in their joint interest.” They note in a section ti-tled “Sacking the Cities” (p. 43) that the NFL does know this principle and “ensures that there are always more cities wanting football teams than there are teams.” They do not talk about unions, but this simple example shows why unions are needed for workers to get a fair share of the returns from an enterprise. Brandenburger & Nalebuff could as well have done a chapter on “Sacking the Workers.” (I have never belonged to, or worked for, a union. I have worked as in an engineering organization, supporting manufacturing in a company with unionized workers on the production line.)
154 Harvey Molotch, “The City as a Growth Machine: Toward a Political Economy of Place,” American Journal of Sociology, Vol. 82, No. 2, p. 309.
155 Molotch’s footnote: “I am not arguing that the labor force is perfectly mobile, as indeed there is strong evidence that mobility is limited by imperfect information, skill limitations, and cultural and family ties. The argument is rather that the essential mobility of the labor force is sufficiently pronounced to make programs of local job creation largely irrelevant to long-term rates of unemployment.”
Bob Powell, Ph.D., MBA • • Continuous Improvement Associates © 2003 • • [email protected] • • 719 599-0977 • • Rev 01/06/03 • • page 85
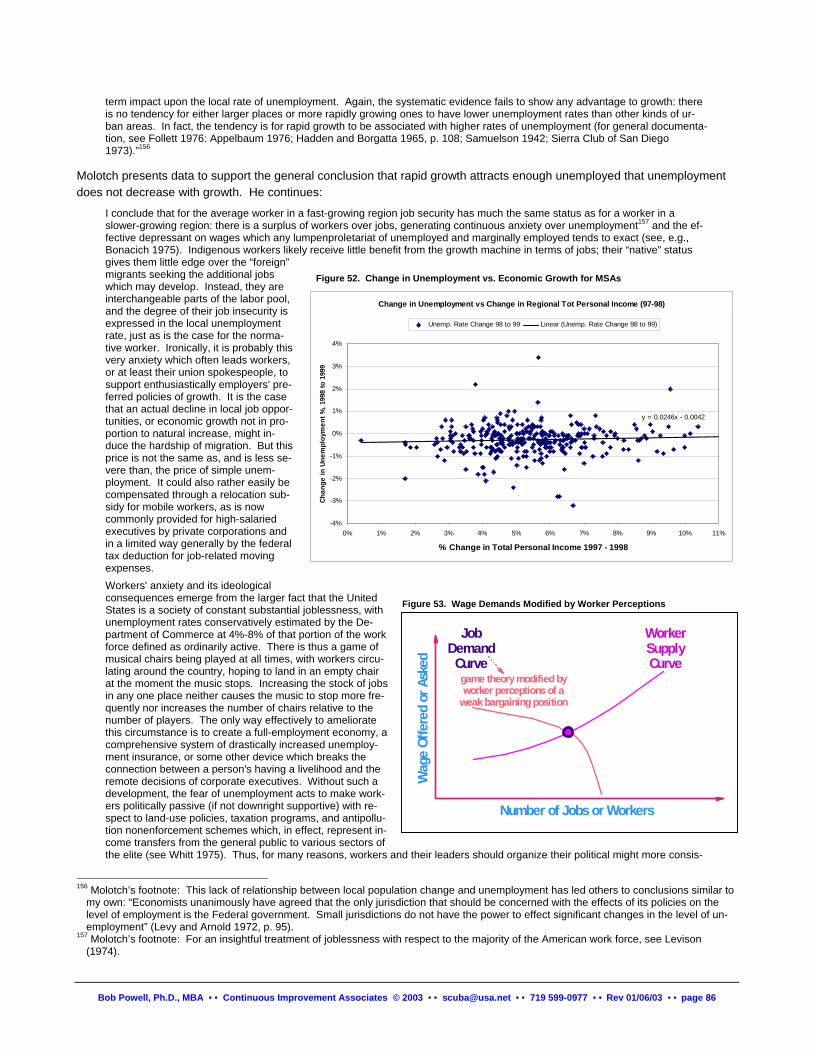
term impact upon the local rate of unemployment. Again, the systematic evidence fails to show any advantage to growth: there is no tendency for either larger places or more rapidly growing ones to have lower unemployment rates than other kinds of ur-ban areas. In fact, the tendency is for rapid growth to be associated with higher rates of unemployment (for general documenta-tion, see Follett 1976: Appelbaum 1976; Hadden and Borgatta 1965, p. 108; Samuelson 1942; Sierra Club of San Diego 1973).”156
Molotch presents data to support the general conclusion that rapid growth attracts enough unemployed that unemployment does not decrease with growth. He continues:
I conclude that for the average worker in a fast-growing region job security has much the same status as for a worker in a slower-growing region: there is a surplus of workers over jobs, generating continuous anxiety over unemployment157 and the ef-fective depressant on wages which any lumpenproletariat of unemployed and marginally employed tends to exact (see, e.g., Bonacich 1975). Indigenous workers likely receive little benefit from the growth machine in terms of jobs; their “native” status gives them little edge over the “foreign” migrants seeking the additional jobs which may develop. Instead, they are interchangeable parts of the labor pool, and the degree of their job insecurity is expressed in the local unemployment rate, just as is the case for the norma-tive worker. Ironically, it is probably this very anxiety which often leads workers, or at least their union spokespeople, to support enthusiastically employers' pre-ferred policies of growth. It is the case that an actual decline in local job oppor-tunities, or economic growth not in pro-portion to natural increase, might in-duce the hardship of migration. But this price is not the same as, and is less se-vere than, the price of simple unem-ployment. It could also rather easily be compensated through a relocation sub-sidy for mobile workers, as is now commonly provided for high-salaried executives by private corporations and in a limited way generally by the federal tax deduction for job-related moving expenses.
Change in Unemployment vs Change in Regional Tot Personal Income (97-98)
y = 0.0246x - 0.0042
-4%
-3%
-2%
-1%
0%
1%
2%
3%
4%
0% 1% 2% 3% 4% 5% 6% 7% 8% 9% 10% 11%
% Change in Total Personal Income 1997 - 1998
Chan
ge in
Une
mpl
oym
ent %
, 199
8 to
199
9Unemp. Rate Change 98 to 99 Linear (Unemp. Rate Change 98 to 99)
Figure 52. Change in Unemployment vs. Economic Growth for MSAs
Workers' anxiety and its ideological consequences emerge from the larger fact that the United States is a society of constant substantial joblessness, with unemployment rates conservatively estimated by the De-partment of Commerce at 4%-8% of that portion of the work force defined as ordinarily active. There is thus a game of musical chairs being played at all times, with workers circu-lating around the country, hoping to land in an empty chair at the moment the music stops. Increasing the stock of jobs in any one place neither causes the music to stop more fre-quently nor increases the number of chairs relative to the number of players. The only way effectively to ameliorate this circumstance is to create a full-employment economy, a comprehensive system of drastically increased unemploy-ment insurance, or some other device which breaks the connection between a person's having a livelihood and the remote decisions of corporate executives. Without such a development, the fear of unemployment acts to make work-ers politically passive (if not downright supportive) with re-spect to land-use policies, taxation programs, and antipollu-tion nonenforcement schemes which, in effect, represent in-come transfers from the general public to various sectors of the elite (see Whitt 1975). Thus, for many reasons, workers and their leaders should organize their political might more consis-
WorkerSupplyCurve
JobDemand
Curvegame theory modified by worker perceptions of a
weak bargaining position
Wag
e O
ffer
ed o
r As
ked
Number of Jobs or Workers
Figure 53. Wage Demands Modified by Worker Perceptions
156 Molotch’s footnote: This lack of relationship between local population change and unemployment has led others to conclusions similar to
my own: “Economists unanimously have agreed that the only jurisdiction that should be concerned with the effects of its policies on the level of employment is the Federal government. Small jurisdictions do not have the power to effect significant changes in the level of un-employment” (Levy and Arnold 1972, p. 95).
157 Molotch’s footnote: For an insightful treatment of joblessness with respect to the majority of the American work force, see Levison (1974).
Bob Powell, Ph.D., MBA • • Continuous Improvement Associates © 2003 • • [email protected] • • 719 599-0977 • • Rev 01/06/03 • • page 86
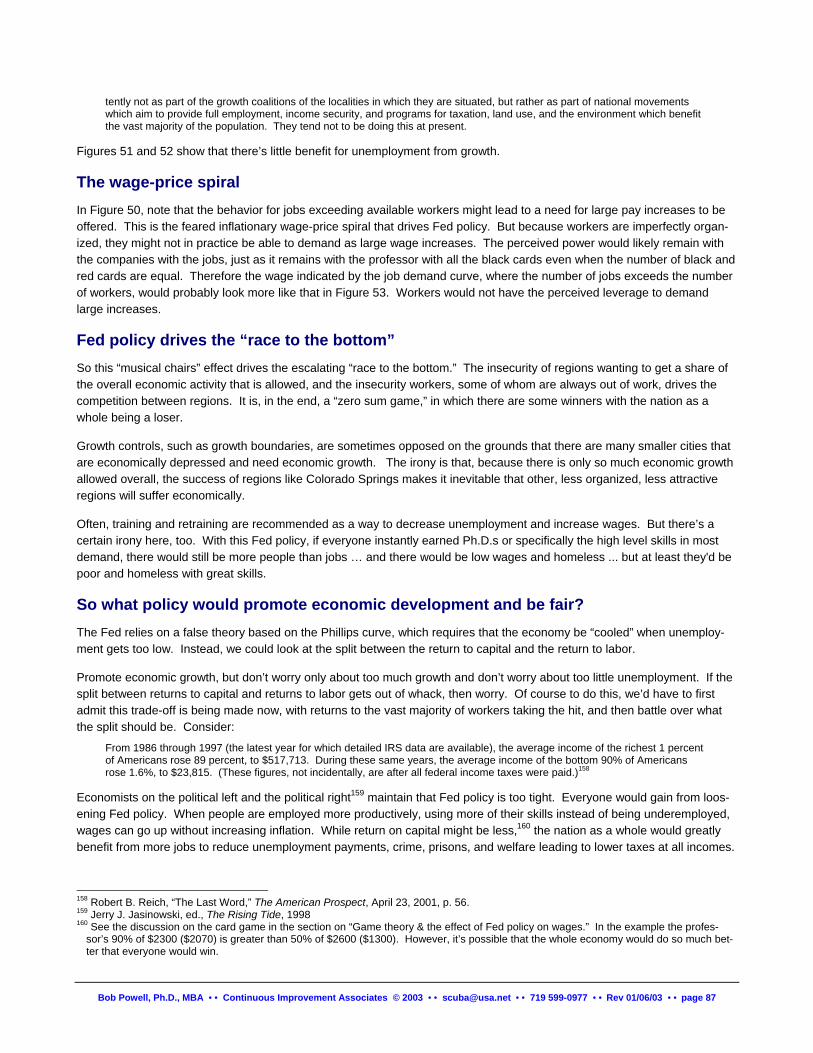
tently not as part of the growth coalitions of the localities in which they are situated, but rather as part of national movements which aim to provide full employment, income security, and programs for taxation, land use, and the environment which benefit the vast majority of the population. They tend not to be doing this at present.
Figures 51 and 52 show that there’s little benefit for unemployment from growth.
The wage-price spiral In Figure 50, note that the behavior for jobs exceeding available workers might lead to a need for large pay increases to be offered. This is the feared inflationary wage-price spiral that drives Fed policy. But because workers are imperfectly organ-ized, they might not in practice be able to demand as large wage increases. The perceived power would likely remain with the companies with the jobs, just as it remains with the professor with all the black cards even when the number of black and red cards are equal. Therefore the wage indicated by the job demand curve, where the number of jobs exceeds the number of workers, would probably look more like that in Figure 53. Workers would not have the perceived leverage to demand large increases.
Fed policy drives the “race to the bottom” So this “musical chairs” effect drives the escalating “race to the bottom.” The insecurity of regions wanting to get a share of the overall economic activity that is allowed, and the insecurity workers, some of whom are always out of work, drives the competition between regions. It is, in the end, a “zero sum game,” in which there are some winners with the nation as a whole being a loser.
Growth controls, such as growth boundaries, are sometimes opposed on the grounds that there are many smaller cities that are economically depressed and need economic growth. The irony is that, because there is only so much economic growth allowed overall, the success of regions like Colorado Springs makes it inevitable that other, less organized, less attractive regions will suffer economically.
Often, training and retraining are recommended as a way to decrease unemployment and increase wages. But there’s a certain irony here, too. With this Fed policy, if everyone instantly earned Ph.D.s or specifically the high level skills in most demand, there would still be more people than jobs … and there would be low wages and homeless ... but at least they'd be poor and homeless with great skills.
So what policy would promote economic development and be fair? The Fed relies on a false theory based on the Phillips curve, which requires that the economy be “cooled” when unemploy-ment gets too low. Instead, we could look at the split between the return to capital and the return to labor.
Promote economic growth, but don’t worry only about too much growth and don’t worry about too little unemployment. If the split between returns to capital and returns to labor gets out of whack, then worry. Of course to do this, we’d have to first admit this trade-off is being made now, with returns to the vast majority of workers taking the hit, and then battle over what the split should be. Consider:
From 1986 through 1997 (the latest year for which detailed IRS data are available), the average income of the richest 1 percent of Americans rose 89 percent, to $517,713. During these same years, the average income of the bottom 90% of Americans rose 1.6%, to $23,815. (These figures, not incidentally, are after all federal income taxes were paid.)158
Economists on the political left and the political right159 maintain that Fed policy is too tight. Everyone would gain from loos-ening Fed policy. When people are employed more productively, using more of their skills instead of being underemployed, wages can go up without increasing inflation. While return on capital might be less,160 the nation as a whole would greatly benefit from more jobs to reduce unemployment payments, crime, prisons, and welfare leading to lower taxes at all incomes.
158 Robert B. Reich, “The Last Word,” The American Prospect, April 23, 2001, p. 56. 159 Jerry J. Jasinowski, ed., The Rising Tide, 1998 160 See the discussion on the card game in the section on “Game theory & the effect of Fed policy on wages.” In the example the profes-
sor’s 90% of $2300 ($2070) is greater than 50% of $2600 ($1300). However, it’s possible that the whole economy would do so much bet-ter that everyone would win.
Bob Powell, Ph.D., MBA • • Continuous Improvement Associates © 2003 • • [email protected] • • 719 599-0977 • • Rev 01/06/03 • • page 87
Appendix III. Colorado Springs official position on impact fees DATE: March 20, 2001 TO: Pat Kelly, City Attorney FROM: M. Allen Ziegler, Jr., Assistant City Attorney SUBJECT: Fiscal Impact Analysis E-mail from Jann Nance In her e-mail to City Council, Ms. Nance states that "What about the requirement of FIAs (Fiscal Impact Analysis) for ALL MASTER PLANS? Has ordinance 97-109, 14.1-4-508.G been repealed or just conveniently ignored?" The reference to § 14.1-508 G. is a reference to the Fiscal subsection (F) listed under the review criteria for master plans under § 14.1-4-508 of the Zoning Code. The fiscal review criteria need to be examined in the context of the nature of master plans. As noted in § 14.1-4-501 of the Zoning Code, '[t]he master plan is legislative in nature and provides advisory land use and development guidelines to be used by the Planning Commission and the City Council in their review of applications for rezoning, plats, or other land de-velopment review provided for in this Zoning Code and Chapter 15 of the City Code." As a master plan is advisory in na-ture, it guides development rather than imposes specific requirements such as those imposed under zoning, development plan requirements and under the Subdivision Code. Section 14.1-4-508 of the Zoning Code relating to master plans entitled "Review Criteria" provides in part:
Master plans, amendments to approved master plans and the periodic examination of master plans shall be reviewed for substantial conformance with the criteria listed below. Conformance with these criteria shall be construed to constitute a community benefit. With regard to fiscal impact, it is recognized that the City has significant flexibility in assessing fiscal impact for master plans submitted as part of an annexation rather than for those master plans covering property already within the corporate boundaries.
(Emphasis added) Section 14.1-4-508(F) of the Zoning Code lists fiscal review criteria for master plans:
F. Fiscal
1. The cost of off-site impacts on public facilities attributable to the master plan is not borne by the general community. Existing infrastructure capacity and service levels shall be used as a basis for determining impact attributable to the master plan. Costs shall be determined for full build out and for phases of development, as appropriate.
2. The fiscal impact analysis demonstrates no adverse impact upon the general community.
3. Special agreements for public improvements and maintenance are shown to be workable and are based on proportional need generated by the master plan.
4. Off-site impacts generated by adoption of the master plan shall not exceed the capacity of existing public facilities. Pre-existing and/or anticipated capacity problems not attributable to the master plan shall be identified as part of the analysis.
5. In those situations where off-site impacts attributable to the master plan are shown to exceed the ca-pacity of existing public facilities, the applicant must demonstrate some means of increasing the ca-pacity of said public facilities proportionate to the impact generated by the proposed master plan. This may include, but not be limited to, planned expansions to the facility, amendments to the master
Bob Powell, Ph.D., MBA • • Continuous Improvement Associates © 2003 • • [email protected] • • 719 599-0977 • • Rev 01/06/03 • • page 88
plan, phasing of the master plan and/or special agreements related to construction and/or mainte-nance of infrastructure upgrades and/or expansion.
The significance of the highlighted portion of the Review Criteria is that with master plans that are submitted in conjunc-tion with annexations, the City may negotiate pursuant to an annexation agreement conditions that could not otherwise be legally required. As noted in the City of Colorado Springs v. Kitty Hawk Development Co., 154 Colo. 535, 392 P.2d 467, 472 (Colo. 1964), "A municipality is under no legal obligation in the first instance to annex contiguous territory, and may reject a petition for annexation for no reason at all. It follows then that if the municipality elects to accept such territory solely as a matter of its discretion, it may impose such conditions by way of agreement as it sees fit." However, for property that is already within the municipal boundaries, the City is not free to exact any condition that it can negotiate pursuant to an agreement. For property that is already within the City limits, the City is limited to exaction requirements permitted by law which meet constitutional standards of rational nexus and rough proportionality as set forth in cases such as Nollan v. California Coastal Commission, 483 US 825 (1987) and Dolan v. City of Tigard, 114 S.Ct. 2309 (1994). These standards have now been codified as statutory law in Colorado under part 2 of article 20 of title 29 C.R.S. Section 29-20-203 C.R.S. which pro-vides:
"Conditions on land-use approvals. (1) In imposing conditions upon the granting of land-use approvals, no local government shall
require an owner of private property to dedicate real property to the public, or pay money to a public en-tity in an amount that is determined on an individual and discretionary basis, unless there is an essential nexus between the dedication or payment and a legitimate local government interest, and the dedication or payment is roughly proportional both in nature and extent to the impact of the proposed use or devel-opment of such property. The section shall not apply to any legislatively formulated assessment, fee, or charge that is imposed on a broad class of property owners by a local government.
(2) No local government shall impose any discretionary condition upon a land-use approval un-less the condition is based upon duly adopted standards that are sufficiently specific to ensure that the condition is imposed in a rational and consistent manner."
The City is limited to exactions that meet constitutional and statutory requirements. The purpose served by fiscal impact requirements must be read in terms of these limitations. The City currently imposes certain exactions and fees under its Subdivision Code including fees such as park fees, school fees, and drainage fees. Except for significant annexation, the City has not generally required fiscal analysis for master plan amendments because of the cost and complexity of such analysis, the constitutional and statutory limitations noted above, the requirements for ex-actions which already exist under other City codes as noted above, and the City's review system under which various City units and Colorado Springs Utilities' departments comment upon proposed master plan and other land use applications dur-ing the review process. Furthermore, the City can only fund a part of infrastructure requirements from exactions which can be legally imposed upon developers. In conclusion, considering the limitations set forth in the "Review Criteria," and statutory and constitutional limitations as discussed above, requiring a fiscal impact analysis only in conjunction with significant annexations of property to the City is justified. Sincerely, FOR THE CITY ATTORNEY By:_________________________________
M. Allen Ziegler, Jr. Assistant City Attorney
Bob Powell, Ph.D., MBA • • Continuous Improvement Associates © 2003 • • [email protected] • • 719 599-0977 • • Rev 01/06/03 • • page 89
Appendix IV. Donella Meadows on Growth This appendix contains Donella Meadows’ obituary, an editorial in the Burlington Free Press following her death, and four of her columns on Sprawl and Growth.
Obituary - Donella Meadows Donella H. Meadows, 59, a pioneering environmental scientist and writer, died Tuesday, 2/20/01, in New Hampshire after a brief ill-ness. She was best known to the world as the lead author of the international bestselling book The Limits to Growth, published in 1972. The book, which reported on a study of long-term global trends in population, economics, and the environment, sold millions of copies and was translated into 28 languages. She was also the lead author of the twenty-year follow-up study, Beyond the Limits (1992), with original co-authors Dennis Meadows and Jxrgen Randers.
Professor Meadows, known as "Dana" to friends and colleagues, was a leading voice in what has become known as the "sustainabil-ity movement," an international effort to reverse damaging trends in the environment, economy, and social systems. Her work is widely recognized as a formative influence on hundreds of other academic studies, government policy initiatives, and international agree-ments.
Dana Meadows was also a devoted teacher of environmental sys-tems, ethics, and journalism to her students at Dartmouth College in Hanover, New Hampshire, where she taught for 29 years. In ad-dition to her many original contributions to systems theory and global trend analysis, she managed a small farm and was a vibrant member of her local community. Genuinely unconcerned with her international fame, she often referred to herself simply as "a farmer and a writer."
Donella Meadows was born March 13, 1941 in Elgin, Illinois, and educated in science, earning a B.A. in chemistry from Carleton Col-lege in 1963 and a Ph.D. in biophysics from Harvard University in 1968. As a research fellow at Massachusetts Institute of Technol-ogy, she was a protege of Jay Forrester, the inventor of system dy-namics as well as the principle of magnetic data storage for com-puters.
In 1972 she was on the MIT team that produced the global com-puter model "World3" for the Club of Rome and provided the basis
for The Limits to Growth. The book made headlines around the world, and began a debate about the limits of the Earth's capacity to support human economic expansion, a debate that continues to this day. Her writing - appearing most often in the form of a weekly column called "The Global Citizen," nominated for the Pulitzer Prize in 1991 -- has been published regularly in the international press since that time.
In 1981, together with her former husband Dennis Meadows, Donella Meadows founded the International Network of Resource Information Centers (INRIC), also called the Balaton Group (after the lake in Hungary where the group meets annually). The group built early and critical avenues of exchange between scientists on both sides of the Iron Curtain at the height of the Cold War.
As the Balaton Group's coordinator for eighteen years, she facili-tated what grew to become an unusually effective global process of information sharing and collaboration among hundreds of leading academics, researchers, and activists in the broader sustainability movement. Professor Meadows also served on many national and international boards and scientific committees, and taught and lec-tured all over the world. She was recognized as a 1991 Pew Scholar and as a 1994 MacArthur Fellow for her work. In 1992 the Swiss Federal Institute of Technology (ETH) presented her with an honorary doctorate.
In 1997, Professor Meadows founded the Sustainability Institute, which she described as a "think-do-tank." The Institute combines cutting edge research in global systems with practical demonstra-tions of sustainable living, including the development of an ecologi-cal village and organic farm in Hartland Four Corners, Vermont.
Donella Meadows is survived by her mother, Phoebe Quist of Tah-lequah Oklahoma; her father, Don Hager of the Chicago area; a brother, Jason Hager, of Wisconsin; cousins and nephews; and a large community of colleagues and friends, both international and local, in the organizations that she founded and assisted.
Donella Meadows, RIP The world's environment has lost a friend. Editorial Thursday, February 22, 2001 http://www.burlingtonfreepress.com/editorial/thursday/1000h.htm
Donella Meadows, noted professor, writer and advocate for nature, died Wednesday after a two-week illness. She was 59. Her achievements, however, will long endure. In all her endeavors she sought to find allies for the environment, to foster greater sensi-tivity among readers and students, and to kindle hope for a better balance between human activity and its global impact. Dana, as she was known to friends, won wide acclaim for her best-seller, "The Limits to Growth." Translated into 28 languages, the book used hard data to determine how much longer the earth could withstand the impacts of human growth at current trends. Readers of this page, however, are probably best acquainted with her weekly column, "The Global Citizen," which we have been proud to publish for several years. While those commentaries made no effort to conceal a bleeding heart's love of nature, they had the greater merit that results when sentiment is supported by hard facts.
When she opined about the globe's natural limits to human popula-tion growth, for example, she was a fount of statistics about ozone depletion, the collapse of fisheries, the thinning of polar ice. Mead-ows' vigorous research gave her credibility, made her hard to de-bate, and won her a readership among people on all sides of envi-ronmental issues. Her other essential attribute was optimism. Although her observa-tions about lost habitat and climate change were often dire, she welcomed technological advances that reduced the impact of hu-man activities like energy generation and transportation. She en-couraged the nation's universities to use their clout and research capacity to increase progress in these efforts. Foremost, she insisted on encouraging readers' hope for reversing consumption and land use trends that damage the planet, because she saw despair as a guarantee of only the worst possible out-come.
Bob Powell, Ph.D., MBA • • Continuous Improvement Associates © 2003 • • [email protected] • • 719 599-0977 • • Rev 01/06/03 • • page 90
Ironically, foes of regulation seized on Meadows' criticism of Ver-mont's growth control laws in a column last year. They overlooked her simultaneous defense of environmental values, a credo Mead-ows embodied in her own life -- for 27 years on an organic farm in Plainfield, N.H., and then in a co-housing community in Hartland, Vermont.
Before the human race can respect this planet, it must learn what is at stake and why it matters. Dana Meadows was an articulate edu-cator in this cause, a scholar and poet who was unafraid to use both her mind and her heart.
I believe the column referenced above is this one, if you wish to read it:: http://iisd1.iisd.ca/pcdf/meadows/act250.html. “An Environmentalist Encounters an Environmental Law” Donella Meadows The Global Citizen, September 14, 2000. Her columns can be found at: http://iisd1.iisd.ca/pcdf/meadows/default.htm. The site which takes you to her columns is: http://www.sustainer.org/
Sprawl By Any Other Name Is Still Out of Control Donella Meadows' The Global Citizen, February 18, 1999 http://iisd1.iisd.ca/pcdf/meadows/sprawl.html
This time around the hot term is "sprawl." During previous out-breaks of concern about America's spreading cities it was "strip de-velopment" or "slurbs" or simply "the growth problem." Whatever we call it, we worry about it toward the end of every eco-nomic boom and try to stimulate it again during every recession. We try to control it with zoning, impact fees, urban growth bounda-ries, conservation easements, growth moratoria. We don't come close to succeeding. Drive around Oregon after 25 years of urban growth boundaries, or Vermont after almost 30 years of Act 250 development review, or Maryland with its "smart growth" program. They look much like the rest of the nation. Shopping centers, fast-food strips, traffic jams. Prime farmland turning into suburbs while inner cities stagnate. Trophy houses sitting proudly on five-acre lawns. Longer com-mutes, more roads, less nature, polluted air, rising local taxes, miles of ugliness. We "develop" 160 acres of land in the United States every hour. Much of it is prime farm land. At the current rate of loss, California's cropland will be half gone in 20 more years. One-fourth of the land lost to sprawl becomes road or parking place. The number of vehi-cles is growing six times faster than the number of people. When something keeps happening that no one much likes, and it happens in many different places, and it goes on happening de-spite all kinds of measures intended to stop it, and we all do things -- shop at the malls, move our families further out of town -- that contribute to the mess, though we know we're contributing to the mess, then we don't have a simple policy problem, we have a sys-tem dysfunction. If we want to fix it, not only do we have to do things differently, we have to think differently, so differently that we create a different system. Tinkering a bit, raising a tax here, throw-ing in a subsidy there, downzoning here, buying open space there, is not enough. I've seen only one contribution to the recent sprawl discussion that begins to attack the problem at the level of complete re-thinking. It's a book called Better, Not Bigger (New Society Publishers, 1999) by Eben Fodor, a city planner (not a development planner, he carefully notes) from Oregon. To treat you to just one excerpt from this book, here's the quiz with which it starts: 1. How much more traffic congestion would you like in your com-munity? A. There is already plenty of traffic, thanks. B. Just a little bit more, please. C.A whole lot more.
2. How much more air and water pollution would you prefer? A. We have too much already. B. Just a little more pollution, please. C. Give me toxic soup! 3. How much more farmland and open space do you want to be developed? A. It would be nice if we could save what we have left. B. I suppose we have to sacrifice this land in the name of "pro-
gress." C. I can't bear the sight of undeveloped land going to waste. 4.How much higher do you want your taxes to go? A. For what I'm getting, I think I'm paying enough already. B. I'm happy to pay more, even if I can't see any benefits. 5. How much more of your local natural resources (fresh water, electric power supply, forests, aggregates and minerals) do you want consumed? A. I'd like to conserve our natural resources and use them as ef-
ficiently as possible. B. We have to sacrifice our resources to create prosperity. C. We should sell all our natural resources for a quick buck. 6. Would you prefer that your city government continue to subsidize new development, or should they use the money to fund schools, extend library hours, offer day care at community centers, create cultural and recreational programs, and still have enough left over for a tax cut? A. I'll take the expanded services and the tax cut, please. B. Let's keep the development fire stoked with my tax dollars. 7. How much bigger do you want your community to be? A. It's already big enough. B. Let's just keep growing and see what happens! C. I love big cities but am too lazy to move to one. This quiz seems funny, because it so blatantly points to the obvi-ous, all-around-us, elephant-in-the-living room negative effects of sprawl that we never hear about in the boosterism for the next mall or condo complex. We never hear about them because they call into question the myths that create and fuel the urban growth sys-tem. The greatest of these myths is the idea that all growth is al-ways good for all of us. The myths are listed in Fodor's book. I'll go into them in next week's column. The reasons why the myths not only persist but are ac-tively promoted will make up the following column. What to do to create a better system will be the column after that.
Urban Growth Means Lower Taxes – and Other Myths Donella Meadows' The Global Citizen, February 25, 1999 http://iisd1.iisd.ca/pcdf/meadows/sprawl2.html
We need to bring in business to bring down taxes. This develop-ment will give us jobs. Environmental protection will hurt the econ-omy. Growth is good for us.
If we've heard those arguments once, we've heard them a thou-sand times, stated with utmost certainty and without the slightest
Bob Powell, Ph.D., MBA • • Continuous Improvement Associates © 2003 • • [email protected] • • 719 599-0977 • • Rev 01/06/03 • • page 91
evidence. That's because there is no evidence. Or rather, there is plenty of evidence, most of which disproves these deeply held pro-growth beliefs. Here is a short summary of some of the evidence. For more, see Eben Fodor's new book Better, Not Bigger, which lists and debunks the following "Twelve Big Myths of Growth." Myth 1: Growth provides needed tax revenues. Check out the tax rates of cities larger than yours. There are a few exceptions but the general rule is: the larger the city, the higher the taxes. That's be-cause development requires water, sewage treatment, road main-tenance, police and fire protection, garbage pickup -- a host of pub-lic services. Almost never do the new taxes cover the new costs. Fodor says, "the bottom line on urban growth is that it rarely pays its own way." Myth 2: We have to grow to provide jobs. But there's no guarantee that new jobs will go to local folks. In fact they rarely do. If you compare the 25 fastest growing cities in the U.S. to the 25 slowest growing, you find no significant difference in unemployment rates. Says Fodor: "Creating more local jobs ends up attracting more people, who require more jobs." Myth 3: We must stimulate and subsidize business growth to have good jobs. A "good business climate" is one with little regulation, low business taxes, and various public subsidies to business. A study of areas with good and bad business climates (as ranked by the U.S. Chamber of Commerce and the business press) showed that states with the best business ratings actually have lower growth in per capita incomes than those with the worst. Fodor: "This surprising outcome may be due to the emphasis placed by good-business-climate states on investing resources in businesses rather than directly in people." Myth 4: If we try to limit growth, housing prices will shoot up. Sounds logical, but it isn't so. A 1992 study of 14 California cities, half with strong growth controls, half with none, showed no differ-ence in average housing prices. Some of the cities with strong growth controls had the most affordable housing, because they had active low-cost housing programs. Fodor says the important factor in housing affordability is not so much house cost as income level, so development that provides mainly low-paying retail jobs makes housing unaffordable. Myth 5: Environmental protection hurts the economy. According to a Bank of America study the economies of states with high envi-ronmental standards grew consistently faster than those with weak regulations. The Institute of Southern Studies ranked all states ac-cording to 20 indicators of economic prosperity (gold) and environ-mental health (green) and found that they rise and fall together. Vermont ranked 3rd on the gold scale and first on the green, while Louisiana ranked 50th on both.
Myth 6: Growth is inevitable. There are constitutional limits to the ability of any community to put walls around itself. But dozens of municipalities have capped their population size or rate of growth by legal regulations based on real environmental limits and the real costs of growth to the community. Myth 7: If you don't like growth, you're a NIMBY (Not In My Back-yard) or an ANTI (against everything) or a gangplank-puller (right after you get aboard). These accusations are meant more to shut people up than to examine their real motives. Says Fodor, "A NIMBY is more likely to be someone who cares enough about the future of his or her community to get out and protect it." Myth 8: Most people don't support environmental protection. Polls and surveys have disproved this belief for decades; Fodor cites ex-amples from Oregon, Los Angeles, Colorado, and the U.S. as a whole. The fraction of respondents who say environmental quality is more important than further economic growth almost always tops 70 percent. Myth 9: We have to grow or die. This statement is tossed around lightly and often, but if you hold it still and look at it, you wonder what it means. Fodor points out, quoting several economic studies, that many kinds of growth cost more than the benefits they bring. So the more growth, the poorer we get. That kind of growth will kill us. Myth 10: Vacant land is just going to waste. Studies from all over show that open land pays far more -- often twice as much -- in property taxes than it costs in services. Cows don't put their kids in school; trees don't put potholes in the roads. Open land absorbs floods, recharges aquifers, cleans the air, harbors wildlife, and measurably increases the value of property nearby. We should pay it for to be there. Myth 11: Beauty is no basis for policy. One of the saddest things about municipal meetings is their tendency to trivialize people who complain that a proposed development will be ugly. Dollars are not necessarily more real or important than beauty. In fact beauty can translate directly into dollars. For starters, undeveloped surround-ings can add $100,000 to the price of a home. Myth 12: Environmentalists are just another special interest. A de-veloper who will directly profit from a project is a special interest. A citizen with no financial stake is fighting for the public interest, the long term, the good of the whole community. Maybe one reason these myths are proclaimed so often and loudly is that they are so obviously doubtful. The only reason to keep re-peating something over and over is to keep others from thinking about it. You don't have to keep telling people that the sun rises in the east. There are reasons why some of us want others of us to believe the myths of urban growth. More on that next time.
If We Don't Like Sprawl, Why Do We Go On Sprawling? Donella Meadows' The Global Citizen, March 4, 1999 http://iisd1.iisd.ca/pcdf/meadows/sprawl3.html
We have planning boards. We have zoning regulations. We have urban growth boundaries and "smart growth" and sprawl confer-ences. And we still have sprawl. Between 1970 and 1990 the popu-lation of Chicago grew by four percent; its developed land area grew by 46 percent. Over the same period Los Angeles swelled 45 percent in population, 300 percent in settled area. Sprawl costs us more than lost farmland and daily commutes through landscapes of stunning ugliness. It costs us dollars, bucks straight out of our pockets, in the form of higher local taxes. That's because our pattern of municipal growth, especially land-intensive city-edge growth, consistently costs more in public services than it pays in taxes.
In his new book Better Not Bigger, Eben Fodor cites study after study showing how growth raises taxes. In Loudon County, Vir-ginia, each new house on a quarter-acre lot adds $705 per year to a town budget (in increased garbage collection, road maintenance, etc. minus increased property tax). On a five-acre lot a new house costs the community $2232 per year. In Redmond, Washington, single-family houses pay 21 percent of property tax but account for 29 percent of the city budget. A study in California's Central Valley calculated that more compact development could save municipali-ties 500,000 acres of farmland and $1.2 billion in taxes. There are dozens of these studies. They all come to the same con-clusion. New subdivisions reach into the pockets of established residents to finance additional schools and services. Commercial
Bob Powell, Ph.D., MBA • • Continuous Improvement Associates © 2003 • • [email protected] • • 719 599-0977 • • Rev 01/06/03 • • page 92
and industrial developments sometimes pay more in taxes than they demand in services, but the traffic and pollution they generate reduces nearby property value. New employees don't want to live near the plant or strip, so they build houses and raise taxes in the NEXT town. Large, well-organized companies such as sports teams and Wal-Mart, push city governments to widen roads, pro-vide free water or sewage lines, offer property tax breaks, even build the stadium. Given all the evidence to the contrary, it's amazing how many of us still believe the myth that growth reduces taxes. But then, every myth springs from a seed of truth. Municipal growth does benefit some people. Real estate agents get sales, construction compa-nies get jobs, banks get more depositors and borrowers, newspa-pers get higher circulations, stores get more business (though they also get more and tougher competition). Landowners who sell to developers can make big money; developers can make even big-ger money. Those folks are every town's growth promoters. Eben Fodor calls them the "urban growth machine" and cites an example of how the machine is fueled. Imagine a proposed development that will cost a community $1,000,000 and bring in $500,000 in benefits. The $500,000 goes to ten people, $50,000 apiece. The $1,000,000 is charged to 100,000 people as a $10 tax increase. Who is going to focus full attention on this project, be at all the hearings, bring in lawyers, chat up city officials? Who is going to believe sincerely and claim loudly that growth is a good thing? Fodor quotes Oregon environmentalist Andy Kerr, who calls urban growth, "a pyramid scheme in which a relatively few make a killing, some others make a living, but most [of us] pay for it." As long as there is a killing to be made, no tepid "smart-growth" measures are going to stop sprawl. We will go on having strips and malls and cookie-cutter subdivisions and traffic jams and rising taxes as long as someone makes money from them.
We can't blame those who make the money. They're playing the game according to the rules, which are set mainly by the market, which rewards whomever is clever enough to put any cost of doing business onto someone else. They get the store profits, we build the roads. They hire the workers (paying as little as they can get away with, because the market requires them to cut costs), we sit in traffic jams and breathe the exhaust. They get jobs building the subdivision, we lose open lands, clean water, and wildlife. Then we subsidize them with our taxes. That, the tax subsidy, is not the market, it's local politics. Collectively we set out pots of subsidized honey at which they dip. We can't expect them not to dip; we can only expect them to howl if the subsidy is taken away. The "we-they" language in the previous paragraph isn't quite right. They may profit more than we do, but we flock to the stores with the low prices. We buy dream homes in the ever-expanding sub-urbs. We use the services of the growth machine. (With some equally amateur friends I'm trying to create a 22-unit eco-development, and I'm learning to appreciate the skills needed and the risks borne by developers.) We want our local builders and banks and stores and newspapers to thrive. So what can we do about this spreading mess, which handsomely rewards a few, which turns our surroundings into blight, which most of us hate but in which most of us are complicit -- and which we subsidize with our tax dollars? Concrete answers to that question take a long chapter in Fodor's book and will take another column here. The general answer is clear. Don't believe the myth that all growth is good. Ask hard ques-tions. Who will benefit from the next development scheme and who will pay? Are there better options, including undeveloped, protected land? How much growth can our roads, our land, our waters and air, our neighborhoods, schools and community support? Since we can't grow forever, where should we stop?
So What Can We Do -- Really Do -- About Sprawl? Donella Meadows' The Global Citizen, March 11, 1999 http://iisd1.iisd.ca/pcdf/meadows/sprawl4.html
In my mind St. Louis is the poster city for sprawl. It has a glittering, high-rise center where fashionable people work, shop and party. Surrounding the center are blocks and blocks of empty lots, aban-doned buildings, dying stores, a sad wasteland through which the fashionable people speed on wide highways to the suburbs. In the suburbs the subdivisions and shopping centers expand rapidly outward onto the world's best farmland. When I imagine the opposite of sprawl, I think of Oslo, Norway. Oslo rises halfway up the hills at the end of a fjord and then abruptly stops. What stops it is a huge public park, in which no pri-vate entity is allowed to build anything. The park is full of trails, lakes, playgrounds, picnic tables, and scattered huts where you can stop for a hot drink in winter or cold drink in summer. Tram lines radiate from the city to the park edges, so you can ride to the end of a line, ski or hike in a loop to the end of another line and ride home. That is a no-nonsense urban growth boundary. It forces develop-ment inward. There are no derelict blocks in Oslo. Space no longer useful for one purpose is snapped up for another. Urban renewal goes on constantly everywhere. There are few cars, because there's hardly any place to park and anyway most streets in the shopping district are pedestrian zones. Trams are cheap and fre-quent and go everywhere. The city is quiet, clean, friendly, attrac-tive and economically thriving. How could we make our cities more like Oslo and less like land-gulping, energy-intensive, half-empty St. Louis? There is a long list of things we could do. Eben Fodor, in his new book Better, Not Bigger (the most useful piece of writing on sprawl control I've seen) organizes them under two categories: taking the foot off the accel-
erator and applying the brake. The accelerator part comes from widespread public subsidies to sprawl. Fodor lists ten of them, which include: • Free or subsidized roads, sewer systems, water systems,
schools, etc. (Instead charge development impact fees high enough to be sure the taxes of present residents don't go up to provide public services for new residents.)
• Tax breaks, grants, free consulting services, and other hand-outs to attract new businesses. (There's almost never a good reason for the public to subsidize a private business, espe-cially not in a way that allows it to undercut existing busi-nesses.)
• Waiving environmental or land-use regulations. (Make the standards strong enough to protect everyone's air, water, views and safety and enforce those standards firmly and evenly.)
• Federally funded road projects. (The Feds pay the money, but the community puts up with the sprawl. And where do you think the Feds get the money?)
Urban growth accelerators make current residents pay (in higher taxes, lower services, more noise and pollution and traffic jams) for new development. There is no legal or moral reason why they should do that. Easing up on the accelerator should at least guar-antee that growth pays its own way. Applying the brake means setting absolute limits. There are some illegal reasons for wanting to do this: to protect special privilege, to keep out particular kinds of persons; to take private property for public purpose without fair compensation. There are also legal rea-
Bob Powell, Ph.D., MBA • • Continuous Improvement Associates © 2003 • • [email protected] • • 719 599-0977 • • Rev 01/06/03 • • page 93
sons: to protect watersheds or aquifers or farmland or open space, to force growth into places where public services can be efficiently delivered, to slow growth to a rate at which the community can ab-sorb it, to stop growth before land, water, or other resources fail. Fodor tells the stories of several communities that have limited their growth and lists many techniques they have used to do so. They include: • Growth boundaries and green belts like the one around Oslo. • Agricultural zoning. Given the world food situation, not another
square inch of prime soil should be built upon anywhere. • Infrastructure spending restrictions. Why should a Wal-Mart
that sucks in traffic force the public to widen the road? Let Wal-Mart do it, or let the narrow road limit the traffic.
• Downzoning. Usually met with screams of protest from people whose land values are reduced, though we never hear objec-tions when upzoning increases land values.
• Comprehensive public review of all aspects of a new devel-opment, such as required by Vermont's Act 250. Public pur-chase of development rights.
• Growth moratoria, growth rate limits, or absolute caps on mu-nicipal size, set by real resource limitations.
Boulder, Colorado, may be the American town that has most ap-plied growth controls, prompted by a sober look at the "build-out" implications of the city's zoning plan. Boulder voters approved a lo-cal sales tax used to acquire greenways around the city. A building height limitation protects mountain views. Building permits are lim-ited in number, many can be used only in the city center, and 75 percent of new housing permits must be allocated to affordable housing. Commercial and industrial land was downzoned with the realization that if jobs grow faster than housing, commuters from other towns will overload roads and parking facilities. All that and more is possible in any city. But controlling growth means more than fiddling at the margins, "accommodating" growth, "managing" growth. It means questioning myths about growth, real-izing that growth can bring more costs than benefits. That kind of growth makes us poorer, not richer. It shouldn't be celebrated or welcomed or subsidized or managed or accommodated; it should be stopped.
The Real Costs of Growth in Oregon Donella Meadows' The Global Citizen, June 5, 1997 http://iisd1.iisd.ca/pcdf/meadows/oregon.htm
The myth persists. Growth is good for us. Development will bring in more tax money. The only way to get our property taxes down is to bring more people and houses and businesses to town. If you're one of the many who still believe this, look around at cities and towns more populous or more rapidly growing than yours. Are their taxes lower? Around here they're not. If your own community has been growing, have your taxes gone down? Mine haven't. So how big do we have to get to reach that magical, mystical place where growth will finally start lowering taxes? Or maybe it would be better to ask: how much more evidence do we need before we stop believing that myth? If evidence will do the trick, there's plenty of it in a March 1997 arti-cle in the journal Population and Environment. The author, Eben Fodor, a planner from Eugene, Oregon, performs two useful ser-vices. First he summarizes previous studies of the relationship be-tween growth and taxes. Second, he does his own calculation of how much a typical new house costs a typical community in Ore-gon. Studies over 25 years from all parts of the nation are unanimous. Growth raises taxes. A 1991 survey of towns in DuPage County, Il-linois, showed a clear relationship between new development and rising property taxes. Amazingly, commercial development was even more expensive to the towns, and thus the taxpayers, than residential development. (More than three times as expensive!). Another study in Springfield, Oregon, showed that after a decade of rapid growth, the city budget had quadrupled, bond indebtedness had quadrupled, and city spending PER PERSON had tripled! Many of these studies demonstrate another point -- sprawl costs more than clustering. As settlement density thins out from 30 houses per acre on one end of the scale to four acres per house on the other end, the cost per house of providing and maintaining roads, sewer, water, storm drains, and schools zooms upward. (It's not clear to me why school costs go up with decreasing density, unless more widely spaced houses tend to be bigger houses with more children.)
Fodor's own study shows why growth raises taxes. He assumes a development of three-bedroom single-family houses on 6,000-square-foot lots -- a density of six houses per acre. He assumes that the houses must be supplied with municipal water and sewage treatment and that every three houses bring two kids into the public school system. Then he calculates what the town has to provide in CAPITAL costs to serve that development. That doesn't mean schoolteachers' salaries or gas for the road grader or paint for the fire station -- those are operational costs. Fodor includes only the costs of build-ing schools and roads and buying fire engines and graders. He comes out with $24,500 per house. More than $11,000 of that comes from the need for more school facilities. Another $5,000 comes from the sewer system, $4,000 from roads, $2,000 from wa-ter supply, and the rest from parks and recreation facilities, storm water drainage systems, and fire protection. Because of these costs, many towns are getting smart enough to charge "impact fees," one-time levies on new developments, so ex-isting residents don't end up subsidizing newcomers. The trouble is, developers hate impact fees and apply such steady political pressure against them that they are usually way too low. Fodor says that in Oregon they range from $1,000 to $6,500 per new house. That means, on average, every new house effectively costs the taxpayers in town something like $20,000. That's probably a conservative number. Fodor assumes in his cal-culation that the added property taxes from the new development cover its ongoing operational costs -- which may or may not be true. And he does not include any capital expansions for police fa-cilities, libraries, town administration, or garbage collection. Nor, as he admits, did he try to calculate the imponderable but very real costs to everyone in the community of decreased air and water quality, lost wildlife habitat, lost beauty, or more traffic, noise, or crime. Is it any wonder that the more we grow, the more property taxes keep rising? And quality of community life keeps falling? The wonder is that after years and years of watching the conse-quences of growth in our own towns and every town around us, we still swallow the idea that if we just keep this Ponzi scheme going a little longer, somehow it will start working in our favor.
Bob Powell, Ph.D., MBA • • Continuous Improvement Associates © 2003 • • [email protected] • • 719 599-0977 • • Rev 01/06/03 • • page 94
Appendix V. The Tangle of Growth – Questions & Criticism (6/30/01) There's a conspiratorial tone with state-ments that can't be supported. I can appreciate the impression of a conspiratorial tone. Systems are strange in that there can be the appearance of a conspiracy, even though the resulting behavior is some-what unconscious. In fact, blame is a sure sign that there is a systems problem.
Aside from that kind of effect, Molotch notes that the growth machine coalition is "naturally organized" whereas the op-position is "naturally disorganized."
And beliefs are powerful, Greenspan may very well have sincerely believed he was protecting the country from the ravages of inflation before the election last year when he raised interest rates quite rapidly ... a conspiracy to assure returns to capital exceed returns to labor? Consciously planned or not ... the effect can be the same.
There was at least the appearance of a conspiracy in the Amendment 24 debate. Opponents put on a $6M propa-ganda campaign that made many statements that were ex-aggerated and even completely false ... statements I docu-ment were unsupportable.
Regarding statements that can’t be supported, in fact, as I worked on the paper, I had trouble with some of the conclu-sions in several of the references. This required I do more research and data analysis. It was my intent to do enough research to provide adequate documentation to support the conclusions.
However, the interesting thing to do with the model would be to pinpoint exactly where in the structure lie the sources of disagreement.
For example, Hinton essentially maintains that "growth pays for itself." That could lead to determining exactly what calculation that implies, agreeing on how to do the calculation, and then agreeing on how to take the data. And, if growth pays for itself, It would also be useful to explore his alternate explanation of how the infrastructure backlog developed. The contention is that the Fed tries to keep wages low to keep inflation low. But Greenspan celebrates rising productivity because it allows wages to rise without
inflation. Therefore the low wage argu-ment doesn't hold up. There's plenty of data showing unemployment is higher than officially stated and that real wages are falling, not rising. Productivity is up, but wages for the bottom 90% of the population are not. See Append I for references on Unem-ployment and Wages. See Append II on “The Division of Returns to Labor vs. Capital” with an excerpt from Secrets of the Temple.
Perhaps I do not make this case clearly enough in the main part of The Tangle. I only included the first of the quotes in Append I. I tried to shorten the section in the main docu-ment to make it not so lengthy ... perhaps I overdid it.
In the model, the issue of low wages only affects the avail-ability of affordable housing. The squeeze on affordable housing is due on the one hand to higher housing prices for the variety of reasons noted in the paper and on the other hand to real wages that are stagnant or falling.
The other effect of Fed policy shown in the model is that it only allows so much economic growth. That's why eco-nomic development effectiveness is so important to EDC in-vestors. If we don't get the economic activity here, some-where else will get it instead; it's a zero sum game.
Because of this competition, there's pressure on govern-ment to keep taxes and fees low and provide relocation in-centives to compete. But when they are too low, there are insufficient funds to cover infrastructure costs.
The systems analysis misses that popula-tion is increasing and that their needs must be taken into account. This omis-sion undermines much of what's in "The Tangle of Growth." The systems analysis doesn't speak to whether we should grow or not. It just says that as we grow, with infrastructure costs not covered by taxes and fees, we'll have an infra-structure backlog and declining quality of life. That is hap-pening.
This is an important point that I should have made explicit. It didn't even occur to me to address this issue. Perhaps there should be a debate about whether to grow or not, but
Bob Powell, Ph.D., MBA • • Continuous Improvement Associates © 2003 • • [email protected] • • 719 599-0977 • • Rev 01/06/03 • • page 95
that's not (I think) what the current growth debate is really about. I just wasn't thinking politically enough ... that was one of the most compelling arguments made against Amendment 24. I should have addressed it.
Growth boundaries are simply to assure that infrastructure would be used efficiently and that, if expansion were to be beyond the limits, government would say how infrastructure costs would be financed. The more restrictive boundaries in Oregon (more restrictive than those proposed in Amend-ment 24) did not slow population growth (Figure 26) in Port-land relative to Denver. And they did not slow building: the FDIC put Portland on the list of "13 cities on the verge of overbuilding" two years before Denver made the list in 2000 (Overbuilding – Growth Boundaries vs. Sprawl). The boundary around Colorado Springs would have been so large as to have virtually no impact on overall growth for a decade or more.
Amendment 24 was effectively portrayed as being about stopping growth, but growth control doesn't mean growth limitation. Growth control is instead about efficiency and how the costs and benefits will be shared.
At the heart of the issue is how to balance individual rights against responsibility to the community. It's about whether one person or group has a right to do things and have the impacts in costs and quality of life borne by others. Achiev-ing balance is a difficult discipline ... and in this case cer-tainly contentious.
The costs are great and there's a growing consciousness of inequity. The report Thursday, 5/8, in the Denver Post cited $760 per person in lost time and fuel from traffic jams. This adds up to a big loss for the whole population.
You make the point that renters don’t get housing subsidies and that owners do, but you don’t document the extent to which this is true. I made the point in "The Tangle" that renters don't get the breaks home-owners do, but didn't back it up with numbers. The article below in the Denver Post came out after I fin-ished the initial release of The Tangle.
Housing would be more affordable if renters had subsidies comparable to those given to homeowners. With such a large infrastructure backlog putting pressure on taxes, it will be argued that there is no money for comparable subsidies.
Denver Post, Tuesday, May 8, 2001 REAL ESTATE, Nation's Housing
In taxes, renters lose big, Kenneth Harney
WASHINGTON - If you're like millions of American home-owners and new buyers, you filed your federal tax returns a couple of weeks ago and are glad to be done with it.
As part of the process, you probably took advantage of some of the highly favorable provisions in the federal tax code that offer you special breaks simply because you bought, own or sold a home -- mortgage interest deductions, property tax write-offs, capital gains exclusions.
Tax breaks like these are so hard-wired into the American housing system -- and so connected with the country's cur-rent record-high homeownership rate -- that hardly anybody even asks: How much money is involved here? How big is the financial subsidy implicit in allowing homeowners -- but not renters -- to cut their taxes through their choice of shel-ter? And who actually gets most of those benefits?
Two recent federal documents provide the answers. One is some fine print tucked away in the Bush administration's proposed budget for fiscal year 2002. The other is a report of "tax expenditures" by the bipartisan Joint Committee on Taxation, which advises House and Senate tax-writers.
Totally apart from whether you're a strong believer in, or opponent of, tax preferences, consider these startling and little-publicized real estate facts:
- The mortgage interest deduction is projected to save homeowners a record $65.7 billion in the coming year. The savings represent uncollected taxes on their regular in-comes that they'd otherwise have to pay if they didn't have a mortgage.
- Property tax write-offs for homeowners also represent a huge federal subsidy -- an estimated $25.6 billion in the coming year. So, too, are capital gains exclusions on home sale profits, which will save homeowners nearly $20 billion in the coming year alone.
But who actually reaps the biggest benefits from the home-ownership preference? Estimates from the Joint Committee on Taxation tell some of the story:
- Mortgage interest deduction tax savings are gobbled up mainly by people with household incomes of $100,000 a year or more. Roughly 59 percent of all the mortgage write-off savings flow to households in that bracket, even though they represent 32.2 percent of the total number of homeowning taxpayers claiming the mortgage interest deduction. - Homeowners with incomes between $75,000 and $100,000 represent 22.4 percent of homeowners filing for the mortgage write-off, but receive 20.5 percent of the sav-ings.
Bob Powell, Ph.D., MBA • • Continuous Improvement Associates © 2001 • • [email protected] • • 719 599-0977 • • Rev 06/30/01 • • page 96
- Homeowners in the $50,000-$75,000 income bracket rep-resent 25.4 percent of all mortgage deduction claimants, but receive just 13.5 percent of the savings.
- Lower- to moderate-income homeowners, who are far less likely to itemize on their tax returns, represent proportion-ately smaller percentages of mortgage interest deduction claimants, and barely get any of the savings. Households with incomes of $30,000-$40,000 account for just 6.7 per-cent of those who deduct mortgage interest, and receive less than 2 percent of the benefits. Homeowners with in-comes of $20,000-$30,000 represents slightly less than 3 percent of mortgage write-off claimants, but get just over one-half of 1 percent of the tax savings.
The breakdown on property tax deductions is similar: The top 33 percent of homeowning income-earners gets 61 per-cent of the savings. Folks at the other end of the income scale get very little.
What’s the point here? First, since this issue so rarely sees the light of day, it's good to get the numbers out. Second,
from purely a homeowner's perspective, the fact that the federal tax system is so generous can only be good news. It makes homeownership easier to afford, raises the economic value of owning a home, and provides millions of people tax-free cash when they sell their shelter.
From the perspective of non-homeowners, on the other hand, the sheer size of the federal subsidies to homeowners can only be sobering, if not enraging. Renters get virtually no subsidies for their choice of shelter.
No wonder that when Harvard University's Joint Center for Housing Studies looked at the net wealth of homeowners last year vs. that of renters, it documented vast differences. Senior homeowners and renters, those 55 years and older, show how wide the gap gets: Homeowners had a median net wealth of $177,400 and home equity of $80,000. Rent-ers, by contrast, had a median net wealth of $5,500 and zero dollars of equity.
Kenneth Harney is a columnist with the Washington Post Writers Group
Append I. On Unemployment and Wages Robert Reich, "The Case (once again) for Uni-versal Health Insurance"
From The American Prospect, vol. 12 no. 7, April 23, 2001
http://www.theamericanprospect.org/print/V12/7/reich-r.html
From 1986 through 1997 (the latest year for which detailed IRS data are available), the average income of the richest 1 percent of Americans rose 89 percent, to $517,713. During these same years, the average income of the bottom 90 percent of Americans rose 1.6 percent, to $23,815. (These figures, not incidentally, are after all federal income taxes were paid.)
From the Press Release on Created Unequal: The Crisis in American Pay by James K. Gal-braith
http://www.tcf.org/Press_Releases/Galbraith.html
By focusing on the defeat of inflation above all other eco-nomic goals, government policies effectively destroyed the wage equality essential to democratic ideals and the middle-class character of American society. The decline of eco-nomic and political power for the majority of America's workers thus rests not in their lack of education or skills, but can instead be traced to the abandonment of full employ-ment, the use of high interest rates as the only policy tool against inflation, and to political hostility to trade unions as well as to maintaining the real value of the minimum wage.
Galbraith reorganizes the traditional industrial classifications into three broad groups--knowledge-intensive capital goods industries, consumer goods producers, and pure service. In a ground-breaking analysis of their performances over last thirty years, he lays bare the forces that actually determine wage structures and consequently the quality of life enjoyed by working people. Through a careful application of statisti-cal technique whose results are displayed in innovative and accessible graphs, Galbraith establishes the links between relative earning power and larger movements of the mac-roeconomy. He probes the relation between cycles of in-vestment and employment, as well as the impact of the mini-mum wage, trade protection, and military spending, on each industrial group, and exposes the pernicious effects of unstable Federal Reserve monetary policies on the distribu-tion of income.
... The main challenge now is to change policies and institu-tions, so that discredited economic theories (such as the in-famous natural rate of unemployment) and special interests (such as the banker votes on the Federal Reserve's Open Market Committee) do not block the sustained achievement of full employment.
"The Rich Get Richer: And Why the Poor Don't" by Edward N. Wolff
From The American Prospect, Volume 12, Issue 3. Febru-ary 12, 2001
Bob Powell, Ph.D., MBA • • Continuous Improvement Associates © 2001 • • [email protected] • • 719 599-0977 • • Rev 06/30/01 • • page 97
http://www.theamericanprospect.org/print/V12/3/wolff-e.html
Since 1979, productivity has recovered somewhat, but wages have failed to keep up. It is this very rise in corporate profitability--which comes at the expense of workers' wages--that has fueled the record boom in the stock market, an ex-pansion whose primary benefits (as noted above) have not gone to low- and middle-income workers. In other words, as the returns to work have atrophied, returns to capital have climbed, shifting ever more power to the rich and contribut-ing to the rising inequality of income in this country.
...
Restore the minimum wage to its 1968 level. Adjusted for in-flation, the minimum wage in 1998 was down 32 percent from its peak in 1968. Restoring the minimum wage to its golden-age level (when, I should point out, the unemploy-ment rate was only 3.6 percent) will help increase the earn-ings of low-wage workers.
From Top Heavy: A Study of the Increasing Ine-quality of Wealth in America by Edward N. Wolff
http://www.tcf.org/Publications/Inequality/Top_Heavy/foreword.html
Foreword
In the pages that follow, Edward Wolff, Professor of Eco-nomics at New York University, adds data and provides analysis concerning wealth to our current knowledge about trends in income distribution. While wealth inequality always has been greater than income inequality, Wolff reports re-markable increases in wealth inequality in recent years. Dur-ing the 1980s, the top 1 percent of wealth holders enjoyed two thirds of all increases in financial wealth. The bottom 80 percent of households ended up with less real financial wealth in 1989 than in 1983. Startlingly, Wolff reports that the United States has gone from a position of less wealth inequality among its citizens than in Europe to greater wealth inequality than is found in those class ridden socie-ties.
Official vs. Effective Unemployment, The Economist, 2/5/94
Cited in the Workforce Study Group on Labor Market Eco-nomics, 11/28/94: from an Amex Bank Review analysis us-ing BLS data and referenced in The Economist, 2/5/94, p. 25
Unemployment at end of 1993:
U.S. Japan Britain France Official: 6.4% 2.9% 10.2% 12.0% "Effective": 9.3% 9.6% 12.8% 13.7% effective/official ratio: 1.453 3.310 1.255 1.142
Official unemployment only counts those who are actively seeking work. "Effective" unemployment includes "discour-aged" & "involuntary part-time" workers (but not under-employed). Britain and France are much more efficient in counting all unemployment.
The rise of temporary employment from Bennett Harrison, Lean and Mean, 1994 p. 202
"... since 1982, temporary employment in the U.S. has grown three times faster than employment as a whole. Be-tween 1976 and 1990, the number of part-timers (those av-eraging <35 hours of waged employment per week ...), in-creased by 7% compared to a 2% growth of full-time work-ers ... ." "Moreover, this trend has come from an increase in "involuntary" part-time employment, not from an increase in voluntary part-time employment. Searches for explana-tions ... should therefore focus of the demand side of the la-bor market" ... "the decisions of managers." These devel-opments have serious implications for personal well-being ... between 1979 and 1989, the share of the private sector workforce covered by pension plans fell from 50% to 43%, ... employee coverage by health insurance ... declined from 69% to 61%." "This growing division of the American work-force into those who are entitled to employee benefits and those who are not is ... truly a dark side of flexible produc-tion."
Append II: The Division of Returns to Labor vs. Capital From William Greider, Secrets of the Temple, How the Federal Reserve Runs the Country, 1987, pp. 573 – 579
From: Part IV. THE RESTORATION OF CAPITAL 16. WINNERS AND LOSERS
The White House political managers, yielding reluctantly to the inevitability of Volcker's reappointment, neverthe-less attempted to establish some ground rules with him
for the future course of monetary policy, particularly lead-ing up to the crucial re-election season in 1984. "You don't want a political whore as Fed chairman," one of them explained, "but you don't want someone who is phi-losophically opposed to your economic policy or partisan in the other direction. We assured ourselves that we could count on him being neutral as a policy maker."
The conversations were never so explicit that they took the form of negotiations. Volcker, for his part, vigorously
Bob Powell, Ph.D., MBA • • Continuous Improvement Associates © 2001 • • [email protected] • • 719 599-0977 • • Rev 06/30/01 • • page 98
denied that he had ever discussed the conduct of mone-tary policy in connection with his reappointment, either with the President or with any of the senior White House advisers. Still, the President's men thought they had an understanding with the Federal Reserve chairman.
I certainly recall a meeting (an Administration official said] where the President would say to Volcker, "I'd like to know that we can count on you." Or rather he'd say, "I'd like to know that your goals and mine are the same-sustained economic growth without in-flation." And Volcker agreed with that. We translated that into this understanding: the Fed would provide sufficient growth in the money supply to insure sus-tained economic growth, without inflation.
Besides the President, the discussion with Volcker in-cluded Baker, Donald Regan, Edwin Meese and Michael Deaver, the official said. "There was no suggestion that I'm not going to reappoint you if you don't agree to this, but we may well have discussed that the brakes were shoved on too hard in the recession," the official recalled. "And we made the point that there were no signs of infla-tion returning now."
The supposed "understanding" meant a lot more to the White House than it did to Paul Volcker. The President's advisers thought they had extracted operating terms from Volcker, an agreement they could hold him to later, if the Fed shifted course and threatened the recovery in the 1984 campaign season. But what exactly did "sufficient" mean? Or "sustained economic growth"?
"It's a perfectly good cliche," a senior White House official complained, "but it's meaningless. It's not a coherent ba-sis for asking the Fed to pursue a specific policy. Volcker can deliver on that commitment with 3 percent money growth and others can say it should be 6 percent. All the parties thought it had meaning, but Volcker could make it mean anything he wanted."
The White House, nevertheless, expected the terms to be honored. As David Stockman said, "Jim Baker thought he had a commitment that nobody was going to screw up the economy in the election year."
On June 18, the President chose his weekly Saturday-morning radio broadcast to announce the news: he was reappointing Paul Volcker to a new four-year term. Vol-cker, the President declared, is "as dedicated as I am to continuing the fight against inflation." Afterward, Treasury Secretary Regan added an important corollary: "Like the President, Volcker wants the recovery to be sustained and is committed to lower interest rates.” [4]
The Treasury Secretary, addressing the National Press Club, was perhaps entitled to a moment of I-told-you-so.
For more than two years, the former chief executive of Merrill Lynch had been heckled by the press for his opti-mism, belittled for his stubborn faith in the principles of supply-side economics. Now it was his turn to cite the economic statistics. The bullish American recovery was redeeming the faith.
As custodians of the American Dream [Donald Re-gan boasted], we have nursed it through difficult days. We have brought it into the sunlight. And we will not surrender it to those who would go back to the old, failed dogmas of yesterday. We will now move from recovery to renewal. And we will dis-perse the dream until it is shared equally by millions who until now have known it only as an abstraction.
Industrial production had soared by 19 percent in the last three months. New orders for durable goods were up 36 percent. Employment in manufacturing jumped by 100,000 for two months running. Retail sales increased at a 27 percent rate over the last quarter. Autos were up 38 percent from the low point the year before, iron and steel up 44 percent, housing up nearly 50 percent. Con-sumer confidence, measured by regular polling at the University of Michigan, was soaring to its highest level in ten years.
Donald Regan declared victory and mocked those liberal skeptics who had opposed the President's original doc-trine, the program of massive tax cuts for business and individuals. The critics, Regan said, resembled comic-strip characters from Pogo, reduced to warning: "We are confronted with insurmountable opportunities."
The recession did last longer than anyone expected [Regan continued]. But all the while, overlooked or simply denied by those who peddle pessimism for their livelihood, the market forces embodied in the Reagan program were gathering momentum. As in-flation fell and worker productivity increased, private companies found themselves with more and more internally generated funds.... But our economic program is really aimed at Main Street.... What we are seeing is the creation of new opportunities from the grassroots up. We are build-ing a bridge between today's recovery and tomor-row's lasting prosperity. And we are proving that quick fixes, while politically appealing, can never take the place of fundamental market forces and human motivations.[5]
The liberal critics were certainly wrong about one thing-the recovery was not weak, as they had predicted, but as robust and rapid as any of the previous postwar cycles. As the American economy regained its strength, it was clear that the abnormally high level of interest rates was not going to stunt a normal post-recession boom. Economists could worry about the implications, but the high price of money did not seem to inhibit consumers and businesses from rushing to join the action.
Bob Powell, Ph.D., MBA • • Continuous Improvement Associates © 2001 • • [email protected] • • 719 599-0977 • • Rev 06/30/01 • • page 99
Alfred Zeller, who ran a fur shop in St. Johnsbury, Ver-mont, noticed that, on the contrary, his business im-proved when interest rates went up. "A lot of my custom-ers are middle-aged, semiretired and retired," Zeller said. "Some are widows whose husbands have left them quite comfortable. All they've got is liquid assets." With higher returns on their money funds, they bought more expen-sive furs. [6]
William Hamilton, a political consultant for Senator John Glenn, who was seeking the Democratic presidential nomination, found that high interest rates simply did not "personally eat away" at voters. The
President Reagan reminded voters repeatedly-and cor-rectly-that nominal interest rates had been cut in half since he took office, from the inflationary frenzy of Janu-ary 1981 when the prime rate hit 20.5 percent to the cur-rent level of 11 percent. What the President did not dis-cuss, of course, was that real interest rates-the exchange of real wealth after discounting for inflation-were actually much higher now and still rising. Though far more signifi-cant, real interest rates were another element of money the public didn't understand. [7]
Paul Volcker also blithely dismissed the impact of high in-terest rates on the different classes of citizens. The sub-ject was too complicated, he claimed, to sort out winners and losers. "Lots of relatively poor people love high in-terest rates-it depends on how they borrow and save," Volcker insisted. "A lot of older people love high interest. I even get mail, not very much but some, when interest rates go down."
The Federal Reserve Board's own research on financial wealth had, of course, described the implications in starker terms. The Fed studies demonstrated that 55 percent of American families were net debtors in terms of financial assets and that a mere 10 percent of American families owned 86 percent of all the net financial wealth. Paul Volcker said he was unfamiliar with this research.
Keynesian economists, in any case, could claim vindica-tion on a more fundamental point about the economy and they did. This was not a "supply side" recovery, they pointed out; it was Keynesian "demand side." In broad outline, they were correct. Notwithstanding the gloating rhetoric from the President and Donald Regan and other Republicans, the expansion that developed in 1983 did not fulfill any of the supply-side premises articulated back in 1981. On the contrary, the recovery followed the stan-dard Keynesian format for demand stimulus-it was led by
consumers spending money on goods in the market-place, not by savers investing in new capital formation.
The Reagan tax cuts stimulated consumer demand by putting more cash in private hands, and this increased stimulus, combined with the Fed's easing of interest rates, drove the expansion. After several quarters, con-sumer spending moderated and, as usually occurred, a boom in capital-goods spending developed, producers in-vesting in new productive facilities and equipment.
This was the standard pattern for economic recovery; the sequence and dimensions did not deviate appreciably from past cycles. The effects of the Reagan fiscal policy were not different from what liberal Democrats had done to manipulate economic growth in previous seasons-raising aggregate demand by running federal deficits – only with $200 billion deficits Ronald Reagan's Keynesian push was much bolder than anything Democrats had dared attempt since World War II.
"The paradox," said Charles Schultze, Jimmy Carter's CEA chairman, "is it's the opposite of supply-side eco-nomics." The central premise of the new conservative doctrine had been that the across-the-board tax cuts would allow citizens to increase their personal savings-and these savings would flow into capital investment in new factories and equipment, expanding the productive capacity of the nation. Thus, broader prosperity would be created by enhancing the 6 4 supply side" of the econ-omy. Nearly the opposite occurred: the savings rate de-clined, instead of increasing, during the Reagan recovery and fell to record lows the longer the expansion contin-ued. [8]
Rather than savings, it was more accurate to say Reagan's economic revival was powered by debt — living on borrowed money. It was borrowed and spent by the federal government, by businesses and by consumers. As the recovery proceeded, an increasing portion of the accumulating debt was borrowed from abroad – capital supplied by foreign investors. For the first time since 1914, the United States would become a debtor nation again, borrowing more than it lent in international finance.
Ronald Reagan's version of Keynes really was different, however, from what Democrats had done before him, de-spite the broad similarities. The President's economic policy, combined with the Fed's, effectively inverted the old liberal priorities-as if the principle of income distribu-tion articulated by Marriner Eccles and the other New Dealers had been stood on its head. Instead of pushing money downward, in order to stimulate the consumption
Bob Powell, Ph.D., MBA • • Continuous Improvement Associates © 2001 • • [email protected] • • 719 599-0977 • • Rev 06/30/01 • • page 100
of goods by the broadest base of families, the federal government was now discreetly pushing money upward-concentrating income disproportionately in the upper economic brackets.
The reversed redistribution of incomes was masked at first by the general prosperity, but the effects were al-ready visible in 1983. According to the U.S. Census, only families on the top 20 percent of the economic ladder en-joyed real increases in their after-tax household incomes from 1980 to 1983. The others, the bottom 80 percent, actually lost. The highest fifth, families earning $38,000 or more, gained an average of $1,480 per household in real income, and the top 5 percent, earning more than $60,000, gained an average of $3,320. Families in the middle lost about $560 and the working poor lost about $250.
The progressive ladder that had guided liberal redistribu-tion politics for two generations was turned upside down. The wealthiest got most and the least got less. The in-come share that went to the most prosperous families, the top fifth on the ladder, became even more dispropor-tionate, increasing from 40.2 to 42 percent of all U.S. in-come. [9]
The reversed redistribution flowed from several channels of government action, involving both fiscal policy and the Federal Reserve. The Reagan Administration's budget cuts had modestly scaled back benefits for lower-income families, while the boom in defense spending naturally tended to favor high-salaried technical professions. The across-the-board reduction in tax rates delivered the largest benefits to taxpayers in the upper brackets. The business tax cuts rewarded the owners of capital and for corporations offset much of the impact of high interest rates. The process of liquidation had depressed eco-nomic activity generally, but the largest personal losses were absorbed by labor and small business. All these in-fluences flowed in the same direction.
Finally, the continuing high level of real interest rates guaranteed a sustained, regressive redistribution of in-come upward. The rewards and penalties were steadily compounded between creditors and debtors, like com-pound interest itself. A larger share of incomes automati-cally flowed to the people who owned most of the net fi-nancial wealth, the well-to-do and the wealthy. The bor-rowers would owe more and more. The rentier had not only eluded the "euthanasia" that John Maynard Keynes had prophesied for him in The General Theory of fifty years before. The owner of capital was now receiving far
greater rent for the use of his money than Keynes had ever seen.
In effect, the reward structure of American capitalism was gradually being altered – less for labor, more for capital; a smaller share for work, a larger one for money. This shift was visible in the shrinking portion of total U.S. personal income that was derived from wages and salaries. For many decades, from the 1930s onward, wages and sala-ries had accounted for about two-thirds of all personal in-come in the United States. In the 1970s, the wage share declined proportionately as government entitlement pro-grams became a larger portion of incomes, mainly Social Security.
In the era of Volcker and Reagan, the wage share shrank much further-to its lowest level in fifty years-as a larger and larger portion of total U.S. income was claimed by the incomes produced by money, dividends and interest payments. By 1983, wages and salaries accounted for only 60.7 percent of total personal income. The following year, the wage share would shrink further – to 59.5 per-cent – the lowest level since 1929.
This was the restoration of capital-capital restored to a primacy it had not enjoyed since before the Great Crash. From 1979 to 1983, the personal incomes derived from interest grew by more than 70 percent, an increase of $158 billion, while wage incomes grew by only 33 percent in the same period. When income from stock dividends was included, the returns on capital would claim 20 per-cent of the whole in 1984, compared to 11 percent in 1979. Money's share of the rewards generated by the American system and apportioned among its citizens had been virtually doubled – primarily by government action – in only five years' time.
But did any of this matter? In the general euphoria, the effects of shifting income shares hardly seemed of con-sequence to the robust performance of the American economy. America was back and expanding vigorously again. The economy was demonstrating that neither high interest rates nor huge deficits would hold it back. After all, wealthy people spent their money too. The increased discretionary income available to the upper brackets from higher interest rates clearly invigorated the consumer demand.
The well-to-do, one could even say, led the nation to re-covery. They bought expensive cars and luxury vaca-tions, jewelry and watches and artwork, boats and bikes and pleasure aircraft, second homes at the beach or in the mountains. Home builders who had nearly gone
Bob Powell, Ph.D., MBA • • Continuous Improvement Associates © 2001 • • [email protected] • • 719 599-0977 • • Rev 06/30/01 • • page 101
broke a few years before building moderately priced sub-divisions discovered a rich new market in resort condo-miniums. This upward tilt in the composition of consumer spending was fostering what some business economists called "a two-tier economy," a subtle breakup in the mass-consumption patterns that had driven the American economy since World War II. Fortune magazine summa-rized the implications for its business readers:
The mass market is splitting apart. Most business-men don't realize it yet, but the middle class – the principal market for much of what they make – is gradually being pulled apart. Economic forces are propelling one family after another toward the high or low end of the income spectrum. For many mar-keters, particularly those positioned to sell to the well-to-do, this presages good times. For others used to selling millions of units of their products to middle-income folks, the prospects are altogether darker. [10]
Liberal sensibilities were offended, but the liberal impulse for progressive redistribution of income had been discred-ited and very few were willing to speak for it now. The question of income shares was regarded as a political is-sue, a faintly old-fashioned argument about social equity,
but not a question of great relevance to economic per-formance.
Even many liberal Keynesian economists accepted that assumption.
Greider’s references & endnotes, p. 761 4. The President's and Donald Regan's remarks on the reappointment were in the Washington Post, June 18, 1983. 5. Donald Regan's speech to the National Press Club was on June 29, 1983. 6. Alfred Zeller's fur sales, Wall Street Journal, July 3, 1984. 7. William Hamilton's polling on interest rates, Wall Street Journal, January 27, 1984. 8. Charles Schultze on supply-side economics, Wall Street Journal, October 10, 1983. 9. The shifting income shares were reported by the Joint Economic Committee, analyzing "After-Tax Money In-come Estimates of Households," U.S. Census, July 8, 1985. 10. The changing patterns of mass consumption were reported by Bruce Steinberg, "The Mass Market Is Split-ting Apart," Fortune, November 28, 1983. A broader de-scription of the economic implications of a shrinking mid-dle class was reported by Robert Kuttner, "The Declining Middle," The Atlantic, July 1983.
Appendix VI. A Note on Reaganomics according to Tobin:161
161 James Tobin, ”Can America Grow Faster?” in Jerry J. Jasinowski, ed., The Rising Tide, 1998, p. 83-84.
… supply-siders are grossly mistaken to claim the 1983-89 re-covery as a vindication of Reaganomics and to assert that the same recipe can now lift growth rates again. The 1981 tax cuts and the buildup of defense spending were fiscal demand stimuli unprecedented in peacetime. With unemployment and excess capacity at their highest rates since the Great Depression, the economy could easily meet the new demands upon it. Inflation, which had touched double digits in 1979-80 and fallen to 5% in the subsequent recession, actually continued to abate during the 1983-89 recovery. Interest rates declined too; the Federal Re-serve was accommodative. As the 1 0 % GDP GAP of 1982 was closed, actual GDP grew 4.4% per year, about 2 points above the sustainable PGDP rate. It is ridiculous and dangerous to ad-vocate repeating in 1996 the Reaganomic policies of the 1980s. The slack that was in the economy in 1982, when unemployment exceeded 10%, is not there now, when unemployment is only 5.3%.
Nothing at all happened on the supply-side in the 1980s; neither PGDP nor its rate of growth were raised. Reagan's fiscal policy powered the demand-side recovery of the 1980s, but it was not essential. The U.S. economy recovered from its seven previous postwar recessions without anything resembling such drastic policies. The Federal Reserve could have managed a 1980s re-covery by itself; absent the bizarre fiscal policies, there was plenty of room for lowering interest rates further. Claims from Laffer curve adherents that expansion of the tax base would overcome the deficits resulting from the tax cuts were emphati-cally falsified. The economy of the 1980s was tilted toward pri-vate consumption and defense, at the expense of investment the economy was not pro-growth, but anti-growth. The reckless ex-periment left the federal government with a large debt and a heavy burden of interest payments.
Bob Powell, Ph.D., MBA • • Continuous Improvement Associates © 2001 • • [email protected] • • 719 599-0977 • • Rev 06/30/01 • • page 102