Embed Size (px)
Citation preview

PR
OJECT PHOEN
IX
THE TAMPA BAY
Produced by the Tampa Bay Regional Planning Council - January 2010
CATASTROPHIC PLAN SCENARIO INFORMATION AND CONSEQUENCE REPORT www.TampaBayCatPlan.org

THIS PAGE INTENTIONALLY LEFT BLANK

Tampa Bay Catastrophic Plan: PROJECT PHOENIX
Tampa Bay Regional Planning Council Draft January 2010 1
1.0 SCENARIO INFORMATION FOR CATASTROPHIC PLAN DEVELOPMENT 1.1 Introduction The Tampa Bay Regional Planning Council, along with our partners from government, business, and social services communities, is developing a plan to identify and address the multitude of issues that would arise should a catastrophic event occur in the Tampa Bay area. For this plan, the Tampa Bay area is defined as the following counties:
Citrus Hardee Hernando Hillsborough Manatee Pasco Pinellas Polk Sumter
Hurricane Phoenix is a fictitious storm created to simulate the effects of a worst‐case scenario. With input from Tampa Bay area emergency management agencies and the local office of the National Weather Service (NWS), a simulated storm was developed with a track and intensity that would devastate the entire Tampa Bay region. The NWS generated National Hurricane Center advisories, local hurricane statements, and data files that simulate the hurricane’s location and intensity from its formation in the Caribbean Sea, through landfall in Pinellas County, to the hurricane’s exit from the east coast of Florida into the Atlantic Ocean. The maps and information presented in this packet are based upon the data files developed for this simulated storm. The simulated parameters of Hurricane Phoenix were input into HAZUS‐MH, the risk assessment tool that uses the Federal Emergency Management Agency (FEMA) standard methodology to measure the effects of real and simulated hazard events like hurricane winds and flooding. As one might expect, a storm of the size and strength of Hurricane Phoenix would create almost unthinkable damage to the area’s homes, businesses, infrastructure, overall economy, and social systems that are currently in place. The goal of this planning process is to develop strategies that will help the Tampa Bay region to recover and rebuild after such a devastating catastrophe.
Tampa Bay Catastrophic Plan: PROJECT PHOENIX
Tampa Bay Regional Planning Council Draft January 2010 2
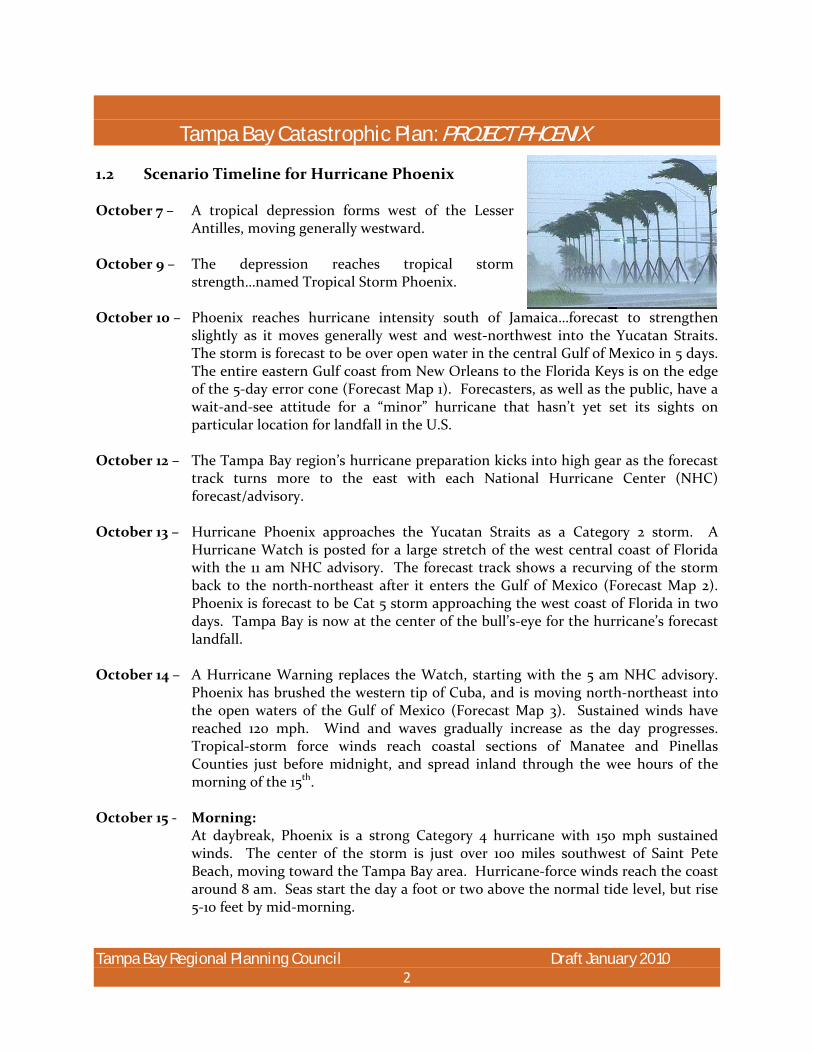
1.2 Scenario Timeline for Hurricane Phoenix October 7 – A tropical depression forms west of the Lesser
Antilles, moving generally westward. October 9 – The depression reaches tropical storm
strength…named Tropical Storm Phoenix. October 10 – Phoenix reaches hurricane intensity south of Jamaica…forecast to strengthen
slightly as it moves generally west and west‐northwest into the Yucatan Straits. The storm is forecast to be over open water in the central Gulf of Mexico in 5 days. The entire eastern Gulf coast from New Orleans to the Florida Keys is on the edge of the 5‐day error cone (Forecast Map 1). Forecasters, as well as the public, have a wait‐and‐see attitude for a “minor” hurricane that hasn’t yet set its sights on particular location for landfall in the U.S.
October 12 – The Tampa Bay region’s hurricane preparation kicks into high gear as the forecast
track turns more to the east with each National Hurricane Center (NHC) forecast/advisory.
October 13 – Hurricane Phoenix approaches the Yucatan Straits as a Category 2 storm. A
Hurricane Watch is posted for a large stretch of the west central coast of Florida with the 11 am NHC advisory. The forecast track shows a recurving of the storm back to the north‐northeast after it enters the Gulf of Mexico (Forecast Map 2). Phoenix is forecast to be Cat 5 storm approaching the west coast of Florida in two days. Tampa Bay is now at the center of the bull’s‐eye for the hurricane’s forecast landfall.
October 14 – A Hurricane Warning replaces the Watch, starting with the 5 am NHC advisory.
Phoenix has brushed the western tip of Cuba, and is moving north‐northeast into the open waters of the Gulf of Mexico (Forecast Map 3). Sustained winds have reached 120 mph. Wind and waves gradually increase as the day progresses. Tropical‐storm force winds reach coastal sections of Manatee and Pinellas Counties just before midnight, and spread inland through the wee hours of the morning of the 15th.
October 15 ‐ Morning:
At daybreak, Phoenix is a strong Category 4 hurricane with 150 mph sustained winds. The center of the storm is just over 100 miles southwest of Saint Pete Beach, moving toward the Tampa Bay area. Hurricane‐force winds reach the coast around 8 am. Seas start the day a foot or two above the normal tide level, but rise 5‐10 feet by mid‐morning.

Tampa Bay Catastrophic Plan: PROJECT PHOENIX
Tampa Bay Regional Planning Council Draft January 2010 3
October 15 ‐ Midday: Phoenix continues to intensify through the morning. By 11 am, sustained winds
reach 160 mph as the wall of the 45‐mile wide eye enters the mouth of Tampa Bay (Forecast Map 4). The center of the eye makes landfall at Indian Rocks Beach just before noon.
Afternoon: Storm surge of 11‐16 feet above normal tide levels has completely overtopped barrier islands from Longboat Key to Clearwater Beach. The storm continues to push a massive volume of water into Tampa Bay, and by early afternoon surge levels climb to at least 20 feet above normal at St. Petersburg, 23 feet at Oldsmar, 24 feet at Apollo Beach, and 26 feet above the normal tide level near Downtown Tampa. Storm surge pushes water from the bay up the Hillsborough, Alafia, Lower Manatee, Braden, and Manatee Rivers and the Tampa Bypass Canal, flooding areas well inland. All three bridges that traverse Tampa Bay and the Courtney Campbell Causeway sustain either structural damage or have their approaches washed away by water and waves. For a time on the afternoon of the 15th, the parts of central St. Petersburg and mid‐Pinellas County that are not inundated by storm surge become two islands, each surrounded by water on all sides. The intense winds of Phoenix damage or destroy numerous buildings that are not inundated by storm surge flooding. Homes and businesses are flattened along a wide swath many miles inland following the hurricane’s path. Structural damage is caused by wind alone, windborne debris, or trees that fall onto building roofs. Most windows are blown out of high‐rise structures. Evening: The hurricane holds a steady course to the northeast as it decimates the entire Tampa Bay area. The storm weakens slowly after landfall. By 5 pm, the center of Phoenix is located in eastern Hernando County. Sustained winds are still 130 mph. Hurricane‐force winds continue in Tampa until around 7 pm. That’s around 10 straight hours of sustained winds greater than 74 mph.
Phoenix accelerates to the northeast during the evening, exiting the east coast of
Florida around midnight at St. Augustine. The storm has maintained hurricane strength throughout its track across the entire width of the Florida peninsula. Sustained winds are 105 mph as Phoenix enters the Atlantic.
October 16 – Search‐and‐rescue operation begin as soon as winds abate, with massive amounts
of debris and roadway damage making ground‐based travel nearly impossible and severely hampering attempts at recovery. Casualties are numerous. Survivors that
Tampa Bay Catastrophic Plan: PROJECT PHOENIX
Tampa Bay Regional Planning Council Draft January 2010 4
are uninjured are dazed, some in shock at the amount of devastation that has occurred.
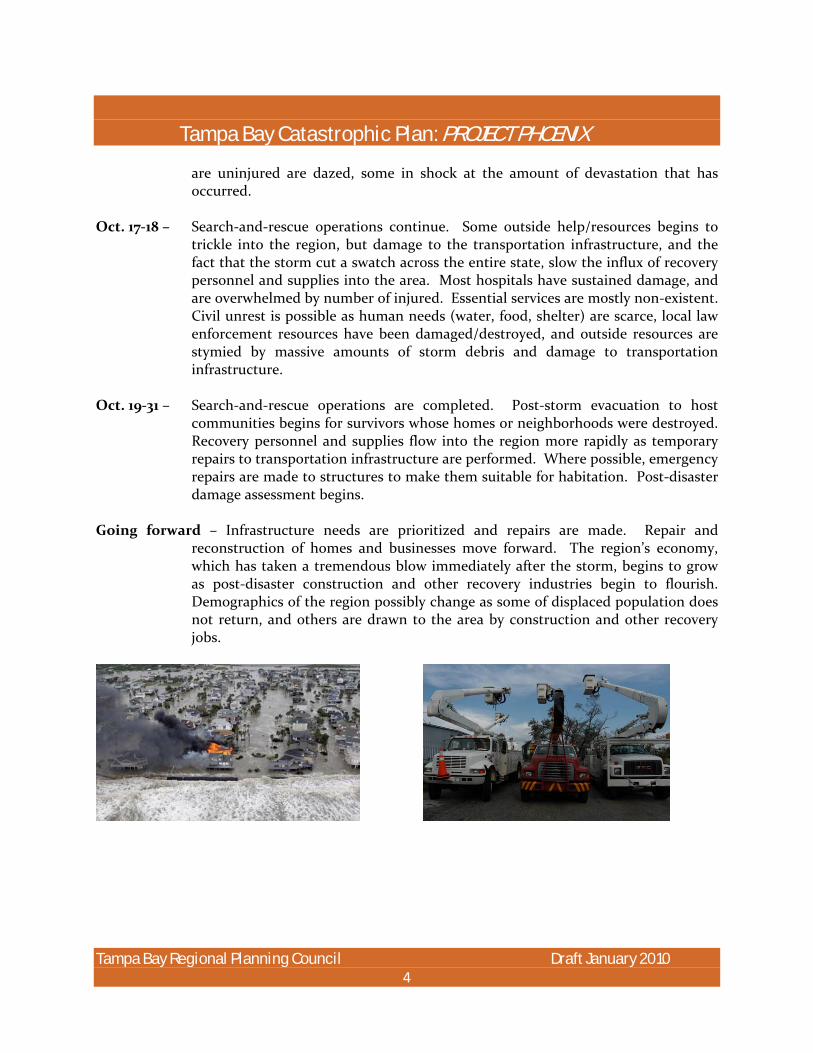
Oct. 17‐18 – Search‐and‐rescue operations continue. Some outside help/resources begins to
trickle into the region, but damage to the transportation infrastructure, and the fact that the storm cut a swatch across the entire state, slow the influx of recovery personnel and supplies into the area. Most hospitals have sustained damage, and are overwhelmed by number of injured. Essential services are mostly non‐existent. Civil unrest is possible as human needs (water, food, shelter) are scarce, local law enforcement resources have been damaged/destroyed, and outside resources are stymied by massive amounts of storm debris and damage to transportation infrastructure.
Oct. 19‐31 – Search‐and‐rescue operations are completed. Post‐storm evacuation to host
communities begins for survivors whose homes or neighborhoods were destroyed. Recovery personnel and supplies flow into the region more rapidly as temporary repairs to transportation infrastructure are performed. Where possible, emergency repairs are made to structures to make them suitable for habitation. Post‐disaster damage assessment begins.
Going forward – Infrastructure needs are prioritized and repairs are made. Repair and
reconstruction of homes and businesses move forward. The region’s economy, which has taken a tremendous blow immediately after the storm, begins to grow as post‐disaster construction and other recovery industries begin to flourish. Demographics of the region possibly change as some of displaced population does not return, and others are drawn to the area by construction and other recovery jobs.

Tampa Bay Catastrophic Plan: PROJECT PHOENIX
Tampa Bay Regional Planning Council Draft January 2010 5
FORECAST MAP 1

Tampa Bay Catastrophic Plan: PROJECT PHOENIX
Tampa Bay Regional Planning Council Draft January 2010 6
FORECAST MAP 2

Tampa Bay Catastrophic Plan: PROJECT PHOENIX
Tampa Bay Regional Planning Council Draft January 2010 7
FORECAST MAP 3

Tampa Bay Catastrophic Plan: PROJECT PHOENIX
Tampa Bay Regional Planning Council Draft January 2010 8
FORECAST MAP 4

Tampa Bay Catastrophic Plan: PROJECT PHOENIX
Tampa Bay Regional Planning Council Draft January 2010 9
2.0 DAMAGE SCENARIO DEVELOPMENT The Catastrophic Scenario was developed by combining some of the more prevalent models for hurricanes. HAZUS‐MH is a standardized loss estimation methodology developed by the Federal Emergency Management Agency (FEMA) and the National Institute of Building Sciences (NIBS)1. The methodology is built upon an integrated GIS platform (see Figure 2) to conduct analysis at an aggregate level (i.e., not on a structure‐by‐structure basis). The HAZUS‐MH risk assessment methodology is parametric, in that distinct hazard and inventory parameters (e.g., flood depths and building types) were modeled using the HAZUS‐MH software to determine the impact of the coastal flood and severe winds on the built environment.2 In order to leverage recently collected topographic data and impacts from a single event, a custom SLOSH (Sea, Lake, and Overland Surge from Hurricanes) model run was created. The results of this model were imported as an input to Hazus®MH MR4 Flood (Coastal) Module. Hazus®MH MR4 (released August 2009) was used to model the coastal flood hazard at the county level based on the hypothetical storm scenario. 3
SLOSH (Sea, Lake and Overland Surges from Hurricanes) is a computerized model run by the National Hurricane Center (NHC) to estimate storm surge heights and winds resulting from historical, hypothetical, or predicted hurricanes by taking into account pressure, size, forward speed, track, and winds. Graphical output from the model displays color coded storm surge heights (See Figure 3) for a particular area in feet above the model's reference level, the National Geodetic Vertical Datum (NGVD), which is the elevation reference for most maps.
The calculations are applied to a specific locale's shoreline, incorporating the unique bay and river configurations, water depths, bridges, roads and other physical features. If the model is being used to estimate storm surge from a predicted hurricane (as opposed to a hypothetical one), forecast data must be put in the model every 6 hours over a 72‐hour period and updated as new forecasts become available.
1 Loss estimates produced by software models such as HAZUS‐MH are to be used with a certain degree of caution. Uncertainty within these types of results can be introduced from a number of sources, including the use of national datasets to represent local conditions, simplifications within the model introduced to allow the model to have flexibility with Level 1 users, and errors introduced as part of the mathematical processing within the software code. As a planning tool however, the consistency and value of the results developed by HAZUS‐MH cannot be understated. 2 These products represent a hypothetical scenario intended to encourage discussion for the Tampa Bay Catastrophic Planning Project. Consequence projections are derived from the scenario using scientific methods based on research. They will continue to be updated and refined as new information from the Catastrophic Planning effort becomes available and specific planning needs are defined. 3 This study represents a Level 2 HAZUS analysis in that it utilizes user‐supplied flood depth grids. The effective date of the user‐supplied SLOSH data is September 2009.

Tampa Bay Catastrophic Plan: PROJECT PHOENIX
Tampa Bay Regional Planning Council Draft January 2010 10
FIGURE 1. CONCEPTUAL MODEL OF HAZUS‐MH METHODOLOGY

Tampa Bay Catastrophic Plan: PROJECT PHOENIX
Tampa Bay Regional Planning Council Draft January 2010 11
FIGURE 2. SAMPLE FRAME FROM CATATSTROPHIC STORM ANIMATION WITHIN SLOSH DISPLAY

Tampa Bay Catastrophic Plan: PROJECT PHOENIX
Tampa Bay Regional Planning Council Draft January 2010 12
While the HAZUS‐MH flood model is generally based on depth damage functions, the hurricane wind model within HAZUS is based on a hazard‐load‐resistance‐loss methodology. Per the HAZUS‐MH MR4 Technical Manual for the Multi‐hazard Loss Estimation Methodology for the Hurricane Model, “the approach is based on a hazard‐load‐resistance‐damage‐loss methodology developed from an individual risk framework. The basic model components (hazard model, load model, resistance models, etc.) are developed separately. Each model component is, wherever possible, separately validated using full scale data, model scale data, or experimental data. A major factor driving the use of a first principles‐based hazard‐load‐resistance‐loss model, rather than the simple wind speed dependent loss models traditionally used, is the ability for the approach to be extended to model the effects of code changes and mitigation strategies on reduction in damage and loss. Furthermore, since economic damage (loss) is modeled separately from physical damage to a building, estimates of both building damage and loss are separately modeled and predicted”. HAZUS‐MH MR4 uses Census 2000 for demographic data; Census 2000 and Dun & Bradstreet 2006 for general building stock inventory; 2006 RS Means for building valuation; and 2006 Dun and Bradstreet for commercial data. Other details and supporting documentation regarding the sources and treatment of the default datasets used in this analysis are available in the HAZUS‐MH MR4 Technical Manuals for the Multi‐hazard Loss Estimation Methodology for the Flood Model and for the Hurricane Model available on www.fema.gov.

Tampa Bay Catastrophic Plan: PROJECT PHOENIX
Tampa Bay Regional Planning Council Draft January 2010 13
3.0 CONSEQUENCES ANALYSIS The goal of this scenario was to estimate the direct physical damages, social impacts, and direct economic losses that could result from the storm surge and wind of this catastrophic hurricane using recently developed user‐supplied SLOSH data. For the purposes of this study, direct physical damages consist of estimated impacts to the county’s general building stock (i.e., residential, commercial, industrial, and agricultural buildings), essential facilities (i.e., schools, fire stations, police stations, medical care facilities, and emergency operations centers as applicable), and agricultural products. Social impacts consist of estimated shelter requirements (in terms of households and individual persons displaced by the event). Economic losses consist of direct economic impacts (not indirect losses). FIGURE 3. REGIONAL MAP WITH PATH OF STORM
Tampa Bay Catastrophic Plan: PROJECT PHOENIX
Tampa Bay Regional Planning Council Draft January 2010 14
The hazard impacts depicted in this report intend to show regional estimates of consequences from surge and wind as generated from the HAZUS‐MH Model. It is important to note that uncertainties are inherent in any loss estimation methodology, arising in part from incomplete scientific knowledge concerning natural hazards and their effects on the built environment. Uncertainties also result from approximations and simplifications that are necessary for a comprehensive analysis (such as abbreviated inventories, demographics, or economic parameters). Figure 4 provides a graphical representation of the multi‐county study region created and maximum flood depths created from the modeled catastrophic event. The multi‐county region was composed of Citrus, Hardee, Hernando, Hillsborough, Manatee, Pasco, Pinellas, Polk, and Sumter counties. The counties of Hardee, Polk, and Sumter did not have storm surge analyses performed for them and thus their HAZUS’ estimates of impacts are strictly from the wind model. Although modeling of inland flooding was not a part of this project, traditional areas of flooding such as lowlands, and FEMA 100‐ and 500‐year flood hazard areas should also be considered when planning for catastrophic events. As mentioned earlier in this report, the HAZUS wind model was also run to estimate regional impacts from the modeled event. The storm path and expected wind gusts are depicted in Figure 5 and is intended to mimic Hurricane Katrina’s intensity prior to landfall when the storm was still identified as a Category 5. The radius to maximum winds was made to vary between 25 and 40 miles in order to create ideal conditions for the modeled storm to push maximum water into Tampa Bay. The minimum central pressure was set to 918 mBars. The estimated impacts to the population and built environment are provided throughout the rest of this document.

Tampa Bay Catastrophic Plan: PROJECT PHOENIX
Tampa Bay Regional Planning Council Draft January 2010 15
FIGURE 4. REGION MAP WITH STORM SURGE FLOOD DEPTHS

Tampa Bay Catastrophic Plan: PROJECT PHOENIX
Tampa Bay Regional Planning Council Draft January 2010 16
FIGURE 5. REGION MAP WITH PATH OF STORM AND MAXIMUM WINDS (1‐Second Gusts)

Tampa Bay Catastrophic Plan: PROJECT PHOENIX
Tampa Bay Regional Planning Council Draft January 2010 17
4.0 DIRECT PHYSICAL DAMAGES 4.1 Wind Damage The analysis conducted to determine direct physical damages to the general building stock was performed at the census tract level (outputs aggregated to the county level) and focuses on residential, commercial, industrial, and agricultural building occupancy types as defined by HAZUS‐MH. Table 1 shows damage probabilities for these selected occupancy types for the modeled, coastal event.
TABLE 1. DAMAGED BUILDING COUNTS FROM WIND BY OCCUPANCY TYPE
Number of Buildings in Each Damage Percentage Range
Occupancy Type
Total in 9‐
County Region None Minor Moderate Severe Destruction
Total Damaged Per Type
Residential 1,438,227 360,345 121,365 165,169 320,831 470,528 1,077,882
Commercial 85,481 17,378 4,936 9,369 43,724 10,074 68,103
Industrial 24,577 5,403 1,453 2,335 13,748 1,638 19,174
Other 17,642 4,411 1,356 1,953 7,916 1,995 13,231
TOTAL BUILDINGS 1,565,927 387,537 129,110 178,826 386,219 484,235 1,178,390
Figure 6 shows the distribution of those areas estimated to be completely destroyed by providing percentages of complete destruction by census tract for residential structures.

Tampa Bay Catastrophic Plan: PROJECT PHOENIX
Tampa Bay Regional Planning Council Draft January 2010 18
FIGURE 6: RESIDENTIAL DAMAGE (PERCENTAGE OF COMPLETE DAMAGE DESTRUCTION PER CENSUS TRACT)

Tampa Bay Catastrophic Plan: PROJECT PHOENIX
Tampa Bay Regional Planning Council Draft January 2010 19
4.2 Storm Surge Damage The analysis conducted to determine direct physical damages to the general building stock was performed at the census tract level (outputs aggregated to the county level) and focuses on residential, commercial, industrial, and agricultural building occupancy types as defined by HAZUS‐MH. Table 2 shows damage levels (minor, moderate, major) by county for the modeled, coastal event. Figure 4 shows the depths of inundation from storm surge in the coastal counties and indicates those areas estimated to be significantly impacted.
TABLE 2 NUMBER OF BUILDINGS BY STORM SURGE DAMAGE CATEGORY
Counties Total Structures
Number With Minor Damage
Number With Moderate Damage
Number with Severe
Damage or Destroyed
Number With More Than Minor Damage
Citrus 71,711 1 3,012 1,301 4,313
Hernando 69,266 0 1,480 398 1,878
Hillsborough 405,461 67 42,678 38,252 80,930
Manatee 132,349 19 19,470 9,271 28,741
Pasco 183,387 7 11,653 6,626 18,279
Pinellas 425,113 70 85,265 36,979 122,244
Total 1,287,287 164 163,558 92,827 256,385
Tampa Bay Catastrophic Plan: PROJECT PHOENIX
Tampa Bay Regional Planning Council Draft January 2010 20
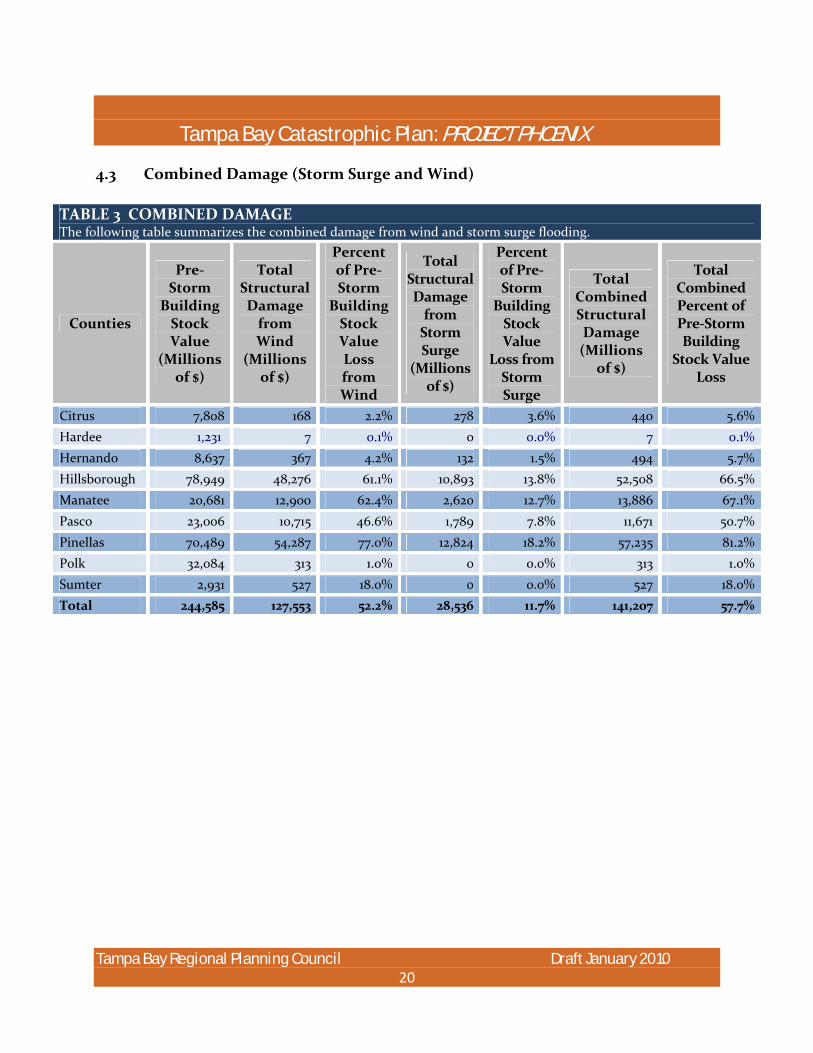
4.3 Combined Damage (Storm Surge and Wind)
TABLE 3 COMBINED DAMAGE The following table summarizes the combined damage from wind and storm surge flooding.
Counties
Pre‐Storm
Building Stock Value
(Millions of $)
Total Structural Damage from Wind
(Millions of $)
Percent of Pre‐Storm
Building Stock Value Loss from Wind
Total Structural Damage from Storm Surge
(Millions of $)
Percent of Pre‐Storm
Building Stock Value
Loss from Storm Surge
Total Combined Structural Damage (Millions
of $)
Total Combined Percent of Pre‐Storm Building
Stock Value Loss
Citrus 7,808 168 2.2% 278 3.6% 440 5.6% Hardee 1,231 7 0.1% 0 0.0% 7 0.1% Hernando 8,637 367 4.2% 132 1.5% 494 5.7% Hillsborough 78,949 48,276 61.1% 10,893 13.8% 52,508 66.5% Manatee 20,681 12,900 62.4% 2,620 12.7% 13,886 67.1% Pasco 23,006 10,715 46.6% 1,789 7.8% 11,671 50.7% Pinellas 70,489 54,287 77.0% 12,824 18.2% 57,235 81.2% Polk 32,084 313 1.0% 0 0.0% 313 1.0% Sumter 2,931 527 18.0% 0 0.0% 527 18.0% Total 244,585 127,553 52.2% 28,536 11.7% 141,207 57.7%

Tampa Bay Catastrophic Plan: PROJECT PHOENIX
Tampa Bay Regional Planning Council Draft January 2010 21
5.0 DAMAGE TO ESSENTIAL FACILITIES The analysis conducted for essential facilities focuses on schools, fire stations, police stations, medical care facilities, and emergency operations centers (EOCs), as identified by HAZUS‐MH default inventories. It is important to note that default essential facilities data in the current version of HAZUS‐MH may not be complete and represents best readily available data for use with this scenario. Tables 4 and 5 show expected damage from wind to essential facilities in terms of the capacity. For each essential facility type (with the exception of hospitals which HAZUS calculates bed availability in days after the event), HAZUS will estimate the percentage of facilities functional.
Figure 8 provides an illustration of expected recovery for the hospital/medical sector in terms of loss of use (days).
TABLE 4. EXPECTED DAMAGE TO ESSENTIAL FACILITIES FROM WIND
Type of Facility Total Number of Facilities Percentage of Facilities Functional Within the Region
EOC 13 31%
Fire Station 356 13%
Hospital/Medical 80 See Table 3 Below
Police Station 220 14%
School 1,026 10%
TOTAL FACILITIES 1,695 Varies per Type

Tampa Bay Catastrophic Plan: PROJECT PHOENIX
Tampa Bay Regional Planning Council Draft January 2010 22
FIGURE 8. DAMAGE TO HOSPITALS/MEDICAL FACILITIES

Tampa Bay Catastrophic Plan: PROJECT PHOENIX
Tampa Bay Regional Planning Council Draft January 2010 23
5.0 DEBRIS CALCULATIONS Debris calculations were performed using the HAZUS regional database. TABLE 5 DEBRIS SUMMARY REPORT All values are in tons.
County
Brick, Wood
and Other
Reinf. Concrete and Steel
Eligible Tree
Debris
Total
Citrus 40,162 808 75,263 116,233
Hardee 1,550 8 7,388 8,946
Hernando 85,74 8 5,085 66,003 156,836
Hillsborough 11,271,935 1,399,417 894,284 13,565,636
Manatee 3,785,148 568,359 190,620 4,544,127
Pasco 3,272,094 472,985 298,409 4,043,488
Pinellas 15,529,750 2,161,617 737,575 18,428,942
Polk 64,127 958 90,387 155,472
Sumter 138,833 16,398 40,685 195,916
Total 34,189,347 4,625,635 2,400,613 41,215,595
Note: The U.S. Army Corps of Engineers estimates that Hurricane Andrew generated approximately 15 million cubic yards of debris and Hurricane Katrina generated more than 118 million cubic yards.

Tampa Bay Catastrophic Plan: PROJECT PHOENIX
Tampa Bay Regional Planning Council Draft January 2010 24
6.0 CRITICAL INFRASTRUCTURE 6.1 Transportation Facilities
Interstate 75 (I‐75), Interstate 275 (I‐275), and Interstate 4 (I‐4) are expected to be the primary routes used to transport goods and people into and out of the affected zone during a response and recovery effort within the nine‐county West Central Florida area.
Interstates and major highways generally have a wide right‐of‐way and trees about 50–100 feet away from the shoulders, so most of the debris on these roads would consist of poles, signs, and small vegetative debris.
According to Florida Department of Transportation (FDOT) engineers, non‐interstate/turnpike evacuation routes in the nine‐county area are generally at‐grade with the surrounding ground. As such, routes shown on maps depicting flooding due to storm surge can generally be assumed to be flooded if the adjacent land is inundated.
Interstates are the Florida Department of Transportation’s top priority for debris clearance; FDOT plans to reopen major roads within 8–24 hours after the hurricane has passed, provided all bridges are operating at full or near capacity.
Significant impacts on the region’s bridges ‐ especially the approaches ‐ are expected on all causeways including the Courtney Campbell Causeway, Howard Frankland Bridge, Gandy Bridge and the Skyway Bridge.
Bridges and roads subject to additional flooding due to the storm will have to be inspected before reopening. This is of particular concern on the three causeways connecting Hillsborough and Pinellas County, the bridges connecting the barrier island communities as well as those connecting downtown with Harbor Island, Davis Island and the 22nd St. Bridge providing access to the Port of Tampa. Bridges over the Manatee River in Manatee and the Pithlachascotee River in Pasco will also require engineering survey.
FDOT could impose a vehicle weight restriction or use a temporary bridge if the bridges are damaged. FDOT typically has 10,000 linear feet of such bridges available in non‐emergency times.
6.1.1 Other Transportation Notes Runaway barges and other large debris could be a threat to bridges during the storm, particularly those spanning the Intracoastal Waterway. Two moveable bridges over the
Tampa Bay Catastrophic Plan: PROJECT PHOENIX
Tampa Bay Regional Planning Council Draft January 2010 25
Intracoastal Waterway were damaged in this way during Hurricane Wilma. As a result, these bridges had to be closed to motor‐vehicle traffic.
Train services in areas along the Atlantic coast may not be available because of debris on the railways.
The Florida Department of Transportation’s goal is to open (with at least one lane available for emergency vehicles) all State roads to traffic one day after the hurricane has passed.
Hurricane Phoenix will destroy traffic control devices (lights, signs), resulting in dangerous uncontrolled intersections post‐landfall.
Many of the buses and other public transit vehicles left in the storm’s path will be destroyed and unavailable post‐landfall.
6.1.2 Ports Florida’s sea‐ and airports are essential resources for providing goods and services to residents and critical economic engines that generate millions of dollars and thousands of jobs for local communities. The state contains two of the top twenty importing and four of the top twenty exporting seaports in the United States, and Tampa International Airport is one of the busiest in the world. As a result, ports will likely be vital to response and recovery efforts following a catastrophic hurricane in Tampa Bay. 6.1.2.1 Airports: Profiles The Tampa International Airport serves 21 passenger air carriers and nine cargo‐only airlines. It manages over 18 million passengers per year and 108,000 tons of cargo, including 12,000 tons of mail per year. The estimated replacement cost of the airport’s land and facilities is $2.3 billion.41 The St. Petersburg‐Clearwater International Airport is located 10 miles east of Tampa International and serves as a charter destination for several air carriers, including a few from Canada. The airport provides over 3,000 jobs and contributes an economic benefit of $400 million annually to the Tampa Bay area.

Tampa Bay Catastrophic Plan: PROJECT PHOENIX
Tampa Bay Regional Planning Council Draft January 2010 26
TABLE 6 HURRICANE PHOENIX IMPACTS ON MAJOR AIRPORTS
Major Airports Storm Category of Maximum Sustained Wind
Storm Surge Flooding Depth (ft) (Flooding over land)
Tampa International 5/181 South end of Runway 36L is 15 ft deep, terminal building is 7 ft, NE corner of
property is dry
St. Petersburg/Clearwater 5/180 NW end of Runway 22 is 17 feet, terminal is 10 ft
Sarasota Manatee Airport 5/160 Dry
6.1.2.2 Seaports: Profiles The Port of Tampa is the largest of the Florida ports, as measured by tonnage, and handles approximately 50 million tons of cargo per year. The Tampa Bay region is the largest metropolitan market in Florida, and it is the 10th largest consumer market in the U.S., with nearly 7 million people within 100 miles of the port. The port contributes to the creation of 96,000 jobs in the region and generates a regional annual economic impact of nearly $8 billion. Tampa is also the closest full service U.S. port to the Panama Canal. Port Manatee is among Florida’s largest deepwater seaports. The port oversees over 9.3 million tons of shipping, and is Fresh Del Monte Produce’s second largest U.S. port facility, used for importing Central American fruit and exporting fruit from Florida. It is also the southeast’s leading forestry product import facility. TABLE 7 HURRICANE PHOENIX IMPACTS ON MAJOR PORTS
Storm Category of Maximum Sustained Wind/ Peak Wind
Gust
Storm Surge Flooding Depth (ft)
Port of Tampa 5/ 180 12 to 26 ft . . . Port Authority bldg is 17 ft.
Port Manatee 5 / 170 6‐12 feet
Tampa Bay Catastrophic Plan: PROJECT PHOENIX
Tampa Bay Regional Planning Council Draft January 2010 27
Note: Ports Preparation As with airplanes and airports, many ships leave seaports prior to the arrival of a hurricane. The Port of Tampa, for example, mandates that any ship larger than 500 gross tons be out of port by twenty‐four hours prior to the onset of hurricane‐force winds (confirm). All potential flying debris or sources of contamination should be removed from dockside areas. The Coast Guard is responsible for establishing “Safety Zones” around the port to prevent ships entering unsafe conditions as well as to prevent unlawful salvage or looting following the storm.
6.2 Electricity Infrastructure 6.2.1 Generation Capacity
The local power plants in the nine‐county areas are located along the coast in areas vulnerable to storm surge. All facilities would have been impacted by the sustained 160‐180 mph winds. Therefore; it is assumed all local generation operations would be suspended until the damage is assessed and repairs could be made. Once the distribution systems start coming back online, most generation would be purchased from outside of the affected region.
6.2.2 Residential Impacts
Weatherheads, which connect homes to the electrical lines, are often damaged and need to be repaired by an electrician.
Approximately 5,000 weatherheads were damaged following Hurricane Wilma. This figure could easily exceed 50,000 for a storm like Phoenix.
Electricians would be required from outside of the state to handle the demand after this type of emergency.
Electrical repairs normally need county inspection before reconnection, but this requirement is sometimes waived.
6.2.3 Transmission Infrastructure
Distribution facility damage throughout the nine counties would be extensive.
Tampa Bay Catastrophic Plan: PROJECT PHOENIX
Tampa Bay Regional Planning Council Draft January 2010 28
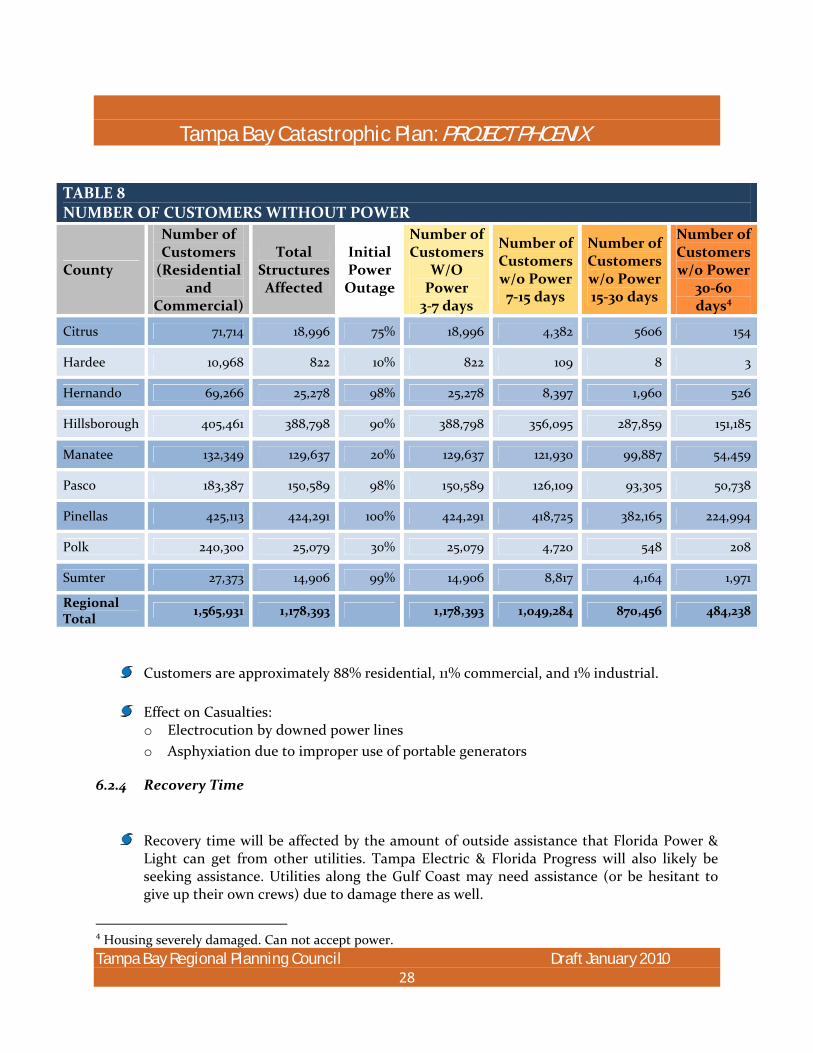
TABLE 8 NUMBER OF CUSTOMERS WITHOUT POWER
County
Number of Customers (Residential
and Commercial)
Total Structures Affected
Initial Power Outage
Number of Customers
W/O Power 3‐7 days
Number of Customers w/o Power 7‐15 days
Number of Customers w/o Power 15‐30 days
Number of Customers w/o Power
30‐60 days4
Citrus 71,714 18,996 75% 18,996 4,382 5606 154
Hardee 10,968 822 10% 822 109 8 3
Hernando 69,266 25,278 98% 25,278 8,397 1,960 526
Hillsborough 405,461 388,798 90% 388,798 356,095 287,859 151,185
Manatee 132,349 129,637 20% 129,637 121,930 99,887 54,459
Pasco 183,387 150,589 98% 150,589 126,109 93,305 50,738
Pinellas 425,113 424,291 100% 424,291 418,725 382,165 224,994
Polk 240,300 25,079 30% 25,079 4,720 548 208
Sumter 27,373 14,906 99% 14,906 8,817 4,164 1,971
Regional Total 1,565,931 1,178,393 1,178,393 1,049,284 870,456 484,238
Customers are approximately 88% residential, 11% commercial, and 1% industrial.
Effect on Casualties: o Electrocution by downed power lines o Asphyxiation due to improper use of portable generators
6.2.4 Recovery Time
Recovery time will be affected by the amount of outside assistance that Florida Power & Light can get from other utilities. Tampa Electric & Florida Progress will also likely be seeking assistance. Utilities along the Gulf Coast may need assistance (or be hesitant to give up their own crews) due to damage there as well.
4 Housing severely damaged. Can not accept power.
Tampa Bay Catastrophic Plan: PROJECT PHOENIX
Tampa Bay Regional Planning Council Draft January 2010 29
Order of Repairs: 1. Feeder circuits serving critical infrastructure facilities (hospitals, 911 centers,
Police/fire stations) would be restored first. 2. Remaining feeder circuits would then be restored. 3. Neighborhood restoration would then take place, ultimately resulting in individual
service wires to each impacted home being repaired. Note: In Hurricanes Charley, Frances, Jeanne, and Katrina, approximately 75–80% of South Florida customers were restored by Day 3, with all South Florida customers receiving full power within 8–13 days. For Wilma, approximately 40% were restored by Day 3, and approximately 60% by Day 5. All power was restored within 18 days. However, recovery time for Phoenix would likely be much longer than in these storms, lasting for weeks or months. Repairs to infrastructure or homes in inundated areas could not occur until the floodwaters have subsided. 6.2.5 Nuclear Power Plant Recovery Nuclear Regulatory Commission (NRC) policy states that any nuclear power plant that will be affected by hurricane force winds must be shut down. Restart requires NRC permission that involves the following:
Inspecting the power plant for damage Inspecting local infrastructure for its capability to support nuclear power output Inspecting the surrounding 10‐mile radius for alert and evacuation capabilities
Note: Hurricane Andrew hit Turkey Point in 1992. The onsite damage included loss of all offsite power for more than five days, complete loss of communication systems, closing of the access road, and damage to the fire protection and security systems and warehouse facilities. However, onsite damage was limited to fire protection, security, and several non‐safety‐related systems and structures. There was no damage to the safety‐related systems and no radioactive release to the environment. The units remained in stable condition and functioned as designed.
6.2.6 Effects of Damage on Utility Employees Florida Power & Light, TECO Energy, and Progress Energy have measures in place to minimize the effect that damage to employees’ homes will have on the recovery process. “Ramp up” of the repair process may be a little slower due to evacuation of some employees. Experiences with damage from recent storms, like Wilma, may make this effect stronger than it has been in the past.
6.3 Telecommunications
6.3.1 Landline Telephone Service

Tampa Bay Catastrophic Plan: PROJECT PHOENIX
Tampa Bay Regional Planning Council Draft January 2010 30
Loss of landline telephone service and jammed circuits will reduce the ability of residents to call for help or information.
6.3.2 Cell Phone Infrastructure Power outage will cause isolation and degradation.
o Cell phone sites that operate on battery backup will lose power in about eight hours.
o Sites with generator power will have power for several days as long as they are not flooded.
The cell phone structure will be barely operational because of wind damage to microwave units and some flooding damage. Microwave units may be ripped off or be out of alignment.
The cell phone system may be isolated from the cell phone infrastructure outside of the hurricane impact area.
Individual geographical sections of the system will be isolated from each other so that customers will only be able to reach other customers within the same area.
Floodwaters can damage circuits and replacements, and drown generator units. Repairs cannot be made in areas where water remains. The areas where water recedes will be eligible for immediate repairs and replacements.
Because landline phone service will be limited, remnants of the cell phone system will be overloaded.
6.3.3 Television Most broadcast stations have at least one generator. For the most part, these stations have been able to continue broadcasting without interruption during past hurricanes.
In three recent cases, stations switched to 24‐hour weather coverage and did not broadcast with closed captioning, which is against FCC regulations.
Most stations feel that a Category 5 strike could damage their antennae, and few or none have backup or portable antennae.
Power loss would interrupt broadcasts of cable television and limit the ability of viewers to operate their televisions.
6.4 Water and Waste Water Systems Approximately 30% of water treatment facilities are located in the storm surge zone. Storm surge will inundate extant water systems, including wells and water mains, causing breakage and contamination. Loss of electricity will prevent water and sewage pumping in much of the Tampa Bay Area.
All water for human and pet use will require boiling. Public health authorities will have to coordinate public notification of boil water notices. Considerable gastrointestinal illness may be observed if contaminated water is consumed.

Tampa Bay Catastrophic Plan: PROJECT PHOENIX
Tampa Bay Regional Planning Council Draft January 2010 31
Potable water production and distribution may be affected by the dike break, but also by commercial power outages, if generator power does not exist or is insufficient.
7.0 SOCIAL IMPACTS 7.1 Displaced Households The analysis conducted to determine shelter requirements estimates that 840,000 households will be displaced due to the modeled storm. (Displacement includes households evacuated from within or very near to the impacted area and may not be a direct reflection of residential building damage within a particular census block.) Assuming a regional average of 2.32 persons per household, more than 58% of the individual persons within the region would be impacted (out of a total population of 3.3 million people). Approximately 220,000 of those would seek temporary shelter in public shelter facilities (see Table 9).
TABLE 9: ESTIMATED SOCIAL IMPACTS Number of Households or Persons in Each Category
9‐County Region Population Households
Displaced5 Individual Persons Displaced
Short Term Shelter (# People)
Citrus 118,055 287 666 75Hardee 26,938 6 14 2Hernando 130,802 951 2,206 244Hillsborough 998,948 289,941 672,663 77,013Manatee 264,002 88,228 204,689 22,573Pasco 344,765 77,221 179,153 20,291Pinellas 921,482 383,213 889,054 98,666Polk 483,924 459 1,065 122Sumter 53,345 3,088 7,164 725Total 3,342,261 843,394 1,956,674 219,711
5 The term, “Displaced household” refers to a dwelling that has been damaged to the extent that it becomes uninhabitable. This is not a permanent displacement, but one that would take weeks/months to rebuild the house back to habitability. The reason for the calculation is the type of shelter needed (i.e. short term, long term) and number of spaces needed at the shelter. Evacuated populations refers to those people leaving during the hurricane/flood/earthquake event, but able to return to their homes afterwards.

Tampa Bay Catastrophic Plan: PROJECT PHOENIX
Tampa Bay Regional Planning Council Draft January 2010 32
7.2 Animal Issues
Between 60–70% of U.S. households have pets. The majority of pet owners consider their pets to be family members, feeling the same sense of responsibility for their safety as they do any other family member.
Survey results from 2004 storms showed that 50–60% of residents in the affected area had pets and 30–40% said pets affected their evacuation decision.
The Pet Evacuation Transportation Standards Act of 2006 requires that State and local governments include household pets in emergency evacuation plans. The act authorizes the use of funds to “procure, construct, or renovate emergency shelter facilities and materials that will temporarily accommodate people with pets and service animals,” as well as provide “rescue, care, shelter, and essential needs...to such pets and animals.”
TABLE 10: ESTIMATED NUMBER OF PETS Estimated Number of Pets in Displaced Households
9‐County Region
Displaced Households Households
with Cats Total Cats Households
with Dogs Total Dogs
Citrus 287 98 234 112 190
Hardee 6 2 5 2 4
Hernando 951 323 776 371 631
Hillsborough 289,941 98,580 236,592 113,077 192,231
Manatee 88,228 29,998 71,994 34,409 58,495
Pasco 77,221 26,255 63,012 30,116 51,198
Pinellas 383,213 130,292 312,702 149,453 254,070
Polk 459 156 375 179 304
Sumter 3,088 1,050 2,520 1,204 2,047
Total 843,394 286,754 688,210 328,924 559,170

Tampa Bay Catastrophic Plan: PROJECT PHOENIX
Tampa Bay Regional Planning Council Draft January 2010 33
8.0 VOLUNTEER AND DONATIONS MANAGEMENT
Types of Volunteers Affiliated: Trained first responders (e.g., Red Cross, Salvation Army, United Way, Faith‐based, etc.)
Unaffiliated: Untrained volunteers who arrive hoping to help
o Often require shelter and food
Past Volunteer Figures 2004 Hurricane Season:
Volunteer Florida handled 120,000 volunteers overall (both affiliated and unaffiliated) The American Red Cross:
o Overall: 35,000 volunteers o Charley: 1,400 volunteers o Frances: 4,100 volunteers and staff o The American Red Cross had 1,900 initial volunteers and staff and 250 vehicles for
Katrina.
Past Donations Katrina, Rita, and Wilma: Over $2 billion
o Relief organizations received more clothing than they could manage. o September 11, 2001 terrorist attacks: $2.2 billion
Other Issues Wilma caused $6.5 million in losses to Florida nonprofits, with at least 100 nonprofits affected

Tampa Bay Catastrophic Plan: PROJECT PHOENIX
Tampa Bay Regional Planning Council Draft January 2010 34
9.0 MEDICAL ISSUES
9.1 Casualties 6
The number of casualties was estimated based on the following assumptions:
Non-evacuation of certain portions of the population-at-risk in storm surge vulnerable evacuation zones and mobile homes. Based on the 2006 behavioral surveys, up to 30% of the vulnerable population would not evacuate even with the threat of a catastrophic hurricane.
Approximately 10% of the population on the barrier islands has indicated that they feel safe in a major storm.
Post-storm deaths o Common hurricane‐related causes of death include: drowning, electrocution,
crushing, head trauma, and natural causes exacerbated by the storm (storm stress‐induced heart attack).
o Improper use of portable generators has led to excess morbidity and mortality following hurricanes. During the period of power outages related to the four major Florida hurricanes in 2004, 167 persons were treated for accidental carbon monoxide poisoning as a result of improper use of portable generators. Six deaths were reported.
Approximately 1,957,000 people will be affected by this catastrophic storm scenario. Of these residents, approximately 1,957 (.001) could loose their lives as a direct result of the storm (primarily due to non‐evacuation of storm surge vulnerable areas and mobile homes). An additional 200 additional people (.0001) could loose their lives following the storm.
6 Note: The number of directly attributable hurricane deaths from major hurricanes in the United States since 1989 ranges from a low of 5 for Hurricane Jeanne (2004, Category 3 at landfall in Florida) to a high of 1,817 for Hurricane Katrina (2005, Category 1 at landfall in Florida, Category 3 at landfall in Louisiana). The mean number of fatalities occurring in major storms since 1989 is 194.9; however, without Hurricane Katrina included, the mean number of deaths drops to 37.1.

Tampa Bay Catastrophic Plan: PROJECT PHOENIX
Tampa Bay Regional Planning Council Draft January 2010 35
TABLE 11: ESTIMATED CASUALTIES
Number of Households or Persons in Each Category
9‐County Region
Total Population Affected
Population
Estimated Direct
Casualties
Estimated Casualties Post‐
Storm
Citrus 118,055 666 1 0
Hardee 26,938 14 0 0
Hernando 130,802 2,206 2 0
Hillsborough 998,948 672,663 673 67
Manatee 264,002 204,689 205 20
Pasco 344,765 179,153 179 18
Pinellas 921,482 889,054 889 89
Polk 483,924 1,065 1 0
Sumter 53,345 7,164 7 1
Total 3,342,261 1,956,674 1,957 196
9.2 Injuries Injuries and illnesses observed in previous Florida hurricane events include blunt trauma, lacerations, muscle strains and pulls, insect and animal bites, puncture wounds, burns, infections, gastrointestinal illnesses, sunburns, exposure, psychosocial distress, and carbon monoxide exposure.
9.3 Additional Medical Topics
9.3.1 Environmental Health
Storm surge can inundate extant water systems, including wells and water mains, causing breakage and contamination. Loss of electricity will prevent water and sewage pumping in much of Tampa Bay. All water for human and pet use will require boiling. Public health authorities will have to coordinate public notification of boil water notices. Excess gastrointestinal illnesses may be observed if contaminated water is consumed.
While stressful and disturbing, the presence of corpses in floodwaters or in storm debris does not create a risk of infectious disease epidemics in flood‐ or storm‐affected areas. However, according to the World Health Organization, should dead bodies enter the water supply there is a small risk of contamination that could lead to gastrointestinal
Tampa Bay Catastrophic Plan: PROJECT PHOENIX
Tampa Bay Regional Planning Council Draft January 2010 36
infections. Health officials must work with the media to educate the public on these issues.
9.3.2 Medical Records Loss of medical records resulting in patient treatment challenges is likely as a result of hurricane events.
9.3.4 Prescription Drugs Although access to traditional prescription drug outlets will be disrupted, access to prescription drugs will be provided by emergency response teams, mobile medical units, and private/voluntary organizations such as AmeriCares and others that focus on distributing prescription drugs and medical equipment following disasters.
Drugs may have been lost in the event or left behind while evacuating. People will have difficulty refilling prescriptions and collecting the cost of replacing them from their insurance companies.
Special needs patients on multiple medications may have difficulty recalling specific medications and doses. Lack of accessible medical records will make it difficult to look up medication information for patients. Medical intervention will be required to determine patients’ prescription needs.
9.3.5 Mental Health Following all hurricane events, members of the affected population will experience some level of distress. While most people return to normal levels of psychological functioning, some will exhibit symptoms of Post Traumatic Stress Disorder, depression, or other illnesses. Psychosocial support will be one of the most lasting needs.
9.3.6 Health Insurance Portability and Accountability Act To facilitate patient treatment, Health Insurance Portability and Accountability Act elements will be suspended or modified as provided for within the act’s policy. There may be confusion about what elements of the act must be maintained in an emergency.
9.3.7 Medical Licensing Planned and spontaneous medical volunteers, including doctors and nurses, will require reciprocal licensing. This will be an urgent need.

Tampa Bay Catastrophic Plan: PROJECT PHOENIX
Tampa Bay Regional Planning Council Draft January 2010 37
10.0 DIRECT ECONOMIC LOSSES The analysis conducted to estimate direct economic losses includes (for the purposes of this study) direct damage to the building (contents and inventory losses are not factored into the analysis) for the residential, commercial, industrial, and agricultural occupancy types (see Table 12).
TABLE 13: DIRECT ECONOMIC IMPACTS
Loss Type Economic Loss ($ Millions)
Residential Buildings $142,851
Commercial Buildings $39,959
Other Buildings $17,362
Business Interruption $32,877
TOTAL FOR ALL LOSSES $233,050
TABLE 12: BUILDING‐RELATED ECONOMIC LOSS ESTIMATES (Thousands Of Dollars) Category Area Residential Commercial Industrial Others Total
Property Damage
Building 98,469,000 20,812,000 4,503,000 3,776,000 127,560,000
Content 44,382,400 18,748,000 4,945,600 3,187,000 71,263,000
Inventory 00 399,500 907,800 42,900 1,350,100
Subtotal 142,851,400 39,959,500 10,356,400 7,005,900 200,173,100
Business Interruption loss
Income 230,300 4,243,900 85,900 57,900 4,618,100
Relocation 11,555,700 3,217,500 228,100 704,500 15,706,000
Rental 4,857,800 2,182,100 52,800 100,300 7,193,000
Wage 542,400 4,445,100 142,900 230,000 5,360,400
Subtotal 17,186,200 14,088,600 509,700 1,092,700 32877500
Total 160,037,500 54,048,000 10,866,100 8,098,500 233,050,073

Tampa Bay Catastrophic Plan: PROJECT PHOENIX
Tampa Bay Regional Planning Council Draft January 2010 38
Regional economic losses from damages to the Port of Tampa and Port Manatee are not directly factored in, but can be assumed to have major impacts with delays of commodities and supplies that will only aggravate an already tense economic and physical environment.
Short‐ and long‐term impacts to the environment (and indirectly tourism) are not factored in to the physical model but may be exercised during the catastrophic planning event.
11.0 SUMMARY With close to $250 billion in expected economic losses (physical structure damage and loss of use for commercial entities), the modeled storm will create unprecedented challenges for the Tampa Bay Area. This catastrophic scenario will force the emergency managers, first responders, and other professionals from all levels of government, the private sector and the faith‐based and volunteer agencies as well as our citizens to consider many recovery and post‐disaster options that might not have been feasible before but may be a necessity to respond to this event. Short‐term housing, public safety, insurance mechanisms, financial mechanisms for logistics and responders (among other items) will need to be addressed in order to help the communities recover.
Tampa Bay Catastrophic Plan: PROJECT PHOENIX
Tampa Bay Regional Planning Council Draft January 2010 39
APPENDIX A SIMULATED PUBLIC ADVISORIES FOR HURRICANE
PHOENIX

Tampa Bay Catastrophic Plan: PROJECT PHOENIX
Tampa Bay Regional Planning Council Draft January 2010 40
THIS PAGE INTENTIONALLY LEFT BLANK

Tampa Bay Catastrophic Plan: PROJECT PHOENIX
Tampa Bay Regional Planning Council Draft January 2010 41
APPENDIX A SIMULATED PUBLIC ADVISORIES FOR HURRICANE PHOENIX Simulated Public Advisory for Hurricane Phoenix Created 10/27/2009 by NWS Ruskin ALL INFORMATION AND DATA CREATED FOR SIMULATION PURPOSES ZCZC MIATCPAT4 ALL TTAA00 KNHC DDHHMM BULLETIN HURRICANE PHOENIX ADVISORY NUMBER 11 NWS TPC/NATIONAL HURRICANE CENTER MIAMI FL 11 AM EDT FRI OCT 10 2014 ...PHOENIX BECOMES THE 9TH HURRICANE OF THE SEASON AS IT HEADS INTO THE WESTERN CARIBBEAN... AT 11 AM EDT...THE GOVERNMENT OF THE CAYMAN ISLANDS HAS ISSUED A TROPICAL STORM WARNING AND A HURRICANE WATCH FOR ALL OF THE CAYMAN ISLANDS. A TROPICAL STORM WARNING REMIANS IN EFFECT FOR JAMAICA. A TROPICAL STORM WARNING MEANS THAT TROPICAL STORM CONDITIONS ARE EXPECTED WITHIN THE WARNING AREA WITHIN THE NEXT 24 HOURS. A HURRICANE WATCH MEANS THAT HURRICANE CONDITIONS ARE POSSIBLE WITHIN THE WATCH AREA...GENERALLY WITHIN 36 HOURS. AT 11 AM EDT...1500Z...THE CENTER OF HURRICANE PHOENIX WAS LOCATED NEAR LATITUDE 16.8 NORTH... LONGITUDE 77.8 WEST OR ABOUT 90 MILES... 145 KM... SOUTHWEST OF KINGSTON JAMAICA. PHOENIX WAS MOVING TOWARD THE WEST NEAR 7 MPH ...11 KM/HR. PHOENIX IS EXPECTED TO CONTINUE TO MOVE WEST DURING THE NEXT 24 HOURS. MAXIMUM SUSTAINED WINDS ARE NEAR 75 MPH...120 KM/HR...WITH HIGHER GUSTS. PHOENIX IS A CATEGORY ONE HURRICANE ON THE SAFFIR-SIMPSON SCALE. HURRICANE FORCE WINDS EXTEND OUTWARD UP TO 30 MILES... 50 KM... FROM THE CENTER...AND TROPICAL STORM FORCE WINDS EXTEND OUTWARD UP TO 130 MILES... 210 KM. ESTIMATED MINIMUM CENTRAL PRESSURE IS 985 MB...29.08 INCHES. PHOENIX IS EXPECTED TO PRODUCE STORM TOTAL ACCUMULATIONS 5 TO 10 INCHES...WITH LOCAL AMOUNTS OF 15 INCHES...ACROSS THE CAYMAN ISLANDS AND JAMAICA THROUGH MONDAY. REPEATING THE 11 AM EDT POSITION...16.8 N... 77.8 W. MOVEMENT TOWARD...WEST NEAR 7 MPH. MAXIMUM SUSTAINED WINDS...75 MPH.

Tampa Bay Catastrophic Plan: PROJECT PHOENIX
Tampa Bay Regional Planning Council Draft January 2010 42
MINIMUM CENTRAL PRESSURE... 985 MB. $$ FORECASTER NOAH Simulated Forecast Advisory for Hurricane Phoenix Created 10/27/2009 by NWS Ruskin ALL INFORMATION AND DATA CREATED FOR SIMULATION PURPOSES ZCZC MIATCMAT2 ALL TTAA00 KNHC DDHHMM HURRICANE PHOENIX FORECAST/ADVISORY NUMBER 11 NWS TPC/NATIONAL HURRICANE CENTER MIAMI FL 1500Z FRI OCT 10 2014 AT 11 AM EDT...1500Z... THE GOVERNMENT OF THE CAYMAN ISLANDS HAS ISSUED A TROPICAL STORM WARNING AND A HURRICANE WATCH FOR ALL OF THE CAYMAN ISLANDS. A TROPICAL STORM WARNING MEANS THAT TROPICAL STORM CONDITIONS ARE EXPECTED WITHIN THE WARNING AREA WITHIN THE NEXT 24 HOURS. A HURRICANE WATCH MEANS THAT HURRICANE CONDITIONS ARE POSSIBLE WITHIN THE WATCH AREA...GENERALLY WITHIN 36 HOURS. A TROPICAL STORM WARNING REMIANS IN EFFECT FOR JAMAICA. HURRICANE CENTER LOCATED NEAR 16.8N 77.8W AT 10/1500Z POSITION ACCURATE WITHIN 15 NM PRESENT MOVEMENT TOWARD THE WEST OR 265 DEGREES AT 6 KT ESTIMATED MINIMUM CENTRAL PRESSURE 985 MB EYE DIAMETER 20 NM MAX SUSTAINED WINDS 65 KT WITH GUSTS TO 80 KT. 64 KT....... 30NE 20SE 10SW 10NW. 50 KT....... 50NE 40SE 30SW 40NW. 34 KT.......120NE 110SE 60SW 90NW. 12 FT SEAS..110NE 130SE 80SW 60NW. WINDS AND SEAS VARY GREATLY IN EACH QUADRANT. RADII IN NAUTICAL MILES ARE THE LARGEST RADII EXPECTED ANYWHERE IN THAT QUADRANT. REPEAT...CENTER LOCATED NEAR 16.8N 77.8W AT 10/1500Z AT 26/1200Z CENTER WAS LOCATED NEAR 16.8N 77.5W FORECAST VALID 11/0000Z 16.8N 78.5W MAX WIND 70 KT...GUSTS 90 KT. 64 KT... 30NE 20SE 20SW 20NW. 50 KT... 50NE 40SE 30SW 40NW. 34 KT...120NE 110SE 60SW 90NW. FORECAST VALID 11/1200Z 17.0N 79.9W MAX WIND 70 KT...GUSTS 90 KT. 64 KT... 30NE 20SE 20SW 20NW. 50 KT... 50NE 40SE 30SW 40NW.

Tampa Bay Catastrophic Plan: PROJECT PHOENIX
Tampa Bay Regional Planning Council Draft January 2010 43
34 KT...120NE 110SE 60SW 90NW. FORECAST VALID 12/0000Z 17.3N 80.9W MAX WIND 70 KT...GUSTS 90 KT. 64 KT... 30NE 20SE 20SW 20NW. 50 KT... 60NE 50SE 40SW 50NW. 34 KT...120NE 110SE 60SW 90NW. FORECAST VALID 12/1200Z 17.8N 82.0W MAX WIND 75 KT...GUSTS 95 KT. 64 KT... 40NE 30SE 30SW 30NW. 50 KT... 70NE 60SE 50SW 60NW. 34 KT...130NE 130SE 70SW 100NW. FORECAST VALID 13/1200Z 19.5N 83.8W MAX WIND 75 KT...GUSTS 95 KT. 64 KT... 40NE 30SE 30SW 30NW. 50 KT... 70NE 60SE 50SW 60NW. 34 KT...130NE 130SE 70SW 100NW. EXTENDED OUTLOOK. NOTE...ERRORS FOR TRACK HAVE AVERAGED NEAR 225 NM ON DAY 4 AND 300 NM ON DAY 5...AND FOR INTENSITY NEAR 20 KT EACH DAY OUTLOOK VALID 14/1200Z 22.0N 86.0W MAX WIND 85 KT...GUSTS 105 KT. OUTLOOK VALID 15/1200Z 26.0N 86.4W MAX WIND 100 KT...GUSTS 120 KT. REQUEST FOR 3 HOURLY SHIP REPORTS WITHIN 300 MILES OF 16.8N 77.8W NEXT ADVISORY AT 10/2100Z $$ FORECASTER NOAH

Tampa Bay Catastrophic Plan: PROJECT PHOENIX
Tampa Bay Regional Planning Council Draft January 2010 44
Simulated NWS Ruskin Hurricane Local Statement on NHC Advisory 30 Created 10/27/2009 by NWS Ruskin ALL INFORMATION AND DATA CREATED FOR SIMULATION PURPOSES URGENT - IMMEDIATE BROADCAST REQUESTED HURRICANE PHOENIX LOCAL STATEMENT NATIONAL WEATHER SERVICE TAMPA BAY FL 630 AM EDT WED OCT 15 2014 ...HURRICANE WARNING IN EFFECT FOR WEST CENTRAL FLORIDA... ...HURRICANE WARNING IN EFFECT FOR THE GULF WATERS... ...HURRICANE PHOENIX IS STILL A CATEGORY 4 HURRICANE PACKING SUSTAINED WINDS OF 150 MPH... ...DIRECT STRIKE OF CATASTROPHIC AND LIFE THREATENING HURRICANE EXPECTED... ...AT THIS TIME PROTECTIVE MEASURES SHOULD HAVE BEEN COMPLETED... ...FLASH FLOOD WARNING IN EFFECT FOR WEST CENTRAL FLORIDA... .AT 630 AM EDT…THE CENTER OF HURRICANE PHOENIX WAS LOCATED NEAR LATITUDE 26.4 NORTH, LONGITUDE 83.6 WEST OR 130 MILES SOUTHWEST OF TAMPA WHICH IS ABOUT 110 MILES SOUTHWEST OF SAINT PETE BEACH. PHOENIX IS MOVING TOWARD THE NORTHEAST AT 15 MPH AND THIS MOTION IS EXPECTED TO CONTINUE FOR THE NEXT 24 HOURS. MAXIMUM SUSTAINED WINDS ARE NEAR 150 MPH WITH HIGHER GUSTS. PHOENIX IS AN EXTREMELY DANGEROUS CATEGORY FOUR HURRICANE ON THE SAFFIR SIMPSON SCALE. SOME FLUCTUATIONS IN STRENGTH ARE LIKELY PRIOR TO LANDFALL... BUT PHOENIX IS EXPECTED TO MAKE LANDFALL AS A CATEGORY FOUR OR EVEN A CATEGORY FIVE HURRICANE. GMZ830-850-870-853-873-FLZ050>051-055-060-100300- /O.CON.KTBW.HU.W.0001.000000T0000Z-000000T0000Z/ COASTAL WATERS FROM ENGLEWOOD TO TARPON SPRINGS, FL OUT 20 NM- COASTAL WATERS FROM ENGLEWOOD TO TARPON SPRINGS, FL EXTENDING FROM 20 TO 60 NM- COASTAL WATERS FROM TARPON SPRINGS TO SUWANNEE RIVER, FL OUT 20 NM- COASTAL WATERS FROM TARPON SPRINGS TO SUWANNEE RIVER, FL EXTENDING FROM 20 TO 60 NM-

Tampa Bay Catastrophic Plan: PROJECT PHOENIX
Tampa Bay Regional Planning Council Draft January 2010 45
TAMPA BAY WATERS- PASCO-PINELLAS-HILLSBOROUGH-MANATEE- 630 AM EDT THU JUN 15 2006 ...HURRICANE WARNING REMAINS IN EFFECT... ...FLASH FLOOD WARNING IN EFFECT... ...NEW INFORMATION... PHOENIX WILL MOVE ONSHORE THE WESTERN COAST OF PINELLAS AND PASCO COUNTIES BETWEEN SAINT PETE BEACH AND HOLIDAY LATE THIS MORNING OR EARLY THIS AFTERNOON. CONDITIONS WILL RAPIDLY DETERIORATE OVER WEST CENTRAL FLORIDA BEFORE NOON. ...AREAS AFFECTED... THIS STATEMENT RECOMMENDS ACTIONS TO BE TAKEN BY PERSONS IN THE FOLLOWING COUNTIES OR MARINE AREAS: WATERS FROM ENGLEWOOD TO SUWANNEE RIVER OUT TO 60 NM...TAMPA BAY WATERS...PASCO...PINELLAS... HILLSBOROUGH AND MANATEE COUNTIES. ...WATCHES/WARNINGS... THE FOLLOWING WATCHES AND WARNINGS ARE CURRENTLY IN EFFECT FOR THIS AREA: HURRICANE WARNING. FLASH FLOOD WARNING. ...PRECAUTIONARY/PREPAREDNESS ACTIONS... PROTECT YOURSELF AND YOUR FAMILY. RESIDENTS SHOULD RUSH PREPARATIONS FOR THE LANDFALL OF A CATASTROPHIC HURRICANE...WITH DEVESTATING HURRICANE FORCE WINDS AND HIGH STORM SURGE. ALL MARINE CRAFT MUST STAY IN SAFE PORT. ...STORM SURGE IMPACTS... TIDES OF 1 TO 2 FEET ABOVE NORMAL WILL RISE TO 5 TO 10 FEET ABOVE NORMAL BY LATE MORNING. SIGNIFICANT AND LIFE THREATENING STORM SURGE OF 15 TO 20 FEET ABOVE NORMAL WITH LARGE BATTERING WAVES IS EXPECTED THIS AFTERNOON. THE UPPER REACHES OF TAMPA BAY MAY REACH 25 FEET ABOVE NORMAL. INNUDATION OF LOW LYING AREAS WILL CONTINUE FOR MORE THAN 24 HOURS INTO LATE THURSDAY MORNING.

Tampa Bay Catastrophic Plan: PROJECT PHOENIX
Tampa Bay Regional Planning Council Draft January 2010 46
BARRIER ISLANDS WILL BE OVERTOPPED. CAUSEWAYS WILL BE WASHED AWAY AND BRIDGES DESTROYED. MANY HOMES AND BUSINESSES IN THE SURGE AREA WILL BE WASHED OFF THEIR FOUNDATAIONS. ESTIMATED STORM SURGE POTENTIAL AT LOCATIONS ACROSS TAMPA BAY: LONG BOAT KEY 13 FEET ANNA MARIA ISLAND 12 FEET SAINT PETERSBURG 18 FEET CLEARWATER BEACH 10 FEET OLDSMAR 21 FEET HUDSON 12 FEET LONG BOAT KEY 14 FEET BRADENTON 12 FEET APOLLO BEACH 21 FEET TAMPA 21 FEET ...WIND IMPACTS... EAST TO SOUTHEAST WINDS OF 60 MPH WITH HIGHER GUSTS WILL INCREASE RAPIDLY. SUSTAINED HURRICANE FORCE WINDS WILL BEGIN BY MID MORNING ALONG COASTAL AREA AND WILL MOVE INLAND AROUND NOON. PHOENIX IS FORECAST TO MOVE ASHORE AS A CATASTROPHIC CATEGORY FOUR OR FIVE HURRICANE...SIMILAR IN STRENGTH TO HURRICANE KATRINA IN 2005. AT LEAST ONE HALF OF WELL CONSTRUCTED HOMES WILL HAVE ROOF AND WALL FAILURE. GABLED ROOFS WILL FAIL...LEAVING THOSE HOMES SEVERELY DAMAGED OR DESTROYED. THE MAJORITY OF INDUSTRIAL BUILDINGS WILL BECOME NON FUNCTIONAL. PARTIAL TO COMPLETE WALL AND ROOF FAILURE IS EXPECTED. WOOD FRAMED LOW RISING APARTMENT BUILDINGS WILL BE DESTROYED. CONCRETE BLOCK LOW RISE APARTMENTS WILL SUSTAIN MAJOR DAMAGE...INCLUDING SOME WALL AND ROOF FAILURE. HIGH RISE OFFICE AND APARTMENT BUILDINGS WILL SWAY DANGEROUSLY...A FEW TO THE POINT OF TOTAL COLLAPSE. ALL WINDOWS WILL BLOW OUT. AIRBORNE DEBRIS WILL BE WIDESPREAD...AND MAY INCLUDE HEAVY ITEMS SUCH AS HOUSEHOLD APPLIANCES AND EVEN LIGHT VEHICLES. SPORT UTILITY VEHICLES AND LIGHT TRUCKS WILL BE MOVED. THE BLOWN DEBRIS WILL CREATE ADDITIONAL DESTRUCTION. PERSONS...PETS...AND LIVESTOCK EXPOSED TO THE WINDS WILL FACE CERTAIN DEATH IF STRUCK.

Tampa Bay Catastrophic Plan: PROJECT PHOENIX
Tampa Bay Regional Planning Council Draft January 2010 47
POWER OUTAGES WILL LAST FOR WEEKS...AS MOST POWER POLES WILL BE DOWN AND TRANSFORMERS DESTROYED. WATER SHORTAGES WILL MAKE HUMAN SUFFERING INCREDIBLE BY MODERN STANDARDS. THE VAST MAJORITY OF NATIVE TREES WILL BE SNAPPED OR UPROOTED. ONLY THE HEARTIEST WILL REMAIN STANDING...BUT BE TOTALLY DEFOLIATED. FEW CROPS WILL REMAIN. LIVESTOCK LEFT EXPOSED TO THE WINDS WILL BE KILLED. ...RAINFALL... RAINFALL TOTALS OF 10 TO 12 INCHES...WITH ISOLATED MAXIMUM AMOUNTS OF 20 INCHES...ARE POSSIBLE. ...INLAND FLOODING... EXPECT FLOODING OF LOW LYING AREAS...STREET INTERSECTIONS AND AREAS KNOWN FOR FLOODING THIS AFTERNOON AND EVENING. EROSION OF STREETS AND PARTIAL OR TOTAL COLLAPSE OF BRIDGES MAY CAUSE SERIUS INJURY OR DEATH TO UNSUSPECTING MOTORISTS. ...TORNADOES... ISOLATED WATERSPOUTS AND TORNADOES ARE POSSIBLE IN THE OUTER RAINBANDS OF PHOENIX MAINLY NORTH AND NORTHWEST OF THE HURRICANE. ...LOCAL MARINE IMPACTS... SOUTHEAST WINDS OF 70 TO 80 KNOTS WITH GUSTS TO 100 KNOTS ARE EXPECTED TO DEVELOP ACROSS THE COASTAL WATERS FROM ENGLEWOOD TO TARPON SPRINGS THIS MORNING...AND UP TO 120 KNOTS OR HIGHER NEAR THE CENTER OF PHOENIX. DANGEROUS LARGE SWELLS OF 15 TO 25 FEET WILL AFFECT THE WATERS UNTIL THE HURRICANE MOVES INLAND. ...NEXT UPDATE... THIS STATEMENT WILL BE UPDATED BY 900 AM EDT.

Tampa Bay Catastrophic Plan: PROJECT PHOENIX
Tampa Bay Regional Planning Council Draft January 2010 48
Simulated NWS Ruskin Hurricane Local Statement on NHC Advisory 31 Created 10/27/2009 by NWS Ruskin ALL INFORMATION AND DATA CREATED FOR SIMULATION PURPOSES URGENT - IMMEDIATE BROADCAST REQUESTED HURRICANE PHOENIX LOCAL STATEMENT NATIONAL WEATHER SERVICE TAMPA BAY FL 1100 AM EDT WED OCT 15 2014 ...HURRICANE WARNING IN EFFECT FOR MAINLAND CENTRAL WESTERN FLORIDA... ...HURRICANE WARNING IN EFFECT FOR THE GULF WATERS... ...THE EYE WALL OF CATEGORY FIVE HURRICANE PHOENIX HAS ENTERED TAMPA BAY WITH SUSTAINED WINDS OF 160 MPH ESTIMATED BY RADAR AT EGMONT KEY AND ANNA MARIA ISLAND... ...FLASH FLOOD WARNING IN EFFECT FOR CENTRAL WESTERN FLORIDA... .AT 1100 AM EDT, THE CENTER OF HURRICANE PHOENIX WAS LOCATED NEAR LATITUDE 27.5 NORTH, LONGITUDE 83.1 WEST OR 50 MILES SOUTHWEST OF TAMPA WHICH IS ABOUT 30 MILES SOUTHWEST OF SAINT PETE BEACH. THE EYE WALL OF PHOENIX IS 45 MILES ACROSS AND HAS PASSED EGMONT KEY AND ANNA MARIA ISLAND. PHOENIX IS MOVING TOWARD THE NORTHEAST AT 16 MPH. MAXIMUM SUSTAINED WINDS ARE NEAR 160 MPH WITH HIGHER GUSTS. PHOENIX IS AN EXTREMELY DANGEROUS CATEGORY FIVE HURRICANE ON THE SAFFIR SIMPSON SCALE. GMZ830-850-870-853-873-FLZ050>051-055-060-100300- /O.CON.KTBW.HU.W.0001.000000T0000Z-000000T0000Z/ COASTAL WATERS FROM ENGLEWOOD TO TARPON SPRINGS, FL OUT 20 NM- COASTAL WATERS FROM ENGLEWOOD TO TARPON SPRINGS, FL EXTENDING FROM 20 TO 60 NM- COASTAL WATERS FROM TARPON SPRINGS TO SUWANNEE RIVER, FL OUT 20 NM- COASTAL WATERS FROM TARPON SPRINGS TO SUWANNEE RIVER, FL EXTENDING FROM 20 TO 60 NM- TAMPA BAY WATERS- PASCO-PINELLAS-HILLSBOROUGH-MANATEE- 630 AM EDT THU JUN 15 2006 ...HURRICANE WARNING REMAINS IN EFFECT... ...FLASH FLOOD WARNING IN EFFECT... ...NEW INFORMATION...
Tampa Bay Catastrophic Plan: PROJECT PHOENIX
Tampa Bay Regional Planning Council Draft January 2010 49
THE EYE WALL OF HURRICANE PHOENIX WILL CONTINUE DEVESTATE THE TAMPA BAY REGION INTO LATE AFTERNOON. THE CENTER OF THE EYE WILL MOVE ONSHORE NEAR INDIAN ROCKS BEACH BEFORE NOON. THE FORWARD EDGE OF THE EYE WALL WILL REACH DOWNTOWN TAMPA AND NEW PORT RICHEY BY 1130 AM... BROOKSVILLE AND ZERPHYHILLS AROUND 1 PM...BUSNELL AROUND 230 PM...AND THE VILLAGES AROUND 330 PM. ...AREAS AFFECTED... THIS STATEMENT RECOMMENDS ACTIONS TO BE TAKEN BY PERSONS IN THE FOLLOWING COUNTIES OR MARINE AREAS: WATERS FROM ENGLEWOOD TO SUWANNEE RIVER OUT TO 60 NM...TAMPA BAY WATERS...PASCO...PINELLAS... HILLSBOROUGH AND MANATEE COUNTIES. ...WATCHES/WARNINGS... THE FOLLOWING WATCHES AND WARNINGS ARE CURRENTLY IN EFFECT FOR THIS AREA: HURRICANE WARNING. FLASH FLOOD WARNING. ...PRECAUTIONARY/PREPAREDNESS ACTIONS... THE TIME TO PREPARE AND PROTECT PROPERTY IS NOW OVER. RESIDENTS MUST REMAIN SHELTERED AS BEST THEY CAN. MARINE CRAFT MUST STAY IN SAFE PORT AS LETHAL MARINE CONDITIONS WILL PREVAIL. ...STORM SURGE IMPACTS... A STORM TIDE OF 13 FEET WAS MEASURED AT ANNA MARIA ISLAND BEFORE THE TIDE GAUGE FAILED. THE SURGE HAS OVERTOPPED BARRIER ISLANDS FROM NORTH OF SARASOTA TO TREASURE ISLAND AND HAS CAUSED EXTENSIVE INNUNDATION IN WEST BRADENTON. STORM SURGE CONDITIONS WILL BECOME EVEN WORSE. THE TAMPA BAY AREA CAN EXPECT A LIFE THREATENING STORM SURGE OF 15 TO 20 FEET ABOVE NORMAL TO PERSIST INTO THE EVENING. LARGE BATTERING WAVES ON TOP OF THE SURGE WILL ADD TO THE EXPECTED DAMAGE. THE UPPER REACHES OF TAMPA BAY MAY REACH 26 FEET ABOVE NORMAL. INNUDATION OF LOW LYING AREAS WILL CONTINUE FOR MORE THAN 24 HOURS INTO FRIDAY AFTERNOON.

Tampa Bay Catastrophic Plan: PROJECT PHOENIX
Tampa Bay Regional Planning Council Draft January 2010 50
BARRIER ISLANDS WILL BE OVERTOPPED. CAUSEWAYS WILL BE WASHED AWAY AND BRIDGES DESTROYED. MANY HOMES AND BUSINESSES IN THE SURGE AREA WILL BE WASHED OFF THEIR FOUNDATAIONS. ESTIMATED STORM SURGE POTENTIAL AT LOCATIONS ACROSS TAMPA BAY: LONG BOAT KEY 15 FEET ANNA MARIA ISLAND 14 FEET SAINT PETERSBURG 20 FEET CLEARWATER BEACH 11 FEET OLDSMAR 23 FEET HUDSON 14 FEET LONG BOAT KEY 16 FEET BRADENTON 14 FEET APOLLO BEACH 24 FEET TAMPA 26 FEET ...WIND IMPACTS... EAST TO SOUTHEAST WINDS OF 80 TO 90 MPH WITH HIGHER GUSTS OVER THE AREA WILL CONTINUE TO INCREASE WITH THE CORE OF THE STRONGEST WINDS...160 MPH WITH HIGHER GUSTS WITH THE EYE WALL. AT LEAST ONE HALF OF WELL CONSTRUCTED HOMES WILL HAVE ROOF AND WALL FAILURE. GABLED ROOFS WILL FAIL...LEAVING THOSE HOMES SEVERELY DAMAGED OR DESTROYED. THE MAJORITY OF INDUSTRIAL BUILDINGS WILL BECOME NON FUNCTIONAL. PARTIAL TO COMPLETE WALL AND ROOF FAILURE IS EXPECTED. WOOD FRAMED LOW RISING APARTMENT BUILDINGS WILL BE DESTROYED. CONCRETE BLOCK LOW RISE APARTMENTS WILL SUSTAIN MAJOR DAMAGE...INCLUDING SOME WALL AND ROOF FAILURE. HIGH RISE OFFICE AND APARTMENT BUILDINGS WILL SWAY DANGEROUSLY...A FEW TO THE POINT OF TOTAL COLLAPSE. ALL WINDOWS WILL BLOW OUT. AIRBORNE DEBRIS WILL BE WIDESPREAD...AND MAY INCLUDE HEAVY ITEMS SUCH AS HOUSEHOLD APPLIANCES AND EVEN LIGHT VEHICLES. SPORT UTILITY VEHICLES AND LIGHT TRUCKS WILL BE MOVED. THE BLOWN DEBRIS WILL CREATE ADDITIONAL DESTRUCTION. PERSONS...PETS...AND LIVESTOCK EXPOSED TO THE WINDS WILL FACE CERTAIN DEATH IF STRUCK. POWER OUTAGES WILL LAST FOR WEEKS...AS MOST POWER POLES WILL BE DOWN AND TRANSFORMERS DESTROYED. WATER SHORTAGES WILL MAKE HUMAN SUFFERING INCREDIBLE BY MODERN STANDARDS.
Tampa Bay Catastrophic Plan: PROJECT PHOENIX
Tampa Bay Regional Planning Council Draft January 2010 51
THE VAST MAJORITY OF NATIVE TREES WILL BE SNAPPED OR UPROOTED. ONLY THE HEARTIEST WILL REMAIN STANDING...BUT BE TOTALLY DEFOLIATED. FEW CROPS WILL REMAIN. LIVESTOCK LEFT EXPOSED TO THE WINDS WILL BE KILLED. ...RAINFALL... RAINFALL TOTALS OF 12 TO 15 INCHES...WITH ISOLATED MAXIMUM AMOUNTS OF 20 INCHES...ARE POSSIBLE NORTH AND WEST OF SUN CITY CENTER. ACROSS THE REST OF THE AREA...RAINFALL OF 6 INCHES OR LESS ARE EXPECTED. ...INLAND FLOODING... EXPECT FLOODING OF LOW LYING AREAS...STREET INTERSECTIONS AND AREAS KNOWN FOR FLOODING THIS AFTERNOON AND EVENING. EROSION OF STREETS AND PARTIAL OR TOTAL COLLAPSE OF BRIDGES MAY CAUSE SERIUS INJURY OR DEATH TO UNSUSPECTING MOTORISTS. ...TORNADOES... ISOLATED TORNADOES ARE STILL POSSIBLE THROUGH THE EARLY AFTERNOON HOURS FROM CEDARY KEY TO THE VILLAGES. ...LOCAL MARINE IMPACTS... SOUTHEAST WINDS OF NEAR 100 KNOTS WITH HIGHER GUSTS ARE AFFECTING THE CENTRAL COASTAL WATERS FROM ENGLEWOOD TO TARPON SPRINGS...AND UP TO 140 KNOTS OR HIGHER NEAR THE CENTER OF HURRICANE PHOENIX. WINDS ARE GRADUALLY SHIFTING FROM THE SOUTH AND SOUTHWEST AT AS THE CENTER OF PHOENIX APPROACHES THE COASTLINE. DANGEROUS LARGE SWELLS OF 15 TO 20 FEET WILL AFFECT THE WATERS UNTIL THE HURRICANE MOVES INLAND. ...NEXT UPDATE... THIS STATEMENT WILL BE UPDATED BY 230 PM EDT. $$

Tampa Bay Catastrophic Plan: PROJECT PHOENIX
Tampa Bay Regional Planning Council Draft January 2010 52
Hurricane Phoenix Location and Intensity Information for Simulated NHC Advisories 11‐34 Advisory Date/Time Lat Lon Pressure Max Wind Movement 11 10oct15z 11am 16.8 77.8 985 mb 70 kts W at 6 kts 12 10oct21z 5pm 16.8 78.4 984 mb 70 kts W at 5 kts 13 11oct03z 11pm 16.8 78.9 984 mb 70 kts W at 6 kts 14 11oct09z 5am 16.8 79.5 982 mb 75 kts W at 7 kts 15 11oct15z 11am 16.8 80.2 979 mb 75 kts W at 5 kts 16 11oct21z 5pm 16.8 80.7 979 mb 75 kts W at 6 kts 17 12oct03z 11pm 17.0 81.3 977 mb 75 kts WNW at 7 kts 18 12oct09z 5am 17.3 82.0 975 mb 80 kts WNW at 6 kts 19 12oct15z 11am 17.7 82.6 974 mb 80 kts NW at 7 kts 20 12oct21z 5pm 18.0 83.2 974 mb 80 kts NW at 8 kts 21 13oct03z 11pm 18.4 83.8 972 mb 85 kts NW at 6 kts 22 13oct09z 5am 18.9 84.3 970 mb 85 kts NW at 7 kts 23 13oct15z 11am 19.4 84.8 968 mb 90 kts NW at 8 kts 24 13oct21z 5pm 20.1 85.2 960 mb 95 kts NW at 10 kts 25 14oct03z 11pm 21.0 85.3 960 mb 95 kts N at 10 kts 26 14oct09z 5am 22.0 85.2 955 mb 100 kts N at 9 kts 27 14oct15z 11am 22.9 85.0 952 mb 105 kts NNE at 12 kts 28 14oct21z 5pm 24.1 84.8 949 mb 110 kts NNE at 12 kts 29 15oct03z 11pm 25.2 84.4 938 mb 120 kts NE at 14 kts 30 15oct09z 5am 26.4 83.7 930 mb 130 kts NE at 13 kts 31 15oct15z 11am 27.5 83.1 918 mb 140 kts NE at 12 kts 32 15oct21z 5pm 28.5 82.3 933 mb 115 kts NE at 15 kts 33 16oct03z 11pm 29.8 81.4 959 mb 90 kts NE at 16 kts 34 16oct09z 5am 31.3 80.7 975 mb 85 kts NE at 16 kts

Tampa Bay Catastrophic Plan: PROJECT PHOENIX
Tampa Bay Regional Planning Council Draft January 2010 53
APPENDIX B – HAZUS CONSEQUENCES TABLES

Tampa Bay Catastrophic Plan: PROJECT PHOENIX
Tampa Bay Regional Planning Council Draft January 2010 54
THIS PAGE INTENTIONALLY LEFT BLANK
Tampa Bay Catastrophic Plan: PROJECT PHOENIX
Tampa Bay Regional Planning Council Draft January 2010 55
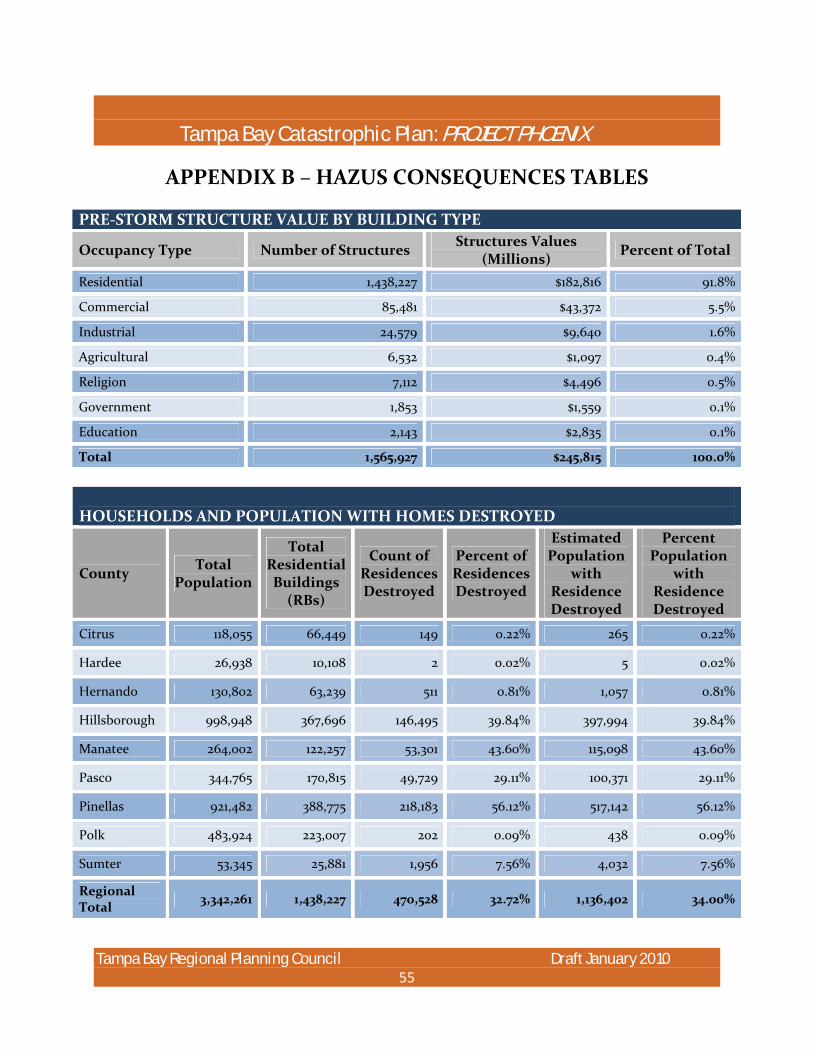
APPENDIX B – HAZUS CONSEQUENCES TABLES
PRE‐STORM STRUCTURE VALUE BY BUILDING TYPE
Occupancy Type Number of Structures Structures Values (Millions) Percent of Total
Residential 1,438,227 $182,816 91.8%
Commercial 85,481 $43,372 5.5%
Industrial 24,579 $9,640 1.6%
Agricultural 6,532 $1,097 0.4%
Religion 7,112 $4,496 0.5%
Government 1,853 $1,559 0.1%
Education 2,143 $2,835 0.1%
Total 1,565,927 $245,815 100.0%
HOUSEHOLDS AND POPULATION WITH HOMES DESTROYED
County Total Population
Total Residential Buildings
(RBs)
Count of Residences Destroyed
Percent of Residences Destroyed
Estimated Population
with Residence Destroyed
Percent Population
with Residence Destroyed
Citrus 118,055 66,449 149 0.22% 265 0.22%
Hardee 26,938 10,108 2 0.02% 5 0.02%
Hernando 130,802 63,239 511 0.81% 1,057 0.81%
Hillsborough 998,948 367,696 146,495 39.84% 397,994 39.84%
Manatee 264,002 122,257 53,301 43.60% 115,098 43.60%
Pasco 344,765 170,815 49,729 29.11% 100,371 29.11%
Pinellas 921,482 388,775 218,183 56.12% 517,142 56.12%
Polk 483,924 223,007 202 0.09% 438 0.09%
Sumter 53,345 25,881 1,956 7.56% 4,032 7.56%
Regional Total 3,342,261 1,438,227 470,528 32.72% 1,136,402 34.00%
Tampa Bay Catastrophic Plan: PROJECT PHOENIX
Tampa Bay Regional Planning Council Draft January 2010 56
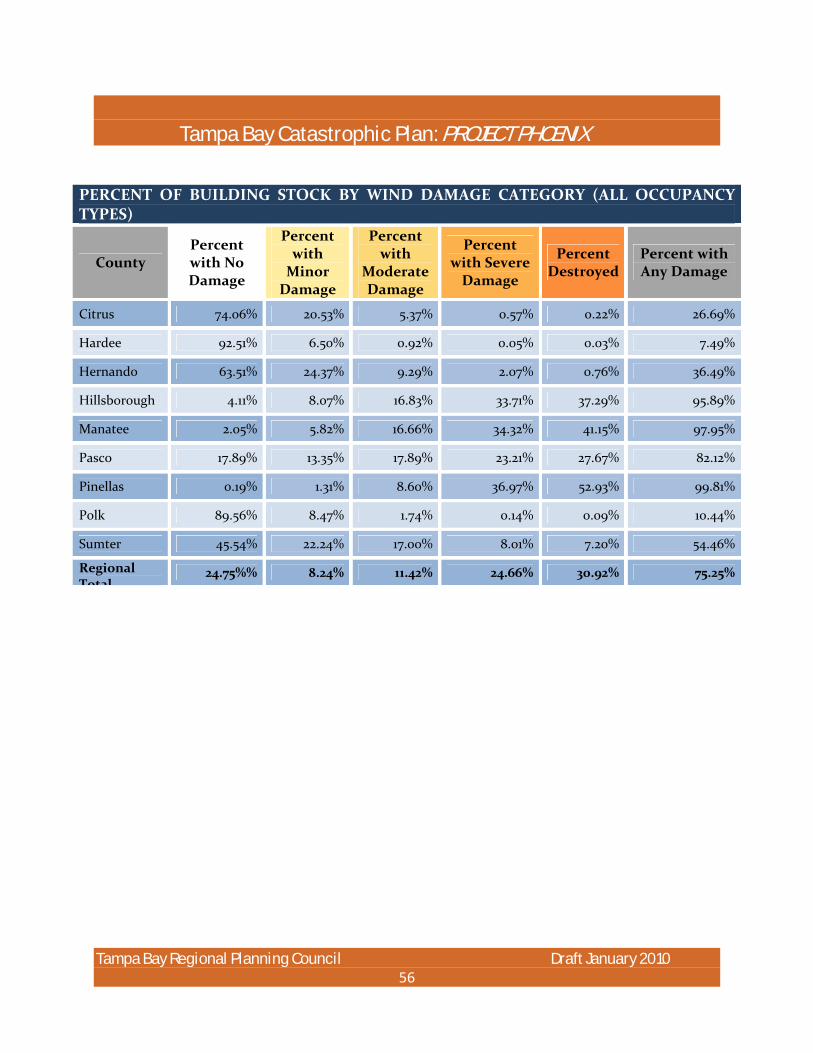
PERCENT OF BUILDING STOCK BY WIND DAMAGE CATEGORY (ALL OCCUPANCY TYPES)
County Percent with No Damage
Percent with Minor Damage
Percent with
Moderate Damage
Percent with Severe Damage
Percent Destroyed
Percent with Any Damage
Citrus 74.06% 20.53% 5.37% 0.57% 0.22% 26.69%
Hardee 92.51% 6.50% 0.92% 0.05% 0.03% 7.49%
Hernando 63.51% 24.37% 9.29% 2.07% 0.76% 36.49%
Hillsborough 4.11% 8.07% 16.83% 33.71% 37.29% 95.89%
Manatee 2.05% 5.82% 16.66% 34.32% 41.15% 97.95%
Pasco 17.89% 13.35% 17.89% 23.21% 27.67% 82.12%
Pinellas 0.19% 1.31% 8.60% 36.97% 52.93% 99.81%
Polk 89.56% 8.47% 1.74% 0.14% 0.09% 10.44%
Sumter 45.54% 22.24% 17.00% 8.01% 7.20% 54.46%
Regional Total
24.75%% 8.24% 11.42% 24.66% 30.92% 75.25%

Tampa Bay Catastrophic Plan: PROJECT PHOENIX
Tampa Bay Regional Planning Council Draft January 2010 57
NUMBER OF BUILDINGS BY WIND DAMAGE CATEGORY (ALL OCCUPANCY TYPES)
County
Number of
Structures in County
Total Structures Affected
Number of
Structures with No Damage
Number of
Structures with Minor Damage
Number of
Structures with
Moderate Damage
Number of
Structures with Severe Damage
Number of
Structures Destroyed
Citrus 71,714 18,996 52,714 14,614 3,822 406 154
Hardee 10,968 822 10,146 713 101 5 3
Hernando 69,266 25,278 43,988 16,881 6,437 1,434 526
Hillsborough 405,461 388,798 16,664 32,702 68,236 136,674 151,185
Manatee 132,349 129,637 2,713 7,706 22,043 45,428 54,459
Pasco 183,387 150,589 32,802 24,479 32,804 42,567 50,738
Pinellas 425,113 424,291 822 5,566 36,560 157,171 224,994
Polk 240,300 25,079 215,220 20,359 4,172 340 208
Sumter 27,373 14,906 12,467 6,089 4,653 2,193 1,971
Regional Total 1,565,931 1,178,393 387,536 129,109 178,828 386,218 484,238

Tampa Bay Catastrophic Plan: PROJECT PHOENIX
Tampa Bay Regional Planning Council Draft January 2010 58
WIND DAMAGE TO RESIDENTIAL STRUCTURES
County
Number of Residential Structures in County
Pre‐Storm Residential Exposure (Millions)
Percent of Structures with No Damage
Percent of Structures
with Minor Damage
Percent of Structures
with Moderate Damage
Percent of Structures
with Severe Damage
Percent of Structures Destroyed
Citrus 66,449 $6,008 73.87% 20.56% 4.93% 0.41% 0.22%
Hardee 10,108 $931 85.40% 5.94% 0.77% 0.03% 0.02%
Hernando 63,239 $6,649 63.89% 24.80% 8.77% 1.72% 0.81%
Hillsborough 367,696 $55,882 4.19% 8.44% 17.15% 30.38% 39.84%
Manatee 122,257 $16,075 1.99% 6.00% 16.90% 31.51% 43.76%
Pasco 170,815 $17,932 18.12% 13.59% 17.89% 21.28% 29.11%
Pinellas 388,705 $53,168 0.16% 1.34% 8.77% 33.63% 56.13%
Polk 223,007 $23,798 89.79% 8.43% 1.59% 0.09% 0.09%
Sumter 25,881 $2,374 45.81% 22.33% 16.72% 7.58% 7.56%
Regional Total 1,438,157 $181,855 25.05% 8.44% 11.48 22.31 32.72%

Tampa Bay Catastrophic Plan: PROJECT PHOENIX
Tampa Bay Regional Planning Council Draft January 2010 59
WIND DAMAGE TO COMMERCIAL STRUCTURES
County
Number of Commercial Structures in County
Pre‐Storm Commercial Exposure (Millions)
Percent of Structures with No Damage
Percent of Structures
with Minor Damage
Percent of Structures
with Moderate Damage
Percent of Structures
with Severe Damage
Percent of Structures Destroyed
Citrus 3,484 1,276 68.77% 17.94% 10.99% 2.27% 0.03%
Hardee 488 166 90.57% 7.17% 2.05% 0.20% 0%
Hernando 3,902 1,386 58.53% 19.73% 15.86% 5.72% 0.13%
Hillsborough 25,862 16,624 3.22% 4.03% 13.72% 65.39% 13.64%
Manatee 6,510 3,022 2.67% 3.52% 13.99% 67.57% 12.26%
Pasco 8,249 3,547 14.47% 9.73% 18.22% 49.32% 8.27%
Pinellas 25,031 11,848 0.58% 1.01% 7.03% 71.19% 20.19%
Polk 11,043 5,188 86.39% 9.03% 3.87% 0.71% 0.01%
Sumter 912 315 40.57% 19.96% 22.81% 15.79% 0.77%
Regional Total 85,481 $43,372 20.33% 5.77% 10.96% 51.15% 11.79%
Tampa Bay Catastrophic Plan: PROJECT PHOENIX
Tampa Bay Regional Planning Council Draft January 2010 60
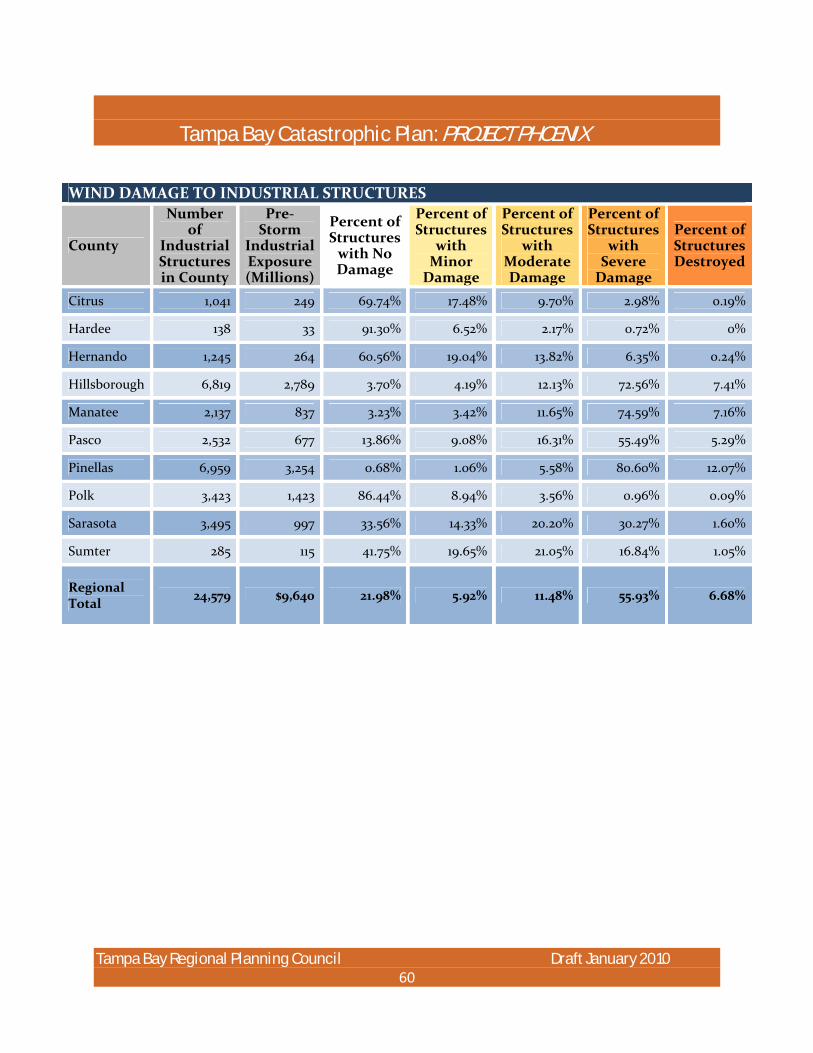
WIND DAMAGE TO INDUSTRIAL STRUCTURES
County
Number of
Industrial Structures in County
Pre‐Storm
Industrial Exposure (Millions)
Percent of Structures with No Damage
Percent of Structures
with Minor Damage
Percent of Structures
with Moderate Damage
Percent of Structures
with Severe Damage
Percent of Structures Destroyed
Citrus 1,041 249 69.74% 17.48% 9.70% 2.98% 0.19%
Hardee 138 33 91.30% 6.52% 2.17% 0.72% 0%
Hernando 1,245 264 60.56% 19.04% 13.82% 6.35% 0.24%
Hillsborough 6,819 2,789 3.70% 4.19% 12.13% 72.56% 7.41%
Manatee 2,137 837 3.23% 3.42% 11.65% 74.59% 7.16%
Pasco 2,532 677 13.86% 9.08% 16.31% 55.49% 5.29%
Pinellas 6,959 3,254 0.68% 1.06% 5.58% 80.60% 12.07%
Polk 3,423 1,423 86.44% 8.94% 3.56% 0.96% 0.09%
Sarasota 3,495 997 33.56% 14.33% 20.20% 30.27% 1.60%
Sumter 285 115 41.75% 19.65% 21.05% 16.84% 1.05%
Regional Total 24,579 $9,640 21.98% 5.92% 11.48% 55.93% 6.68%

Tampa Bay Catastrophic Plan: PROJECT PHOENIX
Tampa Bay Regional Planning Council Draft January 2010 61
NUMBER OF BUILDINGS BY STORM SURGE DAMAGE CATEGORY
Counties Total Structures
Number With Minor Damage
Number With Moderate Damage
Number with Severe
Damage or Destroyed
Number With More Than Minor Damage
Citrus 71,711 1 3,012 1,301 4,313
Hernando 69,266 0 1,480 398 1,878
Hillsborough 405,461 67 42,678 38,252 80,930
Manatee 132,349 19 19,470 9,271 28,741
Pasco 183,387 7 11,653 6,626 18,279
Pinellas 425,113 70 85,265 36,979 122,244
Total 1,287,287 164 163,558 92,827 256,385
PERCENT OF BUILDING STOCK BY STORM SURGE DAMAGE CATEGORY
Counties Total Structures
Percent With Minor Damage
Percent With Moderate Damage
Percent with Severe
Damage or Destroyed
Percent With More Than Minor Damage
Citrus 71,711 0.0% 4.2% 1.8% 6.0%
Hernando 69,266 0.0% 2.1% 0.5% 2.6%
Hillsborough 405,461 0.0% 10.5% 9.4% 19.9%
Manatee 132,349 0.0% 14.7% 7.0% 21.7%
Pasco 183,387 0.0% 6.4% 3.6% 10.0%
Pinellas 425,113 0.0% 20.1% 8.6% 28.7%
Total 1,287,287 0.0% 12.7% 7.2% 19.9%

Tampa Bay Catastrophic Plan: PROJECT PHOENIX
Tampa Bay Regional Planning Council Draft January 2010 62
STORM SURGE DAMAGE TO RESIDENTIAL STRUCTURES
Counties Total
Residential Structures
Pre‐Storm Residential Structures
Value (millions of $)
Percent With Minor Damage
Percent With
Moderate Damage
Percent with Severe Damage
or Destroyed
Percent With More Than Minor Damage
Citrus 66,447 6,008 0.0% 4.5% 2.0% 6.5%
Hernando 63,240 6,649 0.0% 2.3% 0.6% 2.9%
Hillsborough 367,713 55,881 0.0% 11.3% 10.3% 21.6%
Manatee 122,250 16,075 0.0% 15.2% 7.6% 22.8%
Pasco 170,807 17,932 0.0% 11.1% 3.9% 15.0%
Pinellas 388,766 53,168 0.0% 21.1% 9.5% 30.6%
Total 1,179,223 155,713 0.0% 14.0% 7.8% 21.9%
STORM SURGE DAMAGE TO COMMERCIAL STRUCTURES
Counties Total
Commercial Structures
Pre‐Storm Commercial Structures
Value (millions of $)
Percent With Minor Damage
Percent With
Moderate Damage
Percent with Severe Damage
or Destroyed
Percent With More Than Minor Damage
Citrus 3,484 1,276 0.0% 1.3% 0.0% 1.3%
Hernando 3,902 1,386 0.0% 0.0% 0.0% 0.0%
Hillsborough 25,862 16,624 0.1% 3.3% 1.3% 4.6%
Manatee 6,510 3,022 0.0% 1.8% 0.0% 1.8%
Pasco 8,249 3,547 0.0% 1.6% 0.0% 1.6%
Pinellas 25,031 11,848 0.2% 3.1% 1.0% 4.1%
Total 73,038 37,703 0.1% 2.6% 0.8% 3.4%

Tampa Bay Catastrophic Plan: PROJECT PHOENIX
Tampa Bay Regional Planning Council Draft January 2010 63
STORM SURGE DAMAGE TO INDUSTRIAL STRUCTURES
Counties Total
Industrial Structures
Pre‐Storm Industrial Structures
Value (millions of
$)
Percent With Minor Damage
Percent With
Moderate Damage
Percent with Severe Damage
or Destroyed
Percent With More Than Minor Damage
Citrus 1,041 249 0.0% 0.0% 0.0% 0.0%
Hernando 1,245 264 0.0% 0.0% 0.0% 0.0%
Hillsborough 6,819 2,789 0.0% 2.6% 0.5% 3.1%
Manatee 2,137 837 0.0% 0.5% 0.0% 0.5%
Pasco 2,532 677 0.0% 0.1% 0.1% 0.2%
Pinellas 6,959 3,254 0.1% 8.0% 0.6% 8.6%
Total 20,733 8,070 0.0% 3.6% 0.4% 4.0%
STORM SURGE DAMAGE TO AGRICULTURAL, EDUCATIONAL, AND GOVERNMENTAL STRUCTURES
Counties
Total Agriculture, Govt. and
Educational Structures
Pre‐Storm Agriculture, Govt. and
Educational Structures
Value (Millions of $)
Percent With Minor Damage
Percent With
Moderate Damage
Percent with Severe Damage
or Destroyed
Percent With More Than Minor Damage
Citrus 464 125 0.2% 0.4% 0.0% 0.0% Hernando 601 174 0.0% 0.0% 0.0% 0.0% Hillsborough 2,956 2,265 1.1% 6.0% 1.0% 7.0% Manatee 813 361 0.6% 0.2% 0.0% 0.2% Pasco 1,138 483 0.3% 0.6% 0.0% 0.6% Pinellas 2,541 1,085 0.0% 1.7% 0.3% 2.0% Total 8,513 4,493 0.5% 2.7% 0.4% 3.1%

Tampa Bay Catastrophic Plan: PROJECT PHOENIX
Tampa Bay Regional Planning Council Draft January 2010 64
PROPERTY DAMAGE DUE TO STORM SURGE
Counties Structural Damage (Millions of $)
Contents and Inventory Damage (Millions of $)
Total Property Damage (Millions of
$) Citrus 278 348 627 Hernando 132 116 248 Hillsborough 10,893 11,026 21,920 Manatee 2,620 2,456 5,076 Pasco 1,789 1,880 3,669 Pinellas 12,824 12,725 25,548 Total 28,536 28,551 57,088
COMBINED DAMAGE The following table summarizes the combined damage from wind and storm surge flooding.
Counties
Pre‐Storm
Building Stock Value
(Millions of $)
Total Structural Damage from Wind
(Millions of $)
Percent of Pre‐Storm
Building Stock Value Loss from Wind
Total Structural Damage from Storm Surge
(Millions of $)
Percent of Pre‐Storm
Building Stock Value
Loss from Storm Surge
Total Combined Structural Damage (Millions
of $)
Total Combined Percent of Pre‐Storm Building
Stock Value Loss
Citrus 7,808 168 2.2% 278 3.6% 440 5.6% Hardee 1,231 7 0.1% 0 0.0% 7 0.1% Hernando 8,637 367 4.2% 132 1.5% 494 5.7% Hillsborough 78,949 48,276 61.1% 10,893 13.8% 52,508 66.5% Manatee 20,681 12,900 62.4% 2,620 12.7% 13,886 67.1% Pasco 23,006 10,715 46.6% 1,789 7.8% 11,671 50.7% Pinellas 70,489 54,287 77.0% 12,824 18.2% 57,235 81.2% Polk 32,084 313 1.0% 0 0.0% 313 1.0% Sumter 2,931 527 18.0% 0 0.0% 527 18.0% Total 244,585 127,553 52.2% 28,536 11.7% 141,207 57.7%

Tampa Bay Catastrophic Plan: PROJECT PHOENIX
Tampa Bay Regional Planning Council Draft January 2010 65
THIS PAGE INTENTIONALLY LEFT BLANK
Tampa Bay Catastrophic Plan: PROJECT PHOENIX
Tampa Bay Regional Planning Council Draft January 2010