Embed Size (px)
Citation preview

© Stuart Burge 2013: This is a draft document. If you have any comments please contact [email protected]
Tel: 01788 550015 | E-Mail: [email protected] | Web: www.burgehugheswalsh.co.uk Burge Hughes Walsh - Suite 13b Davy Court - Castle Mound Way - Central Park - Rugby - Warwickshire - CV23 0UZ
Page 1 of 14
The Systems Thinking Tool Box
Dr Stuart Burge
“.. bump, bump, bump, on the back of his head. It is, as far as he knows the only way
of coming downstairs, but sometimes he feels that there really is another way, if only
he could stop bumping for a moment and think of it.”
Winnie the Pooh - A. A. Milne
Affinity Diagram (AD)
What is it and what does it do?
Affinity Diagramming is a simple tool that allows a team to:
Generate ideas about a situation or problem.
Organize a large number of ideas, opinions and issues into meaningful
groups.
Communicate their ideas in a simple and powerful representation.
Why do it?
When attempting to understand a situation or solve a problem, the task is to find
amongst all the possibilities those critical aspects or solution respectively. Borne out
of a reductionist mind-set, we often attempt to do this in one-step by “jumping” to the
“answer” since we obtain an outcome quickly. This obsession with speed typically
results in the wrong understanding or solution, thus requiring a return to and
reconsideration of the situation or problem at a later date typically at great expense
in terms of cost and time.
Systems Thinking, however, asserts that we need to be more holistic and consider
the whole of the situation or problem. Achieving this logically comprises two
activities:
1. Generating information
2. Organizing information.
© Stuart Burge 2013: This is a draft document. If you have any comments please contact [email protected]
Tel: 01788 550015 | E-Mail: [email protected] | Web: www.burgehugheswalsh.co.uk Burge Hughes Walsh - Suite 13b Davy Court - Castle Mound Way - Central Park - Rugby - Warwickshire - CV23 0UZ
Page 2 of 14
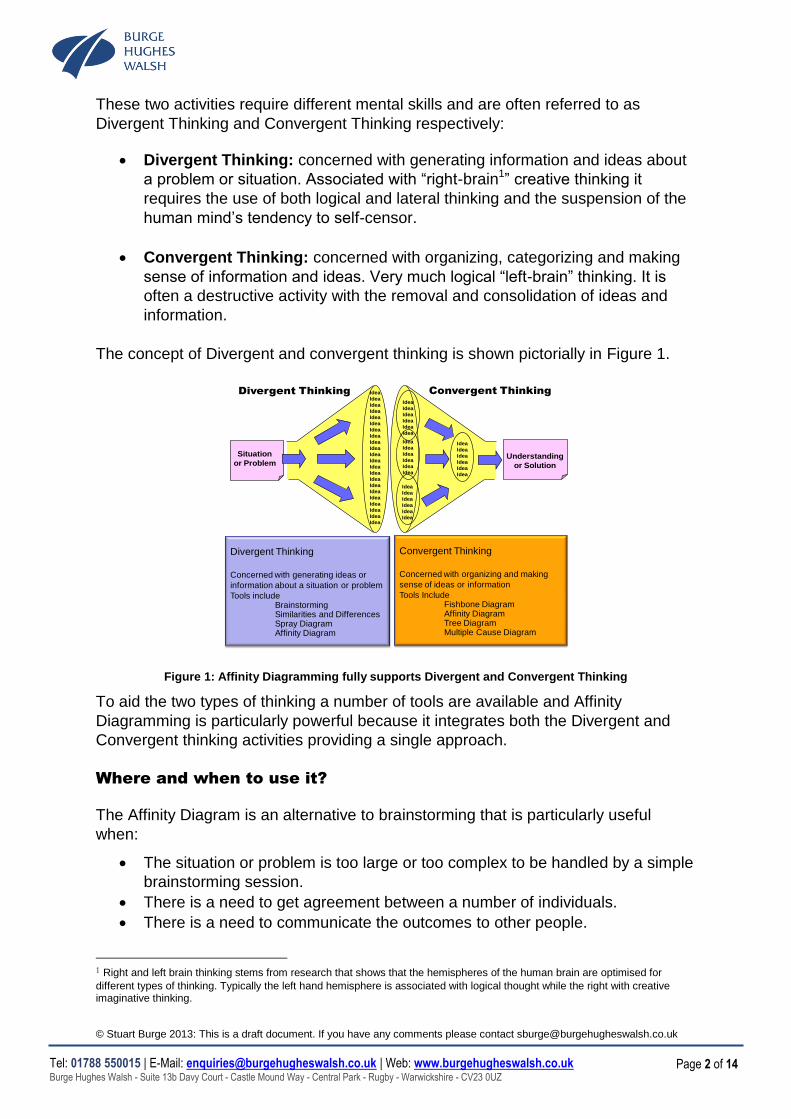
These two activities require different mental skills and are often referred to as
Divergent Thinking and Convergent Thinking respectively:
Divergent Thinking: concerned with generating information and ideas about
a problem or situation. Associated with “right-brain1” creative thinking it
requires the use of both logical and lateral thinking and the suspension of the
human mind’s tendency to self-censor.
Convergent Thinking: concerned with organizing, categorizing and making
sense of information and ideas. Very much logical “left-brain” thinking. It is
often a destructive activity with the removal and consolidation of ideas and
information.
The concept of Divergent and convergent thinking is shown pictorially in Figure 1.
Figure 1: Affinity Diagramming fully supports Divergent and Convergent Thinking
To aid the two types of thinking a number of tools are available and Affinity
Diagramming is particularly powerful because it integrates both the Divergent and
Convergent thinking activities providing a single approach.
Where and when to use it?
The Affinity Diagram is an alternative to brainstorming that is particularly useful
when:
The situation or problem is too large or too complex to be handled by a simple
brainstorming session.
There is a need to get agreement between a number of individuals.
There is a need to communicate the outcomes to other people.
1 Right and left brain thinking stems from research that shows that the hemispheres of the human brain are optimised for
different types of thinking. Typically the left hand hemisphere is associated with logical thought while the right with creative imaginative thinking.
Situation
or Problem
Divergent Thinking Idea
Idea
Idea
Idea
Idea
Idea
Idea
Idea
Idea
Idea
Idea
Idea
Idea
Idea
Idea
Idea
Idea
Idea
Idea
Idea
Idea
Idea
Understanding
or Solution
Idea
Idea
Idea
Idea
Idea
Idea
Idea
Idea
Idea
Idea
Idea
Idea
Idea
Idea
Idea
Idea
Idea
Idea
Idea
Idea
Idea
Idea
Idea
Idea
Convergent Thinking
Divergent Thinking
Concerned with generating ideas or
information about a situation or problem
Tools includeBrainstormingSimilarities and DifferencesSpray DiagramAffinity Diagram
Convergent Thinking
Concerned with organizing and making
sense of ideas or information
Tools IncludeFishbone DiagramAffinity DiagramTree DiagramMultiple Cause Diagram
© Stuart Burge 2013: This is a draft document. If you have any comments please contact [email protected]
Tel: 01788 550015 | E-Mail: [email protected] | Web: www.burgehugheswalsh.co.uk Burge Hughes Walsh - Suite 13b Davy Court - Castle Mound Way - Central Park - Rugby - Warwickshire - CV23 0UZ
Page 3 of 14
There are likely to be issues around group dynamics where it is not possible
or desirable to have a non-hierarchical group.
Who does it?
Affinity Diagrams can be created by an individual or, more powerfully, by a team.
This is primarily because it is a creative thinking tool whose purpose is to generate
information about the problem or situation. It is therefore important that a team
comprises members who have knowledge about the situation or problem. There is,
however, no reason why this core team cannot be supplemented with additional
members who have limited experience of the situation or problem. This can help
ensure that “obvious” or “basic” information is not excluded; experts often mentally
“self-censor” ideas non-experts do not.
There is great benefit in terms of quality of output and time efficiency if the sessions
are facilitated by people, who are familiar with the tool and its use.
How to do it?
There are two basic approaches to generating an Affinity Diagram: the classic
approach, which can be accomplished with or without a facilitator, and the facilitated
approach (which must be done with a facilitator).
The Classic Affinity Diagram Approach
Divergent Thinking Stage
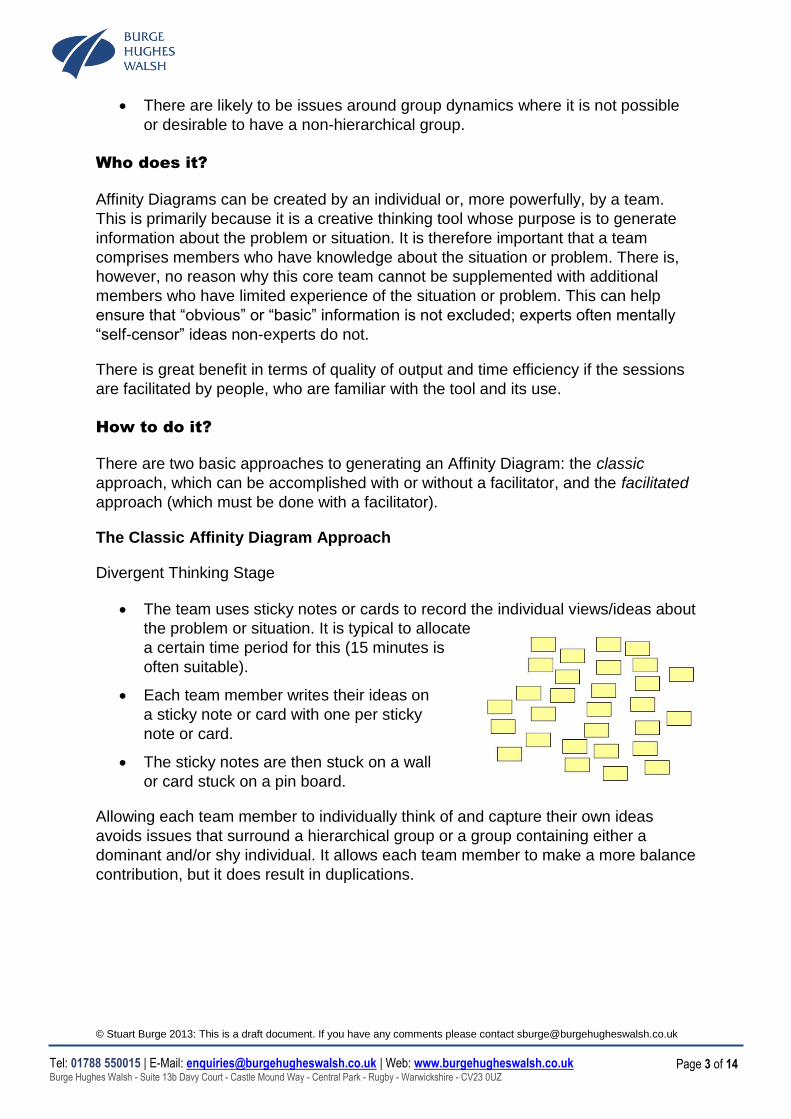
The team uses sticky notes or cards to record the individual views/ideas about
the problem or situation. It is typical to allocate
a certain time period for this (15 minutes is
often suitable).
Each team member writes their ideas on
a sticky note or card with one per sticky
note or card.
The sticky notes are then stuck on a wall
or card stuck on a pin board.
Allowing each team member to individually think of and capture their own ideas
avoids issues that surround a hierarchical group or a group containing either a
dominant and/or shy individual. It allows each team member to make a more balance
contribution, but it does result in duplications.

© Stuart Burge 2013: This is a draft document. If you have any comments please contact [email protected]
Tel: 01788 550015 | E-Mail: [email protected] | Web: www.burgehugheswalsh.co.uk Burge Hughes Walsh - Suite 13b Davy Court - Castle Mound Way - Central Park - Rugby - Warwickshire - CV23 0UZ
Page 4 of 14
Convergent Thinking Stage
In silence, the team organize the sticky notes or cards
into related groups that are thematically linked; that
have an affinity. The intent is to let the natural groups
emerge consensually. Silence is used to restrict
individuals from forcing non- consensual structure on
the outcome.
1. Everyone is allowed to move the sticky notes or
cards in order to place them with others with which
they consider they have affinities.
2. Existing groups can be broken and new groups should be allowed to
emerge.
Once the groups have reached a stable state, the team should now discuss
the groups to:
1. Give each group a header. This may be an
existing sticky note or card.
2. Larger groups should be sub-divided into smaller
groups. A useful rule of thumb is to aim for group
sizes of five to seven of different sticky notes or
cards (if there are potential duplications – see next
step – the group size can be larger. If sub-groups
are formed, they too should be given a header.
The last step is to review the Affinity Diagram to:
o Reconcile duplications. There are two possibilities here:
1. Exactly the same words on two or more sticky
notes or cards. These should be discussed to
determine whether they are capturing the same
information or ideas. If they are then the
duplications should be removed. If the words
capture different ideas or information the sticky
note should be rewritten.
2. The words are similar or appear to be
recording the same information. These should
be discussed to determine whether they are capturing the same
information or ideas. If they are then a suitable set of words should be
agreed. If the words capture different ideas or information then
consideration should be given to rewriting the sticky notes or cards to
make the difference clear.
o One of the advantages of grouping the sticky notes or cards is that it
makes it much easy to review the diagram to identify missing ideas or
information. Each group on the Affinity Diagram should be examined to
determine, and record, additional ideas or information that is pertinent.

© Stuart Burge 2013: This is a draft document. If you have any comments please contact [email protected]
Tel: 01788 550015 | E-Mail: [email protected] | Web: www.burgehugheswalsh.co.uk Burge Hughes Walsh - Suite 13b Davy Court - Castle Mound Way - Central Park - Rugby - Warwickshire - CV23 0UZ
Page 5 of 14
o Consider different groupings. The whole Affinity Diagram should be
examined for other groupings and structures.
The Facilitated Affinity Diagram Approach
The use of an experienced facilitator to create an Affinity Diagram can often improve
the overall quality of the output and reduce the generation time. There can be some
loss of ownership if the facilitator does not allow time for debate and discussion.
Divergent Thinking Stage
The Facilitator should start by defining the problem or situation under
consideration before directing the team to generate ideas or information. As
information or ideas are verbalised, the Facilitator captures the individual
views/ideas on sticky notes or cards. A good Facilitator will manage the
idea/information generation to avoid any individual dominating. They should
also probe the information or ideas to aid in generating further views. It is
typical to allocate a certain time period for this (20-30 minutes is often
suitable).
As the information is captured on the sticky notes or cards these are stuck on
a wall or pin board as appropriate.
Convergent Thinking Stage
The convergent thinking stage is typically carried out as per the classic
approach described above.
What Goes Wrong: The limitations of Affinity Diagramming
Affinity Diagramming is a very simple but powerful tool for generating, capturing and
organizing ideas and information about a problem or situation. It does however have
limitations and can be awkward to use. Some of the issues with its use are given
below with advice on avoiding, and recovering from, the problem:
Individuals dominating the grouping. If the group is hierarchical consider using
a facilitator or limit the number people involved in the grouping.
Difficulties in finding agreed affinities. Ensure that the initial grouping activity is
performed in silence. Consider limiting the number of individual involved in the
group (a minimum of three is recommended). If affinity groups have not
stabilised after 10 to 15 minutes allow the team to discuss potential options for
grouping. Consider the possibility of two Affinity Diagrams.
Do not spend the time:
o checking out duplications.
o seeking additional elements.

© Stuart Burge 2013: This is a draft document. If you have any comments please contact [email protected]
Tel: 01788 550015 | E-Mail: [email protected] | Web: www.burgehugheswalsh.co.uk Burge Hughes Walsh - Suite 13b Davy Court - Castle Mound Way - Central Park - Rugby - Warwickshire - CV23 0UZ
Page 6 of 14
Explain time allocation at the beginning of the session and allocate sufficient
time for resolving duplications and considering addition elements. A typical
breakdown is:
o Divergent Stage 15 minutes
o Convergent Stage
- Affinity grouping 15 minutes
- Duplications 10 minutes
- Additional 10 minutes
Output format not intuitive to novice reader. Completed Affinity Diagrams are
not immediately intuitive to a person who has not seen one before. The
diagram should be explained if included another document. Alternatively it can
be readily converted into a Tree Diagram. An example of this is shown in the
following illustrative examples.
Illustrative Examples
The following example demonstrates the use of an Affinity Diagram to elicit, capture
and organize a set of customer/user requirements for a domestic washing machine.
It is a typical situation were Affinity Diagramming can be applied. A similar outcome
could be achieved by brainstorming but Affinity Diagramming offers several
advantages that include:
Organized and structured output.
Balanced individual input.
Easily reviewable output.
Through duplications a qualitative measure of importance.
The team comprised a small number of potential customers for the machine who
were set the question:
What are you requirements for your next washing machine?
The question was deliberately posed to extract current needs and expectations. It is
important when undertaking an Affinity Diagramming session to be clear on the
starting question. Individuals were supplied with a pack of sticky notes. A trivial, but
important, point is to provide plenty to encourage the individual to maximise their
output. They were instructed to write one requirement per sticky note and stick them
on a wall. Emphasis was placed on quantity rather than quality.
The outcome of this first step is shown in Error! Reference source not found. from
which it is clear that there are what appear to be several duplications of
requirements. This is expected and should be maintained until the appropriate step.
Early removal of duplications without discussion can reduce the overall effectiveness
of the tool.

© Stuart Burge 2013: This is a draft document. If you have any comments please contact [email protected]
Tel: 01788 550015 | E-Mail: [email protected] | Web: www.burgehugheswalsh.co.uk Burge Hughes Walsh - Suite 13b Davy Court - Castle Mound Way - Central Park - Rugby - Warwickshire - CV23 0UZ
Page 7 of 14
Figure 2: Output of the first step in constructing an Affinity Diagram for a set of user requirements for a
washing machine
Experience shows that this first step will typically take 10 – 20 minutes and it is
important to encourage the team members to seek as many ideas as possible. The
step should not be brought to a halt if individuals are still writing sticky notes.
The second step is concerned with arranging the sticky notes into themed groups of
sticky notes that have an affinity. All the team members should perform this in
silence to allow natural or obvious groups to emerge. Many groups find this
uncomfortable and quickly begin discussing potential groupings. This is natural and
should be only mildly resisted. Figure 3 shows such a grouping.
Figure 3: Initial affinity groups
Reasonable purchase price
Low running costs
Grade A efficiency
Low detergent use
Good wash performance
Good spin dry performance
Minimum creasing
Easy to use controls
Easy to load and unload
Easy to load detergents etc
Standard size
Reliable Durable
Attractive
Distinctive style
Hi - tech
Quiet Intelligent and Automatic
Washes quickly
Low carbon footprint
Standard load
Use all available detergents
Wool & delicates cycle
Low temperature wash
Looks good
Washes well
fast Low noise
Cheap Eco - friendly
Easy to use
A Grade Efficiency
Fast Spin speed
Clear Controls
Clean wash Low purchase
price
Lots of cycles
Same size as existing machine
Good spin
Big door
“Green”
Doesn’t break down
Reasonable purchase price
Low running costs
Grade A efficiency
Low detergent use
Good wash performance
Good spin dry performance Minimum
creasing
Easy to use controls
Easy to load and unload
Easy to load detergents etc
Standard size
Reliable
Durable
Attractive
Distinctive style
Hi - tech
Quiet
Intelligent and Automatic
Washes quickly
Low carbon footprint
Standard load
Use all available detergents
Wool & delicates cycle
Low temperature wash Looks good
Washes well
fast
Low noise
Cheap
Eco - friendly
Easy to use
A Grade Efficiency
Fast Spin speed
Clear Controls
Clean wash
Low purchase price
Lots of cycles
Same size as existing machine
Good spin
Big door
“Green” Doesn’t break
down
© Stuart Burge 2013: This is a draft document. If you have any comments please contact [email protected]
Tel: 01788 550015 | E-Mail: [email protected] | Web: www.burgehugheswalsh.co.uk Burge Hughes Walsh - Suite 13b Davy Court - Castle Mound Way - Central Park - Rugby - Warwickshire - CV23 0UZ
Page 8 of 14
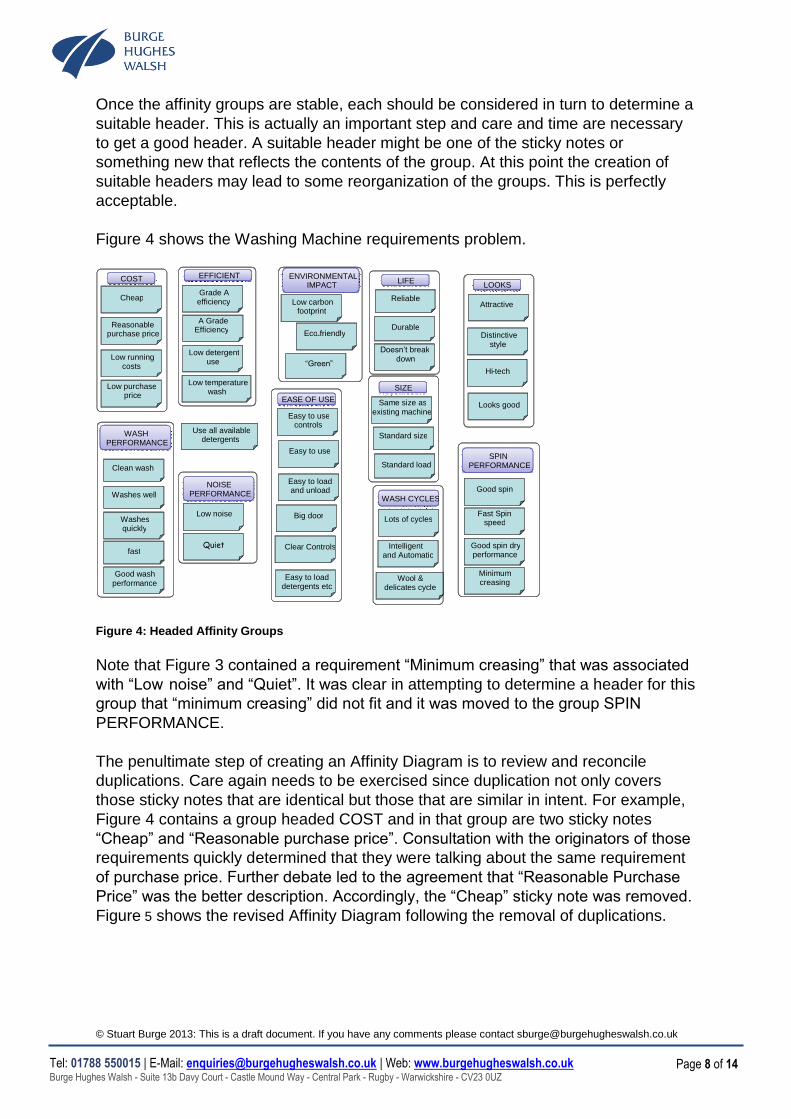
Once the affinity groups are stable, each should be considered in turn to determine a
suitable header. This is actually an important step and care and time are necessary
to get a good header. A suitable header might be one of the sticky notes or
something new that reflects the contents of the group. At this point the creation of
suitable headers may lead to some reorganization of the groups. This is perfectly
acceptable.
Figure 4 shows the Washing Machine requirements problem.
Figure 4: Headed Affinity Groups
Note that Figure 3 contained a requirement “Minimum creasing” that was associated
with “Low noise” and “Quiet”. It was clear in attempting to determine a header for this
group that “minimum creasing” did not fit and it was moved to the group SPIN
PERFORMANCE.
The penultimate step of creating an Affinity Diagram is to review and reconcile
duplications. Care again needs to be exercised since duplication not only covers
those sticky notes that are identical but those that are similar in intent. For example,
Figure 4 contains a group headed COST and in that group are two sticky notes
“Cheap” and “Reasonable purchase price”. Consultation with the originators of those
requirements quickly determined that they were talking about the same requirement
of purchase price. Further debate led to the agreement that “Reasonable Purchase
Price” was the better description. Accordingly, the “Cheap” sticky note was removed.
Figure 5 shows the revised Affinity Diagram following the removal of duplications.
Reasonable purchase price
Low running costs
Grade A efficiency
Low detergent use
Good wash performance
Good spin dry performance
Minimum creasing
Easy to use controls
Easy to load and unload
Easy to load detergents etc
Standard size
Reliable
Durable
Attractive
Distinctive style
Hi - tech
Quiet Intelligent and Automatic
Washes quickly
Low carbon footprint
Standard load
Use all available detergents
Wool & delicates cycle
Low temperature wash
Looks good
Washes well
fast
Low noise
Cheap
Eco - friendly
Easy to use
A Grade Efficiency
Fast Spin speed
Clear Controls
Clean wash
Low purchase price
Lots of cycles
Same size as existing machine
Good spin
Big door
“Green” Doesn’t break
down
COST LIFE
SIZE
WASH CYCLES
EASE OF USE
WASH PERFORMANCE
EFFICIENT
NOISE PERFORMANCE
ENVIRONMENTAL IMPACT
SPIN PERFORMANCE
LOOKS

© Stuart Burge 2013: This is a draft document. If you have any comments please contact [email protected]
Tel: 01788 550015 | E-Mail: [email protected] | Web: www.burgehugheswalsh.co.uk Burge Hughes Walsh - Suite 13b Davy Court - Castle Mound Way - Central Park - Rugby - Warwickshire - CV23 0UZ
Page 9 of 14
Figure 5: Revised Affinity Diagram with duplications reconciled
The Affinity Diagram shown in Figure 5 has separate groups. It is quite
commonplace when arriving at this grouping for there to be extensive debate
because individual ideas (sticky notes) can reside in several groups. This source of
potential conflict can be overcome by allowing the various groups to overlap much
like a Venn diagram. Not only will this resolve any tension it is also a powerful
representation of the inherent complexity of particular situation. This approach is
shown in Figure 6 where three of the groups overlap to show that some
requirements are members of several groups.
Figure 6: Nested Affinity Diagram
Costs
Reasonable
purchase price
Low running
costs
Grade A
efficiency
Low detergent
use
Good wash
performance
Good spin dry
performance
Minimum
creasing
Easy to use
controls
Easy to load
and unload
Easy to load
detergents etc
Standard size
Reliable
Durable Attractive
Distinctive
style
Hi-tech
Quiet
Intelligent and
Automatic
Washes
quickly
Low carbon
footprint
Standard load
Use available
detergents
Wool &
delicates cycleLow temperature
wash
Environmental Impact
Cycles
Easy to useLooksPerformance
COST
LIFE
WASH CYCLES
EASE OF USE
ENVIRONMENTAL
IMPACT
PERFORMANCELOOKS
Reasonable purchase price
Low running costs
Grade A efficiency
Low detergent use
Good wash performance
Good spin dry performance
Minimum creasing
Easy to use controls
Easy to load and unload
Easy to load detergents etc
Standard size
Reliable
Durable
Attractive
Distinctive style
Hi - tech
Quiet Intelligent
and Automatic
Washes quickly
Low carbon footprint
Standard load
Use all available
detergents
Wool & delicates cycle
Low temperature wash
Looks good Washes well
fast Low noise
Cheap
Eco - friendly Easy to use
A Grade Efficiency
Fast Spin speed
Clear Controls
Clean wash
Low purchase price
Lots of cycles Same size as existing machine
Good spin Big door
“Green”
Doesn’t break down
COST LIFE
SIZE
WASH CYCLES
EASE OF USE WASH
PERFORMANCE
EFFICIENT
NOISE PERFORMANCE
ENVIRONMENTAL IMPACT
SPIN PERFORMANCE
LOOKS
© Stuart Burge 2013: This is a draft document. If you have any comments please contact [email protected]
Tel: 01788 550015 | E-Mail: [email protected] | Web: www.burgehugheswalsh.co.uk Burge Hughes Walsh - Suite 13b Davy Court - Castle Mound Way - Central Park - Rugby - Warwickshire - CV23 0UZ
Page 10 of 14
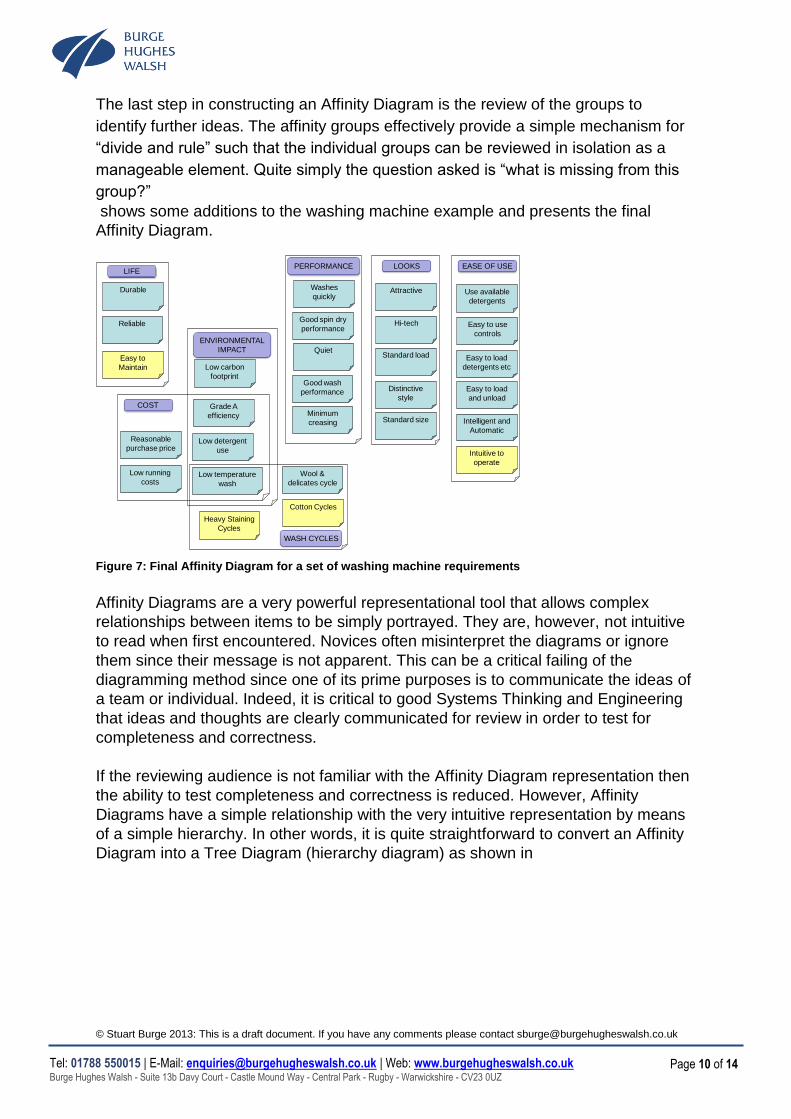
The last step in constructing an Affinity Diagram is the review of the groups to
identify further ideas. The affinity groups effectively provide a simple mechanism for
“divide and rule” such that the individual groups can be reviewed in isolation as a
manageable element. Quite simply the question asked is “what is missing from this
group?”
shows some additions to the washing machine example and presents the final
Affinity Diagram.
Figure 7: Final Affinity Diagram for a set of washing machine requirements
Affinity Diagrams are a very powerful representational tool that allows complex
relationships between items to be simply portrayed. They are, however, not intuitive
to read when first encountered. Novices often misinterpret the diagrams or ignore
them since their message is not apparent. This can be a critical failing of the
diagramming method since one of its prime purposes is to communicate the ideas of
a team or individual. Indeed, it is critical to good Systems Thinking and Engineering
that ideas and thoughts are clearly communicated for review in order to test for
completeness and correctness.
If the reviewing audience is not familiar with the Affinity Diagram representation then
the ability to test completeness and correctness is reduced. However, Affinity
Diagrams have a simple relationship with the very intuitive representation by means
of a simple hierarchy. In other words, it is quite straightforward to convert an Affinity
Diagram into a Tree Diagram (hierarchy diagram) as shown in
Reasonable
purchase price
Low running
costs
Grade A
efficiency
Low detergent
use
Good wash
performance
Good spin dry
performance
Minimum
creasing
Easy to use
controls
Easy to load
and unload
Easy to load
detergents etc
Standard size
Reliable
Durable Attractive
Distinctive
style
Hi-tech
Quiet
Intelligent and
Automatic
Washes
quickly
Low carbon
footprint
Standard load
Use available
detergents
Wool &
delicates cycleLow temperature
wash
Easy to
Maintain
Intuitive to
operate
Cotton Cycles
Heavy Staining
Cycles
COST
LIFE
WASH CYCLES
EASE OF USE
ENVIRONMENTAL
IMPACT
PERFORMANCE LOOKS

© Stuart Burge 2013: This is a draft document. If you have any comments please contact [email protected]
Tel: 01788 550015 | E-Mail: [email protected] | Web: www.burgehugheswalsh.co.uk Burge Hughes Walsh - Suite 13b Davy Court - Castle Mound Way - Central Park - Rugby - Warwickshire - CV23 0UZ
Page 11 of 14
.
In

© Stuart Burge 2013: This is a draft document. If you have any comments please contact [email protected]
Tel: 01788 550015 | E-Mail: [email protected] | Web: www.burgehugheswalsh.co.uk Burge Hughes Walsh - Suite 13b Davy Court - Castle Mound Way - Central Park - Rugby - Warwickshire - CV23 0UZ
Page 12 of 14
the main group headings become the first level of the hierarchy. Sub-group
headings become the next level and so on until the lowest level captures the
individual sticky notes.

© Stuart Burge 2013: This is a draft document. If you have any comments please contact [email protected]
Tel: 01788 550015 | E-Mail: [email protected] | Web: www.burgehugheswalsh.co.uk Burge Hughes Walsh - Suite 13b Davy Court - Castle Mound Way - Central Park - Rugby - Warwickshire - CV23 0UZ
Page 13 of 14
Figure 8 The structural equivalence between Affinity Diagrams and Tree Diagrams
To complete the washing machine requirements example, Figure 9 shows the Tree
Diagram equivalent to the Affinity Diagram shown in Figure 7. Note how the
overlapping groups of the Affinity Diagram are captured in the Tree Diagram through
multiple connections.
Figure 9: Tree Diagram representation of the washing machine requirements
Tree Diagrams, like that shown in Figure 9, are intuitively understood by almost all
humans and require little explanation. Thus, it is commonplace to translate an Affinity
Diagram into its equivalent Tree Diagram.
A
A1
CB
A2C1
C2
A
B
C
A1
A2
C2
C1
Washing Machine Requirements
Life CostEnvironmental
ImpactLooksPerformanceWash Cycles Ease of Use
Reliable
Durable
Easy to Maintain
Reasonable
purchase
price
Low
running
costs
Grade A
efficiency
Low
detergent
use
Low carbon
footprint
Low
temperature
wash
Wool &
delicates
cycle
Cotton
Cycles
Heavy
Staining
Cycles
Good wash
performance
Good spin
dry perform
Minimum
creasing
Quiet
Washes
quickly
Standard
size
Attractive
Distinctive
style
Hi-tech
Standard
load
Easy to use
controls
Easy to load
and unload
Easy to load
detergents etc
Intelligent and
Automatic
Use available
detergents
Intuitive to
operate

© Stuart Burge 2013: This is a draft document. If you have any comments please contact [email protected]
Tel: 01788 550015 | E-Mail: [email protected] | Web: www.burgehugheswalsh.co.uk Burge Hughes Walsh - Suite 13b Davy Court - Castle Mound Way - Central Park - Rugby - Warwickshire - CV23 0UZ
Page 14 of 14
Bibliography
Descriptions of Affinity Diagram appear in many texts, particularly those on quality
improvement, but unfortunately most are glib and ephemeral. The following are
recommended:
Straker David “A Toolbook for Quality Improvement and Problem Solving” 1995, Prentice Hall, ISBN
0-13-746892
Mizuno Sigeru “Management for Quality Improvement: The New 7 Quality Control” 1988, Productivity
Press, ISBN-13: 978-0915299294