Embed Size (px)
Citation preview
The Swedish National Forest Inventory
Rubrik 30/34 pt Berthold Akzidenz Bold
TaxWebb analysis toolData description
TaxWebb Analysis tool - Data descriptionPublication year: 2015, UmeåPublisher: The Swedish National Forest Inventory, SLUCover photograph: Åke Bruhn, SLU.
© SLU, The Swedish University of Agricultural Sciences
TaxWebb analysis tool — Data description
The data available in TaxWebb is col-lected and compiled by the Swedish National Forest Inventory based at the Swedish University of Agricul-tural Sciences, Sweden.
General information
All of the statistics in TaxWebb are for productive forest land excluding protected areas in accor-dance with the definitions below. Land use class Productive forest land - Land that is suitable for forest production and is not significantly used for other purposes. Production is at least 1 m³sk (stem volume with bark above the stump and including top) per hectare and year.
Protected areasProductive forest land within national parks, nature reserves and nature protection areas where forestry is not permitted. In order to give a fair representation over time current boundaries supp-lied by the Swedish Environmental Protection Agency are used for all years.
MeasuresArea (1000 ha)Area in thousands of hectares (ha)
Standing volume (million m³sk)Standing volume per ha (m³sk/ha)Standing volume of living trees. Standing volume is for all trees that have reached a height of 1.3m
(breast height).
Dry weight biomass (million tonnes DW)Tree stem biomass for all trees of at least 1.3m. The units are millions tonnes of dry biomass.
Volume dead wood (million m³)Volume dead wood per ha (m³/ha)All dead wood with a diameter of at least 10 cm. Available from 1994 and onwards. As the values are presented as a five year moving average repre-sented by the middle year the first year available is 1996 (1994, 1995, 1996, 1997, 1998). The units are m³ and not m³sk as calipering of dead wood can be either with or without bark depending on the stage of decomposition.
DimensionsOwnership categoriesCompanies – Includes listed companies that are not owned by the state, local or regional munici-palities.
Individual owners – Private owners, estates or non-listed companies. Other owners – Includes state owned land, listed companies where the state owns a controlling share (Sveaskog), local and regional municipality owned land and other collectively owned land. Also included here are some privately owned lands such as those owned by the church and public commons.
Maturity classesMaturity classes describe a forests development
3
stage from a forest management perspective. Standards and residual stands are excluded when maturity classes are determined.
Maturity class (includes both of the following)Maturity class broad classificationMaturity class detailed classification
A-Bare forest land Includes both bare forest land and very sparse forest. In thicket stage forest the stem density is lower than the Forestry Acts level for satisfactory regeneration and in older forest the degree of stocking is lower than 0.3.
B –Thicket stage forestThicket stage forest and young forest where more than half of the dominant and co-dominant trees have a diameter < 10cm at 1.3m. The average height is main crops height after an eventual pre-commercial thinning.
B1-Plant forest<1.3 m Average height less than 1.3 m.
B2-Young forest 1.3-3.0 m Average height between 1.3 and 3.0 m.
B3-Young forest>3.0 m Average height greater than 3.0 m. The
majority of the dominant and co-domi nant trees have a diameter <10cm at 1.3m.
C-Thinning stage forestThe majority of the dominant and co-dominant trees have a diameter >10cm at 1.3m. The stand age is lower than the minimum age for final fel-ling according to the Forestry Act.
C1- Un-thinned forest < 20 cm Un-thinned forest where several of the dominant and co-dominant trees have a diameter <20cm at 1.3m.
C2-Thinned stage forest < 20 cm Thinned forest where several of the dominant and co-dominant trees have a diameter <20cm at 1.3m
C3,C4-Thicker thinning stage forest > 20 cm Forest younger than the minimum age for final felling where several of the dominant and co-dominant trees have a diameter >20 cm at 1.3m or forest older than the minimum final felling age where thinning should be undertaken again.
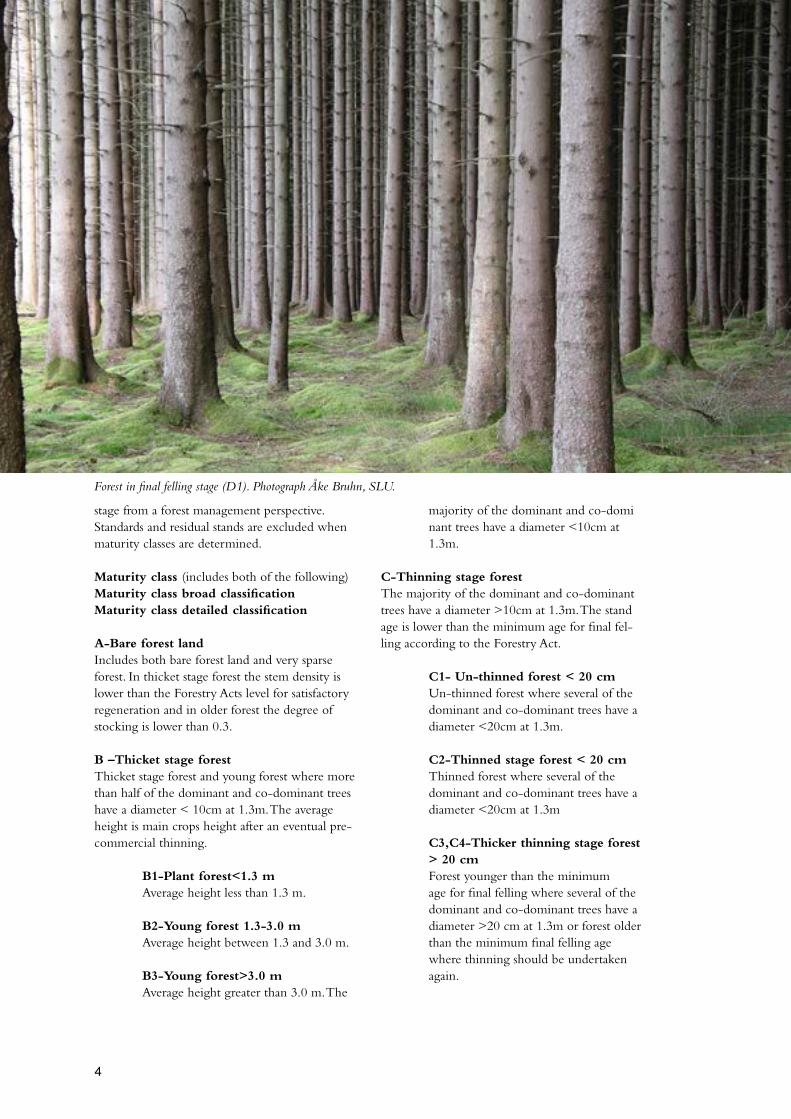
Forest in final felling stage (D1). Photograph Åke Bruhn, SLU.
4
D–Final felling stage forest
D1–Younger final felling stage forest Final felling stage forest. The stand age is higher than the minimum age for final felling but lower than the recommended age for final felling
D2– Older final felling stage forest Final felling stage forest. The stand age is higher than the recommended age for final felling
Forest typesThe tree species proportions are defined as their proportion of the basal area when the average stand height is greater or equal to 7m otherwise as the proportion of the main crop stems.
Forest type (includes both of the following)Forest type broad classificationForest type detailed classification
Pine or Lodgepole pine forestPine 65 percent or more or Lodgepole pine 65 percent or more.
Pine forest excl. Lodgepole pine forest Pine 65 percent or more.
Lodgepole pine forest Lodgepole pine 65 percent or more.
Spruce forest Spruce 65 percent or more.
Mixed conifer forest Neither of the above definitions but conifers 65 percent or more.
Mixed forest More than 35 percent and less than 65% broad-leaves.
Valuable broadleaves forest Broadleaves 65 percent or more and 45 percent or more valuable* broadleaves.
Broadleaves forest excl. valuable broadleavesBroadleaves 65 percent or more and less than 45 percent valuable* broadleaves or birch 65 percent or more.
Birch forest Birch 65 percent or more
Other broadleaves forest Broadleaves 65 percent or more and less than 45 percent valuable* broadleaves.
BareDegree of stocking is 0, no tree proportions registered.
*Valuable broadleaves are Oak, Beech, Dutch elm, European
Ash, Lime, Norway maple, Hornbeam and Wild cherry.
Conifer proportionBroadleaves proportionConifer and broadleaves proportion as their pro-portion of the basal area when the average stand height is greater or equal to 7m otherwise as the proportion of the main crop stems. Bare means no tree proportions were registered.
0-4 %5-14 %15-24 %25-34 %35-44 %45-54 %55-64 %65-74 %75-84 %85-94 %95-100 %Bare
Older, broadleaves rich forestBroadleaves rich is defined as at least 3/10 (25%) of the basal area is broadleaves if the average stand height is greater or equal to 7m otherwise 3/10 (25%) of the crop stems. Older forest is defined as older than 80 years in Northern Sweden plus the counties of Dalarna, Värmland and Örebro and ol-der than 60 years in central and southern Sweden excluding the counties of Dalarna, Värmland and Örebro.
Yes – Complies with the criteria for older, broad-leaves rich forest. No – Does not comply with the criteria for older, broadleaves rich forest.
Old forestOlder forest is defined as older than 140 years in Northern Sweden plus the counties of Dalarna, Värmland and Örebro and older than 120 years
5
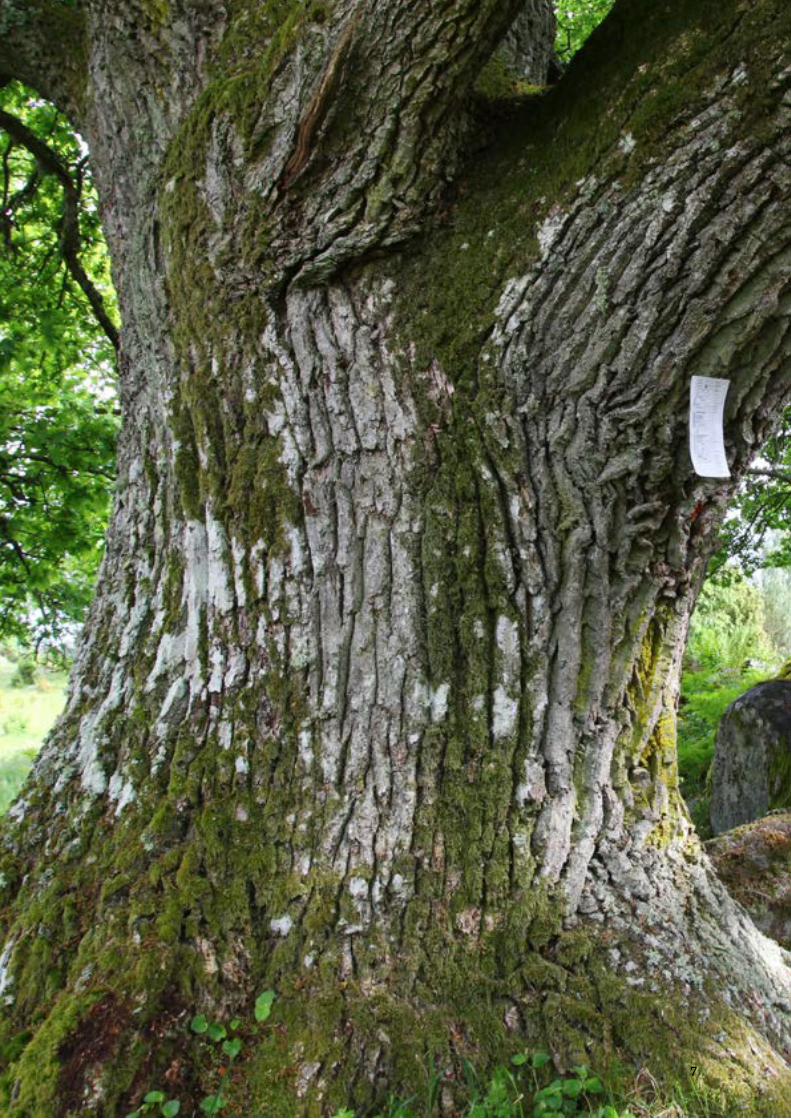
Large Oak in central Sweden. Photograph: Ola Borin, SLU.
in central and southern Sweden excluding the counties of Dalarna, Värmland and Örebro.
Yes - Complies with the criteria for old forestNo - Does not comply with the criteria for old forest
Stand ageThe basal area weighted mean stand age (for stands with a stand height under 7 meters a arith-metic mean age is used). The age class 0-2 years includes bare forest stands and thicket stage stands with an age of 1-2 years. Standards and residual stands are excluded when stand age classes are determined.
Stand age (includes both of the following)Stand age 40 year classesStand age 20 year classes
0-40 (years) 0-20 (years) 21-4041-80 41-60 61-8081-120 81-100 101-121121+ 121-140 141-160161+
Site productivityExpresses a site’s productive capacity as an average increment in m³sk per hectare and year. Site pro-ductivity is calculated from a site index estimated using site factors.
1.0-1.9 (m³sk/ha and year)2.0-2.93.0-3.94.0-4.95.0-5.96.0-6.97.0-7.98.0-8.99.0-9.910.0-10.911.0-11.912.0+
Site moisture classA reflection of the average conditions for a site.
Dry – Dry ground. The groundwater level is deeper than 2 meters.
Mesic – The groundwater level has an average depth of 1-2 m.
Moist – Moist ground. Includes the class Moist/Mesic-Moist. The groundwater level has an av-erage depth of less than 1 meter.
Wet – Saturated ground. The groundwater forms permanent water pools on the surface.
DiameterDiameter measurements in mm including bark at breast height (1.3m).
0-99 (mm)100-199200-299300-399400-499500-599600-
Tree species”Pine” and ”Pine excl. Lodgepole pine” include mountain pine and other pine species. ”Spruce” includes other picea- and abies-species., exotic spruce and other conifers.
Tree SpeciesTree species pine, spruce, broadleavesTree species detailed classificationPine Pine excl Lodgepole pine Lodgepole pineSpruceBroadleaves Birch Oak Beech Other valuable broadl. Other broadl.
Decomposition classHard dead wood – The stem’s volume is com-prised of 90 percent or more hard dead wood with a hard mantel. The stem is affected to only a very minor degree by wood decomposing
6
7
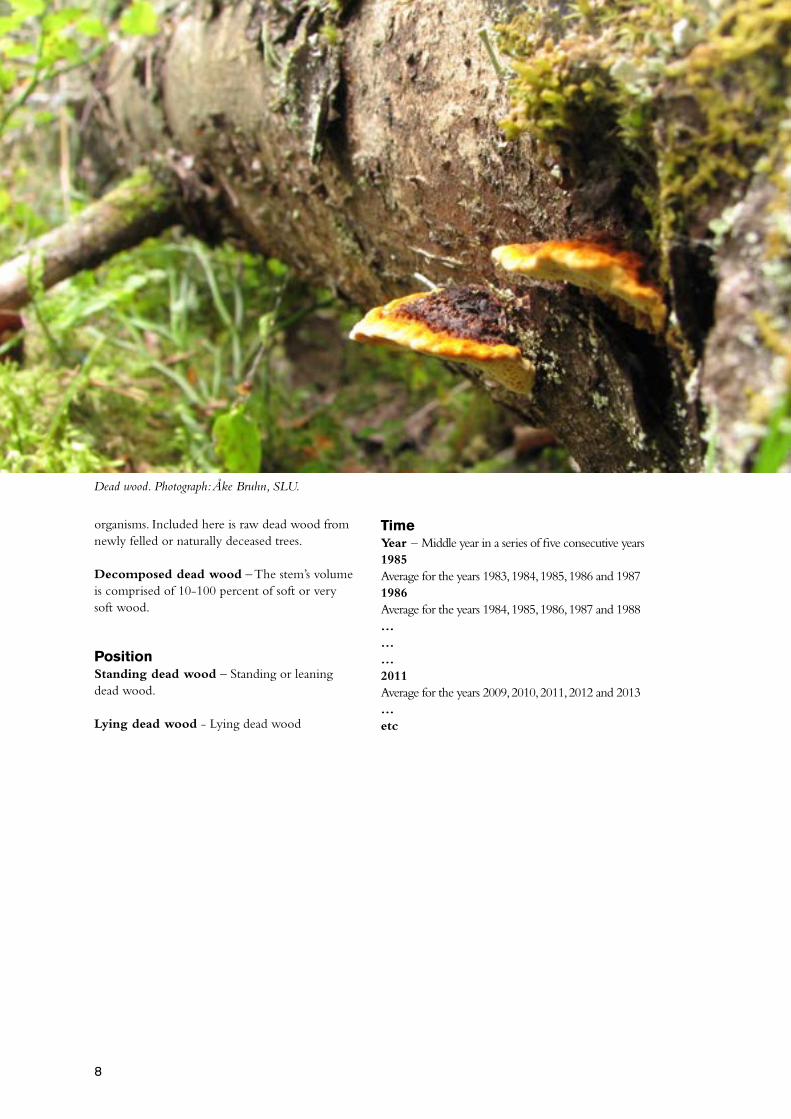
Dead wood. Photograph: Åke Bruhn, SLU.
organisms. Included here is raw dead wood from newly felled or naturally deceased trees.
Decomposed dead wood – The stem’s volume is comprised of 10-100 percent of soft or very soft wood.
PositionStanding dead wood – Standing or leaning dead wood.
Lying dead wood - Lying dead wood
TimeYear – Middle year in a series of five consecutive years1985Average for the years 1983, 1984, 1985, 1986 and 19871986Average for the years 1984, 1985, 1986, 1987 and 1988………2011Average for the years 2009, 2010, 2011, 2012 and 2013…etc
8
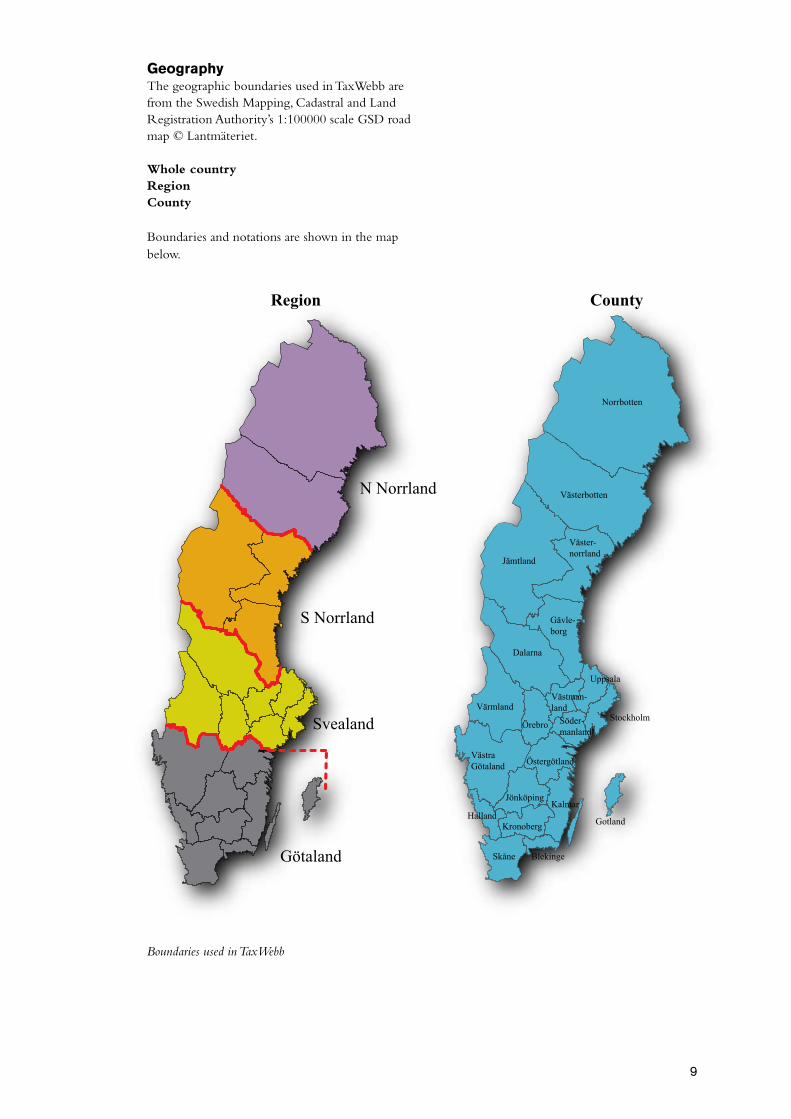
Region County
N Norrland
S Norrland
Svealand
Götaland
Norrbotten
Västerbotten
Jämtland
Väster-norrland
Gävle-borg
Dalarna
Värmland
Örebro
Västman-land
Uppsala
StockholmSöder-manland
Östergötland
Kalmar
VästraGötaland
Jönköping
KronobergHalland
Skåne Blekinge
Gotland
Boundaries used in TaxWebb
GeographyThe geographic boundaries used in TaxWebb are from the Swedish Mapping, Cadastral and Land Registration Authority’s 1:100000 scale GSD road map © Lantmäteriet.
Whole countryRegionCounty
Boundaries and notations are shown in the map below.
9
The Swedish University of Agricultural Sciences has its main locations in Alnarp, Skara, Umeå and Uppsala. Tel: +46 18-67 10 00 • Fax: +46 18-67 20 00 • VAT nr: SE202100281701
A world class university