Embed Size (px)
Citation preview
1 31 March 2016
The Swan diagram
��
�������� �����������
��
(�������ℎ����
����)
������ �������������
����� �������
��
������ �����������
����� �������
������ ������������������� �������
������ ������������
����� �������
2 31 March 2016
Internal and external balance
• Internal balance requires full employment ofresources (sufficiently low unemployment rate)and price stability (low and stable inflation rate).
• External balance corresponds to a balanced currentaccount (the supply and demand for the domesticcurrency are balanced). For simplicity, externalbalance is defined as zero trade balance.
• Internal balance and external balance both areassumed to depend on two variables: domesticexpenditures and the real exchange rate.
3 31 March 2016
The internal balance (IB) function /1
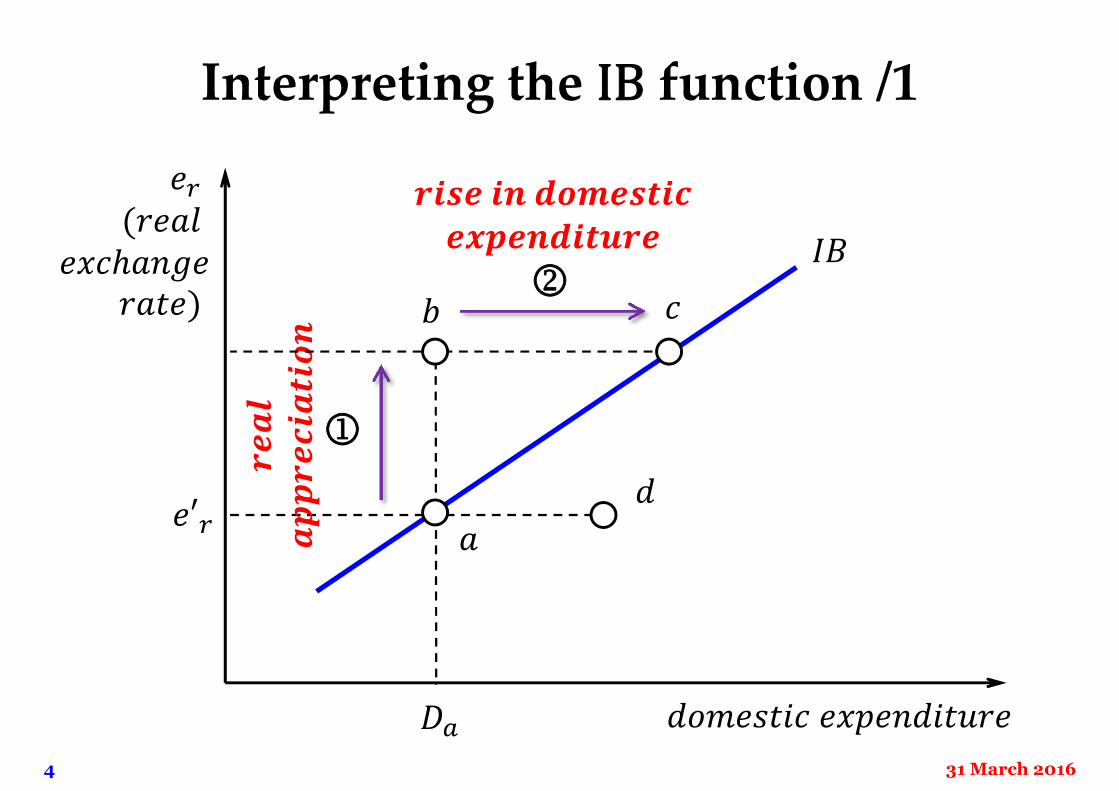
• The IB function drawn on the next slide is assumedincreasing for the following reason.
• Suppose the economy is initially at point �. If a realappreciation occurs (the real exchange rageincreases), then imports rise and exports fall. Thatis, there is a switch in demand from domestic toforeign goods. As a result, unemployment goes upand the economy moves from point � to �.
• To restore internal balance by reaching point �,unemployment must be eliminated. This requiresan increase in domestic expenditure.
4 31 March 2016
Interpreting the IB function /1
��
�������� �����������
��
(�������ℎ����
����)
�
��
��
��
��
��
����
��
���� �� �������������������
� �
��′�
��
5 31 March 2016
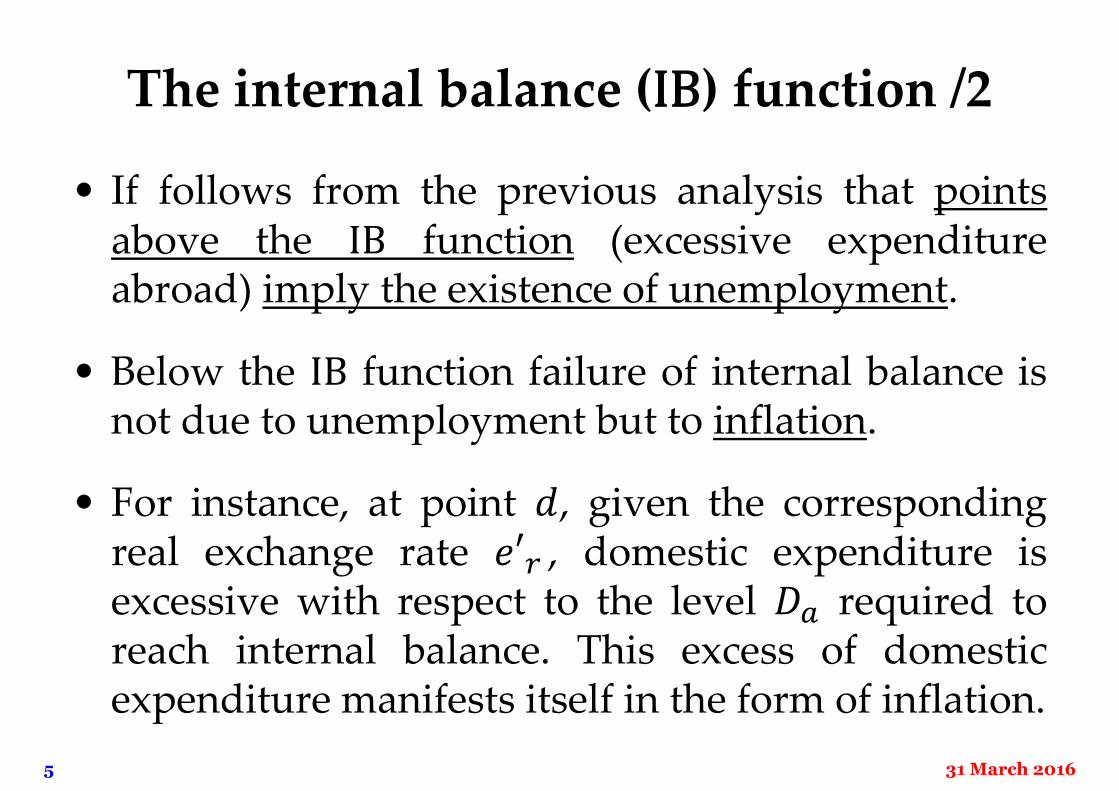
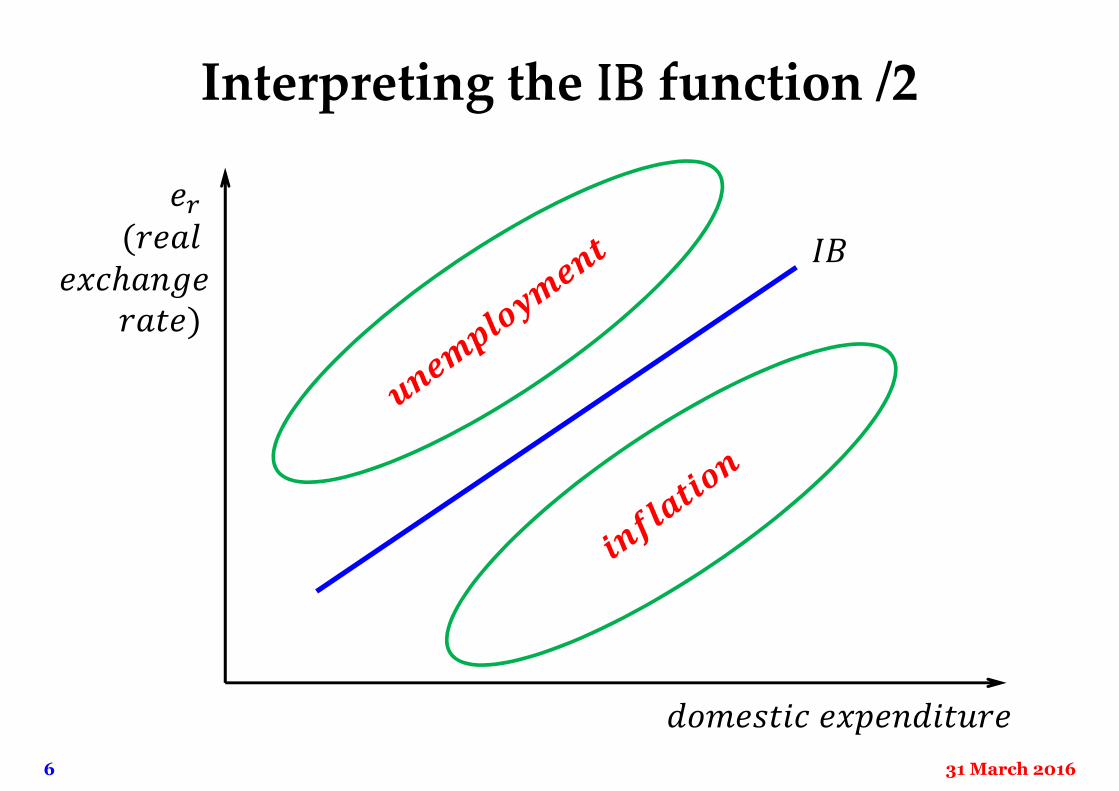
The internal balance (IB) function /2
• If follows from the previous analysis that pointsabove the IB function (excessive expenditureabroad) imply the existence of unemployment.
• Below the IB function failure of internal balance isnot due to unemployment but to inflation.
• For instance, at point �, given the correspondingreal exchange rate �′� , domestic expenditure isexcessive with respect to the level �� required toreach internal balance. This excess of domesticexpenditure manifests itself in the form of inflation.
6 31 March 2016
Interpreting the IB function /2
��
�������� �����������
��
(�������ℎ����
����)
7 31 March 2016
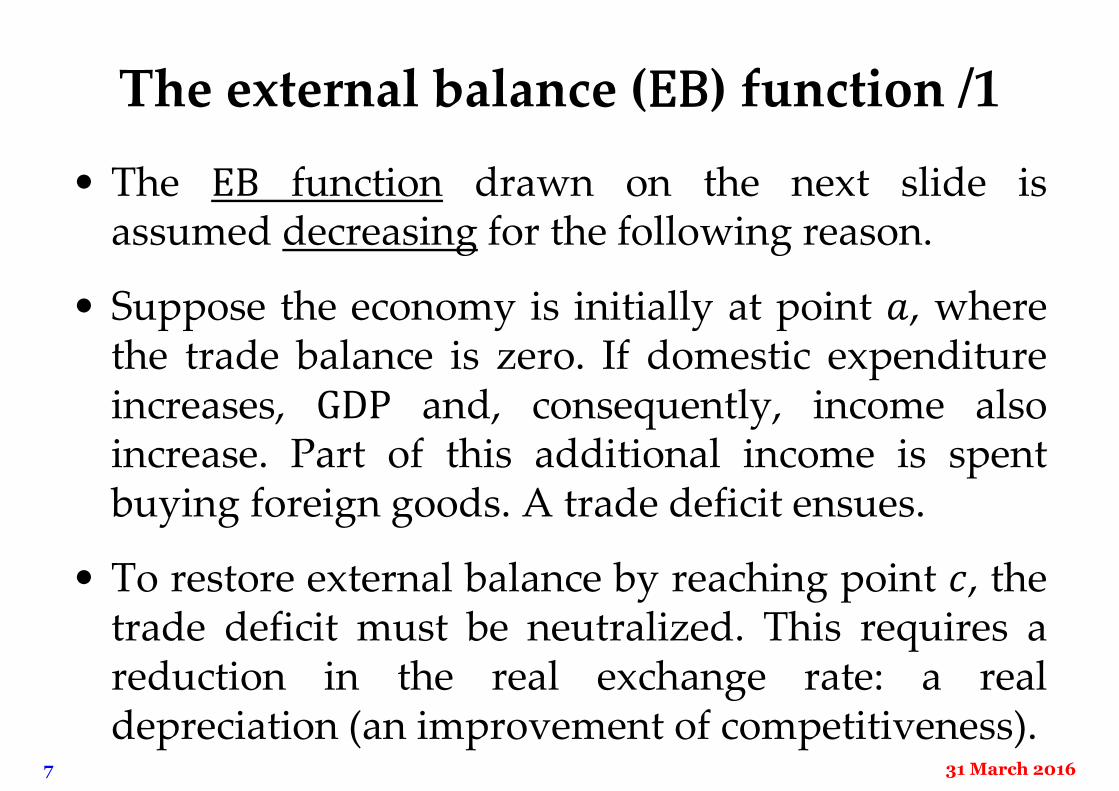
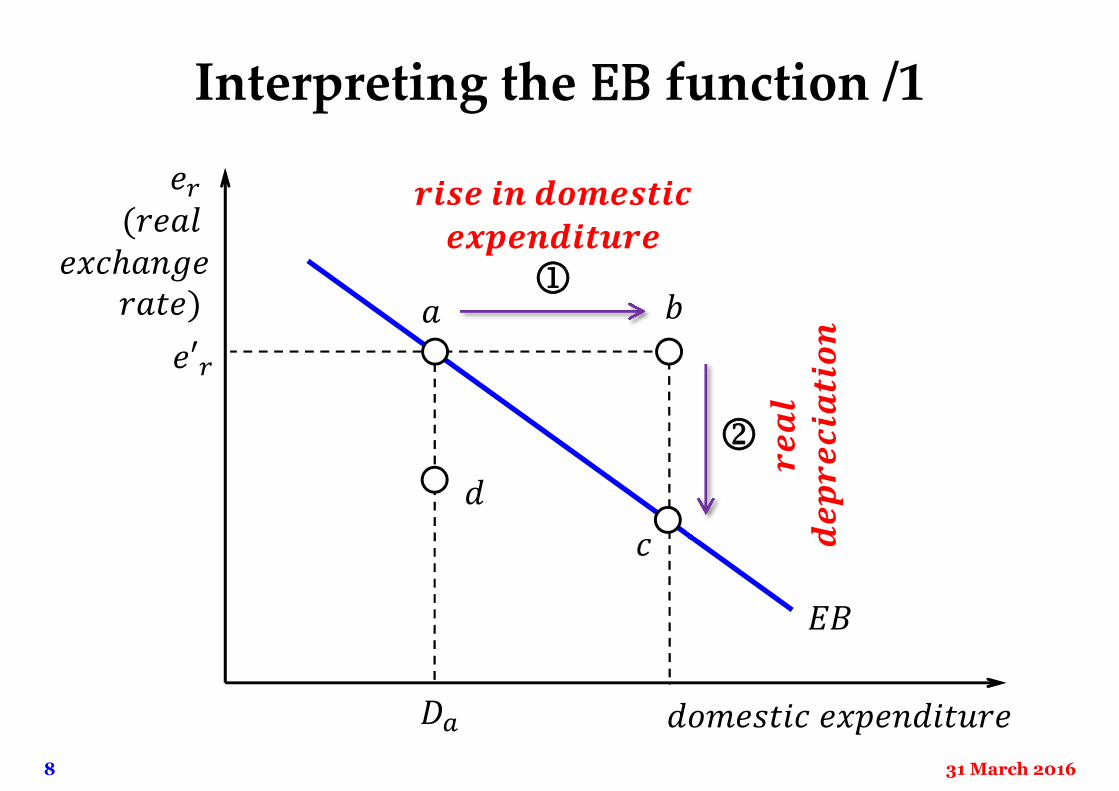
The external balance (EB) function /1
• The EB function drawn on the next slide isassumed decreasing for the following reason.
• Suppose the economy is initially at point �, wherethe trade balance is zero. If domestic expenditureincreases, GDP and, consequently, income alsoincrease. Part of this additional income is spentbuying foreign goods. A trade deficit ensues.
• To restore external balance by reaching point �, thetrade deficit must be neutralized. This requires areduction in the real exchange rate: a realdepreciation (an improvement of competitiveness).
8 31 March 2016
Interpreting the EB function /1
��
�������� �����������
��
(�������ℎ����
����)
�
��
��
��
��
��
����
��
���� �� �������������������
� �
�
�′�
��
9 31 March 2016
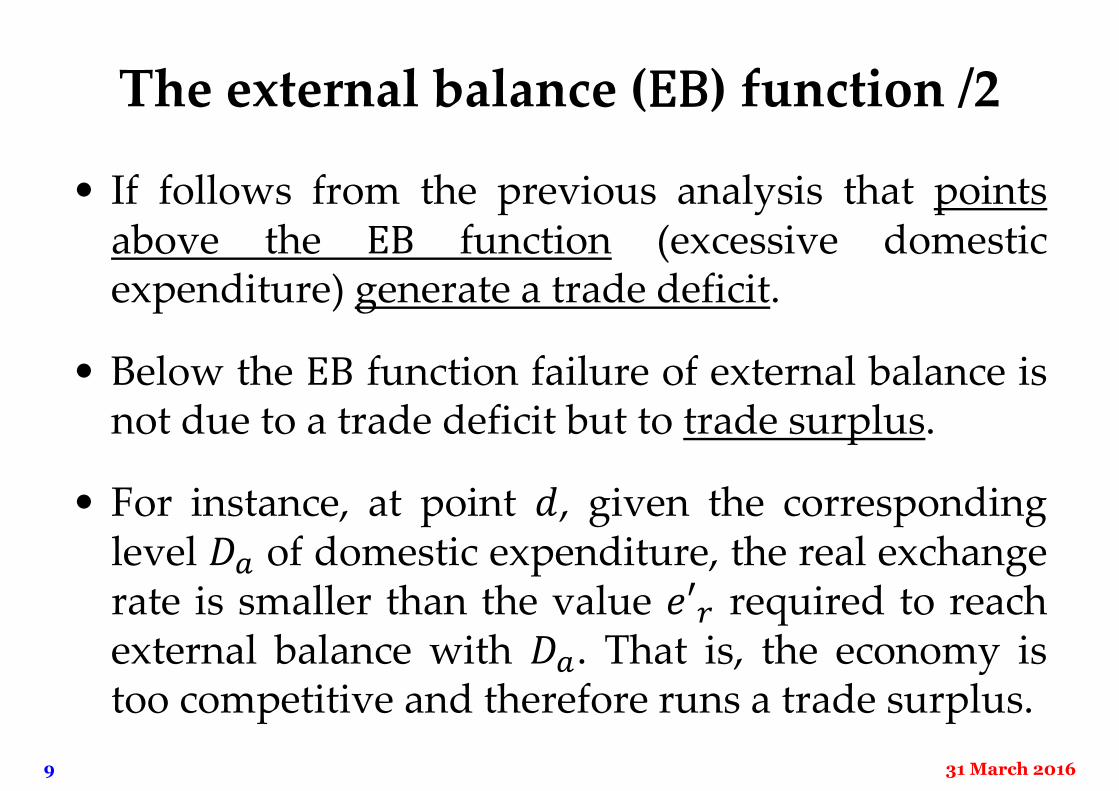
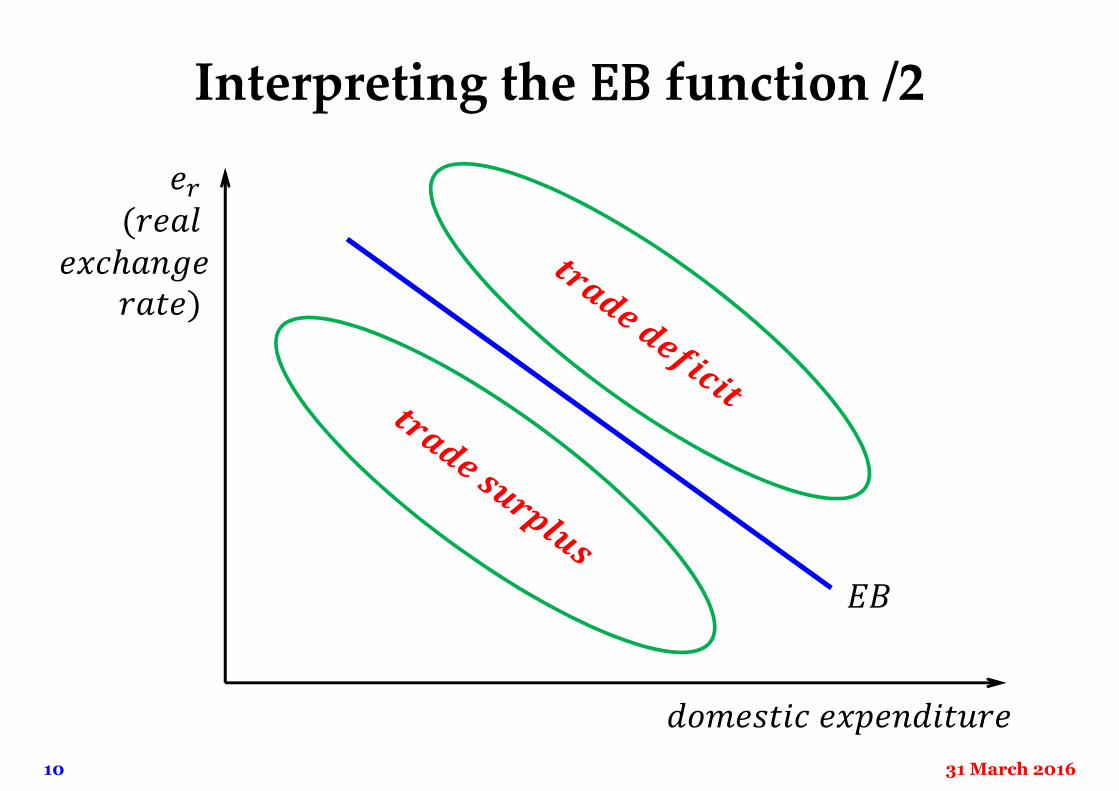
The external balance (EB) function /2
• If follows from the previous analysis that pointsabove the EB function (excessive domesticexpenditure) generate a trade deficit.
• Below the EB function failure of external balance isnot due to a trade deficit but to trade surplus.
• For instance, at point �, given the correspondinglevel �� of domestic expenditure, the real exchangerate is smaller than the value �′� required to reachexternal balance with ��. That is, the economy istoo competitive and therefore runs a trade surplus.
10 31 March 2016
Interpreting the EB function /2
��
�������� �����������
��
(�������ℎ����
����)
11 31 March 2016
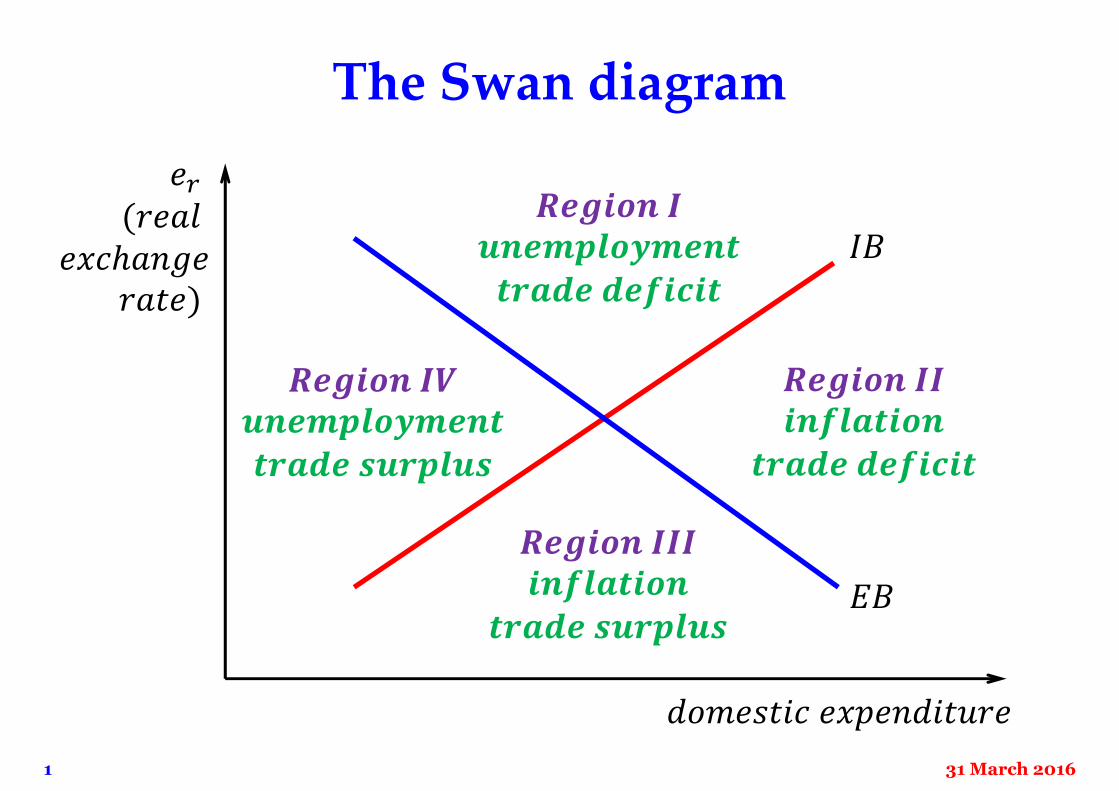
The Swan (or Meade-Swan) diagram
• The Swan diagram (due to Trevor W. Swan)combines the IB and EB functions.
• It separates the plane into four regions.
In region I, the economy experiences unemploy-ment and trade deficit (Spain, Egypt, Poland).
In region II, inflation coexists with a trade deficit(Brazil, Turkey, Colombia, Morocco).
In region III, there is inflation and a tradesurplus (China, Russia, Korea).
In region IV, the economy has unemploymentand runs a trade surplus (Hungary, Slovakia).
12 31 March 2016
The Swan diagram in action
• Suppose the economy is in Region I and, specifi-cally, around the numeral “I” in “Region I”.
• At that point, the economy has unemployment. Itmay appear that more expenditure is needed toreduce unemployment.
• The diagram suggests that the unemploymentproblem this economy faces is not solved by chan-ging expenditure (increasing it) but by shiftingexpenditure. To reach the intersection of the IB andEB lines, domestic expenditure must be reducedand net exports increased (through depreciation).
13 31 March 2016
Involuntary unemployment
• Involuntary unemployment occurs when, at theprevailing wage rate in the economy, there arepeople willing to work but are not given a job.
• The models developed next illustrate basic reasonsfor the existence of involuntary unemployment:
“too high” wage rates (classical explanation);
insufficient labour demand, due to insufficientaggregate demand (Keynesian explanation);
existence of market power (trade unions);
existence of labour discrimination; and
structural reasons (E-PIS model).
14 31 March 2016
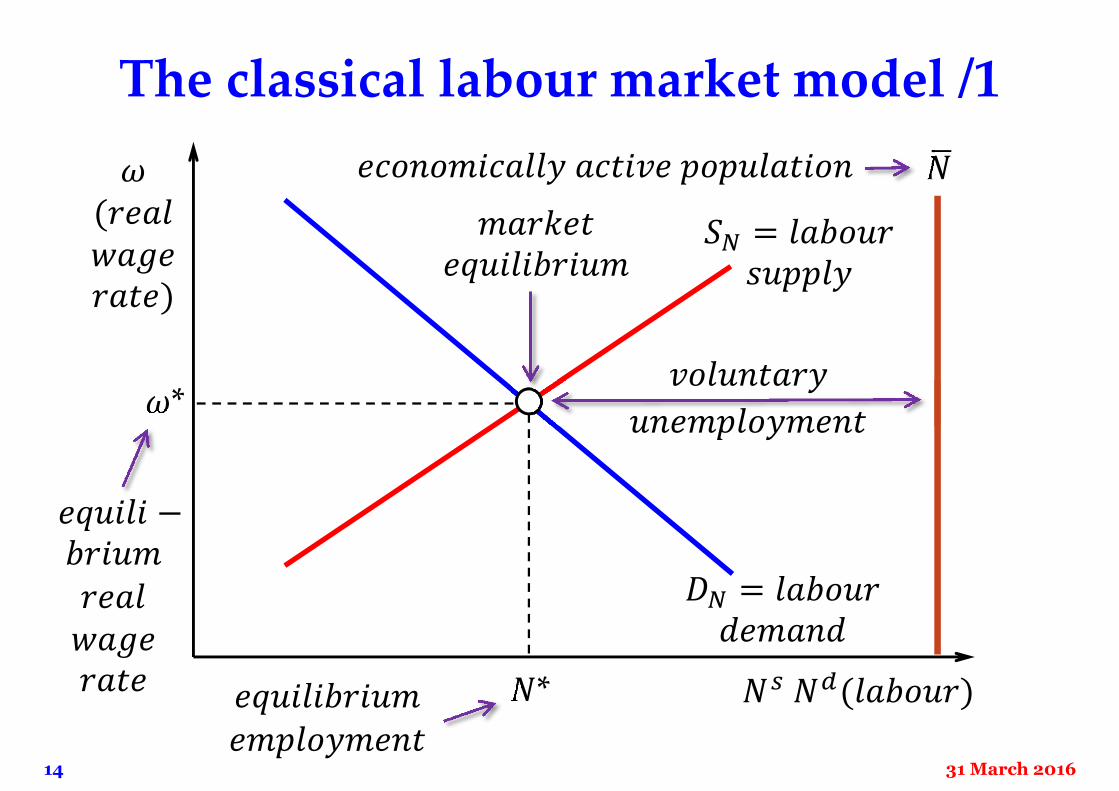
The classical labour market model /1
�� = ������������
�� = ������������
�� ��(������)
�(������������)
�����������������
�*
������ −�����
������������ �*�����������
����������
�������������� ������ ����������
���������
������������
15 31 March 2016
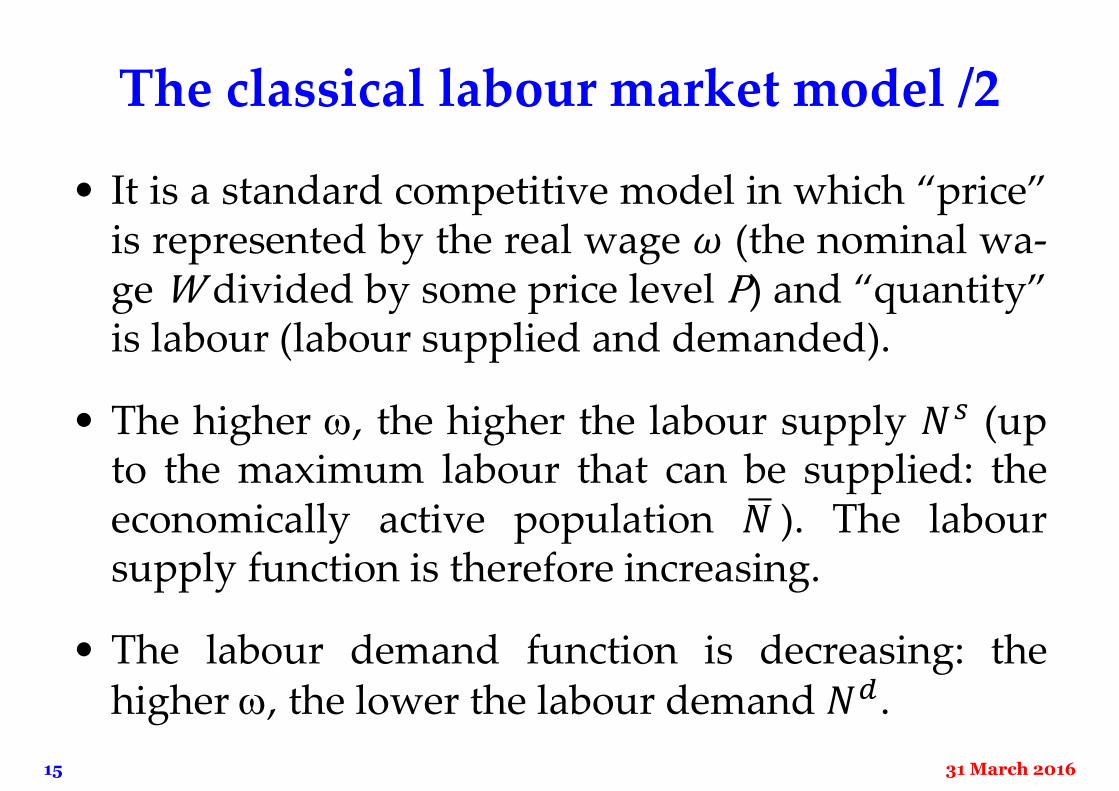
The classical labour market model /2
• It is a standard competitive model in which “price”is represented by the real wage � (the nominal wa-ge W divided by some price level P) and “quantity”is labour (labour supplied and demanded).
• The higher , the higher the labour supply �� (upto the maximum labour that can be supplied: theeconomically active population �� ). The laboursupply function is therefore increasing.
• The labour demand function is decreasing: thehigher , the lower the labour demand ��.
16 31 March 2016
Competitive labour demand /1
• A labour demand function can be constructed asfollows. Take any firm using labour � to produce acertain commodity � by means of the productionfunction � � that establishes the total amount of �that can be produced using � units of labour.
• Define the firm’s profit function as � � = � ·� � − � · �, where � is the amount of labour thefirms hires, � is the price at which the firm sells �(in a competitive market for � ), and � is thenominal wage (the cost of hiring each unit oflabour).
17 31 March 2016
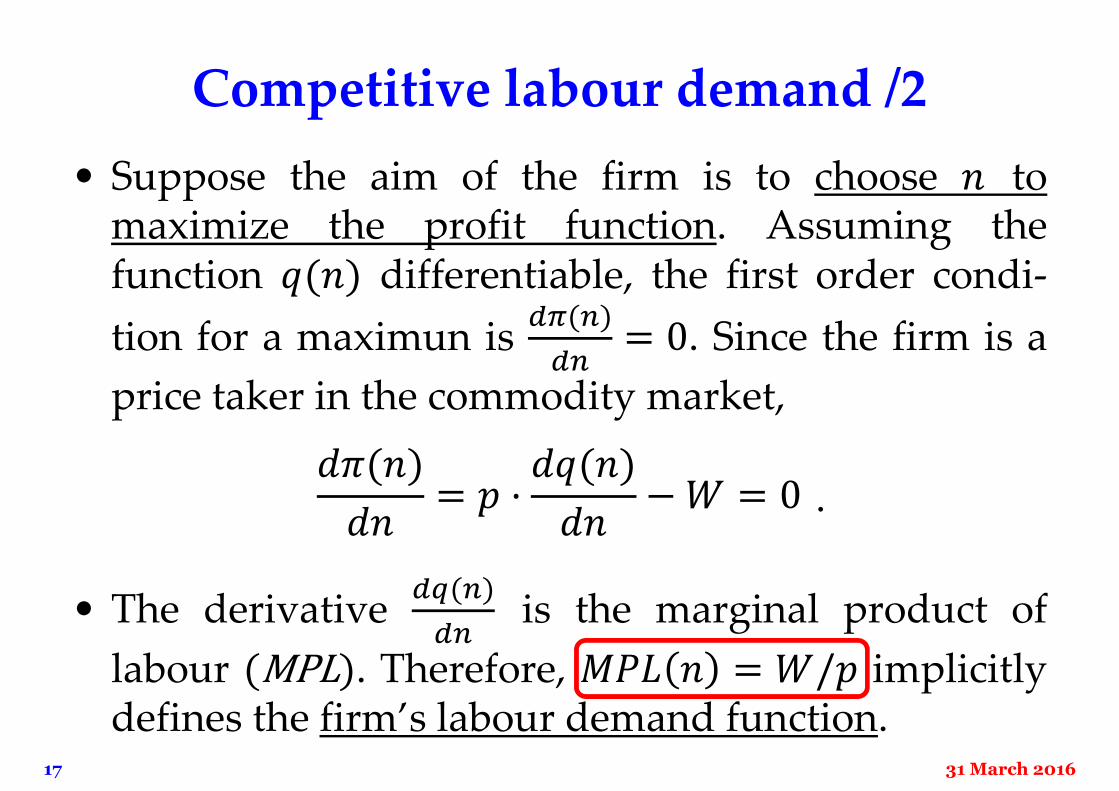
Competitive labour demand /2
• Suppose the aim of the firm is to choose � tomaximize the profit function. Assuming thefunction �(�) differentiable, the first order condi-
tion for a maximun is��(�)
��= 0. Since the firm is a
price taker in the commodity market,
• The derivative��(�)
��is the marginal product of
labour (MPL). Therefore, ��� � = �/� implicitlydefines the firm’s labour demand function.
��(�)
��= � ·
��(�)
��− � = 0 .
18 31 March 2016
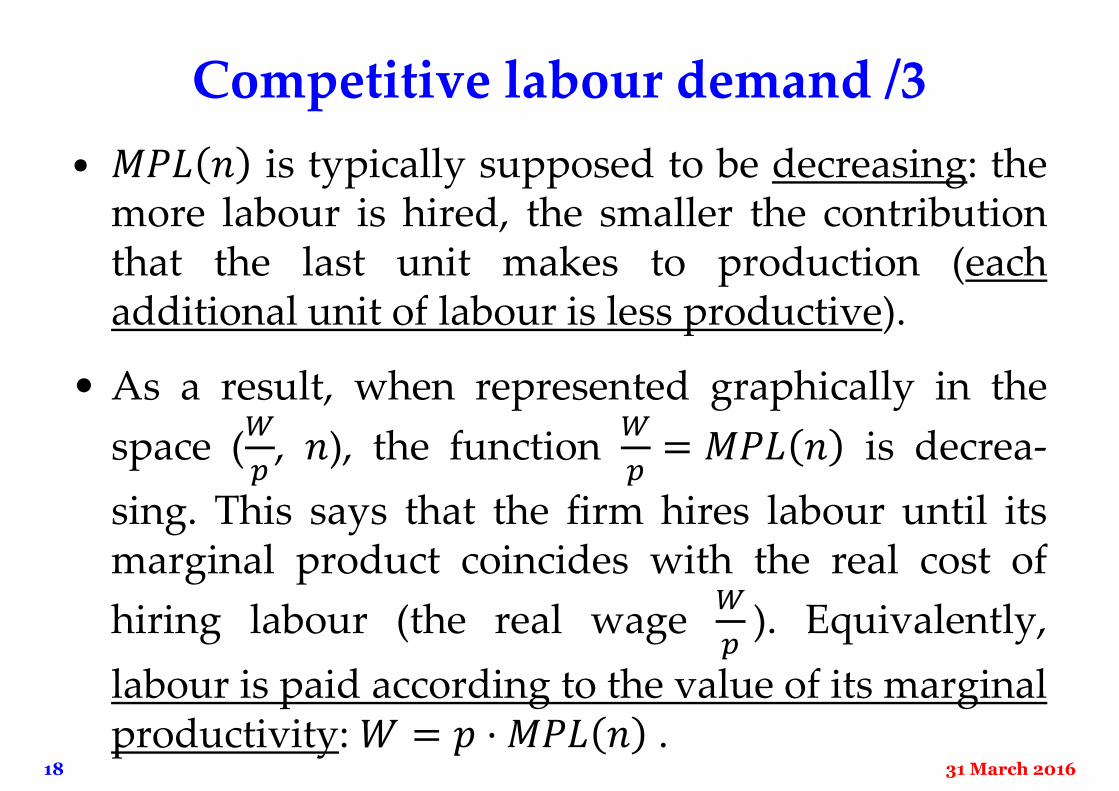
Competitive labour demand /3
• ��� � is typically supposed to be decreasing: themore labour is hired, the smaller the contributionthat the last unit makes to production (eachadditional unit of labour is less productive).
• As a result, when represented graphically in the
space (�
�, �), the function
�
�= ��� � is decrea-
sing. This says that the firm hires labour until itsmarginal product coincides with the real cost of
hiring labour (the real wage�
�). Equivalently,
labour is paid according to the value of its marginalproductivity: � = � · ��� � .
19 31 March 2016
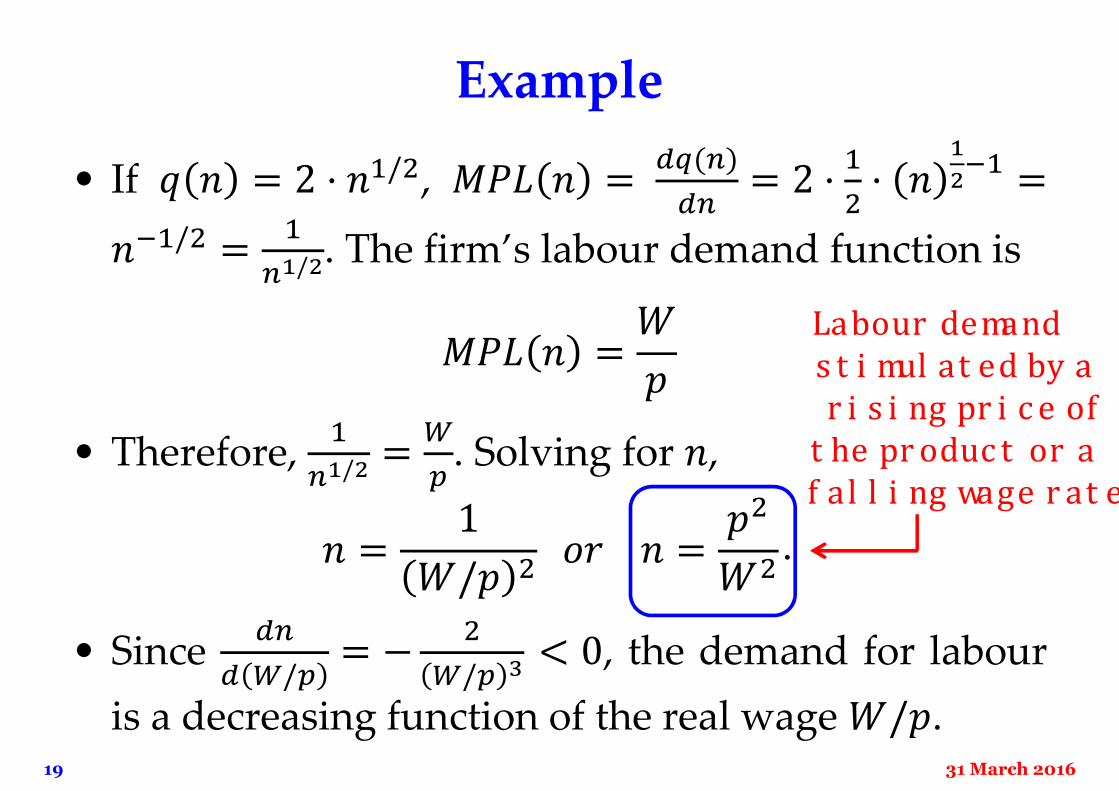
Example
• If � � = 2 · ��/�, ��� � =��(�)
��= 2 ·
�
�· �
�
�� � =
�� �/� =�
��/�. The firm’s labour demand function is
��� � =�
�
• Therefore,�
��/� =�
�. Solving for �,
� =1
�/� � �� � =
��
��
• Since��
� �/�= −
�
�/� � < 0, the demand for labour
is a decreasing function of the real wage �/�.
Labour demandstimulated by arising price of
the product or afalling wage rate
.
20 31 March 2016
Equilibrium in the labour market
• Since the labour demand of each firm is inverselycorrelated with a certain wage rate, one may jumpto the conclusion that the aggregate demand forlabour in an economy is inversely correlated withthe economy’s real wage.
• The equilibrium real wage rate �* is such thatlabour supplied at �* equals labour demanded at�*. Given �*, there is no involuntary unemploy-ment: everyone willing to get hired at �* is hired.The difference �� − �* can be viewed as voluntary
unemployment (�∗��
would be the participation rate).
21 31 March 2016
Unemployment in the classical model /1
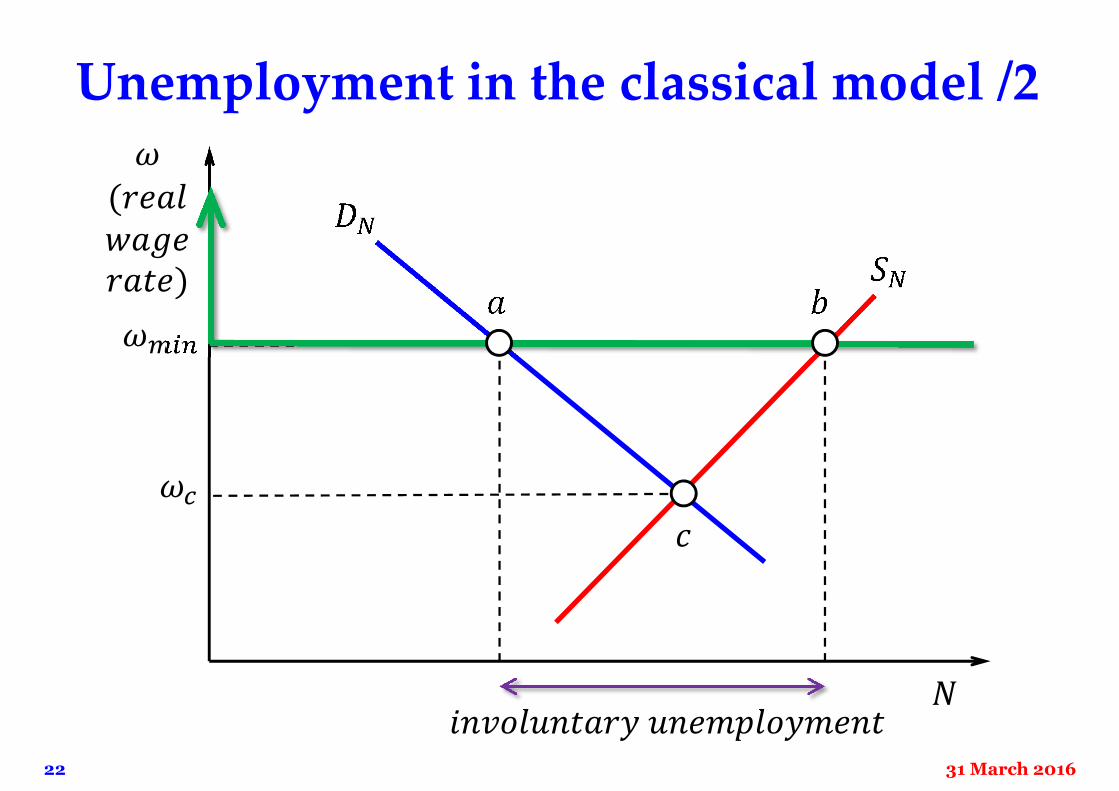
• Establishing a mininum real wage ���� above theequilibrium wage rate �* generates involuntaryunemployment in a competitive labour market.
• The next slide illustrates this possibility. Marketequilibrium occurs at point � . If the minimumwage rate ���� is set, the market state is no longerrepresented by � but by �: although workers arewilling to be at �, firms cannot be forced to hiremore workers than the amount given by �.
• At the prevailing wage rate ���� there is an excesssupply, interpreted as involuntary unemployment.
22 31 March 2016
Unemployment in the classical model /2
��
�
�����
����������� ������������
�
�
��
��
�(������������)

23 31 March 2016
Unemployment in the classical model /3
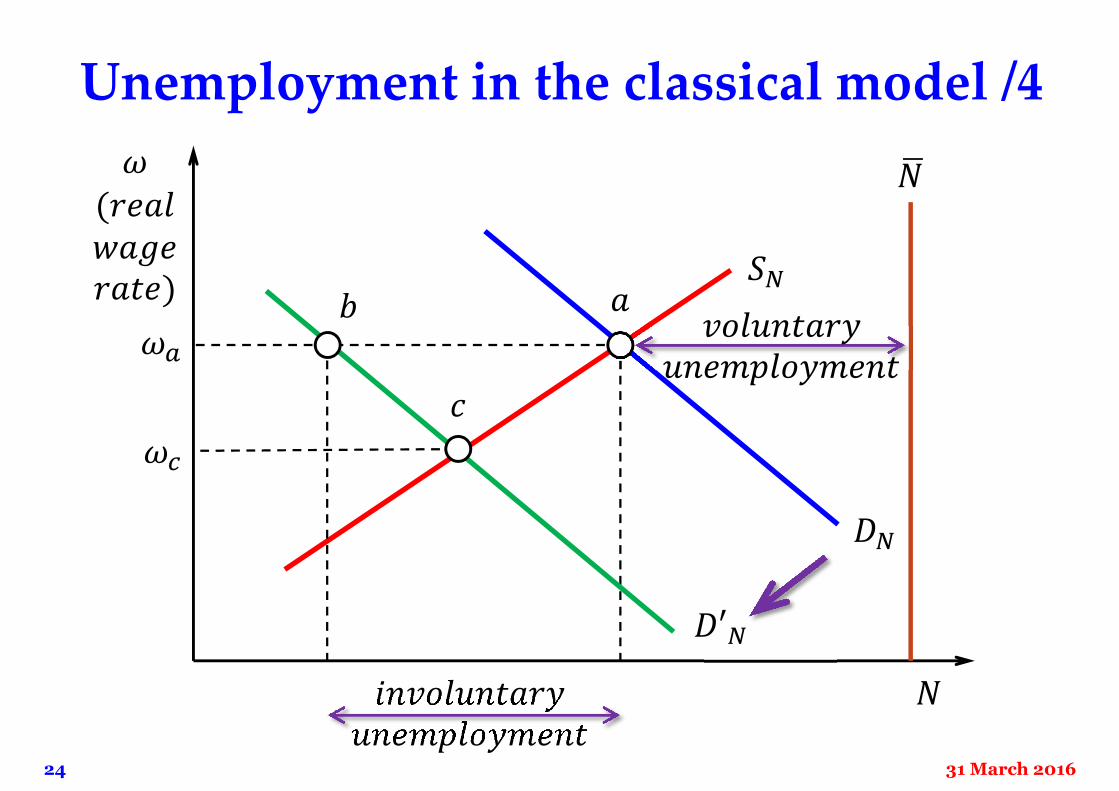
• Involuntary unemployment in a competitive labourmarket may also temporarily arise if the real wagerate adjusts sluggishly.
• The next slide illustrates this situation. Marketequilibrium occurs initially at �, with wage rate ��.The demand for labour function shifts to the left.The new equilibrium would be represented by �.
• But if the real wage rate takes time to adjust (de-crease), the wage rate in the market may tempora-rily remain at the initial level ��. The market isthen at �, where involuntary unemployment exists.
24 31 March 2016
Unemployment in the classical model /4
��
��
�
���
�����������������������
�
�
�′�
��
��
���������������������
�(������������)
25 31 March 2016
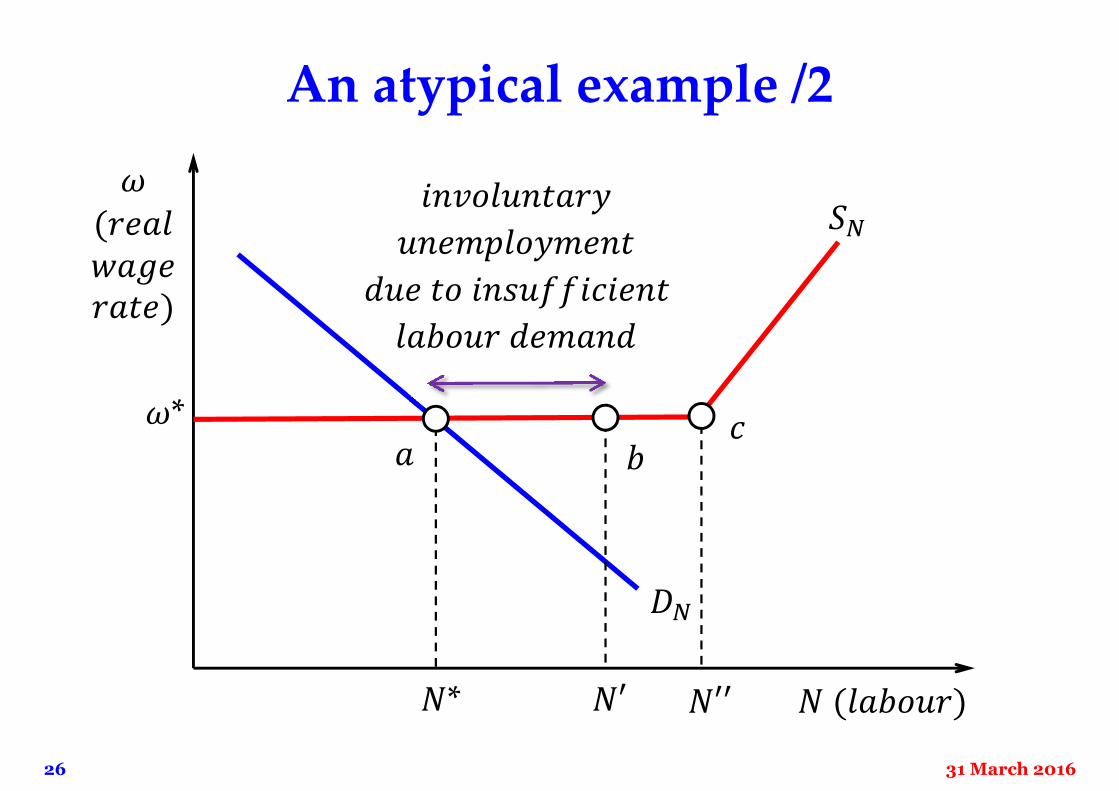
An atypical example /1
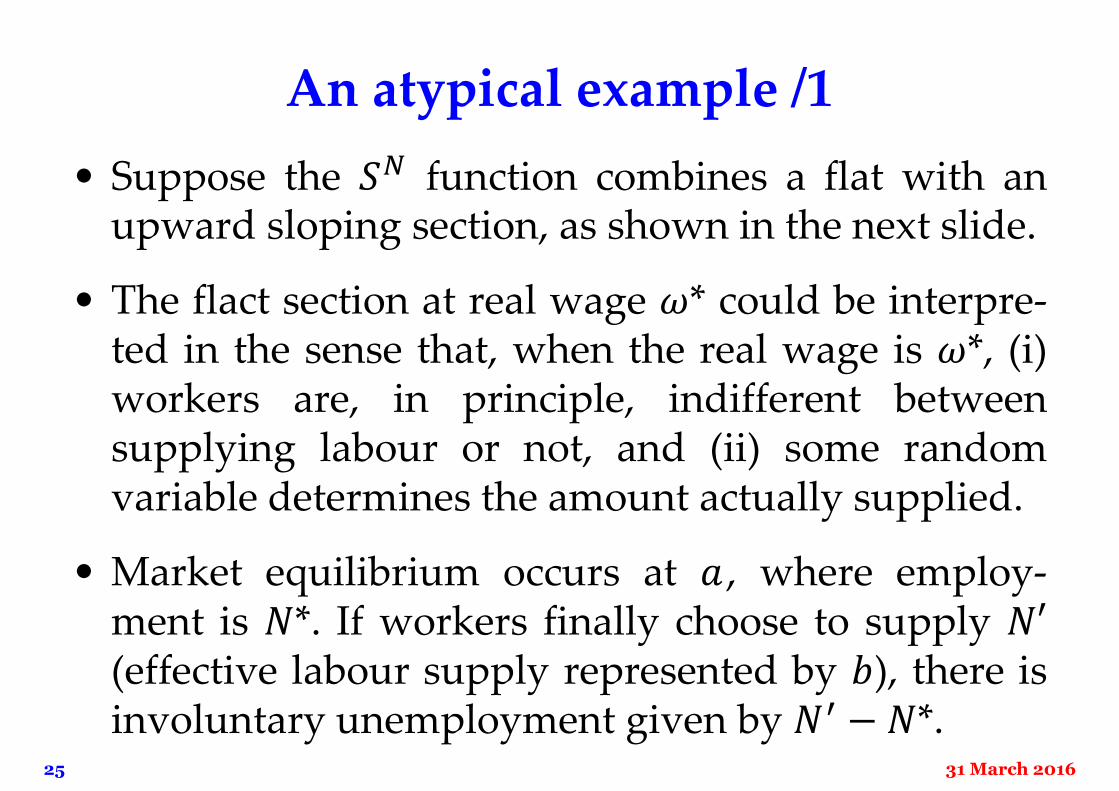
• Suppose the �� function combines a flat with anupward sloping section, as shown in the next slide.
• The flact section at real wage �* could be interpre-ted in the sense that, when the real wage is �*, (i)workers are, in principle, indifferent betweensupplying labour or not, and (ii) some randomvariable determines the amount actually supplied.
• Market equilibrium occurs at � , where employ-ment is �*. If workers finally choose to supply �′(effective labour supply represented by �), there isinvoluntary unemployment given by �� − �*.
26 31 March 2016
An atypical example /2
��
��
� (������)
�(������������)
��*
�*
�����������
������������
��� �� ������������
������ ������
�
�′
�
�′′
27 31 March 2016
(Derived) demand for labour
• Firms do not hire workers because they aim ataccumulating workerts. The labour forces is a toolto produce commodities and obtain a profit byselling the commodities produced.
• For that reason, it is said that the demand forlabour by firms is a derived demand: it arises as anintermediate step in the process of reaching thefirms’ final goal, which is making profits.
• Hence, the demand for labour crucially depends onsales expectations: no matter how “cheap” labouris, workers will not be hired if firms do not expectto sell what these workers would produce.
28 31 March 2016
Supply-side market power: unions /1
• The monopsony analysis shows that demand-sidemarket power generates less employment andlower wages than perfect competition.
• Supply-side market power is typically associatedwith the existence of trade unions. For any givenamount of labour �, the wage rate unions demandto supply � will be higher than the wage ratedictated by the supply of labour function.
• This follows from the fact that unions (since theycan organize strikes) have more bargaining powerover wages than individual workers.
29 31 March 2016
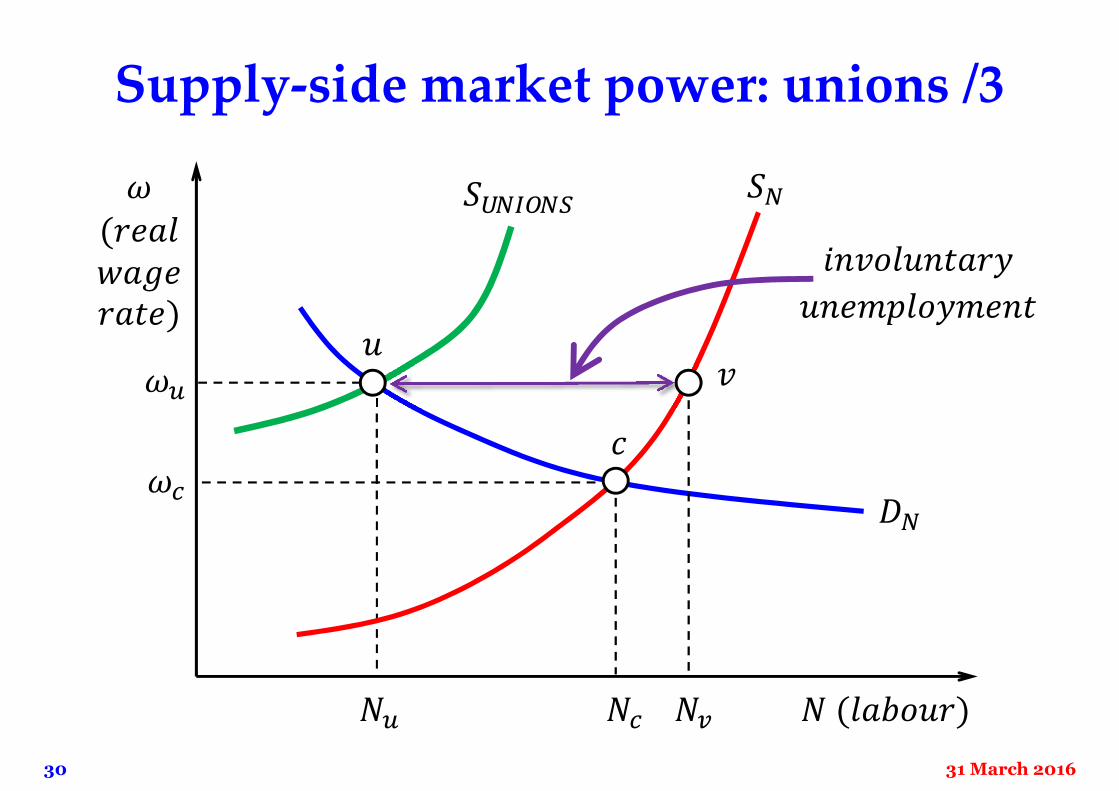
Supply-side market power: unions /2
• As a result, the function ������ � associating witheach amount of labour � the wage rate that unionswill ask to be willing to supply � must lie abovethe supply of labour function.
• The next slide combines the function ������ � witha competitive labour demand function ��. Withouttrade unions, market equilibrium is at � . Withunions market equilibrium is at �. The distancebetween � and � represents involuntary unemploy-ment: given wage �� , workers would individuallylike to supply �� but the presence of the union onlyallows �� to be hired.
30 31 March 2016
Supply-side market power: unions /3
��
� (������)
�(������������)
�
��
�� ��
�������
��
�����������
������������
�
��
�
��
31 31 March 2016
Fighting involuntary unemployment
• When the wage is “too high”, the obvious solutionto get rid of unemployment is to lower the wage(or let time pass by for the wage to adjust by itself).
• When unemployment is due to lack of labourdemand, the natural solution is an aggregatedemand expansion that induces firms to hire moreworkers to satisfy the additional demand.
• When the cause of unemployment is market power(unions), the solution seems harder to implement:how to reduce the unions’ bargaining powerwithout raising protests by part of the workers?
http://en.wikipedia.org/wiki/Trade_unions_in_the_United_Kingdom
32 31 March 2016
Price setting & wage setting model /1
• In modern economies, the nominal wage rate of asubstantial number of workers is determinedthrough collective bargaining involving unions.
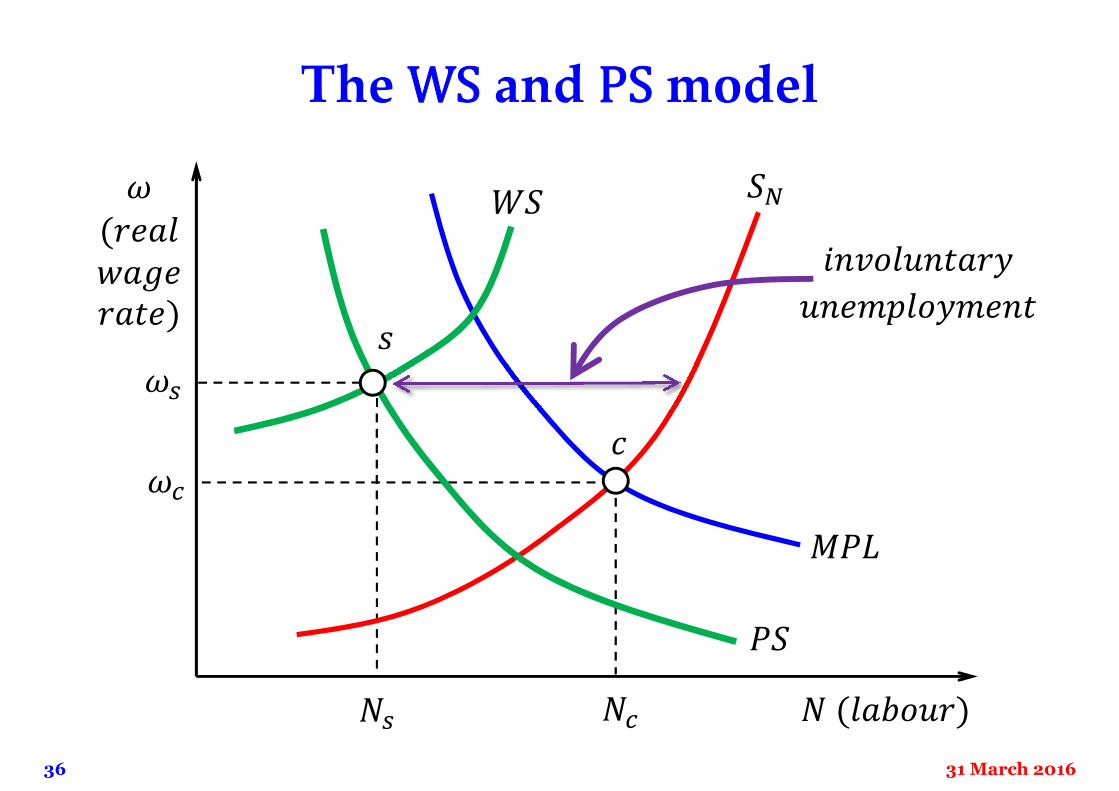
• If workers are represented by unions, at any levelof employment, the real wage will be above thewage rate dictated by the labour supply function.
• It is assumed that unions establish the real wageusing a wage setting function �� sloping upwardand lying above the labour supply function ��. Thehigher the unions’ bargaining power, the larger thevertical distance between between �� and ��.
33 31 March 2016
Price setting & wage setting model /2
• Whereas workers (through unions) are assumed toset the nominal wage, firms are supposed to fix theprices of the commodities they produce.
• A simple price setting rule consists of adding a
mark-up �� > 0 to labour costs: � = 1 + �� ·�
���.
• � is measured in money (EUR) and ��� in units
of product per worker. Thus,�
� ��is the money paid
to workers divided by what they produce. In other
words,�
� ��is the (labour) cost of producing a unit
of the commodity.

34 31 March 2016
Price setting & wage setting model /3
• It follows from � = 1 + �� ·�
���that
�
�� ��· ��� =
�
�. As �� > 0,
�
�� ��< 1. Therefore, for some � > 0,
�
�� ��= 1 − �. Thus, 1 − � · ��� =
�
�. In sum,
��� = �
� + � · ��� .
• � is then a mark-up over output: the fraction of theworkers’ productivity that the firm appropriates.
productionper worker
real wageper worker
real profitper worker
35 31 March 2016
Price setting & wage setting model /4
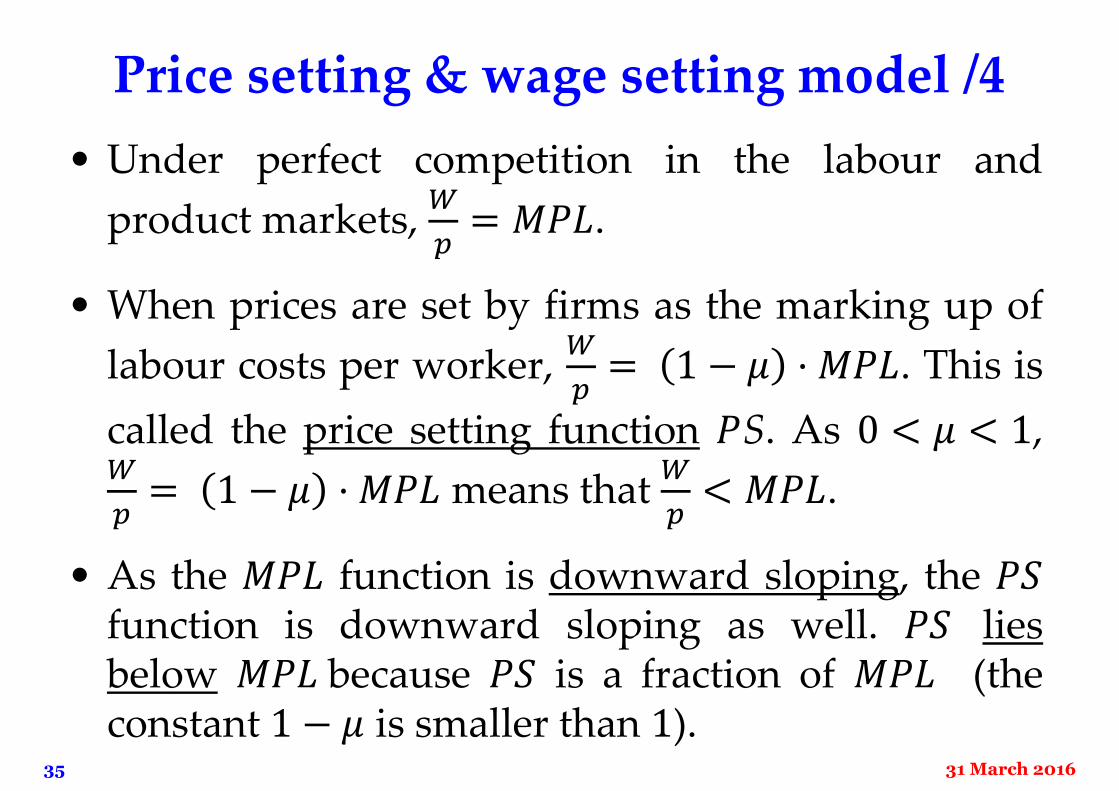
• Under perfect competition in the labour and
product markets,�
�= ���.
• When prices are set by firms as the marking up of
labour costs per worker,�
�= 1 − � · ���. This is
called the price setting function �S. As 0 < � < 1,�
�= 1 − � · ��� means that
�
�< ���.
• As the ��� function is downward sloping, the ��function is downward sloping as well. �� liesbelow ��� because �� is a fraction of ��� (theconstant 1 − � is smaller than 1).
36 31 March 2016
The WS and PS model
��
� (������)
�(������������)
�
��
�� ��
���
��
��
�����������
�������������
��
37 31 March 2016
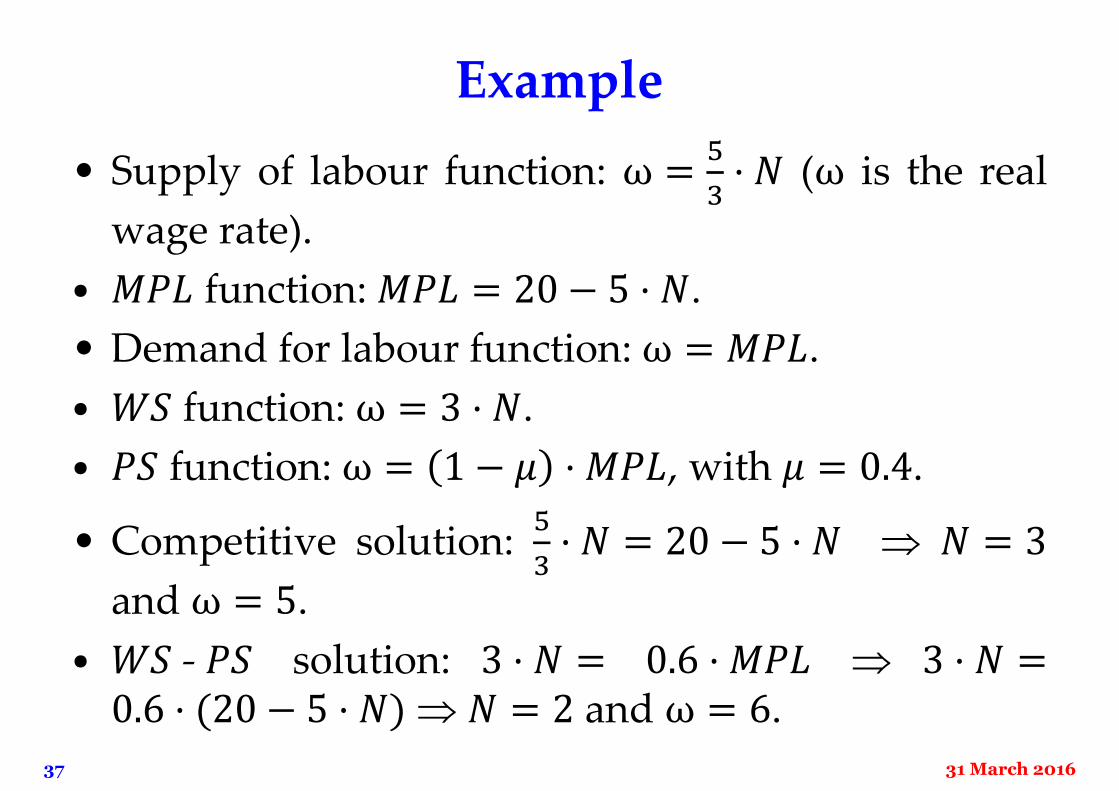
Example
• Supply of labour function: ω =�
�· � (ω is the real
wage rate).
• ��� function: ��� = 20 − 5 · �.
• Demand for labour function: ω = ���.
• �� function: ω = 3 · �.
• �� function: ω = 1 − � · ���, with � = 0.4.
• Competitive solution:�
�· � = 20 − 5 · � � = 3
and ω = 5.
• �� - �� solution: 3 · � = 0.6 · ��� 3 · � =0.6 · (20 − 5 · �) � = 2 and ω = 6.
38 31 March 2016
Segmented labour market model
• Suppose workers may have or not someeconomically irrelevant feature that firms may likeor not (for instance, being a man or not).
• Firms classify workers in two types (I and II)depending on whether they possess the feature ornot. Some firms (type I firms) prefer type Iworkers; the rest (type II) prefer type II workers.
• Each type of firms defines a different (competitive)labour market. Workers are unaware of the factthat there are two types of firms. From theirperspective, the labour market is not segmented.
39 31 March 2016
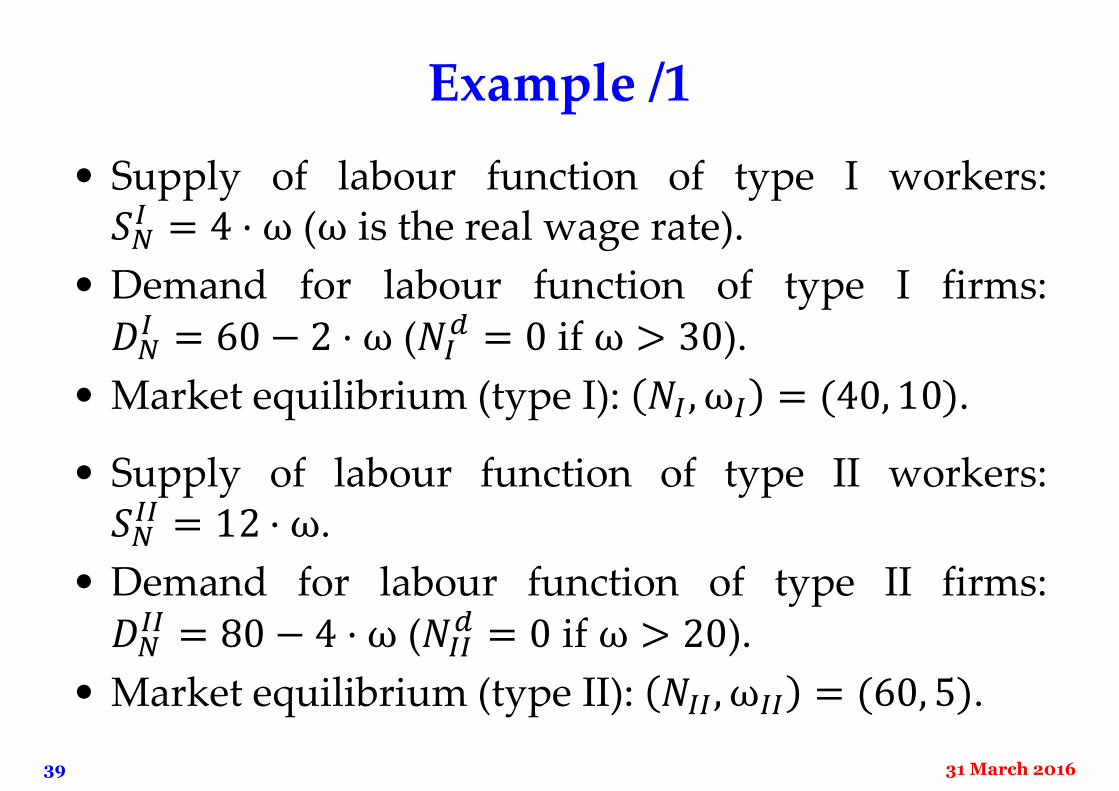
Example /1
• Supply of labour function of type I workers:��
� = 4 · ω (ω is the real wage rate).
• Demand for labour function of type I firms:
��� = 60 − 2 · ω (��
� = 0 if ω > 30).
• Market equilibrium (type I): ��, ω � = (40, 10).
• Supply of labour function of type II workers:��
�� = 12 · ω .
• Demand for labour function of type II firms:
���� = 80 − 4 · ω (���
� = 0 if ω > 20).
• Market equilibrium (type II): ���, ω �� = (60, 5).
40 31 March 2016
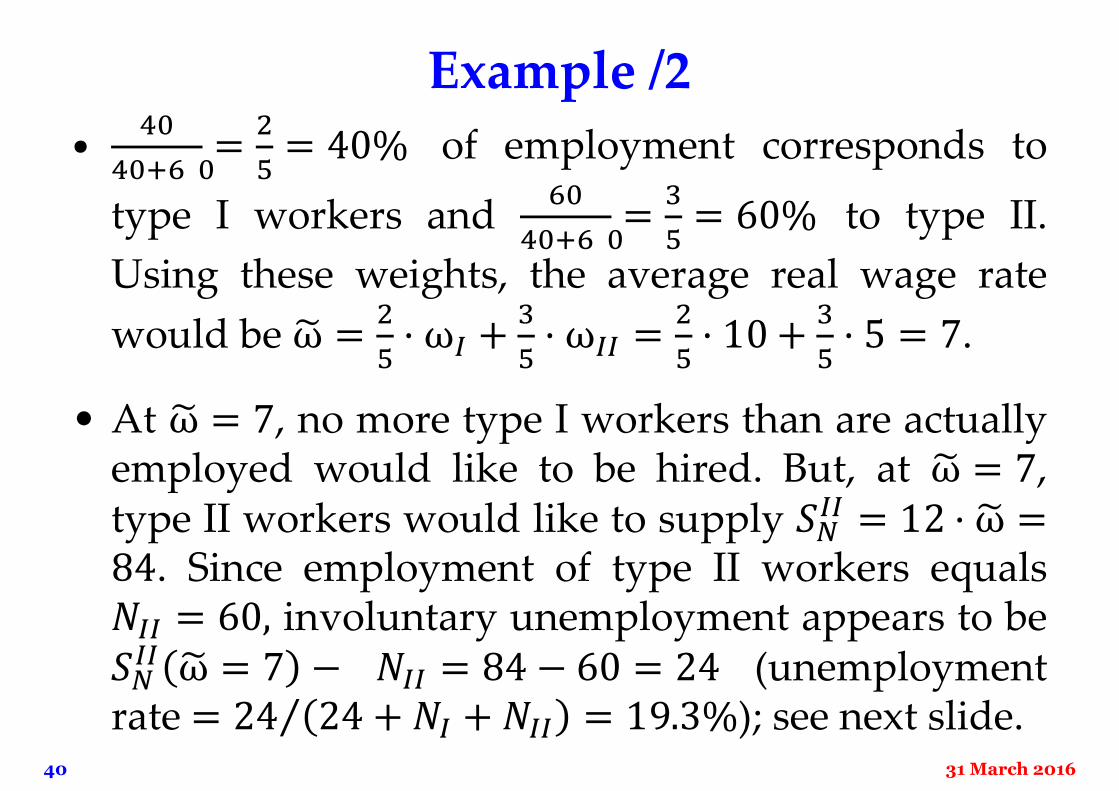
Example /2
•��
��� ��=
�
�= 40% of employment corresponds to
type I workers and��
��� ��=
�
�= 60% to type II.
Using these weights, the average real wage rate
would be ω� =�
�· ω � +
�
�· ω �� =
�
�· 10 +
�
�· 5 = 7.
• At ω� = 7, no more type I workers than are actuallyemployed would like to be hired. But, at ω� = 7,type II workers would like to supply ��
�� = 12 · ω� =84. Since employment of type II workers equals��� = 60, involuntary unemployment appears to be��
�� ω� = 7 − ��� = 84 − 60 = 24 (unemploymentrate = 24 24 + �� + ��� = 19.3%⁄ ); see next slide.
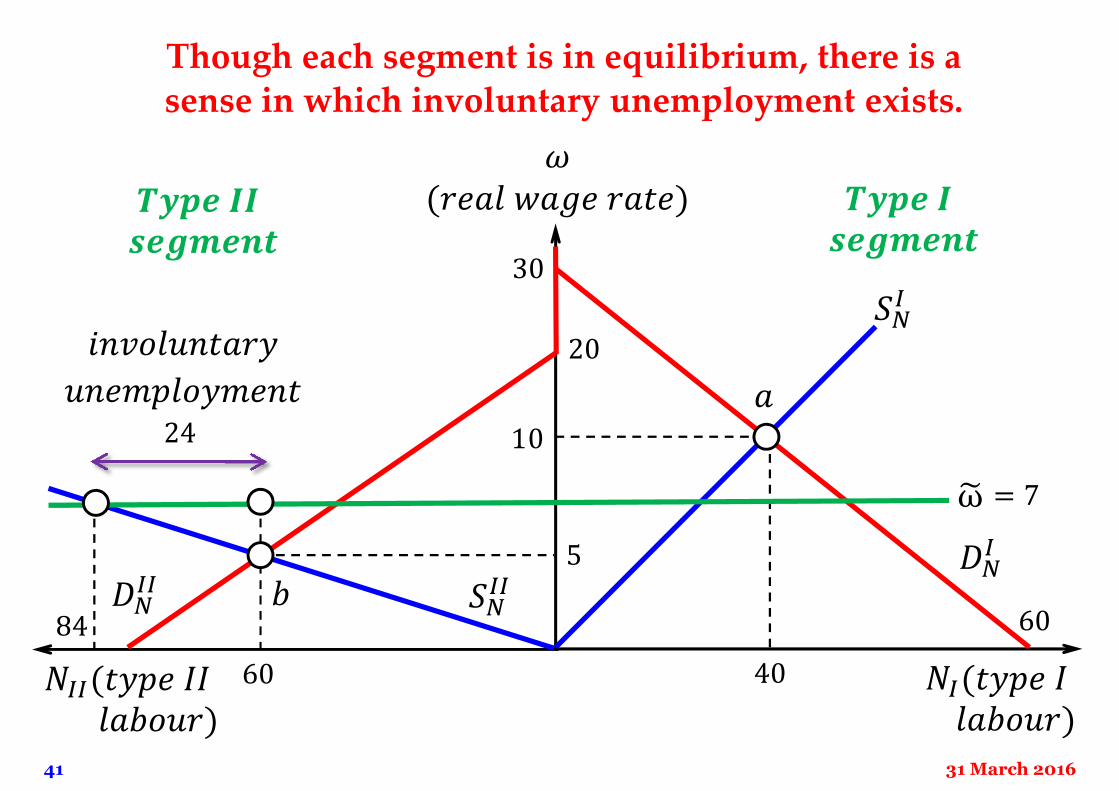
41 31 March 2016
��(���� �������)
�(���� ���� ����)
�
ω�
40
�����������
������������
�
���(���� ��������)
10
30
60
���
���
60
5
���� ��
��
= 7
20
84
24
���� ���������
���� ��������
Though each segment is in equilibrium, there is a sense in which involuntary unemployment exists.
42 31 March 2016
The E-PIS model
• It postulates three linear relations linking employ-ment with production, income, and spending.
�� relation (production employment): esta-blishes the amount of employment required toreach a certain GDP level.
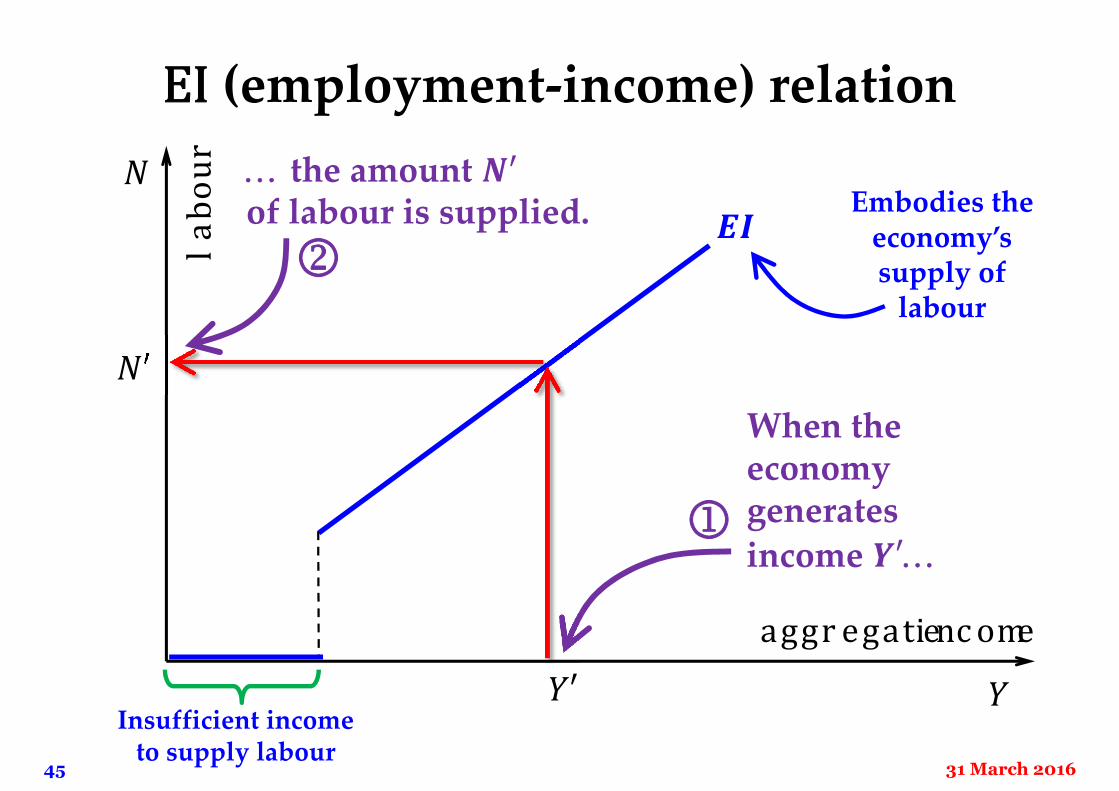
�� relation (income employment): identifiesthe amount of labour supplied for every value ofaggregate income.
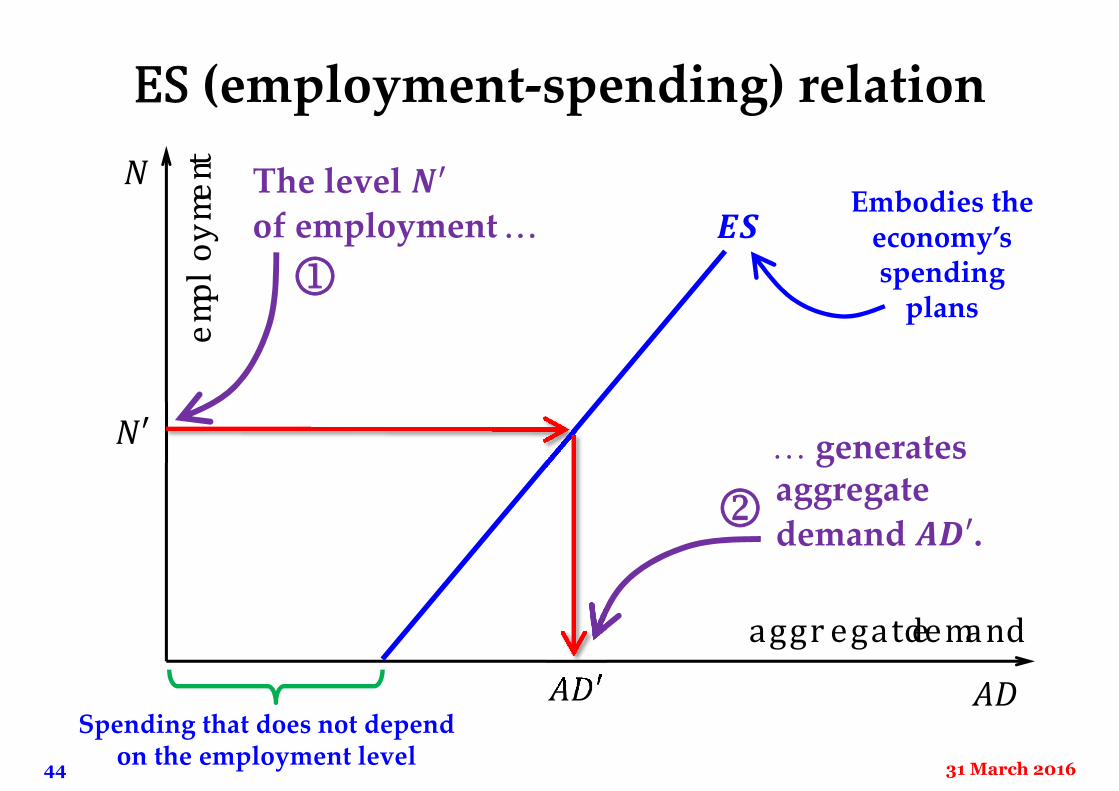
�� relation (employment expenditure): indi-cates the aggregate level of spending associatedwith any given amount of employment.
43 31 March 2016
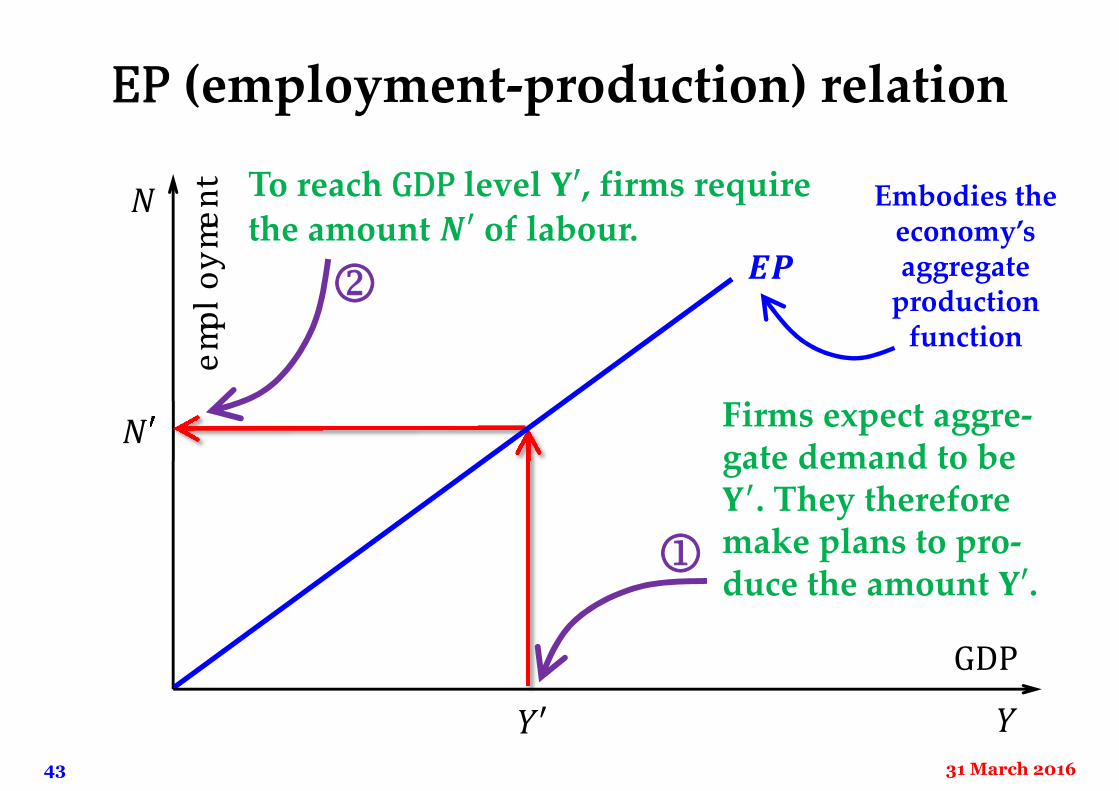
EP (employment-production) relation
�
�
�′
�′
��
em
pl
oy
me
nt
GDP
Firms expect aggre-gate demand to be ��. They thereforemake plans to pro-duce the amount �′.
To reach GDP level �′, firms require
the amount �′ of labour.Embodies the
economy’saggregate
productionfunction
44 31 March 2016
ES (employment-spending) relation
��
�
��′
�′
��e
mp
lo
ym
ent
aggregate demand
generatesaggregate
demand ��′.
The level ��
of employment Embodies the
economy’sspending
plans
Spending that does not depend on the employment level
45 31 March 2016
EI (employment-income) relation
�
�
�′
�′
��l
ab
ou
r
aggregate income
When the economy generates
income �′
the amount ��
of labour is supplied. Embodies theeconomy’ssupply of
labour
Insufficient incometo supply labour
46 31 March 2016
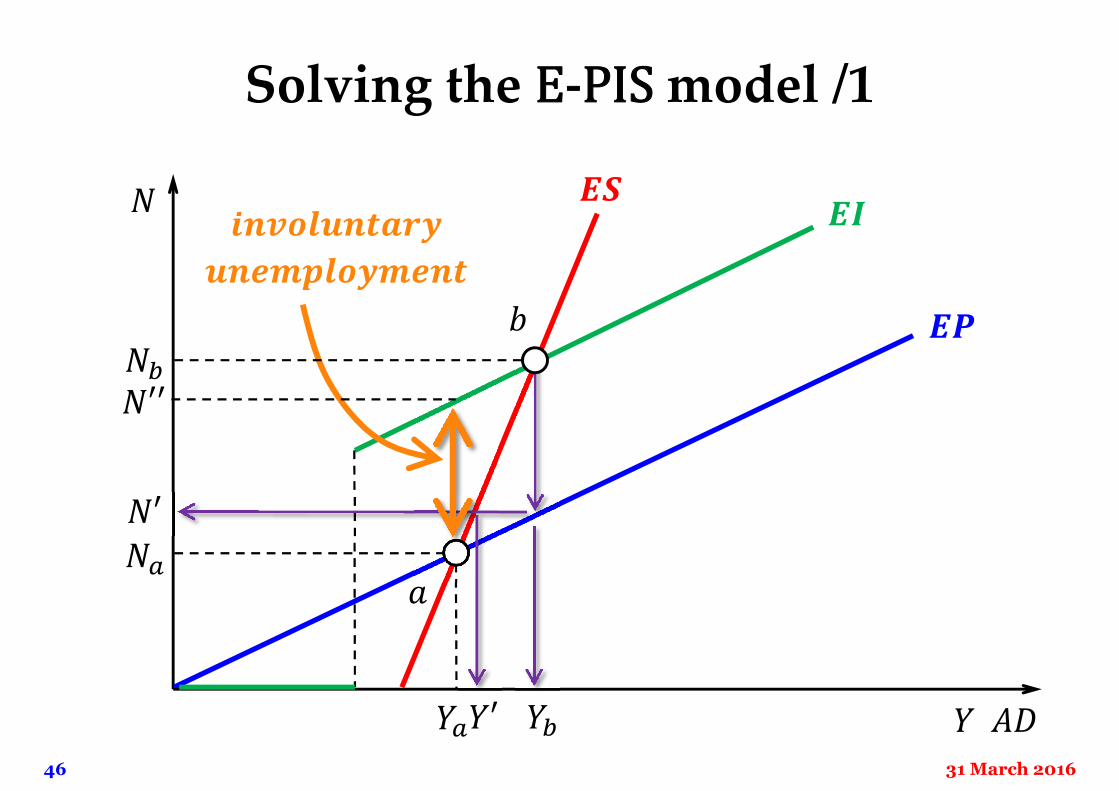
Solving the E-PIS model /1
� ��
�
��
����
�
�
��
�′
�′
�����������
������������
�′′��
��
��
47 31 March 2016
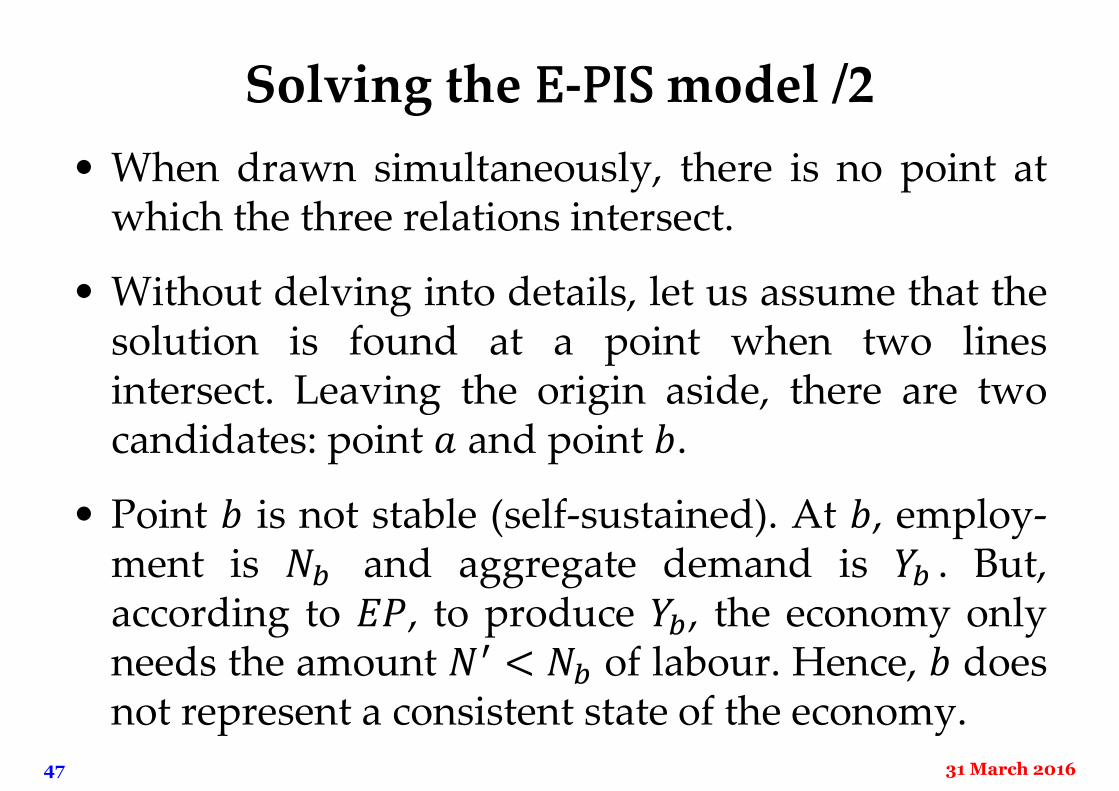
Solving the E-PIS model /2
• When drawn simultaneously, there is no point atwhich the three relations intersect.
• Without delving into details, let us assume that thesolution is found at a point when two linesintersect. Leaving the origin aside, there are twocandidates: point � and point �.
• Point � is not stable (self-sustained). At �, employ-ment is �� and aggregate demand is �� . But,according to ��, to produce ��, the economy onlyneeds the amount �� < �� of labour. Hence, � doesnot represent a consistent state of the economy.
48 31 March 2016
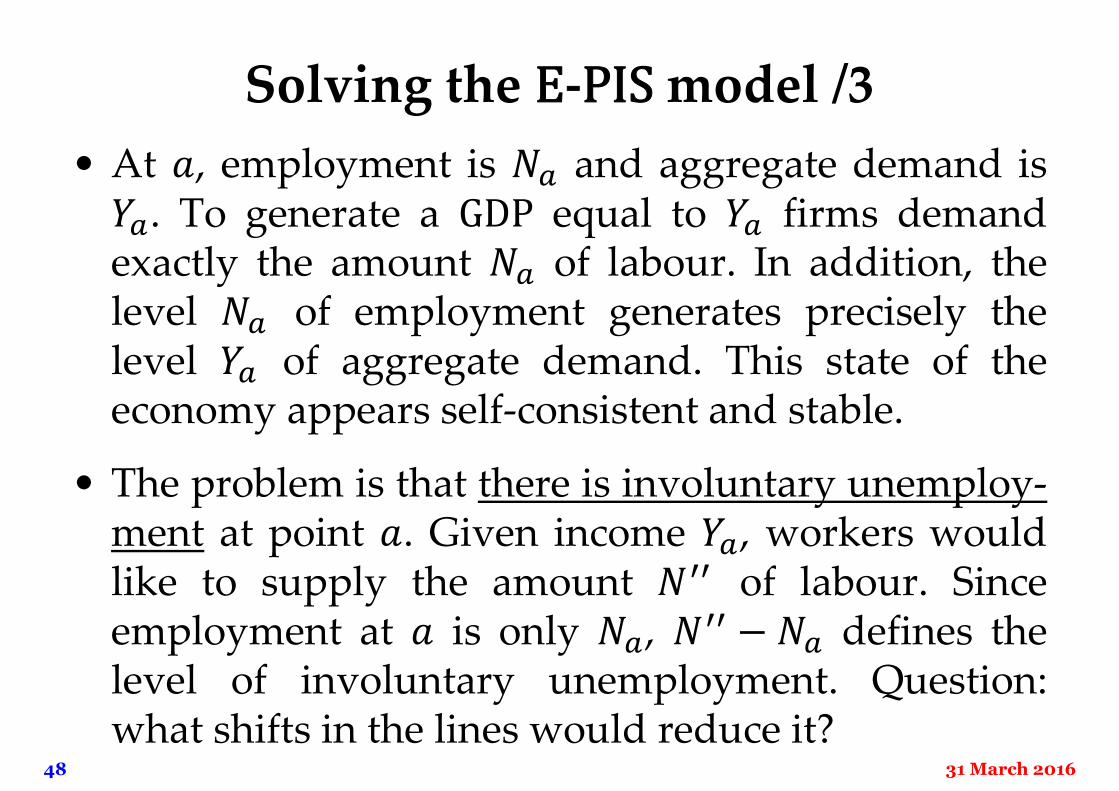
Solving the E-PIS model /3
• At �, employment is �� and aggregate demand is��. To generate a GDP equal to �� firms demandexactly the amount �� of labour. In addition, thelevel �� of employment generates precisely thelevel �� of aggregate demand. This state of theeconomy appears self-consistent and stable.
• The problem is that there is involuntary unemploy-ment at point �. Given income ��, workers wouldlike to supply the amount ��� of labour. Sinceemployment at � is only ��, ��� − �� defines thelevel of involuntary unemployment. Question:what shifts in the lines would reduce it?
49 31 March 2016
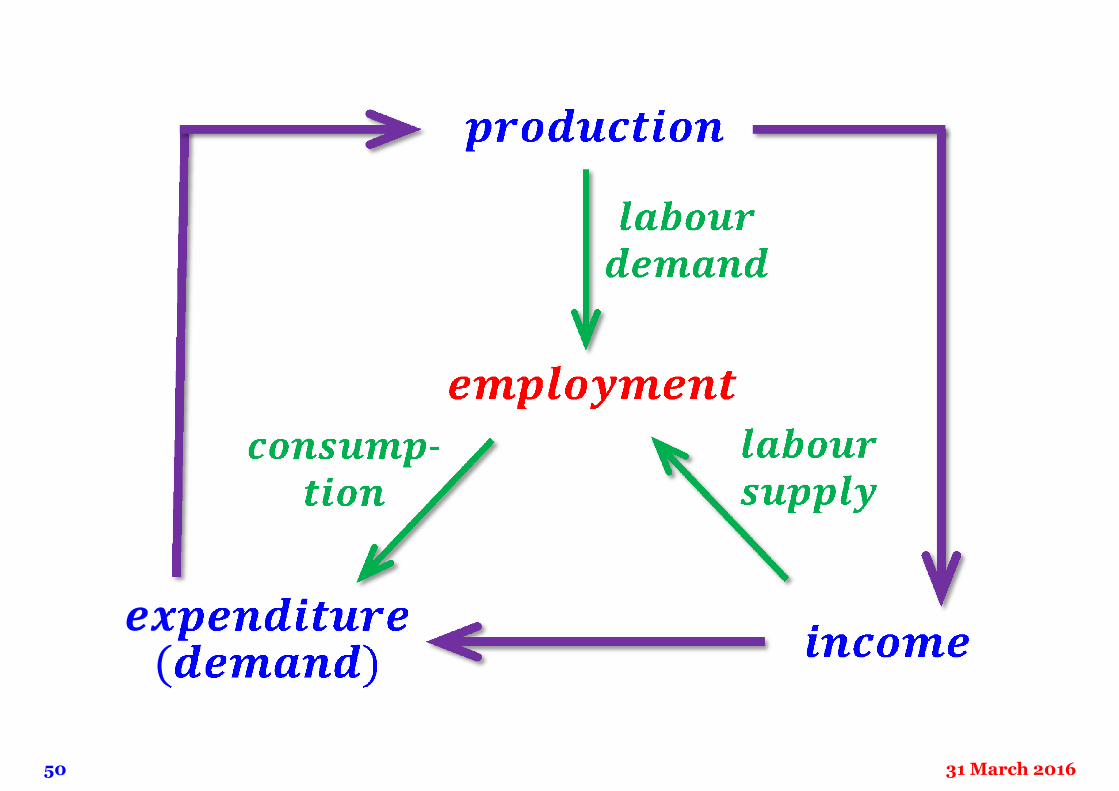
Interpreting the E-PIS model /1
• The arguably simplest description of an economy isgiven by the loop
production income expenditure production
• The E-PIS model inserts labour in this loop. First,production creates a derived demand: the demandfor labour. Second, the income the economygenerates is a key variable helping workers todecide the amount of labour supplied.
• Lastly, the level of employment, once determined,significantly contributes to establish aggregatedemand, which in turn affects production.
50 31 March 2016
����������
�����������������
(������)
����������
������������
������������
�������-����
51 31 March 2016
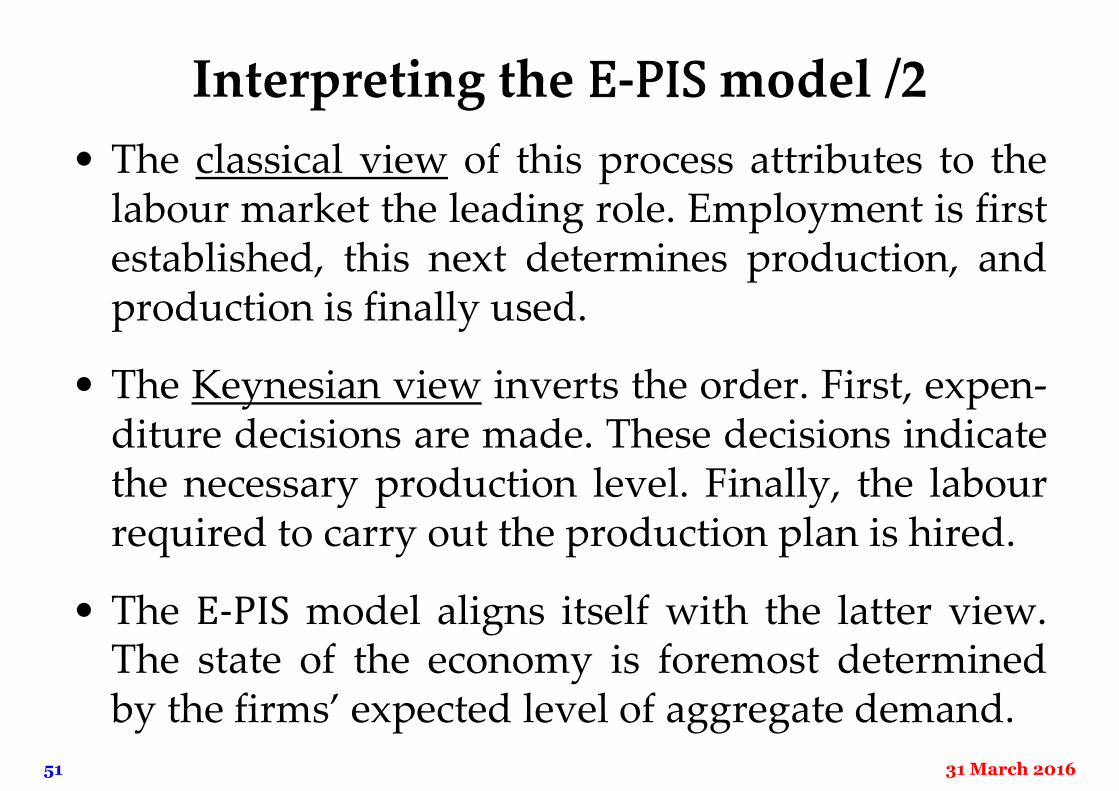
Interpreting the E-PIS model /2
• The classical view of this process attributes to thelabour market the leading role. Employment is firstestablished, this next determines production, andproduction is finally used.
• The Keynesian view inverts the order. First, expen-diture decisions are made. These decisions indicatethe necessary production level. Finally, the labourrequired to carry out the production plan is hired.
• The E-PIS model aligns itself with the latter view.The state of the economy is foremost determinedby the firms’ expected level of aggregate demand.
52 31 March 2016
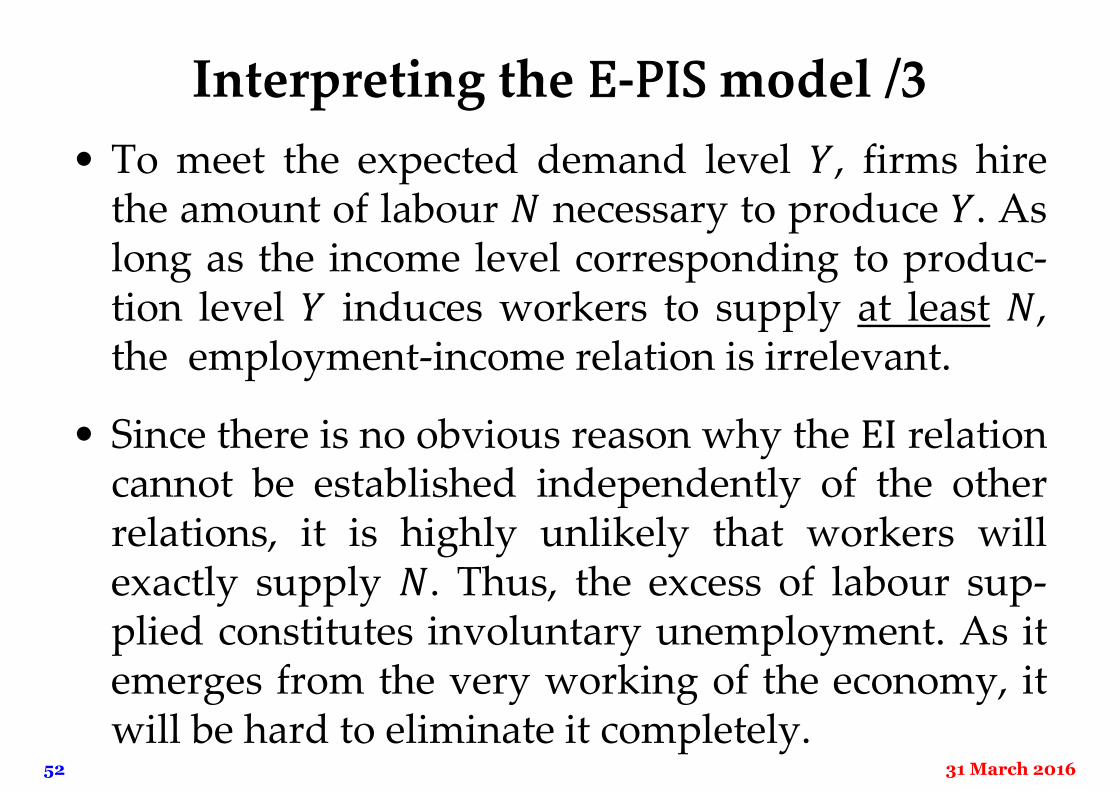
Interpreting the E-PIS model /3
• To meet the expected demand level �, firms hirethe amount of labour � necessary to produce �. Aslong as the income level corresponding to produc-tion level � induces workers to supply at least �,the employment-income relation is irrelevant.
• Since there is no obvious reason why the EI relationcannot be established independently of the otherrelations, it is highly unlikely that workers willexactly supply �. Thus, the excess of labour sup-plied constitutes involuntary unemployment. As itemerges from the very working of the economy, itwill be hard to eliminate it completely.


![woman, will you marry the one depicted?]gandalf.fee.urv.cat/professors/AntonioQuesada/Curs1617/... · 2017-02-09 · 6 Session 1 · 7 Feb 2017 The grid illusion (Gray squares at the](https://img.pdfslide.us/doc/110x75/5f8728c08d8ba84c05048174/woman-will-you-marry-the-one-depicted-2017-02-09-6-session-1-7-feb-2017-the.jpg)