Embed Size (px)
Citation preview
THE SURVEY OF INCOME AND PROGRAM PARTICIPATION
THE IMPACT OF IMPUTATION PROCEDURES ON DISTRIBUTIONAL CHARACTERISTICS
OF LOW INCOME POPULATION
No. 8710 3 2
Pat Doyle and Robert Dalrymple
August 1987
U.S. Department of Commerce BUREAU OF THE CENSUS
ACKNOWLEDGEMENTS
The au thors wish t o thank severa l i n d i v i d u a l s who c o n t r i b u t e d t o t h i s p r o j e c t . John Czajka of Mathematica P o l i c y Research and Steven Car lson and Anna Kondratas of t h e Food and N u t r i t i o n Serv ice , USDA, p rov ided i n s i g h t f u l rev iews of t he e a r l y d r a f t s o f t - 1 ~ r e p o r t . Bob Cohen of Soc ia l and S c i e n t i f i c Systems produced t h e d n a l y s i s f i l e on which t he research was based. Bren t Sear le ded ica ted trerneqdous e f f o r t toward t h e development of t h e s t a t i s t i :: r-esented i n t r e p o r t . F i n a l l y , ou r g r e a t thanks t o Car la Hawkins d Lena Cunni Am f o r t h e i r expe r t p r o d u c t i o n o f t h i s document.
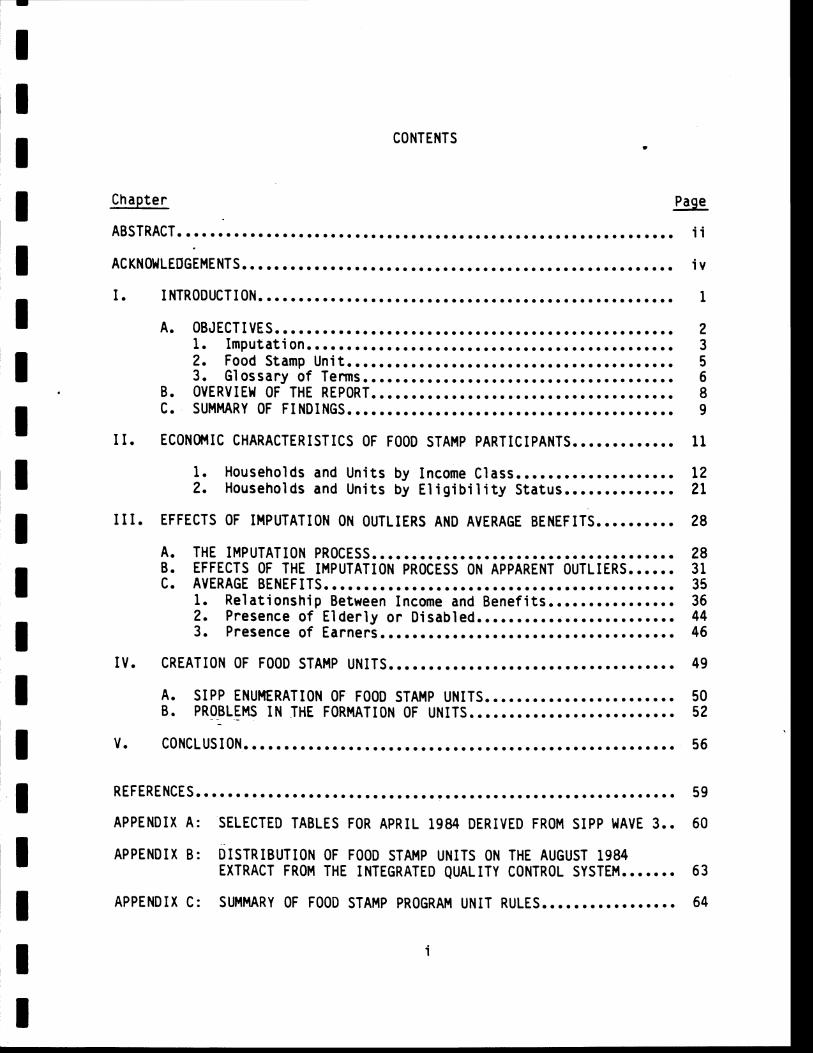
CONTENTS
C h a p t e r P a g e
ABSTRACT .............................................................. ii
I . INTRODUCTION . . . . . . . w . . . . e . .................................*... 1
.................................................. A . OBJECTIVES 2 ................ 1 . I m p u t a t i o n ............................. 3 2 . F o o d S t a m p U n i t .................... ........... . . . . . 5 3 . G l o s s a r y o f T e r m s ....................................... 6
B . OVERVIEW OF THE REPORT ...................................... 8 ......................... C . SUMMARY OF FINDINGS 9
I 1 . ECONOMIC CHARACTERISTICS OF FOOD STAMP PARTICIPANTS ............. 11
1 . H o u s e h o l d s a n d U n i t s b y I n c o m e C l a s s .................... 1 2 2 . H o u s e h o l d s a n d U n i t s b y E l i g i b i l i t y S t a t u s .............. 2 1
I I I . EFFECTS OF IMPUTATION ON OUTLIERS AND AVERAGE BENEFITS .......... 2 8
..... A . THE IMPUTATION PROCESS ............................... .. 2 8 B * EFFECTS OF THE IMPUTATION PROCESS ON APPARENT OUTLIERS ...... 3 1 ..................... C . AVERAGE BENEFITS e..................... 3 5
1 . Re1 a t i o n s h i p B e t w e e n I n c o m e a n d B e n e f i t s ................ 3 6 2 . P r e s e n c e o f E l d e r l y o r D i s a b l e d ............ .... ..... ... 4 4 3 . P r e s e n c e o f E a r n e r s .................................. 4 6
I V * CREATION OF FOOD STAMP UNITS .............. m. ....*............. 4 9
A . S I P P ENUMERATION OF FOOD STAMP UNITS ................. .. .... 5 0 B . PROBLEMS .. . I N THE FORMATION OF UNITS .......................... 5 2 .
.............................. REFERENCES.. ........................... 5 9
APPENDIX A: SELECTED TABLES FOR APRIL 1 9 8 4 DERIVED FROM S I P P WAVE 3 . . 60 APPENDIX B: D I S T R I B U T I O N OF FOOD STAMP UNITS ON THE AUGUST 1 9 8 4
EXTRACT FROM THE INTEGRATED QUALITY CONTROL SYSTEM ....... 6 3
APPENDIX C: SUMMARY OF FOOD STAMP PROGRAM UNIT RULES ................. 6 4
ABSTRACT
The a n a l y s i s o f t h e impact o f t he impu ta t i on procedures on t he d i s t r i b u t i o n a l
c h a r a c t e r i s t i c s of t h e low income popu la t i on i s concen t ra ted on t h e popu la t i on
r e c e i v i n g b e n e f i t s under t h e Food Stamp Program as r e f l e c t e d i n t h e Survey o f
Income and Program P a r t i c i p a t i o n (SIPP). Th is i s a means-tested i n k i n d
t r a n s f e r program - f o r which b e n e f i t s a re c a l c u l a t e d as an e x p l i c i t f u n c t i o n o f
s e l e c t e d c h a r a c t e r i s t i c s i n c l u d i n g income, u n i t s i z e , presence o f ea rn ings and
presence o f e l d e r l y o r d i s a b l e d members. The ex i s t ence o f t h i s e x p l i c i t
r e l a t i o n s h i p p rov ides a p o i n t o f comparison f o r t h e outcome of t he impu ta t i on
process.
The a n a l y s i s f i r s t examines t h e impact o f impu ta t i on on aggregate c h a r a c t e r i s -
t i c s o f households r e c e i v i n g b e n e f i t s and then examines t h e impact on aggre-
ga te c h a r a c t e r i s t i c s o f t he subset o f t h e household covered by t h e bene f i t s
(i.e., t h e food stamp u n i t ) . No t ing a smal l impact of t h e i m p u t a t i o n process
on these aggregate s t a t i s t i c s , t he d i scuss ion s h i f t s t o a c l o s e r examinat ion
o f t h e p o p u l a t i o n whose b e n e f i t s o r income a re imputed. I n so doing, we show
t h a t t he i m p u t a t i o n process does n o t preserve t h e known re1 a t i onsh i p between
b e n e f i t s an& t h e de te rminan ts o f b e n e f i t l e ve l s .
I n a d d i t i o n t o a n a l y z i n g t h e impact o f impu ta t i on o f b e n e f i t s o r income, we
demonstrate t h a t t h e d i s t r i b u t i o n a l c h a r a c t e r i s t i c s o f t he food stamp popula-
t i o n a re d i f - f e r e n t when t h e u n i t of a n a l y s i s i s changed from t h e household
concept r o u t i n e l y employed by t he Census Bureau t o t h e food stamp u n i t . We
f u r t h e r descr ibe some problems encountered i n t h e format ion o f food stamp
u n i t s w i t h S I P P .
iii
I. INTRODUCTION
The Food Stamp Program i s one o f seventeen n u t r i t i o n programs admin is te red by
t h e Food and N u t r i t i o n Serv ice o f t h e U.S. Department o f A g r i c u l t u r e (FNS).
Th i s program prov ides coupons t o t he low income p o p u l a t i o n which can be used
t o purchase food. I n o rde r t o be e l i g i b l e t o r e c e i v e food stamp b e n e f i t s
c e r t a i n requ i rements must be met. These requi rements a re imposed on a group
of people, h e r e a f t e r r e f e r r e d t o as t he food stamp u n i t , who purchase and
prepare meals t o g e t h e r and who r e s i d e t o g e t h e r . l The u n i t , once de f ined , i s
e l i g i b l e t o r e c e i v e b e n e f i t s i f assets , gross income, and income e x c l u s i v e of
d e d u c t i b l e expenses f a l l w i t h i n s p e c i f i e d l i m i t s wh ich vary by u n i t s i z e and
geographic l o c a t i o n . U n i t s c o n t a i n i n g e l d e r l y (age 6 0 t ) o r d i s a b l e d members
a r e a l l owed e x t r a income and assets and h i ghe r deduc t ions than o t h e r u n i t s
w i t h t h e same s ize . Once e l i g i b l e , u n i t s ' b e n e f i t s a re determined as an
exp l i c i t f u n c t i o n o f income 1 ess d e d u c t i b l e expenses and t h e T h r i f t y Food
Plan.
The Survey o f Income and Program P a r t i c i p a t i o n (SIPP) i s a mu l t i - pane l l o n g i -
t u d i n a l survey which c o l l e c t s i n f o r m a t i o n on Food Stamp Program p a r t i c i p a n t s - - -
as a p a r t o? t he co re ques t ions repeated a t every inter vie^.^ Also i nc l uded
i n t h e co re a re ques t ions p e r t a i n i n g t o income which i s coun tab le under t h e
l ~ h e r e a re some excep t ions t o t h i s u n i t d e f i n i t i o n which a l l o w t h e fo rmat ion of separa te - u n i t s w i t h i n t he group o f r e c i p i e n t s sha r i ng meals. A summary o f t h e r e g u l a t i o n s which govern t he f o rma t i on of food stamp u n i t s i s i nc l uded i n Appendix C.
or an overv iew o f S I PP see Nel son, e t a1 . (1985).
Assets and most deduc t i b le expenses are measured i n top.ical modules
admin is te red once ( i n t he case of expenses) o r tw i ce ( i n the case o f assets) I o v e r the two and a h a l f year du ra t i on o f each panel i n the survey. 1 I SIPP i s an impor tan t t o o l f o r t he ana l ys i s of the Food Stamp Program (FSP) f o r
a number o f reasons. The c o l l e c t i o n of the determinants o f e l i g i b i l i t y noted I above i s one. Another impor tan t feature i s t h a t income and program p a r t i c i p a -
t i o n are month ly s t a t i s t i c s co inc iden t w i t h the program account ing period. A I
t h i r d fea ture i s t h a t an at tempt i s made t o c o l l e c t i n f o r m a t i o n on the food
stamp u n i t w i t h i n the Census d e f i n i t i o n o f a household. F i n a l l y , t h e survey
I i s l o n g i t u d i n a l hence p r o v i d i q g an oppo r tun i t y t o i n v e s t i g a t e t he dynamics of I t h e program p a r t i c i p a n t s . I A. OBJECTIVES
Before proceeding t o use S I P P t o analyze the FSP, FNS i s i n t e r e s t e d i n
ana l yz ing t h e qua1 i t y o f t he in fo rmat ion co l l ec ted . The f i r s t s tep i n t h i s
a n a l y s i s was the comparison o f SIPP-based est imates t o est imates o f program I
p a r t i c i p a n t s de r i ved from surveys of a d m i n i s t r a t i v e data on the program case-
l o a d (Dalrymple and Carlson, 1986). The second step, which i s the sub jec t of
I t h i s paper, i s t o analyze the impact of t he Census Bureau's nonresponse
- - .-
I -
adjustments on the d i s t r i b u t i o n a l c h a r a c t e r i s t i c s o f the low income popu la t ion
and t o examine t h e imp1 i c a t i o n s of basing these c h a r a c t e r i s t i c s on the Census I
household. S p e c i f i c a l l y we are concerned here w i t h the impact o f imputa t ion I
l ~ h e i n i t i a l S I P P panel was in te rv iewed over a two year and 10 month period. Subsequent panels were i n te rv iewed over a two year and 7 month period. I
on the SIPP-based est imates o f the economic c h a r a c t e r i s t i c s o f prpgram p a r t i c -
i pan ts and on the c r e a t i o n o f the food stamp u n i t w i t h i n the Census household.
1. Imputat ian
The Census Bureau deals w i t h nonresponse i n two d i f f e r e n t ways. F i r s t , the
sample i s weighted t o compensate f o r most noninterviews. That i s , most obser-
va t i ons which refuse t o p a r t i c i p a t e are de le ted from the sample and o ther
observat ions have t h e i r sample weights adjusted so t h a t when aggregated, the
weighted t o t a l s r e f l e c t the f u l l un iverse from which the sample was drawn.
The second method of compensating f o r nonresponse i s t o impute data fo r the
miss ing i n fo rma t ion i n each incomplete record. The observat ions who refuse t o
p a r t i c i p a t e bu t who remain i n the sample have a l l o f t h e i r responses t o the
quest ionna i re imputed. I n d i v i d u a l s who are success fu l l y in te rv iewed but who
f a i l e d t o respond t o one o r more items i n the quest ionna i re a lso have the
miss ing i tems imputed.
L i t t l e i s a c t u a l l y known about the t r u e values o f the i tems which are missing.
The Census Bureau's imputa t ion procedures are designed t o preserve the o v e r a l l
mean and var iance o f the repor ted in format ion f o r the t o t a l populat ion. I n
the case o f -. food - stamps and o ther means-tested t rans fe rs , there i s an e x p l i c i t
r e l a t i o n s h i p between bene f i t l e v e l s and the determinants o f b e n e f i t l e v e l s
(income, u n i t s i z e and composit ion, and earnings r e c e i p t ) which i s no t taken
i n t o account i n t he Census Bureau procedures. Heeringa and Lepkowski (1986)
note t h a t imputa t ion f o r a miss ing i tem may d i s t o r t the r e l a t i o n s h i p between
i t and o ther i tems unless spec i f i c con t ro l s are imposed. One o b j e c t i v e of
t h i s paper i s t o see i f i n f ac t the absence o f a con t ro l f o r the r e l a t i o n s h i p
betwon- hano f i t l e v e l s and the determinants o f b e n e f i t s l e v e l s does d i s t o r t
t h e r e l a t i o n s h i p i n the case o f the Food Stamp Program. I We do not expect t h a t the r e s u l t s o f t h i s ana lys i s w i l l t e l l us conc lus ive ly I t h a t the Census Bureau's imputa t ion procedures are e i t h e r " r i g h t o r wrong."
Instead, we expect t o determine whether they are reasonable i n l i g h t o f the I
program r e g u l a t i o n s t h a t govern the l e v e l o f b e n e f i t s r e l a t i v e t o income, u n i t
s ize , u n i t composit ion and presence o f earnings. I I
One assumption made both by the Census Bureau i n designing t h e i r imputa t ion
procedures and by us i n t e s t i n g the reasonableness o f those procedures i s t h a t
the repo r ted in fo rmat ion i s accurate and i n t e r n a l l y cons is ten t . This i s a
necessary assumption for the Census Bureau s ince t h e i r imputa t ion methodology
assigns repo r ted values f o r nonreported values when household c h a r a c t e r i s t i c s
match. This i s necessary f o r us s ince our comparisons u t i l i z e the r e l a t i o n -
sh ips observed i n the data, i.e., we do n o t develop a model o f the Food Stamp
Program and determine how we l l the imputed data f i t t h a t model. This assump-
t i o n concerning the accuracy and consis tency o f the repor ted data may i n fac t
n o t be c o r r e c t f o r a l l observat ions i n SIPP. There i s a study c u r r e n t l y under
way a t the _Census Bureau t o evaluate the q u a l i t y of the repor ted data r e l a t i v e - t o a d m i n i s t r a t i v e data f o r a sample o f S I P P cases i n f o u r s ta tes (Kasprzyk,
1986). (This i s r e f e r r e d t o as the S I P P record check study) . This study i s
designed s p e c i f i c a l l y t o explore the e r r o r ra tes i n repor ted in fo rmat ion i n
t e n t r a n s f e r programs i n c l u d i n g food stamps. The r e s u l t s o f t h a t study, when
complete , w i l l i n d i c a t e whether the assumption regard ing the correctness of
the repor ted data i s i n f a c t v a l i d .
2. Food Stamp Un i t
The i n te rv iew u n i t i n S I P P i s the Census household, i.e., a group of people
who u s u a l l y res ide together . This i n te rv iew u n i t i s a lso a commonly used
a n a l y t i c u n i t when present ing SIPP-based s t a t i s t i c s , p a r t i c u l a r l y s t a t i s t i c s
on the 'Food Stamp Program. The food stamp u n i t , commonly c a l l e d a household,
i s not i n fac t the same as the Census household. It i s a subset o f the Census
household r e s t r i c t e d t o persons who purchase and prepare meals together , w i t h
some except ions t o a l l ow f o r the format ion o f separate u n i t s f o r se lected
i n d i v i d u a l s such as e l d e r l y couples. 1
S I P P does not measure a1 1 o f the in format ion needed t o formulate a food stamp
u n i t accord ing t o the program regu la t ions . However, the survey does attempt
t o d i s t i n g u i s h the food stamp u n i t w i t h i n the Census household by s o l i c i t i n g
i n fo rma t ion on which Census household members are covered by the benef i t . As
a r e s u l t , we have observed t h a t 18 percent o f the Census households w i t h food
stamp b e n e f i t s i n September, 1983, conta in a t l e a s t one i n d i v i d u a l who i s no t
covered by the b e n e f i t (Dalrymple and Carlson, 1986), and 16 percent of the
Census households w i t h food stamp bene f i t s i n both A p r i l and August 1984
con ta in a noncovered person.2 The phenomenon o f the ex is tence o f noncovered
persons i n - f o o d stamp households i s explored more f u l l y i n Landa (1987).
l ~ h e d i f f e r i - n c e s between the Census household and the food stamp u n i t are exp la ined f u r t h e r i n Appendix C.
' ~ a s e d on t a b u l a t i o n s o f Waves 3 and 4 o f the 1984 Panel of SIPP.
One o b j e c t i v e of the paper i s t o examine the impact o f the use o f the food
stamp u n i t i ns tead o f the Census household as the u n i t o f ana lys i s fo r t he I presen ta t i on of d i s t r i b u t i o n a l c h a r a c t e r i s t i c s o f the food stamp populat ion. I It i s impor tan t t o note t h a t w h i l e we can asce r ta in when income was imputed
and when food stamp bene f i t s were imputed, we cannot asce r ta in when u n i t I composit ion was imputed. This i s somewhat r e s t r i c t i n g because u n i t s i ze i s an
impor tan t determinant o f b e n e f i t s given a s p e c i f i c income l e v e l and we simply I have t o assume t h a t when b e n e f i t s were repor ted, t he u n i t composit ion was I repo r ted as we1 1.
3. Glossary o f Terms
The two concepts described above--imputation and u n i t o f analys is- -are used I throughout t h e paper t o de f i ne the universe i n quest ion. To a s s i s t the
reader, the var ious universe d e f i n i t i o n s are de f ined below. I FOOD STAMP HOUSEHOLD
FOOD STAMP UNIT
- - - -
IMPUTED INCOME
Census household con ta in ing a t l e a s t one I person who receives food stamps. Food stamp b e n e f i t s may be repor ted o r imputed i n t h i s case. I Subset o f the food stamp household cons i s t - i n g o f on ly those people covered by food stamps. Vhen more than one person i n the 1 Census household repor ted ( o r was imputed) food stamp b e n e f i t s the u n i t cons is ts of a1 1 persons covered by any o f the benef i ts . I The food stamp household o r the food stamp u n i t (depending on the con tex t ) conta ins a t l e a s t one person who d i d no t r e p o r t a t l e a s t one income amount and the missing amount was imputed by the Census Bureau.
I The nonrespondent(s) cou ld have refused t o I p a r t i c i p a t e a1 together (non in terv iew) o r cou ld have i n d i c a t e d r e c e i p t o f a p a r t i c u - l a r income type w i thou t supply ing the I
IMPUTED BENEFITS
REPORTED INCOME
REPORTED BENEFITS
REPORTED INCOME AND BENEFITS
ELIGIBILITY
- - .- -
OUTLIERS
amount. Income r e f e r s t o cash e i t h e r i n the form o f earnings o r uneafned income.
A t l e a s t one member o f the food stamp household o r food stamp u n i t (depending on the con tex t ) i n d i c a t e d r e c e i p t o f food stamp b e n e f i t s bu t d i d no t prov ide the face value o f the coupons, which was imputed by the Census Bureau. This inc ludes nonrespondent ( s ) who refused t o p a r t i c i p a t e a1 together (non in te rv iew) i n which case r e c e i p t , b e n e f i t amounts and u n i t composit ion were a l l imputed. This a1 so inc ludes persons who repor ted r e c e i p t o f food stamps bu t no t t h e i r value. Un i t composit ion may o r may no t have been imputed f o r such persons.
Households o r u n i t s (depending on the con tex t ) who are no t c l a s s i f i e d as having imputed income. U n i t composit ion may o r may no t have been imputed.
Households o r u n i t s (depending on the con tex t ) who are no t c l a s s i f i e d as having imputed bene f i t s . U n i t composit ion may o r may no t have been imputed.
Households o r u n i t s (depending on the con tex t ) i n which no imputa t ions were performed f o r e i t h e r income amounts o r food stamp bene f i t s . U n i t composit ion may o r may no t have been imputed.
An approximation o f e l i g i b i l i t y f o r t he Food Stamp Program based s o l e l y on income, s i z e and presence o f e l d e r l y o r d isab led members. This was constructed f o r house- holds us ing income, composit ion, and s i z e o f the Census household; and f o r u n i t s us ing income, composit ion, and s i z e o f the food stamp u n i t .
Households o r u n i t s (depending on the con tex t ) w i t h excess ive ly h igh income.
B, nVFRVTEW OF THE REPORT *
The d iscuss ion i s subdiv ided i n t o th ree p a r t s f o l l owed by a concluding
chapter . Chapter I 1 focuses on the economic c h a r a c t e r i s t i c : of food s t s r p
pa r t i c i pan ts ; The p resen ta t i on begins w i t h the d i s t r i b u t i o n o f households by I
income c i a s s as pub1 ished t- 'he Census ? ~ r e a u . This t a b l e i s then rep1 i c a t e d I severa l t imes w i t h successive ly more r e s t r i c t i n g un iverse d e f i n i t i o n s t o show
t h e impact o f t h e impu ta t i on process, i.e., t he impu ta t i on o f income, bene f i t s I o r both, and the impact o f the u n i t o f ana l ys i s on t h i s d i s t r i b u t i o n . Follow-
i n g t h a t , t he economic focus switches t o the e l i g i b i l i t y concept which accounts I
f o r u n i t composi t ion and s i z e as w e l l as income. I Chapter I 1 1 s h i f t s t he focus from the d i s t r i b u t i o n a l c h a r a c t e r i s t i c s of t h e
food stamp popu la t i on t o an ana l ys i s o f t he impact o f the imputa t ion of income
o r bene f i t s on o u t l i e r s . I n t h i s case o u t l i e r s are households o r u n i t s w i t h
bene f i t s ( repo r ted o r imputed) whose incomes ( repo r ted o r imputed) are exces-
s i v e l y high. The chapter f u r t h e r examines the r e l a t i o n s h i p between average
bene f i t s and the determinants o f b e n e f i t l eve l s . This ana lys is , which i s
based on t h e food stamp u n i t , compares the r e l a t i o n s h i p o r i g i n a l l y measured by
t h e survey, i.e., t h a t der ived from u n i t s w i t h repo r ted income and benef i t s ,
t o t he r e l a t i a n s h i p imposed on nonrespondents through the imputa t ion of income
o r bene f i t s .
Chapter I V descr ibes the process employed i n the c o n s t r u c t i o n of the food
stamp u n i t f o r t h i s ana l ys i s , focus ing on the d i f f i c u l t y i n i n t e r p r e t a t i o n of
mu1 t i p l e u n i t s w i t h i n the Census hcusehold. The d i f f i c u l t i e s descr ibed i n
t h a t chapter r e s u l t from the method o f imput ing u n i t composit ion, t he l a c k of
a record o f when u n i t composit ion was imputed, and the apparent d u p l i c a t e
r e p o r t i n g o f b e n e f i t s w i t h i n t he Census household.
C. SUMMARY OF FINDINGS
The number of food stamp households t o which e i t h e r income o r food stamp
bene f i t s were imputed i s a r e l a t i v e l y small p ropo r t i on o f the sample w i t h food
stamps. As a r e s u l t , the impact o f the imputa t ion o f income and benef i t s on
the aggregate d i s t r i b u t i o n a l c h a r a c t e r i s t i c s o f the food stamp popu la t ion i s
very small. When aggregate s t a t i s t i c s are based on the food stamp u n i t r a the r
than t h e Census household, t he re i s a s h i f t i n the apparent economic s ta tus of
food stamp p a r t i c i p a n t s . Un i t s are somewhat poorer than households and there
a r e cons iderab ly fewer u n i t s i n the upper t a i l o f t he income d i s t r i b u t i o n than
the re are households w i t h food stamps. Examination o f income r e l a t i v e t o food
stamp g u i d e l i n e s f o r e l i g i b i l i t y shows t h a t some food stamp households and
some food stamp u n i t s do no t appear t o be e l i g i b l e f o r t he program. This
f i n d i n g i s no t unexpected. However, the p ropo r t i on o f the sample which does
n o t appear e l i g i b l e f o r the program drops by one ha1 f when the u n i t of
ana l ys i s i s changed from the Census household t o t he food stamp u n i t . I n t he
aggregate the imputa t ion of income o r food stamp b e n e f i t s does no t have a
dramatic e f f e c t on the p r o p o r t i o n o f households o r u n i t s which do no t appear
t o be e l i g i b l e fo r the program.
The i n i t i a l examinat ion of aggregate s t a t i s t i c s appears t o show minimal e f f e c t
of the impu ta t i on process on the d i s t r i b u t i o n a l c h a r a c t e r i s t i c s of food stamp
r e c i p i e n t s . However, as shown subsequently, t h i s minimal e f f e c t i s due more
t o the smal l p r o p o r t i o n o f t he sample a f f e c t e d than t o t he imputa t ion process
i t s e l f . Close examination o f the food stamp households and u n i t s w i t h imputed
income o r imputed b e n e f i t s shows t h a t the r e l a t i o n s h i p between the benef i ts
and the determinants o f b e n e f i t l e v e l s i s being d i s t o r t e d by the imputat ion o f
income and bene f i t s . The imputa t ion o f income t o food stamp u n i t s w i t h
repor ted b e n e f i t s r e s u l t s i n a d i s p r o p o r t i o n a t e l y h igh number o f u n i t s whose
income exceeds the 1 i m i t s s e t f o r program e l i g i b i l i t y and d i s t o r t s the
r e l a t i o n s h i p between u n i t income, s ize, and b e n e f i t l eve l s .
The impu ta t i on of food stamp b e n e f i t s preserves the o v e r a l l mean as expected.
However, the d i s t r i b u t i o n o f imputed b e n e f i t s by the determinants o f b e n e f i t
l e . 2 i s d i d n o t meet p r i o r expectat ions based on the b e n e f i t formula. The
v a r i a t i o n i n average benef i ts by the presence o f e l d e r l y o r d isab led members
fo r u n i t s w i t h imputed b e n e f i t s d i d no t d i f f e r d r a s t i c a l l y from the expected
v a r i a t i o n based on repor ted benef i ts . This was a t t r i b u t e d t o the use of a
c lose proxy f o r the presence o f e l d e r l y i n the imputa t ion o f benef i ts . A
l a r g e r d i f f e r e n c e was observed f o r the v a r i a t i o n i n average benef i ts by the
r e c e i p t o f earnings, suggest ing t h a t the work experience v a r i a b l e used i n the
imputa t ion process does no t adequately account f o r the impact o f earnings on
bene f i t l e v e l s . The most extreme case was the v a r i a t i o n i n average benef i ts
by pover ty - l e v e l . As noted, imputed average b e n e f i t s were approximately the
same as repo r ted average bene f i t s . However, the group t o whom benef i ts were
imputed had h igher incomes r e l a t i v e t o pover ty than the group w i t h repor ted
b e n e f i t s , suggest ing t h a t t h e i r bene f i t s should have a c t u a l l y been lower on
average. ThTs f i nd ing leads t o the recommendation t h a t a proxy f o r low income
s ta tus be used i n the imputa t ion o f food stamp bene f i t s .
I . ECONOMIC CHARACTERISTICS OF FOOD STAMP PARTICIPANTS
The U.S. Bureau of the Census (1985b) repor ted t h a t 8000 households w i t h
average monthly income i n excess o f $6000 rece ived food stamp b e n e f i t s i n the
t h i r d qua r te r of 1984. This i s a means-tested program and except f o r e l d e r l y
and d isab led households, u n i t s should no t be granted b e n e f i t s i f t h e i r income
exceeds 130 percent of the monthly federa l pover ty guide1 ines. Furthermore,
t h e monthly pover ty l e v e l for a household o f s i z e 4 i n t he t h i r d quar te r i s
$850. Given t h a t , how cou ld there have been households w i t h such h igh incomes
p a r t i c i p a t i n g i n the program? These r a t h e r sensat ional s t a t i s t i c s could
r e f l e c t t r u e circumstances i n ex is tence a t t h a t time. For example, pover ty
screens increase by u n i t s i ze and hence extremely l a r g e u n i t s can have h igh
incomes and s t i l l be e l i g i b l e . This i s p a r t i c u l a r l y t r u e fir l a r g e u n i t s
con ta in ing e l d e r l y o r d isab led members as these u n i t s are no t subjected t o the
gross income t e s t descr ibed e a r l i e r . Instead they are a l lowed t o deduct
c e r t a i n expenses and i f income l e s s deduc t ib le expenses does no t exceed 100
percent o f pover ty they are e l i g i b l e (assuming t h e i r assets do no t exceed
$3000).
A second p o t e n t i a l reason some food stamp households can have unusual ly h igh
incomes i s t h a t the Census household i s no t p r e c i s e l y the same as the food
stamp u n i t . Hence, the household's income i s no t a d i r e c t determinant of
program bene f i t s . F i n a l l y , i t i s poss ib le t h a t a household p a r t i c i p a t i n g i n
t he program - e a r l y i n the quar te r could have had a w i n d f a l l p r o f i t i n t he
l a t t e r p a r t o f t he quar te r and then d iscont inued p a r t i c i p a t i o n i n the program.
Given t h e sensa t i ona l na tu re o f t h i s s t a t i s t i c and t he f a c t t h a t ~ i t appears i n
an o f f i c i a l government publ i c a t i o n , we want t o know--is i t r e a l l y t r u e ? We
dec ided t o address t h i s issued by examining the same t a b l e f o r t h e month of
August u s i n g Wave 4 o f SIPP. August i s t he ca lendar month f o r which f u l l
panel es t imates a r e ob ta i nab le w i t h t h a t wave. It a l s o i s a month f o r which
admi n i s t r a t i ve survey da ta have been c o l 1 ec ted on program p a r t i c i pants and
hence can be used f o r comparison purposes. The d i scuss ion o f t he pub l i shed
s t a t i s t i c s f rom SIPP i s subd iv ided i n t o two par ts . The f i r s t examines house-
ho lds and u n i t s by income c l a s s and t he second examines households and u n i t s
by an approx imat ion o f program e l i g i b i 1 i t y s ta tus .
1. Households and U n i t s by Income Class
Table 1 shows the d i s t r i b u t i o n of households w i t h food stamp b e n e f i t s d i s t r i -
bu ted by income c l a s s f o r bo th t h i r d q u a r t e r 1984 ( f r om Table 9 o f t h e Census
publ i c a t i o n ) and f o r August ( f r om t a b u l a t i o n s o f t h e Wave 4 mic roda ta f i l e s ) .
O f no te i s t h a t t h e number o f households i n t h e h i g h e s t income category i n
August i s t w i c e t h e number publ i shed by the Census Bureau. I n a d d i t i o n t o
r e p l i c a t i n g t he d i s t r i b u t i o n o f weighted cases, we have added t o t h i s t a b l e
t h e number o f unweighted cases on which t he August s t a t i s t i c s a re based. We - - .-
conc lude f r o m t he c a l c u l a t i o n of average weights i n t he h i ghes t income c l ass
i n August t h a t t he publ i shed r e p o r t s on t he number o f food stamp households
w i t h income i n excess o f $6000 i s based on l e s s than 10 cases. l Furthermore,
he Census Bureau used one t h i r d o f the sample we igh ts f o r each monthly o b s e r v a t i o n t o c r e a t e average s t a t i s t i c s f o r the ca lendar quar ter . Assuming an average we igh t o f 4000 per household ( o r 1333 f o r one t h i r d of the household w e i g h t ) i n t he h i g h e s t income category, t he number of month ly o b s e r v a t i o n on which the Census s t a t i s t i c i s based i s 6.
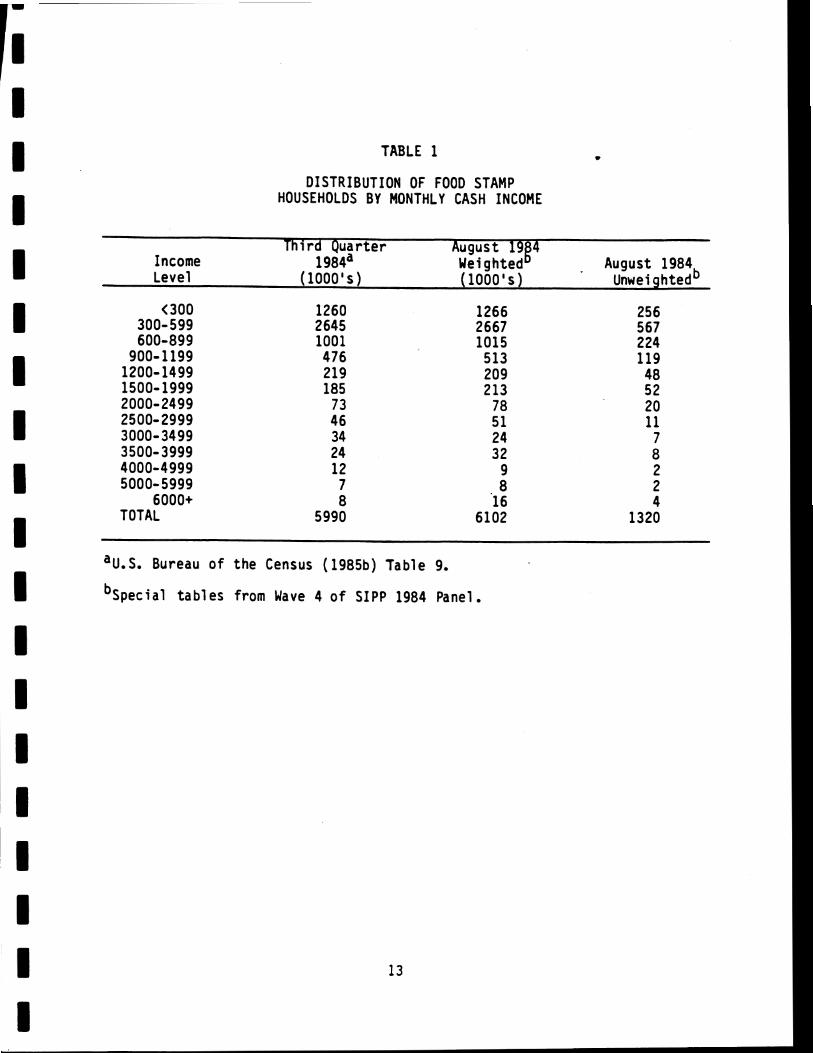
TABLE 1
DISTRIBUTION OF FOOD STAMP HOUSEHOLDS BY MONTHLY CASH INCOME
Th i rd Quar te r August 19 4 Income 1 984a Uei ghtedi . August 1984 Level (1000's) (1000's) Unwei ghtedb
< 300 300-599 600-899
900- 1199 1200-1499 1500-1999 2000-2499 2500-2999 3000-3499 3500-3999 4000-4999 5000- 5999
6000+ TOTAL
a ~ , S . Bureau of the Census (1985b) Table 9,
b ~ p e c i a l t ab les from Wave 4 o f SIPP 1984 Panel.
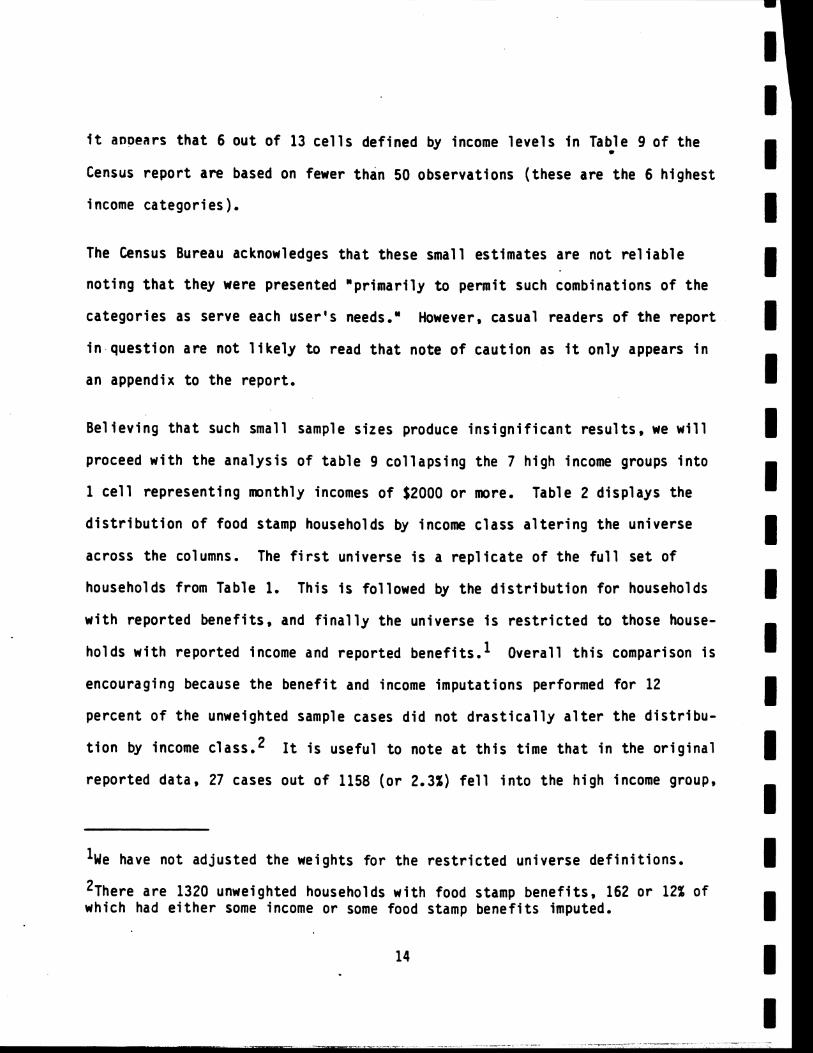
i t anpears t h a t 6 o u t o f 13 c e l l s def ined by income l e v e l s i n Table 9 of the
Census r e p o r t are based on fewer than 50 observat ions ( these are the 6 h ighest
income ca tegor ies ) . The Census Bureau acknowledges t h a t these small est imates are no t re1 i a b l e
n o t i n g t h a t they were presented " p r i m a r i l y t o permi t such combinations o f the
ca tegor ies as serve each user 's needs." However, casual readers o f the r e p o r t
i n ques t ion a re n o t 1 i kely t o read t h a t note o f cau t i on as i t on ly appears i n
an appendix t o the repor t .
B e l i e v i n g t h a t such small sample s izes produce i n s i g n i f i c a n t r e s u l t s , we w i l l
proceed w i t h the ana lys i s o f t a b l e 9 c o l l a p s i n g the 7 h igh income groups i n t o
1 c e l l represent ing monthly incomes o f $2000 o r more. Table 2 d i sp lays the
d i s t r i b u t i o n o f food stamp households by income c lass a1 t e r i n g the un iverse
across the columns. The f i r s t universe i s a r e p l i c a t e o f the f u l l se t of
households from Table 1. This i s fo l lowed by the d i s t r i b u t i o n f o r households
w i t h repor ted benef i ts , and f i n a l l y the universe i s r e s t r i c t e d t o those house-
holds w i t h repo r ted income and repor ted benef1ts. l Overal l t h i s comparison i s
encouraging because the b e n e f i t and income imputa t ions performed for 12
percent o f t he unweighted sample cases d i d no t d r a s t i c a l l y a l t e r t he d i s t r i b u -
t i o n by income c l a s ~ . ~ It i s usefu l t o note a t t h i s t ime t h a t i n the o r i g i n a l
repo r ted data, 27 cases out o f 1158 ( o r 2.3%) f e l l i n t o the h igh income group,
'we have not ad jus ted the weights f o r the r e s t r i c t e d universe d e f i n i t i o n s .
Z ~ h e r e are 1320 unweighted households w i t h food stamp benef i t s , 162 o r 12% of which had e i t h e r some income o r some food stamp b e n e f i t s imputed.
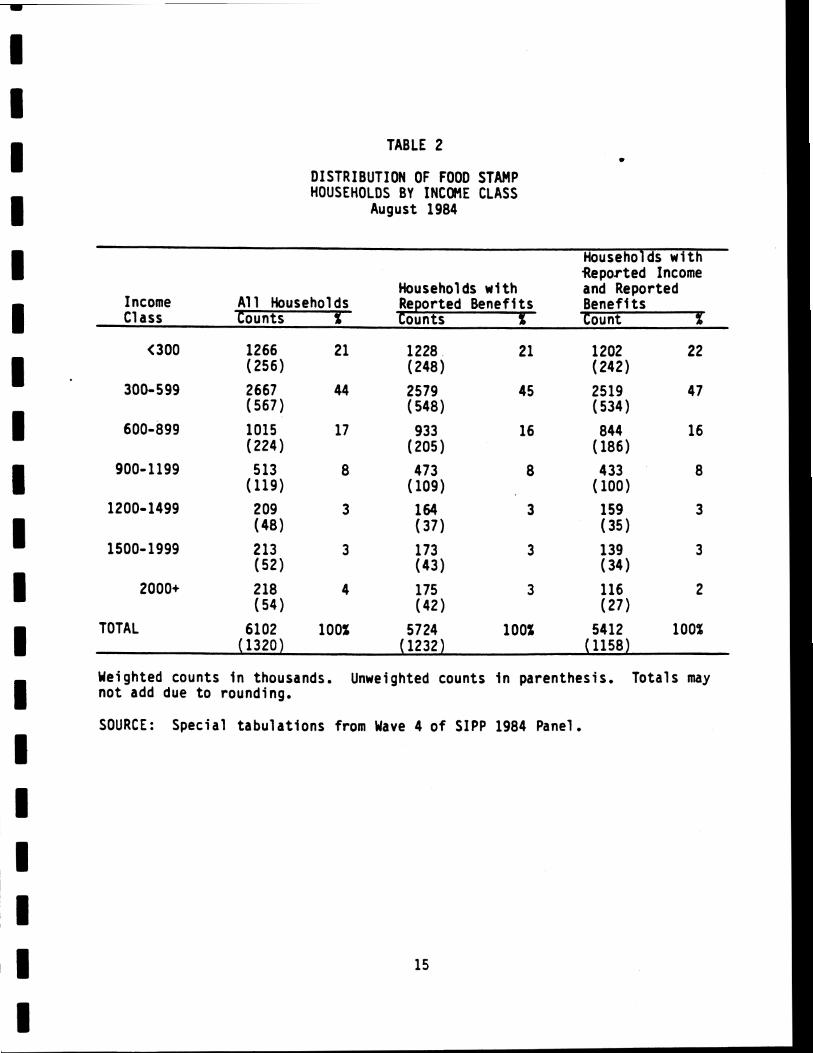
TABLE 2
DISTRIBUTION OF FOOD STAMP HOUSEHOLDS BY INCOME CLASS
August 1984
I Households w i t h Reported Income
Households w i t h and Reported
I Income A1 1 Households Reported Bene f i t s Benef i t s Class Counts % -Counts % Count %
Weighted counts i n thousands. Unweighted counts i n parenthesis. To ta ls may n o t add due t o rounding.
SOURCE: Specia l t a b u l a t i o n s from Wave 4 o f SIPP 1984 Panel.
o n l y onp of which f a l l s i n t o the category o f income i n excess o f $6000. On *
t h e o the r hand, a f t e r imputa t ion f o r nonresponse, 54 ou t o f 1320 o r (4.1%)
f e l l i n t o the h igh income group, 4 o f which now have income i n excess of $6000
i n the month o f August. This suggests t h a t t he imputa t ion process i s
producing too many out1 i e r s r e l a t i v e t o repor ted data, an issue which i s
addressed i n Chapter 111.
The est imates discussed so f a r are based on households and income. It i s
use fu l t o repeat t he tab les us ing the food stamp u n i t . This w i l l demonstrate
whether t he h igh income households are concentrated among those w i t h
noncovered persons who received a l a r g e p o r t i o n o f the household's income. 1
The issues surrounding the ex is tence o f these i n d i v i d u a l s are no t addressed
here.2 The concern i s whether t he p u b l i c a t i o n o f p a r t i c i p a n t s based on the
Census household d e f i n i t i o n i s misleading, e s p e c i a l l y f o r the e a s i l y i d e n t i -
f i e d program p a r t i c i p a n t s w i t h h igh incomes.
Table 3 shows the d i s t r i b u t i o n o f food stamp u n i t s by income c lass fo r the
th ree d i f f e r e n t un iverse d e f i n i t i o n s employed for Table 2 -- a l l un i t s , u n i t s
w i t h repor ted b e n e f i t s and u n i t s w i t h repor ted b e n e f i t s and repor ted income.
A food stamp u n i t f o r t h i s purpose i s the group o f household members covered
'AS noted i n the i n t r o d u c t i o n , the food stamp u n i t d e f i n i t i o n i s more r e s t r i c t i v e then the Census household d e f i n i t i o n . Therefore, households r e c e i v i n g food stamps can l e g i t i m a t e l y con ta in persons who are no t covered by the bene f i t .
Z ~ h e s e issues are addressed i n Landa (1987).
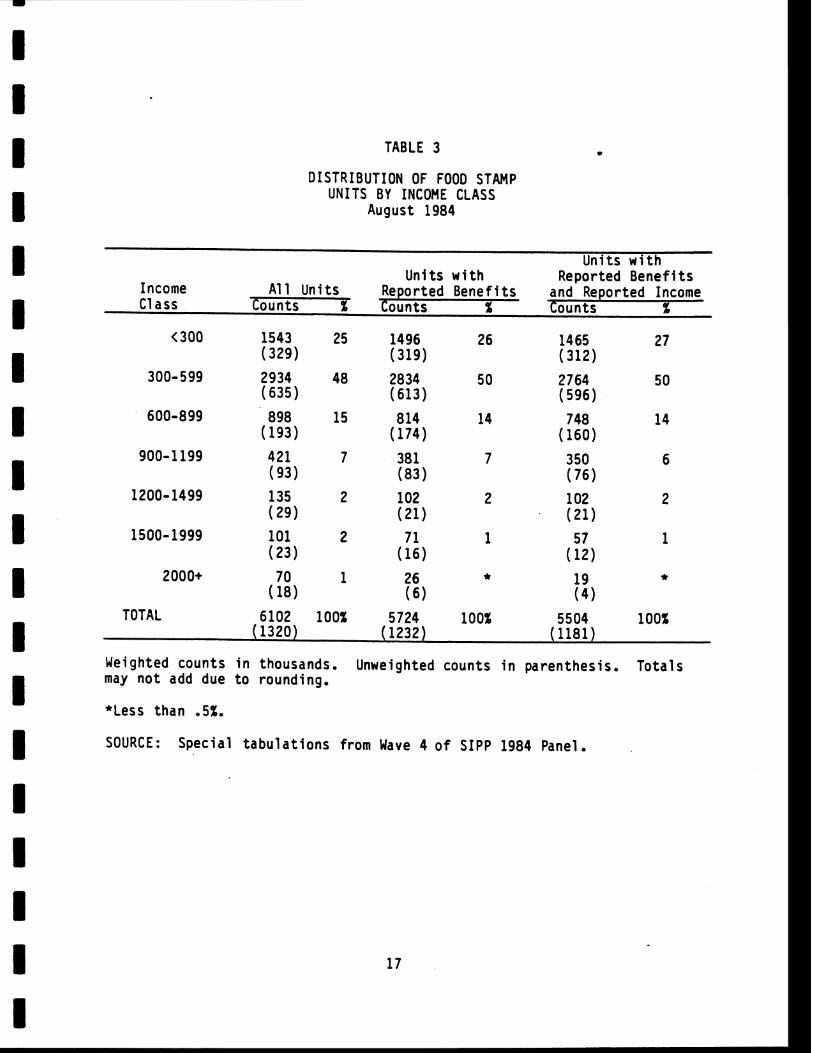
TABLE 3
DISTRIBUTION OF FOOD STAMP UNITS BY INCOME CLASS
August 1984
Un i ts w i t h Un i ts w i t h Reported B e n e f i t s
Income A l l Un i ts Reported Benef i t s and Reported Income Class Counts % Counts % Counts %
TOTAL 6102 100% 5724 100% 5504 100% ( 1320) ( 1232) (1181)
Weighted counts i n thousands. Unweighted counts i n parenthesis. To ta ls may no t add due t o rounding.
*Less than .5%.
SOURCE: Special t a b u l a t i o n s from Wave 4 o f SIPP 1984 Panel.
by food stampsO1 I n 84 percent of t h e cases, t h e food stamp u n i t i s i d e n t i c a l *
t o t h e household. For each o f t h e remaining u n i t s (16 percent) a t l e a s t one
household member i s not covered by t h e b e n e f i t o 2
Due t o t h e l a r g e p ropor t i on o f cases where t h e household and t h e food stamp
u n i t are t h e same, we do no t expect t o see l a r g e d i f f e rences between tab les 2
and 3 and i n f a c t we do not. Overal l , t h e imputa t ion process a f fec ts 10
percent of t h e u n i t s as compared t o 12 percent o f t h e households, i n d i c a t i n g
t h a t i n 2 percent o f t h e households, noncovered persons had some amount of
income imputed and they were t h e on ly persons w i t h income imputedO3 As was
t r u e f o r households i n Table 2, t h e imputa t ion o f b e n e f i t s o r income t o 10
percent of t h e unweighted sample o f food stamp u n i t s does not d r a s t i c a l l y
a l t e r t h e o v e r a l l d i s t r i b u t i o n by income class. O f p a r t i c u l a r i n t e r e s t ,
though, i s t h e p ropor t i on of cases i n t h e h ighest income category. I n Table
2, 4 percent of a l l households (54 cases unweighted) had incomes i n excess of
$2000. This p ropor t i on dec l ined t o 2 percent (27 cases unweighted) when
l l n households w i t h m u l t i p l e persons r e p o r t i n g food stamps, o n l y one u n i t was constructed. This u n i t cons is t s o f a l l persons i n t h e Census household who were covered under a t l e a s t one o f t h e r e c i p i e n t s ' benef i ts . See Chapter I V f o r f u r t h e r d iscuss ion o f mu1 t i p l e - u n i t households.
2 ~ h i s compares favorably t o t h e est imate o f 18 percent obta ined by Dal rymple and Carlson (1986) f o r September, 1983. Tabulat ions o f Wave 3 show t h a t 16 percent of Food Stamp households i n Apr i 1, 1984 con ta in a noncovered person.
3 ~ n o ther words, bo th Tables 2 and 3 have 1320 observat ions w i t h Food Stamps. I n Table 2 t h e r e are 162 households (1320 - 1158) w i t h e i t h e r benef i ts o r income imputed. However, i n Table 3 o n l y 139 food stamp u n i t s (1320 - 1181) have these imputat ions. Thus 23 ( o r 2 percent) o f t h e house- holds have an imputa t ion f o r some household member who i s no t p a r t of t h e Food Stamp u n i t .
imputed households were eliminated. I n Table 3, t he proport ion decl ined s t i l l 0
f u r t he r t o 1 percent (18 cases) by simply narrowing the u n i t o f observation t o
the food stamp un i t . F ina l l y , l ess than one h a l f o f one percent o f a1 1 food
Stamp u n i t s w l th reported income and reported bene f i t s had income i n excess of
$2000 ( 4 - cases unwei ghted) . Furthermore, none o f those 4 unwei ghted cases
f e l l i n t o the category of $6000 o r more i n monthly inc0me.l
The d i s t r i b u t i o n by income c lass s h i f t e d somewhat between Tables 2 and 3 w i t h
more u n i t s than households i n the lower classes (65 percent o f a1 1 households
had -incomes below $600 whereas 73 percent o f a1 1 u n i t s had t h i s l eve l of
income). This s h i f t i n the d i s t r i b u t i o n o f cases t o the lower income catego-
r i e s suggests t h a t t he food stamp u n i t ' s income i s less than the household's
income i n a t l eas t ha l f o f the households contain1 ng a noncovered
Table 4 demonstrates t h a t the food stamp u n i t income i s less than household
income i n most o f t he food stamp households w i t h a noncovered person.
Previously we reported t h a t s ix teen percent o f food stamp households have a t
l eas t one uncovered member, and Table 4 ind icates t h a t 15% o f food Stamp
households contain a noncovered member rece iv ing a t l eas t some of the house-
ho ld 's income. The upper h a l f o f the t a b l e shows how households w i t h i n each - - - . -
'TWO had incomes i n t h e 2000-2499 c lass and two had incomes i n the 3500-3999 class.
2 ~ o o d stamp u n i t income i s e i t h e r the same o r less than household income depending on whether noncovered persons have any income. The s h i f t i n income d i s t r i b u t i o n s suggests t ha t most noncovered persons do have income. The number o f u n i t s w i t h incomes less than $600 exceeds the number of households i n t h a t income category by 544 thousand, which represents 57 percent of the number of households w i t h a noncovered person o r 9% o f a l l food stamp househol ds .
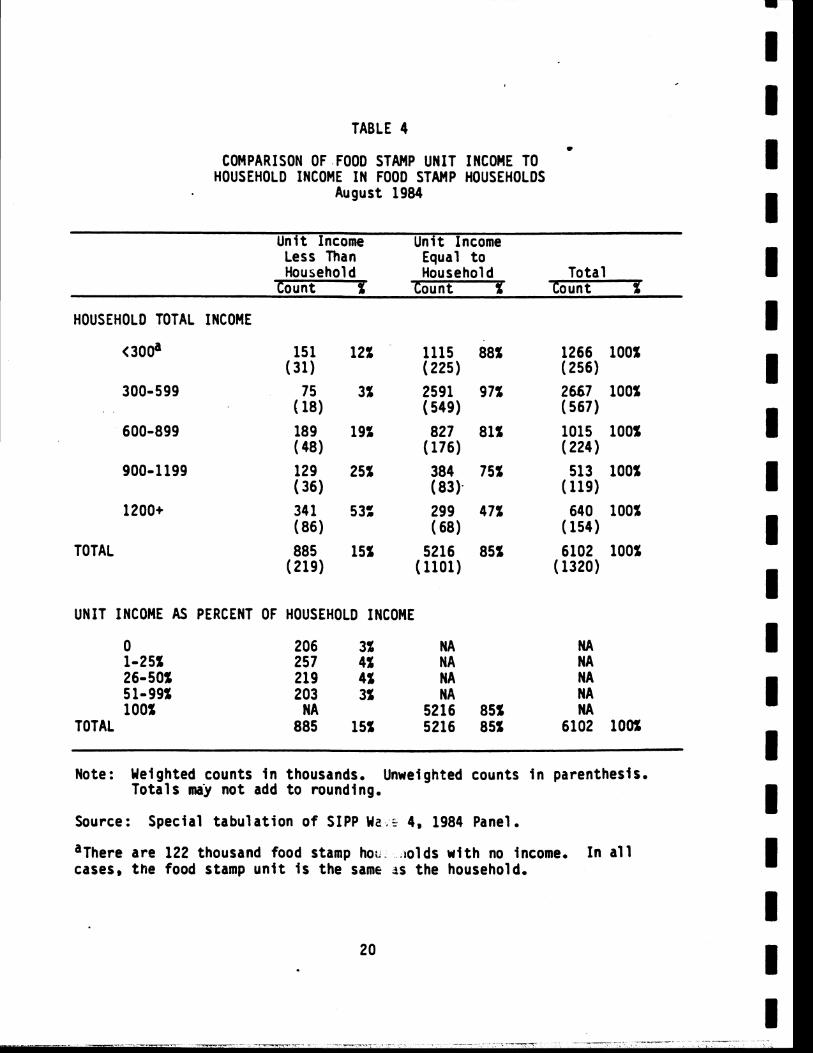
TABLE 4
COMPARISON OF FOOD STAMP UNIT INCOME TO HOUSEHOLD INCOME IN FOOD STAMP HOUSEHOLDS
August 1984
Uni t Income Uni t Income Less Than Eaual t o Household ~ouseho l d Total
Count 'X; Count % Count $
HOUSEHOLD TOTAL INCOME
TOTAL
UNIT INCOME AS PERCENT OF HOUSEHOLD INCOME
0 1925% 26950% 51-993 100%
TOTAL
Note: Weighted counts i n thousands. Unweighted counts i n parenthesis. Tota ls may not add t o rounding.
Source: Special t abu la t i on o f SIPP Wz.5 4, 1984 Panel.
a ~ h e r e are 122 thousand food stamp ho; . ~ o l d s w i t h no income. I n a l l cases, the food stamp u n i t i s the same t s the household.
income c l a s s a re d i s t r i b u t e d by whether o r n o t a noncovered person rece ives a t
l e a s t some o f t h e household's income. As expected, a h i ghe r percentage of t he
households w i t h h i g h incomes have uncovered members whose income i s excluded
from t h e food stamp u n i t than occurs i n poorer households.
The lower h a l f o f the t a b l e descr ibes how much o f t he household's income i s
be ing exc luded f rom t h e food stamp u n i t . I n rough ly t h r e e - f o u r t h s o f a l l
households w i t h a: noncovered person ( o r 11 percent o f a1 1 food stamp house-
ho lds ) , t h e food stamp u n i t income i s l e s s than h a l f o f t he household's income.
A l though t he comparison o f t a b l e s 2 and 3 do n o t y i e l d d r a s t i c a l l y d i f f e r e n t
r e s u l t s i n terms o f the d i s t r i b u t i o n o f t he food stamp popu la t i on by income
c l ass , Table 4 suggests t h a t p resen ta t i on o f the r e s u l t s on a household bas is
i s m i s l ead ing f o r t h e 16% o f t h e food stamp households w i t h an uncovered
person.
2. Households and Un i t s by E l i g i b i l i t y Status
The second case t o be examined i s one where the e l i g i b i l i t y dimension i s
in t roduced. Th i s w i l l he l p t o s o r t o u t apparent o u t l i e r s f rom those house-
ho lds w i t h h i gh incomes which might be e n t i t l e d t o b e n e f i t s due t o a l a r g e
s i z e o r t h e ~ p r e s e n c e - o f an e l d e r l y o r d i sab led i n d i v i d u a l . It w i l l a l s o
i d e n t i f y o u t l i e r s o f sma l l e r s i z e and l e s s pronounced income t h a t a re n o t as
n o t i c e a b l e i n t he aggregate d i s t r i b u t i o n s . For purposes o f t h i s d i scuss ion a
f u l l d e f i n i t i o n o f e l i g i b i l i t y has no t been employed. I ns tead we a re examin-
i n g income e-l i g i b i l i t y which can be measured w i t h i n f o r m a t i o n ob ta i nab le from
t h e core oues t ionna i re and the re fo re a v a i l a b l e f o r use i n t he imputa t ion of
food stamp b e n e f i t s on the c ross-sec t ion f i l e s . 1
Before d iscuss ing the ana l ys i s o f the d i s t r i b u t i o n o f cases by income e l i g i -
b i l i t y s t a t u s i t i s useful t o no te an impor tan t observa t ion common among
surveys of t he populat ion. There are cases where b e n e f i t s are repor ted ( o r
imputed) which are no t cons i s ten t w i t h observed ( o r imputed) income. Of
p a r t i c u l a r concekn i s the ex is tence o f so-ca l led seemingly i n e l i g i b l e p a r t i c i -
pants. These are u n i t s which would be s imulated t o be i n e l i g i b l e f o r the Food
Stamp Program i f a model o f t he program e l i g i b i l i t y de termina t ion process was
executed on the microdata f i l e s . Czajka (1981) and Doyle, e t a1 ., (1986)
r e p o r t on t h e i r ex is tence i n SIPP, speculate about the reasons f o r t h e i r
ex is tence and no te the problems they present i n t h e ana l ys i s o f p a r t i c i p a n t
c h a r a c t e r i s t i c s and the popu la t ion t o which the Food Stamp Program i s
targeted.
The ex is tence of seemingly i n e l i g i b l e p a r t i c i p a n t s i s no t j u s t a phenomenon
assoc ia ted w i t h general-purpose household surveys. Samples o f a d m i n i s t r a t i v e
records of the Food Stamp Program a l so reveal a smal l number of such cases
' un i t s w i t h no e l d e r l y o r d isab led members are income-el i g i b l e if gross income i s l e s s than 130 percent o f monthly pover ty ( t h i s i s a requirement i n the FSP r e g u l a t i o n s ) . U n i t s w i t h e l d e r l y o r d isab led members are c l a s s i f i e d as i ncome-e l i g i b le f o r purposes o f t h i s study i f gross income i s l e s s than 185 percent of poverty. ( I n the FSP r e g u l a t i o n s these u n i t s are no t subjected t o a gross income tes t . However, accord ing t o a d m i n i s t r a t i v e data d isp layed i n Appendix B, -most e l d e r l y and d isab led u n i t s have gross income under 185% of pover ty ) . Gross income i s s i m i l a r t o household t o t a l income. The d i f fe rence i s t h a t earn ings of students under 18 are excluded and ne t earnings r a t h e r than draw i s used f o r s e l f-employed persons.
( 1 ess than one ha1 f o f one percent as d isp layed i n Appendix 8). - These cases
may represent e i t h e r e r r o r s i n data c o l l e c t i o n ( t h e contents o f the adminis-
t r a t i v e records are manually ex t rac ted from the case f i l e s ) o r e r r o r s i n
de termin ing b e n e f i t s f o r u n i t s app ly ing f o r benef i ts .
I n the contex t of a general-purpose household survey l i k e SIPP, seemingly
i n e l i g i b l e p a r t i c i p a n t s may represent t r u e s i t u a t i o n s , e.g., they could be
conceal ing some income from the food stamp case worker i n the a p p l i c a t i o n fo r
benef i t s bu t r e p o r t i n g t r u e income t o t he SIPP in te rv iewer , o r they may be
some o f the small number o f cases which were i n c o r r e c t l y processed i n the Food
Stamp Program. However, they cou ld a l so be the r e s u l t of some form of
nonsampling e r ro r . Given t h a t the t r u e cause o f the ex is tence o f seemingly
i n e l i g i b l e p a r t i c i p a n t s i s no t a c t u a l l y known and t h a t one p o t e n t i a l fac to r i s
some form of nonsampling e r r o r , i t does no t seem reasonable t o a l l ow the
impu ta t i on process t o increase the r e l a t i v e occurrence o f t h i s phenomenon. We
do expect t o see an increase i n the absolute number o f seemingly i n e l i g i b l e
p a r t i c i p a n t s g iven (as we w i l l show) t h a t some u n i t s are repor ted as such.
However, i n t he absence o f evidence t o suggest t h a t nonresponse i s markedly
g rea te r among such u n i t s , we do no t expect the impu ta t i on process t o c rea te a
d i s p r o p o r t i o n a t e l y h igher number of seemingly i n e l i g i b l e u n i t s than seemingly
e l i g i b l e un i t s .
l ~ h e survey o f admi n i s t r a t i ve case records was ex t rac ted from the In tegra ted Qua1 i t y Contro l System (IQCS) and represents a sample o f approximately 7000 cases p a r t i c i p a t i n g i n the Food Stamp Program i n August 1984. The IQCS i s descr ibed i n Dalrymple and Car l son (1986).
Tables 5 and 6 d i s p l a y the r e s u l t s of Tables 2 and 3 w i t h the added dimension
of income e l i g i b i l i t y . As noted, SIPP data do con ta in observat ions which
appear t o be i n e l i g i b l e f o r the program based on income. The p ropo r t i on of
households which appear i n e l i g i b l e f o r the program i s a f f e c t e d somewhat by the
impu ta t i on o f income and bene f i t s . Seven percent o f the households w i t h
repo r ted income and b e n e f i t s appear i n e l i g i b l e f o r the program whereas n ine
percent o f a1 1 food stamp househol ds appear i n e l i g i b l e.
It i s i n t e r e s t i n g t o note t h a t when food stamp u n i t s are examinehthere i s a
drop i n the p r o p o r t i o n o f seemingly i n e l i g i b l e p a r t i c i p a n t s by about one
h a l f . The impu ta t i on o f income and/or b e n e f i t s a f f e c t s t h i s number t o some
e x t e n t but no t d r a s t i c a l l y . It i s a l so i n t e r e s t i n g t h a t seemingly i n e l i g i b l e
households and u n i t s a re n o t concentrated i n t he h i g h income categor ies.
Almost h a l f o f t he i n e l i g i b l e u n i t s have income under $1200 and roughly one
f o u r t h o f t h e i n e l i g i b l e househol ds have income under $1200. S i m i l a r l y , there . are some income-e l i g i b le households ( 3 percent) and u n i t s (2 percent ) w i t h
monthly incomes i n excess o r $1200. I n o the r words, the ana l ys i s of t he
d i s t r i b u t i o n s o f households and u n i t s by income c lass presented e a r l i e r d i d
n o t a c c u r a t e l y reveal t he e x t e n t t o which o u t l i e r s e x i s t i n t he SIPP data.
Spec i f i ca lFy , - there a re small u n i t s w i t h low incomes who do no t appear
e l i g i b l e because t h e i r incomes exceed the a1 lowable 1 i m i t s f o r t h e i r s izes.
S i m i l a r l y , t he re are l a r g e u n i t s w i t h h igh incomes who appear t o be
p o t e n t i a l l y e l i g i b l e because t h e i r incomes do f a l l w i t h i n the a l lowab le 1 i m i t s
f o r t h e i r s izes.
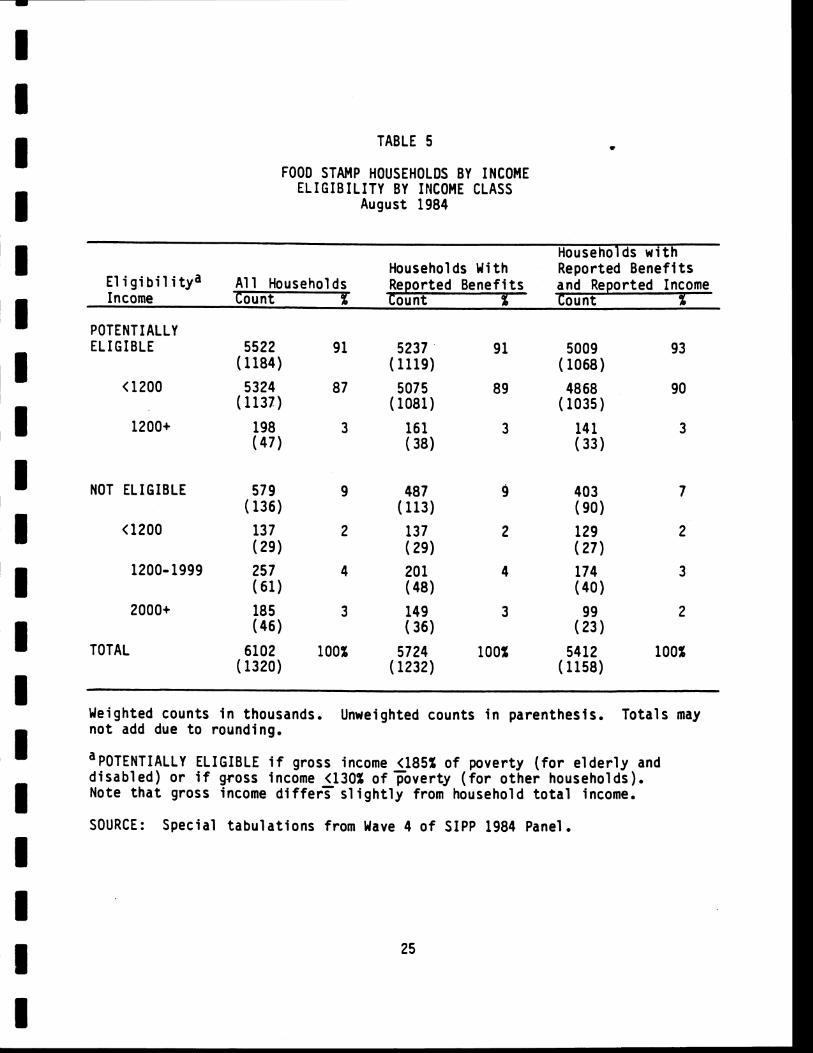
TABLE 5
FOOD STAMP HOUSEHOLDS BY INCOME ELIGIBILITY BY INCOME CLASS
August 1984
Households w i t h Households Wi th Reported B e n e f i t s
E l i g i b i l i t y a A1 1 Households Reported Bene f i t s and Reported Income Income Count X; Tount % Count %
POTENTIALLY ELIGIBLE 5522 9 1 5237 9 1 5009 9 3
(1184) (1119) ( 1068)
NOT ELIGIBLE 579 (136)
TOTAL
Weighted counts i n thousands. Unwei ghted counts i n parenthesis. To ta l s may n o t add due t o rounding.
a~~~~~~~~~~~ ELIGIBLE i f gross income <185% o f pover ty ( f o r e l d e r l y and d i sab led ) o r if gross income <130% o f p o v e r t y ( f o r o the r households). Note t h a t gross income d i f f e r s s l i g h t l y from household t o t a l income.
SOURCE: Special t a b u l a t i o n s from Wave 4 o f SIPP 1984 Panel.
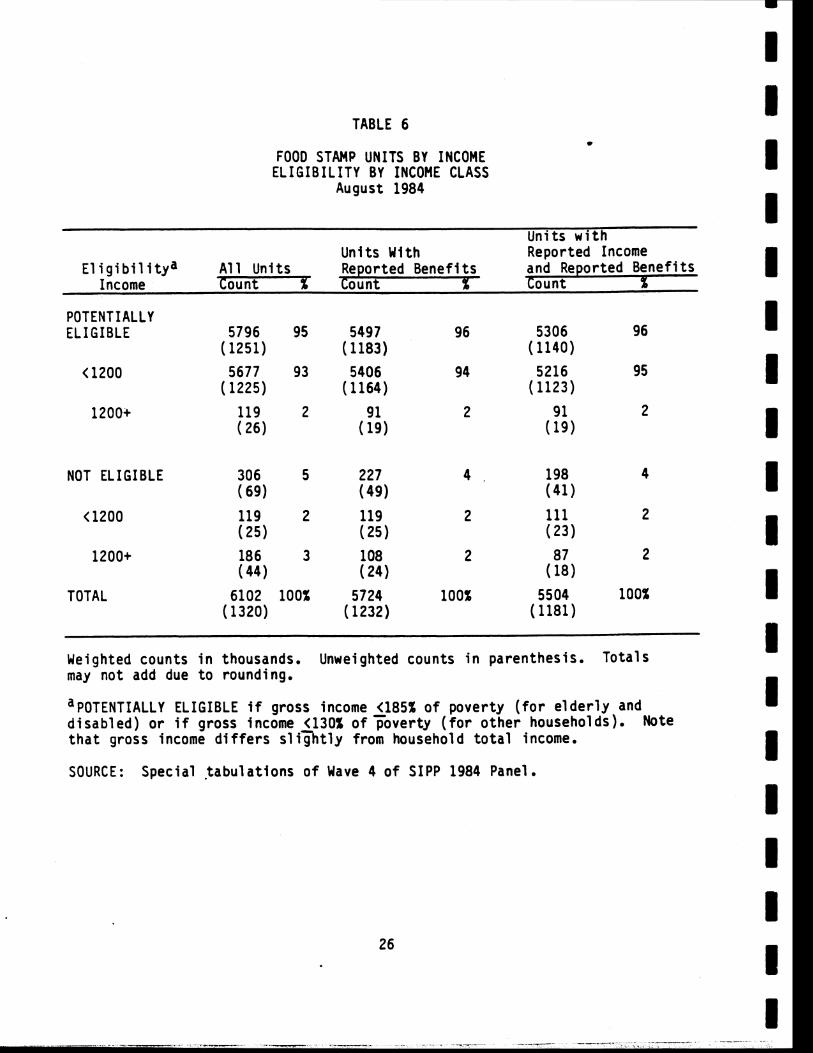
TABLE 6
FOOD STAMP UNITS BY INCOME ELIGIBILITY BY INCOME CLASS
August 1984
Uni ts w i t h Un i ts With Reported Income
E l i g i b i l i t y a A l l Un i ts Reported Bene f i t s and Reported Benefi ts Income Count % Count % Count %
POTENTIALLY ELIGIBLE
NOT ELIGIBLE
TOTAL
Weighted counts i n thousands. Unweighted counts i n parenthesis. To ta ls may not add due t o rounding.
a~~~~~~~~~~~ ELIGIBLE i f gross income <185% of pover ty ( f o r e l d e r l y and d i sab led ) o r i f gross income (130% o f p o v e r t y ( f o r o the r households). Note t h a t gross income d i f f e r s s l i 3 t l y from household t o t a l income.
SOURCE: Special t a b u l a t i o n s o f Wave 4 o f SIPP 1984 Panel.
E a r l i e r we noted t h a t one household was repor ted t o have income i n excess of
$6000 and t o p a r t i c i p a t e i n the Food Stamp Program. Furthermore, the imputa-
I t i o n of income and/or b e n e f i t s added th ree a d d i t i o n a l households t o t h i s
category. A l l o f these households are seemingly i n e l i g i b l e ( a f t e r account ing
1 f o r i nco ie , s i z e and presence o f e l d e r l y o r d isab led members) hence e l im ina t -
i n g the possi b i l i t y t h a t they represent unusual ly l a r g e households. There
I are, however, some households w i t h unusual ly h igh monthly incomes ( i n the
I range $2000 t o $4999) t h a t appear t o be e l i g i b l e f o r the program based on
i ncome .
111. EFFECTS OF IMPUTATION ON OUTLIERS AND AVERAGE BENEFITS *
I n Chapter I 1 we 'a l l uded t o the p o s s i b i l i t y t h a t t he methods used t o impute
income and food stamp b e n e f i t s produce too many out1 i e r s i n the data as a
r e s u l t o f t he omission o f income l e v e l s i n t he imputa t ion of food stamp
bene f i t s and the omission o f r e c e i p t o f food stamps i n the imputa t ion of
income. These omissions a l so l e d t o some concern over the consis tency between
income and benef i ts . Whi le i t might be reasonable t o see a s h i f t i n the
d i s t r i b u t i o n o f the food stamp popu la t ion by income c lass when responses are
imputed ( r e f l e c t i n g an assumption t h a t nonrespondents are somehow d i f f e r e n t
than respondents), we do no t f e e l i t i s reasonable t, see a change i n average
b e n e f i t s f o r a s p e c i f i c pover ty l e v e l , e l d e r l y l d i s a b l e d , and earner c l a s s i -
f i c a t i o n when nonresponses are imputed. This i s because benef i t s are an
exp l i c i t f u n c t i o n o f these c h a r a c t e r i s t i c s .
A. THE IMPUTATION PROCESS
Many users o f SIPP have su f fe red from the l a c k o f a v a i l a b i l i t y of adequate
documentation on the procedures employed i n the produc t ion o f the SIPP micro-
da ta f i l e s . As a r e s u l t o f t h i s l a c k o f documentation, t h i s summary of the
impu ta t i on -process i f 1 ess than compl e te bu t represents our bes t understanding
o f the impu ta t i on process.
When an i n d i v i d u a l has i n d i c a t e d t h a t a p a r t i c u l a r means-tested t rans fe r
b e n e f i t has .been received, the Census Bureau i n i t i a t e s an e d i t t o f i l l i n any
miss ing responses on the u n i t composit ion va r i ab les and a ho t deck procedure
t o impute b e n e f i t s when they are no t r e p o r t e d e l The ho t deck i s a procedure w
whereby an i n d i v i d u a l w i t h c h a r a c t e r i s t i c s s i m i l a r t o the nonrespondent i s
l oca ted and then t h a t i n d i v i d u a l ' s repor ted b e n e f i t s are assigned t o the
nonrespondent. I n the case o f food stamps and o the r means-tested t rans fers
t h e c h a r a c t e r i s t i c s used t o de f i ne " s i m i l a r " , are as fo l l ows :
Sex Race Age Number of persons covered Work experience o f t he r e c i p i e n t .
Besides the omission o f income al ready mentioned i t i s use fu l t o exp la in t h a t
t h e age break i s a t 65. This i s i n c o n s i s t e n t w i t h t he key age break i n t he
Food Stamp Program which i s 60. As noted, a t ta inment o f age 60 o f any member
of t he u n i t e n t i t l e s the u n i t t o be subjected t o more l i b e r a l e l i g i b i l i t y
tes ts . Work experience o f the r e c i p i e n t i s r e l a t e d t o bu t no t q u i t e the same
as one of t he key determinants of b e n e f i t l e v e l s which i s the l e v e l of t he
u n i t ' s earnings.
When an i n d i v i d u a l i nd i ca tes r e c e i p t o f o the r income types but does not r e p o r t
t he amount received, the Census Bureau employs a s i m i l a r procedure t o impute
the missing~irrcame. The dimensions of the ho t deck a r ray vary somewhat from
one income type t o the other . For example, the f o l l o w i n g va r i ab les are used
i n the imputa t ion o f wages and s a l a r i e s :
l ~ h i s ho t deck technique i s s i m i l a r t o t h a t employed f o r the Annual Demographic Supplement t o the Current Populat ion Survey which i s descr ibed i n We1 n i a k and Coder (1980).
Occupation Sex Age Race Educat ional a t ta inment .
The Census Bureau a l s o employs imputa t ion techniques when an i n d i v i d u a l w i t h i n
an o therw ise success fu l l y in te rv iewed u n i t e i t h e r cannot o r refuses t o respond
t o the e n t i r e quest ionnaire.1 I n t h i s case a s t a t i s t i c a l match i s performed
and the responses o f the l i n k e d respondent are imputed t o t he non in te rv iew
person. This i s performed before the e d i t and impu ta t i on f o r i t em nonresponse
The v a r i a b l e s used t o 1 i n k nonrespondents t o respondents i n t he match vary
depending on whether o r no t t he nonrespondent has p r i o r wave data and the
number o f donor records i n each c e l l de f ined by the . i n t e r a c t i o n of the mat-
va r i ab les . The minimum amount of i n fo rma t i on used i n each match i s age, sex,
m a r i t a l s t a t u s and designated parent o r guardian. Nonrespondents and respon-
dents w i t h o u t p r i o r wave data can a l so be matched on the f o l l o w i n g :
Educat ion Household r e l a t i o n s h i p Veteran s t a t u s
p rov ided s u f f i c i e n t -. - m t c h a b l e donors e x i s t . Nonrespondents and donors w i t h - p r i o r wave data can be matched on those c h a r a c t e r i s t i c s p lus the fo l l ow ing
de r i ved from p r i o r waves :
Income sources Asset sources.
' ~ h i s statement does no t apply t o Wave 1 o f the 1984 panel.
0 . EFFECTS OF THE IMPUTATION PROCESS ON APPARENT OUTLIERS
Due t o t he smal l p o r t i o n o f the sample which i s a f f e c t e d by the impu ta t i on
process i t i s d i f f i c u l t t o de tec t from the ana l ys i s i n Chapter I 1 whether the
impu ta t i on process has an e f f e c t on the ou t1 i e r s . Therefore, t h i s sec t i on
examines the d i s t r i b u t i o n of imputed cases along two dimensions t o d iscern
what t he e f f e c t s are. The f i r s t dimension i s pover ty s t a t u s and the second
dimension i s income- e l i g i b i l i t y s tatus. These are no t p r e c i s e l y the same
concepts s ince the e l i g i b i l i t y de termina t ion takes i n t o account the presence
of e l d e r l y o r d i sab led members which has a s i g n i f i c a n t e f f e c t on b e n e f i t
1 eve1 s.
Table 7 shows the d i s t r i b u t i o n o f a l l households w i t h repo r ted income by
pover ty l e v e l (column l ) , as w e l l as the d i s t r i b u t i o n s f o r food stamp house-
ho lds w i t h repor ted b e n e f i t s where those households w i t h f u l l y repor ted income
(column 2) a re separated from those households t h a t have had some income
imputed by the Census Bureau (column 3). This t a b l e demonstrates t h a t imputed
income f o r food stamp households (column 3) i s more concentrated i n t he low
percentage end o f t he pover ty l e v e l scale then the d i s t r i b u t i o n fo r a l l house-
ho lds (column 1). This i s d e s i r a b l e f o r households p a r t i c i p a t i n g i n a means-
t e s t e d t r a n s f e r program. It appears t h a t the va r i ab les used i n the imputa t ion
process have c o n t r o l l e d the process somewhat f o r a sens ib le assignment of
income t o food stamp households.
However, imputed income f o r food stamp households i s no t as concentrated i n
t h e low percentage end o f the pover ty l e v e l sca le as food stamp households
w i t h repo r ted income. The number of food stamp households repor ted t o have
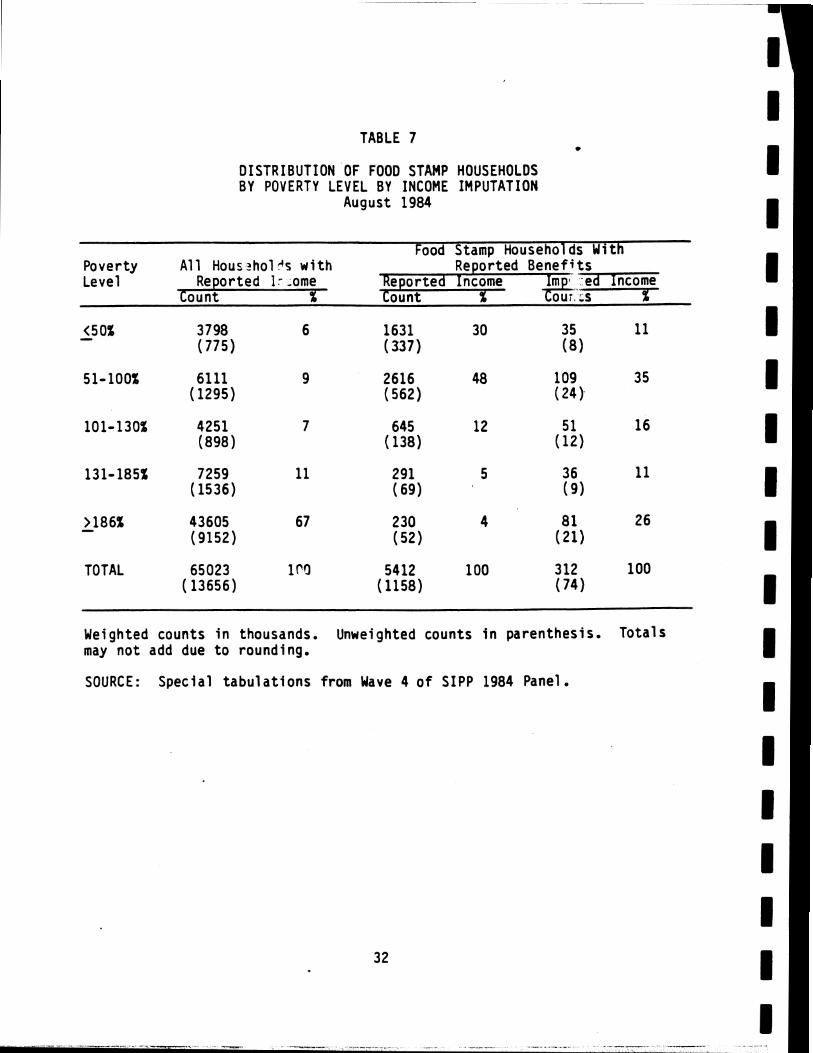
TABLE 7
DISTRIBUTION OF FOOD STAMP HOUSEHOLDS BY POVERTY LEVEL BY INCOME IMPUTATION
August 1984
Food Stamp Households With Poverty A l l H o u s ~ h o l ~ s w i t h Reported Bene f i t s Level Reported I - -ome Reported Income
% % 2 -: d Income Count Count %
TOTAL 65023 1 f'rJ 5412 100 312 100 ( 13656) (1158) (74)
Weighted counts i n thousands. Unweighted counts i n parenthesis. To ta l s may n o t add due t o rounding.
SOURCE: Special t a b u l a t i o n s from Wave 4 o f SIPP 1984 Panel.
income i n excess of 130 percent o f poverty i s 9 percent o f the number of
households w i t h repor ted income and benef i ts , almost h a l f o f which have income
i n excess o f 185 percent o f poverty. On the o ther hand, among households w i t h
repo r ted benef i ts and imputed income the p ropo r t i on i n the two h ighes t poverty
classes increases t o more than one t h i r d o f the t o t a l . Most o f these have
income i n excess of 185 percent o f poverty. The c u t o f f a t 185 percent of
pover ty i s important because a d m i n i s t r a t i v e sources show t h a t very few
e l d e r l y / d i s a b l ed households exceed t h i s 1 i m i t (none1 derly/nondisabled u n i t s
a re no t al lowed t o p a r t i c i p a t e i f gross income exceeds 130 percent o f
pover ty) . l
Another way o f l ook ing a t the impact o f the imputat ion process on o u t l i e r s i s
t o examine the d i s t r i b u t i o n by e l i g i b i l i t y s ta tus as d isp layed i n Table 8.
Only 7 percent o f households w i t h repor ted bene f i t s and repor ted income appear
t o be i nel i g i b l e f o r the program whereas 27 percent o f households w i t h repor ted
b e n e f i t s and imputed income appear i n e l i g i b l e. Hence, the imputat ion o f
income f o r food stamp households w i t h repor ted bene f i t s does d ispropor t ionate-
l y increase the s i ze o f the seemingly i n e l i g i b l e populat ion. 2
'special Tabulat ions o f the August 1984 e x t r a c t from the I Q C S (reproduced i n Appendix B) show l e s s than one h a l f of one percent of food stamp u n i t s w i t h e l d e r l y o r d isab led members have gross income i n excess of 185% o f poverty.
d i d no t disaggregate the households by degree of imputat ion due t o small sample sizes. As noted i n Table 8, i n two- th i rds of the households w i t h repor ted b e n e f i t s and imputed income, the amount o f imputed income exceeds 25% o f t o t a l household income.
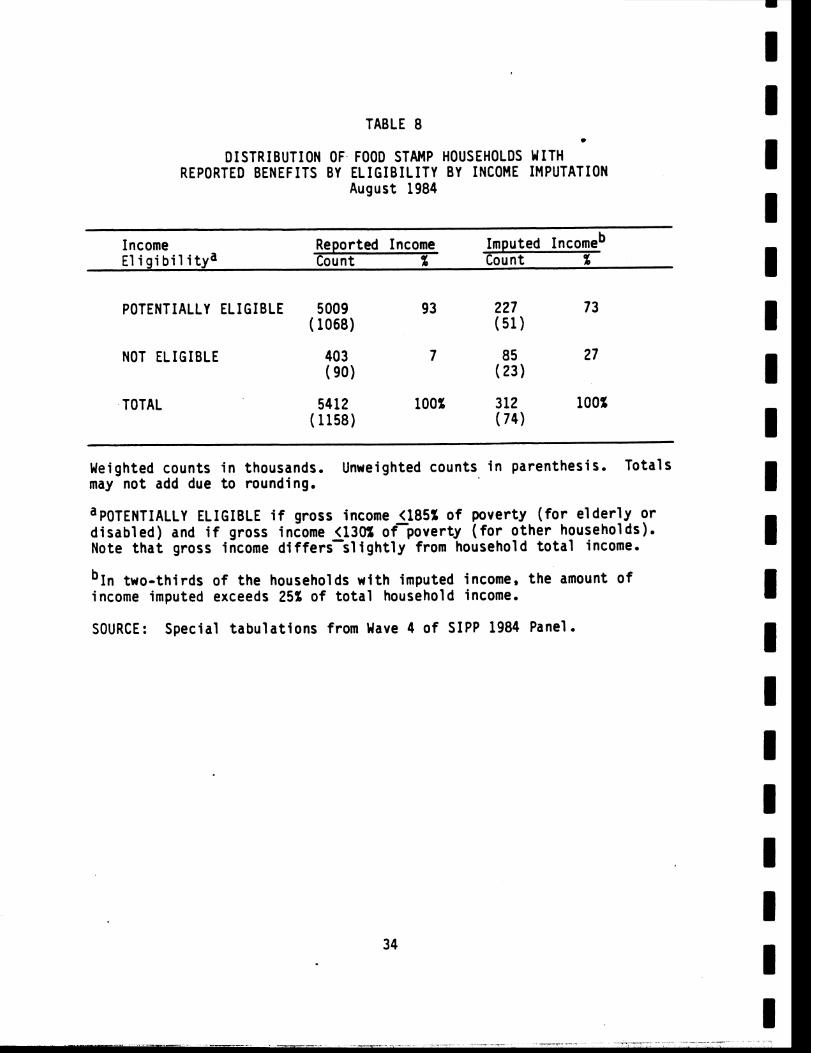
TABLE 8
DISTRIBUTION OF FOOD STAMP HOUSEHOLDS WITH REPORTED BENEFITS BY ELIGIBILITY BY INCOME IMPUTATION
August 1984
Income Reported Income Imputed 1ncomeb ~ l i g i b i l i t y ~ Count % Count %
POTENTIALLY ELIGIBLE 5009 9 3 227 73 ( 1068) (51)
NOT ELIGIBLE
TOTAL
Weighted counts i n thousands. Unweighted counts i n parenthesis. To ta ls may no t add due t o rounding.
a~~~~~~~~~~~ ELIGIBLE if gross income <I852 o f pover ty ( f o r e l d e r l y o r d i sab led ) and i f gross income < 1 3 N of-poverty ( f o r o the r households). Note t h a t gross income differs-sl i g h t l y from household t o t a l income.
b ~ n two- th i rds o f the households w i t h imputed income, the amount of income imputed exceeds 25% o f t o t a l household income.
SOURCE: Special t a b u l a t i o n s from Wave 4 o f S I P P 1984 Panel.
We con jec ture t h a t t h i s d i sp ropo r t i ona te e f fec t on seemingly i n e l i g i b l e house-
holds can be avoided i n the imputat ion of income t o households w i t h repor ted
food stamp b e n e f i t s w i thout changing the basic method o f imputat ion c u r r e n t l y
employed by the Census Bureau. A f a i r l y simple approach would be t o add the
use o f repo r ted r e c e i p t o f food stamp bene f i t s (o r some o ther i n d i c a t o r of low
income s ta tus such as r e c e i p t o f any means-tested t r a n s f e r b e n e f i t ) t o the
c h a r a c t e r i s t i c s a l ready i n use f o r the imputat ion o f income amounts when they
a re no t reported.
C. AVERAGE BENEFITS
B e n e f i t l e v e l s under the Food Stamp Program are ca l cu la ted as an expl i c i t
f u n c t i o n o f se lec ted u n i t c h a r a c t e r i s t i c s , many o f which are measured i n t he
S I P P core quest ionnai re. Speci f i c a l l y , gross income i s f i r s t computed for the
u n i t (gross income i s approximately equal t o t o t a l income measured by SIPP).
From t h i s t o t a l , u n i t s are al lowed t o deduct 20 percent o f earnings along w i t h
allowances f o r c h i l d care and s h e l t e r expenses up t o a l i m i t . Un i ts conta in-
i n g an e l d e r l y o r d isabled member are al lowed an a d d i t i o n a l deduct ion for
medical expenses i n excess o f a th resho ld and are n o t subjected t o a cap on
the deduct ib le she1 t e r expenses. Gross income l e s s the deductions noted i s - - -
r e f e r r e d to -as ne t income. Benef i ts are computed as the d i f f e r e n c e between
the T h r i f t y Food Plan and 30 percent o f net income. The T h r i f t y Food Plan
takes i n t o account the need f o r increased food allowances as the s i ze of the
u n i t increases.
As a r e s u l t of t h i s formula, b e n e f i t l e v e l s vary s i g n i f i c a n t l y according t o
the l e v e l of earnings, the presence o f e l d e r l y o r d isab led members, income of
t h e u n i t and the u n i t ' s size.' This leads t o the expec ta t ion t h a t bene f i t s *
de r i ved from S I P P would vary i n a p r e d i c t a b l e p a t t e r n a long these dimensions. I I n p a r t i c u l a r , when income and composit ion are repo r ted bu t food stamp
b e n e f i t s are not , the l e v e l o f imputed b e n e f i t s i s expected t o vary i n a I
manner cons i s ten t w i t h repor ted b e n e f i t s a long the dimensions noted above.
S i m i l a r l y , i f b e n e f i t s a re repo r ted bu t some o r a l l o f t he income i s missing,
I t h e l e v e l o f imputed income should no t d i s t o r t the known r e l a t i o n s h i p s between I income and b e n e f i t s g iven a s p e c i f i c u n i t s i z e and composi t ion and presence of
e a r n i ngs . I 1. Re1 a t i o n s h i p Between Income and Bene f i t s I Table 9 d i sp lays average b e n e f i t s f o r food stamp u n i t s c l a s s i f i e d accord ing t o I t h e type of impu ta t i on performed and con t ras t s those b e n e f i t s w i t h average
bene f i t s de r i ved from a survey of a d m i n i s t r a t i v e records f o r a comparable t ime
per iod. The comparison t o a d m i n i s t r a t i v e data prov ides a p o i n t o f reference
I i n e v a l u a t i n g the reasonableness of the o r i g i n a l r epo r ted data aga ins t which I t h e imputed data are compared. The a d m i n i s t r a t i v e data can a l s o serve as a
guide i n our suppos i t i on about the unknown c h a r a c t e r i s t i c s o f the nonrespon- I
dents. O f course, any assumptions about t h e i r c h a r a c t e r i s t i c s are necessar i l y I weak s ince -€here are a number of fac to rs which can c o n t r i b u t e t o a discrepancy
between household survey data such as t h a t der ived from SIPP and adminis t ra- I t i v e survey data. Nonresponse i s on l y one o f those factors. I 'other f a c t o r s such as expenses e f f e c t b e n e f i t l e v e l s as w e l l , bu t these are n o t measured i n the core p a r t of the survey and hence are n o t candidates fo r
I use i n the impu ta t i on o f benef i t s . I
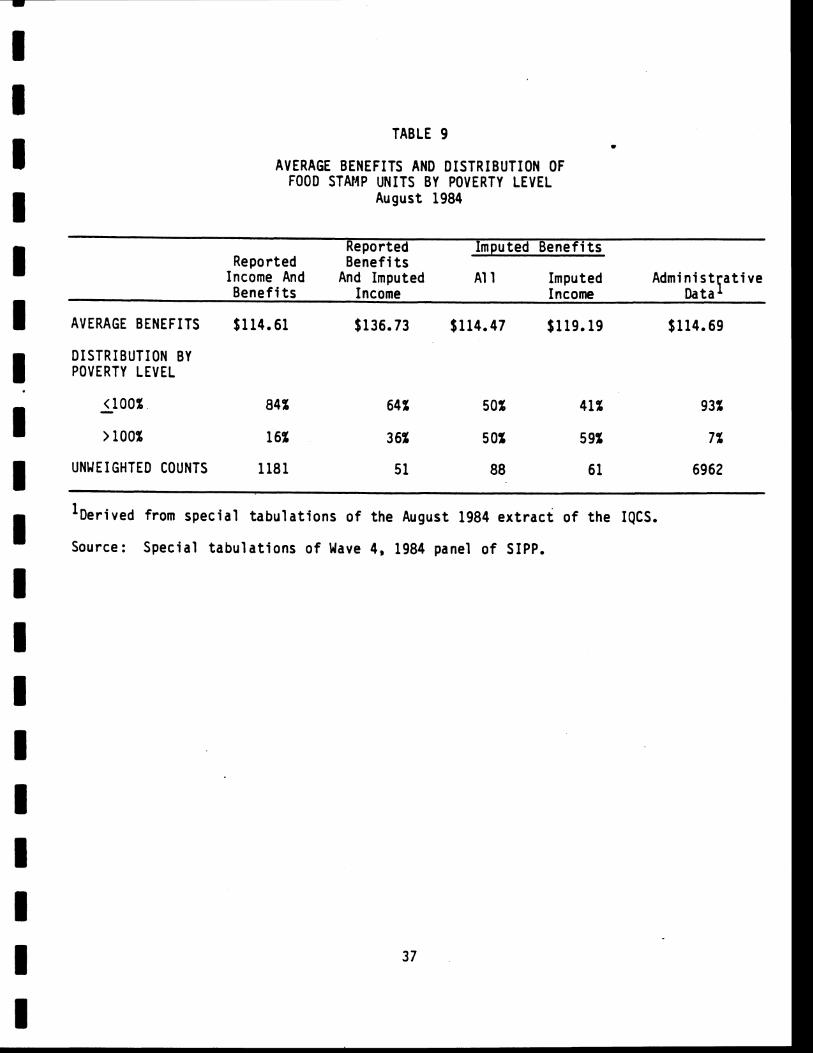
TABLE 9
AVERAGE BENEFITS AND DISTRIBUTION OF FOOD STAMP UNITS BY POVERTY LEVEL
August 1984
Reported Imputed B e n e f i t s Reported B e n e f i t s
Income And And Imputed A1 1 Imputed Admin is t a t i v e B e n e f i t s Income Income Data 1
AVERAGE BENEFITS $114.61 $136.73 $114.47 $119.19 $114.69
DISTRIBUTION BY POVERTY LEVEL
UNUEIGHTED COUNTS 1181 5 1 88 61 6962
l ~ e r i v e d from s p e c i a l t a b u l a t i o n s o f t he August 1984 e x t r a c t o f t h e IQCS.
Source: Spec ia l t a b u l a t i o n s o f Wave 4, 1984 panel of SIPP.
The food stamp u n i t s i n Table 9 a re subdiv ided i n t o t h ree main groups w i t h the
subset o f t h e t h i r d group d isp layed separate ly . The t h r e e main groups are:
o Repcrted bene f i t s an$ repor ted income o Reported b e n e f i t s and imputed income o Imputed bene f i t s .
It should be noted t h a t t h i s c l a s s i f i c a t i o n i s based on whether o r no t anyone
i n t h e u n i t had imputed income o r benef i t s r a t h e r than any one i n t he Census
househo1d.l Because o f the na ture o f t h i s d iscuss ion , i t i s more appropr ia te
t o t a r g e t t h e food stamp u n i t even though the Census Bureau can on l y
r e a l i s t i c a l l y cons ider Census households i n the impu ta t i on phase.
Overa l l t h e average b e n e f i t s f o r u n i t s w i t h repo r ted b e n e f i t s and income
($114.61) compare favorably w i t h average benef i t s de r i ved from a d m i n i s t r a t i v e
data ($114.69). Reported b e n e f i t s f o r u n i t s who d i d no t r e p o r t a l l o f t h e i r
income, however, exceed t h a t repor ted f o r the f i r s t group by 19 percent
($136.73 verses $114.61). Given the na ture o f t he b e n e f i t formula, t h i s
d i f fe rence i n average repo r ted b e n e f i t s suggests t h a t t he income nonrespon-
dents should be poorer on average than the respondents. Therefore, we expect
t h a t the group w i t h repo r ted b e n e f i t s and imputed income should have a h igher
percentage o f food stamp u n i t s below t h e pover ty l e v e l than the group w i t h b
repo r ted income. However, on l y 64 percent of income nonrespondents were below
'AS noted i n the prev ious chapter, 2% o f t he food stamp households had a l l of t h e i r imputed incomes a t t r i b u t e d t o one o r more noncovered persons. Un i ts i n these households are c l a s s i f i e d as having repor ted income.
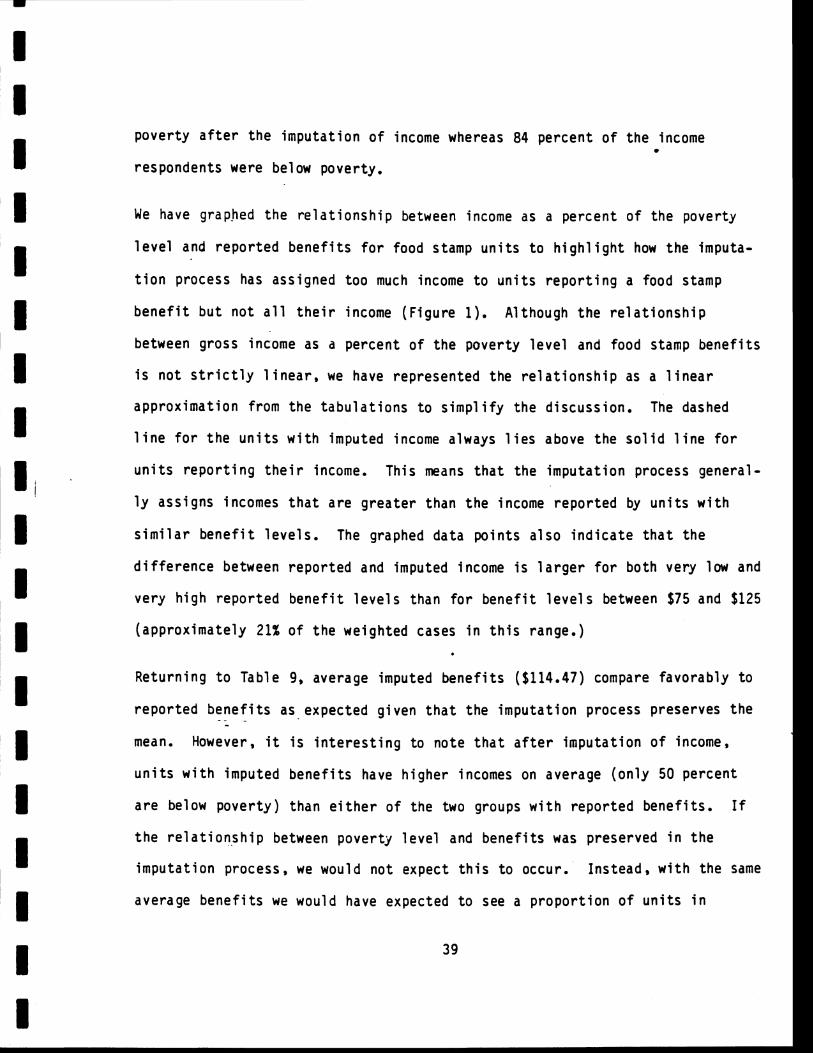
pove r t y a f t e r t h e impu ta t i on o f income whereas 84 percen t o f t h e income 0
respondents were below pover ty .
We have graphed t h e r e l a t i o n s h i p between income as a percen t of t he pover ty
l e v e l and r e p o r t e d b e n e f i t s f o r food stamp u n i t s t o h i g h l i g h t how t h e imputa-
t i o n process has ass igned t oo much income t o u n i t s r e p o r t i n g a food stamp
b e n e f i t b u t n o t a l l t h e i r income (F igu re 1) . Al though t h e r e l a t i o n s h i p
between gross income as a percen t o f t h e pover ty l e v e l and food stamp bene f i t s
i s n o t s t r i c t l y l i n e a r , we have represen ted t he r e l a t i o n s h i p as a l i n e a r
approx imat ion f rom t h e t a b u l a t i o n s t o s i m p l i f y t he d iscuss ion . The dashed
l i n e f o r t h e u n i t s w i t h imputed income always l i e s above t he s o l i d l i n e f o r
u n i t s r e p o r t i n g t h e i r income. Th is means t h a t t he impu ta t i on process genera l -
l y ass igns incomes t h a t a re g r e a t e r than t h e income repo r t ed by u n i t s w i t h
s i m i l a r b e n e f i t l e v e l s . The graphed da ta p o i n t s a l s o i n d i c a t e t h a t t h e
d i f f e rence between r e p o r t e d and imputed income i s l a r g e r f o r bo th very low and
very h i g h r e p o r t e d b e n e f i t l e v e l s than f o r b e n e f i t l e v e l s between $75 and $125
(app rox ima te l y 21% o f t h e weighted cases i n t h i s range.)
Re tu rn ing t o Table 9, average imputed b e n e f i t s ($114.47) compare favorab ly t o
r e p o r t e d b e n e f i t s as expected g iven t h a t t he i m p u t a t i o n process preserves t h e - - -
mean. However, i t i s i n t e r e s t i n g t o no te t h a t a f t e r impu ta t i on of income,
u n i t s w i t h imputed b e n e f i t s have h i ghe r incomes on average ( o n l y 50 percen t
a re below p o v e r t y ) than e i t h e r of t he two groups w i t h r e p o r t e d bene f i t s . If
t h e r e l a t i o n s h i p between pove r t y l e v e l and b e n e f i t s was preserved i n t h e
i m p u t a t i o n process, we would no t expect t h i s t o occur. Ins tead , w i t h the same
average b e n e f i t s we would have expected t o see a p r o p o r t i o n of u n i t s i n
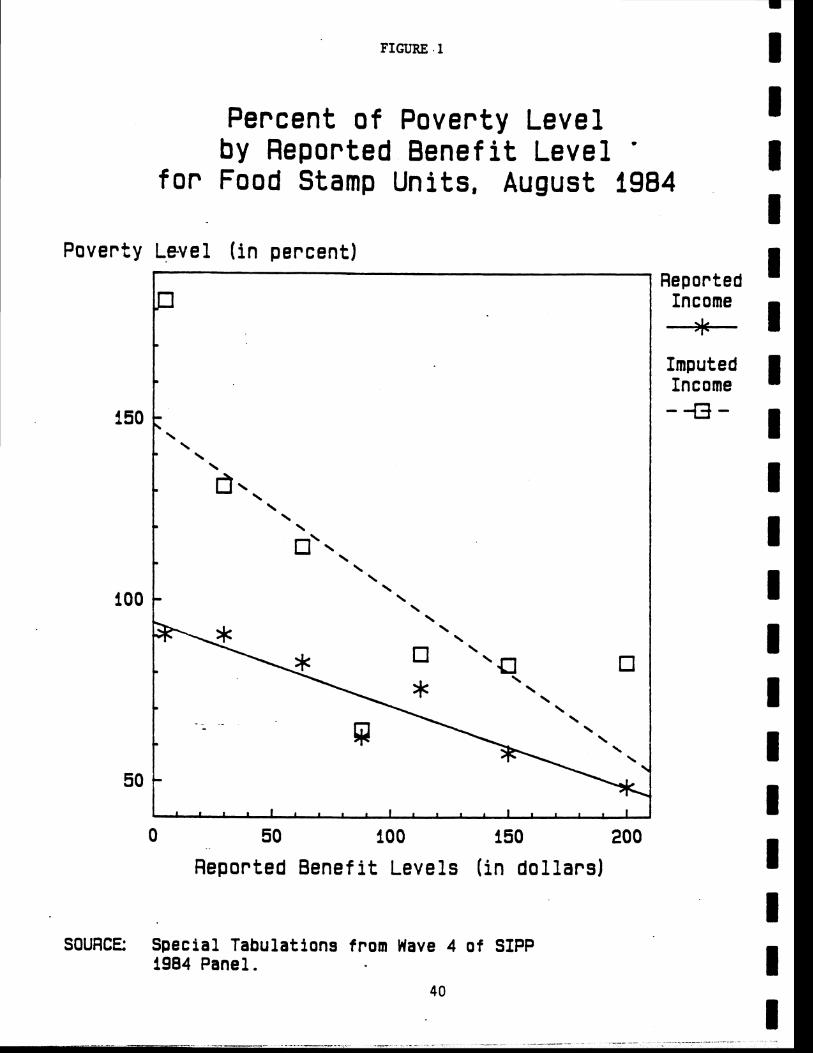
FIGURE .1
P e r c e n t o f P o v e r t y L e v e l by Repor ted B e n e f i t L e v e l '
f o r Food Stamp Units, August 1984
P o v e r t y L e y e l ( i n p e r c e n t )
Repor ted B e n e f i t L e v e l s ( i n d o l l a r s )
SOURCE: S p e c i a l Tabulat ions f rom Wave 4 of SIPP 1984 P a n e l .
Reported I Income --. I
Imputed Income I
pover ty comparable t o t he group w i t h repor ted income and bene f i t s . Of course, *
i t i s poss ib le t h a t the group w i t h imputed b e n e f i t s d i f f e r s i n some s i g n i f i -
cant way from t h e group w i t h repor ted income and b e n e f i t s and t h i s cou ld
e x p l a i n a s h i ft i n the apparent income/benef i t r e1 a t i o n s h i p. (For example,
t he group w i t h imputed b e n e f i t s may have h igher expenses). However, we
b e l i e v e t h i s i s u n l i k e l y . Small sample s izes p r o h i b i t e d a cross c l a s s i f i c a -
t i o n along severa l dimensions needed t o i n v e s t i g a t e t h i s p o s s i b i l i t y .
The ana l ys i s o f Table 9 suggests t h a t w h i l e the impu ta t i on o f benef i t s tends
t o preserve the o v e r a l l mean, the r e l a t i o n s h i p between income and benef i t s i s
be ing d i s t o r t e d . S i m i l a r l y , the imputa t ion o f income t o u n i t s w i t h repor ted
b e n e f i t s does no t ma in ta in t he expected r e l a t i o n s h i p e i t h e r .
This f i r s t p o i n t i s a m p l i f i e d somewhat i n Table 10 a l though few conc lus ive
f i n d i n g s can be de r i ved because the sample s i z e i s small. As expected,
repo r ted average b e n e f i t s a re h igher f o r very poor households (under 50%
pove r t y ) than f o r t he h igher income groups. Average repor ted b e n e f i t s are
c l o s e t o average b e n e f i t s repor ted i n the a d m i n i s t r a t i v e data fo r t h i s group
as we l l . Reported average benef i t s decl i n e f o r t he h igher income groups bu t
t h i s i s no t as r a p i d as the d e c l i n e observed i n the a d m i n i s t r a t i v e data. I n
f ac t , r epo r ted average b e n e f i t s fo r S I P P u n i t s above pover ty are more than
t w i c e the average b e n e f i t s of u n i t s above pover ty based on a d m i n i s t r a t i v e
data. This phenomenon m e r i t s a d d i t i o n a l research.
Based on the d e v i a t i o n between repor ted b e n e f i t s from SIPP and from adminis-
t r a t i v e data and based on the observed f l u c t u a t i o n i n average b e n e f i t s by
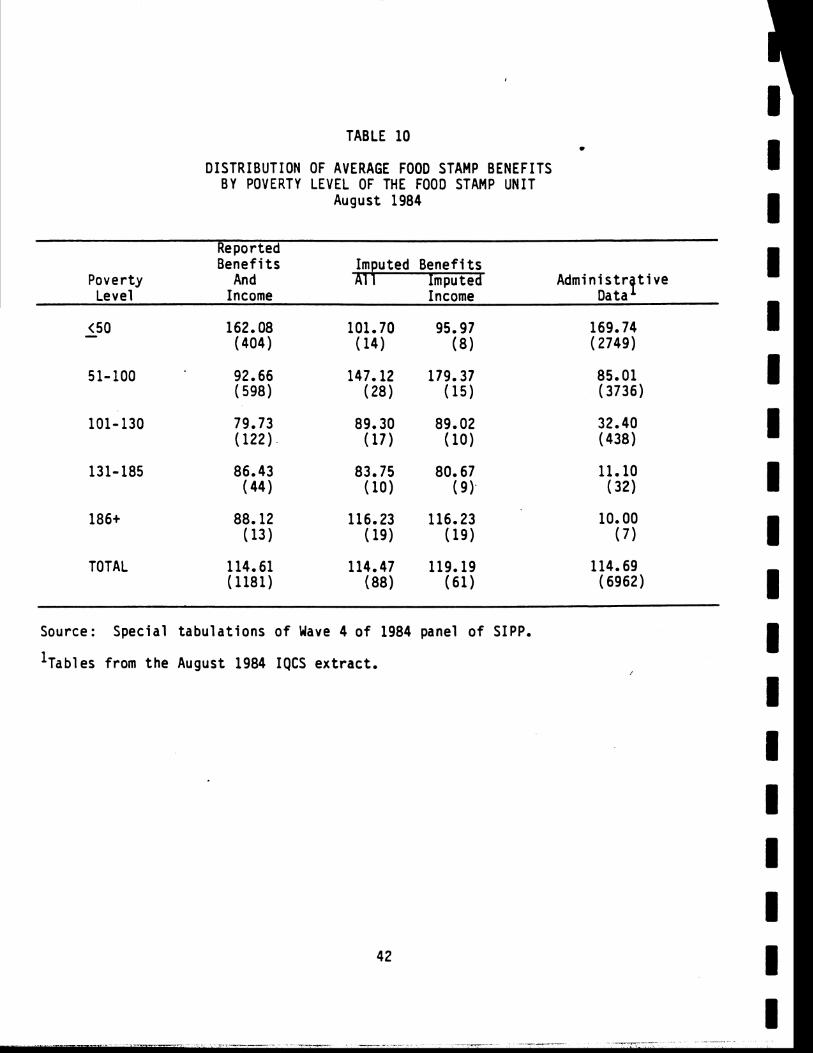
TABLE 10
DISTRIBUTION OF AVERAGE FOOD STAMP BENEFITS BY POVERTY LEVEL OF THE FOOD STAMP UNIT
August 1984
Reported ~ e n e f i t s Imputed Benef i t s
Pover ty And A1 1 Imputed Admin i s t r t i v e Level Income Income Data f
TOTAL 114.61 114.47 119.19 114.69 (1181) (88) ( 61 ) ( 6962)
Source: Specia l t a b u l a t i o n s o f Wave 4 o f 1984 panel o f SIPP.
l ~ a b l e s f rom t h e August 1984 I Q C S e x t r a c t .
pove r t y groups, severa l d i f f e r e n t suppos i t i ons can be made about t h e charac- w
t e r i s t i c s o f nonrespondents and hence t he l e v e l o f m i ss i ng b e n e f i t s . F i r s t ,
g i ven t h a t r epo r t ed b e n e f i t s on average a re l e s s than a d m i n i s t r a t i v e data for
t h e very poor u n i t s one would expect t h a t nonrespondents on average i n t h e
ve r y pw; group would have h i ghe r b e n e f i t s then t h e i r r e p o r t i n g coun te rpa r t s
i f t h e o v e r a l l mean f o r t he group i s t o match t h e a d m i n i s t r a t i v e data.
Corresponding ly , g i ven t h e reverse s i t u a t i o n i n t h e h i ghe r income groups one
would expec t t h a t t h e r e s t o f t h e nonresponding households would have lower
b e n e f i t s then t h e i r responding coun te rpar ts . On t h e o t h e r hand, i f the
o r i g i n a l r e l a t i o n s h i p noted i n t he SIPP da ta between b e n e f i t s and pove r t y
l e v e l were preserved, t h e r e would be l i t t l e change i n avebage b e n e f i t s w i t h i n
p o v e r t y 1 eve1 between t he r e p o r t e r s and t he nonrespondents.
I n a c t u a l i t y , however, none of these expec ta t i ons has been met i n t h e imputa-
t i o n of b e n e f i t s . Imputed b e n e f i t s f o r t h e very poor a re l e s s than repo r t ed
b e n e f i t s f o r t h a t income c lass . Furthermore, among t h e o t h e r groups ( w i t h t he
excep t i on of u n i t s i n t h e 131-1852 o f pove r t y group) imputed bene f i t s a re
1 a r g e r on average than r e p o r t e d bene f i t s .
A l though smal l sample s i z e s p r o h i b i t any s t r o n g conc lus ions based on Table 10, -. - -
t h e outcome dep i c t ed t h e r e does tend t o r e c o n f i r m o u r e a r l i e r susp ic ions t h a t
t h e i m p u t a t i o n process d i s t o r t s t he r e1 a t i o n s h i p between income and u n i t s i z e
and b e n e f i t l e v e l s . Th is was no t observed i n Chapter I 1 due t o t he r e l a t i v e l y
smal l p r o p o r t i o n o f u n i t s a f f e c t e d and t h e focus on t h e aggregate d i s t r i b u -
t i o n , no t c o n t r o l l i n g f o r u n i t s ize. I n f a c t , t he r e l a t i v e l y low l e v e l of
nonresponse i n SIPP i s t h e reason t h i s d i s t o r t i o n does n o t seem t o have a
l a r g e impact i n SIPP-based s t a t i s t i c s of aggregate caseload. However, we do
t h i n k some a t t e n t i o n should be g i ven t o t h i s problem even though i t o n l y
a f f e c t s a r e l a t i v e l y smal l number of observa t ions . One sugges t ion f o r t he
p r e v e n t i o n o f a t l e a s t some o f t h e d i s t o r t i o n i s t o per fo rm impu ta t i ons f o r
m i s s i n g food stamp b e n e f i t s a f t e r t he income has been imputed and t o use some
measure o f t h e u n i t ' s pove r t y s t a t u s ( i f u n i t compos i t i on was r e p o r t e d ) o r t h e
househo ld ' s pove r t y s t a t u s ( i f u n i t compos i t i on was n o t r e p o r t e d ) as a de te r -
m inan t o f t h e l e v e l o f imputed bene f i t s . S i m i l a r l y , i f t h i s t ype o f d i s t o r -
t i o n i s observed t o occur w i t h o t h e r means t e s t e d b e n e f i t s (and we assume i t
wou ld ) these b e n e f i t s cou ld be imputed i n t h e same manner a f t e r o t h e r income
amounts a re imputed b u t be fo re food stamp b e n e f i t s a r e imputed. l
2. Presence of E l d e r l y o r D isab led
Tab1 e 11 d i s p l a y s t h e r e l a t i o n s h i p between average b e n e f i t s and t h e presence
o f e l d e r l y o r d i s a b l e d persons. As expected average b e n e f i t s f o r u n i t s w i t h
r e p o r t e d income and b e n e f i t s va ry cons ide rab l y by t h e presence o f an e l d e r l y
o r d i s a b l e d person. Average b e n e f i t s f o r u n i t s w i t h no e l d e r l y o r d i s a b l e d
members exceeds those w i t h an e l d e r l y o r d i s a b l e d member by a f a c t o r of 2.6.
A l though t h e r e p o r t e d average b e n e f i t s from SIPP exceed t h a t r e p o r t e d i n t he
administrative survey f o r bo th groups t h i s r a t i o o f b e n e f i t s between t he two
groups i s t h e same.
' ~ o o d stamp impu ta t i ons should come l a s t beca2se t h e e l i g i b i l i t y and b e n e f i t d e t e r m i n a t i o n s f o r food stamps i n c l u d e a l l forms o f cash income i n t h e measure o f gross income.
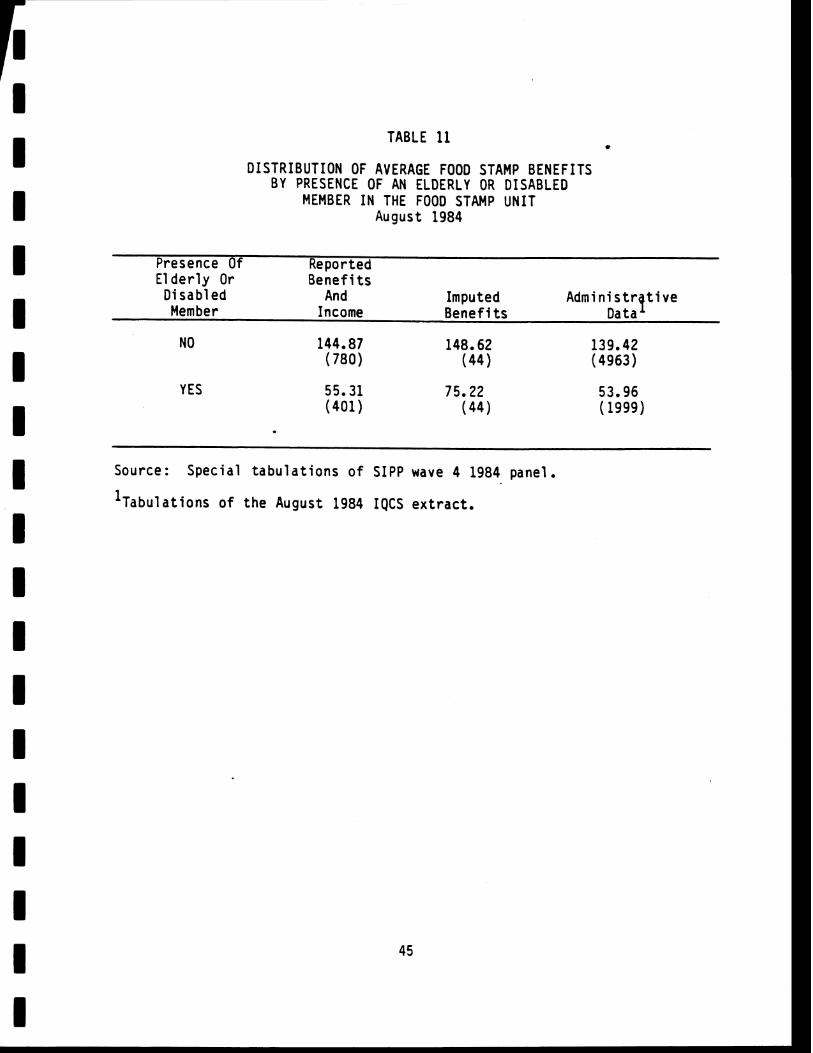
TABLE 11 - DISTRIBUTION OF AVERAGE FOOD STAMP BENEFITS
BY PRESENCE OF AN ELDERLY OR DISABLED MEMBER I N THE FOOD STAMP UNIT
August 1984
Presence O f Repor ted E l d e r l y O r Benef i t s
D i s a b l e d And Imputed A d m i n i s t r t i v e Member Income B e n e f i t s Data f
YES
Source: S p e c i a l t a b u l a t i o n s of SIPP wave 4 1984 pane l .
l ~ a b u l a t i o n s o f t h e August 1984 IQCS e x t r a c t .
Tho i m n l l t ? t i o n of b e n e f i t s ma in ta i ns the d i r e c t i o n o f t h e r e l a t i o n s h i p
( b e n e f i t s f o r u n i t s w i t h no e l d e r l y o r d i s a b l e d members exceed b e n e f i t s f o r
e l d e r l y l d i s a b l ed u n i t s on average). However, t he r a t i o o f average bene f i t s
f o r t h e two groups decreases somewhat f rom 2.6 t o 2.0. The use o f an age
break a t 65 i n t he i m p u t a t i o n o f b e n e f i t s appears t o h e l p t o m a i n t a i n t h i s
r e l a t i o n s h i p . Lowering t h a t age break t o 60 ( t h e food stamp d e s i g n a t i o n o f
e l d e r l y ) and i n c o r p o r a t i n g t he presence o f e l d e r l y persons i n t h e household
o t h e r than t h e p r imary r e c i p i e n t m igh t improve t h i s r e s u l t even more.
3. Presence o f Earners
As noted p r e v i o u s l y , 20 percen t o f ea rn ings i s deducted i n t h e computat ion of
food stamp bene f i t s . Therefore, g i ven the same l e v e l o f t o t a l income, a u n i t
w i t h earn ings w i l l have h i ghe r b e n e f i t s than a u n i t w i t h o u t earnings. Admin-
i s t r a t i v e da ta c o n f i r m t h a t u n i t s w i t h earn ings on average have h i ghe r
b e n e f i t s than u n i t s w i t h o u t (see Table 12). B e n e f i t s t o earners exceed
b e n e f i t s t o nonearners by about 19 percent. U n i t s w i t h r e p o r t e d bene f i t s and
income i n SIPP a l s o e x h i b i t t h i s c h a r a c t e r i s t i c , a l t hough t h e d i f f e r e n c e i n
b e n e f i t l e v e l s i s somewhat l a r g e r ( 27 percen t ) .
The i m p u t a t i o n o f b e n e f i t s r e t a i n s h i ghe r b e n e f i t s f o r ea rners than f o r
nonearners as expected g i ven t h a t a t l e a s t some i n d i c a t i o n o f ea rn ings r e c e i p t
i s i n c l u d e d i n t h e i m p u t a t i o n o f food stamps. However, t h e r a t i o of t he
imputed b e n e f i t s o f ea rners t o nonearners i s 1.42, w e l l above t h e 1.27 r a t i o
f o r r e p o r t e d b e n e f i t s . It i s no t c l e a r why t h i s r a t i o would i nc rease so
much. It does suggest t h a t t h e c u r r e n t use o f work exper ience of t h e
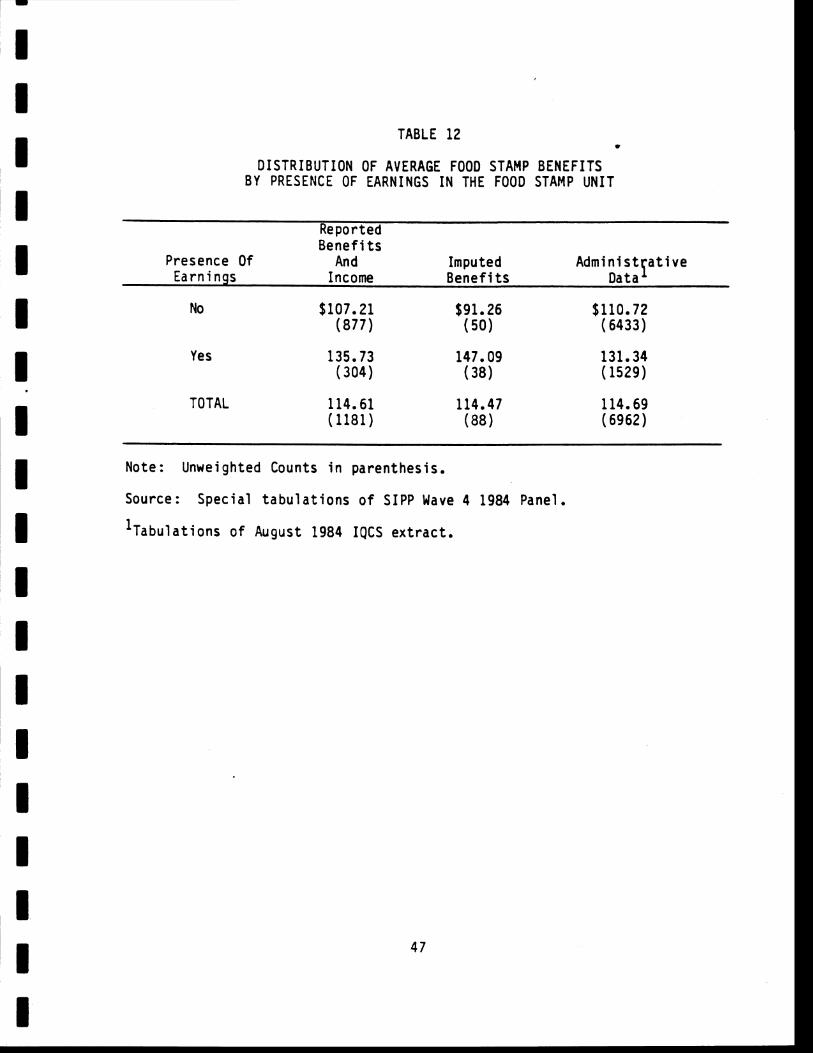
TABLE 12
DISTRIBUTION OF AVERAGE FOOD STAMP BENEFITS BY PRESENCE OF EARNINGS IN THE FOOD STAMP UNIT
Reported B e n e f i t s
Presence O f And Imputed Admin is t a t i v e Earn ings Income B e n e f i t s Data f
Yes 135.73 147.09 131.34 (304) (38) ( 1529)
TOTAL 114.61 114.47 114.69 (1181) (88 ) (6962)
Note: Unweighted Counts i n parenthes is .
Source: Spec ia l t a b u l a t i o n s o f SIPP Wave 4 1984 Panel.
' ~ a b u l a t i o n s o f August 1984 IQCS e x t r a c t .
r e c i ? i o n + i n the impu ta t i on o f b e n e f i t s i s n o t q u i t e s u f f i c i e n t 5s a proxy fo r
r e c e i p t o f ea rn ings by t h e food stamp u n i t .
Up t o t h i s p o i n t we have observed t h a t es t imates based on t he food stamp u n i t
do va ry f rom es t ima tes based on t h e Census household. Furthermore, we have
based our comparisons t o a d m i n i s t r a t i v e da ta on t h e food stamp u n i t r a t h e r
t han t h e Census household. However, we have no ted t h a t some concern e x i s t s
ove r t h e measurement o f t h i s u n i t , p a r t i c u l a r l y w i t h regard t o households
which c o n t a i n more t han one r e c i p i e n t o f food stamp b e n e f i t s . The n e x t
chap te r e l abo ra tes our concerns and exp la i ns why ou r food stamp u n i t c o n s t r u c t
d i d n o t a t tempt t o d i s t i n g u i s h mu1 t i p l e u n i t s w i t h i n Census households
c o n t a i n i n g more than one r e c i p i e n t o f b e n e f i t s .
I V . ' CREATIOtI OF FOOD STAMP UNITS t
The food stamp u n i t d e f i n i t i o n as c u r r e n t l y l e g i s l a t e d a l l ows f o r t h e
f o rma t i on o f program u n i t s t h a t a re subsets o f t h e Census Bureau's d e f i n i t i o n
o f a household. A Census household c o n s i s t s o f persons who u s u a l l y r e s i d e
t oge the r a t a s p e c i f i c address. The food stamp u n i t g e n e r a l l y i s t h e subset
o f those c o h a b i t a n t s who purchase and prepare meals t oge the r . There a r e
excep t ions t o t he general r u l e which pe rm i t m u l t i p l e u n i t s t o form even w i t h i n
groups of c o h a b i t a n t s who share meals. For example, an e l d e r l y o r d i sab led
person and h i s o r her spouse a re a l lowed t o app ly f o r b e n e f i t s as a separate
u n i t f rom t h e r e s t o f t he r e s i d e n t s a t t h e i r address. 1
These r e g u l a t i o n s a f f e c t i n g t h e food stamp u n i t a l l o w t h e f o rma t i on of
subun i t s and mu1 t i p l e u n i t s w i t h i n p a r t i c i p a t i n g Census households. I n e i t h e r
case one o r more i n d i v i d u a l s i n t he Census household may no t be covered under
food stamp b e n e f i t s r ece i ved by o t h e r r e s i d e n t s a t t h e i r address. Given t h e
d i f f e r e n c e between program u n i t s and t he Census household, one of t he
o b j e c t i v e s o f t h i s paper was t o d i s c e r n whether t h e use o f t h e Census house-
h o l d i n t h e a n a l y s i s o f d i s t r i b u t i o n a l c h a r a c t e r i s t i c s o f program p a r t i c i p a n t s
produced d i k f e r e n t answers, p a r t i c u l a r l y w i t h r ega rd t o income and b e n e f i t
l e v e l s , than would have r e s u l t e d had t he a n a l y s i s been based on food stamp
u n i t s . I n o r d e r t o accompl ish t h i s goal , food stamp u n i t s were cons t ruc ted
f rom t h e i n f o r m a t i o n a v a i l a b l e f rom the survey. Th i s e f f o r t , desc r ibed below,
'see Appendix C f o r a more i ndep th d i scuss ion o f the d e f i n i t i o n o f t he food stamp u n i t and how t h a t d i f f e r s f rom t h e Census household d e f i n i t i o n .
was general 1 y success fu l i n . i d e n t i f y i n g noncovered persons within. Census
households b u t n o t success fu l i n i d e n t i f y i n ? mu1 t i p l e u n i t s . I A. S I P P ENUMERATION OF FOOD STAMP UNITS
I n t h e SIPP c o r e module 11 persons over 18 and persons age 15-18 w i t h depen-
dents a re asked i f they dere au tho r i zed t o r ece i ve food stamp bene f i t s some
t i m e d u r i n g t he f o u r months p r i o r t o t he i n t e r v i e w date, i.e., d i d t h e i r name
appear on t h e c e r t i f i c a t i o n card. Th is method o f q u e s t i o n i n g i s in tended t o
i d e n t i f y o n l y one member o f each food stamp u n i t i n t he Census household who
would then be ques t ioned f u r t h e r about t h e i r p a r t i c i p a t i o n i n t h e Food Stamp
Program. Once t h e a u t h o r i z e d r e c i p i e n t s a r e i d e n t i f i e d , a s e r i e s o f ques t ions
des igned t o measure u n i t compos i t i on and month ly b e n e f i t s a re admin is te red t o
those persons. Ques t ions p e r t a i n i n g t o b e n e f i t l e v e l s a re admi n i s - ? red four
t imes , once f o r each o f t h e f o u r months p r i o r t o t h e month o f i n t e r v i e w . The
u n i t compos i t i on ques t i ons a re adm in i s t e red once per wave and i n q u i r e as t o
wh ich persons " l i v i n g here" were covered. There i s some amb igu i t y i n t he
responses t o ques t ions o f u n i t compos i t i on when t h e Census household changed
compos i t i on w i t h i n t h e wave, e s p e c i a l l y when persons l e f t t he household d u r i n g
t h e re fe rence p e r i o d and be fo re t h e i n t e r v i e w month.
- -
W i t h t h i s i n f o r m a t i o n , t h e Census Bureau c rea tes m ic roda ta f i l e s r e f l e c t i n g
food stamp b e n e f i t s and u n i t compos i t i on i n each o f t h e r e fe rence months o f I
t h e wave. Month ly b e n e f i t s a re recorded o n l y on t h e a u t h o r i z e d r e c i p i e n t ' s I r c s o r d w t -eas u n i t ~ m p o s i t i o n i s recorded f o r a l l household members covered
~ e r someone's b e n e f i t . The u n i t composi t ion i s ass igned i n months i n which I b e n e f i t s were r ece i ved by s e t t i n g a coverage f l a g t o one f o r each person I
covered. The de te rm ina t i on o f who was covered i s accompl ished i r l one of two
ways. I f t h e p r imary r e c i p i e n t i n d i c a t e d t h a t a l l persons i n t h e household
were covered, then a l l persons r e s i d i n g a t t he r e c i p i e n t ' s address i n t he
month o r months i n which b e n e f i t s were r ece i ved a re l i s t e d as covered. If t h e
p r imary r e c i p i e n t p rov i ded a 1 i s t o f covered persons (as they a re requested t o
do when l e s s t han t h e f u l l household was covered) then o n l y those people
l i s t e d a re ass igned coverage i n t h e months i n which b e n e f i t s were rece ived.
These month ly b e n e f i t and coverage f i e l d s a re cons t ruc ted on t h e p u b l i c use
mic roda ta f i l e s a f t e r e d i t s and imputa t ions a re performed. Imputa t ion f l ags -
accompany t h e month ly b e n e f i t amounts i n d i c a t i n g whether o r n o t t h e b e n e f i t
amounts i n t h e m ic roda ta f i l e s had been imputed. The f i l e s do no t c o n t a i n
f l a g s t o denote whether u n i t compos i t i on had been imputed. For t h i s p r o j e c t
these c o n s t r u c t e d v a r i a b l e s were used t o determine t h e food stamp u n i t w i t h i n
t h e Census household. E s s e n t i a l l y t h e food stamp u n i t f o r purposes of t h i s
s tudy c o n s i s t e d of a1 1 persons i n the Census household whom t h e Census Bureau
had f lagged as be ing covered i n t h e month o f August 1984 i n t h e S I P P Wave 4
1984 panel m ic roda ta f i l e . Summary c h a r a c t e r i s t i c s o f t h e food stamp u n i t ,
such as income and s i ze , rep resen ted aggrega t ions over t h e covered i n d i v i d u a l s
w i t h i n p a r t i c i p a t i n g households. Due t o t h e ex i s t ence o f ambiguous cases
desc r i bed i n t h e n e x t sec t i on , o n l y one food stamp u n i t was c rea ted i n our
a n a l y s i s f i l e when a Census household con ta ined more than one au tho r i zed
r e c i p i e n t . Th i s u n i t c o n s i s t e d o f a l l persons covered by a t l e a s t one of t h e
a u t h o r i z e d r e c i p i e n t s i n t he Census household. Food stamp b e n e f i t s f o r the
g n i + rnnroc,ented t h e sum o f a l l bene f i t s r epo r t ed by o r imputed t o the autho-
r i z e d r e c i p i e n t s . I 8. PROBLEMS I N THE FORMATION OF UNITS
The a t tempt t o c r e a t e " t r u e " food stamp u n i t s f o r t h i s paper met w i t h a number
o f obs tac l es . These obs tac l es r e s u l t e d f rom the method used by t he Census
Bureau t o ass i gn u n i t compos i t i on i n cases o f non in te r v i ew and i n cases of
nonresponse t o t h e ques t ions p e r t a i n i n g t o food stamp b e n e f i t s . I n t o t a l , 214
thousand o r 4 percen t o f t he r e c i p i e n t households appeared t o have been
m u l t i p l e food stamp u n i t s , i.e., t h e r e was more than one a u t h o r i z e d r e c i p i e n t .
Th is f i g u r e i s c o n s i s t e n t w i t h the Dalrymple and Car lson (1986) es t ima te of 5
percent . However, upon c l o s e examina t ion o f t he food stamp households w i t h
mu1 t i p l e r e c i p i e n t s we found t h a t t h e number o f households w i t h t r u e m u l t i p l e
u n i t s may be as smal l as 1% o f t h e t o t a l . There i s cons ide rab le amb igu i t y i n
t h e data as i l l u s t r a t e d below.
Food stamp households w i t h more than one r e c i p i e n t were examined based on two
c r i t e r i a : ( 1 ) m a r i t a l r e l a t i o n s h i p s between t he food stamp r e c i p i e n t s and ( 2 ) I t h e p o t e n t i a l t h a t one o r more r e c i p i e n t had u n i t compos i t i on imputed. Note
t h a t we d i d -. n o t - know. p r e c i s e l y who responded t o t h e u n i t compos i t i on ques t ions I
- and who d i d not . The f o l l o w i n g s i t u a t i o n s were found t o occur i n 214 thousand
households w i t h more than one au tho r i zed r e c i p i e n t :
I I
1. 28 pe rcen t o r 59 thousand con ta ined husband lw i fe f a m i l i e s .where bo th spouses r e p o r t e d be ing the a u t h o r i z e d r e c i p i e n t .
2. 17 percen t o r 37 thousand were Census households where one o f t h e a u t h o r i z e d r e c i p i e n t s was a non in te r v i ew and
was imputed food stamp r e c e i p t , b e n e f i t s and u n i t compo- s i t i o n where t h i s u n i t compos i t i on d u p l i c a t e s what o fhe r respondents r epo r t ed i n t he Census household.
3. 35 percent o r 7 5 thousand o f t h e Census households had food stamp b e n e f i t s imputed ( i n c l u s i v e of the 17% no ted above) and these u n i t s may o r may n o t have had u n i t corn-
. p o s i t i o n imputed.
Note t h a t t h e d u p l i c a t e r e p o r t i n g cases i n (1) are no t n e c e s s a r i l y d i s t i n c t
from t h e cases wi. th imputed b e n e f i t s i n ( 2 ) and ( 3 ) .
C l e a r l y , r e p o r t i n g of b e n e f i t s by bo th spouses i n a husbandlwi fe fami l y i s
suspect. Hence, i f t h e 59 thousand d u p l i c a t e r e p o r t i n g households a re no t
counted as mu1 t i p l e u n i t s then the number o f m u l t i p l e u n i t households drops t o
155 thousand o r 2.5 percen t o f t h e t o t a l households w i t h food stamps. It i s
p o s s i b l e t h a t i n some cases these represented t r u e mu1 t i p l e u n i t s as i n the . case o f a r ecen t mar r iage o f two s i n g l e paren ts whose combined household had
n o t y e t been r e c e r t i f i e d as one u n i t . However, d i s t i n g u i s h i n g a t r u e m u l t i p l e -
u n i t husband lw i fe f a m i l y f rom a s i t u a t i o n o f d u p l i c a t e r e p o r t i n g of bene f i t s
i s d i f f i c u l t w i t h t h e c ross - sec t i ona l data used f o r t h i s t ask and hence was
n o t at tempted. Ins tead, we s imply combined t h e u n i t s i n t o one and summed t he
b e n e f i t s r epo r t ed - by bo th spouses. The Census Bureau has been conduct ing
research o t l ~ t h i s problem u s i n g l o n g i t u d i n a l data and, we be1 ieve , they have
been making an a t tempt t o d i sen tang le cases o f d u p l i c a t e r e p o r t i n g .
It i s n o t c l e a r whether t r u e m u l t i p l e u n i t s e x i s t i n food stamp households
w i t h mu1 t i p l e r e c i p i e n t s w i t h imputed bene f i t s . For t he t h i r d category l i s t e d
above t h e r e i s no method o f a s c e r t a i n i n g i f u n i t compos i t i on was imputed i n
some fash ion due t o t he l a c k o f an a p p r o p r i a t e i m p u t a t i o n f l a g . We know t h a t
i n t h o 1 7 n ~ r c e n t o f t h e cases which c o n t a i n e d a n o n i n t e r v i e w person ( c a t e g o r y *
2 ) c o m p o s i t i o n was imputed a l o n g w i t h b e n e f i t s , and t h a t t h i s r e s u l t e d i n
d u p l i c a t e coverage f o r a t l e a s t some members o f t h e household. Based on
o b s e r v a t i o n o f t h e raw cases i t appeared t h a t c o m p o s i t i o n was imputed a l o n g
w i t h b e n e f i t s i n a t l e a s t some o f t h e rema in ing cases i n c a t e g o r y 3. If we
assume t h a t a l l cases i n c a t e g o r y 3 had c o m p o s i t i o n imputed a l o n g w i t h b e n e f i t
l e v e l s and t h a t t h e r e s u l t i n g m u l t i p l e r e c i p i e n t s d i d n o t r e p r e s e n t t r u e
m u l t i p l e u n i t s , t h e n t h e number o f t r u e m u l t i p l e u n i t cases r e p o r t e d drops
from 4 p e r c e n t t o 1 p e r c e n t o f t h e t o t a l caseload. I f , on t h e o t h e r hand, we
assume t h a t none o f these cases had u n i t c o m p o s i t i o n imputed a l o n g w i t h
b e n e f i t s and hence they r e p r e s e n t e d t r u e m u l t i p l e u n i t s , t h e n t h e number of
mu1 t i p l e -un i t househol ds i s reduced by 37 thousand.
S ince i m p u t a t i o n o f t e n c r e a t e s d u p l i c a t e coverage o f Census househola members,
we do n o t b e l i e v e t h a t a l l o f t h e imputed cases r e p r e s e n t e d t r u e m u l t i p l e
u n i t s . Hence, i t appears t h a t a s i z e a b l e p o r t i o n o f what seemed t o be
mu1 t i p 1 e - u n i t households were a r t i f i c i a l l y c r e a t e d e i t h e r t h r o u g h dup l i c a t e
r e p o r t i n g of b e n e f i t s o r t h r o u g h t h e i m p u t a t i o n process. We c o n j e c t u r e t h a t
t h e number o f t r u e mu1 t i p l e u n i t s i s i n t h e range o f 86 thousand ( o r 1 p e r c e n t
o f t h e t o t a l number o f households w i t h food stamp b e n e f i t s ) t o 114 thousand
( o r 2 p e r c e n t o f t h e t o t a 1 ) l . Given t h e r e l a t i v e l y sma l l s i z e of t h e group o f
' ~ h e s e e s t i m a t e s t a k e i n t o account t h e ove r1 ap between t h e t h r e e c a t e g o r i e s . Bo th f i g u r e s assume t h a t d u p l i c a t i v e r e p o r t i n g ( c a t e g o r y 1) and i m p u t a t i o n f o r n o n i n t e r v i e w ( c a t e g o r y 2) do n o t r e f l e c t t h e m u l t i p l e u n i t s . The l o w e r f i g u r e assumes t h a t a l l t h e cases b e l o n g i n g e x c l u s i v e l y t o c a t e g o r y 3 a r e n o t t r u e m u l t i p l e u n i t s . The h i g h e r f i g u r e assumes t h a t t h e y a r e t r u e m u l t i p l e u n i t s .
apparent multiple units and this ambiguity in distinguishing among separate
units within a group of covered individuals, the food stamp unit f i l e which
formed the basis o f many of the tables in the body of this report contained
only one record per recipient household. Furthermore, that record pertained
t o a l l covered persons regardless of whether there appeared t o be mu1 t i p l e
reci pients of food stamp benefits.
V . CONCLUSION
We have noted t ha t the s e r i e s of quarterly s t a t i s t i c s on income and program
par t i c ipa t ion o r ig ina l ly publ ished by the Census Bureau contained some
I un rea l i s t i c and unrel iable est imates of the d i s t r i bu t i on of food stamp house- I holds by income class . A1 though the publ ica t ion included some ins ignif icant
f i gu re s , we a re not c r i t i c a l of the since-discontinued quar ter ly data se r ies I .
as a whole. In f a c t , t h a t data se r ies with a revised format would continue t o I be a useful reference. The format revisions would redefine the c l a s s i f i c a t i on
of food stamp cases t o avoid publication of unrel iable s t a t i s t i c s and change I the reference period to a calendar month. The l a t t e r change would have the
benef i t of providing some desperately needed controls for users of the public I
use microdata products. I This report addressed the impact of the imputation process on the re la t ionship
between the d i r ec t determinants of food stamp benefi t level s--income, uni t I
s i z e , uni t composition and earni ngs--and the benefi t l eve l s themselves.
Heeringa and Lepkowski (1986) note tha t imputation fo r a missing item may
I d i s t o r t the re la t ionship between i t and other items in the data unless
- - - I
spec i f i c controls a re imposed. We have demonstrated t h i s to be the case in
examining the re la t ionsh ip between benefi ts and the determinants of benefit 1
l eve l s in S I P P . The lack of a t t en t ion t o reported food stamp benefi ts in the I imputation of income appears to d i s t o r t the observed re1 a t ionshi p between
poverty level and benef i ts fo r the s ix percent of the unweighted sample of I food stamp households who had reported benefi ts and missing income. The f i r s t I
f i n d i n g was t h a t t h e impu ta t i on o f income t o households w i t h r epo r t ed food
stamp b e n e f i t s produced a d i s p r o p o r t i o n a t e l y h i gh number o f o u t l i e r s which
were def ined i n two ways. F i r s t , o u t l i e r s were households whose income was i n
excess of 185 percen t o f pover ty and second they were def ined as p o t e n t i a l l y
i n e l i g i ' b l e based on income. I n both cases the p r o p o r t i o n o f o u t l i e r s among
food stamp households w i t h imputed income and repo r t ed b e n e f i t s was more than
3 t imes h i g h e r than t h e p r o p o r t i o n o f o u t l i e r s among food stamp households
w i t h r e p o r t e d income and b e n e f i t s (Food Stamp Households w i t h imputed income
and repo r t ed b e n e f i t s comprised 6 percent o f t he unweighted sample o f food
stamp households whereas food stamp households w i t h r epo r t ed income and
b e n e f i t s comprise 88 pe rcen t ) .
Th i s f i n d i n g was f u r t h e r suppor ted by an examinat ion o f t he r e l a t i o n s h i p
between average b e n e f i t s and t o t a l income f o r food stamp u n i t s . S p e c i f i c a l l y
we found t h a t r epo r t ed b e n e f i t s were h i g h e r f o r t he group o f households w i t h
m i ss i ng income da ta than f o r households w i t h f u l l y r epo r t ed income. Th is
suggests t h a t t h e income nonresponding households should be poorer on average
g iven t h e i n v e r s e re1 a t i o n s h i p between income and food stamp bene f i t s .
However, a f t e r i m p u t a t i o n f o r t he m i ss i ng income amounts, t h i s group a c t u a l l y
had more in€ome. S i m i l a r l y , we found t h a t a l though t h e impu ta t i on of b e n e f i t s
p reserved t he mean, t h e average imputed b e n e f i t s were no t r e a l i s t i c when
examined s e p a r a t e l y f o r u n i t s grouped by pover ty l e v e l . We b e l i e v e t h a t
f u r t h e r d imens ion ing t h e Census impu ta t i on process f o r the re1 a t i o n s h i p
between income and means-tested b e n e f i t s would very l i k e l y reduce t he number
o f o u t l i e r s c u r r e n t l y produced by t he impu ta t i on process.
We d i d f i n d tha t the spec i f i c re la t ionship between imputed benefi ts and the . preserice o f an elder ly or disabled member was more reasonable than the general I r e l a t i onsh i ? between imputed income and reported o r imputed benef i ts . This
was a t t r i bu t ed to the use of some measure of the presence of an e lder ly member II
i n the 'imputation o f benefi ts . The spec i f i c re la t ionsh ip between the presence
of earners and average benef i ts was not qui te as reasonable leaving us w i t h
I the belief t ha t the imputation of benefi ts could be improved i f a be t t e r proxy I fo r earnings receipt was used in the imputation of benef i ts . I The fourth chapter of t h i s paper described the construction o f food stamp
un i t s within Census households. In attempting t o c rea te these uni ts a number I of problems arose with the determination of u n i t composition. Specif ica l ly ,
in an unexpectedly large number of cases, husbands and wives both reported I
being the authorized recipient of food stamp benefi ts . We a lso observed that 1 the imputations for noninterview produced instances of dupl ica te coverage of
some househol d mernbers. Finally , i t appeared that assignment of uni t composi- I t ion in s i t ua t i ons where uni t composition was missing resul ted in duplicate
coverage. As noted, however, t h i s cannot be confirmed because the pub1 ic use I
f i l e s d o n o t contain a record of the imputation of uni t composition. - - -
I -
REFERENCES
Czajka, J.L. Determinants of P a r t i c i p a t i o n i n t h e Food Stamp Program: S p r i n g 1979. Repor t t o U.S. Department o f A g r i c u l t u r e . Washington, D.C.: - Mathematics Pol i c y Research, Inc., November 1981.
Da l rymple , R. and S. Car lson. "Food Stamp P a r t i c i p a t i o n : A Comparison o f SIPP w i t h A d m i n i s t r a t i v e Records," Proceedings o f t h e Bureau o f t h e Census Second Annual Research Conference. Washington, D. C. : U.S. Bureau o f t h e Census, 1986.
Doyle, P., J. Czajka, P. B o l d i n , H. Beebout and S. H i rabayash i . "Conceptual S t u d i e s i n M i c r o s i m u l a t i o n Using SIPP." D r a f t Repor t t o t h e Food and N u t r i t i o n Serv i ce , USDA. Washington, D.C.: Mathemat ica P o l i c y Research, Inc. November 1986.
Heer inga, S.G. and J.M. Lepkowski , " L o n g i t u d i n a l I m p u t a t i o n f o r t h e SIPP". P r e s e n t a t i o n a t t h e American S t a t i s t i c a l A s s o c i a t i o n J o i n t S t a t i s t i c a l Mee t ings , Chicago, I 1 1 i n o i s . August 1986.
Kasprzyk, D. " A Review o f t h e Research and Design I ssues i n t h e Survey o f Income and Program P a r t i c i p a t i o n , " proceed ings o f t h e Survey ~ese-a rch Methods Sec t ion , American S t a t i s t i c a l A s s o c i a t i o n . Washington, D.C. : American S t a t i s t i c a l A s s o c i a t i o n , 1986.
Landa, C. " E x p l o r i n g Hypotheses t o E x p l a i n t h e Format ion o f Food Stamp U n i t s i n Households." D r a f t Repor t t o t h e Food and N u t r i t i o n Serv i ce , USDA. Washington, D.C.: Mathemat ica P o l i c y Research, February, 1987.
L i t t l e , R. J.A., " M i s s i n g Data i n Census Bureau Surveys." Proceedings of t h e Bureau of t h e Census Second Annual Research Conference. Washington, D.C.: U.S. Bureau o f t h e Census, 1986.
Nelson, P., D.B. M c M i l l e n and D. k s p r z y k . An Overview o f t h e Survey o f Income and Program P a r t i c i p a t i o n : Update 1. SIPP Working Paper S e r i e s 8401. Washington, D.C.: U.S. Bureau o f t h e Census, 1985.
U.S. Bureau o f t h e Census. Economic C h a r a c t e r i s t i c s o f Households i n t h e U n i t e d S t a t e s : Second Q u a r t e r , 1984. C u r r e n t P o p u l a t i o n Reports, Ser ies P-70, No. 4. Washington, D.C.: U.S. Government P r i n t i n g O f f i c e , 1985.
U.S. Bureau of the Census. Economic C h a r a c t e r i s t i c s o f Households i n t h e U n i t e d S t a t e s : T h i r d Q u a r t e r , 1984. Cur ren t P o p u l a t i o n Reports, Ser ies P-70, No. 5. Washington, D.C. : U.S. Government P r i n t i n g O f f i c e , 1985.
Weln iak , E.G., and J.F. Coder. "A Measure o f t h e B ias i n t h e March CPS Earn ings I m p u t a t i o n Scheme". Proceedings o f t h e Survey Research Methods S e c t i o n , America S t a t i s t i c a l A s s o c i a t i o n . Washington, D.C.: American S t a t i s t i c a l A s s o c i a t i o n , 1980. ~.
A P P E N D I X A:
S E L E C T E D T A B L E S FOR A P R I L 1984 D E R I V E D FROM S I P P WAVE 3
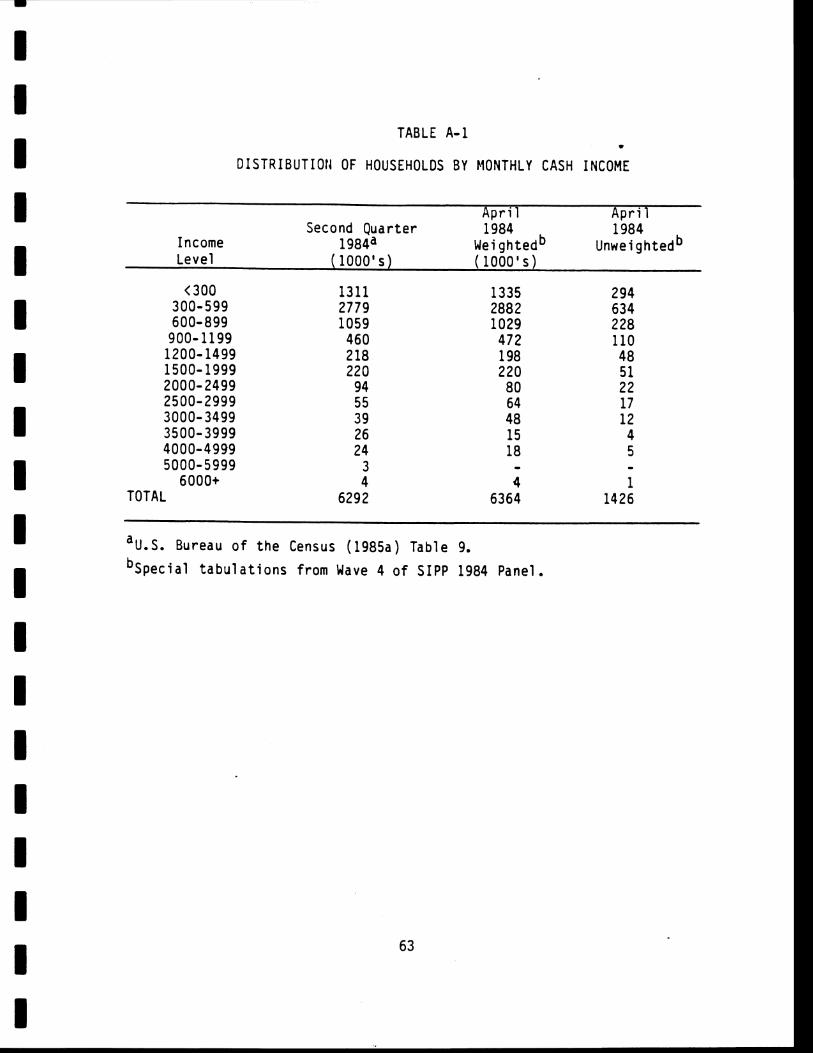
TABLE A - 1 t
DISTRIBUTION OF HOUSEHOLDS BY MONTHLY CASH I N C O M E
A p r i l A p r i 1 Second Q u a r t e r 1984 1984
Income 1 984a Wei ghtedb unweightedb Leve l ( 1000 's ) ( 1000 's )
< 300 1311 1335 294 300-599 2779 2882 634 600-899 1059 1029 228
900- 11 99 460 472 110 1200-1499 2 18 198 48 1500-1999 220 220 5 1 2000-2499 94 80 2 2 2500-2999 5 5 64 17 3000-3499 3 9 48 12 3500-3999 26 15 4 4000-4999 2 4 18 5 5000-5999 3 - -
6000+ 4 4 1 TOTAL 6292 6364 1426
a ~ . ~ . Bureau o f t h e Census (1985a) Table 9.
b ~ p e c i a l t a b u l a t i o n s f rom Wave 4 o f SIPP 1984 Panel.
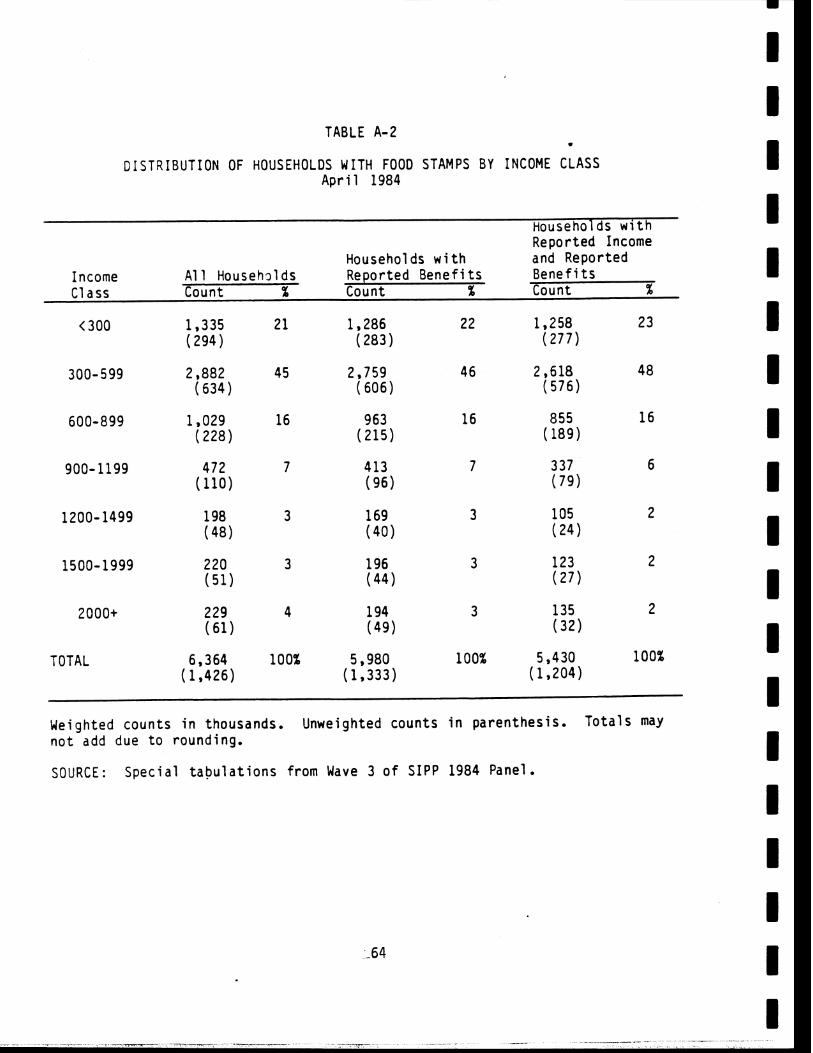
TABLE A-2
DISTRIBUTION OF HOUSEHOLDS WITH FOOD STAMPS BY INCOME CLASS Apr i 1 1984
Households w i t h Reported Income
Households w i t h and Reported Income A1 1 Househ31 ds Reported Benef i t s B e n e f i t s Class Count % Count % Count %
TOTAL 6,364 100% 5,980 100% 5,430 100% ( 1,426) (1,333) ( 1,204)
Weighted counts i n thousands. Unweighted counts i n pa ren thes is . T o t a l s may n o t add due t o rounding.
S O U R C E : Spec ia l t a b u l a t i o n s from Wave 3 o f SIPP 1984 Panel.
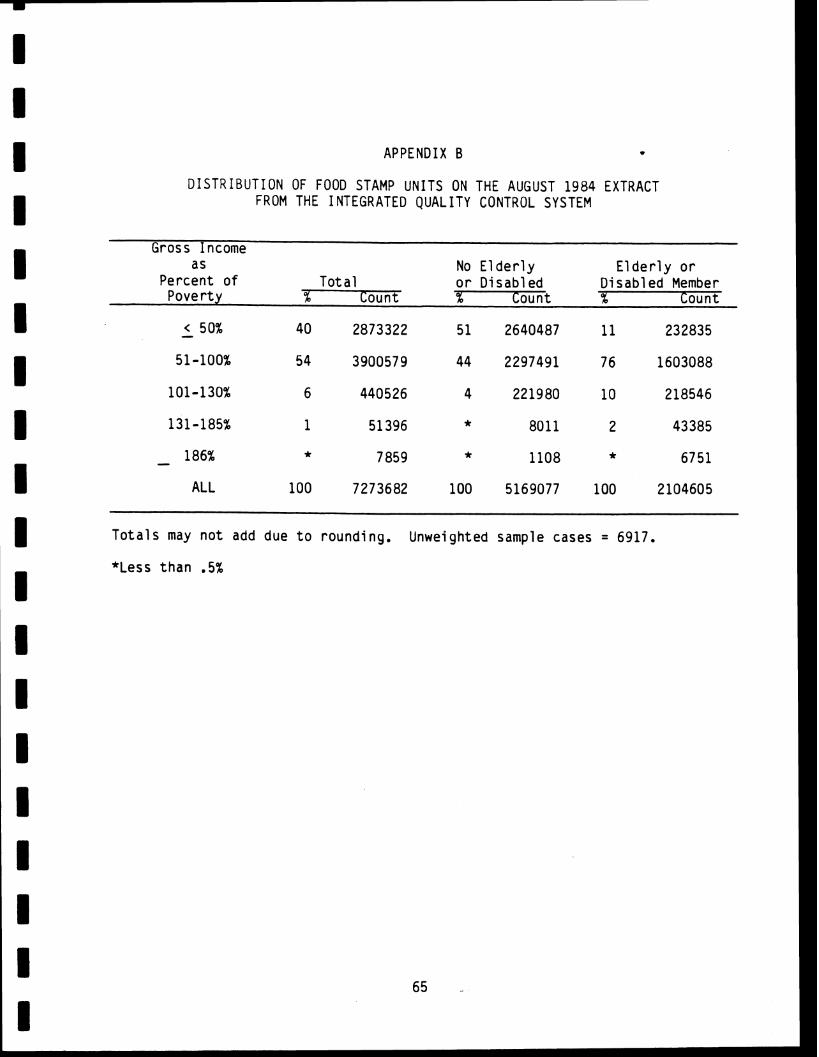
APPENDIX B . DISTRIBUTION OF FOOD STAMP UNITS ON THE AUGUST 1984 EXTRACT
FROM THE INTEGRATED QUALITY CONTROL SYSTEM
bross lncome as No E l d e r l y E l d e r l y o r
Percent o f To ta l o r D isab led D isab led Member Pover ty % Count % Count % Count
ALL 100 7273682 100 5169077 100 2104605
--
T o t a l s may n o t add due t o rounding. Unweighted sample cases = 6917.
*Less than .5%
A P P E N D I X C :
SUMMARY OF FOOD STAt.1P PROGRAM U N I T RULES
APPENDIX C: SUMHARY OF FOOD STAMP PROGRAM UNIT RULE^^
Food Stamp Prograiii r u l e s s p e c i f y t h a t t h e food stamp u n i t i s t o c o n s i s t of a l l
persons l i v i n g t o g e t h e r who c u s t o m a r i l y buy t h e i r f o o d and p repare meals as a
u n i t . Thus, i t i s p o s s i b l e f o r food stamp u n i t s c o n s i s t i n g o f persons who
c u s t o m a r i l y buy food and e a t meals a p a r t f rom o t h e r s i n t h e Census household
t o 1 e g i t i m a t e l y fo rm under Food Stamp Program r u l e s .
There a r e c e r t a i n e x c e p t i o n s t o t h i s genera l r u l e . Some r e l a t e d persons who
l i v e t o g e t h e r must be members of a common food stamp u n i t , even i f they do n o t
c u s t o m a r i l y buy food and p repare meals t o g e t h e r . Parents who r e s i d e w i t h
t h e i r c h i l d r e n must be members o f t h e food stamp u n i t t o wh ich t h e i r c h i l d r e n
be long, if one o f t h e p a r e n t s i s n o t e l d e r l y o r d i s a b l e d . C h i l d r e n under 18
who l i v e w i t h t h e i r p a r e n t s must be members o f t h e food stamp u n i t t o wh ich
t h e i r p a r e n t s belong. Spouses who l i v e t o g e t h e r must be j o i n t l y covered; and
s i b l i n g s who l i v e t o g e t h e r , i f one i s n o t e l d e r l y o r d i s a b l e d , must be members
o f t h e same food stamp u n i t . I n a d d i t i o n , persons who a r e e l d e r l y and
d i s a b l e d , and t h e i r spouses, can form a separa te f o o d stamp u n i t even if they
buy food and p repare meals i n common w i t h o t h e r household members, as l o n g as
l ~ h i s appendix i s an a t t e m p t t o summarize s i x pages o f f e d e r a l r e g u l a t i o n s w h i c h a r e e x t r e m e l y complex. As such, i t may d i f f e r i n some r e s p e c t s from t h e r e g u l a t i o n s themselves. I n these cases, t h e r e g u l a t i o n s and n o t t h e s t a t e - ments i n t h i s t e x t a r e t h e o f f i c i a l r u l e s . The r e ~ u l a t i o n s govern ing t h e f o r m a t i o n o f food stamp u n i t s a r e 7 Code Federal R e g i s t e r 273.1.
m
I I
t h e o r o q c incnme of a l l o t h e r persons w i t h whom t h e y r e s i d e does n o t exceed
165 p e r ~ e n t o f t h e p o v e r t y l i n e . 1 I
G e n e r a l l y , r e s i d e n t s of i n s t i t u t i o n s a r e i n e l i g i b l e f o r food stamps b u t the I law s t a t e s t h a t c e r t a i n group 1 i v i n g s i t u a t i o n s a r e n o t c o n s i d e r e d i n s t i t u -
t i o n s . Res iden ts of f e d e r a l l y s u b s i d i z e d hous ing f o r t h e e l d e r l y , c e r t a i n I
d i s a b l e d o r b l i n d r e c i p i e n t s o f S o c i a l S e c u r i t y a s s i s t a n c e i n sma l l group
1 i v i n g s i t u a t i o n s , temporary r e s i d e n t s o f n o n p r o f i t she1 t e r s f o r b a t t e r e d
I women and c h i l d r e n , and a d d i c t s o r a l c o h o l i c s i n c e r t a i n r e s i d e n t i a l t r e a t m e n t I programs a r e n o t c o n s i d e r e d r e s i d e n t s of an i n s t i t u t i o n , Such i n d i v i d u a l s a r e
c o n s i d e r e d households f o r food stamp purposes ( i .e. f o ~ d stamp u n i t s ) . I
E l d e r l y o r D i s a b l e d Persons i n t h e Household I The presence o f e l d e r l y o r d i s a b l e d persons i n a food stamp household does n o t
guarantee t h e e x i s t e n c e o f a food stamp u n i t c o n s i s t i n g o f a subset of t h e I
r e s i d e n c e i n t h e d w e l l i n g b u t i t does i n c r e a s e t h e l i k e l i h o o d t h a t such food
stamp u n i t s w i l l be formed.
I I I
'1n a d d i t i o n , t h e r e a r e c e r t a i n Census household members who cannot be covered ( by food stamp b e n e f i t s , i n c l u d i n g : i n e l i g i b l e a l i e n s , persons who f a i l t o p r o v i d e s o c i a l s e c u r i t y numbers, person who have i n t e n t i o n a l l y v i o l a t e d Food Stamp Program r u l es, persons v i o l a t i n g employment and t r a i n i n g program o r w o r k f a r e r u l e s , c e r t a i n c o l l e g e s t u d e n t s who a r e between 18 and 60 y e a r s of age, and SSI r e c i p i e n t s i n cash-out s t a t e s . F u r t h e r , roomers, and l i v e - i n
I a t t e n d a n t s cannot be long t o focd stamp u n i t s w i t h o t h e r s i n t h e household, bu t t h e y can fo rm a food stamp u n i t o f t h e i r own. F i n a l l y , a boarder can be c o n s i d e r e d a member o f a household t o whom he o r she i s pay ing board a t the h o u s e h o l d ' s r e q u e s t , b u t cannot fo rm a s e p a r a t e food stamp u n i t . A lso ,
I boarders i n commercia l b o a r d i n g houses a r e n o t e l i g i b l e f o r food stamps. I
7 G I
. - - - - I
L
As noted above, persons who are e l d e r l y and d isabled and t h e i r seouses can
form a separate food stamp u n i t even i f they ea t together w i t h others i n the
household because they are unable t o prepare meals on t h e i r own as lof ig as the
gross income of o thers i n the household does not exceed 165 percent o f t he
pover ty l i n e . I n add i t i on , households which con ta in e l d e r l y o r d isabled
persons who 1 i v e w i t h t h e i r a d u l t c h i l d r e n or a s i b l i n g can form food stamp
u n i t s i f the e l d e r l y o r d isabled persons buy t h e i r food o r prepare t h e i r meals
apa r t from o the r members of the household. I n the former case, one o f the
u n i t s must cons i s t of the e l d e r l y o r d isabled person and h i s o r her spouse.
I n the l a t t e r case, the food stamp u n i t may no t necessar i l y conta in the
e l d e r l y o r d isab led member, i t may be t h a t only res idua l household members are
covered under food stamps.
It i s important t o note t h a t i t i s poss ib le t h a t households w i t h e l d e r l y o r
d isab led persons may no t form food a stamp u n i t c o n s i s t i n g o f a subset of the
res idents . Unless there i s a person i n the household who i s e l d e r l y - and
disabled, a household which has e l d e r l y and/or d isab led persons cannot have
uncovered members o r m u l t i p l e u n i t s unless there are persons who buy food and
prepare meals separately. Even i f the e l d e r l y o r d isab led persons i n the
household buy food o r prepare meals apar t from others i n the household, they
must be j o i n t l y covered w i t h t h e i r spouse o r c h i l d r e n under the age of 18 if
the spouse o r c h i l d r e n are present i n the household. I f the household
cons i s t s e n t i r e l y o f an e l d e r l y o r d isabled person p lus t h a t person's spouse
o r under-18 ch i l d ren , a t most one food stamp u n i t can l e g i t i m a t e l y e x i s t and
t h a t u n i t must be the e n t i r e household. Even e l d e r l y - and d isab led persons
m u s t he covered w i t h t h e i r spouses; so t h a t i f the household cons is ts s o l e l y
o f an e lderly and d isab led person and t h a t person's spouse, a t most one food
stamp u n i t can l e g i t i m a t e l y e x i s t and t h a t u n i t must be t h e e n t i r e household.