Embed Size (px)
Citation preview
Concrete Science and Engineering 1, pp. 45-64, March 1999.
The Surface Area of Hardened Cement Paste as Measured by Various Techniques
Jeffrey J. Thomas*, Hamlin M. Jennings*†, and Andrew J. Allen‡
*Departments of Civil Engineering and †Materials Science and Engineering, Northwestern University, Evanston, IL, and the ‡National Institute of Standards and Technology, Gaithersburg, MD.
Hydrated cement paste has a high specific surface area due almost entirely to the calcium-silicate-hydrate reaction product. The surface area of cement paste is closely related to many crucial properties, including strength and permeability, and is therefore a useful predictive measurement. It is also a useful parameter for studying the nature of the calcium-silicate-hydrate gel itself. Unfortunately, the surface area of cement paste is difficult to measure accurately, and different techniques have given widely varying values. This review discusses these different techniques, summarizes the surface area results given by each, and attempts to rationalize the differences in these results by considering the different physical principles by which each technique generates a surface area value.
I. Introduction The surface area of a porous material, as given by the total internal boundary between the solid phase and the pore system, is one of the most useful microstructural parameters for defining its properties. For example, given a known total porosity, the surface area gives a measure of the fine pores present, and indicates the potential for reactions between solid phases and intruded active species. In the case of disordered porous microstructures such as occur in cement paste and concrete, measurement of the total surface area can give an indication not only of the fineness of the microstructure, but also of the tortuosity of the pore phase, and hence of the permeability. Hardened cement paste, which is the ubiquitous product formed upon mixing cement and water, is the main ingredient of concrete - the world's most widely-used manufactured material. Cement paste possesses a reactive porous microstructure known to contain a high internal surface area, and a reliable measure of the surface area, as a function of the hydration time and conditions, should provide important diagnostic information on the evolution of the properties as hydration proceeds. However, the microstructure of cement paste is quite complex, containing several reaction products as well as unreacted clinker grains and porosity, and measuring a definitive value of surface area for cement paste is beset with several difficulties. One major challenge to the measurement of surface area in hydrating cement paste arises from the heterogeneous microstructure involved, and the very wide length-scale range applicable (from a few nanometers to tens of micrometers). Mindess and Young [1] have classified cement paste pores by size, and Table I lists the different size ranges and the properties influenced by each. It should be emphasized that there is considerable overlap in both the size range and role of the different pore types [2]. While this pore scheme has proved useful in cement paste and concrete microstructure characterization, much recent evidence suggests that the fine pore space in and around the C-S-H should not be considered simply as 'inert' voids (of various shapes) within a monolithic solid phase.
1
Concrete Science and Engineering 1, pp. 45-64, March 1999.
The interaction of the pore water with the C-S-H∗ means that the nature of the pore water and the structure of the fine pore space (not just interlayer porosity) are intimately related to the structure and properties of the 'solid' C-S-H. In this connection, several authors have pointed out the approximately fractal, or scale-invariant, nature of the microstructure of hydrated cement paste, both in the solid/pore mass distribution [3] and in the roughness of the surface at the pore/solid interface [4]. The measured surface area can be greatly influenced by the detectable roughness as well as by the pore sizes accessed. While fine features inevitably dominate the total surface area value, the amount and distribution of larger features is also of interest. For example, the strength and toughness of a set cement is determined primarily by the amount of coarse porosity [1]. Therefore, methods such as mercury intrusion porosimetry , which do not measure surface in the finest pores, remain useful in engineering research. In any case, for a given technique it is important to consider what part of the microstructure is being assessed, and how this relates to the properties of interest. Another difficulty associated with determining the surface area of cement paste is the problem of defining the internal boundary between the solid phase and the pore system. The primary reaction product in cement paste is the C-S-H gel, which is a mostly-amorphous calcium silicate hydrate phase, of variable composition, which forms from the hydration of alite (impure C3S) and belite (impure C2S), the two main constituents of unhydrated cement. The C-S-H phase contains a network of very fine pores called gel pores (see Table I), giving it an extremely high specific surface area, and making the total surface area of a given cement paste essentially determined by its C-S-H gel content. The surface area of the C-S-H gel is quite variable, with a conservative value being 200 m2/g. To put this in perspective, the specific surface area of (unhydrated) portland cement powder is less than 1 m2/g, while the surface area of a fine silica fume with an average particle size of 100 nm has a surface area of around 20 m2/g [5]. In addition to the water in the gel pores, the solid C-S-H phase also contains chemically bound water as part of its internal structure. This creates a basic uncertainty in defining the boundary between solid and pores from which a surface area value should be derived, and it is important to differentiate between gel pores, which contribute to the true surface area, and features within the internal structure of the solid C-S-H, which do not. Thus, some experimental methods may miss some of the true surface area, while other methods may measure what is effectively too much surface area. The nature of the C-S-H gel affects surface area measurements in other ways. The surface area of cement paste increases with hydration time, as more of the C3S and C2S react to form C-S-H. However, the surface area of a given cement paste is not necessarily proportional to the amount of C-S-H it contains. The surface area per gram of C-S-H in a cement paste can vary widely depending on many processing variables, including the cement composition, the reaction temperature, and the water-to-cement ratio (w/c). For example, the surface area of the C-S-H phase tends to be higher when the w/c is higher (although water sorption surface measurements are an exception, as discussed later). Such an increase strongly indicates that the C-S-H gel does not form with a fixed microstructure, but adapts its morphology to the physical surroundings. Microscopists have long observed what appear to be two different types of C-S-H in cement paste, a dense form which forms near the clinker grains and a less-dense form which grows outward into the pore structure [e.g. 6]. These two morphologies are often called "inner product" and "outer product," or, as has more recently been proposed, phenograins and groundmass [7]. It is tempting to assume that the less-dense form of C-S-H contains most or all of the gel pores not associated with the C-S-H internal structure, and that this phase is the primary contributor to the total surface area [8], although as of yet there is no direct evidence of this. Another important consideration for interpreting surface area is the condition of the sample during the measurement. Some techniques, notably gas sorption, require drying of the specimen prior
∗ Cement chemistry notation: C=CaO, S=SiO2, H=H2O.
2
Concrete Science and Engineering 1, pp. 45-64, March 1999.
to surface area measurement. Removal of the water from the microstructure is likely to cause significant structural changes, such as shrinkage or collapse of the gel pores, and it is of major concern to consider how a surface area determined using a method that requires a drying pre-treatment relates to the "equivalent" surface area for the undisturbed (saturated) microstructure. For values of surface area obtained from different techniques to have any comparative significance, details of the sample preparation must be carefully monitored and controlled, and the surface area values must be normalized to the same units. For comparison purposes and in common with general practice in cement research, we have normalized surface values in this paper to the surface area per unit weight of D-dried paste (ground paste equilibrated to a water vapor pressure of 0.5 µm of Hg). However, it may be that surface area values would make more physical sense if normalized to unit weight or volume of saturated cement paste. Despite the difficulties associated with measuring and interpreting the surface area of cement paste, it is clear that this material parameter provides a particularly valuable way of characterizing the C-S-H phase. Several different techniques have been used to measure the surface area of cement paste, including gas sorption typically with either water or nitrogen, mercury intrusion porosimetry (MIP), small-angle scattering using both x-rays (SAXS) and neutrons (SANS), and nuclear magnetic resonance (NMR). Each of these techniques measures the surface area of the C-S-H gel pores using different physical principles. Unfortunately, each technique also gives different surface area values, although the ranges of values for some techniques overlap. It should be mentioned that some of these methods have been used to evaluate the microstructure of cement paste for some time, but have only recently been focused specifically on surface area measurement. In this paper, all of the above-mentioned techniques will be discussed in some detail with the exception of MIP, which is not sensitive to the smallest pores and therefore measures a much lower surface area than other techniques. For each technique, the physical principles used to measure surface area are explained, and the methods and assumptions used to obtain a surface area value from the raw experimental data are outlined, together with the uncertainties involved. The surface area results reported in the literature for the technique are summarized, including the overall range of values and the effects of parameters such as w/c and age, if known. The various techniques and results are discussed in relation to the issues addressed above, and some explanations are offered for the different surface area values obtained. By combining surface area measurement with other more comprehensive microstructural characterization, and with thermodynamic models for cement hydration, we illustrate how the different surface area methods might be used together to develop new insights into microstructural development during cement hydration. 2. Specific surface area normalization Each surface area technique normalizes the specific surface area differently. Gas sorption measures surface area per weight of dried paste, small-angle scattering results are per unit sample volume, and NMR results are generally reported per weight of starting cement powder. Occasionally results are reported per weight of ignited paste in order to normalize the values obtained after different drying methods. More recently, some surface area results have been reported per weight of dried C-S-H. Table II illustrates the effect of the normalization on the numerical value of the surface area by showing the change in the magnitude of a surface area value as it is converted into different units. Clearly, it is difficult to compare the results from different techniques unless the values are first converted to the same normalization. However, this is often not as simple as multiplying by a constant factor. For example, as a paste hydrates, the weight of original cement powder, the total volume, and the weight of ignited paste all remain relatively constant, but the weight of dried paste increases as more non-evaporable water is bound into the structure. Similarly, as the w/c increases, the specimen volume associated with a given weight of dried paste or starting cement powder increases.
3
Concrete Science and Engineering 1, pp. 45-64, March 1999.
It has been suggested [9] that surface area results should be reported per weight of C-S-H, since this is the phase which contributes to the high surface area. This makes good physical sense, but it presents some additional problems. The weight of the C-S-H in a paste depends on the drying condition, so this would have to be standardized. A more serious problem is in accurately determining the amount of C-S-H in a cement paste. This is notoriously difficult because of the amorphous structure and lack of constant composition, as has been discussed by Taylor [10]. For the purposes of comparison, hydration models can be used to estimate the amount of C-S-H in a paste with reasonable accuracy. As was originally shown by Powers [11], it is possible to predict the volumes of different phases in a cement paste based on the cement composition, degree of hydration and w/c. Combining this model with the Avrami-type model for the hydration kinetics developed by Taylor [12], it is possible to predict the amounts of the major phases in cement paste as a function of the starting composition of the cement, the w/c, and the age [9]. This approach can be used to estimate such parameters as the amount of C-S-H in a paste and the density of a paste after D-drying (see Figs. 1 and 2), allowing one type of specific surface area units to be converted to another. One obvious difficulty with this approach is that results reported in the literature often do not include the composition of the OPC or even the exact age of the specimens. However, using the models mentioned above, it is usually possible to make a first approximation conversion from one type of units to another for the purposes of comparing the results of different techniques. In this paper, wherever needed, surface area results are converted to a basis of grams of D-dried paste using this approach. These units were chosen because they are the most familiar cement paste surface area units, not because they are the most physically useful or the easiest to use. In fact, the properties of a cement paste are probably controlled more by the surface area per weight or volume of saturated paste. While some gas sorption results are reported per gram of ignited paste, in many cases, the weight loss on ignition is also given, allowing the results to be converted to grams of dry paste. If not, the conversion can be estimated using reported weight loss on ignition found by other researchers. Reported results for percent weight loss on ignition as a function of age are shown in Fig. 3; the loss on ignition was not found to vary with w/c [13,14]. 3. Gas Sorption Gas sorption is the oldest and most widely-used technique for measuring the surface area of cement paste, and it is also by far the technique with the most published results. The physics and applications of gas sorption techniques are covered in a book by Gregg and Sing [15], and a comprehensive review of the application of the gas sorption method to cement paste has been written by Rarick et al. [16]. The basic concept behind the gas sorption technique is to adsorb a monolayer of gas molecules onto the internal surface of a material. The surface area is then given by
S = Nmσ
m (1)
where S is the specific surface area, Nm is the number of gas molecules in one monolayer, σ is the cross-sectional area of a gas molecule, and m is the mass of the specimen. An important characteristic of this technique is that the specimen must be pretreated to remove all adsorbed gas molecules and the subsequent measurement must be performed starting in a vacuum. For cement paste, this requires removing the water from the C-S-H gel pores - a major disadvantage because of the resulting changes to the C-S-H gel structure.
4
Concrete Science and Engineering 1, pp. 45-64, March 1999.
A gas sorption measurement is conducted by slowly introducing the sorptive gas into a chamber containing the specimen and measuring the change in either the pressure or the sample weight. From these data, a plot of gas adsorbed versus pressure, or sorption isotherm, is obtained. In some cases the corresponding desorption isotherm is also measured to look for possible hysteresis effects. There are two general methods of obtaining an isotherm. In both cases, the specimen is first treated to remove adsorbed gas molecules and then placed into an evacuated specimen chamber. The gravimetric method involves measuring the weight increase of the specimen as the pressure of the sorptive gas is incrementally increased, to determine how much gas is adsorbed. A more complex and powerful method is the volumetric method. With this method, the sorptive gas is introduced into a manifold of known volume. The manifold is then exposed to the specimen chamber and allowed to equilibrate, and then it is isolated and the amount of gas adsorbed by the specimen is calculated from the ideal gas law. This process is repeated many times to obtain the isotherm. The volumetric method is normally performed by automated instruments which can determine sorption and desorption isotherms with excellent resolution. Once the experimental isotherm is obtained, further analysis is needed to determine the amount of gas required to form one monolayer of adsorption, and thus the surface area. The shape of the isotherm depends on the nature of the sorptive gas and on the type of material being measured. The heat of adsorption of the sorptive gas determines the type of adsorption that occurs. If the heat of adsorption is high, the molecules will adsorb nearly a complete monolayer before starting the next layer, while if the heat of adsorption is low there will be a "piling" effect as some of the molecules are adsorbed on top of partially formed layers. Pores which have entrances that are smaller than the pore diameter (so-called "bottleneck" pores), have a tendency to fill completely because of the concave shape of the adsorbed gas layer. This phenomenon, known as capillary condensation, creates a hysteresis in the adsorption/desorption cycle because a pore which has been completely filled by capillary condensation is more difficult to empty on desorption. Analyzing the sorption isotherm to determine the surface area requires making some assumptions about the system. By far the most common method was derived by Brunauer, Emmet, and Teller [17] and is called the BET method. In fact, a surface area measurement performed by gas sorption is commonly called a "BET measurement." By assuming that the heat of adsorption is constant throughout the formation of the first monolayer and that the heat of adsorption for subsequent monolayers is equal to the heat of condensation of the bulk liquid, they were able to derive a relationship between the relative pressure of the gas and the volume adsorbed per unit specimen mass which allows the surface area to be calculated from the multilayer adsorption region of the isotherm. The standard BET equation can be written as
Prel
V 1− Prel( ) = 1
VmCBET+
Prel CBET −1( )VmCBET
(2)
where Prel (= P/P0) is the pressure of the gas in equilibrium with the specimen, P, relative to the saturation vapor pressure, P0, V is the amount of gas adsorbed at pressure P, CBET is a constant, and Vm is the amount of gas required for a monolayer of coverage. The surface area, S, of the specimen can then be calculated from Vm by substituting Nm = Vm/v in eq.1, where v is one molecular volume. An important aspect of gas sorption measurements is selection of the sorptive gas. In addition to the heat of adsorption mentioned above, important factors to consider are the size of gas molecule, the polarity of the gas molecule, and the chemical reactivity between the sample and the gas. In general, the smaller the gas molecule the higher the surface area measured, because smaller molecules are better able to align themselves to cover a rough surface. In addition, if there are pores which have openings in the size range of the gas molecules, then smaller molecules can measure a considerably higher surface area. Polar molecules can cause difficulties in measuring surface area because they can
5
Concrete Science and Engineering 1, pp. 45-64, March 1999.
align themselves in more than one way on a surface, making the effective cross-sectional area difficult to determine. Finally, if the molecule reacts with the specimen, or is absorbed by the specimen, the validity of the measurement will be compromised.
3.1 Application of gas sorption to cement paste As mentioned in the above section, one of the drawbacks of the gas sorption technique for measuring the surface area of cement paste is the requirement that the specimen be dried. There are two general problems associated with the drying pretreatment. First, any gel pores which remain filled with water will not be accessed by the adsorbate molecules and will not be included in the surface area measurement. The smallest pores are the most difficult to empty of water, but they also have the highest relative surface area. In addition, it has often been suggested that the drying process destroys or alters the C-S-H structure, causing gas sorption measurements to measure too low of a surface area even after adequate drying. In general, colloidal materials collapse and are damaged on drying, and various techniques have been developed to preserve their structure. For cement paste, the simplest techniques for removing the water in preparation for a gas sorption measurement are oven drying at 105˚C or vacuum drying using a rotary pump [16]. Although these techniques effectively remove all of the pore water, they were felt to be too damaging to the specimen, and gentler drying techniques have been developed. The most common drying method, D-drying [18], involves equilibrating the specimen to the pressure of water vapor at the temperature of dry ice (-78˚C), which is close to 0.5 µm of Hg. A similar technique, called P-drying [19], involves equilibrating to the water vapor pressure of a mixture of the hydrates of Mg(ClO4)2, which is 8 µm of Hg. In both cases the drying is done using a rotary pump. Another technique used to prepare cement paste specimens for gas sorption is solvent exchange. Before drying, the specimen is placed into a bath of high-vapor-pressure solvent such as methane or pentane, thus allowing the pore water to exchange with the solvent. The specimen is then dried using a standard method such as D-drying. Solvent exchange results in significantly higher gas sorption surface area values. Gas sorption surface area measurements of cement paste are normally conducted using either water vapor or nitrogen as the sorptive gas. Because equilibrium is approached very slowly, measurements of cement paste surface area using water vapor are conducted using a variation of the gravimetric method. This involves exposing the specimen to a series of desiccators containing salt solutions with different water vapor pressures. Nitrogen surface area results are obtained using the volumetric method described in the previous section. Unfortunately, the surface area values of cement paste measured by nitrogen and water vapor sorption are usually quite different. This is discussed further below. 3.2 Surface area results from gas sorption The surface area of well-hydrated cement paste as measured using water vapor, denoted as SH2O, is remarkably consistent at about 200 m2/g of dry paste [20,21,22]. The surface area obtained using nitrogen, SN2, is normally much lower and is much more variable [16]. More results have been reported from nitrogen BET than any other technique, and the range in values for SN2 is disturbingly large. In the book by Taylor [10], the "typical range" of SN2 for mature OPC paste is given as 10-150 m2/g of dry paste, but even higher results have been obtained after solvent exchange. As shown in Table III, when SH2O and SN2 are measured for mature, D-dried pastes of different w/c the results are quite contradictory [23]. While SH2O is nearly constant, SN2 increases dramatically with w/c. It should be noted that if these results are converted to a basis of hydrated paste volume, the increase in SN2 with w/c would be less dramatic and SH2O would decrease with increasing w/c. The
6
Concrete Science and Engineering 1, pp. 45-64, March 1999.
effect of the specific surface area normalization on how the w/c affects results will be discussed further later. The results shown in Table III clearly illustrate both of the major issues associated with the interpretation of gas sorption surface area measurements of cement paste: the higher values obtained when measuring SH2O and the larger variation obtained when measuring SN2. The largest area of controversy involves the reason for the difference between SH2O and SN2, which was the subject of a vigorous debate in the literature in the 1960s and early 1970s. After D-drying, gas sorption using water vapor invariably measures a higher surface area than does nitrogen, and the magnitude of the discrepancy between SH2O and SN2 suggests that the difference is due to more than just the modest difference in their molecular sizes. Table IV shows the effect of sorptive gas size on the measured surface area of the same cement paste [23]. The surface area increases modestly with decreasing cross-sectional area except for the large increase in surface area associated with water. To explain this, one school of thought proposed that the smaller size of the water molecule allowed it to fully penetrate the C-S-H structure and measure the full surface area. Proponents of this point of view suggested that C-S-H contained many "ink-bottle" gel pores with entrances of a size that allowed water molecules to enter while excluding nitrogen [24,25]. Another school of thought argued that water vapor was structurally incorporated or re-absorbed into the C-S-H interlayer spaces during the measurement, causing the water vapor results to be too high [26]. The differences between SH2O and SN2 have been the basis for many of the conceptual models devised over the years to explain the structure of the C-S-H gel. The Powers-Brunauer model [24,25] considers C-S-H to consist of colloidal particles, each containing a few closely-bonded structural layers, which are randomly arranged in a way that allows water vapor, but not nitrogen, to penetrate all of the interparticle spacings and measure the correct surface area. The Feldman-Sereda model [26] also considers the basic structural unit of C-S-H to be a layer, but instead of forming particles, the layers are distributed randomly so that occasional "interlayer spacings" form throughout the C-S-H gel, creating a high surface area. According to this model, water vapor can move reversibly in and out of these interlayer spacings, which distorts the surface area measurements made with water, and thus it is nitrogen which provides the more accurate measure of surface area. The Munich model [27] is a physical model which considers C-S-H to be made up of discrete particles bonded together by van der Waals forces, with a bonding strength strongly affected by moisture content. As with the Feldman-Sereda model, this model predicts that water vapor interacts with the C-S-H structure, making it unsuitable for a surface area measurement. The debate over the relative merits of SN2 and SH2O has never been conclusively resolved, although nitrogen BET has become the standard measurement technique for cement paste, at least in part because of the availability of automated equipment for measuring the BET surface area of specimens that require compressed tanks of the sorptive gas. The large variation in reported values of SN2 has not received as much attention as the discrepancy in the average values of SN2 and SH2O, but it is of considerable concern. Many researchers have been unable to reproduce the SN2 results of others even when duplicating their specimen preparation conditions. The largest source of variation in SN2 is the drying technique. Table V shows the value of SN2 obtained after various drying treatments; the values have been converted to a basis of D-dried paste [28]. The first three entries in Table V illustrate the increase in SN2 as stronger drying treatments remove more water from the paste. The extremely high surface area after solvent exchange suggests a more complex relationship between drying and SN2, however. The w/c of the paste also causes a large variation in SN2, as discussed above, as does the age of the paste. Figure 4 shows the variation in SN2 with age for cement pastes with w/c=0.5 and w/c=0.33 [13]. The lower w/c specimen reaches a maximum and final surface area value by 28 days, while the higher w/c specimen continues to increase in surface area out to 180 days. This behavior has been reported by others [29], and has been interpreted as indicating that once the available space has been filled with product, the surface area has reached its maximum value even though hydration may
7
Concrete Science and Engineering 1, pp. 45-64, March 1999.
continue [13]. The development of SH2O with age was explored for C2S and C3S pastes, and the surface area was found to increase continuously with the degree of hydration [30]. Given the high intrinsic surface area of the C-S-H phase, with its nanometer-sized gel pores, it seems reasonable to state that the SN2 of a mature cement paste with a moderate w/c should not be lower than about 30 m2/g. It is now clear that most of the values on the lower end of the SN2 range are probably in error. It was recently observed [31] that carbonation of cement paste causes a dramatic decrease in SN2, and that cement paste that is ground and dried in preparation for a BET surface area measurement is susceptible to carbonation over time even if stored in a sealed plastic container [32]. It is therefore quite tempting to ascribe some of the apparently random variation in SN2 to carbonation, particularly the lowest values. It is not known whether SH2O is affected by carbonation. The highest values of SN2 are obtained after solvent exchange (see Table V). These high values of SN2 were originally interpreted as indicating that the removal of a high-vapor-pressure solvent from the smallest pores was much less damaging to the C-S-H gel than removal of water by straight D-drying [28]. However, small-angle scattering measurements of cement paste using both x-rays [14] and neutrons [33] have shown that the surface area and the C-S-H gel structure are fully recovered upon rewetting a D-dried specimen. Another interpretation is that D-drying does not empty out the smallest gel pores unless the pore water is replaced with solvent. Whatever the cause or causes of the variation in surface area with drying technique, interpretation of the results has been made more difficult by the lack of details describing specimen preparation in much of the early literature [16]. Eventually the importance of the specimen preparation method on the SN2 values obtained was recognized, and straight D-drying became the standard drying technique for BET surface area measurements of cement. Perhaps the most intriguing aspect of solvent exchange is that the difference in magnitude between SN2 and SH2O nearly disappears. However, as noted by Litvan [28], both SH2O and SN2 vary widely depending not only on the solvents used but also on other experimental factors such as drying rate and drying temperature, and one could easily conclude that there is not a single correct gas sorption surface area value for a given cement paste, but that the value will always depend on the drying treatment. The Jennings-Tennis model [9] was devised as an attempt to reconcile that variation in SN2 which was not associated with the drying technique used (only D-drying was considered). Given the age, w/c, and OPC composition, the model accurately predicted the resulting SN2 after D-drying [9]. The model proposed that the pore space of a given cement paste microstructure can be divided into two regions with fixed volumes, one that nitrogen can penetrate and one that it cannot. C-S-H is modeled as being made up of particles of a fixed size which can exist in either region. As the w/c increases, more of the C-S-H "particles" are assigned to the nitrogen-accessible box, and SN2 increases. This model, although somewhat unphysical, does explain one surprising trend in the literature which had not been previously discussed: the observation that, after the capillary pore volume is subtracted, the apparent gel pore volume measured by nitrogen decreases as the surface area increases. In trying to decide whether the surface area of cement paste is better measured using nitrogen or water vapor, several factors should be considered. First and foremost, it should be kept in mind that the drying treatment required for a gas sorption measurement may affect the C-S-H gel to the extent that the magnitude of the surface area obtained is invalid regardless of the sorptive gas used. Even so, this does not mean that gas sorption should not be used to investigate the effects on surface area of important variables such as w/c, age, cement composition, and additives. For this type of application, nitrogen BET results are considerably more interesting in that they seem to vary in a meaningful way with w/c and other factors. Water vapor results are independent of w/c (see Table III), and in light of the possibility that the surface area comes only from the less-dense form of C-S-H which fills the capillary porosity, it could be argued that this makes SH2O results somewhat suspect.
8
Concrete Science and Engineering 1, pp. 45-64, March 1999.
In the end, practical concerns may have decided the issue of SN2 versus SH2O. Measuring an experimental isotherm using water vapor is quite cumbersome in comparison with an automated nitrogen BET measurement, and from the literature it appears that gas sorption using water is no longer performed. 4. Small-Angle Scattering (SANS and SAXS) Small-angle scattering is a powerful tool for characterizing complex micro-structures. An intense beam of either neutrons (SANS) or x-rays (SAXS) is passed through the specimen, and a small component is scattered out of the incident beam direction by interactions with microstructural features within the bulk of the material. A schematic of a conventional pinhole-geometry SANS experiment is shown in Fig. 5. For cement paste and similar porous materials, the resulting scattering profile, which is the intensity of scattered neutrons or x-rays as a function of scattering angle, is effectively a form of Fourier transform of the solid/pore microstructure. It can be used to determine, for example, size distributions and volume fractions of microstructural features, fractal components within the microstructure, and the total surface area. Because SANS and SAXS operate on the same physical principle (diffraction), they are discussed together in this section, but some important differences between the two techniques do exist. Principally, almost all SANS measurements to date have been made using the configuration shown in Fig. 5 with a pinhole geometry, while a large proportion of SAXS studies have been carried out using a slit geometry , in which the scattered intensity is measured as a function of the scattering angle perpendicular to the source slit, and the data are line-smeared over a large angular range parallel to the source slit. Traditionally, the major challenge in applying small-angle scattering methods has been in interpreting the scattering data in terms of the sometimes complex underlying microstructures that give rise to it. Until about 15 years ago it was not possible to interpret fully the scattering profiles obtained from complex materials with highly disordered microstructures, such as cement paste. The relatively recent discovery that the microstructure of cement paste contains fractal (scale invariant) properties over large parts of the size range has greatly increased the amount of useful microstructural information obtainable from small-angle scattering. The interpretation of SANS scattering data from highly disordered materials such as cement paste has been reviewed by Allen [34]. In this, and other papers, it was concluded that the primary source of the scattering in cement paste is the C-S-H gel structure. Furthermore, much of the C-S-H, for which a high surface area can be measured, is in the form of a disordered fractal structure, the open spaces of which actually comprise the so-called "gel porosity" and, perhaps, part of the "capillary porosity" as well. Small-angle scattering is an ideal technique for characterizing cement paste because specimens can be studied in their saturated state, thus avoiding possible problems associated with drying the C-S-H gel (discussed in the previous section). If the neutron flux is sufficiently high, experiments can be repeated continuously on the same specimen as it hydrates; such real time investigations of early cement hydration have provided valuable information about the kinetics and the microstructure development during early hydration [35,36] Neutrons are scattered by interactions with atomic nuclei, while x-rays are scattered by interactions with outer shell electrons. However, in both cases the scattering occurs at interfaces between two phases, and the data analysis for the two techniques is similar. In cement paste systems the scattering of both x-rays and neutrons is dominated by the interface between C-S-H and the pore medium (water or air). Another difference between SANS and SAXS is that the wavelength of the x-rays used is typically up to one order of magnitude smaller than neutron wavelengths. SAXS experiments generally use either Cu Kα or Mo radiation (wavelengths 0.154 nm and 0.071 nm, respectively), or
9
Concrete Science and Engineering 1, pp. 45-64, March 1999.
radiation of a similar wavelength at a synchrotron facility. SANS experiments on cement paste typically use “cold neutron” wavelengths of 0.5 - 0.8 nm. In this connection, the shorter the wavelength, the smaller the microstructural features that can cause scattering at a given scattering angle. However, in either SANS or SAXS studies, the effective maximum scattering angles, and associated minimum dimensions studied, are determined by the signal-to-noise ratio as the small-angle scattering signal decays away with increasing scattering angle. Reported SAXS surface areas are significantly higher than SANS surface areas, and it has been suggested that this difference is due to the x-rays "seeing" more of the fine C-S-H structure. However, before SANS and SAXS results can be compared directly, it is important that the methods of data analysis used to obtain the surface area values be understood. The methods of determining the surface area of a specimen from its small-angle scattering profile are discussed in detail in the next section. 4.1 Determining surface areas by small-angle scattering The raw experimental data from a conventional small-angle scattering experiment consist of the two-dimensional (2-D) scattered intensity distribution of neutrons or x-rays after passing through the specimen, as registered on the instrument’s position-sensitive detector (see Fig. 5). For a specimen with no preferred orientations (such as cement paste), the 2-D data can be circularly-averaged to give the scattered intensity as a function of the scattering angle, Φ. For slit-geometry SAXS experiments, the line-smeared raw data can be desmeared using algorithms that generally assume a microstructure with no preferred orientation. After subtraction of the “empty-beam” background, the scattering intensity is absolutely-calibrated with respect to a scattering standard sample, or , sometimes, by an absolute geometric calibration with respect to the incident beam. Note, however, that in many SAXS measurements of the surface area of cement paste, the absolute calibration step has been by-passed by using an alternative method to extract the surface area, as is discussed below. Finally, the sample flat-background incoherent scattering can be subtracted out to give the absolute macroscopic differential small-angle scattering cross-section, dΣ/dΩ, versus Q, where Q is the scattering vector given by:
Q =4πλ
sin Φ2( ) (3)
and λ is the neutron or x-ray wavelength. The macroscopic differential scattering cross-section, dΣ/dΩ, is defined as the probability, per unit time and per unit incident flux (also a rate), that a neutron or x-ray will be scattered into a unit solid angle element, dΩ, by a unit sample volume (Units: m-1 sterad-1). Since, for cement systems, dΣ/dΩ depends only on the magnitude of Q, the variation of dΣ/dΩ with Q contains all the obtainable information on the microstructure associated with the scattering, provided certain conditions are met. The Q range and Q resolution must be large enough and good enough for the microstructural scale of interest, and the sample must be thick enough to provide a sufficient small-angle scattering signal without being so thick that significant multiple scattering occurs. Depending on the Q-range being considered, the relationship between dΣ/dΩ and Q takes different forms. The range we are concerned with primarily is the so-called Porod regime, where the small-angle scattered component follows a Q-4 power law whose intensity is proportional to the surface area of the interface between the scattering microstructural phases of interest. In the Porod regime, scattering from the porous material follows the Porod equation [37]:
dΣdΩ
=2π |∆ρ |2 Sv
Q4 (4)
10
Concrete Science and Engineering 1, pp. 45-64, March 1999.
where Sv is the surface area per unit sample volume and ∆ρ is the difference in the scattering length density of the two materials forming the interface associated with the scattering. The term |∆ρ|2 is called the scattering contrast. For cement paste, the contrast is between C-S-H and H2O, or between C-S-H and air. In practice, the sample flat-background parasitic scattering cannot be ignored when compared with the Porod scattering. For SANS this is because of a significant incoherent inelastic scattering contribution from water in the sample. For SAXS, other parasitic scattering contributions can occur, such as arise from fluorescence of some of the atomic species present, particularly when higher x-ray energies (i.e., lower wavelengths) are used. It is usually best to consider the actual data in the Porod regime to have the form:
I =2π | ∆ρ |2 Sv
Q4 +C (5)
where I is the experimentally determined absolute-calibrated scattering intensity and C is the flat background intensity. From eq. 5 it can be seen that a plot of IQ4 vs. Q4 will be linear for Q values in the Porod regime, with a slope of C and an intercept, the Porod constant, given by 2π|∆ρ|2Sv. Thus, if the data are absolutely-calibrated and the scattering contrast is known, Sv is obtained from eq. 5 as:
Sv =CP
2π |∆ρ|2 (6)
where the experimental Porod constant, CP, is the intercept of a straight-line fit to the data in the Porod regime. For uncalibrated data, or when the scattering contrast is unknown, it is also possible to calculate the surface area by utilizing the scattering invariant, Iinv:
Iinv = Q2 dΣdΩ
dQ0
∞
∫ = 2π2 ∆ρ2 φ v (7)
where φ is the volume fraction of the scattering phase and the flat background has been accurately subtracted out (note the π
v2 factor compared to π in the earlier equations). By using eqs. 4 and 7
together, the ratio, Sv/φ , the surface per unit volume of scattering phase, can be calculated without using the contrast, hence giving S
vv if the value of φv is known. The integral in eq. 7 must be taken
over the entire Q-range, and any uncertainties in the small-angle scattering profile or in the background subtraction are amplified by the Q2 factor at high Q. Provided that the scattering contrast is known with a reasonable degree of accuracy, and the data can be absolutely calibrated, the contrast method (eq. 6) for calculating the surface area is preferable. Unfortunately, calculation of the scattering contrast for cement paste has proved to be difficult because of uncertainties about the density and composition of the C-S-H gel. In the case of SANS, the contrast can be calculated experimentally by taking advantage of the difference in contrast when specimens are exchanged with D2O (heavy water). For this reason most reported SANS surface area values have been calculated using the contrast method while many SAXS studies have used the scattering invariant method. This difference in analysis procedure may be an important factor to consider when comparing the surface area values of cement paste obtained from the two techniques. Another challenge associated with calculating surface areas using scattering is determining the appropriate Q-range to use as the Porod region. Because the scattering features within the C-S-H gel are very small (on the order of 5 nm across), the minimum Q-value for the Porod range is quite high. In order to get an accurate straight-line fit to the data, it is desirable to use as wide a Q-range as possible. In some early SANS experiments on cement paste (not primarily focused on surface area measurement), this led to the use of a lower limit for the assumed Porod Q-range which was later
11
Concrete Science and Engineering 1, pp. 45-64, March 1999.
shown to be not truly in the Porod region, resulting in an undercalculation of the Porod constant. A recent SANS study on 28 day old cement paste determined a Q-value of 1.4 nm-1 for the lower limit of the Porod regime [38], and this has been used in later studies. 4.2 Determination of the neutron scattering contrast of cement paste Determination of the correct scattering contrast is an important issue for calculations of cement paste surface area from small-angle scattering. For saturated cement paste, almost all of the surface area is in the interface between C-S-H and water, and the contrast can be written as:
|∆ρ |2= ρCSH − ρH2O( 2) (8)
where ρCSH and ρH2O are the neutron (x-ray) scattering length (form-factor) densities in the solid C-S-H and pore water. When the average composition and density of a phase are known, as with H2O, ρH2O can be calculated directly with the help of international tables of atomic neutron-scattering-lengths [39], or x-ray form-factors. The situation is more difficult for C-S-H, because the exact formula and density value which should be used in the calculations to determine ρCSH is not clear. Because the C-S-H gel is an amorphous phase with a variable composition, some of the water in C-S-H is chemically bound into the structure, while there is additional water which is loosely bound in the interlayer spaces. The amount of water which should be associated with C-S-H for the purposes of calculating ρCSH depends on how much of this water interacts with the neutrons as if part of the solid C-S-H phase, and this is not known a priori. In principle, the neutron scattering contrast of saturated cement paste can be determined experimentally by using H2O/D2O exchange. When a specimen is placed into D2O, the D2O exchanges fully with both the pore water and the water in the C-S-H gel [40], and this greatly alters the scattering contrast. By measuring the apparent surface area of a specimen as the amount of D2O is increased, a plot of the relative contrast versus D2O content is obtained, and this experimental plot can be compared to predicted curves based on various assumed values for the composition and density of the C-S-H phase. Earlier studies [35,40] used a C-S-H formula and density of C3S2H2.5 and 2.15 g/cm3, which were average values taken from the literature, and found acceptable agreement between the experimental contrast data and the predicted curve in a water-saturated system. The contrast value resulting from this work has been used for most earlier published SANS surface area results. In a recent study [41], more accurate contrast measurements were performed to see if a better C-S-H:H2O contrast value for saturated paste could be inferred by utilizing C-S-H formulae and density values appropriate for different moisture conditions [10]. The experimental contrast data, as a function of D2O content, were compared with four theoretical formula/density scenarios. These were the original one above, and the newer model under three conditions: water-saturated, D-dried, and equilibrated to 11% relative humidity (RH). In matching the predicted curves to the experimental data, the main criteria used were the position of the contrast minimum and the relative contrast values at 100% H2O and 100% D2O. The best agreement with the experimental contrast data, within the experimental uncertainties, was shown by the contrast variation predicted for the 11% RH-dried condition (see Fig. 6), with a C-S-H formula of C1.7SH2.1, and a density of 2.18 g/cm3. The resulting contrast value of 6.78 × 1028 m-4 is 21% lower than the previous value. If this newer value is substituted for the old value, earlier reported SANS surface area values would be increased by 21%. Two further points are of interest. Despite the samples being water-saturated, the C-S-H formula and density used for the predicted curve in Fig. 6 happen to be the same as those for C-S-H in a cement paste which has been equilibrated to 11% RH [10], a treatment which is designed to remove
12
Concrete Science and Engineering 1, pp. 45-64, March 1999.
the water from the gel pores without removing any interlayer water. C-S-H formulations for fully saturated and more severely dried pastes both gave significantly worse agreement with the experimental contrast data [41]. These results support the contention that the SANS surface area arises primarily from the interface between solid C-S-H and its gel pores with the interlayers contributing very little to the surface area. The contrast data and curve, shown in Fig. 6, indicate that all of the H2O in the solid C-S-H phase exchanges with the H2O/D2O mix in the pore water, because the contrast variation with H/D ratio would be quite different if this were not the case. The implication of this is that all of the surface area measurable by SANS is accessible to water in less than a few hours, even if this is completely enclosed by gel. Although the interlayer structure within the solid C-S-H is too fine to give a significant SANS contribution within the accessible Q range, the contrast variation experiment shows that the interlayer water must exchange with the pore solution within a few hours. This result may also be of relevance in deciding among the various models for the interpretation of gas sorption surface area measurements [24-27]. 4.3 The discrepancy between reported SANS and SAXS surface areas Reference to Table VI shows that reported SAXS surface areas are 2-6 times higher than those obtained from SANS. There are at least two different reasons why these two techniques, which are based on similar physical principles, give such different surface area results, and there is evidence in favor of each. One possibility is that differences in the data analysis used to calculate the surface area values are responsible for the discrepancy between x-rays and neutrons. As discussed in section 4.1, calculation of the scattering invariant, which requires integrating across all Q-values, is difficult to do accurately, particularly if the flat background, C, can not be subtracted out with sufficient accuracy. Supporting this viewpoint is the fact that one research group has calculated SAXS surface area values consistently in the range of 200-300 m2 per gram of D-dried paste [42,43] for well-hydrated OPC in the saturated state, while another group has consistently calculated values in the range of 500-600 m2/g [14,44] for the same type of specimen. Both of these studies have employed instrument configurations with a slit geometry, and appear to have bypassed both the calibration and desmearing steps described above by using slit-smeared forms of eqs. 4 and 7. The different values obtained from applying the scattering invariant method could easily arise from differences in the SAXS experimental details. The other possibility is that some SAXS studies "see" more of the C-S-H gel phase because they are sensitive to smaller features than is SANS. Support for this viewpoint comes from real-time SAXS and SANS investigations of cement hydration, and this will be discussed in detail in section 4.5. It should also be noted that the lower SAXS surface area values were obtained using a longer x-ray wavelength than the higher values (0.154 nm versus 0.071 nm) with a smaller maximum Q-value (1.5 nm-1 versus 4.5 nm-1), compared to typical effective maximum Q-values for SANS of 2.0 nm-1. When background effects are sufficiently reduced, the larger maximum Q-value would, in principle, permit the small-angle scattering from C-S-H interlayer structures to be detectable. However, it should be noted that the nature of the interlayer structure of the C-S-H is also controversial, with none of the small-angle scattering hallmarks characteristic of, for example, the interlayer structures within swelling clay systems being apparent in the scattering from cement pastes [36,40]. There are of course many factors which can contribute to variations in the reported surface area values for a given technique. These differences can be attributed either to real differences in the surface areas of the specimens measured or to experimental error. One source of uncertainty associated with small-angle scattering experiments comes about from the calibration of the scattering intensity. Each instrument has its own absolute calibration, and this can give variations of up to 10%
13
Concrete Science and Engineering 1, pp. 45-64, March 1999.
in surface area values [40]. For SANS, differences in the data analysis from experiment to experiment, particularly in the Q-range used to define the Porod region and in the C-S-H:H2O contrast value used, have probably contributed to the differences in reported results. 4.4 Surface area of mature saturated pastes SANS and SAXS surface area values have been reported for different cement types, w/c ratios, ages, and humidity levels, and there is a large range of values. Results from both techniques for reasonably well-hydrated, saturated cement pastes are summarized in Table VI, on a basis of m2 per gram of dry paste. These results may have been originally reported with other normalization units, such as m2/cm3 or m2/g of ignited paste, in which case they have been converted to m2/g of dry paste using the approach described in section 2. Also, SANS surface area values have been recalibrated using the most recent contrast value, as discussed in section 4.2. Table VI confirms that SAXS surface area values are considerably higher than SANS values. For hydrated OPC paste in the saturated state, SAXS values range from around 200 m2/g of dry paste [43] to over 500 m2/g [14,44], while reported SANS surface area values for saturated specimens range from about 60 m2/g of dry paste [36] to 150 m2/g [38]. Some early SANS work [40,45] suggested that the surface area of an OPC could vary widely from batch to batch. However, a recent study [38] using three different batches of Type I OPC, made and mixed at one time, found that the surface area of 28 d old paste is reasonably constant at about 100 m2/g. As with nitrogen gas sorption, the surface area for both SAXS and SANS increases with w/c, particularly when the results are reported in units of D-dried paste. Winslow and Diamond [14] found that the SAXS surface area of very well-hydrated OPC increased from 566 to 618 m2/g when the w/c increased from 0.4 to 0.6, while over the same range in w/c Thomas et al. [38] found the SANS surface area of 28 d OPC increased from 100 to 147 m2/g, a much greater proportional increase. 4.5 Early surface area development One of the advantages of using scattering techniques is that they can be conducted in real time during cement hydration without interfering with the hydration process, and this has allowed the development of the C-S-H structure and surface area to be monitored from the earliest hydration times of a few minutes. Figure 7 shows the surface area development of an OPC paste with w/c = 0.40 as measured by SAXS [44]. The surface area increases continuously out to 28 days (672 hours). Figure 8 shows the surface area development of a similar paste as measured by SANS [38]. In this case, the surface area levels off almost completely after approximately one day of hydration. Most SANS studies have shown little or no increase in surface area between 48 hours and 28 days [40,46] It should be noted that the SAXS results [44] do not have enough time resolution to accurately determine the surface area development in the time period between one day and 28 days. This, along with the significant scatter in the data and the lack of reported uncertainties, precludes drawing any firm conclusions regarding the shape of the data. However, the apparent difference in the time-dependencies shown in Figs. 7 and 8 suggest that there may be a qualitative difference in the surface areas being reported from SANS and SAXS studies, which is independent of differences in the data analysis. This implies that the higher Q-values, effectively accessed in some SAXS studies, may sample features in the C-S-H gel that are on the order of a nanometer in size, such as C-S-H interlayer spaces, but that these features are not sampled in most SANS experiments. 4.6 Effect of humidity level on the surface area
14
Concrete Science and Engineering 1, pp. 45-64, March 1999.
The first SAXS investigation of cement paste surface area [14] indicated that the surface area is greatly reduced by drying, and that these changes are reversible. Winslow and Diamond found that when saturated hardened cement paste (HCP) was D-dried the SAXS surface area decreased from 560 m2/g to 180 m2/g. More severe drying, such as oven drying and vacuum drying, decreased the surface area even more. Interestingly, the surface area was found to be completely recoverable on rewetting for drying techniques which did not involve heating. A SANS study of OPC [33] also established that the normal C-S-H gel structure was re-established across a large scale-range on rewetting a D-dried sample. This contradicts the often-mentioned possibility that drying treatments such as D-drying damage the C-S-H structure permanently. Even so, the large decrease in surface area on drying suggests that gas sorption surface area results do not represent the surface of saturated samples. These results strongly suggest that the structure of the C-S-H gel undergoes a reversible change on drying. A likely explanation is that water is reversibly removed from the interlayer spacings, which then collapse but are readily re-established on rewetting. The large variation in the SAXS surface area with humidity level may indeed indicate that SAXS is sensitive to the interlayer spacings, although the gel-pore surface (and the C-S-H microstructure over the whole scale range) would also be affected by a collapse of the C-S-H interlayer structure. Sensitivity to the interlayer surface area may be of considerable interest as a measure of the overall quantity of C-S-H present in all forms, but inclusion of this surface may not be appropriate when associating the surface area with material properties of interest, such as the mechanical and chemical properties. The gel pores are probably the finest features of interest in a practical surface area measurement. Two later SAXS investigations [42,43] measured the surface area of mature OPC during adsorption and desorption of water from HCP. The specific surface area was found to decrease by about 35% when the RH was lowered from 100% to 40%. Further lowering of the RH from 40% RH down to 0% RH caused the surface area to increase slightly. In the dry (0% RH) state, the surface area values from these studies range from 150-180 m2 per gram of D-dried paste. The decrease in surface area on drying, although significant, was much less than that reported originally by Winslow and Diamond [14], who reported quite similar values for dry paste but much higher values for saturated paste. It is conceivable that the shorter wavelength used, and the higher maximum Q-value measured, by Winslow and Diamond (0.071 nm, versus 0.154 nm in the other studies) allowed them to probe very fine C-S-H features that are only present in saturated paste. The decrease in surface area with RH on initial desorption was attributed to shrinkage of the C-S-H gel structure due to a decrease in the disjoining pressure [42]. Some evidence in favor of this is given by a study involving glass plates separated by water [47], in which a similar effect was observed. The slight decrease in surface area on adsorption from 0% RH to 40% RH was attributed to a loss of surface area at gel particle contacts as water was adsorbed. A similar effect was also observed [42] when changes in the surface area of fine silica fume with RH was measured by SAXS. 5. NMR Relaxation Nuclear magnetic resonance (NMR) is another advanced technique which has proven quite useful for studying interactions on an atomic scale in a wide variety of materials. The technique is based on the fact that most atomic nuclei have a non-zero spin state which means that they also have a characteristic magnetic moment. When an external magnetic field is applied to the material, the nuclear spins align themselves with the field. By measuring the rate at which the spins realign themselves to a static magnetic field after a perturbation, or by measuring the response of the material to an oscillating magnetic field, information about atomic interactions with adjacent nuclei and with
15
Concrete Science and Engineering 1, pp. 45-64, March 1999.
the surrounding medium can be obtained. Water is an excellent liquid for these types of measurements because the two hydrogen protons readily align their spins with the magnetic field. For materials with a water-filled pore system, NMR techniques take advantage of the fact that nuclear spin interactions between water and the solid pore walls are much stronger than interactions in the bulk fluid. Therefore, the NMR response from the material is sensitive to the surface to volume ratio of the porosity. The application of NMR relaxation techniques to porous media was reviewed by Halperin et al. [48]. 5.1 Determining Surface Areas using NMR relaxation An NMR experiment is conducted by first applying a static magnetic field, H0, to the specimen. The nuclear spins in the material align themselves to H0 until they have reached thermal equilibrium with the solid lattice, a mechanism referred to as spin-lattice interactions. The rate at which this alignment occurs is a characteristic of the system, and is described by T1, the spin-lattice relaxation time. The time T1 is usually determined by perturbing the equilibrium spin state with a longitudinal magnetic field pulse and then measuring the rate at which the spin system returns to the equilibrium state with respect to H0. Water that is chemically bound has a short spin-lattice relaxation time determined by rigid-lattice relaxation of the protons, while mobile water which is in the bulk of a pore relaxes at a rate which is several orders of magnitude slower. However, mobile surface water - water which is adsorbed onto the surface of a pore but is still mobile on that surface - has a rapid spin relaxation rate which is on the order of that of chemically bound water. The measurement of surface area by NMR is based on the fact that a water molecule in the bulk of a pore must first exchange its position with a mobile surface molecule before its spin can be relaxed. This process is so much faster than the intrinsic rate of relaxation of bulk water molecules that the latter can be ignored, an assumption known as "fast exchange." Therefore, the overall rate of spin relaxation of the mobile water in a given pore is proportional to the surface to volume ratio (S/V) of that pore, and this is the basis for surface area and other pore phase measurements. While it is possible to measure surface areas using measurements of the spin-lattice relaxation time, T1, in practice a slightly more complex technique known as spin-spin NMR is used. After a static field H0 is applied to the specimen to align the spins, a smaller RF frequency field H1 is applied at right angles to H0 and the frequency of H1 is varied. At a specific resonant frequency, the spin system will absorb energy from the oscillating field, creating a peak in the NMR response. This phenomenon is controlled by interactions between the adjacent protons of the water molecules, called spin-spin interactions. The width of the resonant absorption peak is inversely proportional to a second characteristic time constant called the spin-spin relaxation time, or T2. Spin-spin relaxation is surface-sensitive in the same way as spin-lattice relaxation. However, spin-spin NMR generally provides more information about the pore structure than does spin-lattice NMR, because T2 is much shorter than T1. Regardless of the type of NMR relaxation being measured, the relaxation rate for a given pore is proportional to the S/V of that pore, so the relaxation rate will be faster for smaller pores. The detected NMR signal is a superposition of different relaxation rates from different pore sizes, and the signal can be inverted to give a measure of the pore size distribution. The physics involved in deriving expressions for the surface area is rather complicated, and will not be discussed here. The basic model treats the pore system as a series of diffusion cells, which have a size defined by the distance that water molecules are able to diffuse during the relaxation process. A good discussion of the underlying physics can be found in ref. [48]. In somewhat simplified form, the surface area of a cement paste specimen as measured by spin-spin relaxation is given by
16
Concrete Science and Engineering 1, pp. 45-64, March 1999.
S = T2 SVλT2i V( )
(9)
where S is the total surface area accessed by mobile water, λ is the thickness of the layer of mobile surface water, V is the volume of mobile water in the pore system, T2S is the characteristic spin-spin relaxation time for mobile surface water, and T2i(V) is the experimentally measured spin-spin relaxation time for mobile water at volume V. For a surface area experiment, the relaxation time T2i is measured as the specimen is progressively dried to remove mobile water. T2i is then plotted as a function of the filling fraction, V/V0, where V0 is the volume of mobile water in the specimen under saturated conditions. At higher filling fractions the slope is linear. At low filling fractions T2i approaches a constant value as all of the water becomes mobile surface water, and this value is taken as T2S. From eq. 9, it can be seen that the slope in the linear region is
slope = T2SV0
λS (10)
The surface area S can then be determined from the measured value of T2S, the volume of mobile water in the saturated specimen V0 (which is determined independently) and the thickness of the surface layer λ. Of these factors, the values of T2S and λ are subject to some uncertainty. Halperin et al. [49] initially found that for their experimental apparatus the value of T2S varied somewhat randomly between about 30 - 50 µs depending on the hydration time, and later experiments adjusted the value to 60 µs [50]. This value clearly has some uncertainty associated with it, including the assumption that T2S is constant throughout hydration. The value of λ is assumed to be one molecular layer, or 0.3 nm [49,50], but this assumes that relaxation only occurs from the first surface layer, which may not be strictly true. Surface areas could be overestimated by perhaps 15% due to this assumption [51]. There are a few other assumptions inherent in the derivation of eq. 9. One is that the characteristic relaxation time for bulk water, T2B, is much longer than T2S. These times were determined directly to be T2S = 60 µs and T2B = 3 sec [50], so the assumption of fast exchange is clearly valid. Furthermore, the characteristic relaxation time of chemically bound water in the C-S-H gel is 17 µs [49,50], and this signal can be well separated from the mobile water signal. The derivation of eq. 9 also assumes that all the bulk mobile water molecules can diffuse to the surface of a pore during the time of the measurement, a condition referred to as "fast diffusion." Calculations show that water molecules can diffuse distances of a few microns during a spin-spin measurement [48], and pores larger than this do not contribute significantly to cement paste surface area. 5.2 NMR relaxation measurements of cement paste surface area The earliest surface area measurement of cement paste using NMR was reported by Barbaric et al. [52]. They measured the surface area development of OPC pastes with w/c ranging from 0.35 to 0.55 using spin-lattice relaxation. After about 100 hours of hydration, their reported surface area values were as high as 900 m2/g of dry paste, which are the highest surface area values for cement paste found in the literature. However, their model for the surface area was based on the BET approach for multilayer adsorption rather than the approach outlined in the previous section (which was developed later), and problems have been found with this type of analysis [50]. Halperin et al. [49] measured the surface area development of a white cement paste (a low-iron cement quite similar to OPC) with w/c=0.42 using spin-spin relaxation, and calculated surface area values using eq. 9. They found that the surface area increased rapidly between 6 hours and about 48 hours, and that there was essentially no surface area increase between 100 and 1000 hours (see Fig. 9). This leveling off of the surface area, which is surprising because C-S-H continues to form, is
17
Concrete Science and Engineering 1, pp. 45-64, March 1999.
virtually identical to observations with SANS (see Fig. 8). The maximum surface area was 325 m2/g of starting cement powder, which is equivalent to ~280 m2/g of dry paste, a value which falls between the values reported for SANS and for SAXS in similar real time experiments (see Figs. 7 and 8). An important question regarding NMR surface area measurements is whether or not they are sensitive to interlayer water. Although C-S-H interlayers clearly do not contain any bulk mobile water, and as such are not pores, measurements of the strength of the NMR signal for mobile surface water as a function of drying [49] indicate that some mobile surface water is present in the interlayers. However, in order to contribute to the measured surface area, this water would have to exchange with bulk water from a nearby gel pore. Since there is virtually no increase in the NMR surface area after a few days of hydration (see Fig. 9), it would appear that the C-S-H that forms at later times is isolated from the gel pores. However, it is quite possible that interlayer water in the early C-S-H product does contribute to the bulk relaxation rate and thus to the surface area. This would make the values reported too high. Although NMR relaxation has been used extensively to characterize a wide variety of porous materials, and the models used to calculate the surface area are physically meaningful and self consistent, it should be noted that there are very few surface area results for cement paste in the literature at this time, which calls for some caution in analyzing the implications of the NMR technique as it applies to cement paste. The same type of comment could be made for SAXS, which has only a handful of published surface area results which are rather contradictory. It is hoped that further results will be published soon using both of these promising techniques. 6. Discussion The surface area of cement paste has been measured using very different techniques which give very different values, and it is difficult to select a "correct" value for the surface area or even to pick the best technique. However, a range of surface area values for hydrated cement paste in the saturated state of approximately 80-280 m2/g can be quoted which takes into account most of the reported values. This range includes the SANS results, some of the SAXS results, and the NMR result. Reported values falling outside this range include most results from nitrogen gas sorption, which is performed on dry specimens, and some anomolously high SAXS results. One difficulty with comparing the results of different techniques is that the surface area of cement paste varies with such factors as cement type, age, and w/c, and this contributes to the overall variation in reported surface area values. No systematic studies aimed at directly comparing the results of different techniques have been performed, but clearly some techniques measure more surface area than others, and a few broad conclusions can be drawn from the available literature. For many years, gas sorption was the only way to measure the surface area, but this technique, although quite useful, has significant problems associated with the required drying treatment and with the choice of the sorptive gas, as discussed in detail in section 3. Modern techniques, i.e. small-angle scattering and NMR relaxation, are able to avoid the drawbacks associated with gas sorption, but they have their own problems, primarily with analyzing the data. Nonetheless, these modern techniques have made important contributions to the state of knowledge about the surface area of cement paste. The surface area of cement paste is higher in the saturated state, that is, drying cement paste reduces the surface area, and gas sorption tends to measure lower surface areas than modern techniques performed on saturated specimens. One SAXS study found that the surface area was reduced by about 35% on drying [42], while another found that it was reduced by a factor of three [14]. Because cement paste is normally in a relatively saturated state while in service, it is now clear that the true surface area of cement paste must be measured on saturated specimens, unless the surface area loss associated with drying can be avoided.
18
Concrete Science and Engineering 1, pp. 45-64, March 1999.
SAXS studies performed on dry pastes give surface areas of about 150-180 m2/g of dry paste, which is still significantly higher than most values of SN2. One reason why modern techniques measure higher surface areas than gas sorption under the same conditions is that they are sensitive to pores not accessed by gas sorption. All of the modern techniques are sensitive to isolated pores, while gas sorption is only sensitive to pores which are interconnected to the outer surface by necks large enough to admit the sorptive gas. The technique which is sensitive to the smallest features is SAXS, and this is also the technique with the highest reported surface area values. An important contribution of modern techniques is that the surface area increases rapidly during the first 48 hours of hydration, something that, because of sensitivity issues, has not been reported for gas sorption. It is likely that the C-S-H structure formed at early times is delicate and is easily damaged by drying. Perhaps the most interesting aspect of the surface area development as measured by the modern techniques is the qualitative difference between SAXS on the one hand and SANS and NMR on the other hand. As shown in Figs. 7-9, only the surface area as measured by SAXS increases considerably after 48 hours when late C-S-H is forming. Because this difference is unlikely to be due either to the data analysis or to experimental factors such as the cement type, it is tempting to draw the obvious conclusion that only SAXS is sensitive to features within the dense, monolithic C-S-H that forms later in the hydration process. If this is the case, then SAXS could be said to overestimate the surface area, because the interlayer spaces within the C-S-H phase are not true pores and do not contribute to surface area as it is normally defined. A reasonable interpretation of the cement hydration process, based on the surface area results discussed in this review, is that low-density C-S-H with a very high intrinsic surface area forms rapidly during the first few days of hydration, expanding outward from the cement grains and filling the available pore space. At this point space limitations prevent further low-density C-S-H from forming, and the C-S-H product that forms thereafter is a high-density C-S-H with little or no intrinsic surface area, which forms at a much slower rate. There is some circumstantial evidence in favor of this interpretation, in that all techniques (except for water sorption) measure a higher surface area at higher w/c. In fact, Thomas et al. [38] found that the 28 day SANS surface area of OPC paste in the w/c range of 0.4 to 0.6 was directly proportional to the volume fraction of water in the as-mixed paste, which they used as an estimate of the space available for reaction product to form. As a measurable parameter of cement paste, surface area offers both advantages and disadvantages. The disadvantages have been discussed at length in this review: difficulty in precisely defining the physical characteristic being measured, differences caused by the moisture state of the paste, and large variations in the results obtained from different techniques. However, the advantages of surface area measurement are significant. Perhaps more than any other parameter, the surface area is sensitive to the morphology of the C-S-H gel phase, which controls to some extent virtually every property of interest in cement-based materials. This makes surface area evaluation useful both for investigating the structure of the C-S-H gel and for relating the effects of processing and composition to the final properties of cement paste and concrete. To realize fully the potential of surface area measurements as a diagnostic tool for cement paste, it is first necessary to understand the variations in the magnitude of surface area measured by different techniques. This variation can be due to differences in what exactly is being probed in the specimen, differences in the moisture state of the specimen at the time of measurement, or uncertainties arising from assumptions made during analysis of the raw data. At a minimum, surface area studies should describe explicitly both the experimental procedure and the data analysis used to arrive at the surface area from the raw data. Even more useful would be studies measuring the surface area of identical specimens using a variety of techniques. Another issue which bears further thought is the variation in surface area that occurs within samples. While the average specific surface area of specimen is clearly important, the properties of the material will also depend on the degree of variation in the the surface area that occurs on the
19
Concrete Science and Engineering 1, pp. 45-64, March 1999.
microstructural level within the specimen. Small-angle scattering techniques, which probe relatively small sample volumes during a measurement, may be quite useful in analyzing the amount of local variability in the surface area of cement paste. References 1. S. Mindess and J.F. Young, Concrete, Prentice Hall, Englewood Cliffs, NJ (1981).
2. R.A. Livingston, D.A. Neumann, A.J. Allen, and J.J. Rush, "Application of Neutron Scattering Methods to Cementitious Materials," Mat. Res. Soc. Symp. Proc. 376, pp. 459-469 (1995).
3. D.A. Lange, H.M. Jennings, S.P. Shah and D.A. Quenard, "A Fractal Approach to Understanding Cement Paste Microstructure," Ceram. Trans. 16, pp. 347-363 (1992).
4. D.N. Winslow, "The Fractal Nature of the Surface of Cement Paste," Cem. Con. Res. 15, pp. 817-824 (1985).
5. P.K. Mehta, Concrete: Structure, Properties and Materials, Prentice-Hall, Englewood Cliffs, NJ (1986).
6. H.M. Jennings, P.J. Dalgleish, and P.L. Pratt, "Morphological Development of Hydrating Tricalcium Silicate as Examined by Electron Microscopy Techniques," J. Am. Ceram. Soc. 64 [10], pp. 567-72 (1981).
7. S. Diamond and D. Bonen, "Microstructure of a Hardened Cement Paste: A New Interpretation," J. Am. Ceram. Soc. 76 [12], pg. 2993 (1993).
8. C.M. Neubauer, H.M. Jennings, and E.J. Garboczi, "Mapping Drying Shrinkage Deformations In Cement-Based Materials," Cement and Concrete Research, 27 [10]
pp. 1603-1612 (1997).
9. H.M. Jennings and P.D. Tennis, "Model for the Developing Microstructure in Portland Cement Pastes," J. Am. Ceram. Soc. 77 [12], pp. 3161-72 (1994), and correction 78 [9], pg. 2575 (1995).
10. H.F.W. Taylor, Cement Chemistry, Academic Press, San Diego, CA (1990).
11. T.C. Powers, "Physical Properties of Cement Paste," in Proceedings of the Fourth International Conference on the Chemistry of Cement (Washington D.C., 1960), U.S. National Bureau of Standards Monograph 43, Vol. 2, pp. 577-613 (1962).
12. H.F.W. Taylor, "A Method for Predicting Alkali Ion Concentrations in Cement Pore Solutions," Adv. Cem. Res. 1 [1], pp. 5-17 (1987).
13. C.M. Hunt, "Nitrogen Sorption Measurements and Surface Areas of Hardened Cement Paste," in Symposium on Structure of Portland Cement Paste and Concrete, Highway Research Board Special Report 90 (1966).
14. D.N. Winslow and S. Diamond, "Specific Surface of Hardened Cement Paste as Determined by Small-Angle X-Ray Scattering," J. Am. Ceram. Soc. 57 [5], pp. 193-97 (1974).
15. S.J. Gregg and K.S.W. Sing, Adsorption, Surface Area and Porosity (2nd ed.), Academic Press, New York, NY (1982).
16. R.L. Rarick, J.I. Bhatty, and H.M. Jennings, "Surface Area Measurement using Gas Sorption: Application to Cement Paste," In Materials Science of Concrete IV, American Ceramic Society, Westerville, OH, pp. 1-36 (1994).
17. S. Brunauer, P.H. Emmit, and E. Teller, "Adsorption of Gases in Multimolecular Layers," J. Am. Chem. Soc. 60, pp. 309-19 (1938).
18. L.E. Copeland and J.C. Hayes, "Determination of Nonevaporable Water in Hardened Portland Cement Paste," ASTM Bull 194, pp. 70-74 (1953).
20
Concrete Science and Engineering 1, pp. 45-64, March 1999.
19. L.E. Copeland and R.H. Bragg, "Hydrates of Magnesium Perchlorate," J. Phys. Chem. 58, pp.
1075-77 (1954).
20. T.C. Powers and T.L. Brownyard, "Studies of the Physical Properties of Hardened Cement Pastes," Portland Cem. Assoc. R&D Bull. 22 (1948).
21. R.Sh. Mikhail, L.E. Copeland, and S. Brunauer, "Pore Structures and Surface Areas of Hardened Portland Cement Pastes," Can. J. Chem . 42, pp. 426-37 (1964).
22. G.L. Kalousek, "Relation of Shrinkage to Moisture Content in Concrete Block," Proc. Am. Concr. Inst. 26, pg. 233 (1954).
23. R.Sh. Mikhail and S.A. Selim, "Adsorption of Organic Vapors in Relation to Pore Structure of Hardened Portland Cement Paste," pp. 123-34 in Symposium of Structure of Portland Cement and Concrete. Highway Research Board Special Report 98 (1966).
24. T.C. Powers, "The Physical Structure and Engineering Properties of Concrete," Portland Cem. Assoc. R&D Bull. 90 (1958).
25. S. Brunauer, "Tobermorite Gel: The Heart of Concrete," Am. Scientist 50, pp. 211-29 (1962).
26. R.F. Feldman and P. Sereda, "A New Model for Hydrated Portland Cement and its Practical Implications," Eng. J. Can. 53 [8-9], pp. 53-59 (1970).
27. F.H. Wittman, Cement Production and Use, pp. 143-61. Publication No. 79-08, Engineering Foundation, New York (1979).
28. G.G. Litvan, "Variability of the Nitrogen Surface Area of Hydrated Cement Paste," Cem. Concr. Res. 6, pp. 139-44 (1976).
29. R.L. Blaine and H.J. Valis, "Surface Avaliable to Nitrogen in Hydrated Portland Cements," J. Research NBS 42, pp. 257-67 (1949).
30. D.L. Kantro, S. Brunauer, and C.H. Weise, "Development of Surface in the Hydration of Calcium Silicates," J. Phys. Chem. 66, pp. 1804-9 (1962).
31. J.J. Thomas, J. Hsieh, and H.M. Jennings, "Effect of Carbonation on the Nitrogen BET Surface Area of Hardened Cement Paste," Adv. Cem. Bas. Mat. 3, pp. 76-80 (1996).
32. R.L. Rarick, J.J. Thomas, B.J. Christensen, and H.M. Jennings, "Deterioration of the Nitrogen BET Surface Area of Dried Cement Paste with Storage Time," Adv. Cem. Bas. Mat. 3, pp. 72-75 (1996).
33. D. Pearson and A.J. Allen, "A Study of Ultrafine Porosity in Hydrated Cements using Small Angle Neutron Scattering," J. Mater. Sci. 20, pp. 303-15 (1985).
34. A.J. Allen, "Time-Resolved Phenomena in Cements, Clays, and Porous Rocks," J. Appl. Cryst. 24, pp. 624-34 (1991).
35. A.J. Allen, A.H. Baston and C.R. Wilding, "Small-Angle Neutron Scattering Studies of Pore and Gel Structures, Diffusivity, Permeability and Damage Effects," Mat. Res. Soc. Symp. Proc. 137, pp. 119-125 (1989).
36. A.J. Allen and R.A. Livingston, “Small-Angle Scattering Study of Concrete Microstructure as a Function of Silica Fume, Fly Ash, or Other Pozzolanic Additions,” pp.1179-1200 in Proc. 5th CANMET/ACI Int. Conf. on Fly Ash, Silica Fume, Slag and Natural Pozzolans in Concrete, ed. V.M. Malhotra, American Concrete Institute, Detroit, MI (1995).
37. G. Porod, "X-Ray Small Angle Scattering of Close Packed Colloid Systems: I," Kolloid Z. 124, pg. 83 (1951).
38. J.J. Thomas, H.M. Jennings, and A.J. Allen, "The Surface Area of Cement Paste as Measured by Neutron Scattering - Evidence for Two C-S-H Morphologies," Cem. Con. Res. (in press).
21
Concrete Science and Engineering 1, pp. 45-64, March 1999.
39. V.F. Sears, Neutron News 3, pp. 26-37 (1992).
40. A.J. Allen, R.C. Oberthur, D. Pearson, P. Schofield, and C.R. Wilding, "Development of the Fine Porosity and Gel Structure of Hydrating Cement Systems," Phil. Mag. B 56 [3], pp. 263-8 (1987).
41. J.J. Thomas, H.M. Jennings, and A.J. Allen, "Determination of the Neutron Scattering Contrast of Hydrated Portland Cement Paste using H2O/D2O Exchange," Adv. Cem. Bas. Mat. (in press) (1998).
42. R.E. Beddoe and K. Lang, "Effect of Moisture on Fractal Dimension and Specific Surface of Hardened Cement Paste by Small-Angle X-Ray Scattering," Cem. Con. Res. 24 [4], pp. 605-12 (1994).
43. J.J. Volkl, R.E. Beddoe, and M.J. Setzer, "The Specific Surface of Hardened Cement Paste by Small-Angle X-Ray Scattering - Effect of Moisture Content and Chlorides," Cem. Con. Res. 17, pp. 81-87 (1987).
44. D.N. Winslow, J.M. Bukowski, and J.F. Young, "The Early Evolution of the Surface of Hydrating Cement," Cem. Con. Res. 24 [6], pp. 1025-32 (1994).
45. A.J. Allen, unpublished data, 1987.
46. J.J. Thomas, A.J. Allen, and H.M. Jennings, unpublished data, 1996.
47. H. Splittgerber, Cem. Con. Res. 6, pg. 29 (1976).
48. W.P. Halperin, F. D'Orazio, S. Bhattacharja, and J.C. Tarczon, "Magnetic Resonance Relaxation Analysis of Porous Media," pp. 311-350 in Molecular Dynamics in Restricted Geometries, ed. J. Klafter and J. M. Drake, John Wiley and Sons, New York (1989).
49. W.P. Halperin, J.Y. Jehng, and Y.Q. Song, " Application of Spin-Spin Relaxation to Measurement of Surface Area and Pore Size Distributions in a Hydrating Cement Paste," Magn. Reson. Imaging 12 [2], pp. 169-73 (1994).
50. J.Y. Jehng, "Microstructure of Wet Cement Pastes," Ph.D. Thesis, Northwestern University, Evanston, IL (1995).
51. W.P. Halperin, private communication.
52. L. Barbaric, I. Kocuvan, R. Blinc, G. Lahajnar, P. Merljak, and I. Zupancic, "The Determination of Surface Development in Cement Pastes by Nuclear Magnetic Resonance," J. Am. Ceram. Soc. 65 [1], pp. 25-31 (1982).
22
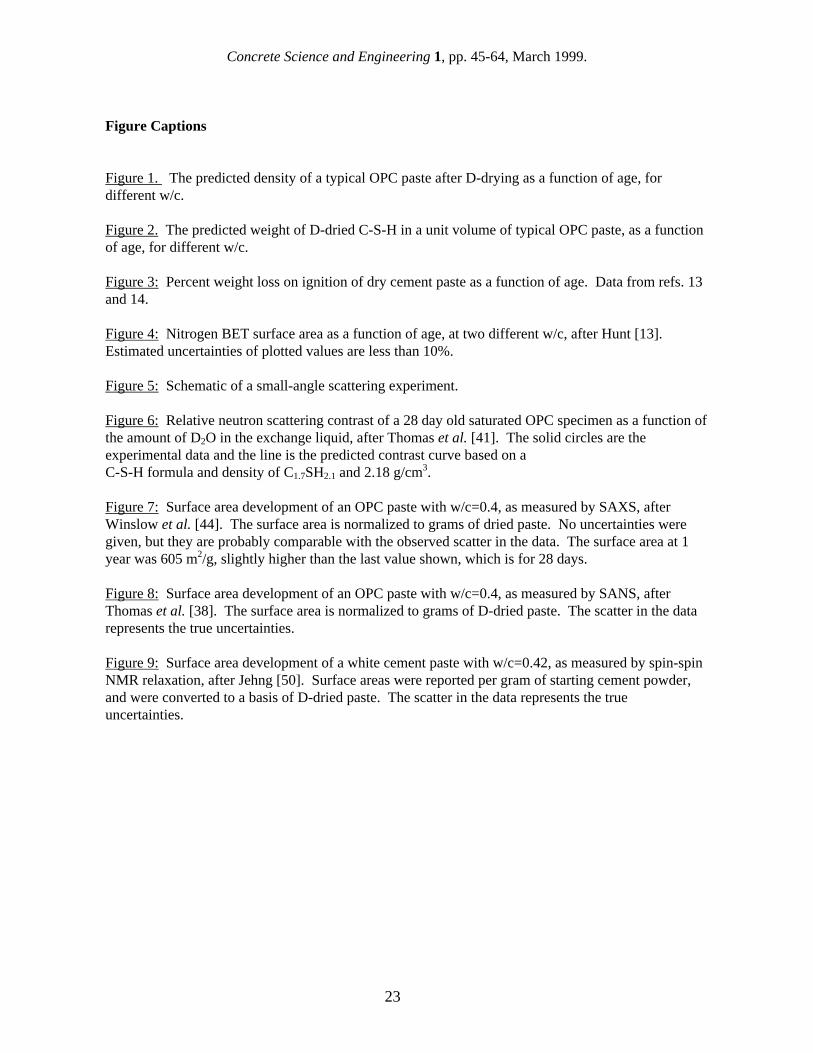
Concrete Science and Engineering 1, pp. 45-64, March 1999.
Figure Captions Figure 1. The predicted density of a typical OPC paste after D-drying as a function of age, for different w/c. Figure 2. The predicted weight of D-dried C-S-H in a unit volume of typical OPC paste, as a function of age, for different w/c. Figure 3: Percent weight loss on ignition of dry cement paste as a function of age. Data from refs. 13 and 14. Figure 4: Nitrogen BET surface area as a function of age, at two different w/c, after Hunt [13]. Estimated uncertainties of plotted values are less than 10%. Figure 5: Schematic of a small-angle scattering experiment. Figure 6: Relative neutron scattering contrast of a 28 day old saturated OPC specimen as a function of the amount of D2O in the exchange liquid, after Thomas et al. [41]. The solid circles are the experimental data and the line is the predicted contrast curve based on a C-S-H formula and density of C1.7SH2.1 and 2.18 g/cm3. Figure 7: Surface area development of an OPC paste with w/c=0.4, as measured by SAXS, after Winslow et al. [44]. The surface area is normalized to grams of dried paste. No uncertainties were given, but they are probably comparable with the observed scatter in the data. The surface area at 1 year was 605 m2/g, slightly higher than the last value shown, which is for 28 days. Figure 8: Surface area development of an OPC paste with w/c=0.4, as measured by SANS, after Thomas et al. [38]. The surface area is normalized to grams of D-dried paste. The scatter in the data represents the true uncertainties. Figure 9: Surface area development of a white cement paste with w/c=0.42, as measured by spin-spin NMR relaxation, after Jehng [50]. Surface areas were reported per gram of starting cement powder, and were converted to a basis of D-dried paste. The scatter in the data represents the true uncertainties.
23
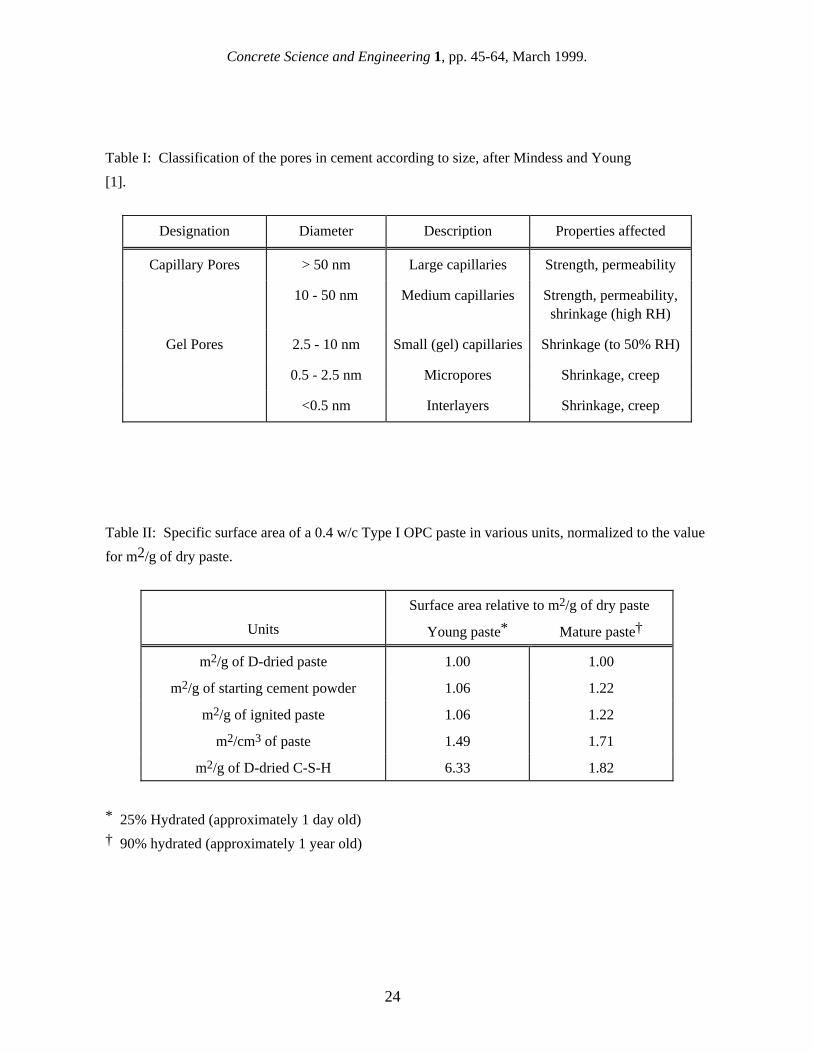
Concrete Science and Engineering 1, pp. 45-64, March 1999.
Table I: Classification of the pores in cement according to size, after Mindess and Young
[1].
Designation Diameter Description Properties affected
Capillary Pores > 50 nm Large capillaries Strength, permeability
10 - 50 nm Medium capillaries Strength, permeability, shrinkage (high RH)
Gel Pores 2.5 - 10 nm Small (gel) capillaries Shrinkage (to 50% RH)
0.5 - 2.5 nm Micropores Shrinkage, creep
<0.5 nm Interlayers Shrinkage, creep
Table II: Specific surface area of a 0.4 w/c Type I OPC paste in various units, normalized to the value
for m2/g of dry paste.
Units
Surface area relative to m2/g of dry paste
Young paste* Mature paste†
m2/g of D-dried paste 1.00 1.00
m2/g of starting cement powder 1.06 1.22
m2/g of ignited paste 1.06 1.22
m2/cm3 of paste 1.49 1.71
m2/g of D-dried C-S-H 6.33 1.82
* 25% Hydrated (approximately 1 day old) † 90% hydrated (approximately 1 year old)
24
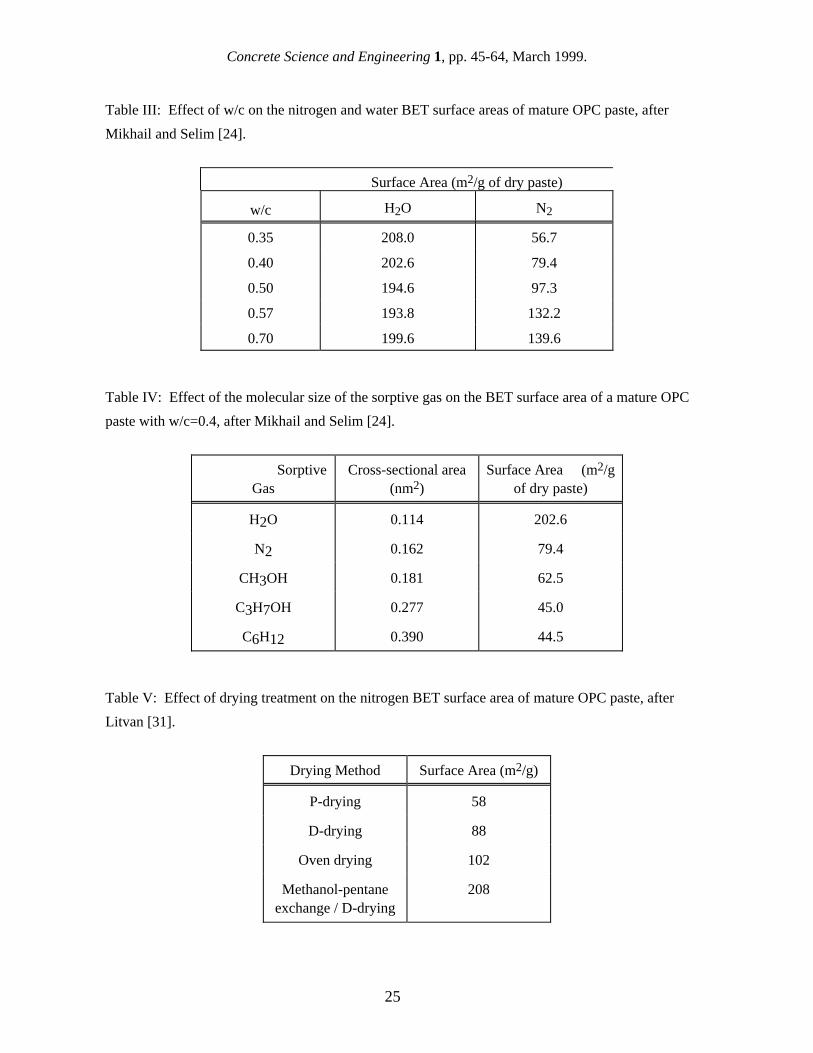
Concrete Science and Engineering 1, pp. 45-64, March 1999.
Table III: Effect of w/c on the nitrogen and water BET surface areas of mature OPC paste, after
Mikhail and Selim [24].
Surface Area (m2/g of dry paste)
w/c H2O N2
0.35 208.0 56.7
0.40 202.6 79.4
0.50 194.6 97.3
0.57 193.8 132.2
0.70 199.6 139.6
Table IV: Effect of the molecular size of the sorptive gas on the BET surface area of a mature OPC
paste with w/c=0.4, after Mikhail and Selim [24].
Sorptive Gas
Cross-sectional area (nm2)
Surface Area (m2/g of dry paste)
H2O 0.114 202.6
N2 0.162 79.4
CH3OH 0.181 62.5
C3H7OH 0.277 45.0
C6H12 0.390 44.5
Table V: Effect of drying treatment on the nitrogen BET surface area of mature OPC paste, after
Litvan [31].
Drying Method Surface Area (m2/g)
P-drying 58
D-drying 88
Oven drying 102
Methanol-pentane exchange / D-drying
208
25
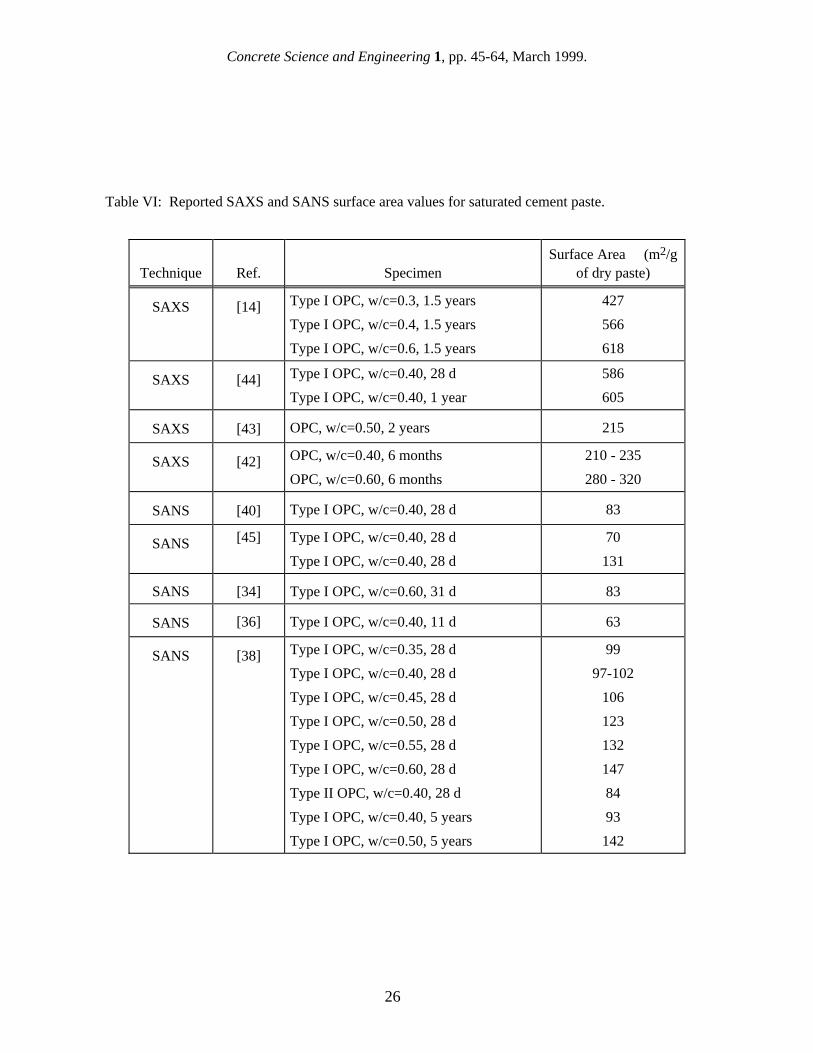
Concrete Science and Engineering 1, pp. 45-64, March 1999.
Table VI: Reported SAXS and SANS surface area values for saturated cement paste.
Technique
Ref.
Specimen Surface Area (m2/g
of dry paste)
SAXS [14] Type I OPC, w/c=0.3, 1.5 years
Type I OPC, w/c=0.4, 1.5 years
Type I OPC, w/c=0.6, 1.5 years
427
566
618
SAXS [44] Type I OPC, w/c=0.40, 28 d
Type I OPC, w/c=0.40, 1 year
586
605
SAXS [43] OPC, w/c=0.50, 2 years 215
SAXS [42] OPC, w/c=0.40, 6 months
OPC, w/c=0.60, 6 months
210 - 235
280 - 320
SANS [40] Type I OPC, w/c=0.40, 28 d 83
SANS [45] Type I OPC, w/c=0.40, 28 d
Type I OPC, w/c=0.40, 28 d
70
131
SANS [34] Type I OPC, w/c=0.60, 31 d 83
SANS [36] Type I OPC, w/c=0.40, 11 d 63
SANS [38] Type I OPC, w/c=0.35, 28 d
Type I OPC, w/c=0.40, 28 d
Type I OPC, w/c=0.45, 28 d
Type I OPC, w/c=0.50, 28 d
Type I OPC, w/c=0.55, 28 d
Type I OPC, w/c=0.60, 28 d
Type II OPC, w/c=0.40, 28 d
Type I OPC, w/c=0.40, 5 years
Type I OPC, w/c=0.50, 5 years
99
97-102
106
123
132
147
84
93
142
26
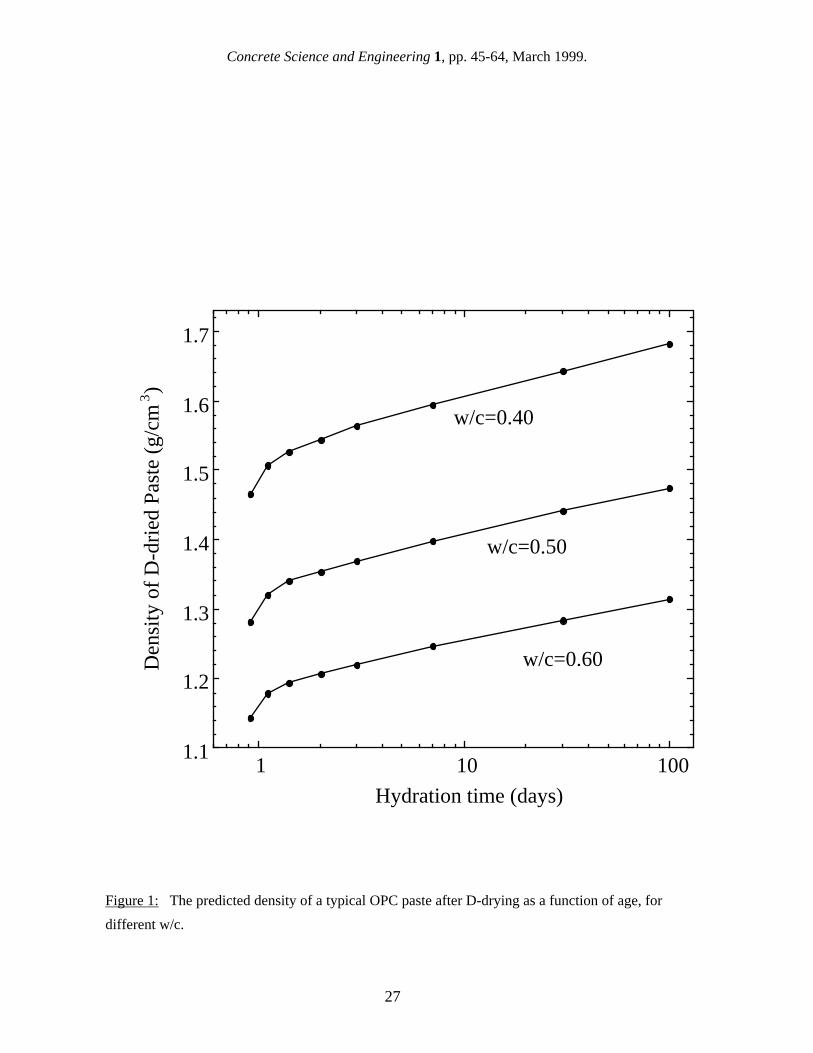
Concrete Science and Engineering 1, pp. 45-64, March 1999.
1.1
1.2
1.3
1.4
1.5
1.6
1.7
1 10 100
Den
sity
of
D-d
ried
Pas
te (
g/cm
3 )
Hydration time (days)
w/c=0.40
w/c=0.50
w/c=0.60
Figure 1: The predicted density of a typical OPC paste after D-drying as a function of age, for
different w/c.
27
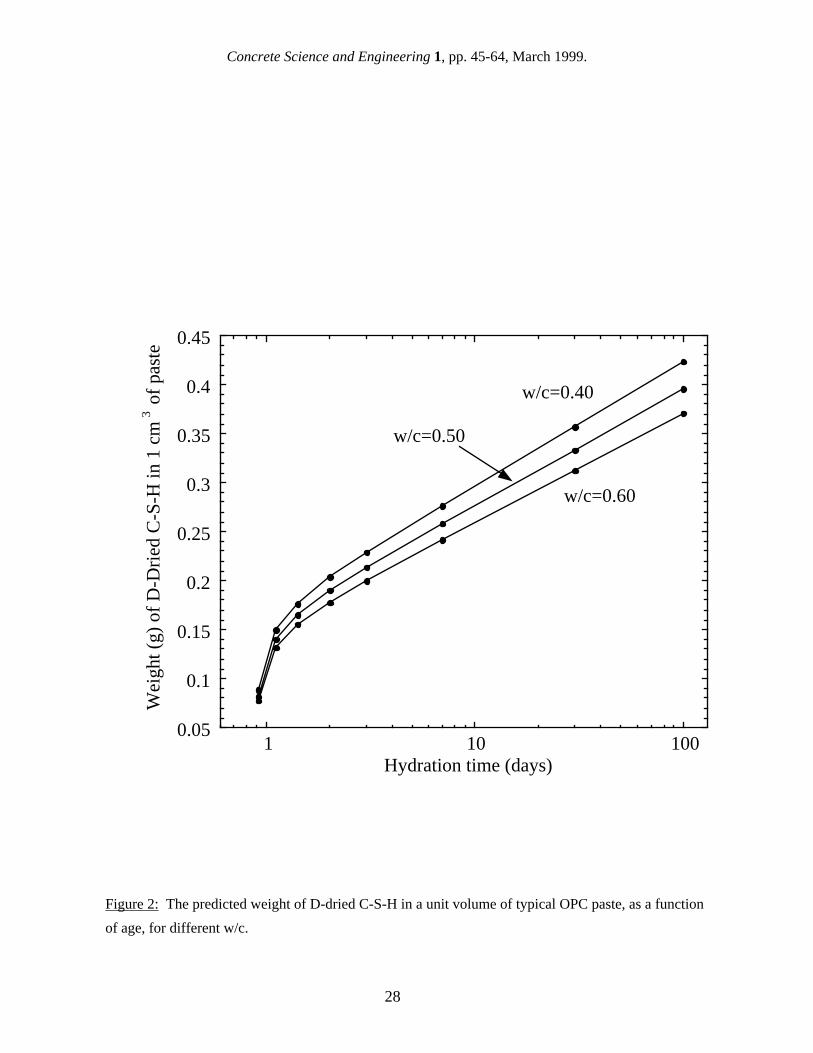
Concrete Science and Engineering 1, pp. 45-64, March 1999.
0.05
0.1
0.15
0.2
0.25
0.3
0.35
0.4
0.45
1 10 100
Wei
ght (
g) o
f D
-Dri
ed C
-S-H
in 1
cm
3 o
f pa
ste
Hydration time (days)
w/c=0.40
w/c=0.50
w/c=0.60
Figure 2: The predicted weight of D-dried C-S-H in a unit volume of typical OPC paste, as a function
of age, for different w/c.
28
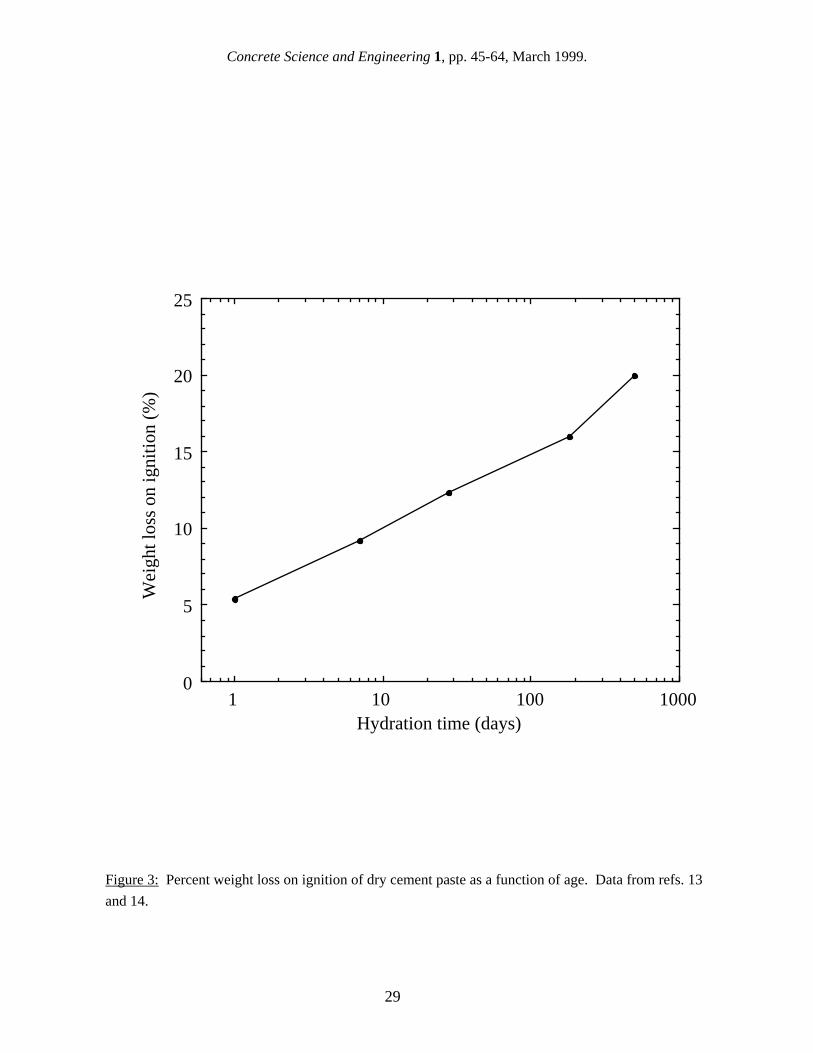
Concrete Science and Engineering 1, pp. 45-64, March 1999.
0
5
10
15
20
25
1 10 100 1000
Wei
ght l
oss
on ig
nitio
n (%
)
Hydration time (days)
Figure 3: Percent weight loss on ignition of dry cement paste as a function of age. Data from refs. 13
and 14.
29
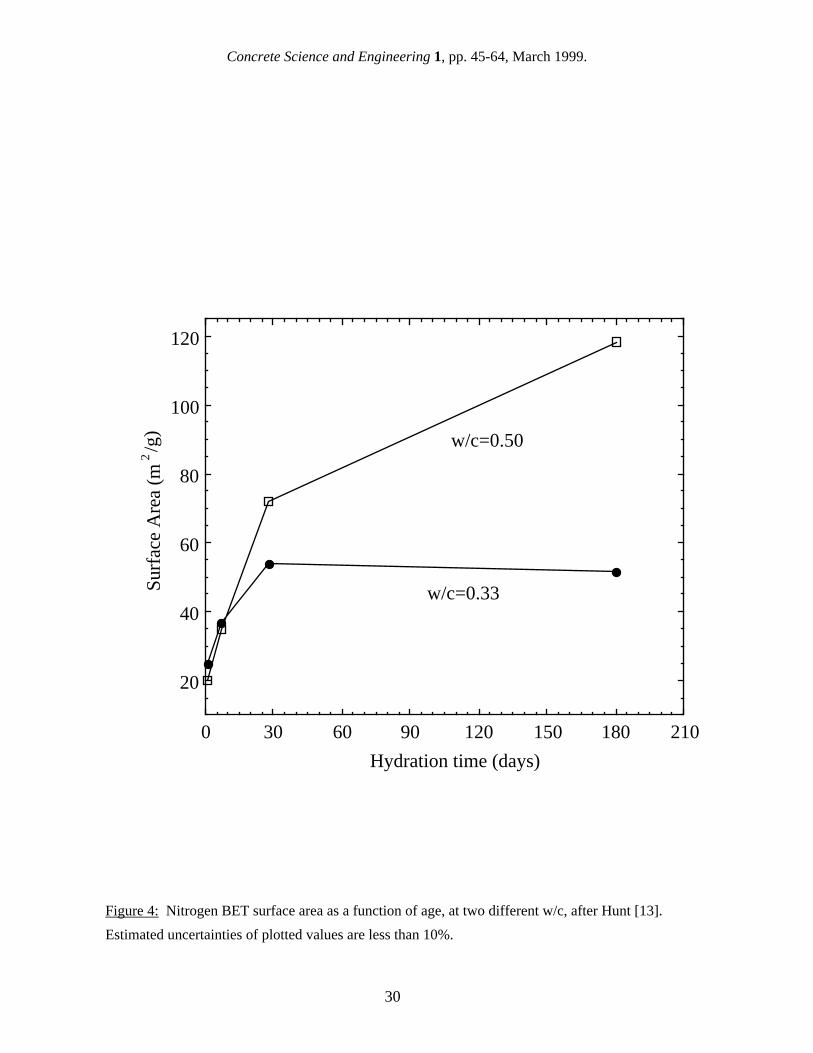
Concrete Science and Engineering 1, pp. 45-64, March 1999.
20
40
60
80
100
120
0 30 60 90 120 150 180 210
Surf
ace
Are
a (m
2/g
)
Hydration time (days)
w/c=0.33
w/c=0.50
Figure 4: Nitrogen BET surface area as a function of age, at two different w/c, after Hunt [13].
Estimated uncertainties of plotted values are less than 10%.
30
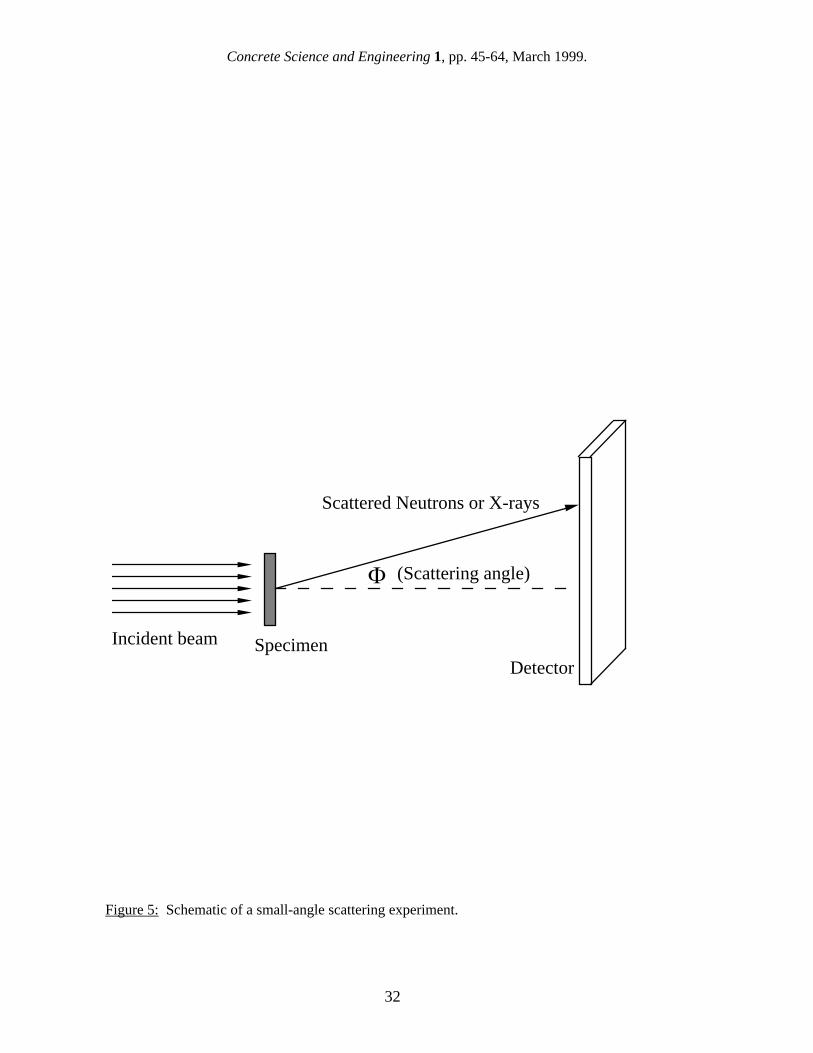
Concrete Science and Engineering 1, pp. 45-64, March 1999.
Incident beam
DetectorSpecimen
Φ
Scattered Neutrons or X-rays
(Scattering angle)
Figure 5: Schematic of a small-angle scattering experiment.
32
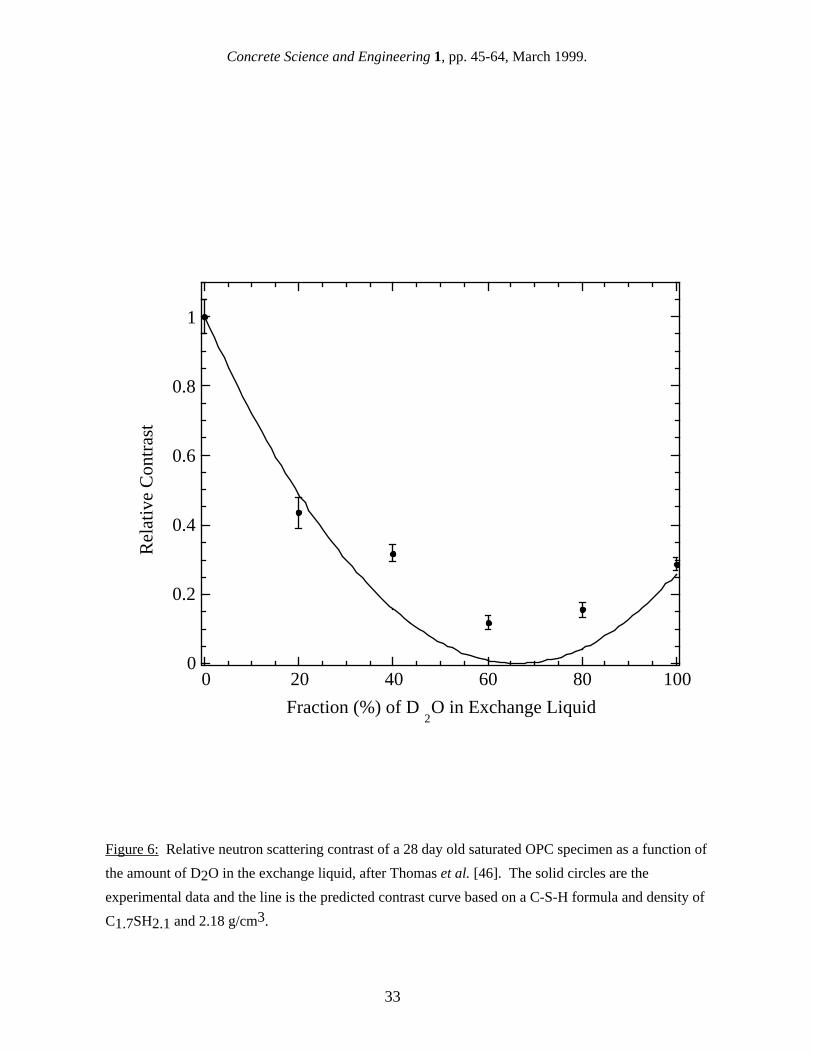
Concrete Science and Engineering 1, pp. 45-64, March 1999.
0
0.2
0.4
0.6
0.8
1
0 20 40 60 80 100
Rel
ativ
e C
ontr
ast
Fraction (%) of D2O in Exchange Liquid
Figure 6: Relative neutron scattering contrast of a 28 day old saturated OPC specimen as a function of
the amount of D2O in the exchange liquid, after Thomas et al. [46]. The solid circles are the
experimental data and the line is the predicted contrast curve based on a C-S-H formula and density of
C1.7SH2.1 and 2.18 g/cm3.
33
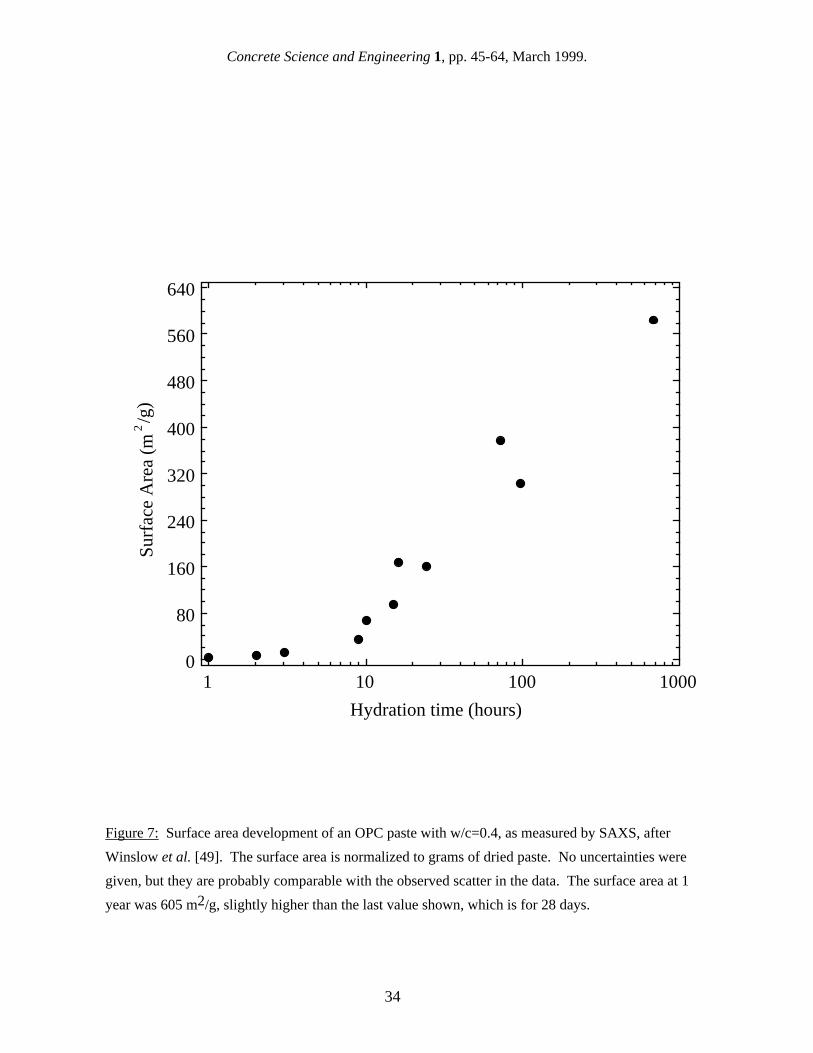
Concrete Science and Engineering 1, pp. 45-64, March 1999.
0
80
160
240
320
400
480
560
640
1 10 100 1000
Surf
ace
Are
a (m
2/g
)
Hydration time (hours)
Figure 7: Surface area development of an OPC paste with w/c=0.4, as measured by SAXS, after
Winslow et al. [49]. The surface area is normalized to grams of dried paste. No uncertainties were
given, but they are probably comparable with the observed scatter in the data. The surface area at 1
year was 605 m2/g, slightly higher than the last value shown, which is for 28 days.
34
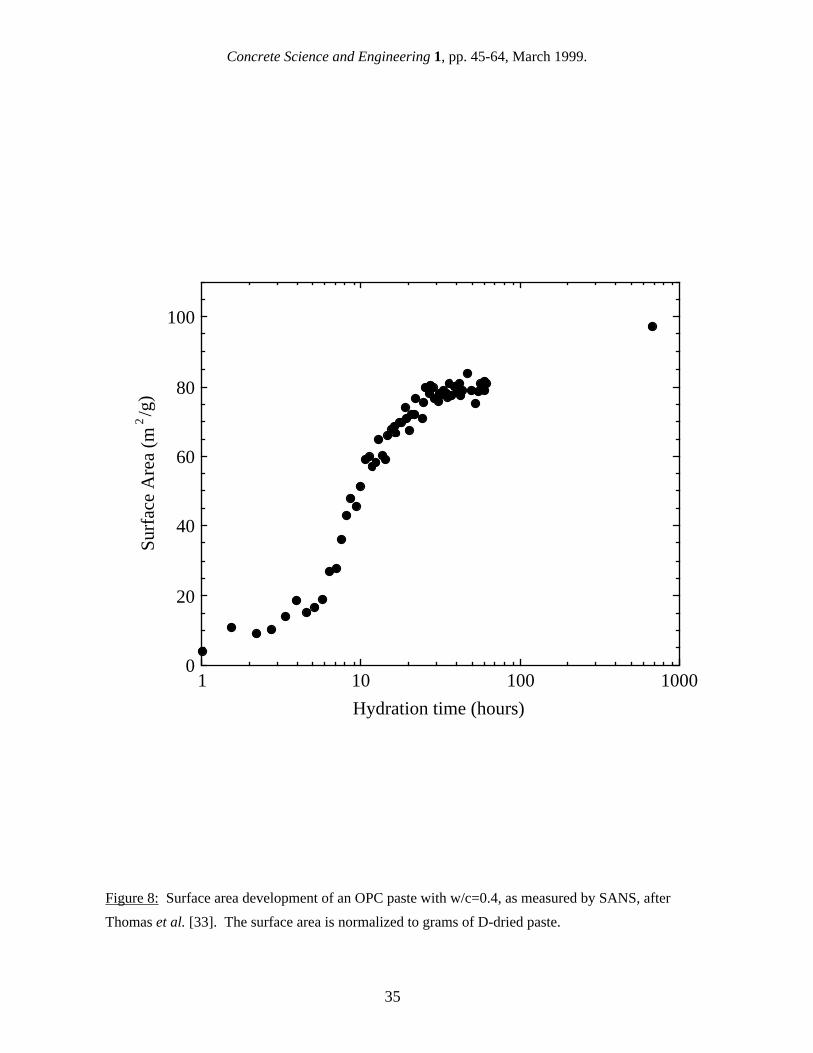
Concrete Science and Engineering 1, pp. 45-64, March 1999.
0
20
40
60
80
100
1 10 100 1000
Surf
ace
Are
a (m
2/g
)
Hydration time (hours)
Figure 8: Surface area development of an OPC paste with w/c=0.4, as measured by SANS, after
Thomas et al. [33]. The surface area is normalized to grams of D-dried paste.
35
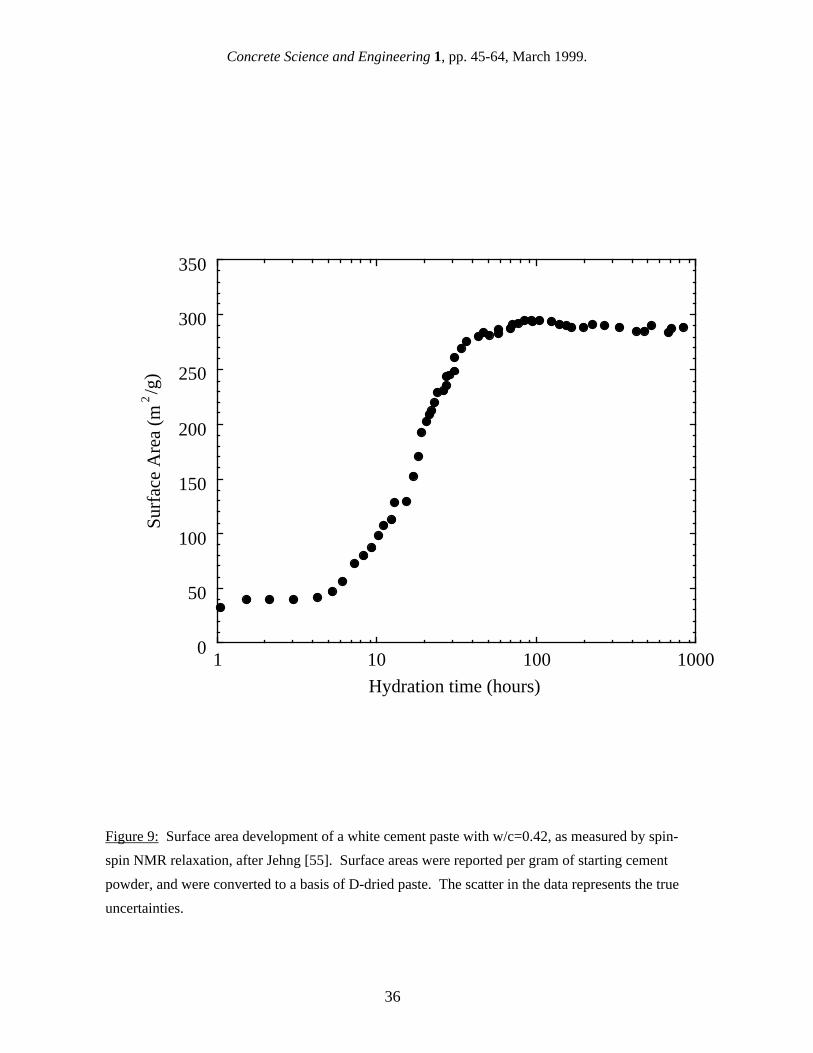
Concrete Science and Engineering 1, pp. 45-64, March 1999.
0
50
100
150
200
250
300
350
1 10 100 1000
Surf
ace
Are
a (m
2/g
)
Hydration time (hours)
Figure 9: Surface area development of a white cement paste with w/c=0.42, as measured by spin-
spin NMR relaxation, after Jehng [55]. Surface areas were reported per gram of starting cement
powder, and were converted to a basis of D-dried paste. The scatter in the data represents the true
uncertainties.
36