Embed Size (px)
Citation preview

The Support for
Freedom Index
2017
Trevor Smith, Timothy Lee, and Bryon Allen
The Support for Freedom Index
Executive Summary
“Those who would give up essential Liberty, to purchase a little temporary Safety, deserve
neither Liberty nor Safety.”
- Benjamin Franklin, 1755
“When the government acts it does so at the expense of individual liberty.”
- Senator Mike Lee, 2017
For more than 260 years, Americans have grappled with the appropriate balance between
individual liberty and government acting to limit that liberty for purposes including, safety,
economic security, or fairness. This tension underpins nearly every policy debate we have in this
country. From privacy to taxes, immigration to education, the rights of individuals to act freely
and in accordance with their own beliefs continually come into conflict with government
priorities and obligations to keep Americans safe, secure, and prosperous.
Americans have mostly taken an “I know it when I see it” approach to how much freedom they
are willing to sacrifice in the name of some greater purpose. Among many examples the debate
over the PATRIOT Act has raged for more than a decade as policymakers seek to both protect
the privacy rights of law-abiding citizens while also vigorously investigating suspected terrorists.
Until now, no one has tried to quantify this balance; this report measures and tracks Americans’
attitudes toward liberty. Using survey research and quantitative analysis, we have designed a
scale, the Freedom Support Index, which gauges how Americans define freedom and whether
they generally support more or less government interference in their daily lives.
Several of the findings are what one might expect. For example, Republicans and conservatives,
who generally support local control, individual responsibility, and less government intervention,
score higher on the Freedom Index; however, definitions of freedom by Republicans and
conservatives vary a widely. Democrats and liberals, who generally support a more active
government role, equalization of outcomes, and economic protection, score lower on the
Freedom Index; definitions of freedom between Democrats and liberals are strongly similar.
We have both found and confirmed that Republicans are not necessarily conservatives and
conservatives are not necessarily Republicans. Pluralities of conservatives tend to define freedom
from the passive government perspective, choosing liberty over security. Republicans on the
other hand, are not overall split on the question of active vs passive government, but the leading
definitions are presenting an interesting dichotomy that may exist within the Republican Party.
One leading definition believes that freedom is a passive government, are less free over the last
ten years, and would choose liberty over security and the other leading definition chooses an
active government, are just as free, and would choose security over liberty. Both Republicans
(70.9) and conservatives (71.42) scored the highest for overall support for freedom in their
respective demographic groups, but define freedom differently.
Democrats (24.17%) and liberals (23.63%) on the other hand overwhelmingly define freedom as
an active government, just as free, and liberty over security. This indicates that Democrats and
liberals do not deviate much in their definition of freedom and both believe that an active
government is necessary to secure liberty. Both groups generally feel less free over the past
decade. Therefore, this questions actual experience vs ideal definitions. This question is
especially perplexing considering that Democrats and liberals scored lowest for overall support
for freedom on the index in the party demo. They both define freedom as an active government
necessary to secure liberty and even though we’ve seen a government work to achieve these ends
of activity and liberty, both groups feel less free over the past decade.
Also of note are Millennials’ attitudes toward freedom. Millennials, categorized as ages 18-34,
have a higher overall support for freedom (69.92) than their elders 35+ (69.43). In particular,
what is driving their scores is their support for religious and social freedom (78.70), at a higher
rate than non-Millennials (76.61).
When looking from the active government perspective only, non-Millenials view the need for an
active government in ensuring security (23.09%) more than ensure liberty (21.52%), while
Millennials view the need for an active government in ensuring liberty (31.7%) over security
(22.11%).
A majority of Millennials would support an active (54%) over a passive (40%) government and
liberty (60%) over security (40%) indicating that Millennials believe an active government
ensures liberty. With non-Millennials on the other hand, a majority would support a passive
(51%) over and active (45%) government and liberty (54%) over security (46%).
Some of the results were surprising. Despite supporting less freedom overall, when Democrats
and liberals were asked directly about choosing liberty or security, both groups overwhelmingly
chose liberty, 60% and 65% respectively. While generally and unsurprisingly being more
favorable to economic liberty, majorities of Republicans and conservatives supported
government intervention in trade policy, which may be an effect of the 2016 presidential
campaign; call it the “Trump Effect.”
Additionally, far more Americans feel less free (38%) than more free (11%) over the past 10
years and their definitions of freedom reflect this reality.
While most individuals would consider more freedom “good” and less freedom “bad” assigning
a moral judgment is not what this study aims to do. There are regulations that limit individual
freedom that most people prefer we have, such as blood alcohol limits for drivers and public
water contamination limits for firms. Most of the American public believes these restrictions are
“good” but they would score as less free in the Index. We hope this study becomes an integral
part of an age-old debate over that proper balance, and how or where Americans see themselves
in this debate.

Long term we aim to find out where that balance resides with the American people, and see how
it changes over time. Perhaps most important we want to look at what future generations believe
about freedom and how their attitudes shift as they become the policymakers of tomorrow.
Acknowledgments and Contributors
Roger Ream, President, The Fund for American Studies
Steve Slattery, Executive Vice President, The Fund for American Studies
Kerri DiNarda Shimko, Director of Communications, The Fund for American Studies
Chris Wilson, President, WPA Intelligence
Brian Phillips, Senior Vice President, WPA Intelligence
Alex Muir, Senior Vice President, WPA Intelligence
Jay Lucas, Data Scientist, WPA Intelligence
Josh Coulter, Project Manager, WPA Intelligence
Sam Swanson, Senior Research Analyst, WPA Intelligence
Gavin Hamilton, Research Analyst, WPA Intelligence
Cassidy McGowan, Junior Research Analyst, WPA Intelligence
Cody Wolfe, Intern, WPA Intelligence
Mike Thompson, Senior Vice President, CRC Public Relations
Keith Appell, Senior Vice President, CRC Public Relations
Dina Fraioli Senior Account Executive, CRC Public Relations,
Maria Hatzikonstantinou, Vice President, CRC Public Relations
Jordan Ecarma, Digital Coordinator, CRC Public Relations
Will Gale, Account Associate, CRC Public Relations
Victoria Kucharski, Account Associate, CRC Public Relations
Data availability
This report as a PDF can be downloaded for free at www.TFAS.org/FreedomIndex. The full
data set published in this report as well as the report as a PDF is available for free at
www.wpaintel.com/FreedomIndex. Researchers are encouraged to contact Trevor Smith at
[email protected] for any questions on the data set.
Citations
Authors: Trevor Smith, Timothy Lee, and Bryon Allen
Title: The Support for Freedom Index
Publisher: The Fund for American Studies
Year: 2017
URL: www.wpaintel.com/FreedomIndex
1
Chapter 1
Freedom in the United States
Freedom in the United States
Freedom is a commonly accepted term ubiquitous in movies, popular media, and throughout the
political world. It is a term used by politicians on both the left and the right to promote and
dissuade argument in an attempt to further their political agenda. Freedom is fluid and either
side of the political isle uses this term to move their own political agenda. Freedom as a term is
difficult and subjective, in that when heard it means something different to every person based
on their own experiences, education, and pre-conceived notions. It is also not something easily
defined.
But what if you could accurately measure support for freedom preserving policies across the
United States by comparing the commonly cited demographic groups? The Freedom Index is an
attempt to gauge support for freedom, understand how Americans define freedom, and then see
how these definitions overlay support.
It is demonstrable that more coercive government philosophy has remained and gained strength
when looking at the 2016 presidential based on three of the more popular candidates: Bernie
Sanders, Hillary Clinton, and Donald Trump. Less coercive government philosophy found its
home with candidates like Ted Cruz, Marco Rubio, Rand Paul, Donald Trump, and a few other
notable Republicans. Clearly, this battle rages on.
Because support for freedom in the United States is not something currently quantified, we
wanted to create a year-over-year index to measure perceptions of freedom and support for
freedom. We will begin to measure changes over time and understand how definitions of and
support for freedom are impacted by external events. Freedom is measured throughout the world
in multiple ways, but none have attempted to measure actual support freedom for or how people
define freedom.
What is Freedom?
The founders intended freedom to mean that we would be free from, or at least as free as
possible from, government coercion. Thus, they developed both vertical and horizontal checks
on government meant to curb any possible coercion; vertical in that they developed a system of
federalism, where power was intentionally diverted between the central government and the
states and horizontal where they diverted power between the multiple branches of government.
In the vertical system (federalism), the states were intended to be an equal partner in power to the
central government. The central government’s powers were clearly delineated and specified, and
more importantly, circumscribed. Those powers not delegated to the central government, nor
prohibited, were reserved for the states.
In the horizontal system, republicanism for the central government is clearly laid out in the first
three articles of the Constitution. In these Articles, each branch was made as a check on the
2
other. Article IV Section 4 also guaranteed and required that every new state form a republican
government. Thus, vertically, power and authority is restricted via the single central government
acting as a check on the state governments and vice versa. Horizontally, power and authority is
restricted through a balance of powers within each government.
Throughout this system of federalism balanced by republicanism, we find that the Founders
desired a functional government, but also one that was limited in its coercive powers over the
citizenry. Why was this necessary? As Madison famously noted in Federalist 51:
If men were angels, no government would be necessary. If angels were to govern men,
neither external nor internal controls on government would be necessary. In framing a
government which is to be administered by men over men, the great difficulty lies in this:
you must first enable the government to control the governed; and in the next place
oblige it to control itself. A dependence on the people is, no doubt, the primary control
on the government; but experience has taught mankind the necessity of auxiliary
precautions.
The Founders were quite clear in their understanding of both the beauty and potential of human
nature. They were also, however, acutely aware of the potential for more vile tendencies of
human nature growing from power. Like them, we have seen multiple out-of-control
governments, led by individuals and groups destroy civilizations since our country’s inception.
We therefore accept that because of human nature, power must be limited and sectioned off and
that this design was intentional.
The intentional design of our government was to promote ordered liberty. The failures, or rather
eventual successes, of our promotion of liberty occurred only through how individuals and
governments defined freedom; freedom of oneself over others (coercion), freedom from
coercion, and acceptance to changes in freedom as it is defined culturally.
Human beings, at our very core, are not mutually exclusive and essentially similar in our desires.
While we all support better lives for our children, there are instincts that we have that can
become corrupted through power. We are not debating this, rather accepting that governments,
like human beings, can slowly destroy freedom through incremental coercion or swiftly carry out
their intentions with unspeakable results. Either way, coercion eventually can destroy individual
and community freedom to pursue life, liberty, and property.
We accept this notion as fact that is undebatable. What is debatable is the amount of coercion
necessary to promote ordered liberty. Thus, we approached this study with one difficult problem:
the debate over freedom and coercion has never been quantified or to this day properly answered.
The solutions to solving this dilemma present three testable questions.
1) What are Americans’ perceptions of freedom;
2) How do Americans define freedom; and,
3) Do people support freedom as less coercion by government?
We believe that this study is a first step in answering the coercion question.

3
4
Chapter 2
Perceptions of Freedom
How do Americans perceive freedom as currently viewed and what is the ideal level of freedom?
We attempt to answer these questions with two ten point scales and then correlate these
responses to try and understand how respondents actually define freedom.
For the scales we gather the respondents into tertiles.
8-10: Absolute Freedom
5-7: Moderate Freedom
0-4: Absence of Freedom
Do we feel Free?
To first gauge freedom, it is important to understand how free adults in the United States actually
feel compared to their ideal freedom. Unsurprisingly, Americans generally support more of an
ideal state of freedom over the amount of freedom they actually have.
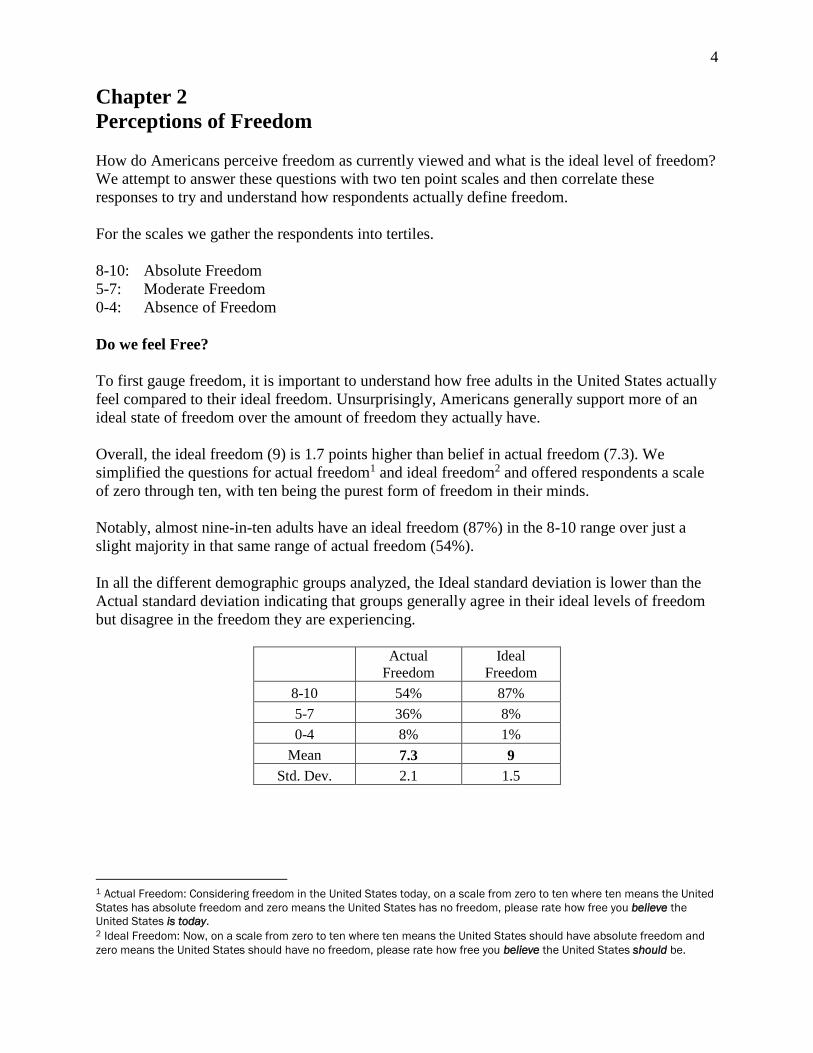
Overall, the ideal freedom (9) is 1.7 points higher than belief in actual freedom (7.3). We
simplified the questions for actual freedom1 and ideal freedom2 and offered respondents a scale
of zero through ten, with ten being the purest form of freedom in their minds.
Notably, almost nine-in-ten adults have an ideal freedom (87%) in the 8-10 range over just a
slight majority in that same range of actual freedom (54%).
In all the different demographic groups analyzed, the Ideal standard deviation is lower than the
Actual standard deviation indicating that groups generally agree in their ideal levels of freedom
but disagree in the freedom they are experiencing.
Actual
Freedom
Ideal
Freedom
8-10 54% 87%
5-7 36% 8%
0-4 8% 1%
Mean 7.3 9
Std. Dev. 2.1 1.5
1 Actual Freedom: Considering freedom in the United States today, on a scale from zero to ten where ten means the United
States has absolute freedom and zero means the United States has no freedom, please rate how free you believe the
United States is today. 2 Ideal Freedom: Now, on a scale from zero to ten where ten means the United States should have absolute freedom and
zero means the United States should have no freedom, please rate how free you believe the United States should be.
5
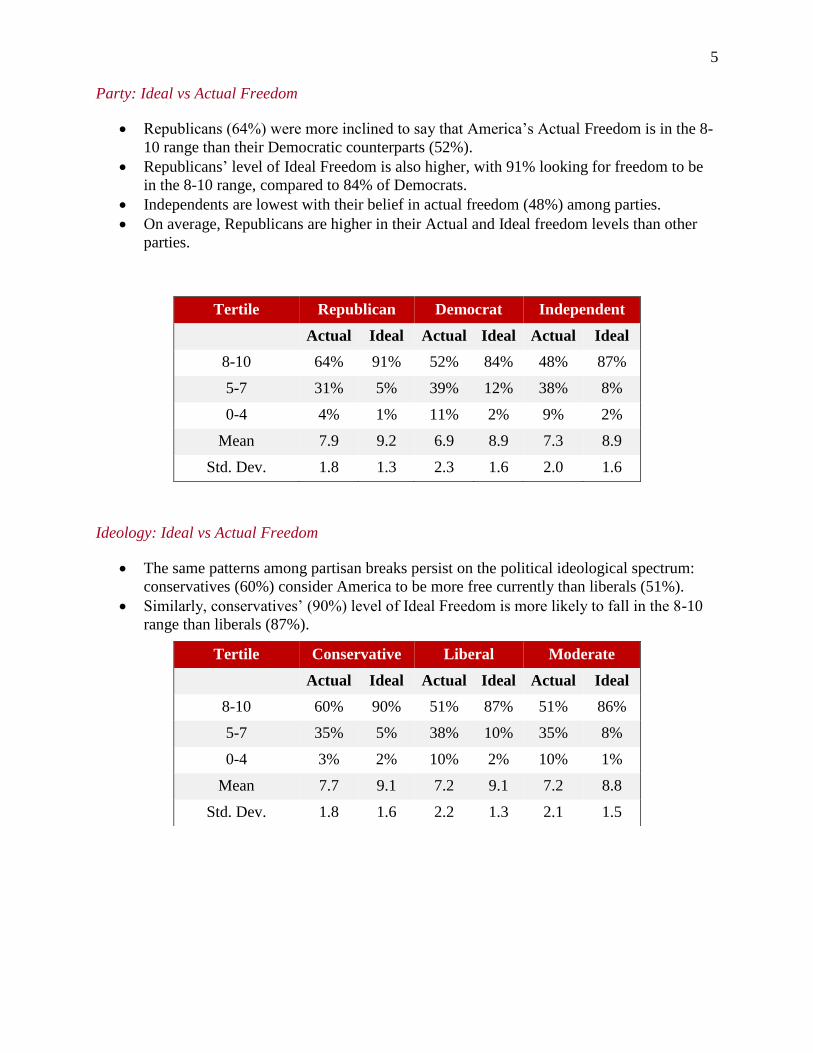
Party: Ideal vs Actual Freedom
• Republicans (64%) were more inclined to say that America’s Actual Freedom is in the 8-
10 range than their Democratic counterparts (52%).
• Republicans’ level of Ideal Freedom is also higher, with 91% looking for freedom to be
in the 8-10 range, compared to 84% of Democrats.
• Independents are lowest with their belief in actual freedom (48%) among parties.
• On average, Republicans are higher in their Actual and Ideal freedom levels than other
parties.
Ideology: Ideal vs Actual Freedom
• The same patterns among partisan breaks persist on the political ideological spectrum:
conservatives (60%) consider America to be more free currently than liberals (51%).
• Similarly, conservatives’ (90%) level of Ideal Freedom is more likely to fall in the 8-10
range than liberals (87%).
Tertile Republican Democrat Independent
Actual Ideal Actual Ideal Actual Ideal
8-10 64% 91% 52% 84% 48% 87%
5-7 31% 5% 39% 12% 38% 8%
0-4 4% 1% 11% 2% 9% 2%
Mean 7.9 9.2 6.9 8.9 7.3 8.9
Std. Dev. 1.8 1.3 2.3 1.6 2.0 1.6
Tertile Conservative Liberal Moderate
Actual Ideal Actual Ideal Actual Ideal
8-10 60% 90% 51% 87% 51% 86%
5-7 35% 5% 38% 10% 35% 8%
0-4 3% 2% 10% 2% 10% 1%
Mean 7.7 9.1 7.2 9.1 7.2 8.8
Std. Dev. 1.8 1.6 2.2 1.3 2.1 1.5
6
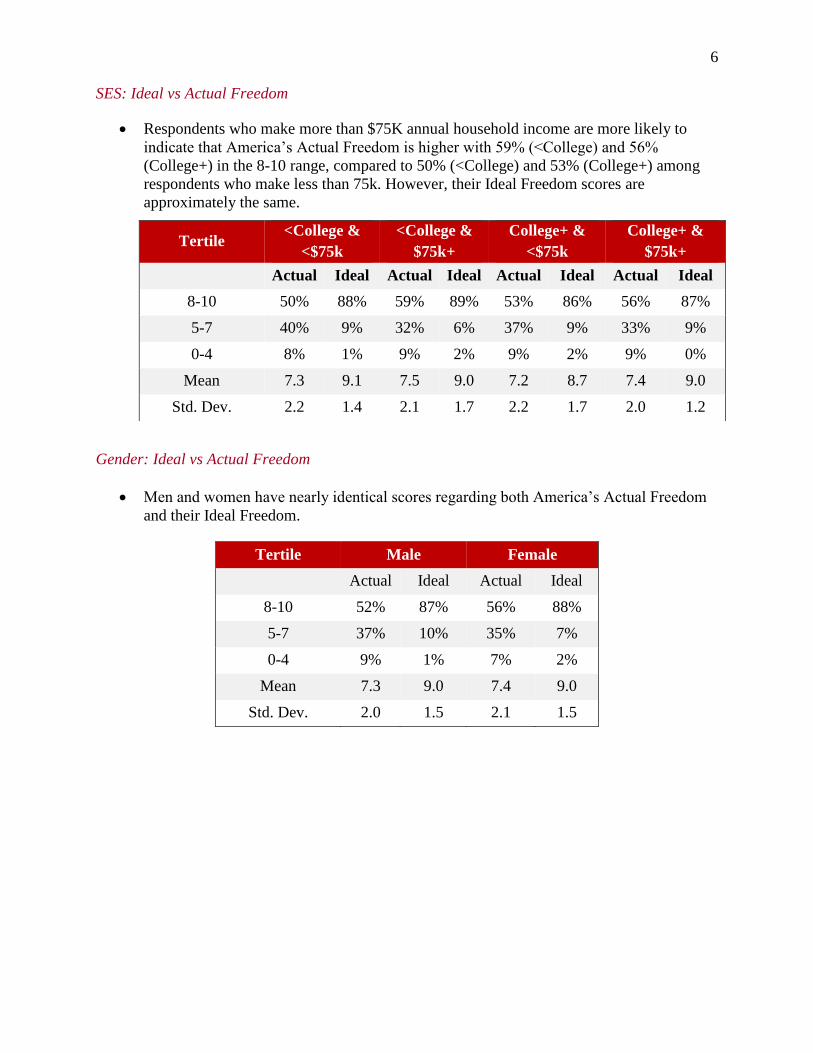
SES: Ideal vs Actual Freedom
• Respondents who make more than $75K annual household income are more likely to
indicate that America’s Actual Freedom is higher with 59% (<College) and 56%
(College+) in the 8-10 range, compared to 50% (<College) and 53% (College+) among
respondents who make less than 75k. However, their Ideal Freedom scores are
approximately the same.
Gender: Ideal vs Actual Freedom
• Men and women have nearly identical scores regarding both America’s Actual Freedom
and their Ideal Freedom.
Tertile <College &
<$75k
<College &
$75k+
College+ &
<$75k
College+ &
$75k+
Actual Ideal Actual Ideal Actual Ideal Actual Ideal
8-10 50% 88% 59% 89% 53% 86% 56% 87%
5-7 40% 9% 32% 6% 37% 9% 33% 9%
0-4 8% 1% 9% 2% 9% 2% 9% 0%
Mean 7.3 9.1 7.5 9.0 7.2 8.7 7.4 9.0
Std. Dev. 2.2 1.4 2.1 1.7 2.2 1.7 2.0 1.2
Tertile Male Female
Actual Ideal Actual Ideal
8-10 52% 87% 56% 88%
5-7 37% 10% 35% 7%
0-4 9% 1% 7% 2%
Mean 7.3 9.0 7.4 9.0
Std. Dev. 2.0 1.5 2.1 1.5
7
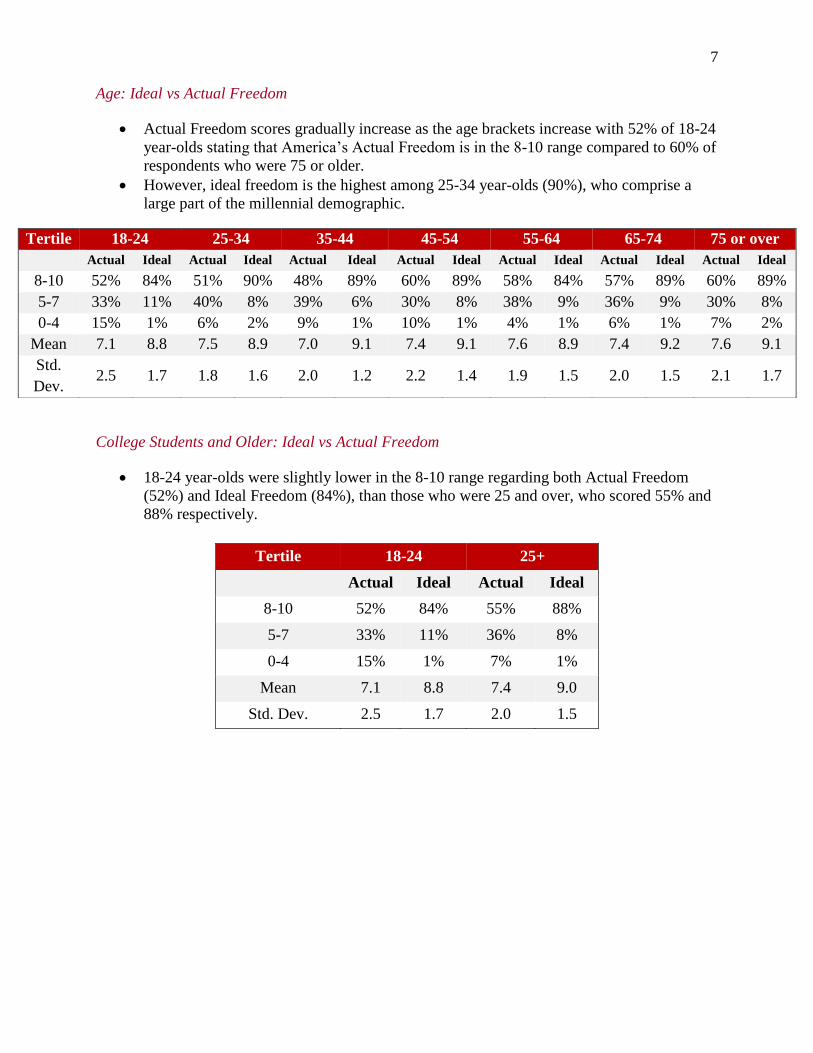
Age: Ideal vs Actual Freedom
• Actual Freedom scores gradually increase as the age brackets increase with 52% of 18-24
year-olds stating that America’s Actual Freedom is in the 8-10 range compared to 60% of
respondents who were 75 or older.
• However, ideal freedom is the highest among 25-34 year-olds (90%), who comprise a
large part of the millennial demographic.
College Students and Older: Ideal vs Actual Freedom
• 18-24 year-olds were slightly lower in the 8-10 range regarding both Actual Freedom
(52%) and Ideal Freedom (84%), than those who were 25 and over, who scored 55% and
88% respectively.
Tertile 18-24 25-34 35-44 45-54 55-64 65-74 75 or over
Actual Ideal Actual Ideal Actual Ideal Actual Ideal Actual Ideal Actual Ideal Actual Ideal
8-10 52% 84% 51% 90% 48% 89% 60% 89% 58% 84% 57% 89% 60% 89%
5-7 33% 11% 40% 8% 39% 6% 30% 8% 38% 9% 36% 9% 30% 8%
0-4 15% 1% 6% 2% 9% 1% 10% 1% 4% 1% 6% 1% 7% 2%
Mean 7.1 8.8 7.5 8.9 7.0 9.1 7.4 9.1 7.6 8.9 7.4 9.2 7.6 9.1
Std.
Dev. 2.5 1.7 1.8 1.6 2.0 1.2 2.2 1.4 1.9 1.5 2.0 1.5 2.1 1.7
Tertile 18-24 25+
Actual Ideal Actual Ideal
8-10 52% 84% 55% 88%
5-7 33% 11% 36% 8%
0-4 15% 1% 7% 1%
Mean 7.1 8.8 7.4 9.0
Std. Dev. 2.5 1.7 2.0 1.5
8
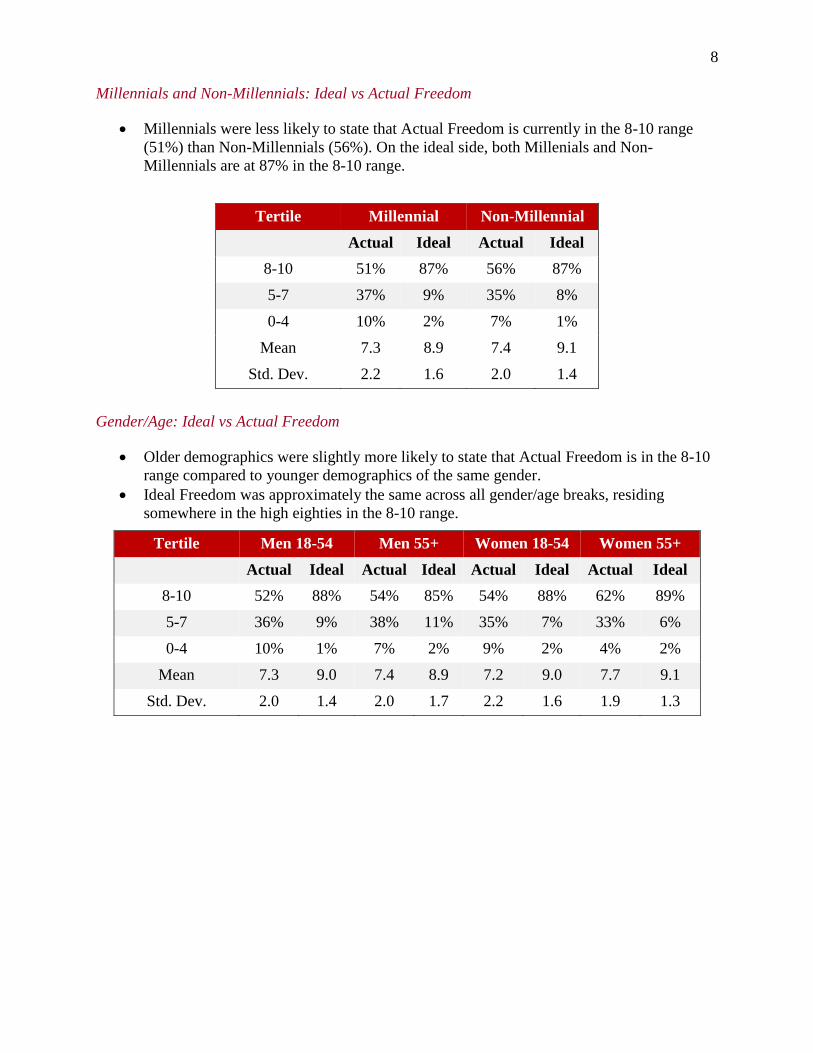
Millennials and Non-Millennials: Ideal vs Actual Freedom
• Millennials were less likely to state that Actual Freedom is currently in the 8-10 range
(51%) than Non-Millennials (56%). On the ideal side, both Millenials and Non-
Millennials are at 87% in the 8-10 range.
Gender/Age: Ideal vs Actual Freedom
• Older demographics were slightly more likely to state that Actual Freedom is in the 8-10
range compared to younger demographics of the same gender. • Ideal Freedom was approximately the same across all gender/age breaks, residing
somewhere in the high eighties in the 8-10 range.
Tertile Millennial Non-Millennial
Actual Ideal Actual Ideal
8-10 51% 87% 56% 87%
5-7 37% 9% 35% 8%
0-4 10% 2% 7% 1%
Mean 7.3 8.9 7.4 9.1
Std. Dev. 2.2 1.6 2.0 1.4
Tertile Men 18-54 Men 55+ Women 18-54 Women 55+
Actual Ideal Actual Ideal Actual Ideal Actual Ideal
8-10 52% 88% 54% 85% 54% 88% 62% 89%
5-7 36% 9% 38% 11% 35% 7% 33% 6%
0-4 10% 1% 7% 2% 9% 2% 4% 2%
Mean 7.3 9.0 7.4 8.9 7.2 9.0 7.7 9.1
Std. Dev. 2.0 1.4 2.0 1.7 2.2 1.6 1.9 1.3
9
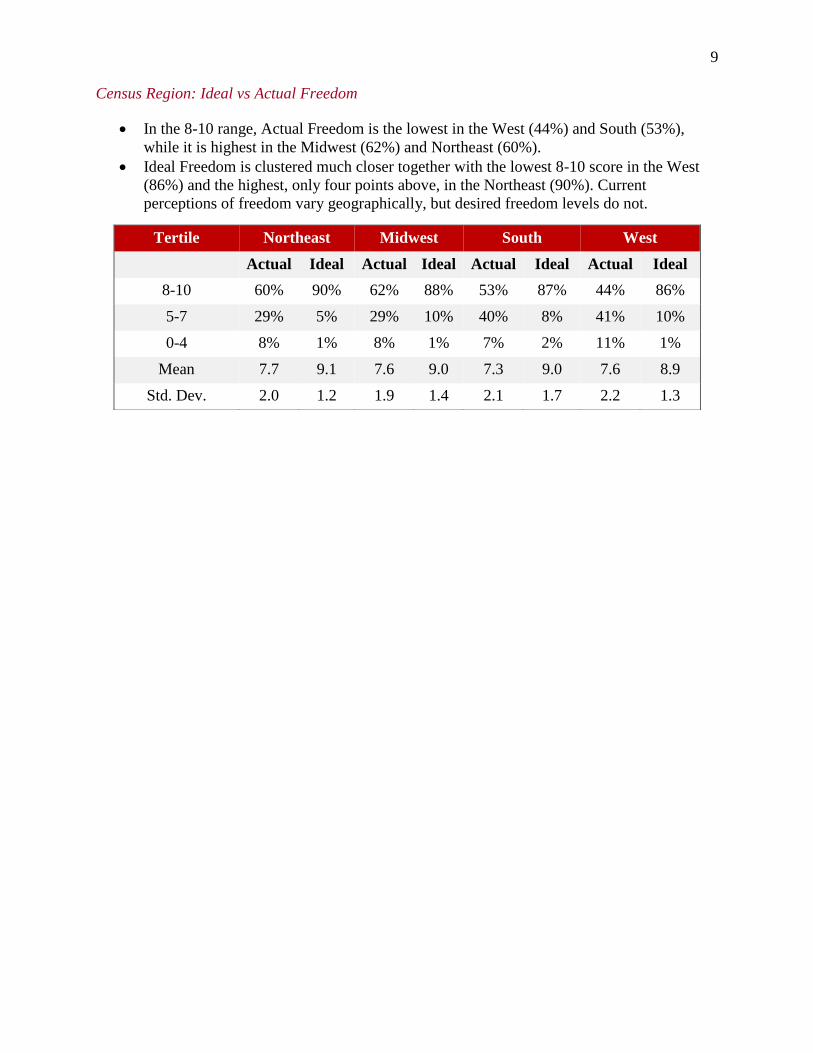
Census Region: Ideal vs Actual Freedom
• In the 8-10 range, Actual Freedom is the lowest in the West (44%) and South (53%),
while it is highest in the Midwest (62%) and Northeast (60%). • Ideal Freedom is clustered much closer together with the lowest 8-10 score in the West
(86%) and the highest, only four points above, in the Northeast (90%). Current
perceptions of freedom vary geographically, but desired freedom levels do not.
Tertile Northeast Midwest South West
Actual Ideal Actual Ideal Actual Ideal Actual Ideal
8-10 60% 90% 62% 88% 53% 87% 44% 86%
5-7 29% 5% 29% 10% 40% 8% 41% 10%
0-4 8% 1% 8% 1% 7% 2% 11% 1%
Mean 7.7 9.1 7.6 9.0 7.3 9.0 7.6 8.9
Std. Dev. 2.0 1.2 1.9 1.4 2.1 1.7 2.2 1.3

10
11
Chapter 3
Definitions of Freedom
Defining freedom is no easy task. In its simplest form freedom is to do as one pleases, but in an
ordered society this is not realistic. Parents must restrict children, laws must restrict the negative
actions of one over the other, people must restrict their government, and governments must
restrict themselves.
To understand how people define freedom, we took two static questions and combined them with
a dynamic question, creating a total of 18 different possible definitions of freedom. The static
questions are simple; first, do you believe that government should behave in a more active or
more passive manner; and second, when it comes to serious questions regarding liberty versus
security, which position would one choose? Our dynamic question is an attempt to measure both
a belief in how the world has changed over the past decade and also, in a retrospective and
outside lens fashion, allow readers to compare to a decade’s worth of political events.
As we delve into the minds of Americans, there is clearly a cross pollination of definitions with
people from various different groups.
Role of Government3
Active – Respondents noted that they want a more active role of government in their daily lives.
Overall, 42% of respondents selected this.
Both – Respondents noted that they want both an active and passive role of government in their
daily lives. Overall, 6% of respondents selected this.
Passive – Respondents noted that they want a less active or passive role of government in their
daily lives. Overall, 44% of respondents selected this.
3 I am going to read you two points of view about freedom and security in the United States and please tell me
which one you agree with more.
(Some/Other) people say that it is important for the government to take an active role in our daily lives in order
to keep us secure from both threats abroad and domestic issues such as poverty, wealth distribution, and
corruption.
…while…
(Some/Other) people say that it is important for the government to take a passive role in our daily lives and
allow citizens to have the liberty to choose the life they want to live, trusting that people will take care of each
other.
12
Current Freedom Compared to Ten Years Ago4
More Free – Respondents noted that they feel more free than they were ten years ago. Overall,
11% of respondents selected this.
Same – Respondents noted that they feel about as free as they were ten years ago. Overall, a
plurality (49%) selected this.
Less Free – Respondents selected punches 5 and 6 in the survey. They feel that they are less free
than they were ten years ago. Overall, 38% of respondents selected this.
Liberty vs Security5
Liberty – Respondents selected punch 1 in the survey. They note that when concerns about
security and liberty should conflict, they would choose liberty over security. Overall, 51% of
respondents selected this.
Security – Respondents selected punch 3 in the survey. They note that when concerns about
security and liberty should conflict, they would choose security over liberty. Overall, 40% of
respondents selected this.
Note: Only respondents who gave a response to all three questions are included in these
definitions.
4 Do you believe that you are ROTATE more or less END ROTATION free now than you were ten years ago, or
would you say you were about as free then as you are now? 5 If individual liberty and concerns about security should conflict, would you be inclined to favor ROTATE liberty
or security?
13
Definitions by Ideology
A plurality of conservatives (18.45%) define freedom as a passive government, feel less free, and
would choose liberty over security. This is closely followed by conservatives (14.54%) who
define freedom as a passive government, feel about the same in the last decade, and would
choose liberty over security. Almost 13% of conservatives define freedom as
Active/Same/Security.
Among liberals, a plurality (23.63%) define freedom as an active government, feel about the
same over the last decade, and would choose liberty over security. Contrarily, almost 11% of
liberals define freedom as Passive/Less Free/Liberty, which would be expected from a
conservative type ideology.
A plurality of moderates (15.26%) would define freedom as an active government, feel about the
same over the last decade, and would choose security over liberty. Continuing on the active side
of the definition, another 12.7% of moderates would define freedom as Active/Same/Liberty.
Importantly, in contrast to liberals (10.92%) and moderates (12.77%), conservatives (18.45%)
generally define freedom as passive/less free/liberty.
Conservatives: n=301 or 37% of sample
Moderates: n=284 or 35% of sample
Liberals: n=174 or 22% of sample

14
Definition (Size) Conservative Liberal Moderate
Active/More Free/Liberty (3.1%) 1.79% 4.44% 3.67%
Active/More Free/Security (3.5%) 3.06% 4.27% 3.53%
Active/Same/Liberty (13.4%) 8.73% 23.63% 12.70%
Active/Same/Security (12.5%) 12.93% 8.69% 15.26%
Active/Less Free/Liberty (7.9%) 3.41% 14.44% 7.57%
Active/Less Free/Security (7.0%) 8.45% 6.10% 7.00%
Both/More Free/Liberty (0.0%) 0% 0% 0%
Both/More Free/Security (0.4%) 0.19% 1.59% 0%
Both/Same/Liberty (1.2%) 0.39% 1.21% 1.67%
Both/Same/Security (2.4%) 2.16% 0.32% 2.94%
Both/Less Free/Liberty (0.8%) 0.91% 0.57% 0.54%
Both/Less Free/Security (0.3%) 0.47% 0% 0.47%
Passive/More Free/Liberty (2.4%) 2.41% 2.87% 1.54%
Passive/More Free/Security (2.4%) 3.60% 0.78% 1.59%
Passive/Same/Liberty (12.3%) 14.54% 9.55% 12.44%
Passive/Same/Security (10.0%) 11.15% 8.02% 10.55%
Passive/Less Free/Liberty (14.9%) 18.45% 10.92% 12.77%
Passive/Less Free/Security (5.4%) 7.36% 2.60% 5.79%
15
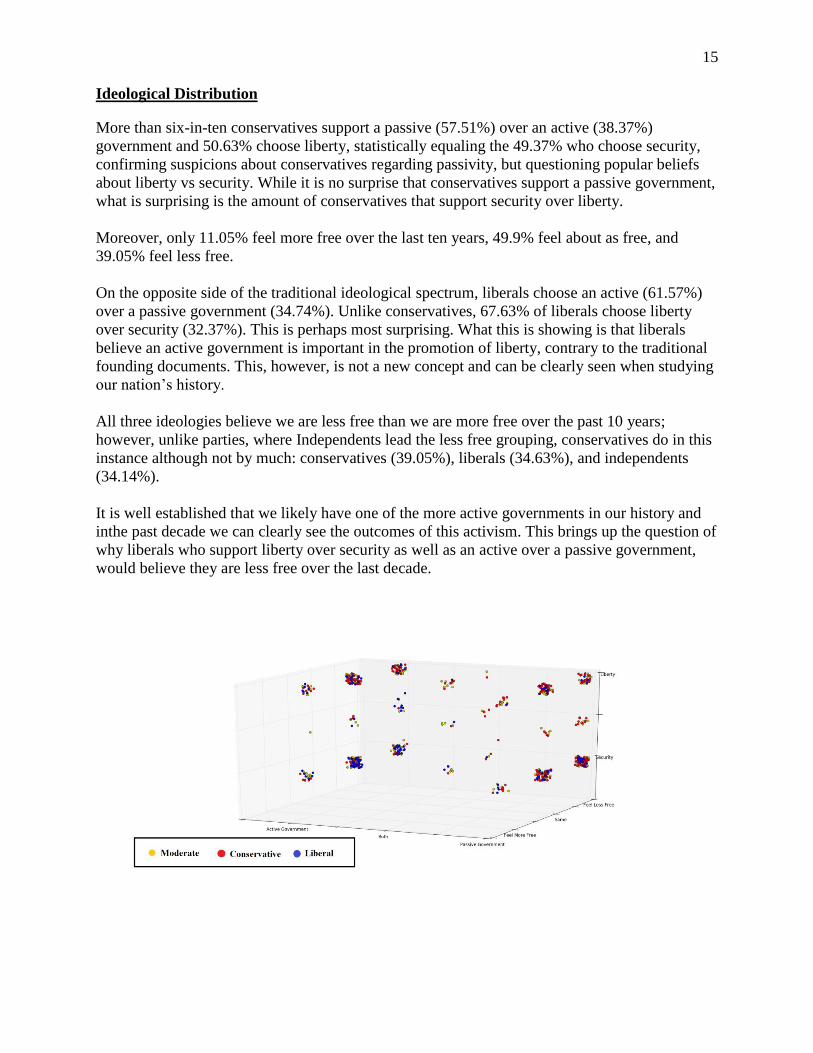
Ideological Distribution
More than six-in-ten conservatives support a passive (57.51%) over an active (38.37%)
government and 50.63% choose liberty, statistically equaling the 49.37% who choose security,
confirming suspicions about conservatives regarding passivity, but questioning popular beliefs
about liberty vs security. While it is no surprise that conservatives support a passive government,
what is surprising is the amount of conservatives that support security over liberty.
Moreover, only 11.05% feel more free over the last ten years, 49.9% feel about as free, and
39.05% feel less free.
On the opposite side of the traditional ideological spectrum, liberals choose an active (61.57%)
over a passive government (34.74%). Unlike conservatives, 67.63% of liberals choose liberty
over security (32.37%). This is perhaps most surprising. What this is showing is that liberals
believe an active government is important in the promotion of liberty, contrary to the traditional
founding documents. This, however, is not a new concept and can be clearly seen when studying
our nation’s history.
All three ideologies believe we are less free than we are more free over the past 10 years;
however, unlike parties, where Independents lead the less free grouping, conservatives do in this
instance although not by much: conservatives (39.05%), liberals (34.63%), and independents
(34.14%).
It is well established that we likely have one of the more active governments in our history and
inthe past decade we can clearly see the outcomes of this activism. This brings up the question of
why liberals who support liberty over security as well as an active over a passive government,
would believe they are less free over the last decade.
16
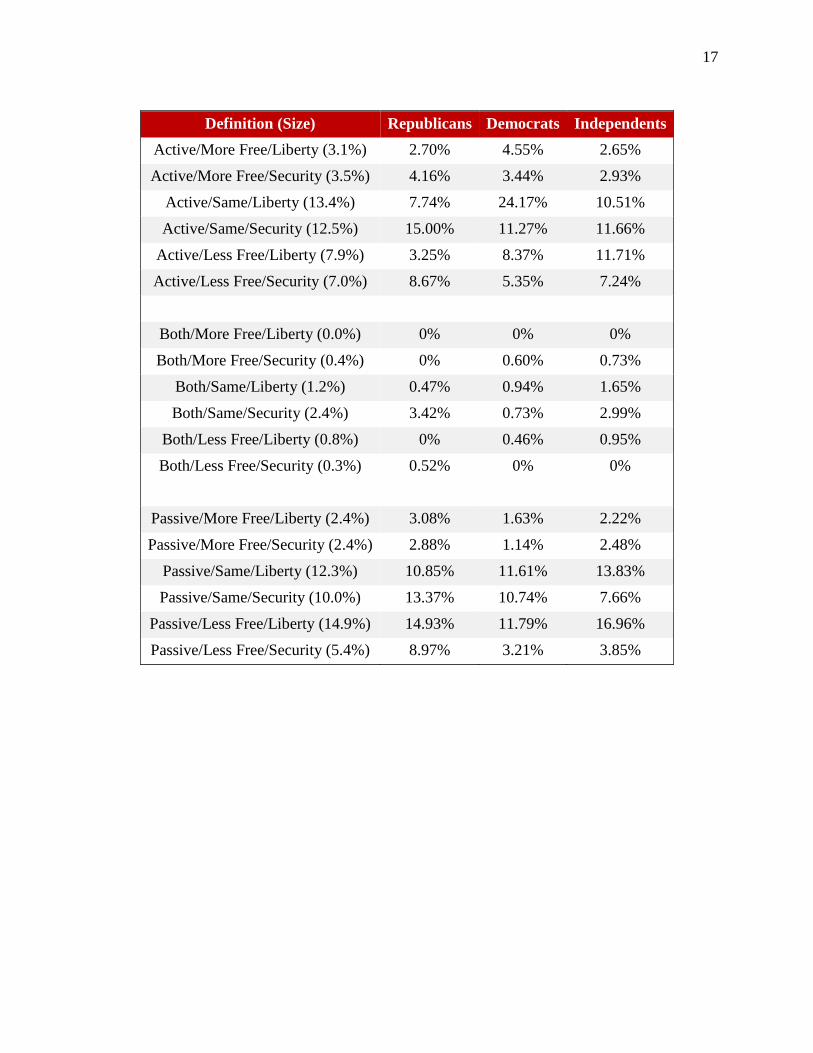
Definitions by Party
Republicans (14.93%) define freedom as a passive government, less free, and choose liberty over
security. The same amount, statistically, (15.00%) define freedom as an active government, feel
about the same over the last decade, and would choose security over liberty.
Among Democrats, a plurality (24.17%) define freedom as an active government, feel about the
same over the last decade, and would choose liberty over security. This is no different than with
liberals. However, 40% of Democrats define government as passive.
Independents (16.96%) define freedom as a passive government, less free, and choose liberty
over security.
Republicans: n=247 or 31% of sample
Independents: n=299 or 37% of sample
Democrats: n=222 or 28% of sample
17
Definition (Size) Republicans Democrats Independents
Active/More Free/Liberty (3.1%) 2.70% 4.55% 2.65%
Active/More Free/Security (3.5%) 4.16% 3.44% 2.93%
Active/Same/Liberty (13.4%) 7.74% 24.17% 10.51%
Active/Same/Security (12.5%) 15.00% 11.27% 11.66%
Active/Less Free/Liberty (7.9%) 3.25% 8.37% 11.71%
Active/Less Free/Security (7.0%) 8.67% 5.35% 7.24%
Both/More Free/Liberty (0.0%) 0% 0% 0%
Both/More Free/Security (0.4%) 0% 0.60% 0.73%
Both/Same/Liberty (1.2%) 0.47% 0.94% 1.65%
Both/Same/Security (2.4%) 3.42% 0.73% 2.99%
Both/Less Free/Liberty (0.8%) 0% 0.46% 0.95%
Both/Less Free/Security (0.3%) 0.52% 0% 0%
Passive/More Free/Liberty (2.4%) 3.08% 1.63% 2.22%
Passive/More Free/Security (2.4%) 2.88% 1.14% 2.48%
Passive/Same/Liberty (12.3%) 10.85% 11.61% 13.83%
Passive/Same/Security (10.0%) 13.37% 10.74% 7.66%
Passive/Less Free/Liberty (14.9%) 14.93% 11.79% 16.96%
Passive/Less Free/Security (5.4%) 8.97% 3.21% 3.85%
18
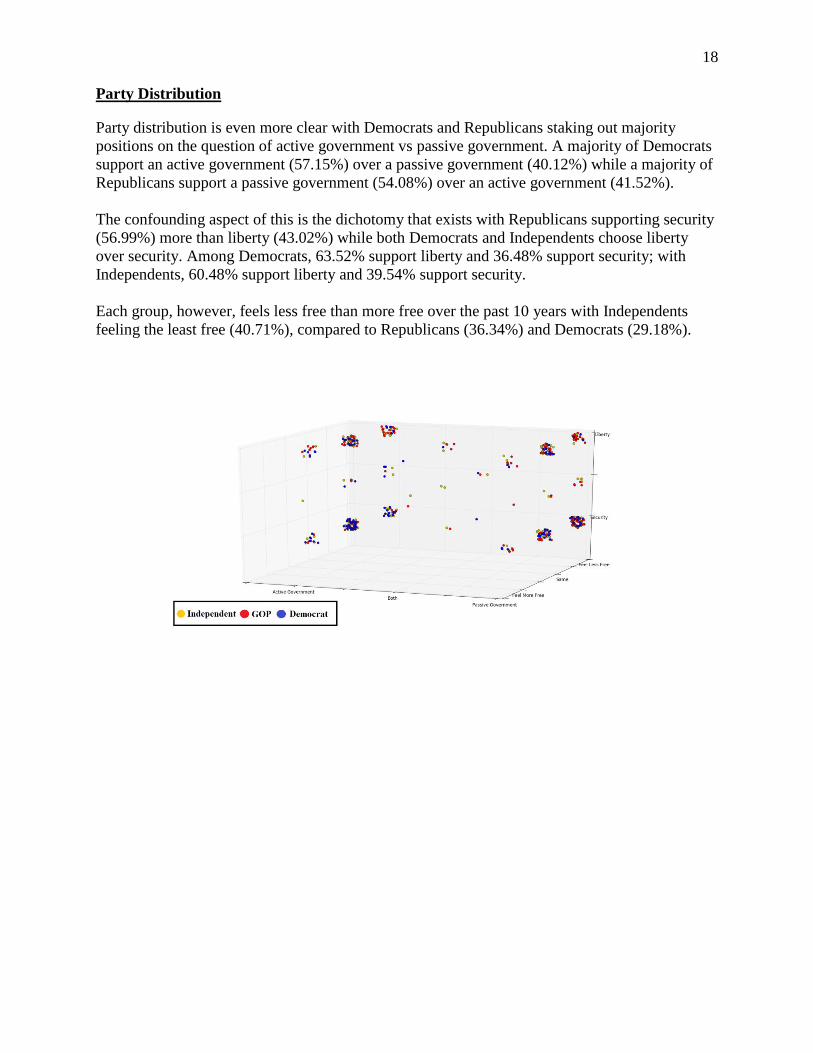
Party Distribution
Party distribution is even more clear with Democrats and Republicans staking out majority
positions on the question of active government vs passive government. A majority of Democrats
support an active government (57.15%) over a passive government (40.12%) while a majority of
Republicans support a passive government (54.08%) over an active government (41.52%).
The confounding aspect of this is the dichotomy that exists with Republicans supporting security
(56.99%) more than liberty (43.02%) while both Democrats and Independents choose liberty
over security. Among Democrats, 63.52% support liberty and 36.48% support security; with
Independents, 60.48% support liberty and 39.54% support security.
Each group, however, feels less free than more free over the past 10 years with Independents
feeling the least free (40.71%), compared to Republicans (36.34%) and Democrats (29.18%).
19
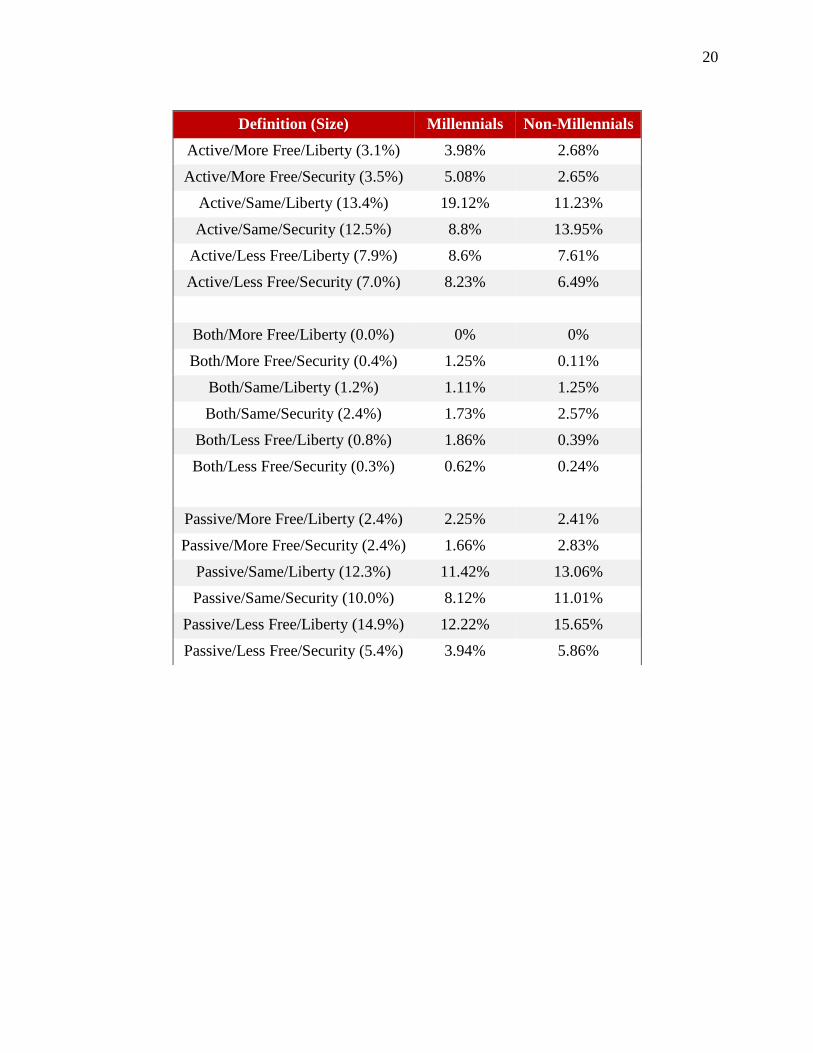
Definitions by Generation
A plurality of Millennials (19.12%) define freedom as an active government, feel about the same
over the last decade, and would choose liberty over security. This is followed by 12.22% of
Millennials who define freedom as a passive government, feel less free, and would choose liberty
over security.
Non-Millennials define freedom as a passive government, feel less free, and would choose
liberty over security (15.65%).
Millennials: n=232 or 29% of sample
Non-Millennials: n=545 or 68% of sample
20
Definition (Size) Millennials Non-Millennials
Active/More Free/Liberty (3.1%) 3.98% 2.68%
Active/More Free/Security (3.5%) 5.08% 2.65%
Active/Same/Liberty (13.4%) 19.12% 11.23%
Active/Same/Security (12.5%) 8.8% 13.95%
Active/Less Free/Liberty (7.9%) 8.6% 7.61%
Active/Less Free/Security (7.0%) 8.23% 6.49%
Both/More Free/Liberty (0.0%) 0% 0%
Both/More Free/Security (0.4%) 1.25% 0.11%
Both/Same/Liberty (1.2%) 1.11% 1.25%
Both/Same/Security (2.4%) 1.73% 2.57%
Both/Less Free/Liberty (0.8%) 1.86% 0.39%
Both/Less Free/Security (0.3%) 0.62% 0.24%
Passive/More Free/Liberty (2.4%) 2.25% 2.41%
Passive/More Free/Security (2.4%) 1.66% 2.83%
Passive/Same/Liberty (12.3%) 11.42% 13.06%
Passive/Same/Security (10.0%) 8.12% 11.01%
Passive/Less Free/Liberty (14.9%) 12.22% 15.65%
Passive/Less Free/Security (5.4%) 3.94% 5.86%
21
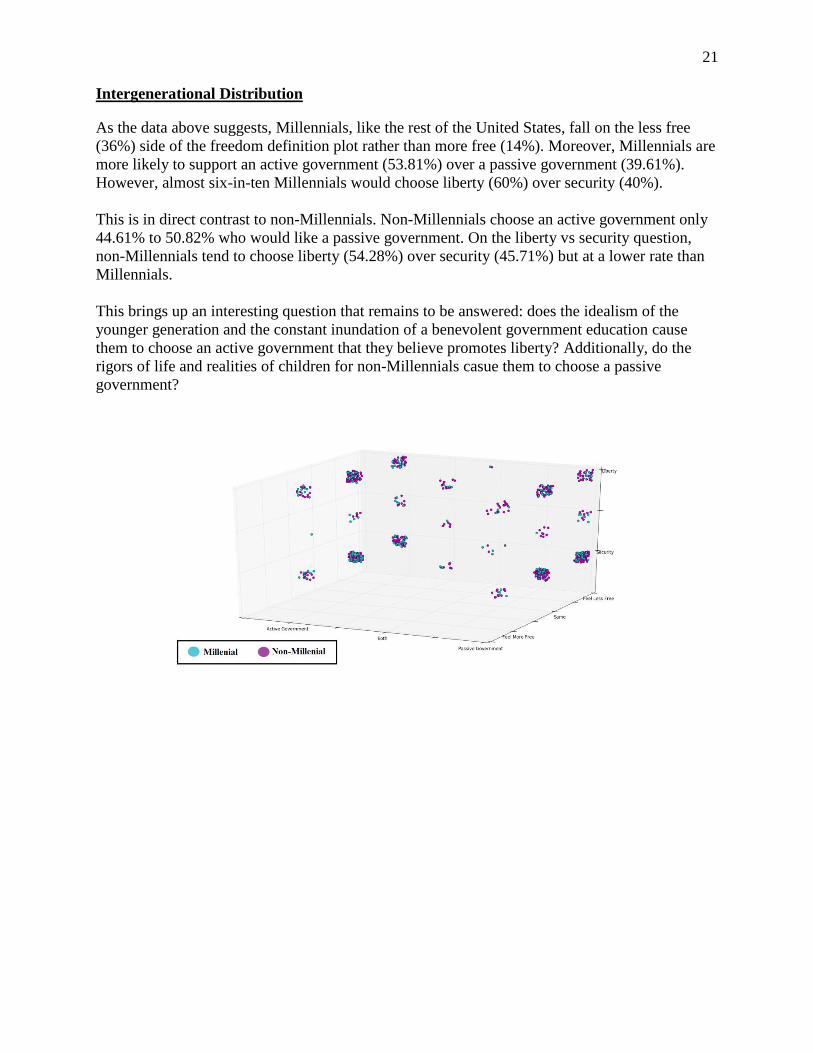
Intergenerational Distribution
As the data above suggests, Millennials, like the rest of the United States, fall on the less free
(36%) side of the freedom definition plot rather than more free (14%). Moreover, Millennials are
more likely to support an active government (53.81%) over a passive government (39.61%).
However, almost six-in-ten Millennials would choose liberty (60%) over security (40%).
This is in direct contrast to non-Millennials. Non-Millennials choose an active government only
44.61% to 50.82% who would like a passive government. On the liberty vs security question,
non-Millennials tend to choose liberty (54.28%) over security (45.71%) but at a lower rate than
Millennials.
This brings up an interesting question that remains to be answered: does the idealism of the
younger generation and the constant inundation of a benevolent government education cause
them to choose an active government that they believe promotes liberty? Additionally, do the
rigors of life and realities of children for non-Millennials casue them to choose a passive
government?

22
23
Chapter 4
Freedom Support Scores
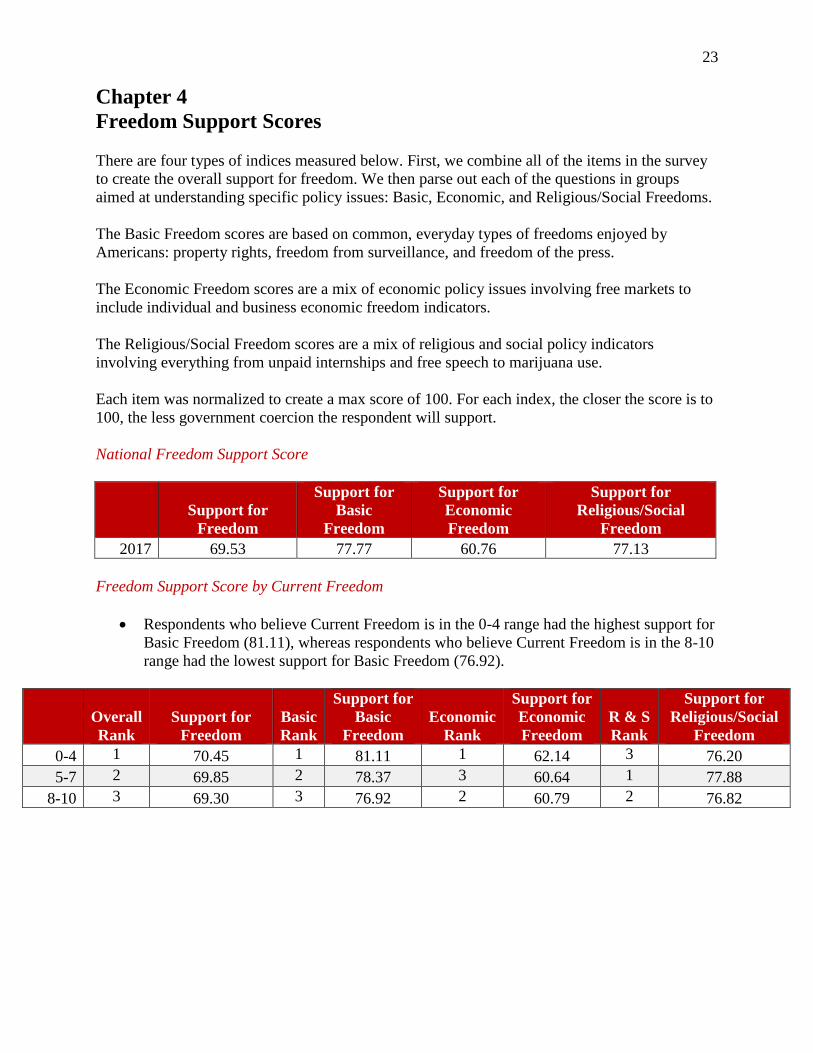
There are four types of indices measured below. First, we combine all of the items in the survey
to create the overall support for freedom. We then parse out each of the questions in groups
aimed at understanding specific policy issues: Basic, Economic, and Religious/Social Freedoms.
The Basic Freedom scores are based on common, everyday types of freedoms enjoyed by
Americans: property rights, freedom from surveillance, and freedom of the press.
The Economic Freedom scores are a mix of economic policy issues involving free markets to
include individual and business economic freedom indicators.
The Religious/Social Freedom scores are a mix of religious and social policy indicators
involving everything from unpaid internships and free speech to marijuana use.
Each item was normalized to create a max score of 100. For each index, the closer the score is to
100, the less government coercion the respondent will support.
National Freedom Support Score
Support for
Freedom
Support for
Basic
Freedom
Support for
Economic
Freedom
Support for
Religious/Social
Freedom
2017 69.53 77.77 60.76 77.13
Freedom Support Score by Current Freedom
• Respondents who believe Current Freedom is in the 0-4 range had the highest support for
Basic Freedom (81.11), whereas respondents who believe Current Freedom is in the 8-10
range had the lowest support for Basic Freedom (76.92).
Overall
Rank
Support for
Freedom
Basic
Rank
Support for
Basic
Freedom
Economic
Rank
Support for
Economic
Freedom
R & S
Rank
Support for
Religious/Social
Freedom
0-4 1 70.45 1 81.11 1 62.14 3 76.20
5-7 2 69.85 2 78.37 3 60.64 1 77.88
8-10 3 69.30 3 76.92 2 60.79 2 76.82
24
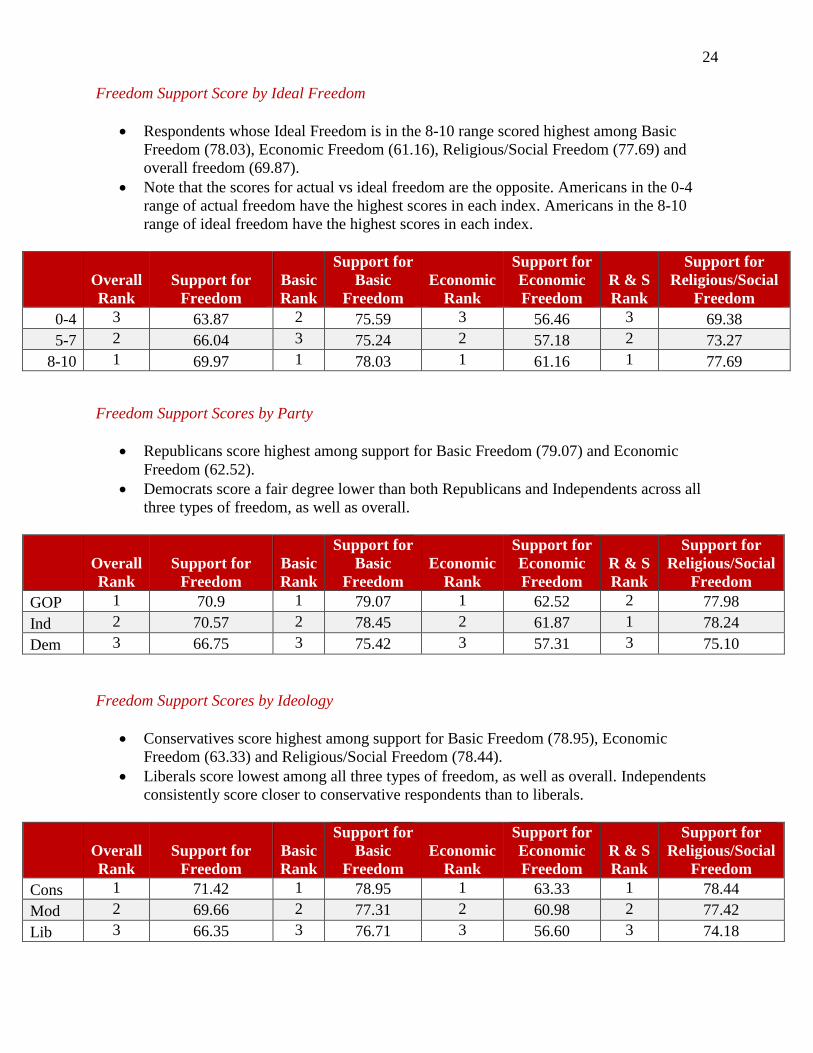
Freedom Support Score by Ideal Freedom
• Respondents whose Ideal Freedom is in the 8-10 range scored highest among Basic
Freedom (78.03), Economic Freedom (61.16), Religious/Social Freedom (77.69) and
overall freedom (69.87).
• Note that the scores for actual vs ideal freedom are the opposite. Americans in the 0-4
range of actual freedom have the highest scores in each index. Americans in the 8-10
range of ideal freedom have the highest scores in each index.
Overall
Rank
Support for
Freedom
Basic
Rank
Support for
Basic
Freedom
Economic
Rank
Support for
Economic
Freedom
R & S
Rank
Support for
Religious/Social
Freedom
0-4 3 63.87 2 75.59 3 56.46 3 69.38
5-7 2 66.04 3 75.24 2 57.18 2 73.27
8-10 1 69.97 1 78.03 1 61.16 1 77.69
Freedom Support Scores by Party
• Republicans score highest among support for Basic Freedom (79.07) and Economic
Freedom (62.52).
• Democrats score a fair degree lower than both Republicans and Independents across all
three types of freedom, as well as overall.
Overall
Rank
Support for
Freedom
Basic
Rank
Support for
Basic
Freedom
Economic
Rank
Support for
Economic
Freedom
R & S
Rank
Support for
Religious/Social
Freedom
GOP 1 70.9 1 79.07 1 62.52 2 77.98
Ind 2 70.57 2 78.45 2 61.87 1 78.24
Dem 3 66.75 3 75.42 3 57.31 3 75.10
Freedom Support Scores by Ideology
• Conservatives score highest among support for Basic Freedom (78.95), Economic
Freedom (63.33) and Religious/Social Freedom (78.44).
• Liberals score lowest among all three types of freedom, as well as overall. Independents
consistently score closer to conservative respondents than to liberals.
Overall
Rank
Support for
Freedom
Basic
Rank
Support for
Basic
Freedom
Economic
Rank
Support for
Economic
Freedom
R & S
Rank
Support for
Religious/Social
Freedom
Cons 1 71.42 1 78.95 1 63.33 1 78.44
Mod 2 69.66 2 77.31 2 60.98 2 77.42
Lib 3 66.35 3 76.71 3 56.60 3 74.18
25
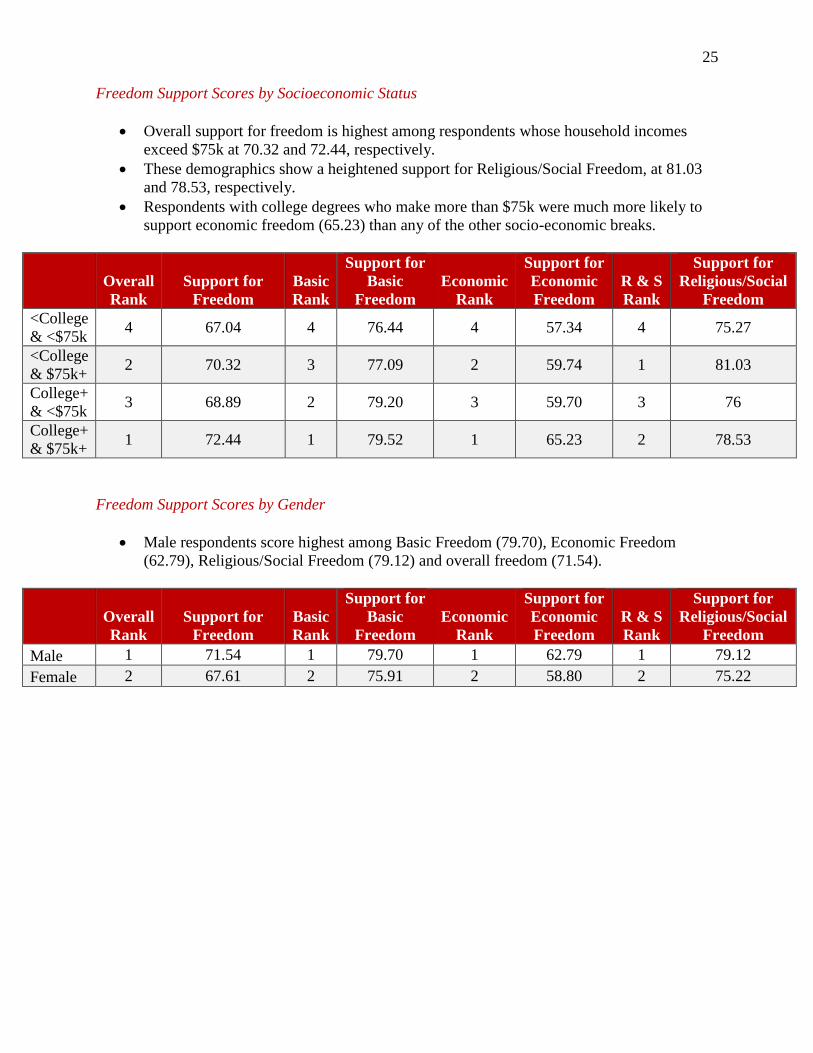
Freedom Support Scores by Socioeconomic Status
• Overall support for freedom is highest among respondents whose household incomes
exceed $75k at 70.32 and 72.44, respectively.
• These demographics show a heightened support for Religious/Social Freedom, at 81.03
and 78.53, respectively.
• Respondents with college degrees who make more than $75k were much more likely to
support economic freedom (65.23) than any of the other socio-economic breaks.
Overall
Rank
Support for
Freedom
Basic
Rank
Support for
Basic
Freedom
Economic
Rank
Support for
Economic
Freedom
R & S
Rank
Support for
Religious/Social
Freedom
<College
& <$75k 4 67.04 4 76.44 4 57.34 4 75.27
<College
& $75k+ 2 70.32 3 77.09 2 59.74 1 81.03
College+
& <$75k 3 68.89 2 79.20 3 59.70 3 76
College+
& $75k+ 1 72.44 1 79.52 1 65.23 2 78.53
Freedom Support Scores by Gender
• Male respondents score highest among Basic Freedom (79.70), Economic Freedom
(62.79), Religious/Social Freedom (79.12) and overall freedom (71.54).
Overall
Rank
Support for
Freedom
Basic
Rank
Support for
Basic
Freedom
Economic
Rank
Support for
Economic
Freedom
R & S
Rank
Support for
Religious/Social
Freedom
Male 1 71.54 1 79.70 1 62.79 1 79.12
Female 2 67.61 2 75.91 2 58.80 2 75.22
26
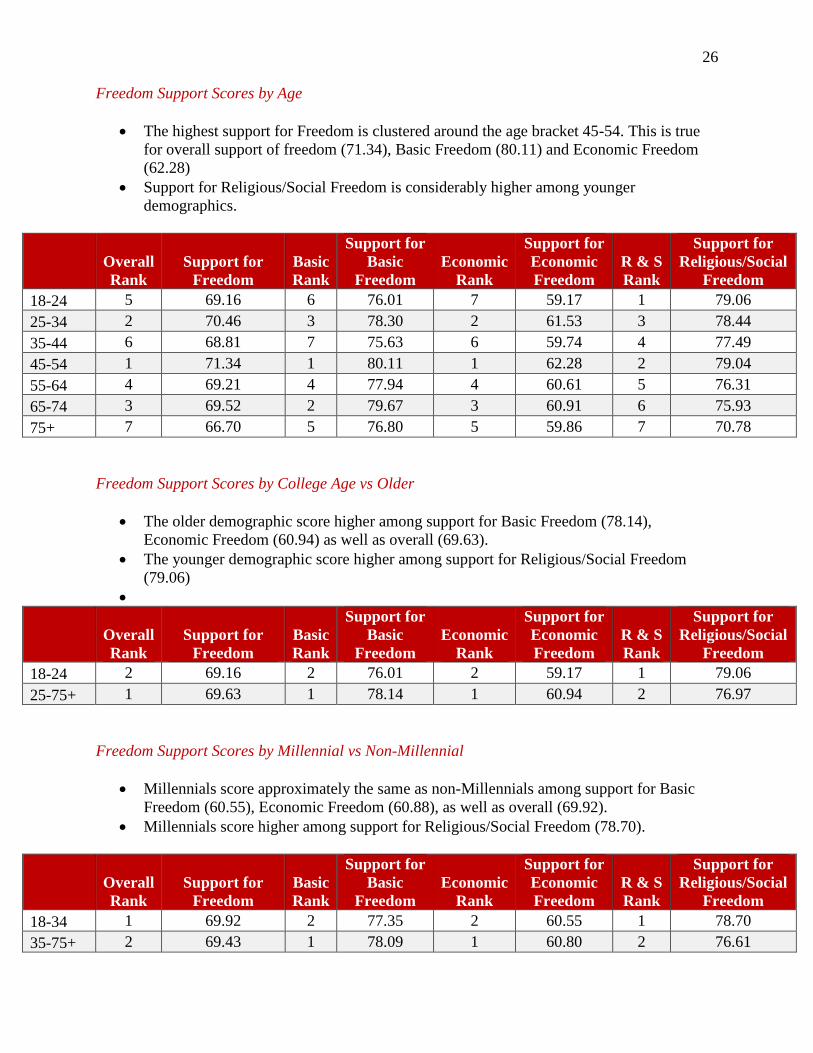
Freedom Support Scores by Age
• The highest support for Freedom is clustered around the age bracket 45-54. This is true
for overall support of freedom (71.34), Basic Freedom (80.11) and Economic Freedom
(62.28)
• Support for Religious/Social Freedom is considerably higher among younger
demographics.
Overall
Rank
Support for
Freedom
Basic
Rank
Support for
Basic
Freedom
Economic
Rank
Support for
Economic
Freedom
R & S
Rank
Support for
Religious/Social
Freedom
18-24 5 69.16 6 76.01 7 59.17 1 79.06
25-34 2 70.46 3 78.30 2 61.53 3 78.44
35-44 6 68.81 7 75.63 6 59.74 4 77.49
45-54 1 71.34 1 80.11 1 62.28 2 79.04
55-64 4 69.21 4 77.94 4 60.61 5 76.31
65-74 3 69.52 2 79.67 3 60.91 6 75.93
75+ 7 66.70 5 76.80 5 59.86 7 70.78
Freedom Support Scores by College Age vs Older
• The older demographic score higher among support for Basic Freedom (78.14),
Economic Freedom (60.94) as well as overall (69.63).
• The younger demographic score higher among support for Religious/Social Freedom
(79.06)
•
Overall
Rank
Support for
Freedom
Basic
Rank
Support for
Basic
Freedom
Economic
Rank
Support for
Economic
Freedom
R & S
Rank
Support for
Religious/Social
Freedom
18-24 2 69.16 2 76.01 2 59.17 1 79.06
25-75+ 1 69.63 1 78.14 1 60.94 2 76.97
Freedom Support Scores by Millennial vs Non-Millennial
• Millennials score approximately the same as non-Millennials among support for Basic
Freedom (60.55), Economic Freedom (60.88), as well as overall (69.92).
• Millennials score higher among support for Religious/Social Freedom (78.70).
Overall
Rank
Support for
Freedom
Basic
Rank
Support for
Basic
Freedom
Economic
Rank
Support for
Economic
Freedom
R & S
Rank
Support for
Religious/Social
Freedom
18-34 1 69.92 2 77.35 2 60.55 1 78.70
35-75+ 2 69.43 1 78.09 1 60.80 2 76.61
27
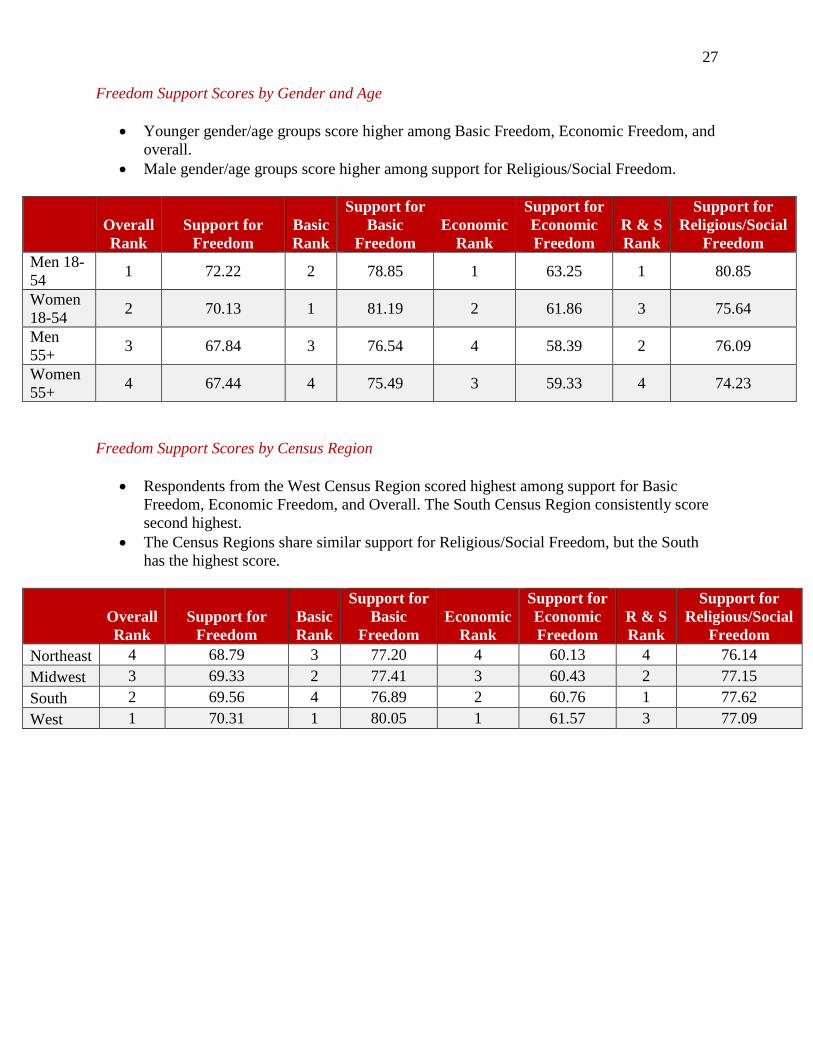
Freedom Support Scores by Gender and Age
• Younger gender/age groups score higher among Basic Freedom, Economic Freedom, and
overall.
• Male gender/age groups score higher among support for Religious/Social Freedom.
Overall
Rank
Support for
Freedom
Basic
Rank
Support for
Basic
Freedom
Economic
Rank
Support for
Economic
Freedom
R & S
Rank
Support for
Religious/Social
Freedom
Men 18-
54 1 72.22 2 78.85 1 63.25 1 80.85
Women
18-54 2 70.13 1 81.19 2 61.86 3 75.64
Men
55+ 3 67.84 3 76.54 4 58.39 2 76.09
Women
55+ 4 67.44 4 75.49 3 59.33 4 74.23
Freedom Support Scores by Census Region
• Respondents from the West Census Region scored highest among support for Basic
Freedom, Economic Freedom, and Overall. The South Census Region consistently score
second highest.
• The Census Regions share similar support for Religious/Social Freedom, but the South
has the highest score.
Overall
Rank
Support for
Freedom
Basic
Rank
Support for
Basic
Freedom
Economic
Rank
Support for
Economic
Freedom
R & S
Rank
Support for
Religious/Social
Freedom
Northeast 4 68.79 3 77.20 4 60.13 4 76.14
Midwest 3 69.33 2 77.41 3 60.43 2 77.15
South 2 69.56 4 76.89 2 60.76 1 77.62
West 1 70.31 1 80.05 1 61.57 3 77.09
28
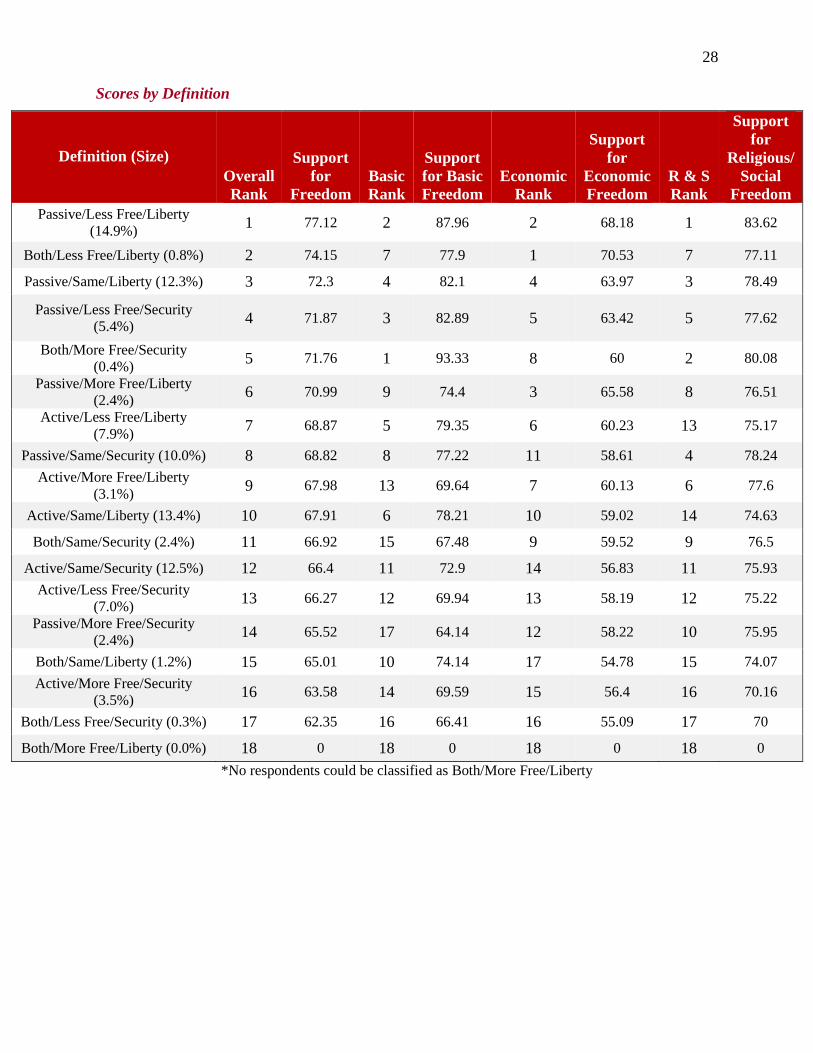
Scores by Definition
*No respondents could be classified as Both/More Free/Liberty
Definition (Size)
Overall
Rank
Support
for
Freedom
Basic
Rank
Support
for Basic
Freedom
Economic
Rank
Support
for
Economic
Freedom
R & S
Rank
Support
for
Religious/
Social
Freedom
Passive/Less Free/Liberty
(14.9%) 1 77.12 2 87.96 2 68.18 1 83.62
Both/Less Free/Liberty (0.8%) 2 74.15 7 77.9 1 70.53 7 77.11
Passive/Same/Liberty (12.3%) 3 72.3 4 82.1 4 63.97 3 78.49
Passive/Less Free/Security
(5.4%) 4 71.87 3 82.89 5 63.42 5 77.62
Both/More Free/Security
(0.4%) 5 71.76 1 93.33 8 60 2 80.08
Passive/More Free/Liberty
(2.4%) 6 70.99 9 74.4 3 65.58 8 76.51
Active/Less Free/Liberty
(7.9%) 7 68.87 5 79.35 6 60.23 13 75.17
Passive/Same/Security (10.0%) 8 68.82 8 77.22 11 58.61 4 78.24
Active/More Free/Liberty
(3.1%) 9 67.98 13 69.64 7 60.13 6 77.6
Active/Same/Liberty (13.4%) 10 67.91 6 78.21 10 59.02 14 74.63
Both/Same/Security (2.4%) 11 66.92 15 67.48 9 59.52 9 76.5
Active/Same/Security (12.5%) 12 66.4 11 72.9 14 56.83 11 75.93
Active/Less Free/Security
(7.0%) 13 66.27 12 69.94 13 58.19 12 75.22
Passive/More Free/Security
(2.4%) 14 65.52 17 64.14 12 58.22 10 75.95
Both/Same/Liberty (1.2%) 15 65.01 10 74.14 17 54.78 15 74.07
Active/More Free/Security
(3.5%) 16 63.58 14 69.59 15 56.4 16 70.16
Both/Less Free/Security (0.3%) 17 62.35 16 66.41 16 55.09 17 70
Both/More Free/Liberty (0.0%) 18 0 18 0 18 0 18 0
29
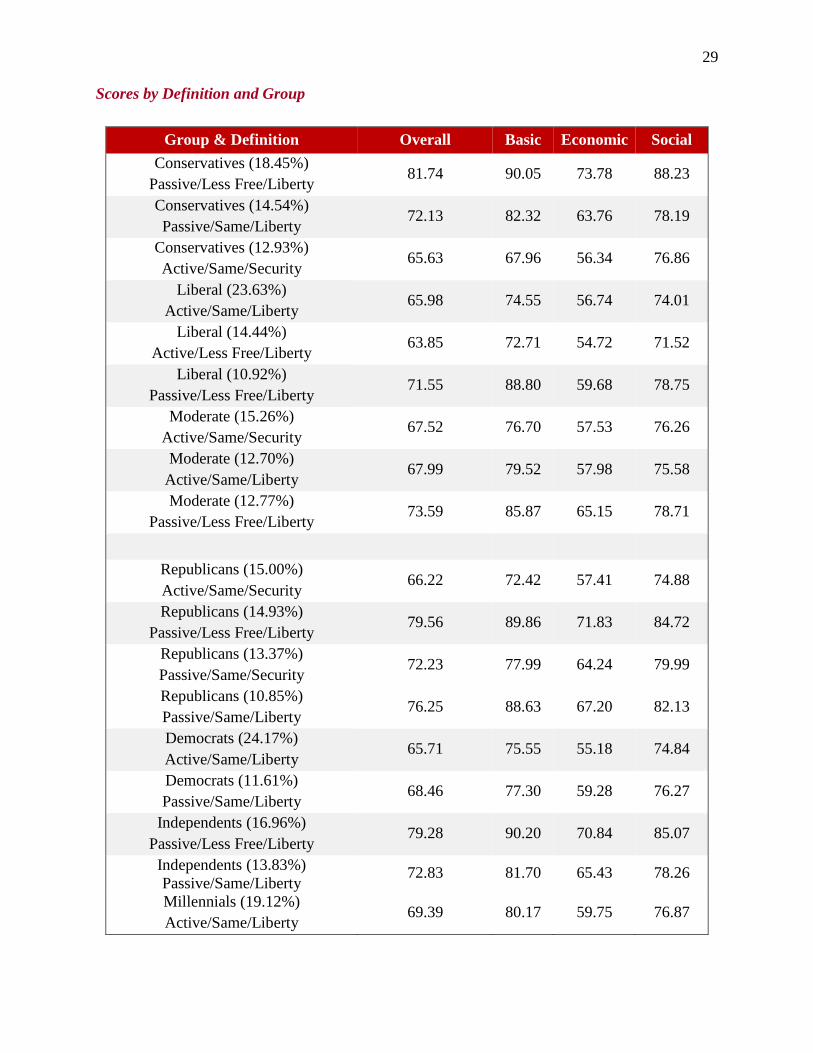
Scores by Definition and Group
Group & Definition Overall Basic Economic Social
Conservatives (18.45%)
Passive/Less Free/Liberty 81.74 90.05 73.78 88.23
Conservatives (14.54%)
Passive/Same/Liberty 72.13 82.32 63.76 78.19
Conservatives (12.93%)
Active/Same/Security 65.63 67.96 56.34 76.86
Liberal (23.63%)
Active/Same/Liberty 65.98 74.55 56.74 74.01
Liberal (14.44%)
Active/Less Free/Liberty 63.85 72.71 54.72 71.52
Liberal (10.92%)
Passive/Less Free/Liberty 71.55 88.80 59.68 78.75
Moderate (15.26%)
Active/Same/Security 67.52 76.70 57.53 76.26
Moderate (12.70%)
Active/Same/Liberty 67.99 79.52 57.98 75.58
Moderate (12.77%)
Passive/Less Free/Liberty 73.59 85.87 65.15 78.71
Republicans (15.00%)
Active/Same/Security 66.22 72.42 57.41 74.88
Republicans (14.93%)
Passive/Less Free/Liberty 79.56 89.86 71.83 84.72
Republicans (13.37%)
Passive/Same/Security 72.23 77.99 64.24 79.99
Republicans (10.85%)
Passive/Same/Liberty 76.25 88.63 67.20 82.13
Democrats (24.17%)
Active/Same/Liberty 65.71 75.55 55.18 74.84
Democrats (11.61%)
Passive/Same/Liberty 68.46 77.30 59.28 76.27
Independents (16.96%)
Passive/Less Free/Liberty 79.28 90.20 70.84 85.07
Independents (13.83%)
Passive/Same/Liberty 72.83 81.70 65.43 78.26
Millennials (19.12%)
Active/Same/Liberty 69.39 80.17 59.75 76.87
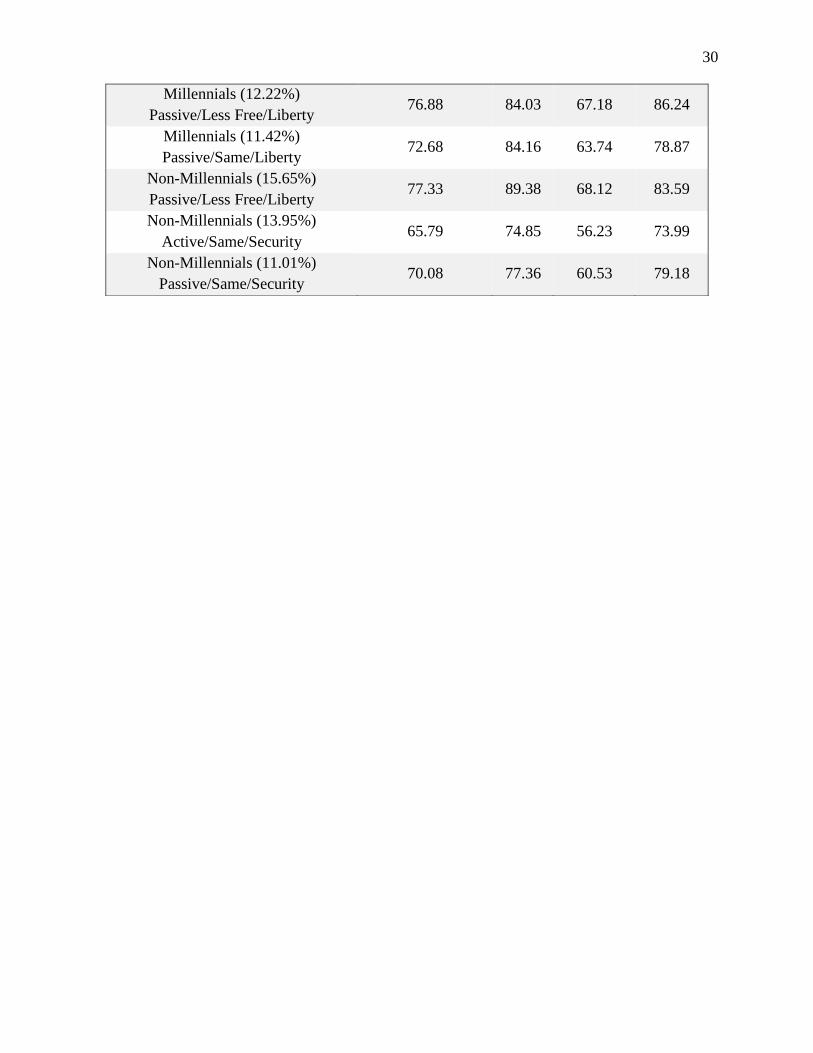
30
Millennials (12.22%)
Passive/Less Free/Liberty 76.88 84.03 67.18 86.24
Millennials (11.42%)
Passive/Same/Liberty 72.68 84.16 63.74 78.87
Non-Millennials (15.65%)
Passive/Less Free/Liberty 77.33 89.38 68.12 83.59
Non-Millennials (13.95%)
Active/Same/Security 65.79 74.85 56.23 73.99
Non-Millennials (11.01%)
Passive/Same/Security 70.08 77.36 60.53 79.18

31
32
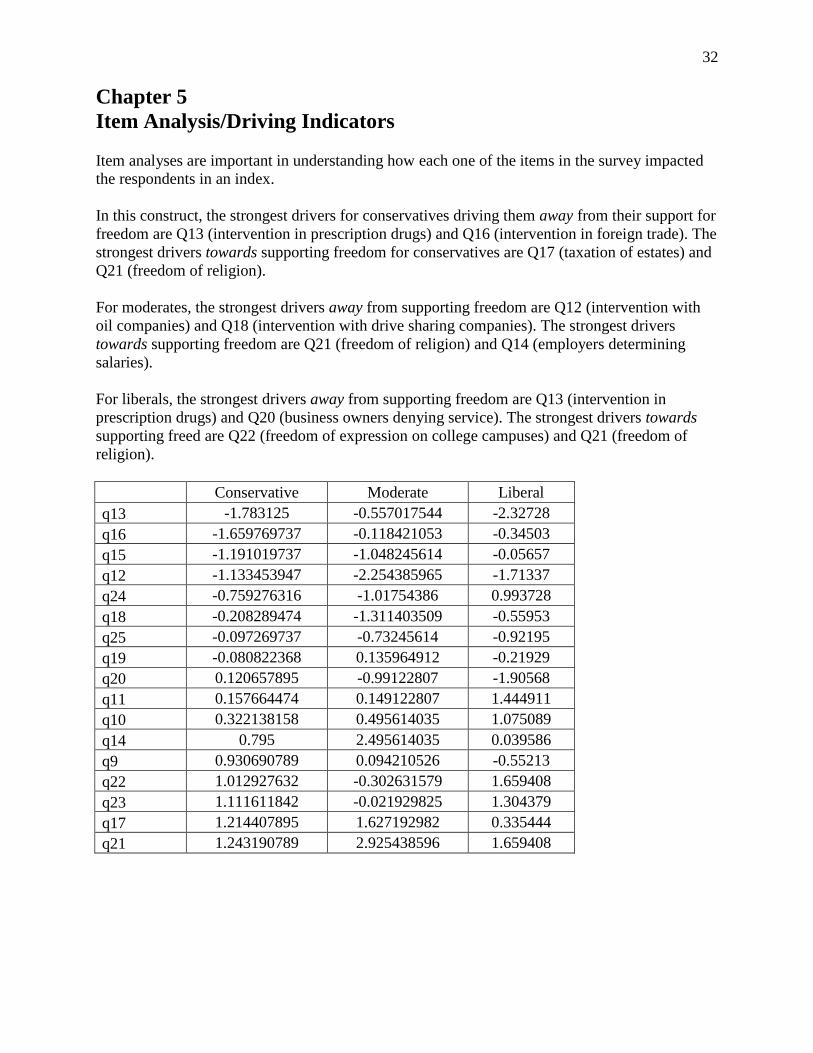
Chapter 5
Item Analysis/Driving Indicators
Item analyses are important in understanding how each one of the items in the survey impacted
the respondents in an index.
In this construct, the strongest drivers for conservatives driving them away from their support for
freedom are Q13 (intervention in prescription drugs) and Q16 (intervention in foreign trade). The
strongest drivers towards supporting freedom for conservatives are Q17 (taxation of estates) and
Q21 (freedom of religion).
For moderates, the strongest drivers away from supporting freedom are Q12 (intervention with
oil companies) and Q18 (intervention with drive sharing companies). The strongest drivers
towards supporting freedom are Q21 (freedom of religion) and Q14 (employers determining
salaries).
For liberals, the strongest drivers away from supporting freedom are Q13 (intervention in
prescription drugs) and Q20 (business owners denying service). The strongest drivers towards
supporting freed are Q22 (freedom of expression on college campuses) and Q21 (freedom of
religion).
Conservative Moderate Liberal
q13 -1.783125 -0.557017544 -2.32728
q16 -1.659769737 -0.118421053 -0.34503
q15 -1.191019737 -1.048245614 -0.05657
q12 -1.133453947 -2.254385965 -1.71337
q24 -0.759276316 -1.01754386 0.993728
q18 -0.208289474 -1.311403509 -0.55953
q25 -0.097269737 -0.73245614 -0.92195
q19 -0.080822368 0.135964912 -0.21929
q20 0.120657895 -0.99122807 -1.90568
q11 0.157664474 0.149122807 1.444911
q10 0.322138158 0.495614035 1.075089
q14 0.795 2.495614035 0.039586
q9 0.930690789 0.094210526 -0.55213
q22 1.012927632 -0.302631579 1.659408
q23 1.111611842 -0.021929825 1.304379
q17 1.214407895 1.627192982 0.335444
q21 1.243190789 2.925438596 1.659408
33
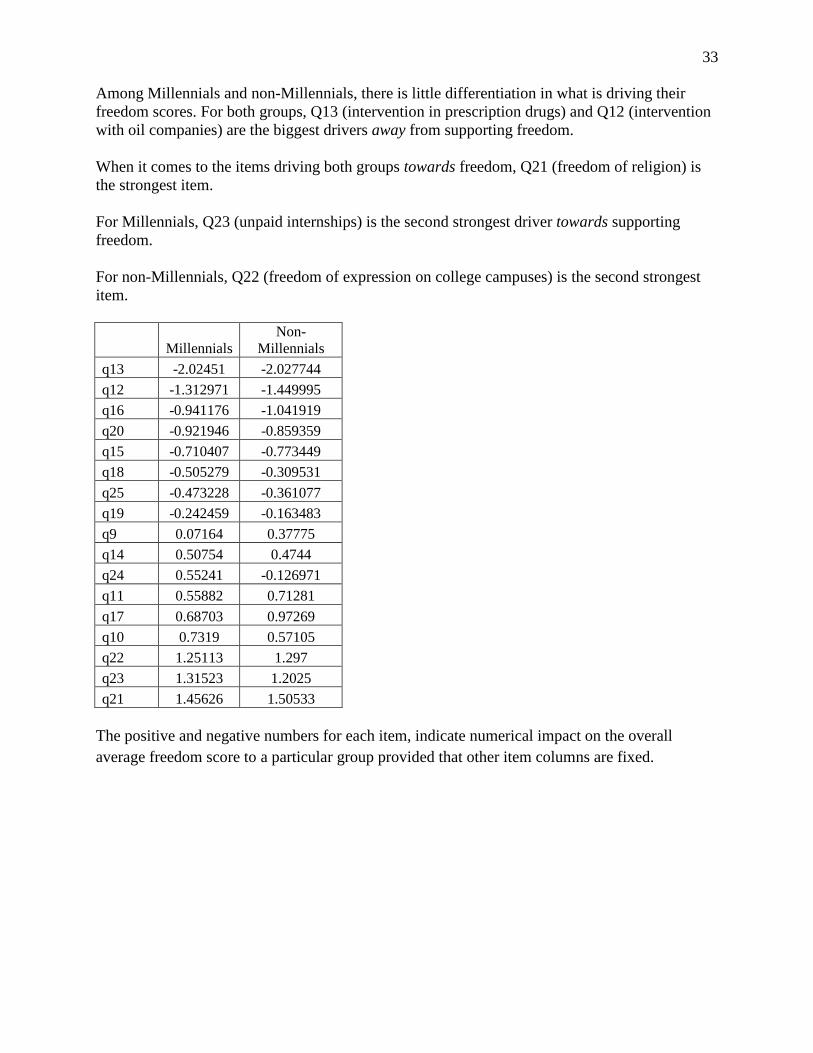
Among Millennials and non-Millennials, there is little differentiation in what is driving their
freedom scores. For both groups, Q13 (intervention in prescription drugs) and Q12 (intervention
with oil companies) are the biggest drivers away from supporting freedom.
When it comes to the items driving both groups towards freedom, Q21 (freedom of religion) is
the strongest item.
For Millennials, Q23 (unpaid internships) is the second strongest driver towards supporting
freedom.
For non-Millennials, Q22 (freedom of expression on college campuses) is the second strongest
item.
Millennials
Non-
Millennials
q13 -2.02451 -2.027744
q12 -1.312971 -1.449995
q16 -0.941176 -1.041919
q20 -0.921946 -0.859359
q15 -0.710407 -0.773449
q18 -0.505279 -0.309531
q25 -0.473228 -0.361077
q19 -0.242459 -0.163483
q9 0.07164 0.37775
q14 0.50754 0.4744
q24 0.55241 -0.126971
q11 0.55882 0.71281
q17 0.68703 0.97269
q10 0.7319 0.57105
q22 1.25113 1.297
q23 1.31523 1.2025
q21 1.45626 1.50533
The positive and negative numbers for each item, indicate numerical impact on the overall
average freedom score to a particular group provided that other item columns are fixed.

34
35
Appendix A
Methodology
Data Collection
The 2017 Support for Freedom Index was designed by Trevor Smith, Research Director with
WPAi, and fielded by Central Marketing Research Services from February 22-23 & 26, 2017.
Telephone interviews were conducted with a representative sample of 803 adults throughout the
United States (481 respondents were interviewed on a landline telephone and 322 were
interviewed on a cellphone). Respondents were selected using Random Digit Dialing (RDD).
The respondents were asked for their name and if they were over the age of 18 to match the
name on file.
The sample for this survey was stratified based on geography, age, gender, and ethnicity. This
methodology allows us to avoid post-survey “weighting” which can reduce the reliability of
survey results. The survey was designed to gauge perceived, actual, and preferred levels of
freedom across a variety of archetypes. These archetypes include measures of Basic Freedom,
Economic Freedom, Religious/Social Freedom, as well as overall Freedom Scores. Utilizing the
results WPAi created the Support for Freedom Index, comparing relevant demographics and
determining the composition of the American adult population regarding ideals towards liberty.
The best measure of the expected value of the population mean for a measure is the sample mean
of that measure. The margin of error of a survey is a measure of the uncertainty of the estimate of
the population mean based on the sample size and a worst case (50/50) distribution of opinion. It
is normally distributed and reported at the 95% confidence level. Other sources of potential error
due to construct, measurement, or response are not included in the margin of error. The study has
a sample size of n=803 Adults nationwide (40% cell) and a margin of error equal to ±3.5% in 95
out of 100 cases.
Survey and Index Design
The survey was designed to avoid subjective judgments except from the initial perspective of
less government coercion equals more freedom. To avoid response bias, questions and individual
items were directionally rotated.
Items were designed by a team of experts in the policy and political world, leveraged with a
research design and academic expertise of scholars with decades of experience in the polling and
political world. Each item set was introduced to the respondent with a clear introductory
statement identifying the overarching theme that would be discussed with support and oppose
options being rotated per respondent. Included with each item are directional indicators, + or -,
the directional indicators show which direction the question is in support of freedom.
Each item was tested; post data collection, to ensure the accuracy of the results identifying the
discriminative power of each item. The discriminative power (DP) was measured to examine the
36
survey participant’s differing response by applying following formulas for each individual item
in the survey:
Weighted Mean of Q1 (Top 25%) - Weighted Mean of Q3 (Bottom 25%) where
Weighted Mean = (Weighted Total)/(Number in Group) and
Weighted Total = Raw Score x Number of Respondent Choosing that Score.
After examining DP for each individual item in our survey, we proceeded to check the reliability
of the survey. Using the method of Spearman Bowman split-half reliability test has been
performed by splitting the survey into two parts, odd and even numbered questionnaires. Using
the raw scores from both parts, the survey has produced Spearman Bowman prophecy of .60.
The scores were then flipped into a single direction to gauge the results in a meaningful way.
The items in the survey were then normalized from 0-100 point scale using the following scaling
formula:
Scaled Score = (Sum of the Raw Scores x 100)/(Total Possible Raw Score)
37
Appendix B: Items
Admittedly, the index needed more questions in each section to provide a larger understanding of
Americans’ understanding and support for freedom. Due to time constraints and budget we were
limited in this first edition, but believe this offers a beginning to an important conversation.
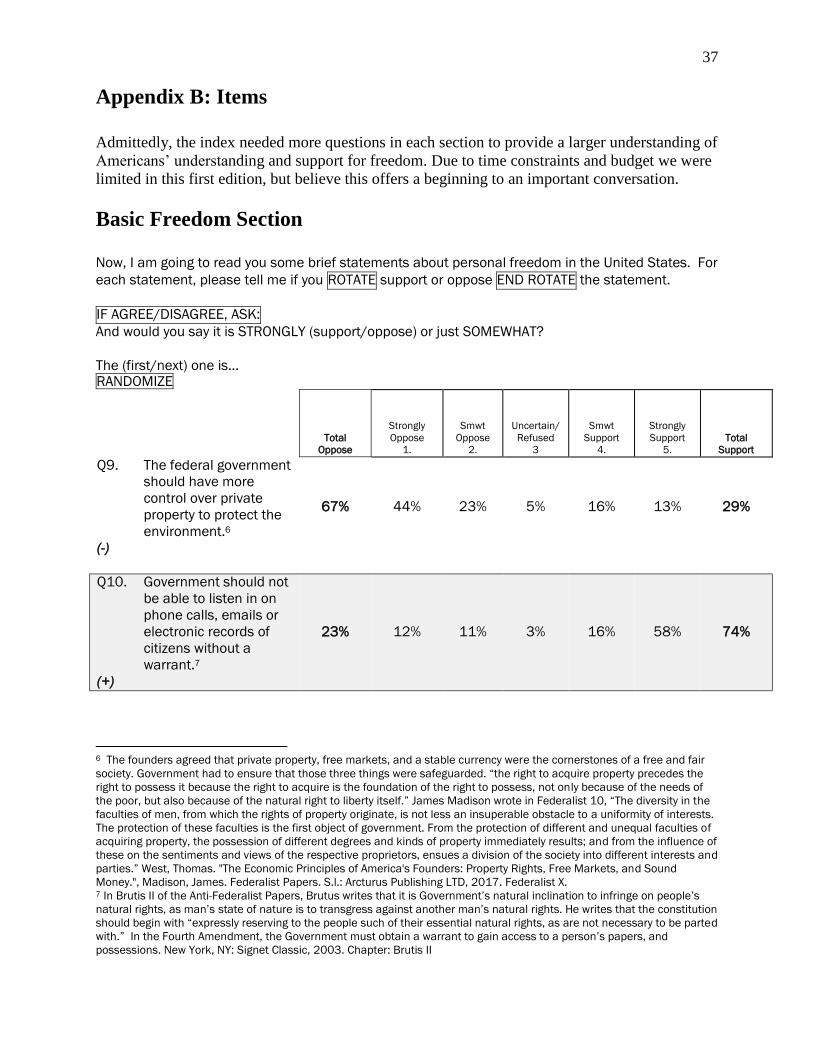
Basic Freedom Section
Now, I am going to read you some brief statements about personal freedom in the United States. For
each statement, please tell me if you ROTATE support or oppose END ROTATE the statement.
IF AGREE/DISAGREE, ASK:
And would you say it is STRONGLY (support/oppose) or just SOMEWHAT?
The (first/next) one is… RANDOMIZE
Total
Oppose
Strongly
Oppose
1.
Smwt
Oppose
2.
Uncertain/
Refused
3
Smwt
Support
4.
Strongly
Support
5.
Total
Support
Q9. The federal government
should have more
control over private
property to protect the
environment.6
(-)
67% 44% 23% 5% 16% 13% 29%
Q10. Government should not
be able to listen in on
phone calls, emails or
electronic records of
citizens without a
warrant.7
(+)
23% 12% 11% 3% 16% 58% 74%
6 The founders agreed that private property, free markets, and a stable currency were the cornerstones of a free and fair
society. Government had to ensure that those three things were safeguarded. “the right to acquire property precedes the
right to possess it because the right to acquire is the foundation of the right to possess, not only because of the needs of
the poor, but also because of the natural right to liberty itself.” James Madison wrote in Federalist 10, “The diversity in the
faculties of men, from which the rights of property originate, is not less an insuperable obstacle to a uniformity of interests.
The protection of these faculties is the first object of government. From the protection of different and unequal faculties of
acquiring property, the possession of different degrees and kinds of property immediately results; and from the influence of
these on the sentiments and views of the respective proprietors, ensues a division of the society into different interests and
parties.” West, Thomas. "The Economic Principles of America's Founders: Property Rights, Free Markets, and Sound
Money.", Madison, James. Federalist Papers. S.l.: Arcturus Publishing LTD, 2017. Federalist X. 7 In Brutis II of the Anti-Federalist Papers, Brutus writes that it is Government’s natural inclination to infringe on people’s
natural rights, as man’s state of nature is to transgress against another man’s natural rights. He writes that the constitution
should begin with “expressly reserving to the people such of their essential natural rights, as are not necessary to be parted
with.” In the Fourth Amendment, the Government must obtain a warrant to gain access to a person’s papers, and
possessions. New York, NY: Signet Classic, 2003. Chapter: Brutis II
38
Total
Oppose
Strongly
Oppose
1.
Smwt
Oppose
2.
Uncertain/
Refused
3
Smwt
Support
4.
Strongly
Support
5.
Total
Support
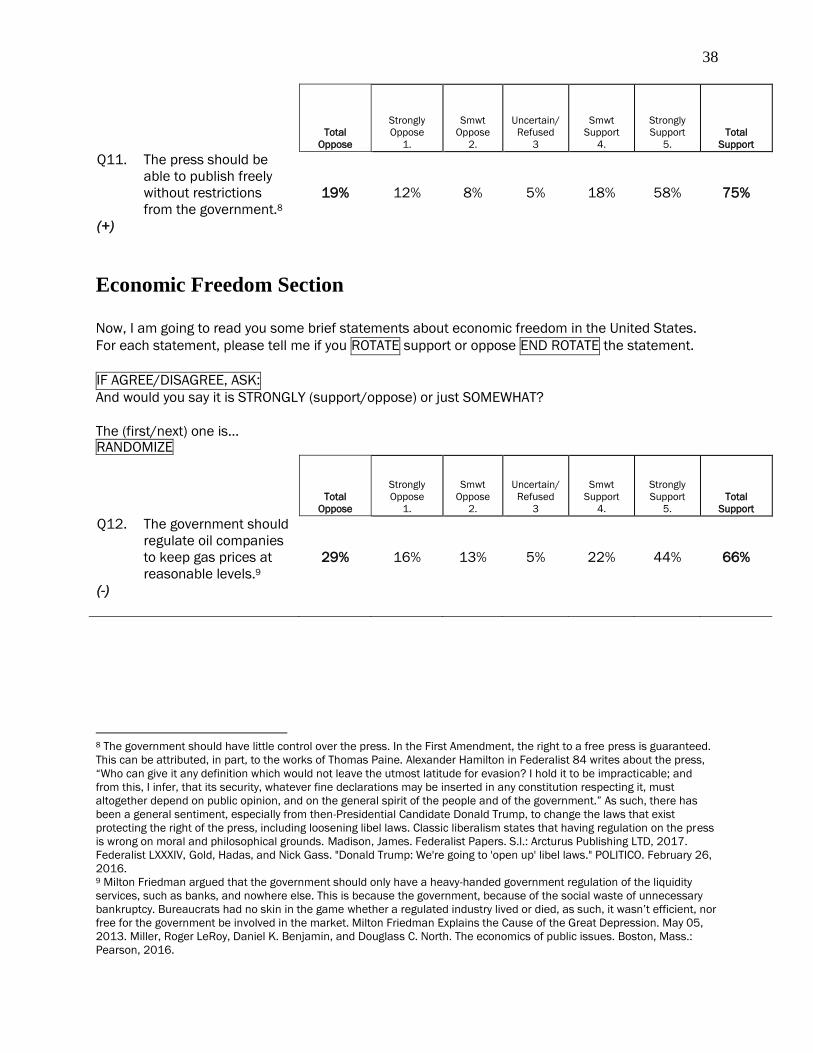
Q11. The press should be
able to publish freely
without restrictions
from the government.8
(+)
19% 12% 8% 5% 18% 58% 75%
Economic Freedom Section
Now, I am going to read you some brief statements about economic freedom in the United States.
For each statement, please tell me if you ROTATE support or oppose END ROTATE the statement.
IF AGREE/DISAGREE, ASK:
And would you say it is STRONGLY (support/oppose) or just SOMEWHAT?
The (first/next) one is… RANDOMIZE
Total
Oppose
Strongly
Oppose
1.
Smwt
Oppose
2.
Uncertain/
Refused
3
Smwt
Support
4.
Strongly
Support
5.
Total
Support
Q12. The government should
regulate oil companies
to keep gas prices at
reasonable levels.9
(-)
29% 16% 13% 5% 22% 44% 66%
8 The government should have little control over the press. In the First Amendment, the right to a free press is guaranteed.
This can be attributed, in part, to the works of Thomas Paine. Alexander Hamilton in Federalist 84 writes about the press,
“Who can give it any definition which would not leave the utmost latitude for evasion? I hold it to be impracticable; and
from this, I infer, that its security, whatever fine declarations may be inserted in any constitution respecting it, must
altogether depend on public opinion, and on the general spirit of the people and of the government.” As such, there has
been a general sentiment, especially from then-Presidential Candidate Donald Trump, to change the laws that exist
protecting the right of the press, including loosening libel laws. Classic liberalism states that having regulation on the press
is wrong on moral and philosophical grounds. Madison, James. Federalist Papers. S.l.: Arcturus Publishing LTD, 2017.
Federalist LXXXIV, Gold, Hadas, and Nick Gass. "Donald Trump: We're going to 'open up' libel laws." POLITICO. February 26,
2016. 9 Milton Friedman argued that the government should only have a heavy-handed government regulation of the liquidity
services, such as banks, and nowhere else. This is because the government, because of the social waste of unnecessary
bankruptcy. Bureaucrats had no skin in the game whether a regulated industry lived or died, as such, it wasn’t efficient, nor
free for the government be involved in the market. Milton Friedman Explains the Cause of the Great Depression. May 05,
2013. Miller, Roger LeRoy, Daniel K. Benjamin, and Douglass C. North. The economics of public issues. Boston, Mass.:
Pearson, 2016.
39
Total
Oppose
Strongly
Oppose
1.
Smwt
Oppose
2.
Uncertain/
Refused
3
Smwt
Support
4.
Strongly
Support
5.
Total
Support
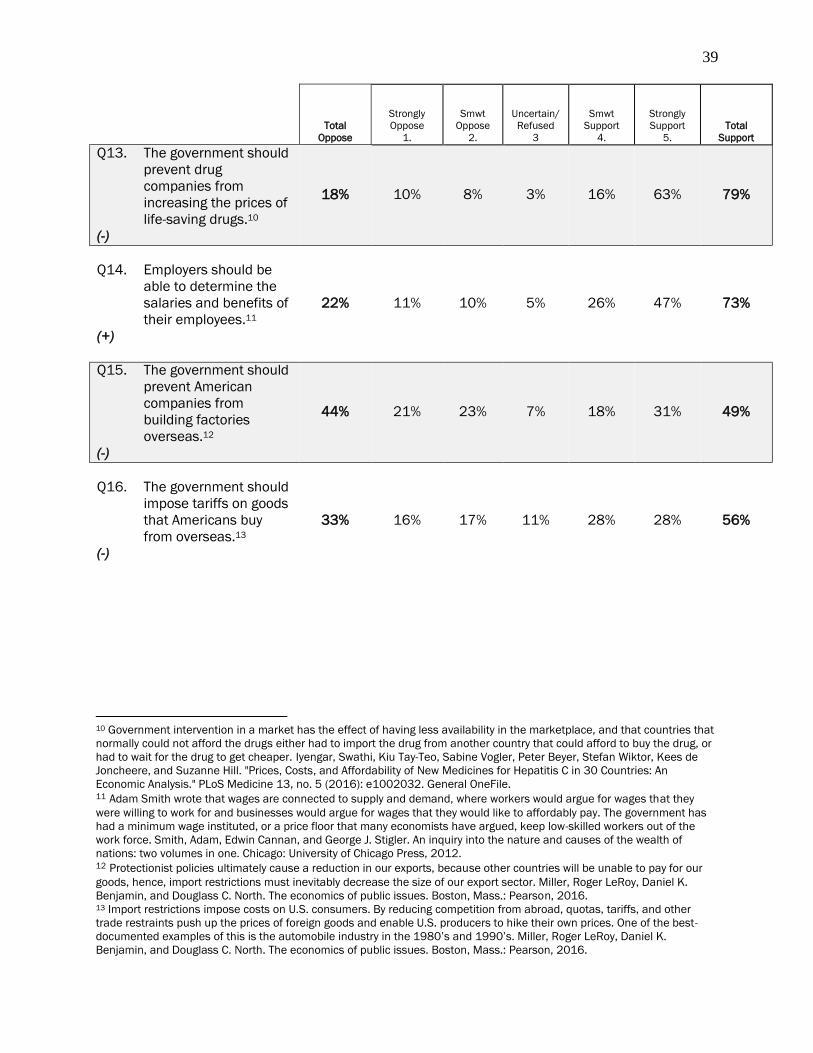
Q13. The government should
prevent drug
companies from
increasing the prices of
life-saving drugs.10
(-)
18% 10% 8% 3% 16% 63% 79%
Q14. Employers should be
able to determine the
salaries and benefits of
their employees.11
(+)
22% 11% 10% 5% 26% 47% 73%
Q15. The government should
prevent American
companies from
building factories
overseas.12
(-)
44% 21% 23% 7% 18% 31% 49%
Q16. The government should
impose tariffs on goods
that Americans buy
from overseas.13
(-)
33% 16% 17% 11% 28% 28% 56%
10 Government intervention in a market has the effect of having less availability in the marketplace, and that countries that
normally could not afford the drugs either had to import the drug from another country that could afford to buy the drug, or
had to wait for the drug to get cheaper. Iyengar, Swathi, Kiu Tay-Teo, Sabine Vogler, Peter Beyer, Stefan Wiktor, Kees de
Joncheere, and Suzanne Hill. "Prices, Costs, and Affordability of New Medicines for Hepatitis C in 30 Countries: An
Economic Analysis." PLoS Medicine 13, no. 5 (2016): e1002032. General OneFile. 11 Adam Smith wrote that wages are connected to supply and demand, where workers would argue for wages that they
were willing to work for and businesses would argue for wages that they would like to affordably pay. The government has
had a minimum wage instituted, or a price floor that many economists have argued, keep low-skilled workers out of the
work force. Smith, Adam, Edwin Cannan, and George J. Stigler. An inquiry into the nature and causes of the wealth of
nations: two volumes in one. Chicago: University of Chicago Press, 2012. 12 Protectionist policies ultimately cause a reduction in our exports, because other countries will be unable to pay for our
goods, hence, import restrictions must inevitably decrease the size of our export sector. Miller, Roger LeRoy, Daniel K.
Benjamin, and Douglass C. North. The economics of public issues. Boston, Mass.: Pearson, 2016. 13 Import restrictions impose costs on U.S. consumers. By reducing competition from abroad, quotas, tariffs, and other
trade restraints push up the prices of foreign goods and enable U.S. producers to hike their own prices. One of the best-
documented examples of this is the automobile industry in the 1980’s and 1990’s. Miller, Roger LeRoy, Daniel K.
Benjamin, and Douglass C. North. The economics of public issues. Boston, Mass.: Pearson, 2016.
40
Total
Oppose
Strongly
Oppose
1.
Smwt
Oppose
2.
Uncertain/
Refused
3
Smwt
Support
4.
Strongly
Support
5.
Total
Support
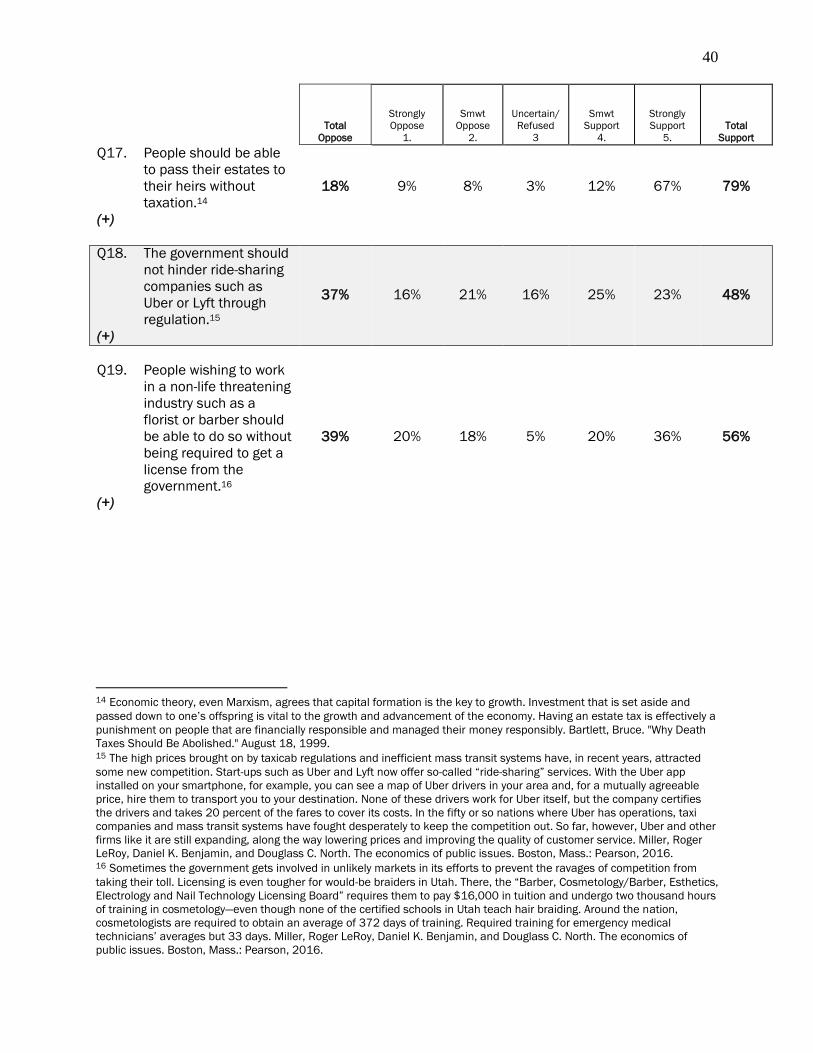
Q17. People should be able
to pass their estates to
their heirs without
taxation.14
(+)
18% 9% 8% 3% 12% 67% 79%
Q18. The government should
not hinder ride-sharing
companies such as
Uber or Lyft through
regulation.15
(+)
37% 16% 21% 16% 25% 23% 48%
Q19. People wishing to work
in a non-life threatening
industry such as a
florist or barber should
be able to do so without
being required to get a
license from the
government.16
(+)
39% 20% 18% 5% 20% 36% 56%
14 Economic theory, even Marxism, agrees that capital formation is the key to growth. Investment that is set aside and
passed down to one’s offspring is vital to the growth and advancement of the economy. Having an estate tax is effectively a
punishment on people that are financially responsible and managed their money responsibly. Bartlett, Bruce. "Why Death
Taxes Should Be Abolished." August 18, 1999. 15 The high prices brought on by taxicab regulations and inefficient mass transit systems have, in recent years, attracted
some new competition. Start-ups such as Uber and Lyft now offer so-called “ride-sharing” services. With the Uber app
installed on your smartphone, for example, you can see a map of Uber drivers in your area and, for a mutually agreeable
price, hire them to transport you to your destination. None of these drivers work for Uber itself, but the company certifies
the drivers and takes 20 percent of the fares to cover its costs. In the fifty or so nations where Uber has operations, taxi
companies and mass transit systems have fought desperately to keep the competition out. So far, however, Uber and other
firms like it are still expanding, along the way lowering prices and improving the quality of customer service. Miller, Roger
LeRoy, Daniel K. Benjamin, and Douglass C. North. The economics of public issues. Boston, Mass.: Pearson, 2016. 16 Sometimes the government gets involved in unlikely markets in its efforts to prevent the ravages of competition from
taking their toll. Licensing is even tougher for would-be braiders in Utah. There, the “Barber, Cosmetology/Barber, Esthetics,
Electrology and Nail Technology Licensing Board” requires them to pay $16,000 in tuition and undergo two thousand hours
of training in cosmetology—even though none of the certified schools in Utah teach hair braiding. Around the nation,
cosmetologists are required to obtain an average of 372 days of training. Required training for emergency medical
technicians’ averages but 33 days. Miller, Roger LeRoy, Daniel K. Benjamin, and Douglass C. North. The economics of
public issues. Boston, Mass.: Pearson, 2016.
41
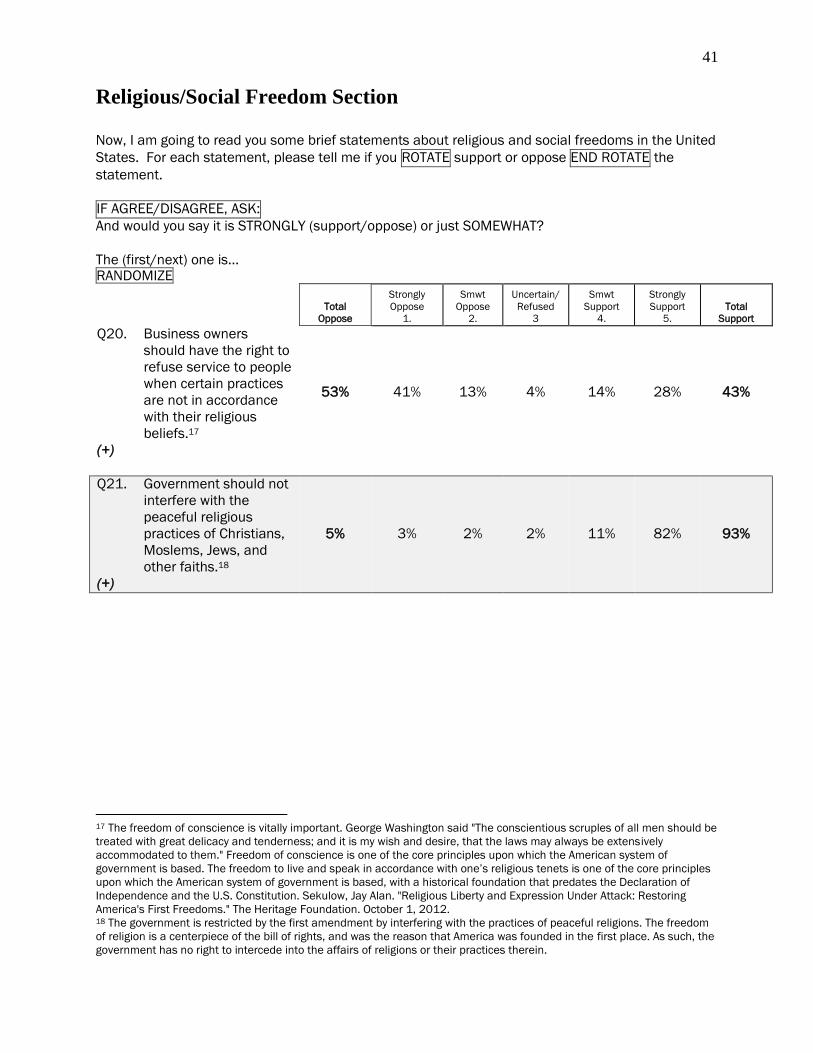
Religious/Social Freedom Section
Now, I am going to read you some brief statements about religious and social freedoms in the United
States. For each statement, please tell me if you ROTATE support or oppose END ROTATE the
statement.
IF AGREE/DISAGREE, ASK:
And would you say it is STRONGLY (support/oppose) or just SOMEWHAT?
The (first/next) one is… RANDOMIZE
Total
Oppose
Strongly
Oppose
1.
Smwt
Oppose
2.
Uncertain/
Refused
3
Smwt
Support
4.
Strongly
Support
5.
Total
Support
Q20. Business owners
should have the right to
refuse service to people
when certain practices
are not in accordance
with their religious
beliefs.17
(+)
53% 41% 13% 4% 14% 28% 43%
Q21. Government should not
interfere with the
peaceful religious
practices of Christians,
Moslems, Jews, and
other faiths.18
(+)
5% 3% 2% 2% 11% 82% 93%
17 The freedom of conscience is vitally important. George Washington said "The conscientious scruples of all men should be
treated with great delicacy and tenderness; and it is my wish and desire, that the laws may always be extensively
accommodated to them." Freedom of conscience is one of the core principles upon which the American system of
government is based. The freedom to live and speak in accordance with one’s religious tenets is one of the core principles
upon which the American system of government is based, with a historical foundation that predates the Declaration of
Independence and the U.S. Constitution. Sekulow, Jay Alan. "Religious Liberty and Expression Under Attack: Restoring
America's First Freedoms." The Heritage Foundation. October 1, 2012. 18 The government is restricted by the first amendment by interfering with the practices of peaceful religions. The freedom
of religion is a centerpiece of the bill of rights, and was the reason that America was founded in the first place. As such, the
government has no right to intercede into the affairs of religions or their practices therein.
42
Total
Oppose
Strongly
Oppose
1.
Smwt
Oppose
2.
Uncertain/
Refused
3
Smwt
Support
4.
Strongly
Support
5.
Total
Support
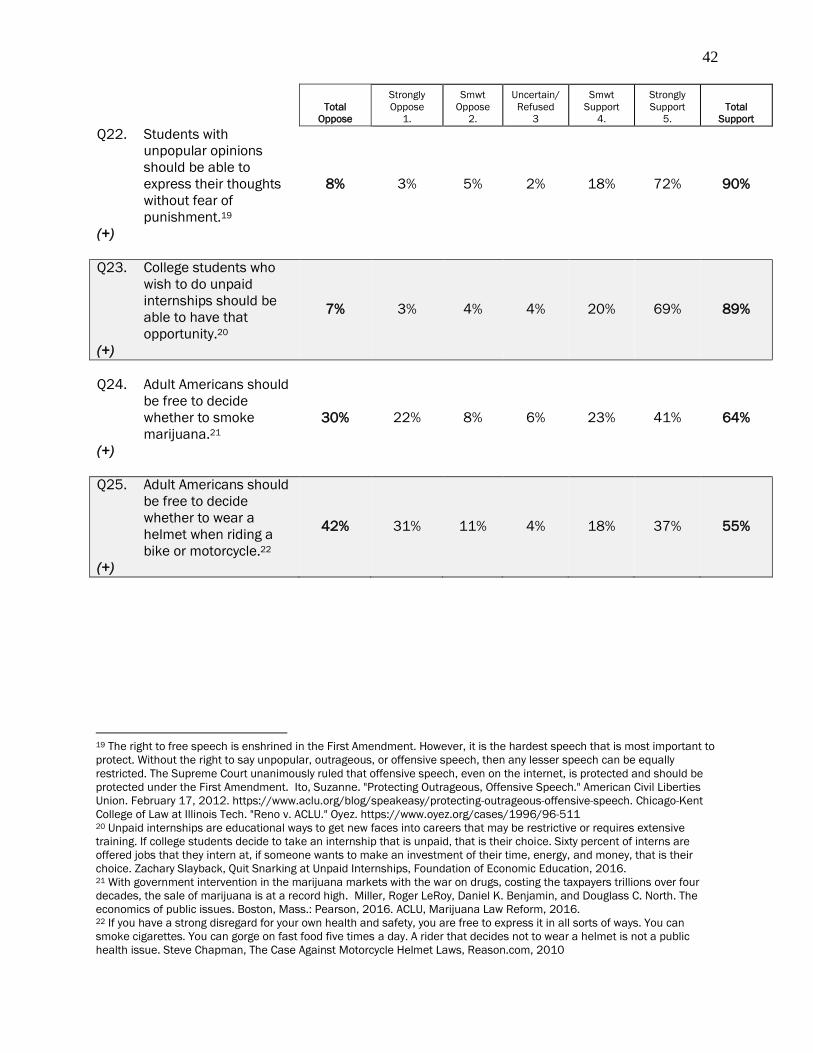
Q22. Students with
unpopular opinions
should be able to
express their thoughts
without fear of
punishment.19
(+)
8% 3% 5% 2% 18% 72% 90%
Q23. College students who
wish to do unpaid
internships should be
able to have that
opportunity.20
(+)
7% 3% 4% 4% 20% 69% 89%
Q24. Adult Americans should
be free to decide
whether to smoke
marijuana.21
(+)
30% 22% 8% 6% 23% 41% 64%
Q25. Adult Americans should
be free to decide
whether to wear a
helmet when riding a
bike or motorcycle.22
(+)
42% 31% 11% 4% 18% 37% 55%
19 The right to free speech is enshrined in the First Amendment. However, it is the hardest speech that is most important to
protect. Without the right to say unpopular, outrageous, or offensive speech, then any lesser speech can be equally
restricted. The Supreme Court unanimously ruled that offensive speech, even on the internet, is protected and should be
protected under the First Amendment. Ito, Suzanne. "Protecting Outrageous, Offensive Speech." American Civil Liberties
Union. February 17, 2012. https://www.aclu.org/blog/speakeasy/protecting-outrageous-offensive-speech. Chicago-Kent
College of Law at Illinois Tech. "Reno v. ACLU." Oyez. https://www.oyez.org/cases/1996/96-511 20 Unpaid internships are educational ways to get new faces into careers that may be restrictive or requires extensive
training. If college students decide to take an internship that is unpaid, that is their choice. Sixty percent of interns are
offered jobs that they intern at, if someone wants to make an investment of their time, energy, and money, that is their
choice. Zachary Slayback, Quit Snarking at Unpaid Internships, Foundation of Economic Education, 2016. 21 With government intervention in the marijuana markets with the war on drugs, costing the taxpayers trillions over four
decades, the sale of marijuana is at a record high. Miller, Roger LeRoy, Daniel K. Benjamin, and Douglass C. North. The
economics of public issues. Boston, Mass.: Pearson, 2016. ACLU, Marijuana Law Reform, 2016. 22 If you have a strong disregard for your own health and safety, you are free to express it in all sorts of ways. You can
smoke cigarettes. You can gorge on fast food five times a day. A rider that decides not to wear a helmet is not a public
health issue. Steve Chapman, The Case Against Motorcycle Helmet Laws, Reason.com, 2010