Embed Size (px)
Citation preview

The Supergrid: 100% Renewable Electricity Supply for Europe and its Neighborhood
Optimal sustainable solution for climate protection: Transfer to US-American conditions
G. Czisch, Transnational Renewables Consulting (TNRC), Stanford, 20110113
Dr.-Ing. Dipl.-Phys. G. Czisch
Is it possible to come to a totally renewable electricity supply?(Potentials, Technology, Temporal Production Behavior)
YES
Can we afford that? (Cost)
How could that work in an optimal case?
Utilisation of the renewable potentials for a common electricity supply interconnected within a strong international grid => affordable supply
preliminary questions:
Important steps to come there

Electricity Production with Hydropower
Photo source, VSE G. Czisch (TNRC), Stanford, 20110113
Storage Type
River Runoff Type

Storage Hydro Power in Europe: Rated Power, Storage Capacity and Annual Energy Production
G. Czisch (TNRC), Stanford, 20110113
Data of
UCTE 1998
Rated Power of Reservoir and mixed
pumped Storage
Storage Capacity of Reservoir and mixed
pumped Storage
Annual Energy Prod. of Reservoir and mixed
pumped Storage
[GW] [TWh] [TWh]
Slovenia/Croatia 1,4 1,8 ?Swizerland 8,2 8,4 18,0Serbia and Montenegro 2,0 2,0 ?Portugal 2,1 2,6 4,2Austria 5,6 3,2 7,0Luxemburg 0,0 0,0 0,0Italy 7,5 7,9 17,6Greece 1,9 2,4 2,8France 11,6 9,8 18,2Germany 1,4 0,3 1,1Belgium 0,0 0,0 0,0Spain 7,7 18,4 16,7
Sum of UCTE 49 57 86Data of
NORDEL
Norway 27,3 84,1 112,6Finland 2,9 4,9 12,6Sweden 16,2 33,7 63,6
Sum of NORDEL 46 123 189Sum of
NORDEL + UCTE 96 180 275
1 Month EU-consumption
>

Wind Energy
Photo source: http://www.nrel.gov/data/pix/searchpix.cgiG. Czisch (TNRC), Stanford, 20110113

80
60
40
20
0
-20
-40
-60
-80
4000
3500
3000
2500
2000
1500
1000
-150 -100 -50 0 50 100 150
Mean Annual Production of 1.5 MW Variable Speed Wind Turbines (HH = 80 m) in Full Load Hours [FLH]
Meteorological data: ECMWF, ERA-15, 1979-1992 G. Czisch (TNRC), Stanford, 20110113
Me
an
An
nu
al P
rod
uct
ion
19
79
–1
992
[FL
H]

Comparison of the Average Electricity Production (Jul Jan) from Wind Energy (Monthly Mean of 15 Years)
Met. Data: ECMWF, ERA-15, 1979-1992 G. Czisch (TNRC), Stanford, 20110113
Pro
duct
ion
Rat
io
JU
L/J
AN
80
60
40
20
0
-20
-40
-60
-80
2.0
1.8
1.6
1.4
1.2
1.0
0.8
0.6
0.4
-150 -100 -50 0 50 100 150

Mean Annual Production of 1.5 MW Variable Speed Wind Turbines (HH = 80 m)on Land Sites in Europe and its Neighbourhood
Meteorological data: ECMWF, ERA-15, 1979-1992
G. Czisch (TNRC), Stanford, 20110113
Electricity Demand 1998
UCTE & NODEL:
2100 TWh
Potential Wind Energy
Prod. on land sites with
more than 1500 FLH
at 4 – 8 MW/km2:
120 000 – 240 000 TWh
Mean Prod. at this sites:
2050 FLH
Take the best: =>0.4% of the area for
4000TWh .
EU & Norway2700 FLH400 TWhAt 0.29 MW/km2
North Russia & West Siberia3100 FLH1100 TWhAt 2.4 MW/km2
Kazakhstan2600 FLH550 TWhAt 2.4 MW/km2
Southern Morocco3400 FLH400 TWhAt 2.4 MW/km2
Mauritania3000 FLH320 TWhAt 2.4 MW/km2

Monthly Mean Electricity Production of Wind Power within Selected Favourable Regions at Land Sites and Electricity Demand
Meteorological data: ECMWF, ERA-15, 1990
G. Czisch (TNRC), Stanford, 20110113
0,0
0,1
0,2
0,3
0,4
0,5
0,6
0,7
0,8
0,9
1,0
1 2 3 4 5 6 7 8 9 10 11 12Time [Month]
0,0
0,3
0,6
0,9
1,2
1,5
Selected Good Wind Sites within EU and Norway
Electricity Demand within EU & Norway
Mo
nth
ly M
ean
WT
- P
ow
er
[P
Mea
n/P
Rat
ed]
Mo
nth
ly M
ean
Ele
ctri
c D
eman
d
[PM
ean/P
Rat
ed]
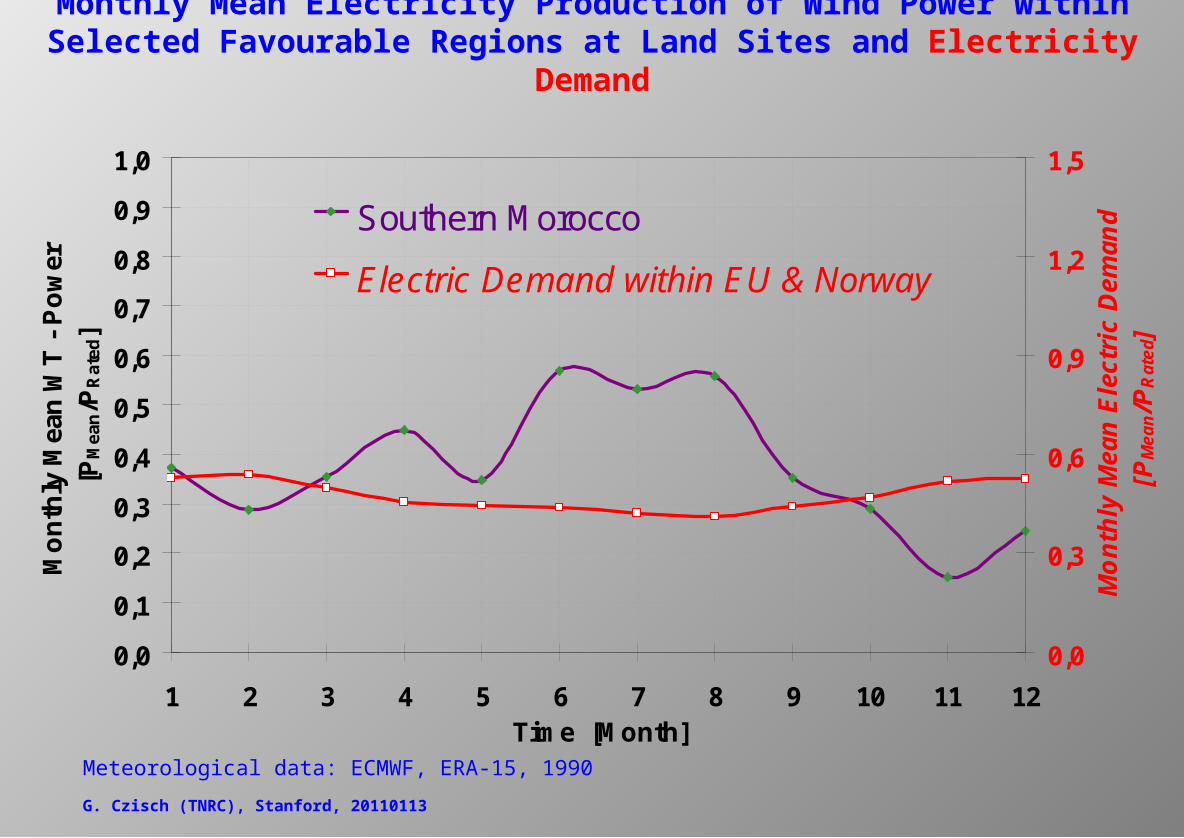
Monthly Mean Electricity Production of Wind Power within Selected Favourable Regions at Land Sites and Electricity Demand
Meteorological data: ECMWF, ERA-15, 1990
G. Czisch (TNRC), Stanford, 20110113
0,0
0,1
0,2
0,3
0,4
0,5
0,6
0,7
0,8
0,9
1,0
1 2 3 4 5 6 7 8 9 10 11 12Time [Month]
0,0
0,3
0,6
0,9
1,2
1,5
Southern Morocco
Electric Demand within EU & Norway
Mo
nth
ly M
ean
WT
- P
ow
er
[P
Me
an/P
Rat
ed]
Mo
nth
ly M
ean
Ele
ctri
c D
eman
d
[PM
ean/P
Rat
ed]

Monthly Mean Electricity Production of Wind Power within Selected Favourable Regions at Land Sites and Electricity Demand
Meteorological data: ECMWF, ERA-15, 1990
G. Czisch (TNRC), Stanford, 20110113
0,0
0,1
0,2
0,3
0,4
0,5
0,6
0,7
0,8
0,9
1,0
1 2 3 4 5 6 7 8 9 10 11 12Time [Month]
0,0
0,3
0,6
0,9
1,2
1,5
Combination of Production in all Regions
Electric Demand within EU & Norway
Mo
nth
ly M
ean
WT
- P
ow
er
[P
Mea
n/P
Rat
ed]
Mo
nth
ly M
ean
Ele
ctri
c D
eman
d
[PM
ean/P
Rat
ed]

Transmission of Electricity
Photo source: http://www.nrel.gov/data/pix/searchpix.cgiG. Czisch (TNRC), Stanford, 20110113

Some Estimated Maximum Net Transfer Capacities within UCTE and to its Neighbours in Winter 2004/2005 [MW]
Source of map: ETSO; Source of Data: ETSO
G. Czisch (TNRC), Stanford, 20110113
UCTENORDELUKTSOAATSOI
3360
2520
2000
1300
400 400
1000
1400
1400
High-Voltage-Direct-Current (HVDC) Transmission is a state-of-the-art technology able to transport elctricity over far distances with low losses and for low costs

Right 0f WayConventional 400 kV AC or new Supergrid with ±800 kV DC?
G. Czisch (TNRC), Stanford, 20110113
520 m
64 m
13 GW transmission capacity With conventional AC, 400 kV double system
13 GW transmission capacity With newest DC, ±800 kV HVDC double bipol
Or

Mean Annual Production of 1.5 MW Variable Speed Wind Turbines (HH = 80 m)on Land Sites in Europe and its Neighbourhood
Meteorological data: ECMWF, ERA-15, 1979-1992
G. Czisch (TNRC), Stanford, 20110113
Electricity Demand 1998
UCTE & NODEL:
2100 TWh
Potential Wind Energy
Prod. on land sites with
more than 1500 FLH
at 4 – 8 MW/km2:
120 000 – 240 000 TWh
Mean Prod. at this sites:
2050 FLH

Region Full Load Hours Distance to Kassel Costs[h/a] [km] [€c/kWh]
Land Sea Land & Seawithin the
Region in KasselCost of Losses
a) Nortern Russia and Western Sibiria 3100 4200 0 4200 3,1 4,4 0,5b) Kazakhstan 2600 4300 0 4300 4,1 5,9 0,7c) Southern Morocco 3400 4400 40 4440 3,0 4,5 0,5d) Mauritania 3000 4900 40 4940 3,2 4,8 0,6
Cost Calculation for Wind Energy from Far Distant Regions
G. Czisch (TNRC), Stanford, 20110113
Unit UnitHVDC Voltage +/- 600 [kV]Konverter Costs 2 * 60 [€/kW] Total Investment 1000 [€/kW]Converter Losses at full load 2 * 0.55 [%]Costs of Overhead Line 70 [€/(kW * 1000 km)]Costs of Sea Cable 700 [€/(kW * 1000 km)]Losses in Overhead Line and Cable at full load 4 [% / (1000 km)]Annual O & M Costs relative to total Investment 1 [%]
Annual O & M Costs relative to total Investment 2 [%]
Real Interest Rate 5 [%] Real Interest Rate 5 [%]Calculatory Livespan 25 [a] Calculatory Livespan 20 [a]
Rated HVDC Power = Rated Wind Power 5 GW
Underlaying AssumptionsTransportation System Wind Parks
Mean Losses[%]
10,4%10,2%10,4%10,8%
Comparison with Germany Onshore Wind Power:
Average Utilisation VLh
Cost of Electricity €c/kWh

Potential Common Electricity System
G. Czisch (TNRC), Stanford, 20110113
Population
1.1 billion Inhabitants
Electricity Consumption
4000 TWh/a
Largest Distance
8000 kmNorthwest-Siberia
South-Mauritania
HVDC-System

4.6 €ct/kWh
5.5 Ect/kWh4.6 €ct/kWh
-1
11
23
Biom
ass
Fuel C
ell
Energy
Towes
Fusion
Geoth
erm
al
Combin
ed C
ycle
Solar T
herm
al
Photovo
ltaic
s
Hydro
power
Win
dpower
Total P
roduct
ion
Total T
ransp
ort
Transp
ort Loss
es
Pump S
tora
ge
Surplu
s Pro
ductio
n
Total C
onsum
ption
Deman
d Man
agem
ent
Co
sts
of
Ele
ctri
city
[€c
t/kW
h]
-250
1250
2750
4250
5750
An
nu
al P
rod
uct
ion
[T
Wh
]
Annual Production by Type etc.Mean Costs of ElectricityCosts of Electricity: Produced within Region DK-DCosts of Electricity DK-D: Import Costs included (external surplus not included)Costs of Electricity by Type
Annual Electricity Production by Type with CollectiveDemand, Transport, Surplus and Costs of Electricity
Annual Electricity Production by Type with CollectiveDemand, Transport, Surplus and Costs of Electricity
G. Czisch (TNRC), Stanford, 20110113
Base Scenario: Today's Costs for all Components
not allowed
Today's Costs for all Components
Only Technology Available Now

Cost of Electricity Production in Base Scenario (including: Production, HVDC Transmission and Storage)
CoE €ct/kWh Relation of Costs to National Income of EU-15 & Norway CoE of GDP
Today‘s Expenses for Electricity of GDP (Germany today > 3%)
Thereof for Production of GDP
Costs difference BS Today of GDP
Further Progress in Renewable Technology => Cost Reduction > 30%
=> A future renewable electricity supply could produce cheaper electricity than our current conventional system.
Cost of Electricity Production in Base Scenario (including: Production, HVDC Transmission and Storage)
CoE €ct/kWh Relation of Costs to National Income of EU-15 & Norway CoE of GDP
Today‘s Expenses for Electricity of GDP (Germany today > 3%)
Thereof for Production of GDP
Costs difference BS Today of GDP
Further Progress in Renewable Technology => Cost Reduction > 30%
Cost of Electricity Production in Base Scenario (including: Production, HVDC Transmission and Storage)
CoE €ct/kWh Relation of Costs to National Income of EU-15 & Norway CoE of GDP
Today‘s Expenses for Electricity of GDP (Germany today > 3%)
Thereof for Production of GDP
Costs difference BS Today of GDP
Cost of Electricity Production in Base Scenario (including: Production, HVDC Transmission and Storage)
CoE €ct/kWh Relation of Costs to National Income of EU-15 & Norway CoE of GDP
Today‘s Expenses for Electricity of GDP (Germany today > 3%)
Thereof for Production of GDP
Cost of Electricity Production in Base Scenario (including: Production, HVDC Transmission and Storage)
CoE €ct/kWh Relation of Costs to National Income of EU-15 & Norway CoE of GDP
Today‘s Expenses for Electricity of GDP (Germany today > 3%)
Cost of Electricity Production in Base Scenario (including: Production, HVDC Transmission and Storage)
CoE €ct/kWh Relation of Costs to National Income of EU-15 & Norway CoE of GDP
Cost of Electricity Production in Base Scenario (including: Production, HVDC Transmission and Storage)
CoE €ct/kWh
Cost of Electricity (CoE) for Base Scenario (BS)and National Economies
G. Czisch (TNRC), Stanford, 20110113
Prices at EEX: German-Baseload-Cal-07 already exceeded 6 €ct/kWh
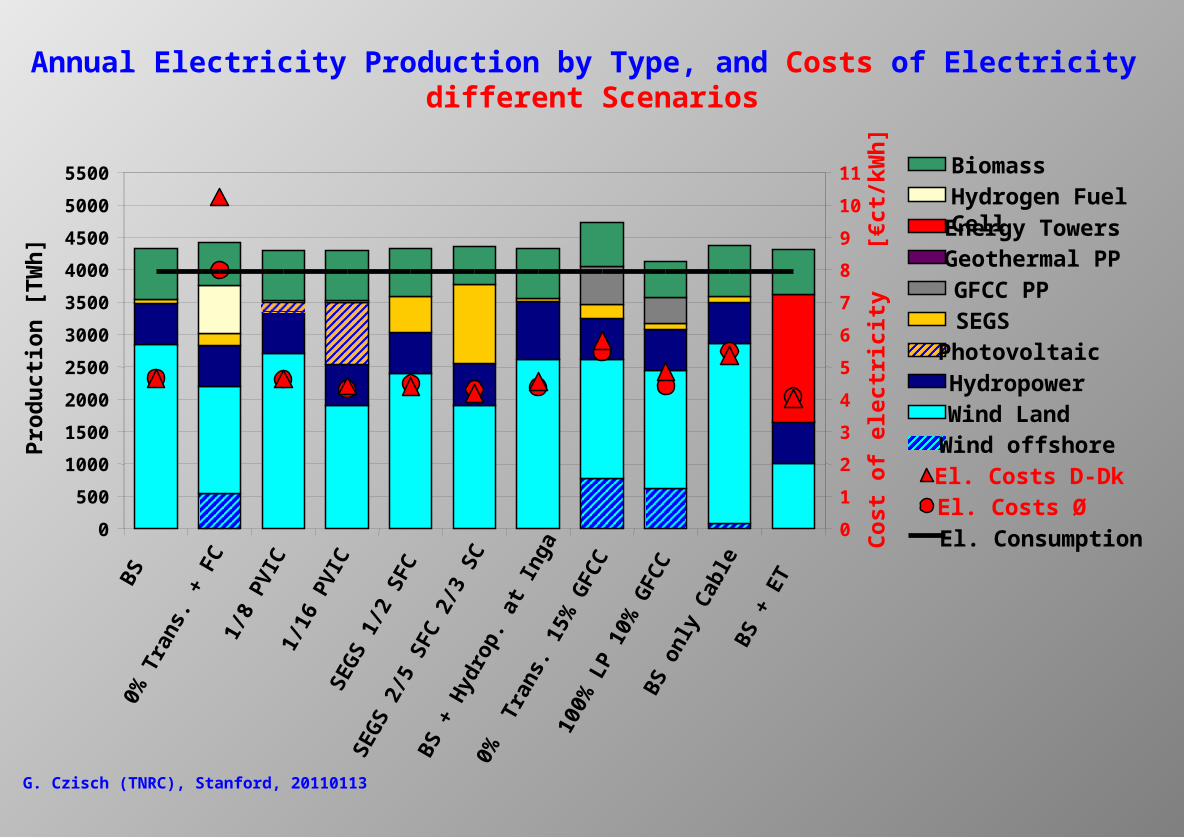
Annual Electricity Production by Type, and Costs of Electricity different Scenarios
G. Czisch (TNRC), Stanford, 20110113
0
500
1000
1500
2000
2500
3000
3500
4000
4500
5000
5500
BS
0% T
rans
. + F
C
1/8
PV
IC1/
16 P
VIC
SE
GS
1/2
SFC
SE
GS
2/5
SFC
2/3
SC
BS
+ H
ydro
p. a
t Ing
a
0% T
rans
. 15%
GFC
C
100%
LP
10%
GFC
CB
S o
nly
Cab
leB
S +
ET
Pro
du
ctio
n [
TW
h]
0
1
2
3
4
5
6
7
8
9
10
11
Co
st
of
ele
ctr
icit
y [
€ct
/kW
h]
BiomassHydrogen Fuel CellEnergy TowersGeothermal PPGFCC PPSEGSPhotovoltaicHydropowerWind LandWind offshoreEl. Costs D-DkEl. Costs ØEl. Consumption

Basic conclusions from the scenarios
G. Czisch (TNRC), Stanford, 20110113
Also the cost of electricity of a fully renewable electricity supply would be quite reasonable.
Costs for backup and HVDC – lines would not dominate.
Backup and storage are existent.
The bigger the catchment area the better temporal behaviour.
There are enough renewables for all needs.
The grid must be reinforced.
Now politics and economy are responsible, now they must act!

International Electricity Supply With Renewable Energies:What is happening towards the Renewable Supergrid
G. Czisch (TNRC), Stanford, 20110113
2007 the Swiss parliament discusses the cooperation with Germany and France and 2008 the German ministries of economy discuss cooperation with Switzerland to export offshore wind energy to Switzerland and get backup from Swiss hydropower.
2008 as a step towards the Mediterranean union the EU discusses the import of renewable energies from North Africa.
2008 the 17th Baltic Sea Parliamentary Conference (BSPC) promotes the development of a European ultra-high voltage DC transmission network for greater use of renewable energies.
Article 9 of the DIRECTIVE 2009/28/EC of the European Parliament and of the Council on the promotion of the use of energy from renewable sources regulates how renewable electricity could be imported from non EU countries to the EU. In June 2009 Desertec Industrial Initiative – (DII) was founded – amongst the Founders were Munich Re, Siemens, Deutsche Bank the German Ministry for Economy and the Club of Rome and announced to invest 400 Billion € till 2050 in the export of solar electricity from Africa to Europe.
2010 EU energy Commissioner Günther Oettinger promotes a European feed-in-system and feed-in-tariffs which also aim to realize renewable imports from Africa.

Climate change is often seen as one of the biggest challenges mankind has
ever been faced with. But the chances are that it is negligence rather than
the practical infeasibility of the problem which will cause us real trouble.
Thank you for your attention
Gregor Czisch
Transnational Renewables Consulting (TNRC)
+49-163-826-7921