Embed Size (px)
Citation preview

Emerging Markets Review 6 (2005) 238–262
www.elsevier.com/locate/econbase
The success of stock selection strategies in emerging
markets: Is it risk or behavioral bias?B
Jaap van der Hart a, Gerben de Zwart b, Dick van Dijk c,*
aEmerging Markets Team, Robeco Group, P.O. Box 973, 3000 AZ, Rotterdam, The NetherlandsbDepartment of Quantitative Research, Robeco Group, P.O. Box 973, 3000 AZ, Rotterdam, The Netherlands
cEconometric Insitute, Erasmus University Rotterdam, P.O. Box 1738, NL-3000 DR Rotterdam, The Netherlands
Received 11 February 2005; received in revised form 20 April 2005; accepted 16 May 2005
Abstract
We examine competing explanations, based on risk and behavioral models, for the profitability of
stock selection strategies in emerging markets. We document that both emerging market risk and
global risk factors cannot account for the significant excess returns of selection strategies based on
value, momentum and earnings revisions indicators. The findings for value and momentum strategies
are consistent with the evidence from developed markets supporting behavioral explanations. In
addition, for value stocks, the most important behavioral bias appears to be related to
underestimation of long-term growth prospects, as indicated by above average earnings revisions
for longer post-formation horizons and by quite rapidly improving earnings growth expectations.
Furthermore, we find that overreaction effects play a limited role for the earnings revisions strategy,
as there is no clear return reversal until five years after portfolio formation, setting this strategy apart
from momentum strategies.
D 2005 Elsevier B.V. All rights reserved.
JEL classification: G11; G15
Keywords: Value; Momentum; Earnings revisions; Risk; Behavioral models; Overreaction; Underreaction
1566-0141/$ -
doi:10.1016/j.e
B We thank a
for useful com
* Correspond
E-mail add
djvandijk@few
see front matter D 2005 Elsevier B.V. All rights reserved.
memar.2005.05.002
n anonymous referee and participants at the Inquire Europe meeting held in Prague, October 2004
ments and suggestions. We thank Willem Jellema for excellent assistance in collecting the data.
ing author.
resses: [email protected] (J. van der Hart), [email protected] (G. de Zwart),
.eur.nl (D. van Dijk).

J. van der Hart et al. / Emerging Markets Review 6 (2005) 238–262 239
1. Introduction
Research in emerging markets finance has been rapidly expanding over the past two
decades, see Bekaert and Harvey (2002, 2003) for comprehensive surveys of the past,
present and future of the area. Relatively few studies exist that investigate individual stock
selection for emerging markets, see Claessens et al. (1998), Fama and French (1998), Patel
(1998), Achour et al. (1998, 1999a,b,c), Rouwenhorst (1999), Barry et al. (2002), and van
der Hart et al. (2003). The general conclusion from these studies appears to be that stock
selection strategies that work well in developed markets also generate significant
outperformance in emerging markets. The most recent analysis by van der Hart et al.
(2003), based on almost 3000 securities from 32 countries and an extensive set of selection
strategies, finds that in internationally diversified (but country-neutral) portfolios, value
stocks outperform growth stocks, past winners (based on six-month momentum)
outperform past losers, and stocks with (relatively) high analysts’ earnings revisions
outperform stocks with low revisions.
There is an ongoing debate concerning the underlying reasons for (or the appropriate
interpretation of) the profitability of value, momentum and revisions strategies. Roughly
speaking, on the one hand, the excess returns of these stock selection strategies are
believed to be compensation for risk involved, whereas on the other hand they are
attributed to behavioral biases, with investors either under- or overreacting to the release of
new firm-specific information. To add to this discussion, in this paper we perform an bout-of-sampleQ test of these competing explanations by examining whether they can account
for the profitability of stock selection strategies in emerging markets. As most research in
this area has been conducted for developed markets, emerging markets provide an
excellent opportunity to study the source of return premiums on a relatively independent
sample.
We find that both emerging market risk and global factor risk (using a four-factor model
including market, book-to-market, size and momentum factors) cannot explain the excess
returns of the selection strategies in emerging markets. Relatively few factor loadings are
found to be significant, while excess returns of the strategies remain of the same
magnitude and significant after accounting for risk. We find more convincing evidence in
favor of behavioral explanations for value and momentum anomalies put forward in the
context of developed markets. In addition, we present new results supporting an
underrreaction effect for the earnings revisions strategy.
For value strategies, our findings are in accordance with the underreaction or
extrapolation hypothesis developed in Lakonishok et al. (1994), which posits that the
outperformance of value stocks arises because investors systematically underestimate
the earnings growth prospects of such stocks. We find that the actual earnings growth
of value stocks in emerging markets equals the average earnings growth after just a
few years, indicating that the difference in valuation between value and growth stocks
indeed is not justified by subsequent earnings developments. At the same time, we find
that the evidence for emerging markets is also in line with the results of Doukas et al.
(2002), who document that analysts in fact are more optimistic about value than
growth stocks, seemingly contradicting the behavioral interpretation of Lakonishok et
al. (1994). We suggest a possible reconciliation for these contrasting views, based on

J. van der Hart et al. / Emerging Markets Review 6 (2005) 238–262240
the idea that the most important behavioral bias is related to underestimation of long-
term earnings growth prospects for value stocks. This hypothesis is supported by our
finding that analysts’ forecast errors (defined as actual earnings minus the
corresponding earnings forecast) and earnings revisions for value stocks are below
average only until approximately one year after portfolio formation. After this initial
period, analysts indeed become less optimistic about value than growth stocks. In
addition, we observe that the expected earnings growth for value stocks improves quite
rapidly and exceeds the average expected growth within two years after portfolio
formation.
For the momentum strategy, we find elements of both underreaction and overreaction,
in agreement with the evidence from developed markets. On the one hand, stocks with
high past returns have higher earnings forecast errors and earnings revisions for about one
year after portfolio formation, indicating an underreaction effect, similar to the findings of
Chan et al. (1996) for the US. On the other hand, in line with Jegadeesh and Titman (2001)
and Nagel (2002), we also find that momentum strategies have a pronounced reversal in
excess returns between three and five years after portfolio formation, indicating an
overreaction effect.
For the earnings revisions strategy, our results lend unequivocal support to an
underreaction explanation. In line with the US evidence of Chan et al. (1996) and our own
findings for the emerging markets momentum strategy, stocks with high past earnings
revisions continue to have earnings revisions (and earnings forecast errors) above average
for about one year after portfolio formation. Contrary to the momentum strategy, we find
no return reversal for the earnings revisions strategy until five years after portfolio
formation, indicating a distinct difference between these strategies. To the best of our
knowledge, return reversals for earnings revisions strategies have not been examined
before, even for developed markets.
The plan of the paper is as follows. Section 2 describes the data and stock selection
strategies. Section 3 summarizes the results concerning their profitability and the
robustness thereof. Sections 4 and 5 explore the competing explanations for the excess
returns of the strategies in terms of risk and behavior, respectively. Finally, Section 6
concludes.
2. Methodology
2.1. Data
Stock returns, earnings and book value data are drawn from the S&P/IFC Emerging
Markets database. Monthly total stock returns are measured in US dollars, and account for
dividends, stock splits and other capital adjustments, cf. Rouwenhorst (1999). The returns
contain some extreme observations, which are at least partly due to data errors. To avoid a
potentially disrupting impact from large data errors, we compare the total returns from
S&P/IFC with corresponding total returns from the Factset Pricing database, as well as
with price returns from both sources. In case of extreme return observations with large
differences between the data sources, we use the smallest absolute value to err on the side

J. van der Hart et al. / Emerging Markets Review 6 (2005) 238–262 241
of caution. In addition, we cap monthly returns at 300% or 150%, depending on whether
or not the S&P/IFC data is confirmed by Factset Pricing.
We exclude stocks that are not included in the IFC Investable Composite index1 and
stocks that have a real investable market value less than 100 million in December 1998 US
dollars, applying a 10% annual inflation rate. This makes the selection strategies feasible
for a large international investor, while it also mitigates the problem of survivorship bias in
the Emerging Markets database, due to backfilled data for some countries in the period
before inclusion in the IFC Investable Composite index, see Harvey (1995) for a detailed
discussion. In addition, we omit countries with less than four stocks and countries for
which the data necessary for the particular selection strategy is available for less than 30%
of the stocks. We discard these bsmallQ countries because the selection strategies construct
local return factor portfolios from the top and bottom 15% stocks in each country
separately.
The data from S&P/IFC are supplemented with analysts’ earnings forecasts from the
Institutional Brokers Estimate System (IBES). These are used to compute earnings
revisions, defined as the number of analysts with upward revisions minus the number of
analysts with downward revisions divided by the total number of analysts providing an
earnings forecast in a particular month, following Achour et al. (1998).
Combining the different databases, we implement the stock selection strategies
described below over the period from December 1988, the inception month of the
IFC Investable Composite index, until June 2004. The number of stocks that are
used for testing the strategies starts at about 100 in December 1988, grows quite
rapidly to about 700 in 1994 and varies between 600 and 900 stocks in the
remaining years.
2.2. Stock selection strategies
We investigate stock selection strategies based on the value indicators book-to-
market (B /M) and earnings-to-price (E /P), based on momentum as measured by the
total return over the previous six months (6MR), and based on analysts’ earnings
revisions, measured by the past three-month average earnings revisions for the current
fiscal year (ER FY1). The methodology underlying the portfolio construction is
described below.
1 The IFC Investable Composite Index consists of stocks from the following countries, with the first month
of inclusion in parenthesis. In case two months are provided, the second indicates the last month of inclusion.
Latin America: Argentina (Dec 1988), Brazil (Dec 1988), Chile (Dec 1988), Colombia (Feb 1991–Nov
2001), Mexico (Dec 1988), Peru (Jan 1994), Venezuela (Jan 1990–Nov 2001); Asia: China (Oct 1995), India
(Nov 1992), Indonesia (Sep 1990), Korea (Jan 1992), Malaysia (Dec 1988), Pakistan (Mar 1991–Nov 2001),
Philippines (Dec 1988), Sri Lanka (Jan 1994–Nov 2001), Taiwan (Jan 1991), Thailand (Dec 1988); Europe:
Czech Republic (Jan 1996), Greece (Dec 1988–Apr 2001), Hungary (Apr 1994), Poland (Apr 1994), Portugal
(Dec 1988–Mar 1999), Russia (Nov 1997), Slovakia (Nov 1997–Nov 2001), Turkey (Aug 1989); Africa and
Middle East: Egypt (Nov 1997), Israel (Dec 1996), Jordan (Dec 1988–Nov 2001), Morocco (Nov 1997),
South Africa (Apr 1995), and Zimbabwe (Apr 1994–Nov 2001). Malaysia was not included during the period
Oct 1998–Oct 1999.

J. van der Hart et al. / Emerging Markets Review 6 (2005) 238–262242
All strategies are applied without a delay between the moment of ranking and the
moment of portfolio formation. As the IFC and IBES databases contain data as
published, all sorting characteristics would have been available to investors at the
time of ranking and, hence, the selection strategies do not use any future
information.2 At the beginning of each month, we rank the stocks by country on each
of the above characteristics in descending order. For each country in the sample, equally
weighted btopQ and bbottomQ portfolios are formed from the 15% stocks ranked highest
and lowest, respectively.3 These country portfolios are then combined into internationally
diversified portfolios, in which each stock receives an equal weight. Each month, new
portfolios are constructed which are held for a period of six months. After formation, the
portfolios are not rebalanced, except to account for stocks leaving the IFC Investables
index. These stocks exit the relevant portfolio and the weights of the remaining stocks are
adjusted proportionally. As we construct new portfolios every month and use a six-month
holding period, at any point in time the strategies effectively hold stocks from six
portfolios, each formed one month apart. To handle the problems concerned with
overlapping returns, we calculate monthly returns for a particular strategy as the average of
the returns on the six similar portfolios, cf. Jegadeesh and Titman (1993, 2001) and
Rouwenhorst (1998).
3. Profitability of stock selection strategies
In this section, we evaluate the performance of the stock selection strategies based on
value, momentum and earnings revisions. Table 1 shows the average monthly returns
during the six-month holding period for the top portfolio, an equally weighted index
consisting of all stocks in the relevant sample (EWI) and the bottom portfolio, as well as
the excess returns of the top portfolio versus the equally weighted index (TMI) and versus
the bottom portfolio (TMB).
All four selection strategies prove to be successful, in the sense that the excess returns
of the top portfolio are positive and strongly statistically significant. Compared to the
EWI, the average monthly excess returns of the top portfolio vary from 0.24% for the
earnings revisions strategy to 0.53% for the B/M strategy. The average returns for the top
versus bottom portfolio range between 0.59% and 0.74% per month, with the highest
2 Apart from worries about the timely availability of the sorting variables, another reason to implement
momentum strategies with a delay (usually of one-month) is to attenuate the effects of bid-ask bounce, see Achour
et al. (1998) and Rouwenhorst (1999), among others. Because of the minimum capitalization requirement that we
impose, the smallest, and probably least liquid, stocks are not included in our sample and, hence, bid-ask bounce
is less important at the monthly frequency. Therefore, we also implement the momentum strategies without delay,
such that, for example, the 6-month momentum factor that is used to rank the stocks at the beginning of month t is
based on the average return from the beginning of month t�6 to the end of month t�1.3 Stocks are selected in each country separately to avoid any implicit country allocation. We examine the added
value of country selection by ranking stocks globally and forming equally weighted portfolios consisting of the
top and bottom 15 percent stocks in this alternative ranking. We find that such bglobal rankingQ adds considerablyto the profitability of the stock selection strategies. The excess returns due to country selection are, however,
much more volatile than the excess returns due to stock selection.
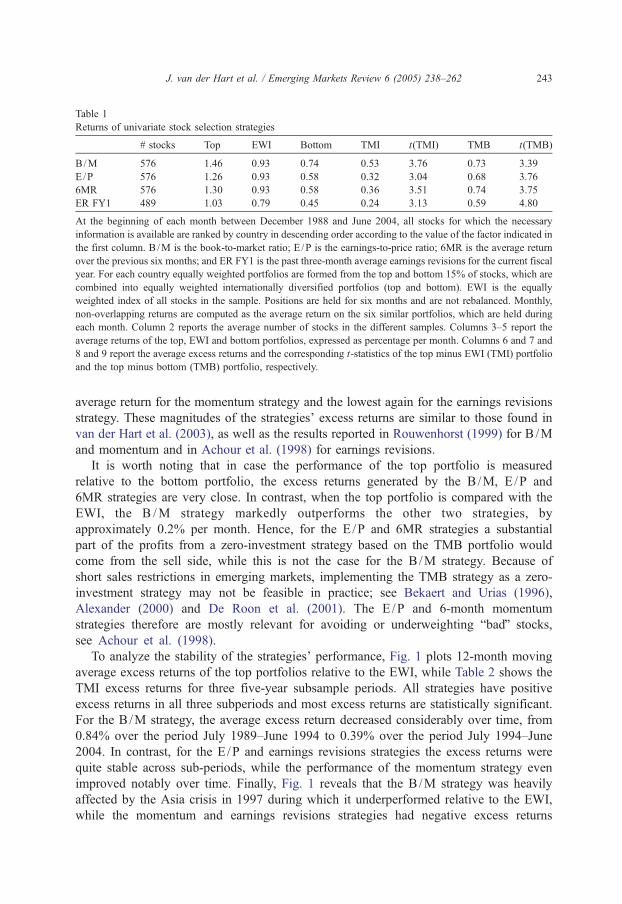
Table 1
Returns of univariate stock selection strategies
# stocks Top EWI Bottom TMI t(TMI) TMB t(TMB)
B/M 576 1.46 0.93 0.74 0.53 3.76 0.73 3.39
E /P 576 1.26 0.93 0.58 0.32 3.04 0.68 3.76
6MR 576 1.30 0.93 0.58 0.36 3.51 0.74 3.75
ER FY1 489 1.03 0.79 0.45 0.24 3.13 0.59 4.80
At the beginning of each month between December 1988 and June 2004, all stocks for which the necessary
information is available are ranked by country in descending order according to the value of the factor indicated in
the first column. B/M is the book-to-market ratio; E /P is the earnings-to-price ratio; 6MR is the average return
over the previous six months; and ER FY1 is the past three-month average earnings revisions for the current fiscal
year. For each country equally weighted portfolios are formed from the top and bottom 15% of stocks, which are
combined into equally weighted internationally diversified portfolios (top and bottom). EWI is the equally
weighted index of all stocks in the sample. Positions are held for six months and are not rebalanced. Monthly,
non-overlapping returns are computed as the average return on the six similar portfolios, which are held during
each month. Column 2 reports the average number of stocks in the different samples. Columns 3–5 report the
average returns of the top, EWI and bottom portfolios, expressed as percentage per month. Columns 6 and 7 and
8 and 9 report the average excess returns and the corresponding t-statistics of the top minus EWI (TMI) portfolio
and the top minus bottom (TMB) portfolio, respectively.
J. van der Hart et al. / Emerging Markets Review 6 (2005) 238–262 243
average return for the momentum strategy and the lowest again for the earnings revisions
strategy. These magnitudes of the strategies’ excess returns are similar to those found in
van der Hart et al. (2003), as well as the results reported in Rouwenhorst (1999) for B /M
and momentum and in Achour et al. (1998) for earnings revisions.
It is worth noting that in case the performance of the top portfolio is measured
relative to the bottom portfolio, the excess returns generated by the B/M, E/P and
6MR strategies are very close. In contrast, when the top portfolio is compared with the
EWI, the B /M strategy markedly outperforms the other two strategies, by
approximately 0.2% per month. Hence, for the E /P and 6MR strategies a substantial
part of the profits from a zero-investment strategy based on the TMB portfolio would
come from the sell side, while this is not the case for the B/M strategy. Because of
short sales restrictions in emerging markets, implementing the TMB strategy as a zero-
investment strategy may not be feasible in practice; see Bekaert and Urias (1996),
Alexander (2000) and De Roon et al. (2001). The E/P and 6-month momentum
strategies therefore are mostly relevant for avoiding or underweighting bbadQ stocks,
see Achour et al. (1998).
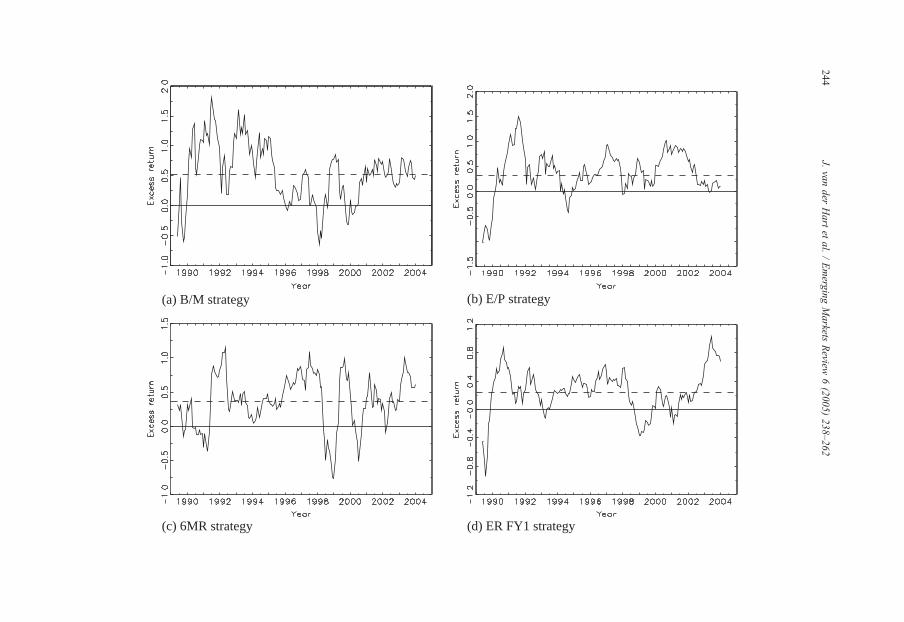
To analyze the stability of the strategies’ performance, Fig. 1 plots 12-month moving
average excess returns of the top portfolios relative to the EWI, while Table 2 shows the
TMI excess returns for three five-year subsample periods. All strategies have positive
excess returns in all three subperiods and most excess returns are statistically significant.
For the B/M strategy, the average excess return decreased considerably over time, from
0.84% over the period July 1989–June 1994 to 0.39% over the period July 1994–June
2004. In contrast, for the E /P and earnings revisions strategies the excess returns were
quite stable across sub-periods, while the performance of the momentum strategy even
improved notably over time. Finally, Fig. 1 reveals that the B/M strategy was heavily
affected by the Asia crisis in 1997 during which it underperformed relative to the EWI,
while the momentum and earnings revisions strategies had negative excess returns
(a) B/M strategy (b) E/P strategy
(c) 6MR strategy (d) ER FY1 strategy
J.vander
Hartet
al./Emerg
ingMarkets
Review
6(2005)238–262
244
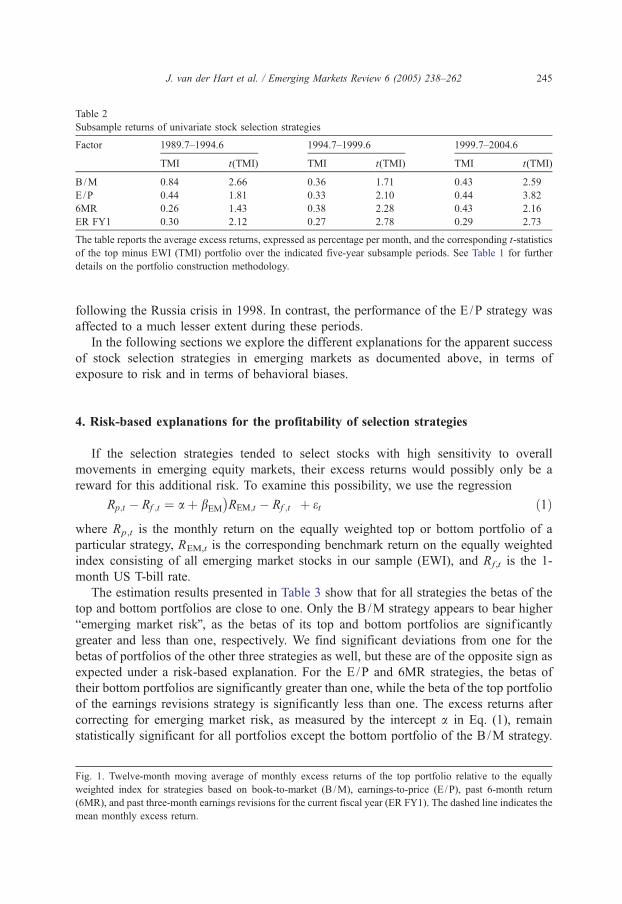
Table 2
Subsample returns of univariate stock selection strategies
Factor 1989.7–1994.6 1994.7–1999.6 1999.7–2004.6
TMI t(TMI) TMI t(TMI) TMI t(TMI)
B/M 0.84 2.66 0.36 1.71 0.43 2.59
E /P 0.44 1.81 0.33 2.10 0.44 3.82
6MR 0.26 1.43 0.38 2.28 0.43 2.16
ER FY1 0.30 2.12 0.27 2.78 0.29 2.73
The table reports the average excess returns, expressed as percentage per month, and the corresponding t-statistics
of the top minus EWI (TMI) portfolio over the indicated five-year subsample periods. See Table 1 for further
details on the portfolio construction methodology.
J. van der Hart et al. / Emerging Markets Review 6 (2005) 238–262 245
following the Russia crisis in 1998. In contrast, the performance of the E /P strategy was
affected to a much lesser extent during these periods.
In the following sections we explore the different explanations for the apparent success
of stock selection strategies in emerging markets as documented above, in terms of
exposure to risk and in terms of behavioral biases.
4. Risk-based explanations for the profitability of selection strategies
If the selection strategies tended to select stocks with high sensitivity to overall
movements in emerging equity markets, their excess returns would possibly only be a
reward for this additional risk. To examine this possibility, we use the regression
Rp;t � Rf ;t ¼ a þ bEM REM;t � Rf ;t
� �þ et ð1Þ
where Rp,t is the monthly return on the equally weighted top or bottom portfolio of a
particular strategy, REM,t is the corresponding benchmark return on the equally weighted
index consisting of all emerging market stocks in our sample (EWI), and Rf,t is the 1-
month US T-bill rate.
The estimation results presented in Table 3 show that for all strategies the betas of the
top and bottom portfolios are close to one. Only the B /M strategy appears to bear higher
bemerging market riskQ, as the betas of its top and bottom portfolios are signif icantly
greater and less than one, respectively. We find significant deviations from one for the
betas of portfolios of the other three strategies as well, but these are of the opposite sign as
expected under a risk-based explanation. For the E /P and 6MR strategies, the betas of
their bottom portfolios are significantly greater than one, while the beta of the top portfolio
of the earnings revisions strategy is significantly less than one. The excess returns after
correcting for emerging market risk, as measured by the intercept a in Eq. (1), remain
statistically significant for all portfolios except the bottom portfolio of the B/M strategy.
Fig. 1. Twelve-month moving average of monthly excess returns of the top portfolio relative to the equally
weighted index for strategies based on book-to-market (B /M), earnings-to-price (E/P), past 6-month return
(6MR), and past three-month earnings revisions for the current fiscal year (ER FY1). The dashed line indicates the
mean monthly excess return.
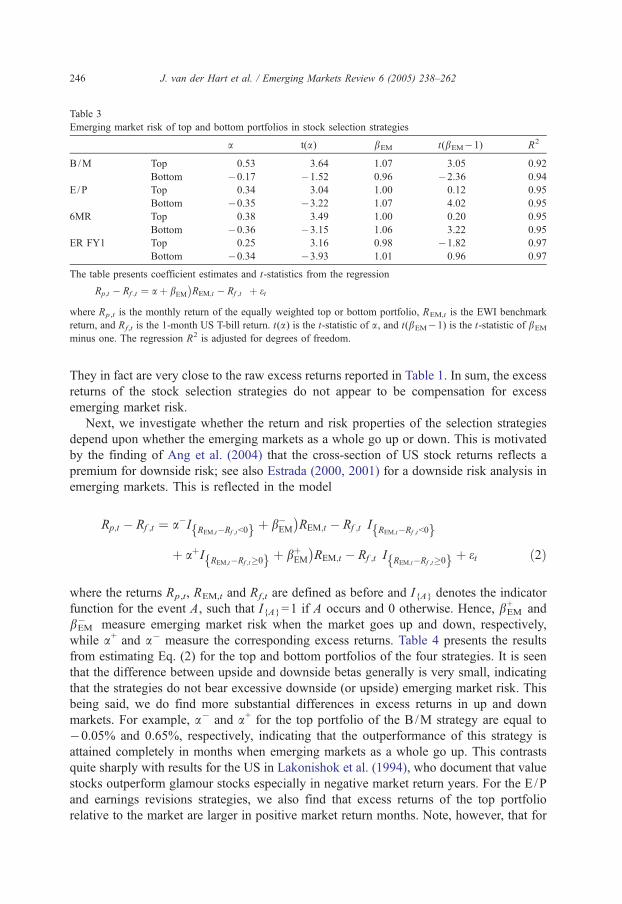
Table 3
Emerging market risk of top and bottom portfolios in stock selection strategies
a t(a) bEM t(bEM�1) R2
B/M Top 0.53 3.64 1.07 3.05 0.92
Bottom �0.17 �1.52 0.96 �2.36 0.94
E/P Top 0.34 3.04 1.00 0.12 0.95
Bottom �0.35 �3.22 1.07 4.02 0.95
6MR Top 0.38 3.49 1.00 0.20 0.95
Bottom �0.36 �3.15 1.06 3.22 0.95
ER FY1 Top 0.25 3.16 0.98 �1.82 0.97
Bottom �0.34 �3.93 1.01 0.96 0.97
The table presents coefficient estimates and t-statistics from the regression
Rp;t � Rf ;t ¼ a þ bEM REM;t � Rf ;t
� �þ et
where Rp ,t is the monthly return of the equally weighted top or bottom portfolio, REM,t is the EWI benchmark
return, and Rf ,t is the 1-month US T-bill return. t(a) is the t-statistic of a, and t(bEM�1) is the t-statistic of bEM
minus one. The regression R2 is adjusted for degrees of freedom.
J. van der Hart et al. / Emerging Markets Review 6 (2005) 238–262246
They in fact are very close to the raw excess returns reported in Table 1. In sum, the excess
returns of the stock selection strategies do not appear to be compensation for excess
emerging market risk.
Next, we investigate whether the return and risk properties of the selection strategies
depend upon whether the emerging markets as a whole go up or down. This is motivated
by the finding of Ang et al. (2004) that the cross-section of US stock returns reflects a
premium for downside risk; see also Estrada (2000, 2001) for a downside risk analysis in
emerging markets. This is reflected in the model
Rp;t � Rf ;t ¼ a�IREM;t�Rf ;tb0f g þ b�
EM REM;t � Rf ;t
� �I
REM;t�Rf ;tb0f g
þ aþIREM;t�Rf ;t�0f g þ bþ
EM REM;t � Rf ;t
� �I
REM;t�Rf ;t�0f g þ et ð2Þ
where the returns Rp,t, REM,t and Rf,t are defined as before and I{A} denotes the indicator
function for the event A, such that I{A}=1 if A occurs and 0 otherwise. Hence, bEM+ and
bEM� measure emerging market risk when the market goes up and down, respectively,
while a+ and a� measure the corresponding excess returns. Table 4 presents the results
from estimating Eq. (2) for the top and bottom portfolios of the four strategies. It is seen
that the difference between upside and downside betas generally is very small, indicating
that the strategies do not bear excessive downside (or upside) emerging market risk. This
being said, we do find more substantial differences in excess returns in up and down
markets. For example, a� and a+ for the top portfolio of the B/M strategy are equal to
�0.05% and 0.65%, respectively, indicating that the outperformance of this strategy is
attained completely in months when emerging markets as a whole go up. This contrasts
quite sharply with results for the US in Lakonishok et al. (1994), who document that value
stocks outperform glamour stocks especially in negative market return years. For the E /P
and earnings revisions strategies, we also find that excess returns of the top portfolio
relative to the market are larger in positive market return months. Note, however, that for

Table 4
Downside and upside emerging market risk of top and bottom portfolios in stock selection strategies
Strategy Portfolio a� t(a�) bEM� t(b�
EM�1) a+ t(a+) bEM+ t(b+
EM�1) R2
B /M Top �0.05 �0.15 0.99 �0.25 0.65 2.28 1.07 1.48 0.93
Bottom 0.08 0.31 1.00 �0.05 �0.16 �0.73 0.95 �1.42 0.94
E /P Top 0.18 0.68 0.98 �0.55 0.36 1.65 1.00 0.08 0.95
Bottom �0.60 �2.34 1.02 0.63 �0.48 �2.21 1.10 2.82 0.96
6MR Top 0.53 2.06 1.02 0.62 0.32 1.54 1.01 0.21 0.95
Bottom �0.23 �0.87 1.07 1.65 �0.52 �2.34 1.08 2.24 0.95
ER FY1 Top 0.23 1.31 0.98 �0.68 0.40 2.47 0.95 �1.81 0.97
Bottom �0.34 �1.76 1.01 0.22 �0.47 �2.60 1.04 1.21 0.97
The table presents coefficient estimates and t-statistics from the regression
Rp;t � Rf ;t ¼ a�IREM;t�Rf ; tb0f g þ b�
EM REM;t � Rf ;t
� �I
REM; t�Rf ; tb0f g þ aþIREM; t�Rf ; t�0f g
þ bþEM REM;t � Rf ;t
� �I
REM;t�Rf ;t�0f g þ et
where Rp ,t is the monthly return of the equally weighted top or bottom portfolio, REM,t is the EWI
benchmark return, Rf ,t is the 1-month US T-bill return, and I{A} is the indicator function for the event A. t(a)is the t-statistic of a and t(bEM�1) is the t-statistic of bEM minus one. The regression R2 is adjusted for
degrees of freedom.
J. van der Hart et al. / Emerging Markets Review 6 (2005) 238–262 247
the E /P strategy the bottom portfolio also performs relatively better in upward markets,
such that the outperformance of the top versus bottom portfolio is not sensitive to the
direction of the overall market. The same holds for the momentum strategy, although in
that case we find that |a+|b |a�|. In sum, the evidence in Table 4 indicates that the selection
strategies do not expose investors to greater downside (or upside) emerging market risk.
Finally, we consider the possibility that the excess returns are rewards for exposures to
global risk factors by using the four-factor regression model developed by Fama and French
(1993, 1996) and Carhart (1997). This model explains portfolio returns in excess of the risk-
free rate Rp,t�Rf,t by sensitivities to the excess return on the market portfolio RM,t�Rf,t
and the difference between the returns on portfolios of stocks with high and low book-to-
market values (RHML,t, HML=high-minus-low), on portfolios of stocks with small and large
market capitalization (RSMB,t, SMB=small-minus-big), and on portfolios of stocks with
high and low momentum (RUMD,t, UMD=up-minus-down). That is, the model is given by
Rp;t � Rf ;t ¼ a þ bM RM;t � Rf ;t
� �þ bHMLRHML;t þ bSMBRSMB;t þ bUMDRUMD;t þ et:
ð3Þ
The four-factor model is estimated with Rp,t being the returns on the top and bottom
portfolios in the different strategies, the returns on the equally weighted index of the
corresponding samples of emerging market stocks (EWI), and the TMI and TMB excess
returns. For the TMI and TMB excess return regressions, the risk-free interest rate is not
included on the left-hand side of Eq. (3). As proxies for the global risk factors, we use the
US returns data available on the website of Kenneth French.4
The estimation results in Table 5 show a number of interesting features. First, the
estimates of bM are significantly less than one for all top and bottom portfolios and
4 http://mba.tuck.dartmouth.edu/pages/faculty/ken.french/data_library.html.
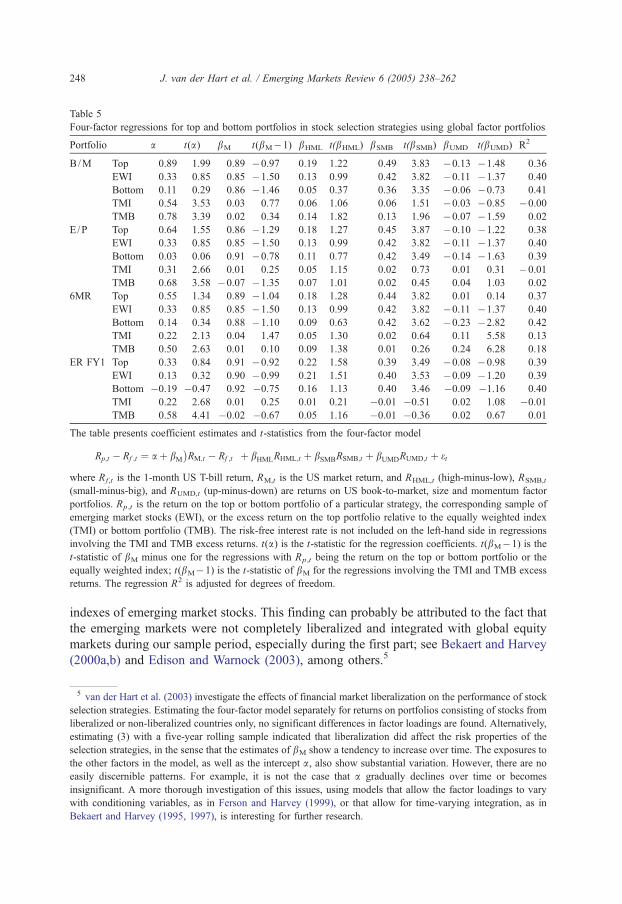
Table 5
Four-factor regressions for top and bottom portfolios in stock selection strategies using global factor portfolios
Portfolio a t(a) bM t(bM�1) bHML t(bHML) bSMB t(bSMB) bUMD t(bUMD) R2
B/M Top 0.89 1.99 0.89 �0.97 0.19 1.22 0.49 3.83 �0.13 �1.48 0.36
EWI 0.33 0.85 0.85 �1.50 0.13 0.99 0.42 3.82 �0.11 �1.37 0.40
Bottom 0.11 0.29 0.86 �1.46 0.05 0.37 0.36 3.35 �0.06 �0.73 0.41
TMI 0.54 3.53 0.03 0.77 0.06 1.06 0.06 1.51 �0.03 �0.85 �0.00
TMB 0.78 3.39 0.02 0.34 0.14 1.82 0.13 1.96 �0.07 �1.59 0.02
E/P Top 0.64 1.55 0.86 �1.29 0.18 1.27 0.45 3.87 �0.10 �1.22 0.38
EWI 0.33 0.85 0.85 �1.50 0.13 0.99 0.42 3.82 �0.11 �1.37 0.40
Bottom 0.03 0.06 0.91 �0.78 0.11 0.77 0.42 3.49 �0.14 �1.63 0.39
TMI 0.31 2.66 0.01 0.25 0.05 1.15 0.02 0.73 0.01 0.31 �0.01
TMB 0.68 3.58 �0.07 �1.35 0.07 1.01 0.02 0.45 0.04 1.03 0.02
6MR Top 0.55 1.34 0.89 �1.04 0.18 1.28 0.44 3.82 0.01 0.14 0.37
EWI 0.33 0.85 0.85 �1.50 0.13 0.99 0.42 3.82 �0.11 �1.37 0.40
Bottom 0.14 0.34 0.88 �1.10 0.09 0.63 0.42 3.62 �0.23 �2.82 0.42
TMI 0.22 2.13 0.04 1.47 0.05 1.30 0.02 0.64 0.11 5.58 0.13
TMB 0.50 2.63 0.01 0.10 0.09 1.38 0.01 0.26 0.24 6.28 0.18
ER FY1 Top 0.33 0.84 0.91 �0.92 0.22 1.58 0.39 3.49 �0.08 �0.98 0.39
EWI 0.13 0.32 0.90 �0.99 0.21 1.51 0.40 3.53 �0.09 �1.20 0.39
Bottom �0.19 �0.47 0.92 �0.75 0.16 1.13 0.40 3.46 �0.09 �1.16 0.40
TMI 0.22 2.68 0.01 0.25 0.01 0.21 �0.01 �0.51 0.02 1.08 �0.01
TMB 0.58 4.41 �0.02 �0.67 0.05 1.16 �0.01 �0.36 0.02 0.67 0.01
The table presents coefficient estimates and t-statistics from the four-factor model
Rp;t � Rf ;t ¼ a þ bM RM;t � Rf ;t
� �þ bHMLRHML;t þ bSMBRSMB;t þ bUMDRUMD;t þ et
where Rf ,t is the 1-month US T-bill return, RM,t is the US market return, and RHML,t (high-minus-low), RSMB,t
(small-minus-big), and RUMD,t (up-minus-down) are returns on US book-to-market, size and momentum factor
portfolios. Rp ,t is the return on the top or bottom portfolio of a particular strategy, the corresponding sample of
emerging market stocks (EWI), or the excess return on the top portfolio relative to the equally weighted index
(TMI) or bottom portfolio (TMB). The risk-free interest rate is not included on the left-hand side in regressions
involving the TMI and TMB excess returns. t(a) is the t-statistic for the regression coefficients. t(bM�1) is the
t-statistic of bM minus one for the regressions with Rp ,t being the return on the top or bottom portfolio or the
equally weighted index; t(bM�1) is the t-statistic of bM for the regressions involving the TMI and TMB excess
returns. The regression R2 is adjusted for degrees of freedom.
J. van der Hart et al. / Emerging Markets Review 6 (2005) 238–262248
indexes of emerging market stocks. This finding can probably be attributed to the fact that
the emerging markets were not completely liberalized and integrated with global equity
markets during our sample period, especially during the first part; see Bekaert and Harvey
(2000a,b) and Edison and Warnock (2003), among others.5
5 van der Hart et al. (2003) investigate the effects of financial market liberalization on the performance of stock
selection strategies. Estimating the four-factor model separately for returns on portfolios consisting of stocks from
liberalized or non-liberalized countries only, no significant differences in factor loadings are found. Alternatively,
estimating (3) with a five-year rolling sample indicated that liberalization did affect the risk properties of the
selection strategies, in the sense that the estimates of bM show a tendency to increase over time. The exposures to
the other factors in the model, as well as the intercept a, also show substantial variation. However, there are no
easily discernible patterns. For example, it is not the case that a gradually declines over time or becomes
insignificant. A more thorough investigation of this issues, using models that allow the factor loadings to vary
with conditioning variables, as in Ferson and Harvey (1999), or that allow for time-varying integration, as in
Bekaert and Harvey (1995, 1997), is interesting for further research.

J. van der Hart et al. / Emerging Markets Review 6 (2005) 238–262 249
Note that for all selection strategies the betas for the top portfolios are not significantly
greater than the betas for the corresponding EWI and bottom portfolios. The resulting
estimates of beta when the excess returns of the top portfolio relative to the EWI or bottom
portfolio are used as dependent variable therefore are close to zero for all selection
strategies considered. Second, the returns for the emerging market portfolios are positively
correlated with the returns for small versus big stocks, as evidenced by the positive and
statistically significant estimates of bSMB for the top, index and bottom portfolios of all
strategies. In contrast, the emerging market portfolios are virtually insensitive to the HML
and UMD factors. The estimates of bHML are never significant (at the two-sided 5%
significance level) for the top, EWI and bottom portfolios, while the estimate of bUMD is
significant only for the bottom portfolio of the momentum strategy. Third, the sensitivities
of the TMI and TMB excess returns are never significantly different from zero, except for
the SMB and UMD factors in case of the B/M and momentum strategies, respectively.
Fourth and perhaps most important, the estimated intercepts a for the TMI and TMB
excess returns are significantly different from zero for all strategies and are very close to
the raw excess returns reported in Table 1. The only exception appears to be the
momentum strategy, for which a sizeable part of the excess return is accounted for by
global momentum risk. Overall, however, global book-to-market, size and momentum risk
factors cannot explain the outperformance of stock selection strategies in emerging
markets. This corroborates the results obtained by Rouwenhorst (1999) using a two-factor
model with only the HML factor included next to the market portfolio return.
We close this section by noting that whether the HML, SMB and UMD factors are
indeed proxies for risk is subject to discussion and interpretation. Instead of being risk
proxies, these factors could also capture certain market inefficiencies themselves.
Consequently, finding an insignificant alpha in multi-factor models such as Eq. (3) does
not necessarily imply that the sorting characteristic upon which the particular strategy is
based is just proxying for risk. The alpha also goes to zero in case the inefficiencies
captured by the factors are correlated with the inefficiencies captured by the strategy. In
sum, it is difficult to distinguish between the risk-based and behavioral explanations using
multi-factor models. Note that our results are not subject to this caveat, given that we find
highly significant estimates of alpha in Eq. (3) for strategies considered; hence for our
purposes, we can leave this discussion aside. However, we would like to remark that one
could interpret the regression results more neutrally by speaking for example of developed
market style returns instead of global risk factors. This would still give relevant
information on whether the emerging markets strategies move in tandem with developed
markets, or that they have their own dynamics.
5. Behavioral explanations for the profitability of selection strategies
In this section we explore whether behavioral explanations can account for the success
of the stock selection strategies in emerging markets. We discuss value strategies and
momentum and earnings revisions strategies separately. Although momentum and
revisions strategies prove to have different features in some respect, they are treated
together as the same characteristics are examined.
J. van der Hart et al. / Emerging Markets Review 6 (2005) 238–262250
5.1. Value strategies
Lakonishok et al. (1994) provide a behavioral explanation for the significant excess
returns of value strategies. They argue that investors are excessively pessimistic
(optimistic) about future earnings growth of value (growth) stocks, because they
extrapolate past growth rates too far into the future. Using a sample of US stocks and
various measures of growth, including earnings, Lakonishok et al. (1994) demonstrate that
glamour stocks grow much faster than value stocks before portfolio formation. During the
post-formation period, earnings growth rates continue to be lower for value stocks than for
glamour stocks for the first two years, but this pattern is reversed over the following three
years, resulting in approximately equal growth rates over the complete five-year period.
Hence, actual post-formation earnings growth of value stocks relative to growth stocks
turns out to be substantially higher than what they were during the pre-formation period or
than what investors expected them to be according to multiples such as the E /P ratio.
Buying and selling stocks with low and high expected earnings growth, respectively, then
produces excess returns.
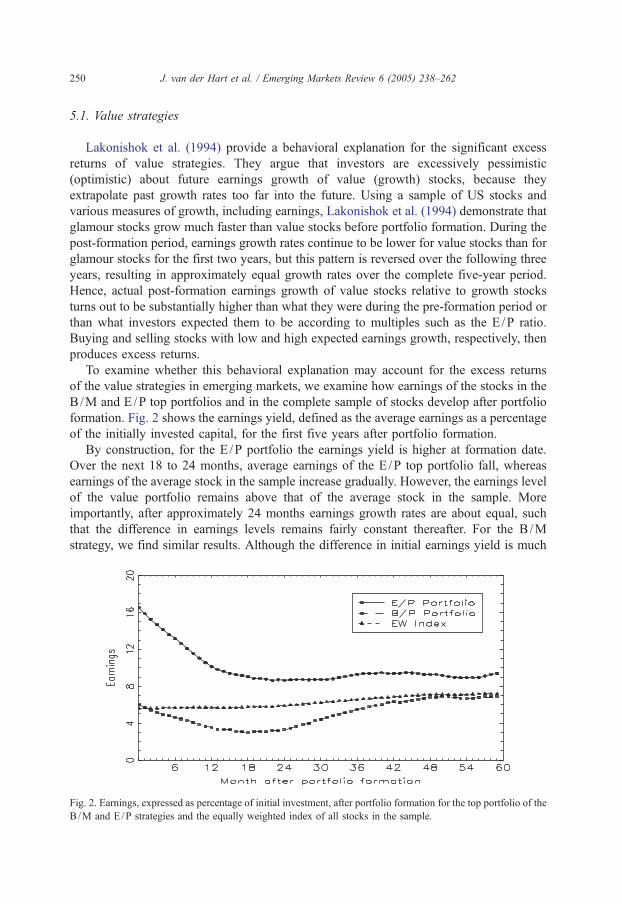
To examine whether this behavioral explanation may account for the excess returns
of the value strategies in emerging markets, we examine how earnings of the stocks in the
B/M and E /P top portfolios and in the complete sample of stocks develop after portfolio
formation. Fig. 2 shows the earnings yield, defined as the average earnings as a percentage
of the initially invested capital, for the first five years after portfolio formation.
By construction, for the E /P portfolio the earnings yield is higher at formation date.
Over the next 18 to 24 months, average earnings of the E /P top portfolio fall, whereas
earnings of the average stock in the sample increase gradually. However, the earnings level
of the value portfolio remains above that of the average stock in the sample. More
importantly, after approximately 24 months earnings growth rates are about equal, such
that the difference in earnings levels remains fairly constant thereafter. For the B/M
strategy, we find similar results. Although the difference in initial earnings yield is much
Fig. 2. Earnings, expressed as percentage of initial investment, after portfolio formation for the top portfolio of the
B/M and E/P strategies and the equally weighted index of all stocks in the sample.
J. van der Hart et al. / Emerging Markets Review 6 (2005) 238–262 251
smaller, we do find negative growth during the first 18 months after portfolio formation.
This is followed by above average growth in the subsequent period, such that after three
and a half years the stocks in the B/M portfolio again have higher earnings levels than the
average stock. The improvement in earnings growth may lead to valuation ratios for the
value portfolios that are more in line with the market average. This is indeed the case. The
average fall in earnings is more than compensated for by a rise in the stock price, leading
to an improvement in the price-to-earnings ratio. Concluding, the differences in valuation
ratios between value and growth stocks are not justified by subsequent earnings
developments. After two years, the earnings growth rate of value stocks is equal to the
growth rate of the average stock. Hence, our findings for value strategies in emerging
markets correspond with the evidence for this behavioral explanation in Lakonishok et al.
(1994).
More recently, Doukas et al. (2002) argue that the results of Lakonishok et al. (1994) do
not imply that investors actually underestimate the growth prospects for value stocks. To
the contrary, using analysts’ earnings forecasts for the next three years, they find that
analysts are on average more (over)optimistic for value stocks than for growth stocks. In
addition, they find that value stocks have larger negative revisions of earnings estimates
than growth stocks. Based on this evidence they conclude that the superior return
performance of value stocks cannot be explained by excessive pessimism about future
earnings growth.
In our view, the evidence from Doukas et al. (2002) is not necessarily at odds with the
evidence from Lakonishok et al. (1994). It may be argued that long-term developments are
most important for equity valuation and that, hence, the three-year post-portfolio formation
period considered by Doukas et al. (2002) is too short. Analysts might overestimate the
short-run earnings developments of value stocks, but at the same time underestimate the
potential for earnings growth to revert to the mean at longer horizons. The improvement in
the earnings growth rate and the strong recovery in P /E ratio for value stocks discussed
above indicate that their long-term earnings prospects improve sharply after just a few
years. We put this hypothesis to the test using analysts’ earnings forecast errors, earnings
revisions and earnings growth forecasts, during the five years after portfolio formation.
For an individual stock, the earnings forecast error in month t, denoted FEt, is
defined only once a year, namely eight months prior to fiscal year end. In that case,
FEt is equal to the difference between the actual earnings in the current fiscal year
(FY0t+8) and the consensus analysts’ forecast issued in month t (FY1t), expressed as
percentage of the stock price at the time of the forecast ( Pt); that is
FEt=100 (FY0t+8�FY1t) /Pt. We define the consensus forecast as the median
forecast reported by IBES. The eight-month horizon is adopted from Easterwood and
Nutt (1999) and Doukas et al. (2002) and is chosen to ensure that the previous year’s
annual report was available to analysts at the time they issued their forecasts. We also
follow Easterwood and Nutt (1999) in eliminating observations for which the forecast
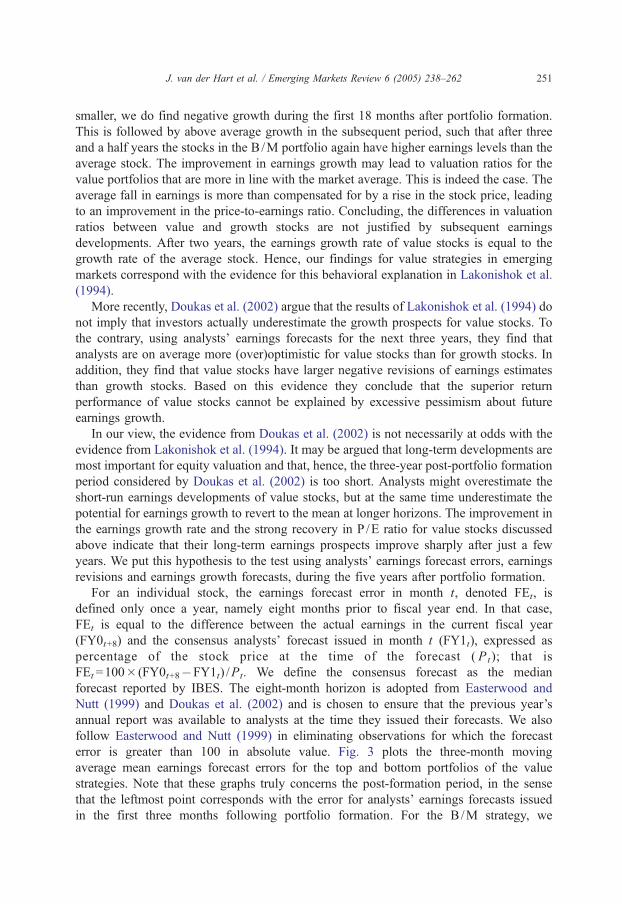
error is greater than 100 in absolute value. Fig. 3 plots the three-month moving
average mean earnings forecast errors for the top and bottom portfolios of the value
strategies. Note that these graphs truly concerns the post-formation period, in the sense
that the leftmost point corresponds with the error for analysts’ earnings forecasts issued
in the first three months following portfolio formation. For the B/M strategy, we
(a)
(b)
Fig. 3. Three-month moving average of earnings forecast errors after portfolio formation for top and bottom
portfolios of the (a) B/M strategy and (b) E /P strategy and for the relevant equally weighted index.
J. van der Hart et al. / Emerging Markets Review 6 (2005) 238–262252
observe that immediately following portfolio formation, earnings forecast errors for the
top and bottom portfolios are substantially below and above average, respectively.6 In
fact, this continues to be the case until 18 months after portfolio formation. Hence, analysts
6 Notice that for the EWI, the forecast error is negative for each month in the post-formation period. This
demonstrates the notion that analysts are (too) optimistic about future earnings for the average stock in the
sample. In addition to systematic positive bias in analysts’ earnings forecasts (see Easterwood and Nutt, 1999 for
recent evidence), the extent of this bias has also been found to be predictable from observable firm characteristics,
see Abarbanell and Bernard (1992), among others. Analysts’ forecasts are therefore usually dismissed as being
irrational or inaccurate. A recent study by Lim (2001) shows that positively and predictably biased forecasts may
in fact be optimal if the incentive structure of analysts is taken into account. If analysts balance forecast accuracy
and improved access to management information, such biased forecasts are rational. Furthermore, Hong and
Kubik (2003) document that optimistic analysts promoting stocks are more likely to experience favorable job
separations. Hence, career concerns may also lead to upward biases in analysts’ forecasts.

J. van der Hart et al. / Emerging Markets Review 6 (2005) 238–262 253
indeed appear to be more optimistic about the earnings prospects of value than growth
stocks, as reported in Doukas et al. (2002). In the remaining post-formation period,
however, the pattern is reversed. While the earnings forecast error for growth stocks
remains close to the average, it becomes substantially larger than average for value stocks,
implying that analysts are relatively pessimistic about value stocks’ earnings in the longer
term. For the E /P strategy, we observe a similar reversal in earnings forecast errors,
although in this case the error for growth stocks dips below average around 18 months
after portfolio formation, while for value stocks it remains at par. The implication is
however the same, namely that analysts are relatively optimistic (pessimistic) about
growth (value) stocks.
The above analysis is corroborated by the development of analysts’ earnings revisions
after portfolio formation, as shown in Fig. 4. Analysts’ revisions are more negative for
stocks in the B /M and E/P top portfolios until 10 and 15 months after portfolio formation,
respectively, again indicating that they were too optimistic about the earnings prospects for
value stocks.7 For the B/M strategy, earnings revisions for these stocks rise (substantially)
above average between one and four years after portfolio formation. During roughly the
same period, earnings revisions for growth stocks fall below average. For the E /P strategy,
the differences are smaller, but the earnings revisions for the top portfolio do remain above
the revisions for the bottom portfolio during the period between 15 and 48 months after
portfolio formation.
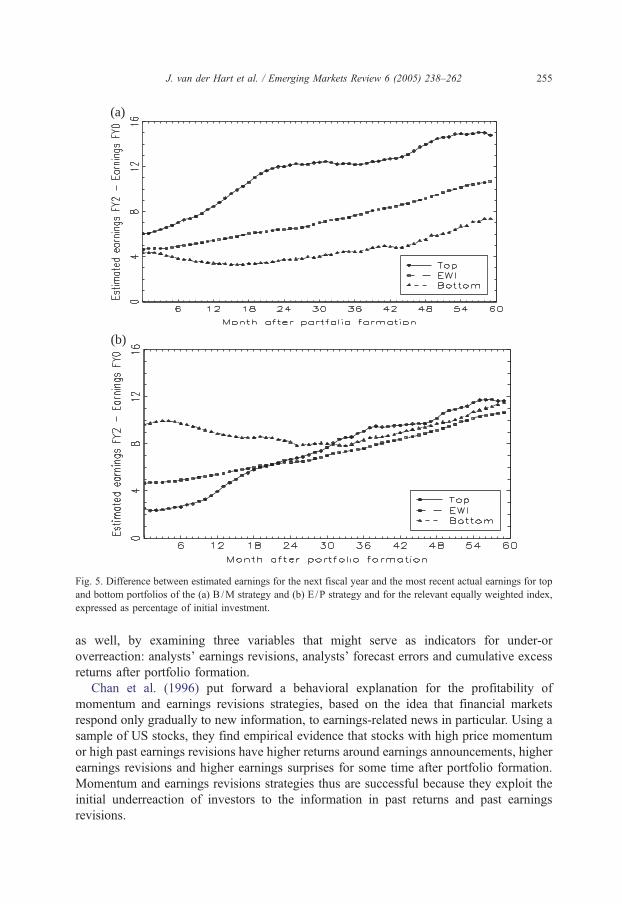
Finally, the improvement in earnings prospects is also confirmed by looking at the
developments of the earnings growth expected by analysts after portfolio formation for
each of the portfolio’s. Fig. 5 depicts the difference between the consensus earnings
forecast for the next fiscal year (FY2) versus the most recent actual earnings (FY0). Like
in the earnings figures in Fig. 2, the expected earnings change is normalized by calculating
this number as a percentage of the initially invested capital at portfolio formation. For the
E /P strategy, the expected earnings change is much lower for the top portfolio, as to be
expected. However, it reverts to the mean quite rapidly. The expected earnings change for
the top portfolio exceeds those for the equally weighted index and for the bottom portfolio
within two and three years, respectively. For the B/M strategy, the starting point differs as
the expected earnings change at portfolio formation is already slightly higher for the top
portfolio. What is the same, however, is that the expected earnings change increases more
strongly for the top portfolio. The growth characteristics of expensive stocks based on E/P
and B/M appear to be rather short-lived.
Concluding, just like Lakonishok et al. (1994), we find that the relative cheapness of
value stocks is not justified by subsequent earnings developments. For value stocks,
earnings as percentage of the initial investment remain well above the averages for the
complete sample and for growth stocks, while both the actual earnings growth and its
forecast revert to the mean quite rapidly. Like Doukas et al. (2002), we do find that
analysts appear too optimistic about the earnings prospects for value stocks in the short
term. We also find that this reverses in the longer term as value stocks have above average
7 Notice that for the EWI, forecast revisions are negative for each month in the post-formation period,
confirming that analysts are (too) optimistic about future earnings for the average stock in the sample.

(b)
(a)
Fig. 4. Monthly earnings revisions after portfolio formation for top and bottom portfolios of the (a) B/M strategy
and (b) E/P strategy and for the relevant equally weighted index, expressed as percentage.
J. van der Hart et al. / Emerging Markets Review 6 (2005) 238–262254
earnings forecast errors and earnings revisions after about one year after portfolio
formation. This indicates that analysts are too pessimistic about the long-term growth
perspectives for value stocks.
5.2. Momentum and earnings revisions strategies
A number of studies have tested behavioral explanations for momentum strategies in
developed markets (see amongst others Chan et al., 1996; Jegadeesh and Titman, 2001;
Lee and Swaminathan, 2000; Hong et al., 2000; Nagel, 2002; Cooper et al., 2004).
Underreaction and overreaction effects are part of these explanations. In this section we
investigate whether these effects are present in the emerging markets momentum strategy
(b)
(a)
Fig. 5. Difference between estimated earnings for the next fiscal year and the most recent actual earnings for top
and bottom portfolios of the (a) B /M strategy and (b) E /P strategy and for the relevant equally weighted index,
expressed as percentage of initial investment.
J. van der Hart et al. / Emerging Markets Review 6 (2005) 238–262 255
as well, by examining three variables that might serve as indicators for under-or
overreaction: analysts’ earnings revisions, analysts’ forecast errors and cumulative excess
returns after portfolio formation.
Chan et al. (1996) put forward a behavioral explanation for the profitability of
momentum and earnings revisions strategies, based on the idea that financial markets
respond only gradually to new information, to earnings-related news in particular. Using a
sample of US stocks, they find empirical evidence that stocks with high price momentum
or high past earnings revisions have higher returns around earnings announcements, higher
earnings revisions and higher earnings surprises for some time after portfolio formation.
Momentum and earnings revisions strategies thus are successful because they exploit the
initial underreaction of investors to the information in past returns and past earnings
revisions.
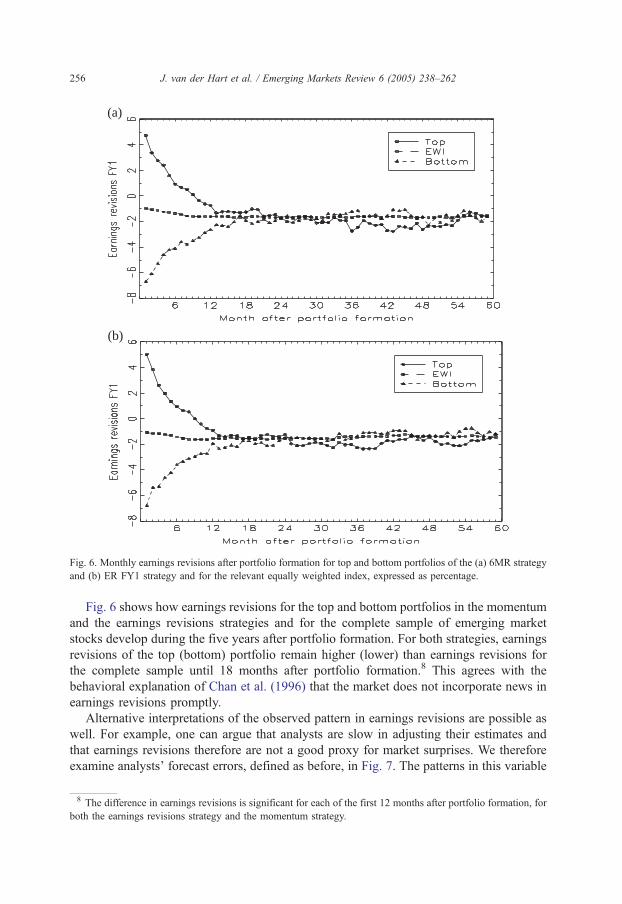
(a)
(b)
Fig. 6. Monthly earnings revisions after portfolio formation for top and bottom portfolios of the (a) 6MR strategy
and (b) ER FY1 strategy and for the relevant equally weighted index, expressed as percentage.
J. van der Hart et al. / Emerging Markets Review 6 (2005) 238–262256
Fig. 6 shows how earnings revisions for the top and bottom portfolios in the momentum
and the earnings revisions strategies and for the complete sample of emerging market
stocks develop during the five years after portfolio formation. For both strategies, earnings
revisions of the top (bottom) portfolio remain higher (lower) than earnings revisions for
the complete sample until 18 months after portfolio formation.8 This agrees with the
behavioral explanation of Chan et al. (1996) that the market does not incorporate news in
earnings revisions promptly.
Alternative interpretations of the observed pattern in earnings revisions are possible as
well. For example, one can argue that analysts are slow in adjusting their estimates and
that earnings revisions therefore are not a good proxy for market surprises. We therefore
examine analysts’ forecast errors, defined as before, in Fig. 7. The patterns in this variable
8 The difference in earnings revisions is significant for each of the first 12 months after portfolio formation, for
both the earnings revisions strategy and the momentum strategy.
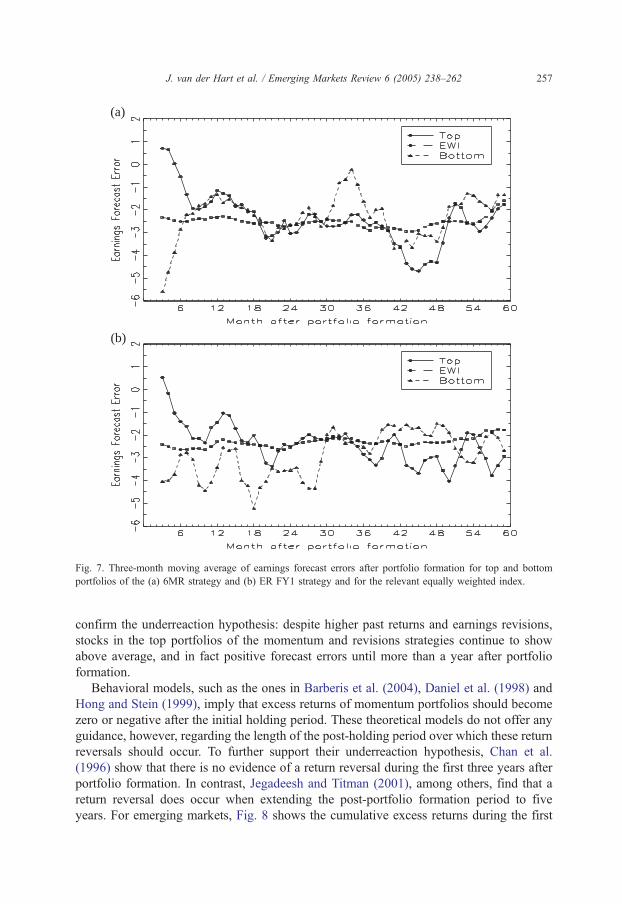
(a)
(b)
Fig. 7. Three-month moving average of earnings forecast errors after portfolio formation for top and bottom
portfolios of the (a) 6MR strategy and (b) ER FY1 strategy and for the relevant equally weighted index.
J. van der Hart et al. / Emerging Markets Review 6 (2005) 238–262 257
confirm the underreaction hypothesis: despite higher past returns and earnings revisions,
stocks in the top portfolios of the momentum and revisions strategies continue to show
above average, and in fact positive forecast errors until more than a year after portfolio
formation.
Behavioral models, such as the ones in Barberis et al. (2004), Daniel et al. (1998) and
Hong and Stein (1999), imply that excess returns of momentum portfolios should become
zero or negative after the initial holding period. These theoretical models do not offer any
guidance, however, regarding the length of the post-holding period over which these return
reversals should occur. To further support their underreaction hypothesis, Chan et al.
(1996) show that there is no evidence of a return reversal during the first three years after
portfolio formation. In contrast, Jegadeesh and Titman (2001), among others, find that a
return reversal does occur when extending the post-portfolio formation period to five
years. For emerging markets, Fig. 8 shows the cumulative excess returns during the first
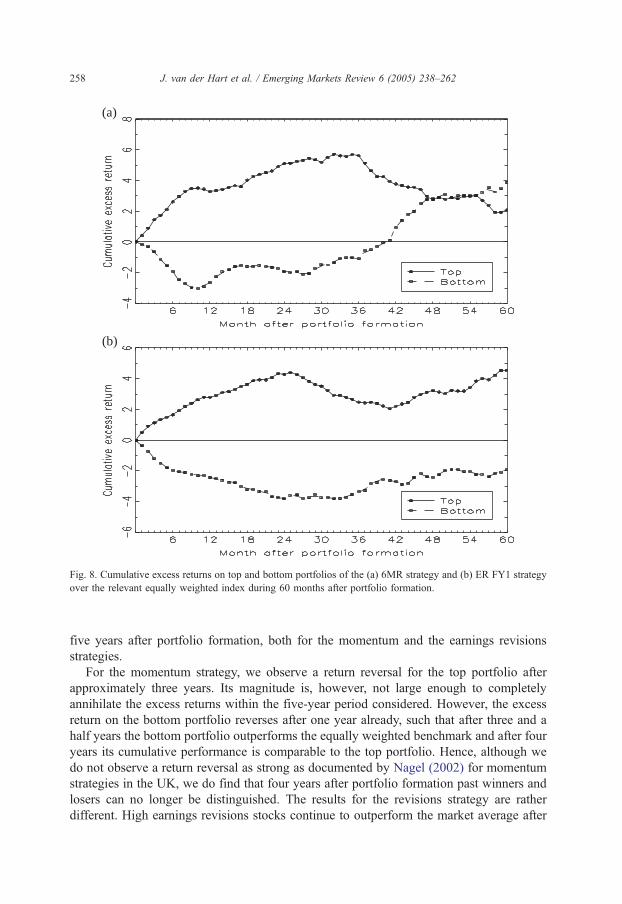
(a)
(b)
Fig. 8. Cumulative excess returns on top and bottom portfolios of the (a) 6MR strategy and (b) ER FY1 strategy
over the relevant equally weighted index during 60 months after portfolio formation.
J. van der Hart et al. / Emerging Markets Review 6 (2005) 238–262258
five years after portfolio formation, both for the momentum and the earnings revisions
strategies.
For the momentum strategy, we observe a return reversal for the top portfolio after
approximately three years. Its magnitude is, however, not large enough to completely
annihilate the excess returns within the five-year period considered. However, the excess
return on the bottom portfolio reverses after one year already, such that after three and a
half years the bottom portfolio outperforms the equally weighted benchmark and after four
years its cumulative performance is comparable to the top portfolio. Hence, although we
do not observe a return reversal as strong as documented by Nagel (2002) for momentum
strategies in the UK, we do find that four years after portfolio formation past winners and
losers can no longer be distinguished. The results for the revisions strategy are rather
different. High earnings revisions stocks continue to outperform the market average after
J. van der Hart et al. / Emerging Markets Review 6 (2005) 238–262 259
the six-month holding period and a return reversal does not occur during the first five years
after portfolio formation.
Concluding, the momentum strategy seems to have elements of both overreaction and
underreaction effects, as the analysts’ earnings revisions and forecast errors suggest an
underreaction, while the five-year post-formation returns suggest an overreaction. A
possible solution may be found in Lee and Swaminathan (2000), who investigate the
interaction between momentum and turnover, and find different behavior for high turnover
momentum stocks versus low turnover momentum stocks in the US. Nagel (2002) finds
similar results for the UK and relates them to implicit value effects. An interesting topic for
further research would be to test these results for emerging markets. For the earnings
revisions strategy, both the earnings revisions by analysts after portfolio formation as well
as the five-year excess returns point towards an initial underreaction. This shows that the
revisions strategy has different characteristics than the momentum strategy.
6. Conclusions
Stock selection strategies based on value, momentum and earning revisions prove to
generate significant excess returns in emerging markets. In this paper, we investigate
different explanations for the success of these strategies, using stocks included in the IFC
Investable Composite Index over the period December 1988–June 2004.
We find little if any evidence for risk-based explanations. The excess returns remain
significant after correcting for (potentially different upside and downside) emerging
market risk, as well as after correcting for global market risk, value, size and momentum
factors. Only the performance of the momentum strategy can partly be attributed to a
global momentum risk factor.
We do find that the emerging markets results are consistent with the evidence from
developed markets concerning behavioral explanations. For value stocks, our findings are
in accordance with an overreaction explanation, as the actual and expected earnings
growth of these stocks reverts to the mean in a few years and the earnings as percentage of
initial investment remains well above average. The overreaction explanation seems to be
contradicted by the finding that value stocks have below average (and substantially
negative) earnings forecast errors and earnings revisions up to a year after portfolio
formation. As a possible solution we suggest that the most important behavioral bias could
be related to underestimation of long-term growth rates for value stocks. This conjecture is
supported by the observation that earnings forecast errors and earnings revisions for these
stocks become above average for longer post-formation horizons and by the finding that
estimated earnings growth becomes above average within two years after portfolio
formation. For the momentum strategy, both underreaction and overreaction effects appear
to be at work. High upward earnings revisions by analysts after portfolio formation
suggest an initial underreaction. However, in the five-year post-formation period, we also
observe a strong return reversal, indicating an overreaction effect. In contrast, the evidence
does support an underreaction explanation for the earnings revisions strategy. Stocks with
high past earnings revisions continue to have high upward earnings revisions for twelve
months after portfolio formation, while there is no return reversal until at least five years

J. van der Hart et al. / Emerging Markets Review 6 (2005) 238–262260
after portfolio formation. As the earnings revisions strategy seems to have no or limited
overreaction effects, this sets it apart from momentum strategies.
Still, our results do not prove that the risk-based explanation is incorrect. The analysis
shows that the excess returns are not simply due to higher beta, more exposure to global
factors for value, size and momentum or higher downside risk, but it still might be the case
that other, yet unidentified risk measures would be able to explain the results. Also,
although the data is consistent with behavioral explanations, it does not prove it. Other
explanations might be feasible as well. It therefore remains difficult to reach a clear verdict
on the competing explanations. However, our conclusion is that the circumstantial
evidence in the current literature and in our study points towards the behavioral
explanation as the most probable one. Investors in emerging markets are more likely to get
a better risk/return reward by incorporating value, momentum and revisions strategies.
Further research could involve using a broader set of risk indicators to test whether the
strategies lead to portfolios bearing more risk in dimensions not measured by the value,
size and momentum factors. A specific possibility would be to account for macroeconomic
risk explicitly, see Chordia and Shivakumar (2002) and Griffin et al. (2003). However, one
should be aware that it might be difficult to separate the risk-based and behavioral
explanations, as proposed risk factors might also be correlated to the inefficiencies
themselves instead of just being a proxy to risk. Preferably, risk factors have a direct link
to the likelihood and magnitude of undesirable situations for investors. At the same time, a
broader set of indicators that would correlate with investor sentiment could be tested to
provide further evidence for behavioral explanations. Another source of data that could
provide interesting indicators of sentiment concerns company policies. Overoptimism of
investors might be interrelated with overoptimism of management, which could be tested
by looking for example at investment policy of the company and subsequent return on
these investments. Finally, the most direct way to test behavioral explanations is to study
the actual behavior of market participants, like in Odean (1998) for example. This would
give important complimentary evidence.
References
Abarbanell, J.S., Bernard, V.L., 1992. Tests of analysts’ overreaction/underreaction to earnings information as an
explanation for anomalous stock-price behavior. Journal of Finance 47, 1181–1207.
Achour, D., Harvey, C.R., Hopkins, G., Lang, C., 1998. Stock selection in emerging markets: portfolio strategies
for Malaysia, Mexico and South Africa. Emerging Markets Quarterly 2, 38–91 (Winter).
Achour, D., Harvey, C.R., Hopkins, G., Lang, C., 1999a. Stock selection in Malaysia. Emerging Markets
Quarterly 3, 54–91 (Spring).
Achour, D., Harvey, C.R., Hopkins, G., Lang, C., 1999b. Stock selection in Mexico. Emerging Markets Quarterly
3, 1–38 (Fall).
Achour, D., Harvey, C.R., Hopkins, G., Lang, C., 1999c. Firm characteristics and investment strategies in Africa:
the case of South Africa. African Finance Journal 1, 1–39.
Alexander, G.J., 2000. On back-testing bzero-investmentQ strategies. Journal of Business 73, 255–278.Ang, A., Chen, J., Xing, Y., 2004. Downside Risk. Columbia University, Working Paper.
Barberis, N., Shleifer, A., Vishny, R.W., 1998. A model of investor sentiment. Journal of Financial Economics 49,
307–343.
Barry, C.B., Goldreyer, E., Lockwood, L., Rodriguez, M., 2002. Robustness of size and value effects in emerging
markets, 1985–2000. Emerging Markets Review 3, 1–30.
J. van der Hart et al. / Emerging Markets Review 6 (2005) 238–262 261
Bekaert, G., Harvey, C.R., 1995. Time-varying world market integration. Journal of Finance 50, 403–444.
Bekaert, G., Harvey, C.R., 1997. Emerging equity market volatility. Journal of Financial Economics 43, 29–77.
Bekaert, G., Harvey, C.R., 2000a. Capital flows and the behavior of emerging market equity returns. In: Edwards,
S. (Ed.), Capital Flows and the Emerging Economies: Theory, Evidence and Controversies. University of
Chicago Press, Chicago, pp. 159–194.
Bekaert, G., Harvey, C.R., 2000b. Foreign speculators and emerging equity markets. Journal of Finance 55,
565–614.
Bekaert, G., Harvey, C.R., 2002. Research in emerging market finance: looking to the future. Emerging Markets
Review 3, 429–448.
Bekaert, G., Harvey, C.R., 2003. Emerging markets finance. Journal of Empirical Finance 10, 3–55.
Bekaert, G., Urias, M.S., 1996. Diversification, integration, and emerging market closed-end funds. Journal of
Finance 51, 835–870.
Carhart, M.M., 1997. On persistence in mutual fund performance. Journal of Finance 52, 57–82.
Chan, L.K.C., Jegadeesh, N., Lakonishok, J., 1996. Momentum strategies. Journal of Finance 51, 1681–1713.
Chordia, T., Shivakumar, L., 2002. Momentum, business cycle, and time-varying expected returns. Journal of
Finance 57, 985–1019.
Claessens, S., Dasgupta, S., Glen, J., 1998. The cross section of stock returns: evidence from emerging markets.
Emerging Markets Quarterly 2, 4–13.
Cooper, M.J., Gutierrez, R.C., Hameed, A., 2004. Market states and momentum. Journal of Finance 59,
1345–1365.
Daniel, K., Hirshleifer, D., Subrahmanyam, A., 1998. Investor psychology and security market under- and
overreactions. Journal of Finance 53, 1839–1885.
De Roon, F.A., Nijman, Th.E., Werker, B.J.M., 2001. Testing for mean-variance spanning with short sales
constraints and transaction costs: the case of emerging markets. Journal of Finance 56, 721–742.
Doukas, J.A., Kim, C., Pantzalis, C., 2002. A test of the errors-in-expectations explanation of the value/glamour
stock returns performance: evidence from analysts’ forecasts. Journal of Finance 57, 2143–2165.
Easterwood, J.C., Nutt, S.R., 1999. Inefficiency in analysts’ earnings forecasts: systematic misreaction or
systematic optimism? Journal of Finance 54, 1777–1797.
Edison, H.J., Warnock, F.E., 2003. A simple measure of the intensity of capital controls. Journal of Empirical
Finance 10, 81–103.
Estrada, J., 2000. The cost of equity in emerging markets: a downside approach. Emerging Markets Quarterly 4,
19–30 (Fall).
Estrada, J., 2001. The cost of equity in emerging markets: a downside approach (II). Emerging Markets Quarterly
4, 63–72 (Spring).
Fama, E.F., French, K.R., 1993. Common risk factors in the returns on stocks and bonds. Journal of Financial
Economics 33, 3–56.
Fama, E.F., French, K.R., 1996. Multifactor explanations of asset pricing anomalies. Journal of Finance 51,
55–84.
Fama, E.F., French, K.R., 1998. Value versus growth: the international evidence. Journal of Finance 53,
1975–1999.
Ferson, W.E., Harvey, C.R., 1999. Conditioning variables and the cross section of stock returns. Journal of
Finance 54, 1325–1360.
Griffin, J.M., Ji, X., Martin, J.S., 2003. Momentum investing and business cycle risk: evidence from pole to pole.
Journal of Finance 58, 2515–2547.
Harvey, C.R., 1995. Predictable risk and return in emerging markets. Review of Financial Studies 8, 773–816.
Hong, H., Kubik, J.D., 2003. Analyzing the analysts: career concerns and biased earnings forecasts. Journal of
Finance 58, 313–351.
Hong, H., Stein, J.C., 1999. A unified theory of underreaction, momentum trading, and overreaction in asset
markets. Journal of Finance 54, 2143–2184.
Hong, H., Lim, T., Stein, J.C., 2000. Bad news travels slowly: size, analyst coverage, and the profitability of
momentum strategies. Journal of Finance 55, 265–295.
Jegadeesh, N., Titman, S., 1993. Returns to buying winners and selling losers: implications for stock market
efficiency. Journal of Finance 48, 65–91.

J. van der Hart et al. / Emerging Markets Review 6 (2005) 238–262262
Jegadeesh, N., Titman, S., 2001. Profitability of momentum strategies: an evaluation of alternative explanations.
Journal of Finance 56, 699–720.
Lakonishok, J., Shleifer, A., Vishny, R.W., 1994. Contrarian investment, extrapolation and risk. Journal of
Finance 49, 1541–1578.
Lee, C.M.C., Swaminathan, B., 2000. Price momentum and trading volume. Journal of Finance 55, 2017–2069.
Lim, T., 2001. Rationality and analysts’ forecast bias. Journal of Finance 56, 369–385.
Nagel, S., 2002. Is momentum caused by delayed overreaction? Working Paper, London Business School.
Odean, T., 1998. Are investors reluctant to realize their losses? Journal of Finance 53, 1775–1798.
Patel, S.A., 1998. Cross-sectional variation in emerging markets equity returns, January 1988–March 1997.
Emerging Markets Quarterly 2, 57–70 (Spring).
Rouwenhorst, K.G., 1998. International momentum strategies. Journal of Finance 53, 267–284.
Rouwenhorst, K.G., 1999. Local return factors and turnover in emerging stock markets. Journal of Finance 54,
1439–1464.
van der Hart, J., Slagter, E., van Dijk, D., 2003. Stock selection strategies in emerging markets. Journal of
Empirical Finance 10, 105–132.


![Emerging Stock Markets_ASEAN (Dic. 2010]](https://img.pdfslide.us/doc/110x75/577d2a181a28ab4e1ea8a44c/emerging-stock-marketsasean-dic-2010.jpg)