Embed Size (px)
Citation preview

Chapter: 2
The Study Area: The City of Calcutta
2.1 Introduction
2.2 Boundaries of Calcutta City
2.3 Physiographic Setting
2. 4 Geological Structure
2. 5 Climatic Condition
2. 6 Demographic Structure
2. 6.1 Density of Population, 2. 6. 2 Migration, 2. 6. 3 Sex Ratio, 2. 6. 4 Religious Composition.
2. 7 Land Use Pattern
2.8 Housing
2. 8.1 Density of Houses, 2. 8. 2 Crowding in Residential Areas, 2.8.3 Type of Housing.
2. 9 Conclusions
2.1 Introduction
The City of Calcutta was established by traders of the English East India Company to
tap the rich natural resources of the Gangetic Valley of Bengal, Bihar and Orissa. 1•
The site where Calcutta was established was a typical rural area in the delta of lower
Bengal - a flat rice-swamp with a few scattered villages on the riverbank interspersed
with patches of jungle.
Job Charnock, an agent of the Company, had earlier made several attempts in
establishing an English fort and a city in this region. He had tried three places,
Hooghly, Uluberia and Hijli on the course of the river and had given them up for
various reasons. Eventually he chose a site near village Sutanuti where in 1686 his
men built a few clay and straw huts for a temporary stay near the village market.
The reason behind his choice perhaps was the proximity to several populous villages
and hats (periodic markets) from where labour and other provisions could be
obtained. Moreover, Bator, the oldest seat of European trade in Bengal was situated
~m the opposite bank where the docks were available for "repairing and filling the ship
bottoms" and provided good anchorage. It also served as an excellent moat against
any sudden attack by the Marathas who were invading the western parts of Bengal at
that time. There were also no Mughal fortifications nearby and land was available at a
very low price. Nearer the bay, but just above the swampiest level, Sutanuti occupied
a more naturally advantageous position, both commercially and strategically as
compared to the French settlement at Chandemagore founded in 1676.
Job Charnock withdrew the English factory from Hooghly in 16862 to Sutanuti, but it
was not till August 1690 that he succeeded in establishing a firm footing in that
village. In 1691 the English obtained a patent from Aurangzeb allowing them to trade
free of customs duty, on condition of an annual payment of Rs. 3,000. But it took
1 Kidwai, Atiya Habeeb (1987): Gateway Cities of Asia- Calcutta 1800-1981; Project Report; Indian Council for Social Science Research; New Delhi, pp.76-78.
2 Kidwai, Atiya Habeeb: (1989): Colonial Calcutta: A Scaffolding for Urban History (1690-1911); Working Paper Series; CSRD I SSS I JNU; New Delhi; pp. 6-7.
23

some years, before the English were allowed either to fortify their factory or to
exercise jurisdiction over the natives employed by them.
Map: 2.1 City of Calcutta
1690
HAORA
KAUGHAT
J In 1698, the East India Company purchased the two villages3 of Sutanuti and
Gobindpur.4 They acquired Kalikata from Savarna Ray Chaudhury, who held the
zamindari right of the area, by bribing the newly appointed Viceroy of Bengal5• The
area extended for about 3 miles along the eastern bank of the Hooghly and about 1
mile inland6•
In 1700 the Court of Directors urged the Company servants to develop the settlement
as a mercantile centre. Thereafter, the settlement gradually began to grow and take
shape. In 1707 the Company was induced to declare Calcutta a separate Presidency,
accountable only to the Directors in London. The first survey of the area showed that
the pivot of the settlement was Lal Dighi or the Great Tank (present Dalhousie
3 Of theses villages, Sootalooty was the northern most, being situated near Hatkbola in the Koomartooly ward, Calcutta was somewhere between the present mint and the Custom House, and Govindpore occupied the site ofthe new Fort William, including the Race Course; cited in S.K. Munsi (1990) The Genesis ofthe Metropolis2 p.44.
4 In an old map by Capt. Cameron (without date) Govindpore is marked on the site of the present racecourse. In Orme's map, Govindpore is placed on the riverbank near Hastings of Kidderpore.
5 Nair, P.T.(l986): Calcutta in the Jfh Century; Calcutta: Firma KLM Private Ltd; p.39. 6 Deb, Raja Binay Krishna (1905):The Early History and Growth of Calcutta; Calcutta: Romesh
Chandra Ghose. p. l6.
24

Square) near which most of the European residences were located. The Indian
population lived mainly to the north of Bara Bazaar, the great native mart where their
business was located. Sandwiched between these two localities were the slums of the
Portuguese who had begun to migrate to this settlement, near their church at Moorgi
Hata, after the destruction of their settlement at Bandel. They were soon to outnumber
the English population, four to one, making Portuguese the lingua franca of the town
for nearly a century7•
In 1717, the Company obtained from the Mughal Emperor the confirmation of all their
former privileges8 and the permission to purchase 38 more villages extending on both
sides of the Hughli for a distance of ten miles9. Howrah, across the river was also
included in the deal. The expanded settlement covered an area of 685 hectares (1692
acres).
The physical limits of the Company lands were further extended in 1752 and 1754
when Holwell, then Zamindar, purchased some 'out towns' and 'Simla' 10. These
'out-towns' were Banian Pukur, Puggladanga, Tangra and Dolland. In 1752 the area
under the Company according to Holwell thus became 1316 hectares (3253 acres I
5422 bighas).
In 1756 the town was briefly captured and renamed as Alinagar by Siraj-ud-daulah. In
1757, Clive and Watson retrieved it just before the Battle ofPlassey. The prospects of
the settlements completely changed after these events. The Company's treaty with
Jafar Ali Khan granted them the Zamindari11 of24 Parganas. In 1758 a 'sunnud' was
7 Op. cit; footnote 2; p. I 0. 8 The English Company sent an embassy to Delhi in 1715 for the confirmation of its privileges. It
succeeded in 1717 in obtaining a new farman or charter from Farukh Siyar. Murshid Quli Khan, the governor of Bengal, agreed to observe the first article of the farman which confirmed its rights to trai:le in Bengal, free of customs in return for an annual sum of Rs.3000.- See Sinha, J.C. (1927), Economic Annals of Bengal, London: McMillan, p.5.
9 The permission to purchase the villages was given as a compensation for the services of William Hamilton, Surgeon at the Embassy to Delhi who had treated the Emperor of a troublesome swelling in his arm.- See Martin, James R. (1837) Notes on the Medical Topography of Calcutta. The names of these villages still survive in Calcutta, viz. Cossipur, Chitpur, Belgachia, Bagmari, Beliaghata, Benia pukur, etc.
10 The purchase of Simla added 544 hectares ( 134 7 acres I 2245 bighas) to the Company land. See. op.cit, footnote 2; p.16.
11 Jagirdari was a salary, whereas, Zamindari gave ownership title.
25

obtained for the free tenure of the town of Calcutta, and finally in 1759 Lord Clive
was officially declared the Jagirdar of 24 Parganas.
The years immediately following the Battle of Plassey were very important in terms of
the social ecology of Calcutta 12• The Court of Directors of the Company decided that
'separate districts' should be allotted to the workmen of the Company. Holwell,
hence, distributed his tenants into groups according to their occupation and allotted
each group a distinct quarter in the town. Thus originated the to/as, the to/is, and the
paras, meaning quarters of the different trade guilds. The town was also sharply
demarcated into the European and Native town 13.
Map. 2.2
Indian T 01M1
I
lt l\
\
TOIMld CALCUTTA
Map. 2.3
CALCUTTA Localities- Indian Town
" 0 0 ., .. -
.., .
(1152- 1156}
Rambagan Pathur .. thata Shwt.h
:!! Jtrasanlo K uareapara
: : 4. ~ Chore Bat an
~ Battsto&a ID lluchooa Bazar Jhamapullur
NaharH Arm ant To.. Jal .. al'ttola Tola
Doom Toa.te
Soortea Bagan
Cotootota
Thuntuneaa .. .q
Chtnapura +'~ Choonagully
Champatola
Source: Map No.2: Sinha,Pradip (l978):Calcutta in Urban History; Calcutta:Finna KLM Private Limited.
Map No.3: Kundu, A.K.(l996): Atlas of the city of Calcutta; NATMO; Calcutta:GOJ.
The Native Town "extended along the river, haifa mile north ofthe Old Fort. It then
consisted of 3 or 4 villages, more or less remote from each other and from the English
factory" 14• The physical extent of the native town was as follows: along the riverside
from Barabazaar to Bagbazaar on the edge of the Chitpur creek; inland it stretched in
a series of hamlets over the tract between the Ditch and the Kalighat-Road. The richer
12 Op.cit, footnote 2; p.l9. 13 Op.cit, footnote 2; p.20. 14 Ray, A. K. (1982): A Short History of Calcutta; Calcutta: RDDHI; p.205
26

natives crowded in Kumartoli, Jorabagan, Barabazaar, and other areas along the
riverside and built their houses in a quadrangle approached through a narrow lane for
considerations of security and privacy. The poor natives and artisans built their small
huts made of straw and mud in front of these rich mansions. They not only paid high
rents but also provided security to the rich.
The Europeans belonging to the lower classes began to expand in two ribbon
developments along the Bow Bazaar and Dharmatola Streets, running eastwards from
the main European settlement.
The Regulating Act of 1774 ofthe British Parliament made Calcutta the seat of British
India and Warren Hastings was made the first Governor General. In 1775 a royal
farman was obtained which granted the jagirdari of 24 Parganas to the Company in
perpetuity. These two events led to the first major physical expansion of the original
urban nucleus15•
The physical expansion of the town after 1774 followed a layout characteristic of
indigenous Indian towns which, barring a few exceptions, were never dominated by
large-scale plans.
Based on the historical study of the growth of the city of Calcutta, Figure 2.1 shows
the physical growth of the city during the period under study. It is clear that the town
area remained constant but suburbs were added to the city to accommodate the
growing population. The area under the Port and Canals, however, reduced over time.
15 Op. cit; footnote 2; pp.25-26.
27

Figure: 2.1
• e c(
1876 1881 1891
.,...
..; ..,
.,...
1901
Growth of Calcutta Urban Area
(So. KRL)
1911 1921 1931
.,...
..; .,... .,...
- Fort/Port/ Canal c::::::JAddtional Area
1941
Town Prope r
c:::::::JGrand Total --Unear (Grand Total) --Unear (Add ~i onal Area)
- Linear (Fort/Port /Canal) --Unear (Town Proper)
2.2 Boundaries of Calcutta City
.,...
.,; C>
The City had no legally defined boundaries before 1794. Popularly, the Fort 1William
region, old or new, was referred to as the city of Calcutta and the rest being E opean
'suburbs' or 'native town' 16• The first attempt at definition came from Alexander
Hamilton, in 1708-1710: "The Company's Colony is limited by a land-mark at
Governarpore (Gobindapur) and, another near Barnagul (Baranagar), about six
miles distant; and the Salt-Water Lake bounds it on the land side" 17•
The earliest official description dates from 1754: "The Company 's Settlement of
Calcutta is situated upon a bow of the River Ganges the Points of which are Salmon 's
Garden to the southward and Perrin 's Garden to the Northward. Our bounds extend
16 Nair, P. T.(l990): "The Growth and Development of Old Calcutta", inS. Chowdhury (ed.) Calcutta: The Living City; VoL 1: The Past; Calcutta: Oxford University Press; p.13.
17 Ibid; p.l3
28

inland in a kind of curve too, the greatest distance of which from the River is about a
l f"l d ,]8 1v.a e an a quarter .
In 1774, Warren Hastings proposed the boundaries of Calcutta for policing purposes
asi9:
SOUTH- Carry Jurie (Khari Juri, a village underMathurapur Thana);
NORTH- Palta, a village in Calcutta Pergunna;
EAST- Baddadherry (Bidyadhari) River;
WEST- River Ganges.
A 1779 judgement cited the " Kidderpore Nullah" as the southern boundary,
completing the circuit of the Hughli and the Maratha Ditch or Circular Road.
The boundaries of Calcutta for municipal and judicial purposes were at last fixed in
1794 by the governor-general, Lord Cornwallis, and practically remained the same
until 186720• A proclamation of 11th September 1794 gave a detailed account, which
was adequately summarized in an Act of 1840:
NORTH- Maratha Ditch;
EAST - Circular Road (constructed along the eastern portion of the Ditch);
WEST- the Hooghly River;
SOUTH- Lower Circular Road to Kidderpore Bridge and Tolly's Nullah to
the river, including the Fort and Cooly Bazaar (Hastings).
The Municipal limits expanded thereafter. Act XVI of 1847, excluded Fort William,
Hastings and Maidan areas from the municipal jurisdiction and thereby, the southern
boundary became the Lower Circular Road and the Chowringhee Road demarcated
18 Nair, P.T.(l989): Calcutta Municipal Corporation at a Glancei._Calcutta: The Calcutta Municipal Corporation; p.3. -Salmon's Garden was situated neaar the Kidderpore Bridge and Perrin's Garden was situated at Baghbazar. Probably, Marhatta Ditch formed the eastern boundary.
19 op.cit, footnote I; p. 13. 20Goode, S.W.(l916): Municipal Calcutta: Its Institutions in Their Origin and Growth; Edinburgh: T.
& A. Constable; pp. 6-7.
29
the southwestern boundary. Hastings was again included within Calcutta by Act V of
186821•
Meanwhile, the suburbs of Calcutta were defined in 1857 and a separate Suburban
Municipality was set up in 1876. Finally, in 1889, extensive changes were made in
the boundaries of the Calcutta Municipal Corporation. The old suburban Municipality
was split into: North Suburban (Chitpur and Kashipur), East Suburban (Maniktala),
Suburban (Garden Reach) and South Suburban (Tollyganj) municipalities.
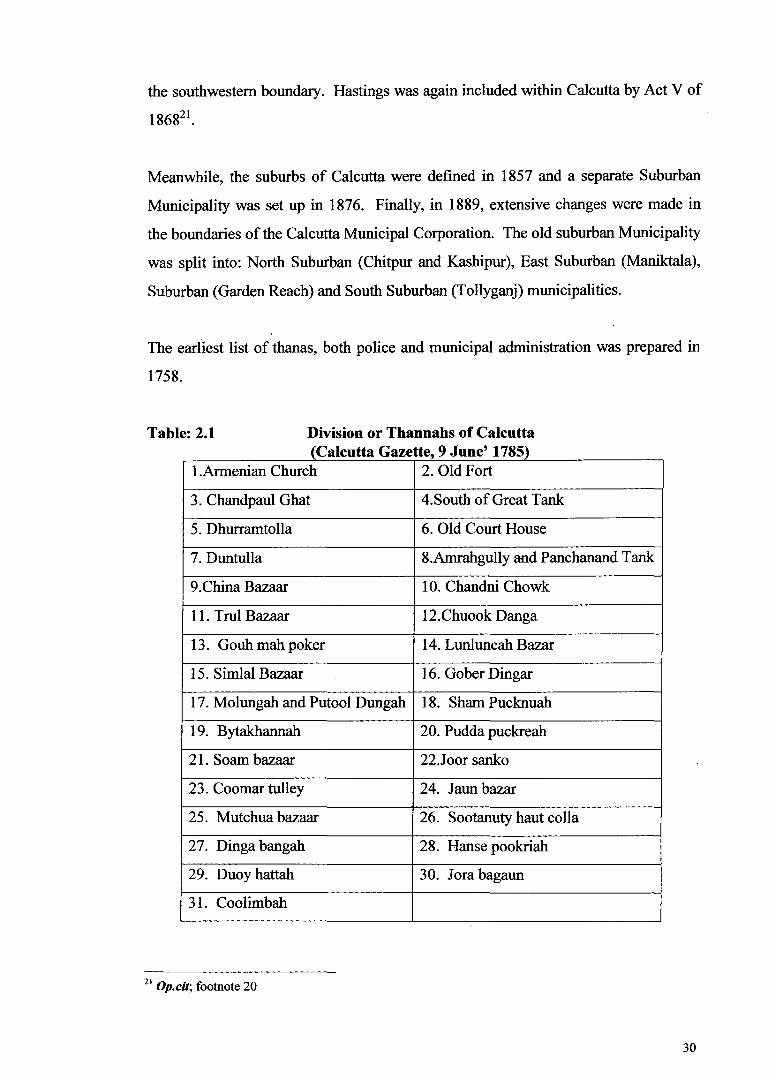
The earliest list of thanas, both police and municipal administration was prepared in
1758.
Table: 2.1 Division or Thannahs of Calcutta (Calcutta Gazette, 9 June' 1785)
!.Armenian Church 2. Old Fort
3. Chand paul Ghat 4.South of Great Tank
5. Dhurramtolla 6. Old Court House
7. Duntulla 8.Amrahgully and Panchanand Tank
9 .China Bazaar 10. Chandni Chowk
11. Trul Bazaar 12.Chuook Danga
13. Gouh mah poker 14. Lunluncah Bazar
15. Simlal Bazaar 16. Gober Dingar
17. Molungah and Putool Dungah 18. Sham Pucknuah
19. Bytakhannah 20. Pudda puckreah
21. Soam bazaar 22.Joor sanko
23. Coomar tulley 24. Jaun hazar
25. Mutchua bazaar 26. Sootanuty haut colla
27. Dinga bangah 28. Hanse pookriah
29. Duoy hattah 30. Jora bagaun
31. Coolimbah
21 Op.cit; footnote 20
30

Map: 2.4
Wards of Calcutta Municipality
1850 1876-81 1891 -1921
~~
Between 1850 and 1881 , the total area under the Calcutta Municipal Corporation was
divided into 18 Thanas or Wards. The Corporation area was divided into 25 Wards
and their boundaries were defmed in the Third Schedule to the 1888 Act. The fringe
area wards formed portions of Thanas of Ooltadangah, Manicktolla and Beliaghata,
before the amalgamation of the greater part of the old suburbs with the Corporation in
31
1889. The area and number of wards of the Corporation remained unchanged between
1891 and 1921 when the Census took place. The municipalities of Cossipore
Chitpore, Manicktolla and Garden Reach were amalgamated with the Corporation in
1923 and thereby, increasing the number ofwards to 32 in the 1931 Census. The area
of the Corporation decreased in the 1941 Census and again increased in the 1951
Census22.
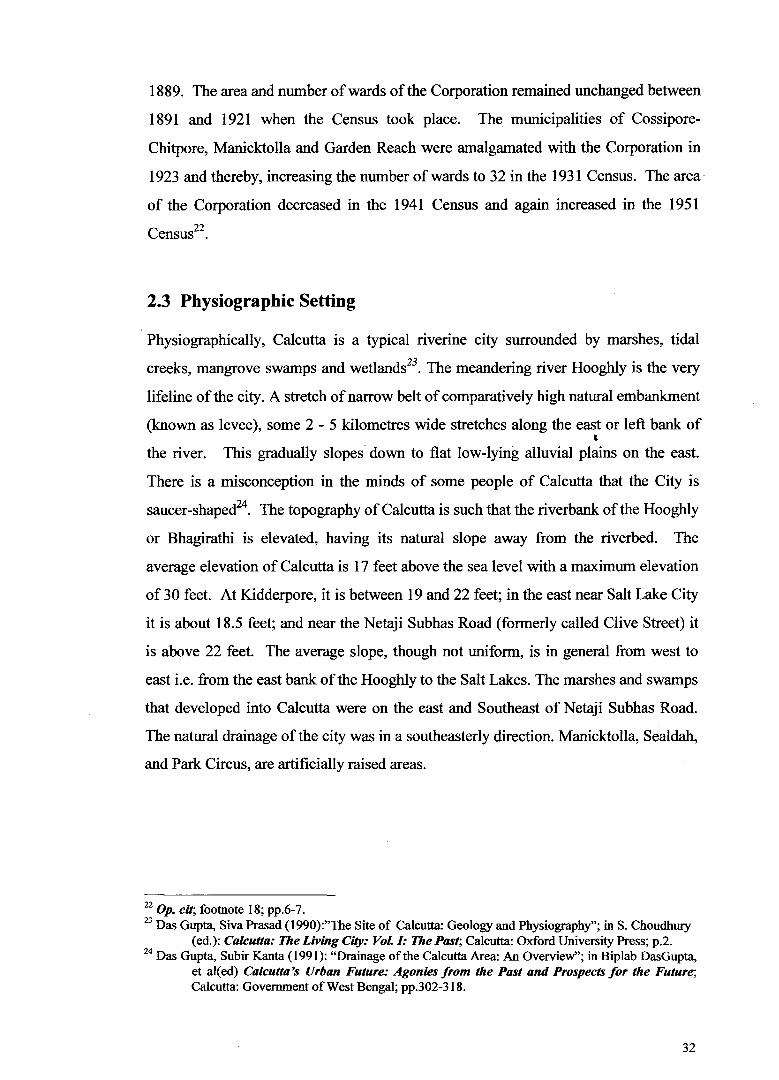
2.3 Physiographic Setting
Physiographically, Calcutta is a typical riverine city surrounded by marshes, tidal
creeks, mangrove swamps and wetlands23• The meandering river Hooghly is the very
lifeline of the city. A stretch of narrow belt of comparatively high natural embankment
(known as levee), some 2 - 5 kilometres wide stretches along the east or left bank of ' the river. This gradually slopes down to flat low-lying alluvial plains on the east.
There is a misconception in the minds of some people of Calcutta that the City is
saucer-shaped24. The topography of Calcutta is such that the riverbank of the Hooghly
or Bhagirathi is elevated, having its natural slope away from the riverbed. The
average elevation of Calcutta is 17 feet above the sea level with a maximum elevation
of 30 feet. At Kidderpore, it is between 19 and 22 feet; in the east near Salt Lake City
it is about 18.5 feet; and near the Netaji Subhas Road (formerly called Clive Street) it
is above 22 feet. The average slope, though not uniform, is in general from west to
east i.e. from the east bank of the Hooghly to the Salt Lakes. The marshes and swamps
that developed into Calcutta were on the east and Southeast of Netaji Subhas Road.
The natural drainage of the city was in a southeasterly direction. Manicktolla, Sealdah,
and Park Circus, are artificially raised areas.
22 Op. cit; footnote 18; pp.6-7. 23 Das Gupta, Siva Prasad ( 1990):"The Site of Calcutta: Geology and Physiography''; in S. Choudhury
(ed.): Calcutta: The Living City: VoL 1: The Past; Calcutta: Oxford University Press; p.2. 24 Das Gupta, Subir Kanta (1991): "Drainage of the Calcutta Area: An Overview"; in Biplab DasGupta,
et al(ed) Calcutta's Urban Future: Agonies from the Past and Prospects for the Future; Calcutta: Government of West Bengal; pp.302-318.
32

Calcutta had its natural drainage in the Khat (creek) that gave the city its name when
Job Charnock selected Sutanuti for the headquarter of the East India Company's trade
in Bengal in 1690. That creek originated from the Salt Lakes in the east and joined
the Hooghly just below the Princep Ghat, after meandering through Beliaghata,
Sealdah, Creek Row, Dharmatola and Government Place North. The great Cyclone of
1737 rendered this creek useless as a watercourse for navigation. The excavation of
Maratha Ditch (the present Acharya Jagadish Bose Road and Acharya Prafulla
Chandra Road- Old Lower and Upper Circular Road) in 1742 tolled the death-knell
of the Creek. This interference with the natural drainage of Calcutta gave rise to the
problem of water-logging in the town which is the main problem pointed out by Lord
Wellesley, Governor General, in his famous Minute of June 16,1803.
The Central Lake Channel of the Bidyadhari extended right up to the Creek Row even
in the late 1830s. From the fact that the depth of this Khal was no less than 20 feet at
Dhapa, one would surmise that the channel was much deeper that what was required
for a safe and sufficient outfall. The excavation of the Circular canal from Entally to
Hooghly for navigation rendered this old channel ineffective in carrying the natural
drainage of Calcutta.
Map: 2.5
Calcutta and Its Environment
Dum D urn
'
CALCUTTA Bel1agh ata
- -- S~ld-.a-0-F o rt Wilham
6
K idderpore - ·~. Ali p~r Dhakuria
... . ,..
Tollygunge Jadavpu r
c,.,•,
33
2.4 Geological Structure
Calcutta is situated on the east bank of the river Hoogh.ly about 60 miles from the Bay
of Bengal. The region is a part of the world's largest deltaic zone at the mouth of
River Ganges. A series of "bore-operations" conducted under the superintendence of
a Committee of naturalists from December 1835 to April1840 revealed:
• A complete absence of marine deposits throughout the depth ofthe borehole;
• The existence of a peat-bed at 30 to 35 feet, and again at 382 to 395 feet below
the surface; and,
• The existence in considerable quantities, of fine sand and pebbles like those of the
seashore at 170 to 180 feet and at 320 to 325 feet, and again at 400 to 480 feet
below the surface. The greater part of these pebbles was derived from gneissic
rocks.
Rai5 points out that in remote antiquity, gneissic hills stood out from the sea where
Calcutta now is. At a later date - probably during the tertiary period - these hills were
depressed and tidal swamp extended up to the foot of the Rajmahal hills. Thereafter
the lower Gangetic plains below the Rajmahal hills began to be elevated by fluvial
deposits about 4000 to 5000 years ago. The extension of the delta was from the north
and west to south and east. Near Calcutta, an elevation of the area has alternately been
followed by a subsidence. In historical times the extreme southeastern portion,
including the districts of Khulna, Jessore, Sundetbans, and Calcutta, was not fully
formed in the seventh century A.D., when East Bengal was sufficiently inhabited to
form the nucleus of a kingdom.
Calcutta rests on a clay bed deposited by rivers forming the lower plain of the
Gangetic delta26• The clay overlies a thick pile of alluvial sediments deposited in the
recent geological era. The upper 300 metres of this alluvial pile clearly belong to the
25 Op. cit; footnote 14; p.8 26 Op.cit; footnote 23; p.4.
34
Quaternary age (commencing about 1.5 million years ago). It consists of successive
layers of clay, silt, sand and sometimes coarser sediments or even pebbles. These sub
surface layers have not yet been clearly divided or classified. But a tentative division
can be made as follows:
o The existence of a thick clay layer at a depth varying from 254 metres
in the north of the city to 414 metres at Garia in the south. South of
Garia, the clay bed slowly rises.
o An extensive clay bed, 30 to 60 metres or even more in thickness,
which caps the entire sedimentary pile within the city proper. On the
southern periphery, especially at Tollygunje, this thins off and is hardly
9 metres thick. Sometimes the clay cap is overlain by thin, disjointed
strips of silts and fme sands, especially in depressions and along old
abandoned riverbeds. Elsewhere, peaty matters occur at many places
within the clay cap, at depths of 3 metres or thereabouts. Both the
bottom clay and top clay are sticky and plastic to semi plastic m
character, impervious to water and dark grey in colour.
o Between them lie thick layers of sand of varying grain sizes: fme,
medium, coarse, or even somewhat gravely. Small isolated patches of
clay are often set among them, or sometimes a pebble zone of varying
thickness (from 4 metres at Dhakuria to 25m at Kidderpore). Even
deeper pebble zones, at a depth of some 130 metres, have been found
at Taratola in southwest Calcutta.
The subsurface sandy layers of great thickness can hold plenty of water in the pore
space between th~ ~iq~ ~d &ijpP; the quantity of wat~r ~kpt(ndin~ on the size of the
grains. Thick sand beds, trapped between impervio~~ y'~y f~y((rs ~t the top and
bottom, serve as immense water reservoirs in the city.
Calcutta is, as it were, balanced upon a huge natural raft of clay, literally floating on
an enormous reservoir of water stored within the sand grains underneath. This
groundwater is held under great pressure exerted by the alluvial sediments above
35

them. The pressure falls or rises as water is pumped up in large quantities for human
use, or brought back into the sandy aquifers (water-bearing layers) through
underground seepage of rainwater. The layer of clay has been tunnelled through and
through to provide for sewerage, water-supply pipes, power cables, etc.
2.5 Climatic Condition
Calcutta has a subtropical climate with a seasonal regime of monsoons. The maximum
temperature reaches about 108° F or 42° C in May, and the minimum falling in
January to 44°F or 7°C. For the eight months, from March to October, the average
temperature remains above 80° F or 26.6° C. The greatest changes occur between the
months of October and November, and again between January and February.
On the basis of rainfall the entire year in Calcutta may be divided into four periods27:
o The period of excessive rainfall (monsoon months between June to
September);
o The period of minimum rainfall (winter months between November to
February); and,
o Two periods of intermediate rainfall (March to May; and October).
The average annual rainfall is about 64 inches. The highest average rainfall per day
occurs in June.
2.6 Demographic Structure
A historical study of the demographic structure of the city is constrained due to the
non-availability of population data before 187228• It is believed that during the last
ctecade of the sixteenth century after King Pratapaditya lost his little kingdom,
fishermen and cultivators from the upper riparian regions as well as a number of
Brahmins with their servants from Halisahar, Neemta, Triveni and Y osohara migrated
to the areas later included in Calcutta. Early records quote that one Lakshmi Kanta
27 Cunningham, Dr. D. D. (1880): "Medico-Topographical Report on Calcutta"; Indian Medical Gazette; May 1; pp.113-117.
28 Ghosh, A. K. (1991): "Ecology and Environment of Calcutta"; in Biplab Das Gupta, et al (ed.) Calcutta's Urban Future: Agonies from the Past and Prospects for the Future; Calcutta: Government of West Bengal; pp.60-83.
36

Ganguli (1570-1649) was allotted a tenancy of land including 'Pargana Kalikata'. His
earliest office (kutcherry) was beside the present Dalhousie Square Tank, locally
known as Laldighi. Apart from the Setts and Basaks in Govindapur village, some
references are found about Bhuvaneshwar Chakravarti and his relatives, the priests of
Kali temple at Kalighat, and forefathers of Maharaja Nabakrishna. Before the English
settlement came into being the Portuguese settled a cotton factory 'Alogodam' at the
site of Clive Street. The Armenians were also well settled in Calcutta by then29•
Table: 2.2 indicate the change in population of the city prior to Census evaluations.
Table. 2.2 Population of Calcutta Prior to Census
Source Year rrotal Population Hamilton's 1717 12000 Holwell 1752 1409056 Mackintosh's 1782 500000 Grand pre 1789 ~00000 !Police ~ommissioner 1800 500000 Chief Magistrate 1802 600000 Sir E. Hyde's 1814 700000 lEast India Gazetter 1815 500000 ~ssesso'S 1821 179917 Captain Steel's 1831 187081 Captain Birch's 1837 229714 Simm's 1840 ~61369 ~hief Magistrates 1850 1413184 IDowlean's 1866 ~52874
Source: Compiled From Different Reports
The city experienced a rapid growth of population, which was steady in the main town
area; steep (though lower than the main town area) in the added areas of the Calcutta
Municipal Area and more or less a constant in the Port-Fort-Canal areas.
29 Ghosh, Murari; A. K. Dutta and Biswanth Roy (1972): Calcutta -A Study in Urban Growth Dynamics; Calcutta: Firma K. L. Mukhopadhaya Private Ltd.; p.3.
37

Figure: 2.2
1878 1881 18!t1
Population of Calcutta (In Number) (1876-1941)
1901 1911
rmePeriod
1921 1931
TownPropor -~ c:J-/irea c:JCALCUTTA
1941
- u.- (Town Proper) - u.- (CALCUTT AI - Lne• ~--_, -Lne• (ForVI'IortiCIIMI)
2.6.1 Density of Population
With the expanding area and increase in the size of the population, the density of the
population also changed over time. From Figure: 2.3 it is clear that from 1876 to
1941 the density of population of Calcutta city as a whole remained constant,
increased rapidly in the 'main town' area, showed a gradual increase in the 'added
areas' , and remained constant in the 'Fort/Port/Canal areas' .
Figure. 2.3
70000 Density Of Population - Calcutta
1876 1881 1891
I T~ Proper - FortiPort/Ccnll
- Li1ear (T~ Proper) - Li1ear (CALCUTTA)
1901 1911 1921 1931 1941
Time Period
CJAdditional Aceta CJ CALCUTTA ---r - Li1ear (Additional Aceta) -Li1ear (Fort/Portl~
38

The ward wise distribution of density in Calcutta (see Maps 2.6) shows that between
1876 and 1941,
o Shampooker, Burtolla, Waterloo Street, Collinga, Park Street, Baman Bustee,
and Hastings had a Low density of population, varying between 1,500000 -
21,499 persons per sq. km. in 1876 and 1881.
o The density of population increased in most of the wards of the city between
1891-1921, except in the Added Areas and Waterloo Street, Collinga, Park
Street and Baman Bustee, where, the density of population varied between
1,500- 21,499 persons per sq. km. In 1931, the Burra Bazar area had a low
density of population followed by Waterloo Street, Kalinga, Park Street,
Baman Bustee, Tengra, Entally, Ballygunge, Alipore, Ekbalpur, Watgunge
Hastings, Garden Reach, Tollygunge, Beliaghata, Maniktola, Belgachia,
Satpukur and Cossipur wards. By 1941, only Waterloo Street, Park Street,
Baman Bustee I Victoria Terrace, Ballygunge, Alipore, Ekbalpur, Watgunge
Hastings, Beliaghata, Manicktola, Belgachia, Satpukur, and Cossipur wards
retained 'low density' of population.
o Between 1876 and 1931, most of the northern wards of the 'town proper', i.e.
Shampooker, Kumartuli, Burtolla, Sukea's Street, Jorabagan, Jorasanko,
Collootola, Moocheepara, Bow Bazar, Puddopooker, Fenwick Bazar and
Taltolla, had 'medium' (21,500 - 41,499 persons per sq. km.) to 'high'
(41,500 - 61,499 persons per sq. km.) density of population. By 1931,
Beniapukur and Bhowanipore wards of the 'added area', recorded 'medium'
density of population. In 1941, 'medium' and 'high' density of population was
observed in Burra Bazar, Entally, Beniapukur, Bhowanipore, Kalighat and
Tollygunge areas.
o 'Very high' density of popul~liOJl, varying between 61,500- 110,000 persons
per sq. km. was observed in the northern wards ofthe 'town proper' in 1941,
i.e. in Shampooker, Koomartooly, Burtolla, Sukea's Street, Jorabagan,
Jorasanko, Colootola, Moocheepara, Bow Bazaar, Puddopooker, Fenwick
Bazaar, and Taltola. Prior to 1941, such a high density was observed only in
Colootola in 1901.
39

• The Port-Fort-Canal areas of the city had a very low density of population
varying between 200- 1,117 persons per sq. km.
Map: 2.6
Changing Pattern of Density of Population in Calcutta- Ward Wise
Index
PopUation (per Sq. Km)
D 200-1499 D 1500-21499 D 21500-41499
41500 - 61499
- 61500-81499 - 81500-11()(0)
Maps not to Scale
40

Changing Pattern of Density of Population in Calcutta- Ward Wise
2. 6.2 Migration
Index
PopUatioo (per Sq. Km)
D 200-1499 D 1500 - 21499 D 21500-41499 D 41500- 61499 • 61500- 81499 • 81500 -110000
This rapid increase in the population of Calcutta during the Colonial period was a
result of migrants converging on the city from a vast hinterland in search of a
livelihood. From Tables 2.3, 2.4 and 2.5 it is clear that nearly 60 to 67 percent of the
population of Calcutta came from outside, i.e. they migrated into the city from the
neighboring districts of Bengal and other provinces of India. People from Bihar and
Orissa had moved into Calcutta as early as 1891 followed by people from Punjab and
Rajputana. The maximum immigration took place in 1901 and 1911. The Burdwan,
Presidency, and Dacca Divisions contributed the maximum number of migrants from
Bengal Province.
Table. 2. 3 Proportion Of Migrants In Calcutta
Year Percenta2e of total population 1876 1881 1891 1901 1911 1921
Born in Calcutta 32.5 40.26 39.8 45.25 41.17 48.12 Mi2rants 67.5 59.74 60.2 54.75 58.33 52.88
Source: Raza and Habeeb(l991): "Characteristics of Colonial Urbanization- A Case Study of the Satellitic Primacy"; in M.S.A. Rao et al.(eds) A Reader in Urban Sociology; N Delhi: Orient Longman.
4 1

Table. 2.4 Migration into Calcutta From Different Parts of India
Migrants From 1881 1891 1901 1911 1921 Ben2al N.A. 241051 257951 278979 274697 Bihar 59495 121642 139345 150478 125202
Orissa 13027 25518 26483 N.A. 43851 Assam N.A. N.A. 2630 4986 2951 British Burma N.A. NA. N.A. N.A. 1044 Uttar Pradesh N.A. N.A. 90337 89635 67433 Pun.iab 278 N.A. 6235 8261 7150 Rajputana 143 494 14701 20888 28339 Bombay N.A. N.A. N.A. 3243 4931 Madras N.A. N.A. 1875 2944 3235 Central Province & Berrar N.A. N.A. N.A. 2535 4669
Source: Chattopadhyaya, Haraprasad (1987): Intemal Migration in India: A Case Study of Bengal; Calcutta: K. P. Bagchi and Company.
Table. 2.5 Migration into Calcutta From Other Districts of Bengal
Divisions 1891 1901 1911 1921 Burdwan Division ~9.54 ~2.44 43.55 38.37 Presidency Division ~6.97 42.19 42.14 38.96 Rajshahi Division ~.66 1.69 1.3 2.5 Dacca Division 11.14 10.52 9.99 16.61 Chittagong Division 1.69 3.16 2.95 3.43 Cooch Behar Division 0.07 0.13 Total 100.00 100.00 100.00 100.00
Source: Haraprasad Chattopadhyaya(1987):Internal Migration in India: A Case Study of Bengal; Calcutta: K. P. Bagchi and Company. ·
2. 6.3 Sex Ratio
The sex wise composition of the population of Calcutta during the period under study
shows that there were more males than females in the city. Figure: 2.4 indicate the
changing pattern of sex ratio in the city. It is also observed that there has been a
decline in the sex ratio between 1876 and 1941 in the main town area as well as in the
added areas of the city. On the other hand, the sex ratio in the Port/Fort/Canal areas
has increased at a very low rate.
42

Figure. 2.4
8D Changing Pattern Of Sex Ratio In Calcutta
1m Em SD 400 :m 3D 100
0
1876 1881 1891 1901 1911 1921 1931
c::JC:IIaJia - Urear(TOMPI"c:p!r) - l..irea"(Mild Aea)
-Unar (RitlfafCnli)- Urear(QIICUia)
The ward wise analysis of sex ratio in the city of Calcutta given in Map: 2. 7 reveals
that:
• The sex ratio had been low and ranged between 90 and 849.
• Wards with a very low sex ratio were Port-Fort and Canal areas of the city
followed by Waterloo Street (1876 -1941), Barnan Bustee (1901), Park Street
(1911), Burra Bazar (1911 - 1941) and Fenwick Bazar (1931-1941).
• 'Medium' sex ratio, ranging between 215-500, was observed mainly m
Jorabagan, Collootola, Moocheepara, Bow Bazar, Fenwick Bazar (1876-
1921 ), Taltolla, Collinga, Park Street, Ali pore, Watgunge, Ekbalpur and
Hastings wards of the city.
• 'High' to 'Very high' sex ratio rangmg from 501-850 was observed in
Sharnpooker, Koomartooly, Burtolla, Sukea's Street, Jorasanko, Puddopooker,
Moocheepara (1876-1901), Taltolla, and Collinga (1876-1901), Hastings,
Tengra, Entally (1891-1931), Beniapukur, Ballygunge, Bhowanipore,
Ekbalpur and Tollygunge, Puddopooker (1876), Ballygunge, Tollygunge,
Bhowanipor~ (1891-1901), Ekbalpur (1891), and Beliaghata (1931); i.e. the
wards lying on the outskirts of the main town area during the period of growth
ofthe city.
43

Map. 2.7
Changing Pattern of Sex Ratio Of Population Calcutta- Ward Wise
Index
Female /1000 Male
D 90-214.99 D 215 - 339.99 D 340 - 464.99
465-589.99 590-714.99
- 715-850
Maps Not to Scale
44

2.6.4 Religious Composition
Index
Female /1000 Male
D 9o -214.99 D 215 - 339.99 D 340 -464.99 D 465 - 589.99
590-714.99 - 715-850
Maps Not to Scale
It is necessary to have an idea about the religious composition of the people in the city
as it plays a very important role in understanding the socio-cultural aspects of the
population.
Figure. 2.5
70
II)
~!I) :§,4) ! ~:I)
3)
'I)
0
1876 1881 1901 1911 1921 1931
c:::JQhers J Urew (Qhersj
- Mc:termedln; c::l CITistiii'IS
- Urear~- Lilea'(antanst
45

From Figure 2.5 it is clear that the Hindus outnumbered the population of other
religions in the city. Nearly 60 to 70 per cent of the total population of city were
Hindus, 25-30 per cent were Muslims, 4- 7 per cent were Christians and less than 4
per cent included other religions such as Jewish, Armenians, Chinese, Parsees,
Buddhists, Sikhs, etc. The changing pattern of the religious composition of the
population in the city shows that over time the Hindu population increased marginally
while the Muslims, Christians and Other groups decreased.
Based on the Report submitted by the Smallpox Commission in 1850, we find that
Calcutta was divided into three main divisions with specific dominant religious
communities.
• Northern Division was predominantly Hindu, comprising of wards -
Shampooker, Koomartooly, Burtolla, Jorabagan, Jorasanko, and Sukea's
Street;
• Middle Division was predominantly European, comprising of Bow Bazaar,
Burra Bazaar, Colootola, Moocheepara, St. James' Street, and Mangoe Lane;
and,
• Southern Division was predominantly Muslim and comprised of Park Street,
Fenwick Bazaar, Taltola, Collinga, Baman Bustee and Coolly Bazaar.
Table: 2.6 indicate that relatively the Hindus were more in number in the Northern
Division. Their proportion decreased in the Middle Division and the Southern
Divisions. The Muslim community was relatively dominant in the Southern Division
but their proportion decreased in the Middle Division and the Northern Divisions.
The ruling classes i.e. the Europeans were more numerous in the Middle Division
followed by the Southern Division. The Eurasians were mainly concentrated in the
Southern Division followed by the Middle Division and Northern Division. Nearly all
the Armenians and Chinese resided in the Middle Division. Among the other Asiatic
communities, nearly 73 per cent lived in Middle Division, 25 per cent in the Southern
Division and only 2.3 per cent in the Northern Division.
46

Table: 2.6
Community Wise Distribution of Population in Calcutta 1850
Communities North Div. Mid Div Sn Div. Total
Europeans 0.53 60.07 39.40 100.00
Eurasians 2.64 46.83 50.53 100.00
Armenians 0.56 99.33 0.11 100.00
Chinese 0.00 99.76 0.24 100.00
Asiatic 2.33 72.88 24.79 100.00 Hindus 51.92 37.44 10.64 100.00 Mohammedans 24.72 34.32 40.96 100.00
Total 41.23 38.63 20.14 100.00
Source: Report of Smallpox Commission 1850
Table. 2.7 Ward Wise Distribution of Different Communities in Calcutta 1850
Sections Europeans Eurasians !Armenians Chineese !Asiatic Hindus Mohammedans
~orasanko 0.00 0.00 0.00 0.00 0.55 13.23 7.12 Koomartooly 0.06 0.09 0.00 0.00 0.00 11.94 1.67 Shampooker 0.05 0.02 0.00 0.00 0.00 6.49 1.29 Burtolla 0.19 1.19 0.00 0.00 0.00 9.54 11.87 §_ookea's Street 0.11 1.34 0.56 0.00 0.23 3.36 1.81 Jorabagan 0.11 0.00 0.00 0.00 1.55 7.73 0.99 Bowbazar 13.25 24.29 0.56 22.31 15.73 2.73 4.18 Burra Bazaar 11.47 0.56 89.13 28.57 14.91 17.08 8.83 Colootola 6.85 5.96 8.52 47.34 18.73 5.46 8.11 Moocheepara 10.91 2.45 1.01 0.00 4.77 7.36 10.40 ~t. James Stree 6.69 11.96 0.11 0.00 5.10 4.19 1.51 Mangoe Lane 10.89 1.82 0.00 1.53 0.59 0.62 1.24 Parkstreet 8.15 2.21 0.00 0.00 0.10 0.61 1.06 Fenwick Bazar 9.66 27.67 0.00 0.00 0.00 3.62 10.83 Taltolla 6.63 10.12 0.00 0.00 23.31 1.48 12.51 Colinga 6.69 5.94 0.00 0.12 6.79 2.59 12.27 Bamun Bustee 5.47 1.41 0.11 0.00 7.63 1.03 2.41 Coolley Bazar 2.81 2.97 0.00 0.12 0.01 0.94 1.92
Total 100.00 100.00 100.00 100.00 100.00 100.00 100.00 Source: Report of Smallpox CommiSSion 1850
The ward wise distribution of the religious communities for the years 1876, 1881,
1901, 1921 and 1931 is shown in Map 2.8. The analysis shows that Hindu population
was highest in most of the wards of the city with some exceptions during the period
under study. Muslims were dominant or in high proportions in Collootola, Taltola,
Colinga, Port, Bow Bazar (1881 and 1901), Beniapukur (1901-1931), Ekbalpur
47
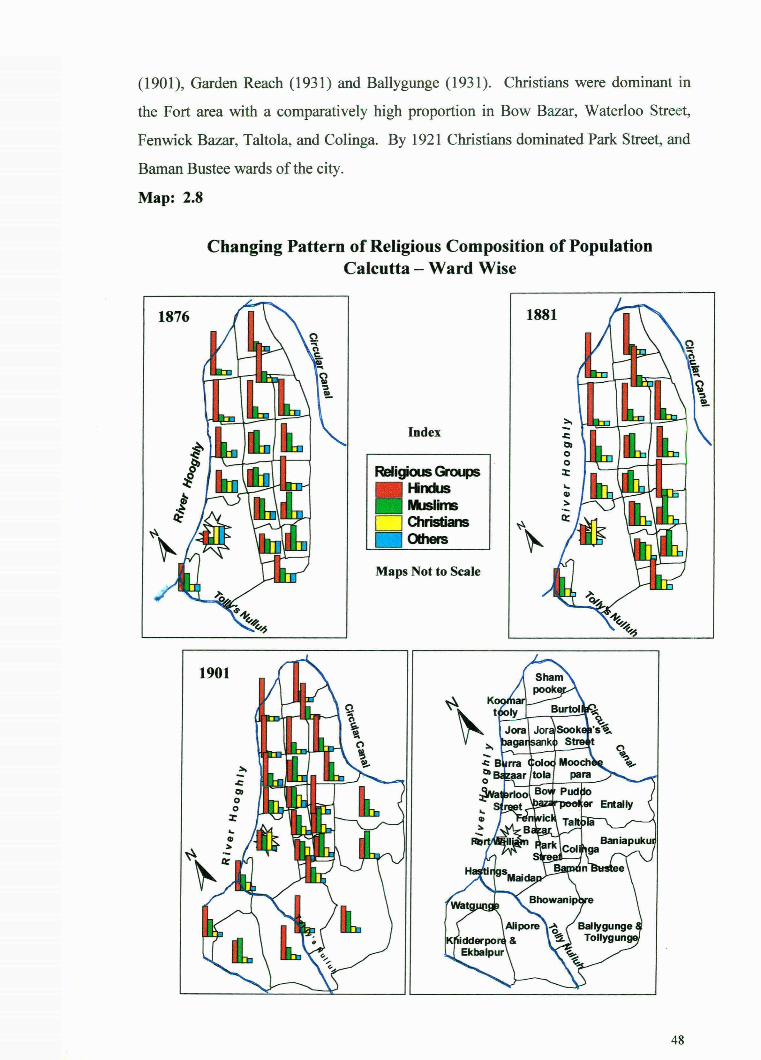
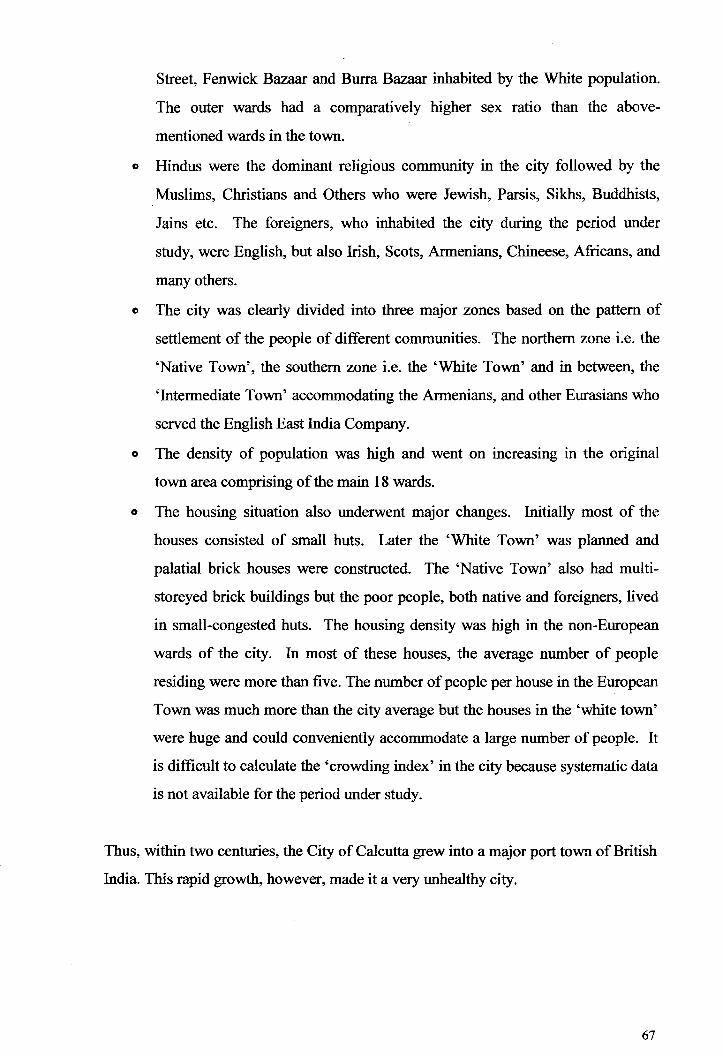
(1901), Garden Reach (1931) and Ballygunge (1931). Christians were dominant in
the Fort area with a comparatively high proportion in Bow Bazar, Waterloo Street,
Fenwick Bazar, Taltola, and Colinga. By 1921 Christians dominated Park Street, and
Baman Bustee wards of the city.
Map: 2.8
Changing Pattern of Religious Composition of Population Calcutta - Ward Wise
Index
Maps Not to Scale
48

Changing Pattern of Religious Composition of Population Calcutta - Ward Wise
1921
Calcutta Ward Map
1931
N
A
1931
N
A
Index
Religious Groups Hndus NkJSiims Christians Others
Maps Not to Scale
49

In 1876, the 'Others' category dominated Fort William area, but over time, Christians
and the Hindus became higher in proportion. By 1921 people belonging to ' other'
religious groups were high in the Fort area, Burra Bazaar and Colootola wards.
2. 7 Land use Pattern
With the growth of the City the original land use pattern also changed. Figure 2.6
indicates the land use pattern of the three hamlets I villages which mainly constituted
the city of Calcutta. In the early years of the eighteenth century nearly 50 to 70 percent
of the land was under agricultural use, followed by jungle area, which was around 30
to 40 percent of the total land area. Only 10 percent of the land was under built up
houses, tanks, gardens, paths and other immediate uses.
Figure. 2.6
Land Use Pattern of the Hamlets that grew into City of Calcutta - 1706
Swm1i Town d Blzaar Gobindaptr Calcutta Calcutta
The Subdivisions of CalaJtta
Ia HOUSES • TAN<S & PATHS • AGRICLl.TlRALUSE D GARlENS • DfTCHES • J I.N>LE o MSTEGR<XN> I
Source: Chatteljee, Monidip: "Settlement Pattern in the Calcutta Metropolitan Area - A futuristic Vision"; in Biplab DasGupta, et al (ed)(l991): Calcutta's Urban Future: Agonies from the Past and Prospects for the Future; Calcutta: Government of West Bengal.
Table: 2.8 show the change in the land use pattern of the city between the eighteenth
and the twentieth centuries.
50

Table. 2.8 Changing Land Use Pattern Of Calcutta Since 1706
Area Covered in °/o of Total Land Land Uses 1706 1847 1911 1961
Residential 16.61 63.92 41.72 61.65
Commerce (includin_g_ offices)- 0.67 9.61 12.09
Industry - - 0.82 2.35
Public & Semi-Public - 1.42 4.42 6.76
Transport &Communication 6.26 11.95 - -Recreation (incl. organised open space) 8.81 0.23 1.39 3.16
Slums - - 15.2 6.24
Agriculture 40.13 - - -Water body - 1.65 - -Forest, barren, vacant ponds,
and marshes 28.19 20.16 - -Others (non-specified) - - 26.84 7.84
TOTAL 100.00 100.00 100.00 100.00 Source: Chatteijee, Monidip: "Settlement Pattern in the Calcutta Metropolitan Area - A futuristic Vision"; in Biplab DasGupta, et al (ed)(l991): Calcutta's Urban Future: Agonies from the Past and Prospects for the Future; Calcutta: Government of West Bengal.
Based on the above information we find that over time and with the increase in the
population, the percentage of land for residential purposes has increased. It is also
observed that along with the planned construction of residences in various parts of the
city, the growth of slum areas have also increased which was negligible in the initial
years. The area under agriculture and forest has decreased over time and the vacant
lands, and marshes have been cleared and ponds filled to build residences and other
buildings for commercial and other purpose. This changing pattern of land use has
not only changed the geography of the region but also decreased the carrying capacity
of the land. This had its effect on the health of the inhabitants.
2.8 Housing
Provision of adequate housing is necessary for a healthy urban life30• The city of
Calcutta exhibits certain peculiarities in the array, structure and design of houses,
roads, lanes and bye lanes, and in the pattern of dwellings and accommodation
facilities.
30 Mitra, Manimanjari (1990): Calcutta in the 2ff' Century - An Urban Disaster; Calcutta: Asiatic Book Agency; p.l73.
51

A proclamation was issued in 1695 permitting persons desirous of living in Sutanuti
to "erect houses at their pleasure, on any site ... in any portion of the wastelands
belonging to the Company"31• Since Charnock did not have the Emperor's
hukumnama (paper of official permission), which gave the company freedom to
construct brick buildings, the first buildings had mud walls and were thatched. They
consisted of a warehouse, a dining house, a secretary's office, a room to sort clothes
in, a cook room, and an apartment for the Company's servants, three houses for agents
and the guardhouse. The only masonry building the English settlers acquired was the
cutchery (courthouse) of the earlier Indian Zamindar32• The factory establishment
consisted of a doctor, 6 senior merchants, 3 junior merchants, 7 factors and 4 writers.
Although the English Company obtained an Imperial order as early as 1691 to
continue trade on yearly payment, nothing was done to clear jungles, construct roads
or build houses. The early traders lived either in mud hovels or in the cabins or
forecastles of their ships or worse still in small country boats in the stifling heat and
torrential rains of Calcutta33• In 1700 A.D., Charles Eyre got instructions to build a
fort and name it after William III. In 1702 the President's House was commenced
which took four years to complete. In 1706 the old factory house was pulled down
and in its place was erected a single-storied house for the servants of the Company -
the first "Writers' Building". But it was not till the death of Aurangazeb in 1707, that
the English had any real opportunity of fortifying the settlement. By this time the other
European merchants had built their houses on the eastern side of the Fort, the western
side being lapped by the Hooghly. The pivot of the settlement was "The Green before
the Fort", now called "Lal Dighi" by the Indians and "Dalhousie Square" by
Europeans34•
31 Charnock's letter to the Company Directors in England, March, 1695, cited in C.R.Wilson (1906), Old Fort William in Bengal, Vol.l p.246.
32 Ray,A .K. (1902): A Short History of Calcutta- Towns and Suburbs; Part I; Vol. VII; Census of India-1901; p.28.
33 Bagchi, P. C. (ed.) (1938): The Second City of the Empire; 25th Session of the Indian Science Congress Association; Calcutta; p. 34.
34 Ibid; p.35.
52

The first brick and mortar house any native in the city possessed was the estate house
of Savama Chowdhury beside Laldighi35• The first survey of Calcutta, done in 1706,
estimated the area of Calcutta at 685 hectares, with 8 pucca (permanent) houses and
8,000 kutcha (temporary) houses, and 2 streets and 2lanes.
The localities inhabited by natives, around Bara Bazaar, generally referred to as the
'native' or 'black' town, continued to be an amalgam of straw huts. Only 16 dust
ridden lanes served the settlement and were secured by a gate at the Palisade and at
the ghats. This humble town, surrounded by swamps, marshes and tiger infested
jungles, was, however, very rich.
In the next fifty years, i.e. by 1756, the area almost doubled to 1307 hectares, and the
number of 'pucca' houses increased to 498, i.e. more than sixty times while, the
number of 'kutcha' houses increased to 14,450 i.e. less than two times. In that year
Calcutta had 27 streets, 52 lanes and 75 by-lanes36•
The new Fort William necessitated substantial alterations in the town plan of Calcutta.
The Indian dwellings along the riverbank were cleared to obtain space for the large
fort and the tiger infested jungle at Govindapur began to be cleared to provide open
land called the 'Maidan' for a free view and firing space.
The house rents in Calcutta were high so people kept constantly building. Since this
was done without a plan, the town soon became "as awkward a place as can be
conceived; so irregular that it looked as if all the houses had been thrown up the air
and had fallen down by accident"37•
Table 2.9 indipates the numerical growth of residential houses in the city of Calcutta
to cater to the increasing population during the eighteenth century.
35 Op.cit; footnote 29; p.74. 36 Ghosh, Santosh Kr.{l991): "Calcutta's Urban Growth and Built Form"; in Biplab Das Gupta et al.
edited Calcutta•s Urban Future: Agonies From the Past and Prospects for the Future; Calcutta: Government of West Bengal, p.l36.
37 Op. cit; footnote 2; p.21.
53

Table. 2.9 Number of Houses in Calcutta (Eighteenth Century)
I Year I Pucca I Kutcha I Total
11706 l8,ooo 18,008
11726 113,300 113,340
11742 1121 114,747 114,868
11756 114,450 114,948
11794 11 ,114 113,657 114,771 Source: Ray, A. K. (1902): A Short History of Calcutta- Towns nd Suburbs; Part I; Vol.
Figure. 2.7
• • • ::0 0 :z: , .! ... ::0 u u 0 ... 0
0 z
VII; Census oflndia - 190 1; p. l25.
1 40000 Growth of Total Occupied Houses In Calcutta
120000
100000
80000
60000
4 0000
20000
0
"' "' N "' • ~ ~ .... 0 "' "' ~ ~ ~ .... 0 "' ~ ... 0 N • "' "' N .. .. ... "' .... "' "' 0 ~ N N .. .... .... .... .... .... .... .. .. .. ., .. .. .. .. "' "' "' "' "' • ~ ~ ~ ~ ~ ~ ~ ~ ~ ~ ~ ~ ~ ~
"' ~ Time Pe ri o d
I = T o tal --L i ne ar (T o tal) I
From Figure 2. 7 it is clear that there has been a rapid, and at times fluctuating increase
in the number of occupied houses. The fluctuations were caused by several disasters
and sieges in the eighteenth century, which destroyed many houses in the city. Many
huts were also cleared for digging the Marhatta Ditch in 1742; for the building of the
new Fort William (1758-1776) in Gobindapur; and for the construction of the
Government House between 1798 and 1803. In 1780 about 15,000 straw houses were
destroyed in fire.
54

In 1782 Warren Hastings divided the 'black town' and the 'white town' into 35 wards
and pushed the natives further awa~8• A number of garden houses were built in the
outskirts ofCalcutta. By a treaty in 1757, the area up to 600 yards on both sides ofthe
Marhatta Ditch came under the control of the English. It was filled up and the
Circular Road was built.
2.8.1 Density of Houses
The overall density of houses i.e. number of houses per sq. km. remained more or less
constant between 1881 and 1941 [See Figure 2.8] . However, a sharp increase in the
density of houses is observed in the ' town proper' and to a lesser extent in the 'added
areas' of the town. In the Port-Fort-Canal area, the density of houses was extremely
low and remained more or less constant.
Figure. 2.8
1 2 0 00 e Density of Houses In Calcutta
:.:: cT
1 0 0 00
1/)
~ 8 0 00 .. 11. .. .. 6 0 00 .. "' 0
:1: 4 0 00
2 0 00
0
1 a 81 1 8 9 1 1 9 01 19 1 1 1 9 21 1 9 31 19 41
Tim e P e rio d
Town Proper - AdditionaiArea
=F or 11 P o r1/C a n a I = C A L C U T T A
--Linear(Town Proper) - Linear(CALCUTTA)
-- L i n • a r (A d d i ti o n a I A r e a ) - L in e a r ( F o r t /P o r tl C a n a I )
The spatial and temporal analysis of 'density of housing' in Calcutta, as shown in Map
2.9 shows a more or less 'medium' (1 000- 2499 houses per sq. km.) to 'high' (2500-
5999 houses per sq. km.) density in most ofthe wards of Calcutta. 'Low' density of
housing (<1000 houses per sq. km.) is observed mainly in the Port-Fort-Canal areas,
Waterloo Street, Park Street, Baman Bustee and Hastings wards of the ' town proper'
and in the later time period in Ballygunge-Tollygunge, Alipore, Entally, Beniapukur
38 Op. cit; footnote 36; p.l36.
55

and Entally wards of the 'added area'. A 'very high' density of housing (i.e. more
than 6000 houses per sq. km.) in Calcutta has been observed since 1901. Between
1901 and 1941 most of the wards in the ' town proper', except Burra Bazaar, Waterloo
Street, Park Street and Baman Bustee, had very high density of housing. The ' added
area' ofKalighat, Entally and Beniapukur also had very high density of housing.
Map. 2.9
Changing Pattern of Housing Density Calcutta- Ward Wise
I ndex
No . o f Hou s es (Per Sq . Km . )
0 - 499 .99 500 - 2499.99 2500 - 4499 .99 4500 - 6499.99 6500 - 8499 8500 - 10499 10500 - 21100
Maps Not to Scale
56

Changing Pattern of Housing Density Calcutta- Ward Wise
Index
No. of Houses (Per Sq . Km .)
0 - 499 .99 500 - 2499 .99 2500 - 4499.99 4500 - 6499 .99 6500- 8499 8500 - 10499 10500 - 21100
Maps Not to Scale
57

2.8.2 'Crowding' in residential areas
Apart from analysing the density of houses in an urban area, it is also necessary to
have an idea about the density of population in each house i.e. 'crowding' in each
house, as this has an impact on health of the people living in it. It is clear from Figure
2.9 that though the 'density of population' in each house decreased over time, the
number of persons per house has remained more than 5.
Figure. 2.9
25
CD 2 0 Ill :I 0 J: 15 ... CD
a. 1 0 c: .2 -.!! 5 :I Q. 0 a. 0
Density of Population per House in Calcutta
1 88 1 1 8 9 1 1 90 1 1 91 1 1 9 2 1 1 93 1 1 94 1
Time Per i od
T ow n P ro p e r -- A d d i ti o n a I A re a
=Fort/Port/Canal =CALCUTTA
--Line a r (T o wn Proper) --Line a r (Add i tion a I Are a)
-L i n e a r IF o rt/P o rt/C an a I) - Line a rIC A l CUT T A)
The spatial and temporal analysis of 'crowding' i.e. number of persons per house in
each ward of the city is shown in Map 2.10. The analysis indicates that in 1881, most
of the wards had a relatively low crowding rate of 1-5 person per house except in Park
Street, Waterloo Street, Collootola and Baman Bustee where 16- 25 persons resided
in each house. In 1891 Park Street, Fenwick Bazaar, Collootola and Hastings had 16-
25 persons per house. The other wards had a moderate rate of crowding i.e. 6 - 15
persons per house. This high density, however, is not indicative of overcrowding in
these wards as there were huge palatial houses in these areas built by the Europeans.
Hence, it cannot be said that the houses were crowded in these wards.
58

Map. 2.10
Density of Population Per House in Calcutta- Ward wise
Index
per 0 1-5 0 6-15 - 16-25 - 26-41
Maps Not to Scale
59

Density of Population Per House in Calcutta- Ward wise
Index
per 0 1-5 0 6-15 · 16-25 ·3;-41
Ma~ Not to Scale
60

In 1901, 1-5 persons per house were recorded in Alipore, Hastings, Ekbalpur and
Ballygunge-Tollygunge wards while the other wards recorded 6-15 persons per house.
The 1911 Census shows an extraordinary high rate of crowding in each house of the
city when the minimum number of persons (15) in one house was recorded in
Bhowanipore and maximum ( 41) in Ekbalpur ward. In 1921, a high rate of crowding
varying between 16-25 persons per house was recorded in Park Street and Hastings
wards; normal (1 - 5) in Beniapukur, Collinga, Watgunge, Khidderpore, Ekbalpur,
Entally, Taltolla, Fenwick Bazaar, Moocheepara, Puddopooker, Bow Bazaar, Alipore,
and Collootola. Rest of the wards recorded moderate crowding varying between 6 -
15 persons per house. By 1931 - 1941 most of the wards recorded normal to moderate
rate of crowding.
2.8.3 TypeofHousing
From the point of view of structural characteristics, the houses of Calcutta can be
broadly classified under two types39:
i) Kutcha or temporary constructions with wall material of grass, leaves, reeds
or bamboos; timber; mud; un-burnt bricks or metal sheets and of roof
materials like, grass, leaves, reeds thatch, wood or bamboos, tiles, slates,
shingles or other metal sheets; and,
ii) Pucca or permanent constructions with wall materials like burnt bricks and
. lime, cement concrete and stone slabs and roof materials of brick lime or
cement concrete.
The rapid urban growth since the early eighteenth century led to a very haphazard
growth of houses and accommodation facilities in the city. The slums or 'bustees' in
Calcutta sprang up to house the urban poor. Bustees were called 'native village' in old
records and the slum houses were simply designated as 'huts'. Both these were the
seedbeds of disease and epidemics. There were no 'thatched huts' in the Corporation
39 Op. cit; footnote 30; p. 173.
61

area as they were prohibited in 1837. According to the Administration Report of the
Calcutta Municipality for the year 186840,
"A bustee, or native village, generally consists of a mass of huts constructed
without any plan or arrangement, without roads, without drains, ill-ventilated,
and never cleaned. Most of these villages are the abodes of misery, voice, and
filth, and the nurseries of sickness and disease. In these bustees are found
green and slimy stagnant ponds, full of putrid vegetable and animal matter in
a state of decomposition, and whose bubbling surfaces exhale, under a
tropical sun, noxious gases, poisoning the atmosphere and spreading around
disease and death. These ponds supply the natives with water for domestic
purposes, and are very often receptacles of filth. The arteries, which fed these
tanks, are the drains that ramify over the village, and carry the sewage of the
huts into them... paths are so narrow and tortuous that it is difficult for a
stranger to find his way through ... The huts are huddled together in masses,
and pushed to the very edge of the ponds... and the intervening spaces,
impervious to the rays of the sun are converted into toilets, used by both the
sexes in common ... "
It is clear from Figure 2.10 that in the initial years of the city's growth, the number of
Kutcha houses was more than the Pucca houses but gradually and mainly after 1911
'pucca' houses outnumbered the 'kutcha' houses when the 'Calcutta Improvement
Trust' took after the maintenance of the city administration.
In the middle of the nineteenth century, Calcutta was divided into northern and
southern divisions. The northern division extended from the line of Burra bazaar and
Lal bazaar Street to the Chitpur canal and contained 9,823 masonry buildings and
41,917 huts. According to Mr. Simm's Report in 1850, the number of habitations
within the jurisdiction of the Commissioner of the Town of Calcutta was 61,400.
40 Op. cit; footnote 18; p.l61.
62

Figure. 2.10
Share of Pucca and Kutcba Houses
27.13 21 .0821 .8422.33 21.32
0. 10 0.30 0. 81
Table :2.10
II ~ .. .. == ~ i ~
!!. I =: ~
:c ~ ~ e ~
: 5 : ... ..
Time Period j-+- Pucca ~ Bustee/Kutcha J
Type of Houses in Calcutta - 1850
Number of Residences Pucca Houses Huts 1 Storied Pucca Houses 5,918 -2 Storied Pucca Houses 6,438 -3 Storied Pucca Houses 721 -4 Storied Pucca Houses 10 -5 Storied Pucca Houses 1 -Total 13,088 48,312 Grand Total ofHabitations 61,400
Source: Administration Report of Calcutta Corporation - 1856-59.
By 1866, the total area of the city increased along with population. The house types
were:
Table. 2.11 Type of Houses in Calcutta- 1866
No. Of House Types No. Of Pucca houses Huts
5 storied house 1 -4 storied house 26 -3 storied house 999 -2 storied house 7677 -1 storied house 7272 -TOTAL 15975 42917
Total Number of Houses 58892 Source: Report of the Census of Calcutta - 1866.
63

Considering the spatial distribution of houses in the city, it is clear from Table 2.12
that their total number was more in the northern division of the city than the southern
division. The northern division possessed high rise pucca houses, which varied from
one story to five stories. Although European and their allied population dominated
the southern division of the city, there were plenty of huts that probably housed the
domestic workers of these palatial houses occupied by rich people.
Table. 2.12 Distribution of Different Types of Houses
in Calcutta - 1866
Northern Southern House Types Division Division Total
Pucca 5storied house 1 0 1 4storied house 22 4 26 3storied house 764 235 999 2storied house 5777 1900 7677 1 storied house 5144 2128 7272 Huts 31120 11797 42917 Total 42828 16064 58892
Source: Report of the Census of Calcutta- 1866.
Table. 2.13 Type of Houses in Calcutta - 1876
No. of Huts I Kutcha House Types No. of Pucca Houses Houses
5 storied houses 2 4 storied houses 34 3 storied houses 1187 2 storied houses 8636 1 storied houses 7037 Total 16896 22860 Grand Total 39756
Source: Census of Calcutta- 1876.
Note: Out of 16,896 'Pucca Houses', 15,667 houses were inhabited. Out of22,860 'Kutcha
Houses I Huts' , 22,195 were inhabited. 'Huts I Kutcha Houses' were 'Tiled' and not
'Thatched' . Off the total 'Kutcha Houses I Huts', 1 , 120 had upper storied and 21 , 7 40 were
single storied.
The temporal analysis of house types in Calcutta shows that between 1881 and 1891 ,
the share of Pucca house in the city was comparatively low and these were
concentrated in District II followed by District I and District III. But over time, there
was a sharp increase in the number of Pucca houses in all the districts.
64

Figure. 2.11 Types of Houses in Different Districts of Calcutta
District I tD D. 1strict II !II v Ill vv lO
~ Ill
Sl r--. 4J r--. 3) r--. 3) 1------
1------11
h h t- l.i 0
~
- .. 1111 1117 11111 - 1!BI - - .. 1IJI 1117 11111 - 1!BI --- --!o~tm~otwa-L.iwfbDt-Liwf'Jrht!
District III District IV
- .. 1111 1117 11111 - 1!BI -
11 -- 1111 - 1IJI 117 11111 - 1!BI --!o~tm~ twa- L.iwfbDt-Liwf'Jrht!
District Wards
I Shampooker, Koomartooly, Burtolla, Sukea's Street, Jorabagan, Jorasanko, Belgachia, ~ Satpukur and Cossipur.
II Burra Bazaar, Collootola, Moocheepara, Bow Bazaar, Puddopooker, Waterloo Street, ., Beliaghata and Manicktola.
Ill Fenwick Bazaar, Taltolla, Collinga, Park Street, Baman Bustee, Tengra, Entally, Beniapukur, Ballygunge.
IV Bhowanipore, Alipore, Ekbalpur, Watgunge-Hastings, Garden Reach, Tollygunge and Kalighat.
2.9 Conclusions
• The English East India Company established the city during the last decade of
the seventeenth century. The main purpose for the establishment of a
settlement on the eastern part of India was to control the rich natural resource
of the Bengal, Bihar, Orissa and Assam plains.
65

o The site chosen by the Company consisted of three small hamlets or villages
on the left bank of river Hooghly. These were located on a comparatively
higher level than its surrounding areas.
o The English settlement known as Calcutta, gradually expanded on the eastern
side of the original site along the riverbank. This led to the clearing of the
jungles, uplifting of the marshy areas and filling up of the ponds and ditches.
o Physiographically, this site was low lying and was traversed by numerous
rivers and channels like the Hooghly, Bidyadhari and their tributaries. The
general slope of the land was to the eastern side towards the Salt Lake area
instead of the river in the west.
o Geologically, the city rested on a clay bed deposited by rivers forming the
lower plains of the Gangetic delta overlying a thick pile of alluvial sediments.
The subsurface consisted of a thick layer of sandy soil that trapped huge
quantity of water and served as a water reservoir.
o Climatologically, the area lies within the tropical zone and experiences a hot
and humid climate for most parts of the year. Rains are heavy and
temperatures are very high. Winter is mild and short.
o The process of Calcutta's growth had been more or less continuous from the
seventeenth century. The area of the town increased from 1692 acres in 1717
to 20,714 acres in 1941 and the population increased from 12000 in 1717 to
2108891 persons in 1941. Thereby, the density of population also increased
over time. The main or the core area of the town was the area in and around
the Fort William and Burra Bazaar- that included the wards ofBurra Bazaar,
Waterloo Street, Fenwick Bazaar, Park Street, Hastings and Alipore.
o With the establishment of the city, people from different parts of Bengal as
well as from other parts of the country moved into Calcutta mainly in search of
a livelihood. Most of the migrants into Calcutta during the early part of the
nineteenth century hailed from Bihar, Orissa, Punjab and Rajputana. The
migration stream was male selective.
o The sex ratio was 500 females per 1000 male population in the city. It was
lowest in the Port-Fort-Canal areas, followed by the wards that formed the
main business town i.e. in the wards of Waterloo Street, Baman Bustee, Park
66
Street, Fenwick Bazaar and Burra Bazaar inhabited by the White population.
The outer wards had a comparatively higher sex ratio than the above
mentioned wards in the town.
o Hindus were the dominant religious community in the city followed by the
Muslims, Christians and Others who were Jewish, Parsis, Sikhs, Buddhists,
Jains etc. The foreigners, who inhabited the city during the period under
study, were English, but also Irish, Scots, Armenians, Chineese, Africans, and
many others.
o The city was clearly divided into three major zones based on the pattern of
settlement of the people of different communities. The northern zone i.e. the
'Native Town', the southern zone i.e. the 'White Town' and in between, the
'Intermediate Town' accommodating the Armenians, and other Eurasians who
served the English East India Company.
o The density of population was high and went on increasing in the original
town area comprising of the main 18 wards.
o The housing situation also underwent major changes. Initially most of the
houses consisted of small huts. Later the 'White Town' was planned and
palatial brick houses were constructed. The 'Native Town' also had multi
storeyed brick buildings but the poor people, both native and foreigners, lived
in small-congested huts. The housing density was high in the non-European
wards of the city. In most of these houses, the average number of people
residing were more than five. The number of people per house in the European
Town was much more than the city average but the houses in the 'white town'
were huge and could conveniently accommodate a large number of people. It
is difficult to calculate the 'crowding index' in the city because systematic data
is not available for the period under study.
Thus, within two centuries, the City of Calcutta grew into a major port town of British
India. This rapid growth, however, made it a very unhealthy city.
67