Embed Size (px)
Citation preview

The Structure of the Custom Concentrate Market
Albert de SousaHead of Marketing, Newcrest Mining Ltd
Australian Copper Conference.25 March 2010 Brisbane, Australia

2
DisclaimerForward Looking Statements
These materials include forward looking statements. Forward looking statements inherently involve subjective judgement and analysis and are subject to significant uncertainties, risks and contingencies, many of which are outside of the control of, and may be unknown to, the company. Actual results and developments may vary materially from those expressed in these materials. The types of uncertainties which are relevant to the company may include, but are not limited to, commodity prices, political uncertainty, changes to the regulatory framework which applies to the business of the company and general economic conditions. Given these uncertainties, readers are cautioned not to place undue reliance on such forward looking statements.
Forward looking statements in these materials speak only at the date of issue. Subject to any continuing obligations under applicable law or any relevant stock exchange listing rules, the company does not in providing this information undertake any obligation to publicly update or revise any of the forward looking statements or any change in events, conditions or circumstances on which any such statement is based.
Competent Persons Statement
The information in this presentation that relates to Exploration Results is based on information compiled by C. Moorhead, EGM Minerals for Newcrest Mining Limited who is a Member of The Australasian Institute of Mining and Metallurgy, and a full-time employee of Newcrest Mining Limited. Mr Moorhead has sufficient experience which is relevant to the styles of mineralisation and types of deposits under consideration and to the activity which he is undertaking to qualify as a Competent Person as defined in the 2004 Edition of the Australasian Code for Reporting of Exploration Results, Mineral Resources and Ore Reserves (the “JORC Code”). Mr Moorhead consents to the inclusion in this presentation of the matters based on this information in the form and context in which they appear.
Ore Reserves and Mineral Resources Reporting Requirements
As an Australian company with securities listed on the Australian Securities Exchange (“ASX”), Newcrest is subject to Australian disclosure requirements and standards, including the requirements of the Corporations Act and the ASX. Investors should note that it is a requirement of the ASX listing rules that the reporting of ore reserves and mineral resources in Australia comply with the JORC Code and that Newcrest’s ore reserve and mineral resource estimates comply with the JORC Code.
3
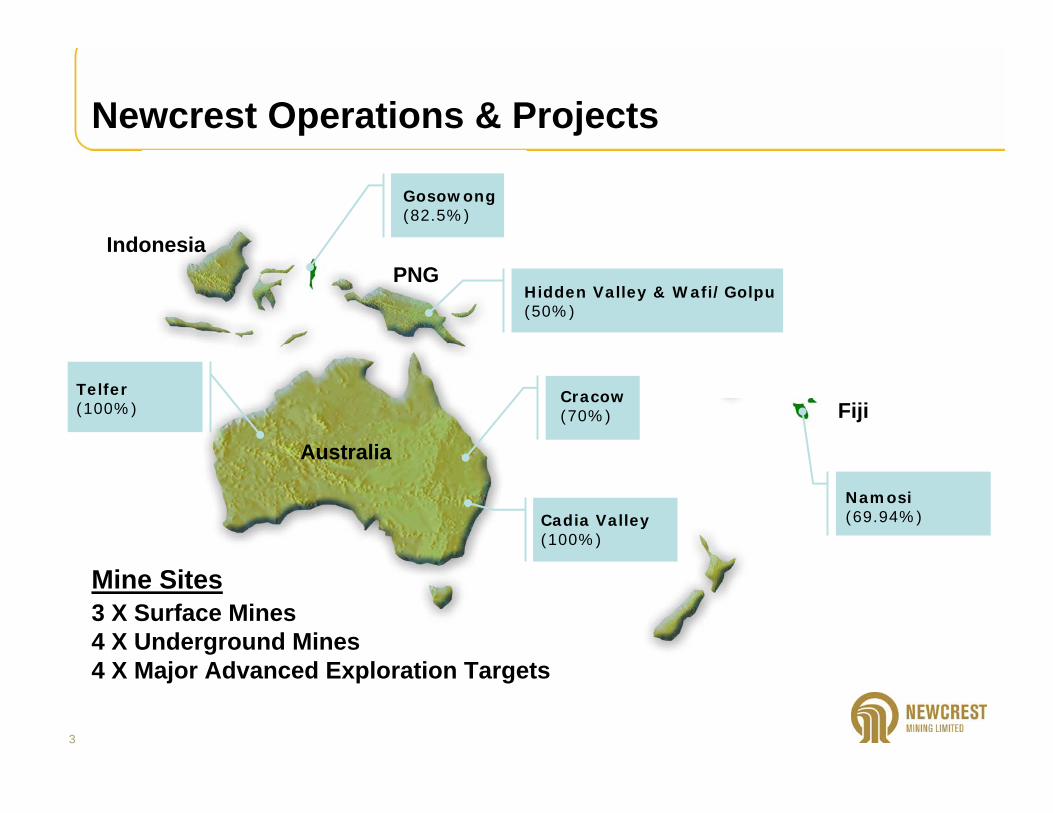
Newcrest Operations & Projects
Telfer(100%)
Gosowong(82.5%)
Hidden Valley & Wafi/Golpu(50%)
Cracow(70%)
Cadia Valley(100%)
Namosi (69.94%)
Australia
Indonesia
Fiji
PNG
Mine Sites3 X Surface Mines4 X Underground Mines4 X Major Advanced Exploration Targets
4
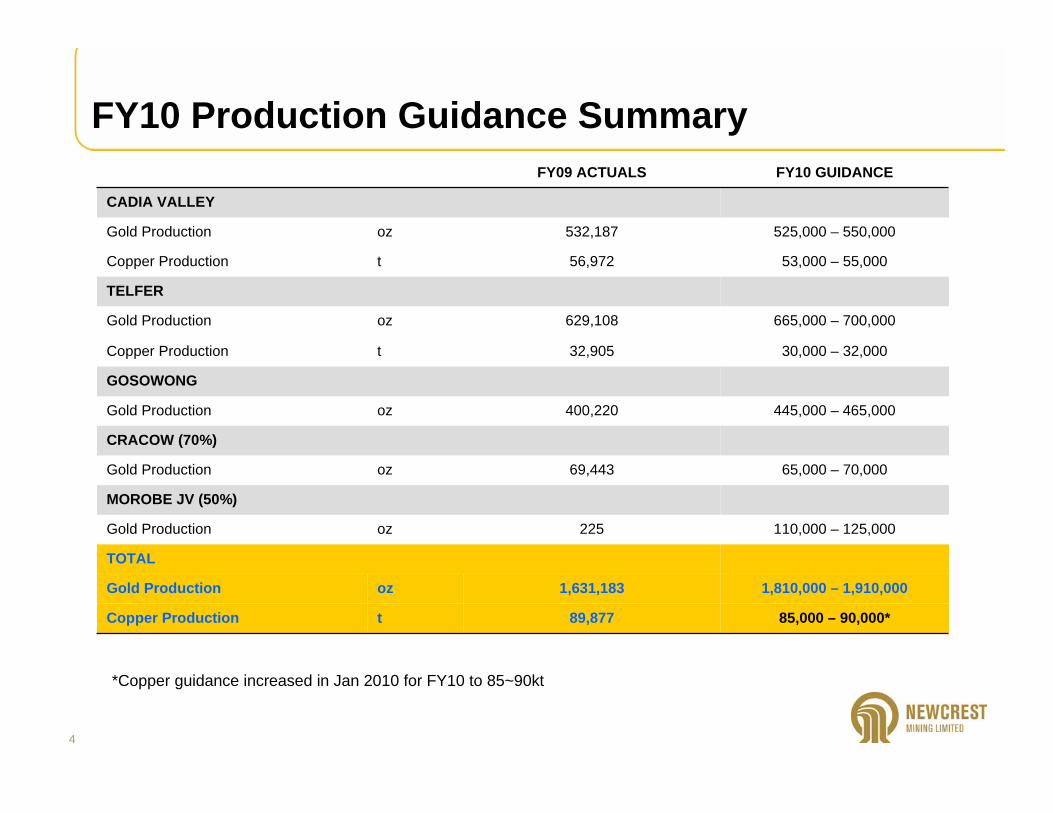
FY10 Production Guidance Summary
85,000 – 90,000*
1,810,000 – 1,910,000
110,000 – 125,000
65,000 – 70,000
445,000 – 465,000
30,000 – 32,000
665,000 – 700,000
53,000 – 55,000
525,000 – 550,000
FY10 GUIDANCE
89,877tCopper Production
1,631,183ozGold Production
TOTAL
225ozGold Production
MOROBE JV (50%)
69,443ozGold Production
CRACOW (70%)
400,220ozGold Production
GOSOWONG
32,905tCopper Production
629,108ozGold Production
TELFER
56,972tCopper Production
532,187ozGold Production
CADIA VALLEY
FY09 ACTUALS
*Copper guidance increased in Jan 2010 for FY10 to 85~90kt

5
Gold production to increase 40% over 5 years
1.63Moz
2.30Moz
FY2009 FY2014
1.81 – 1.91Moz
5 %
5 %
5 %
5 %
Hidden ValleyGosowong
Hidden ValleyCVO
Ridgeway Deeps Cadia East
Hidden ValleyCadia East
TelferCadia East
5 year Copper production to increase 30% from FY2009. Total copper to exceed 100,000t pa from FY2013.
6
Concentrate Market & Market Mechanisms
Mines & Smelters are either Integrated or Custom
Examples of Integrated Mines and Smelters are BHPB’s Olympic Dam and Xstrata’s Mt Isa / Townsville operations
Cadia Valley and Telfer are Custom Mines supplying Custom Smelters
The Custom Concentrate Market accounts for about 50% of the total smelter feed.
Apart from Mines and Smelters, Merchants (or Traders) are also active as Buyers & Sellers
7
Concentrate Market & Market Mechanisms
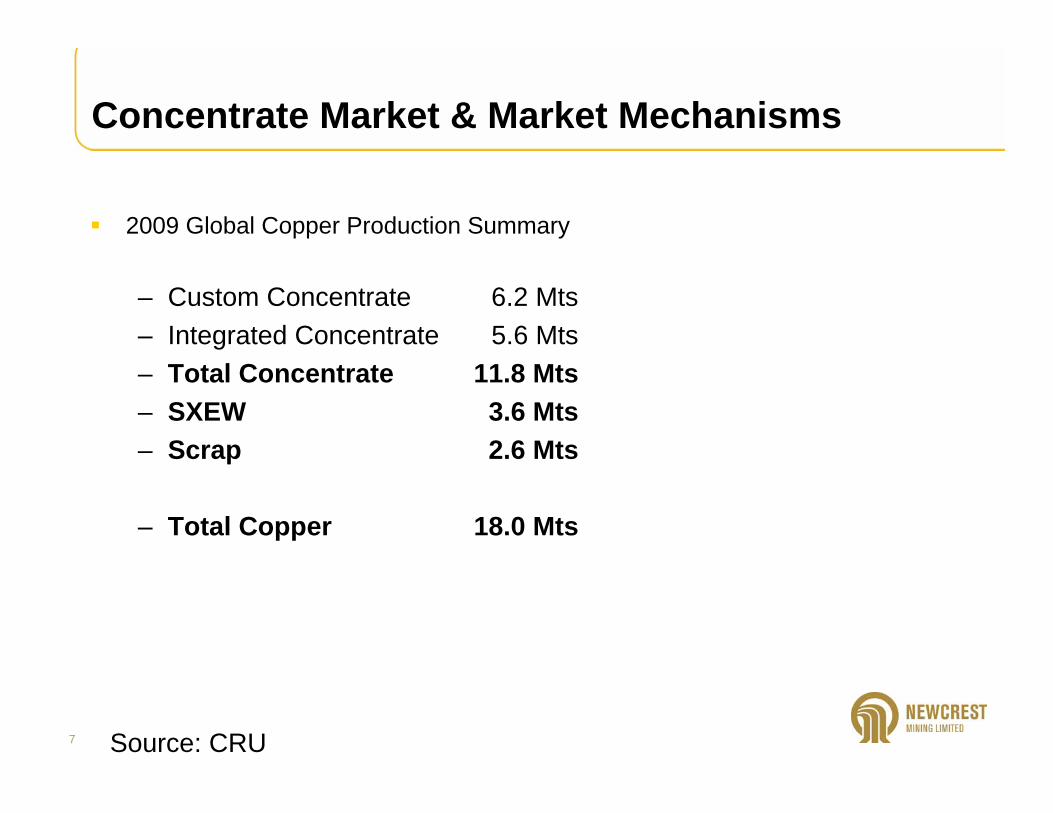
2009 Global Copper Production Summary
– Custom Concentrate 6.2 Mts– Integrated Concentrate 5.6 Mts– Total Concentrate 11.8 Mts– SXEW 3.6 Mts– Scrap 2.6 Mts
– Total Copper 18.0 Mts
Source: CRU
8
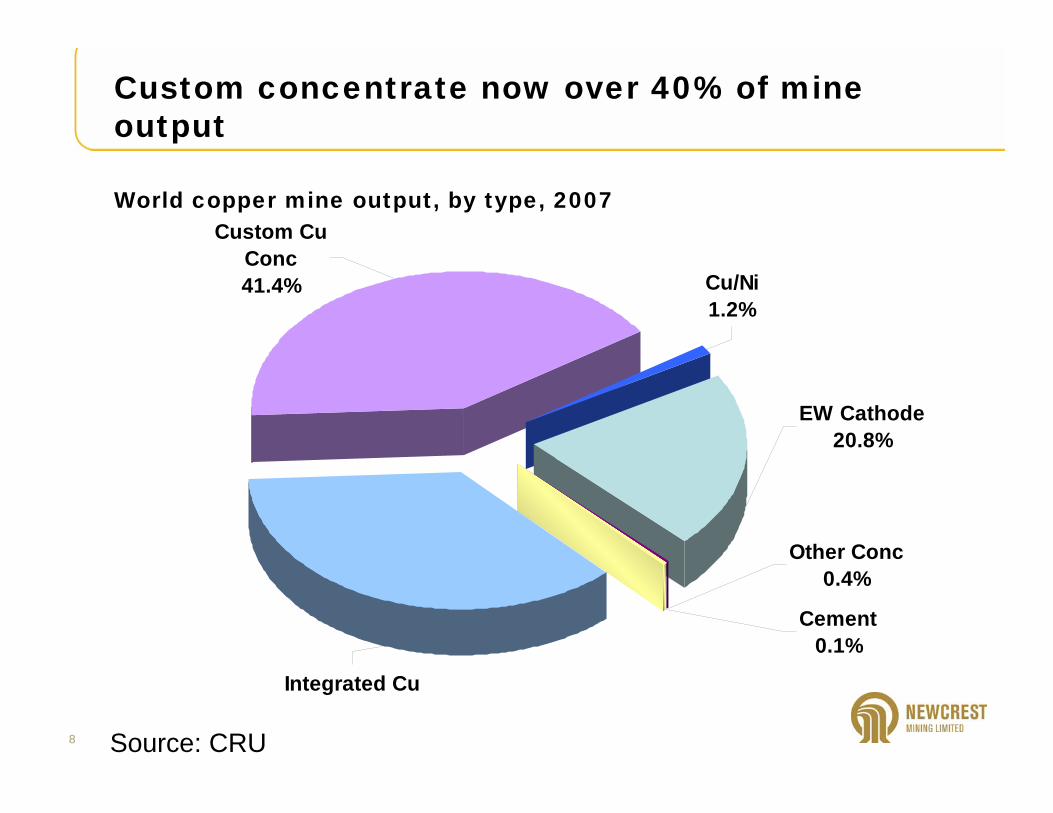
Custom concentrate now over 40% of mine output
World copper mine output, by type, 2007
Source: CRU
EW Cathode20.8%
Other Conc0.4%
Cement0.1%
Integrated Cu
Custom Cu Conc41.4% Cu/Ni
1.2%

9
Custom Concentrate Market Share
Cement0.1%
Other Conc0.1%
Cu/Ni0.9%
Scrap8.2%
Residues1.0% Integrated Cu
Conc41.7%
Custom Cu Conc48.1%
Custom share now nearly 50%Raw material offtake by smelters, 2009
Source: CRU
10
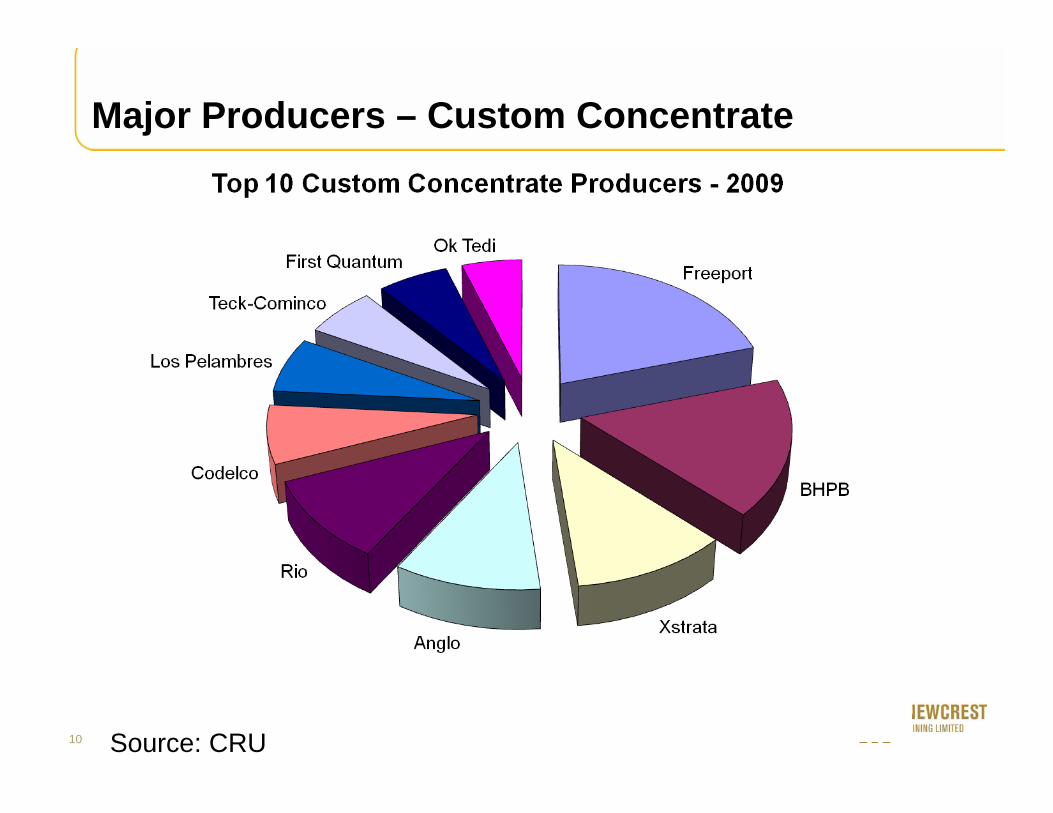
Major Producers – Custom Concentrate
Source: CRU
11
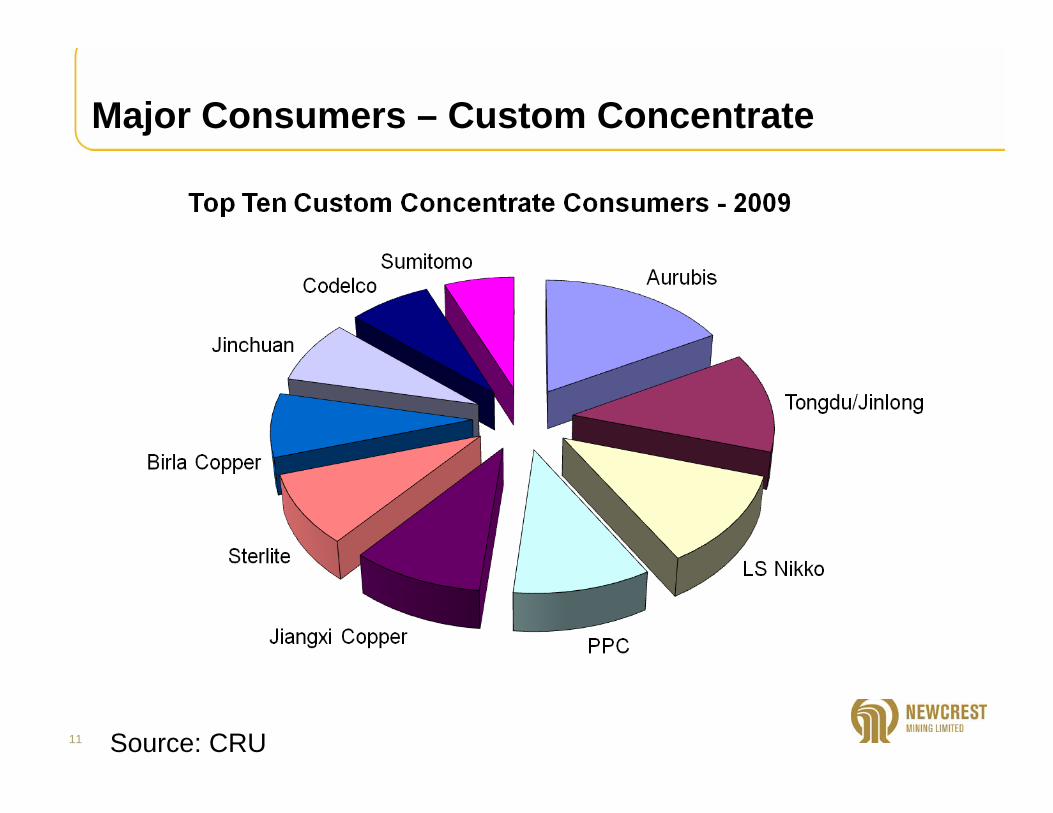
Major Consumers – Custom Concentrate
Source: CRU
12
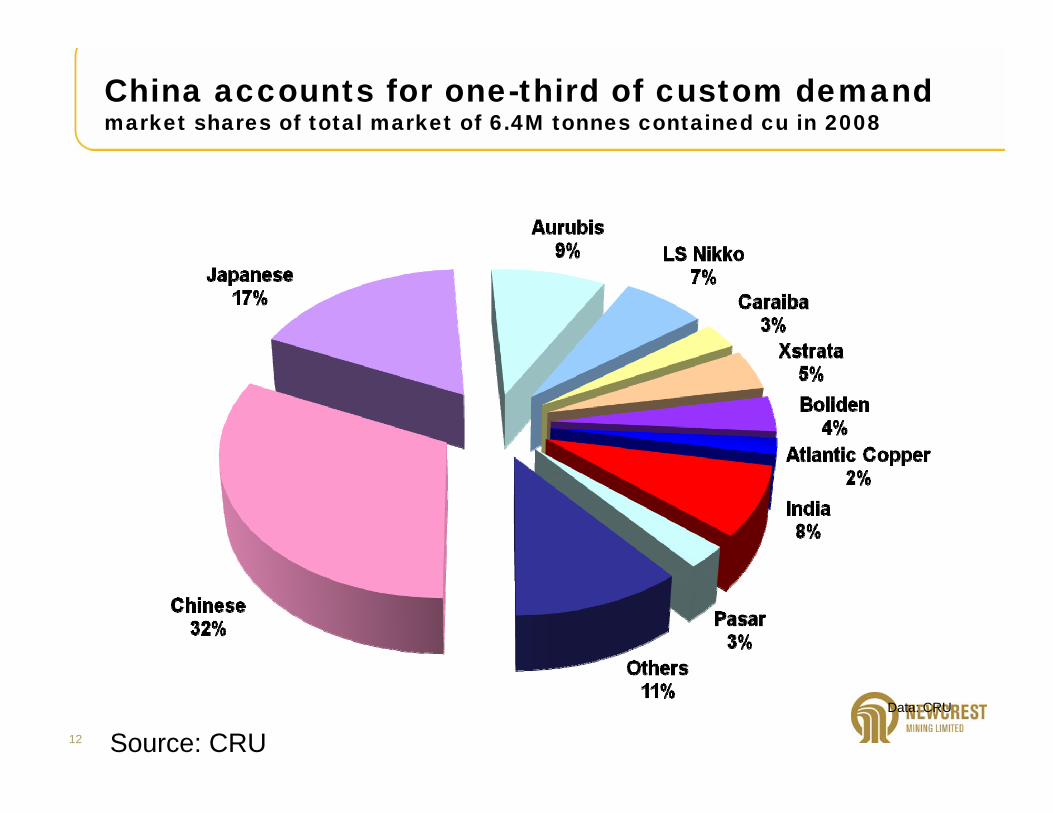
China accounts for one-third of custom demandmarket shares of total market of 6.4M tonnes contained cu in 2008
Data: CRU
Source: CRU

13
Types of Contracts
Long-term (“Frame”) contracts between Mines and Smelters
Long-term (“Frame”) contracts between Mines and Merchants
Long-term (“Frame”) contracts between Smelters and Merchants
The Spot Market via Merchants
Price Share Contracts [PS] where charges are levied as a percentage of the prevailing copper price
Frame Contracts are typically Bricks or Blocks
14
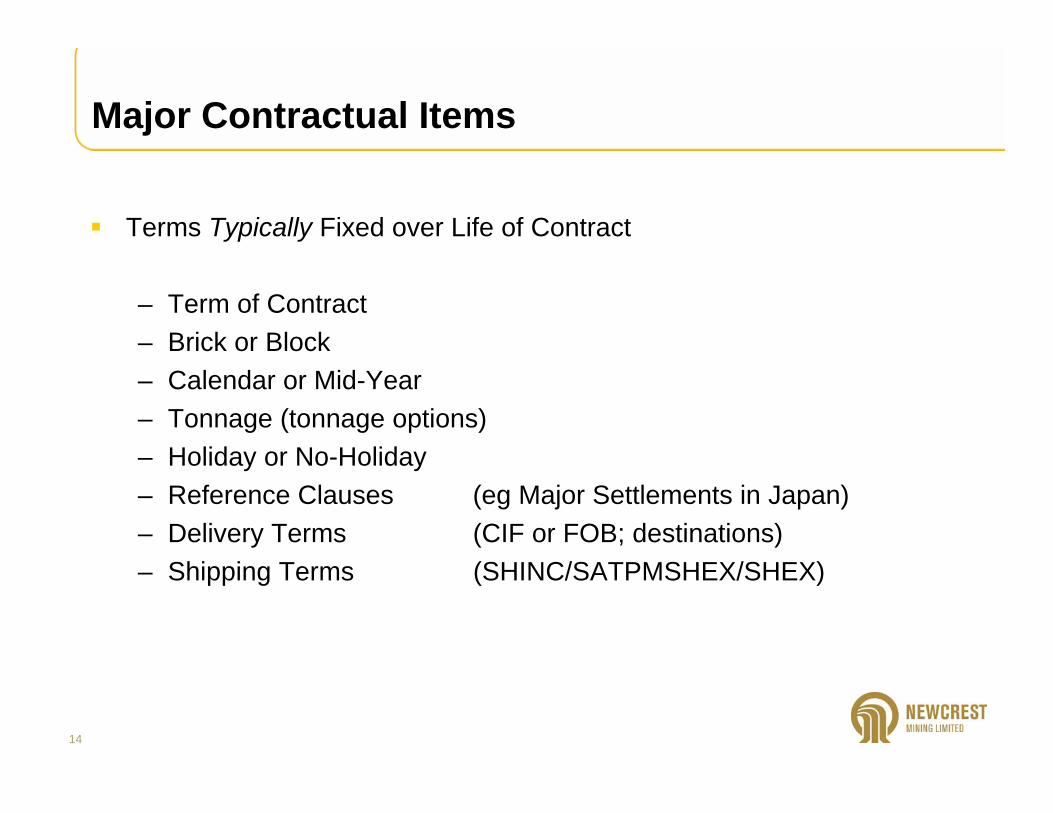
Major Contractual Items
Terms Typically Fixed over Life of Contract
– Term of Contract– Brick or Block– Calendar or Mid-Year– Tonnage (tonnage options)– Holiday or No-Holiday– Reference Clauses (eg Major Settlements in Japan)– Delivery Terms (CIF or FOB; destinations)– Shipping Terms (SHINC/SATPMSHEX/SHEX)
15
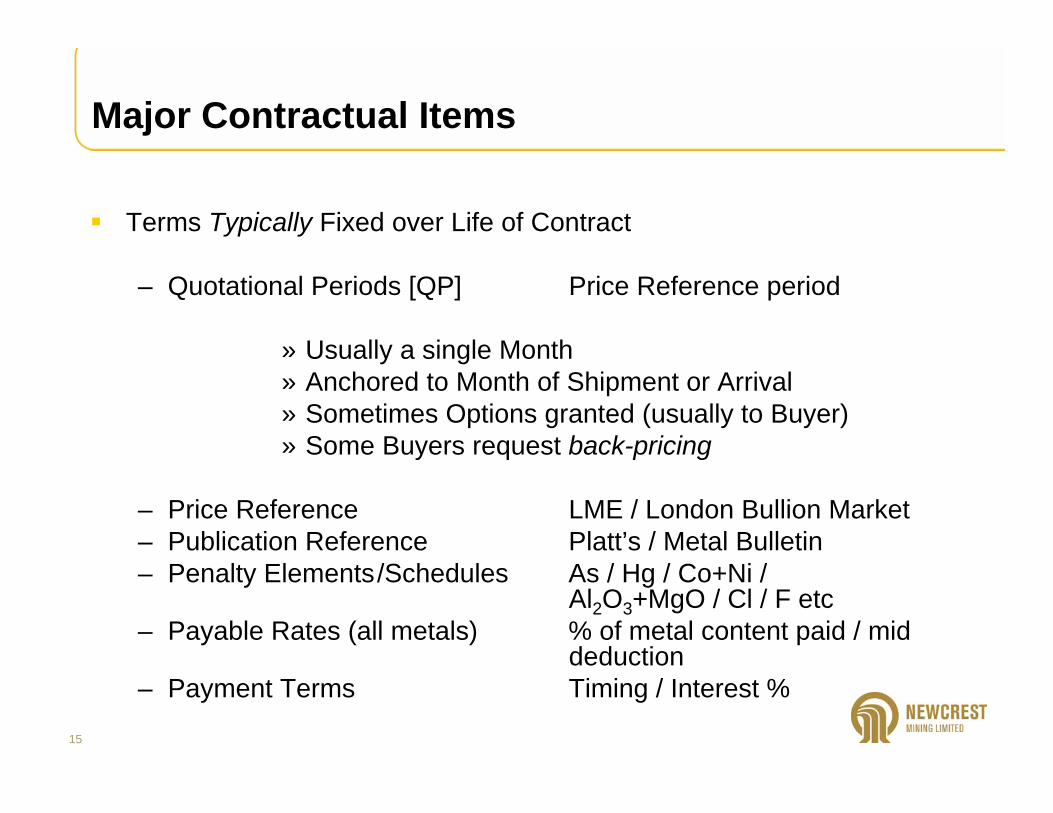
Major Contractual Items
Terms Typically Fixed over Life of Contract
– Quotational Periods [QP] Price Reference period
» Usually a single Month» Anchored to Month of Shipment or Arrival» Sometimes Options granted (usually to Buyer)» Some Buyers request back-pricing
– Price Reference LME / London Bullion Market– Publication Reference Platt’s / Metal Bulletin– Penalty Elements/Schedules As / Hg / Co+Ni /
Al2O3+MgO / Cl / F etc– Payable Rates (all metals) % of metal content paid / mid
deduction– Payment Terms Timing / Interest %

16
Major Contractual Items
Terms Typically Negotiated Annually
– Treatment Charge $ / DMT– Refining Charge (Cu) ¢ / lb– Refining Charge (Au) $ / oz– Refining Charge (Ag) $ / oz– Price Participation [PP] (Cu) % of Cu Price
Historically ± 10% of copper price above/below 90¢/lbCaps & Floors have existedEliminated in current market
17
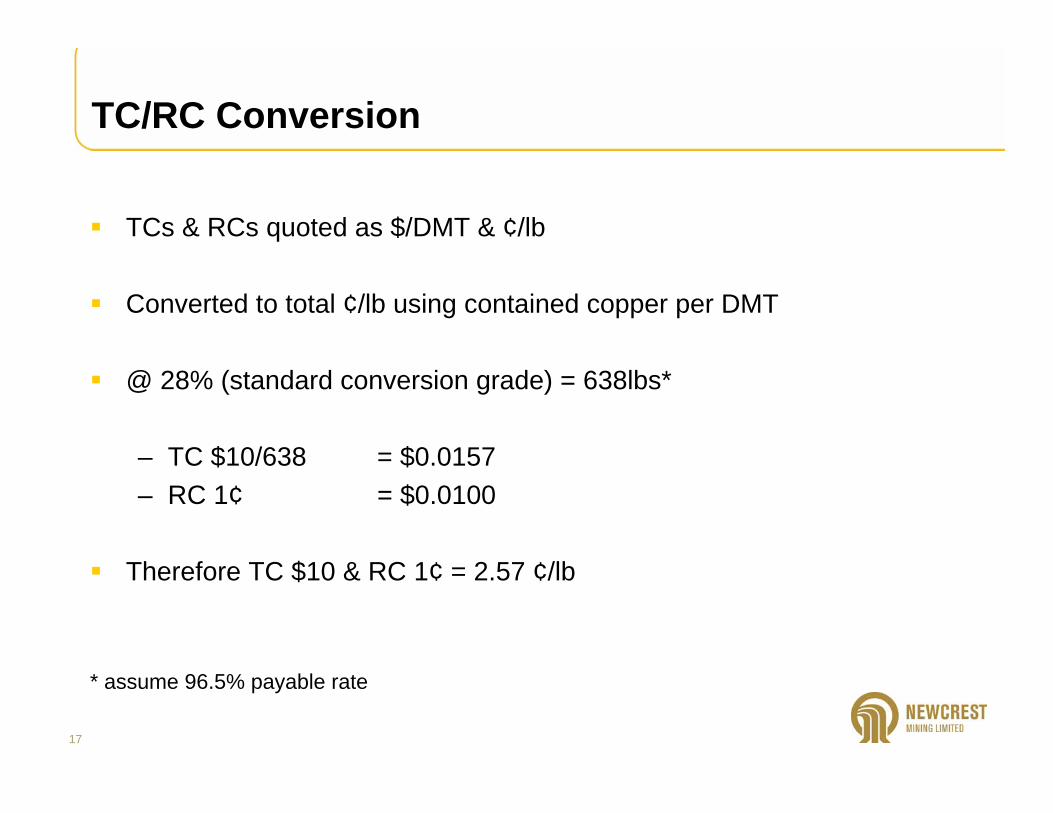
TC/RC Conversion
TCs & RCs quoted as $/DMT & ¢/lb
Converted to total ¢/lb using contained copper per DMT
@ 28% (standard conversion grade) = 638lbs*
– TC $10/638 = $0.0157– RC 1¢ = $0.0100
Therefore TC $10 & RC 1¢ = 2.57 ¢/lb
* assume 96.5% payable rate
18
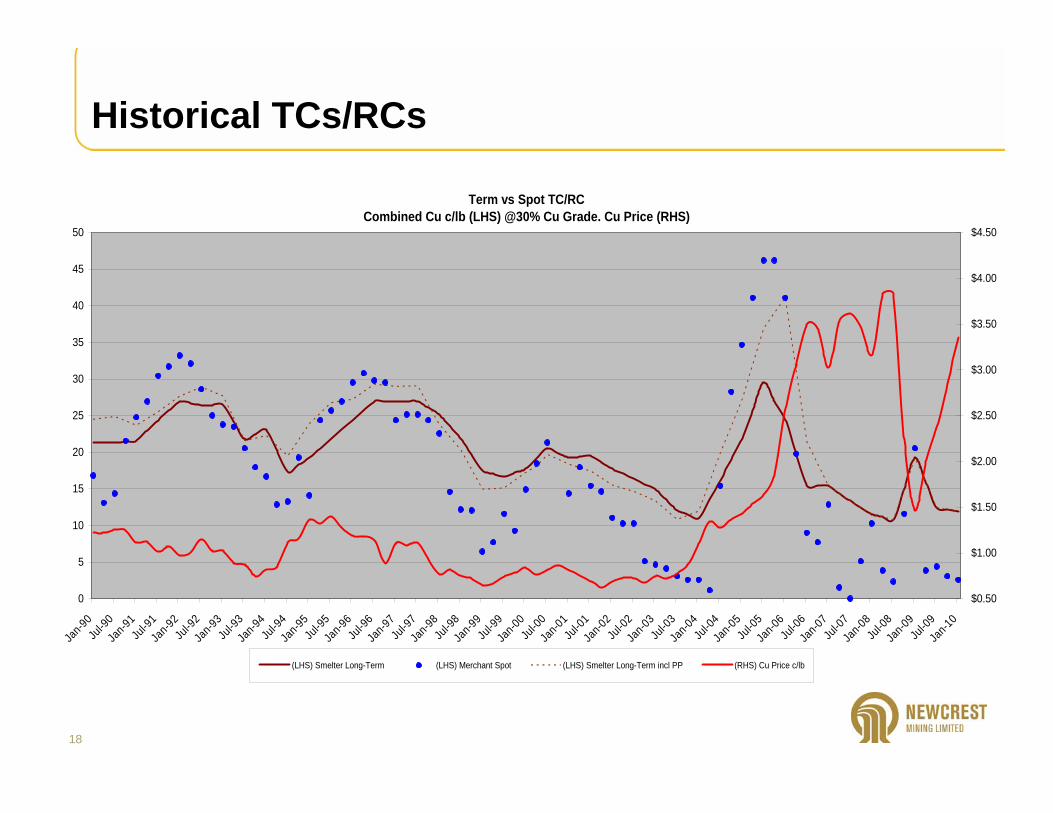
Historical TCs/RCs
Term vs Spot TC/RCCombined Cu c/lb (LHS) @30% Cu Grade. Cu Price (RHS)
0
5
10
15
20
25
30
35
40
45
50
Jan-9
0Ju
l-90
Jan-9
1Ju
l-91
Jan-9
2Ju
l-92
Jan-9
3Ju
l-93
Jan-9
4Ju
l-94
Jan-9
5Ju
l-95
Jan-9
6Ju
l-96
Jan-9
7Ju
l-97
Jan-9
8Ju
l-98
Jan-9
9Ju
l-99
Jan-0
0Ju
l-00
Jan-0
1Ju
l-01
Jan-0
2Ju
l-02
Jan-0
3Ju
l-03
Jan-0
4Ju
l-04
Jan-0
5Ju
l-05
Jan-0
6Ju
l-06
Jan-0
7Ju
l-07
Jan-0
8Ju
l-08
Jan-0
9Ju
l-09
Jan-1
0
$0.50
$1.00
$1.50
$2.00
$2.50
$3.00
$3.50
$4.00
$4.50
(LHS) Smelter Long-Term (LHS) Merchant Spot (LHS) Smelter Long-Term incl PP (RHS) Cu Price c/lb
19
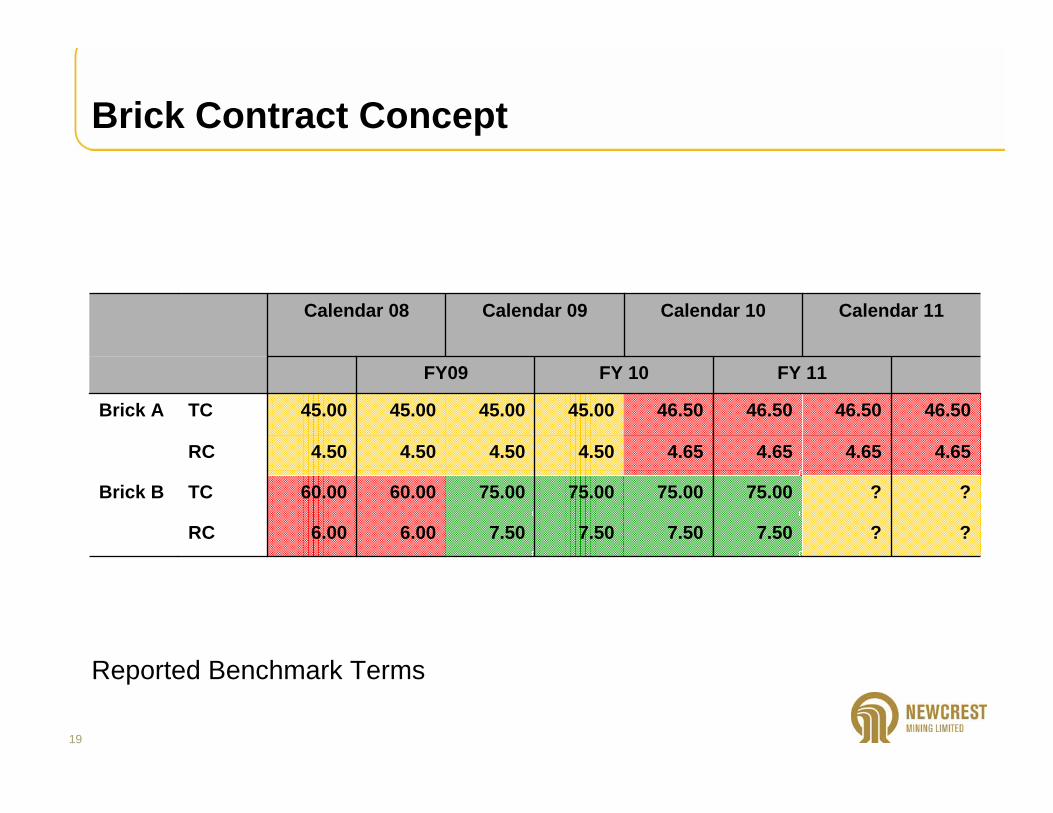
Brick Contract Concept
??7.507.507.507.506.006.00RC
??75.0075.0075.0075.0060.0060.00TCBrick B
4.654.654.654.654.504.504.504.50RC
46.5046.5046.5046.5045.0045.0045.0045.00TCBrick A
FY 11FY 10FY09
Calendar 11Calendar 10Calendar 09Calendar 08
Reported Benchmark Terms

20
Concentrate Sales Chain
Mine
Port
Storage Shipload
Transit Disport Sampling
Contractual Payment 90%
3 Days
Assays
Exchange Umpire
2nd ProvPayment
Final Assays
60 ~ 75 Days
12~30 Days
Final QP
Final Payment
10%
30 ~ 150 Days (1 MAMA ~ 4 MAMA)3~7 Days
Pre-payment
Tier 2 - Pre-pay 100% - Title Passes
Risk Passes
Title Passes – Tier 1

21
Copper Concentrate – Other Considerations
Copper Grade – High v Low
Au/Ag – High v Low
Penalty Elements – certain levels may prohibit sale to certain destinations
Market / Customer knowledge
Weights & Assays (adjustments & weight franchises)
22
Risk Management & Mitigation
Recognise different Types of risk
– Credit Risk– Performance Risk
– Credit Risk can be mitigated by a number of measures and instruments (EG L/Cs; pre-payments; escrow arrangements etc)
– Performance Risk is related to the quality of your counter-party