Embed Size (px)
Citation preview
The Structure and Profitability of Organic Field Crop Production:
The Case of Wheat
William D. McBride*
Catherine Greene
Mir Ali
Linda Foreman
Selected Paper prepared for presentation at the Agricultural and Applied Economics
Association’s 2012 Annual Meeting, Seattle, Washington, August 12-14, 2012
Abstract: Results from long-term experimental trials suggest that similar yields and lower costs
are possible from organic compared with conventional field crop production, but there is little
information about the relative costs and returns on commercial farms. This study examines the
structure and profitability of commercial wheat production using a nationwide survey of wheat
producers for 2009 that includes a targeted sample of organic growers. Treatment-effect models
were specified to isolate the impact of choosing the organic approach on various levels of wheat
production costs. Average organic wheat yields were much lower than for conventional wheat,
but per acre operating plus capital costs were also lower. Estimated operating costs per bushel
for organic wheat were lower than for conventional wheat, but operating plus capital costs and
total economic costs were about $2 to $4 per bushel higher. The average organic price premium
in 2009 was $3.79 per bushel, enough to cover the difference in operating plus capital costs of
organic versus conventional wheat production, but was short of the difference in total economic
costs.
*The authors are with the U.S. Department of Agriculture, Economic Research Service. The
views expressed herein are those of the authors and do not necessarily reflect the views or
polices of the U.S. Department of Agriculture. Direct any correspondence to:
[email protected] , (202) 694-5577.

The Structure and Profitability of Organic Field Crop Production:
The Case of Wheat
Organic cropping systems rely on ecologically based practices, such as biological pest
management and composting, and exclude most synthetic chemicals. Under organic cropping
systems, the fundamental components and natural processes of ecosystems—such as soil
organism activities, nutrient cycling, and species distribution and competition—are used as farm
management tools (Greene and Kremen). For example, crops are rotated, food and shelter are
provided for the predators and parasites of crop pests, animal manure and crop residues are
recycled, and planting/harvesting dates are carefully managed.
Crop acres under certified organic systems have grown rapidly during the past decade. Organic
crop acres were more than 4 times higher in 2008 than in 1995, as acreage increased from
638,500 to over 2.6 million acres (USDA, Economic Research Service, a.). A large part of this
growth was in major U.S. field crops, corn, soybeans, and wheat. Certified organic production
of corn, soybeans, and wheat increased from about 200,000 acres in 1995 to about 736,000 acres
in 2008. Sustained higher prices for conventional corn, soybean, and wheat since 2008 (NASS,
Agricultural Prices) may have limited organic acreage in more recent years.
Despite the interest in organic field crop production there is little information about the relative
costs and returns of organic and conventional production systems, and the characteristics of
farms that are choosing the organic approach. Several researchers (e.g., Delate et al.; Mahoney
et al.; Hanson et al.; Pimentel et al.; Smith et al) have examined organic crop production in a
long-term experimental setting, but little has been reported about the commercial production of
2
organic field crops (McBride and Greene). This area of research utilizes farm survey data from
U.S. corn, soybean, and wheat production in a comparison of conventional and organic systems.
One objective is to describe characteristics of farms adopting the organic production approach.
Another objective is to describe and contrast the costs of production for each system, using these
costs to indicate price premiums that make organic systems competitive with conventional
systems.
Data from targeted samples of organic field crop producers, as part of USDA’s annual
Agricultural Resource Management Survey (ARMS), support this area of research. Organic
samples of soybeans (2006), wheat (2009), and corn (2010), along with corresponding
conventional samples, have been collected in the ARMS. This report describes the case of
organic versus conventional wheat production. Treatment-effect models were specified to isolate
the impact of choosing the organic approach on various levels of wheat production costs. This
technique corrects for sample-selection bias and allows for an unbiased estimate of the impact
that choice of the organic approach has on wheat production costs.
Experimental Trials
Much of what is known about organic cropping systems stems from multidisciplinary research
conducted with long-term experimental trials that compare the agronomic, economic, and
sometimes environmental performance of organic and conventional systems. The identical
weather and soil conditions under which field experiments are conducted provide opportunities
not possible with on-farm studies, such as replication, precise field measurements, and long-term
comparisons. In these types of studies, descriptive and analytical data are collected on crop
3
yields and management practices, and the productivity, economic viability, and in some cases the
potential environmental impacts of different farming systems are statistically assessed.
Results of an economic analysis of organic cropping systems using data from 1999-2001 were
reported from the Neely-Kinyon Long-Term Agroecological Research site in Iowa (Delate et
al.). This study compares a conventional corn-soybean rotation with organic rotations that
include corn, soybeans, oats, and alfalfa. Both corn and soybean production costs are
significantly higher in the conventional system compared with the organic systems mainly due to
higher costs of chemical versus mechanical weed control, while crop yields are much the same.
Results indicate that returns to corn and soybean production are significantly higher under the
organic systems. Returns to land, labor, and management are higher with the organic rotations
regardless of whether an organic price premium is received. Sensitivity analysis of labor charges
reveal that organic systems have higher returns even when labor is valued at $50 per hour.
Data from 22 years of experiments from the Rodale Institute Farming Systems Trial in
Pennsylvania were used to compare conventional, organic animal, and organic legume systems
(Pimentel et al.). Crop yields are similar with each system during normal years, but are higher
for two organic systems under drought conditions. Energy input use, including fuels for farm
machinery, fertilizers, seeds, and herbicides, is about 30 percent less under the organic systems.
Net returns to the organic rotations, without price premiums, are similar to those for conventional
rotations during typical years, but are less when the costs of transition years are included.
However, the organic price premium required to equalize returns is only 10 percent above the
conventional price, much lower than normal price premiums for organic grains.
4
Long-term cropping system data during 1990-99 were used to examine the relative profitability
of organic cropping systems in southwestern Minnesota (Mahoney et al.). The research
examines various corn, soybean, oats, and alfalfa rotations and finds that even though crop yields
are lower under the organic input strategy, so too are production costs in comparison with
conventional strategies. As a result, the organic input strategy provides net returns that are not
statistically different from those of conventional strategies without any organic price premium,
and are significantly higher when historical organic price premiums are paid.
A similar analysis of organic and conventional crop rotations in the northern Great Plains of
Canada was conducted with data from 1997-2000 (Smith et al). Wheat, barley, peas, and forage
crops are part of the rotations. Some organic cropping systems are found to be more profitable
than conventional systems, but this is conditional on the price premium and cropping system.
Also, there is as much variation in net returns within organic and conventional systems as
between the two. When costs of transition are taken into account, organic rotations have higher
returns relative to many conventional rotations with price premiums at their most likely level, but
require higher premiums to compete with the most profitable conventional rotations.
Data from long-term field trials covering 1982-1995 in southeastern Pennsylvania were used to
evaluate the net returns to organic and conventional rotations using corn, wheat, soybeans, and
forages (Hansen et al.). Annual returns to organic rotations compare favorably with those of
conventional rotations after the transition period, but high transition costs may not justify the use
of organic systems in some cases. The organic rotations require much more family labor than

5
conventional rotations. This could hinder organic adoption among farmers who primarily work
off-farm because of the high opportunity cost of switching to organic farming that would result
from foregone wages and benefits.
Long-term agricultural experiments are leading to an improved understanding of the main
biophysical and economic processes associated with different farming systems, addressing basic
research questions about yields, profitability, and environmental impacts. In most of the
situations studied, organic cropping systems generate economic returns equal to or greater than
those of conventional systems, and sometimes much greater returns. Despite this progress,
comparisons between conventional and organic cropping systems are problematic mainly
because the latter employ unique approaches to nutrient availability, pest control, and soil
management that are profoundly different and may not be easily employed outside of the
experimental setting. These experiments also leave out the ―human factor‖ – that valuable
system of local knowledge and expertise that every farmer acquires through on-farm experience
that plays a crucial role in organic farming. Our area of research enhances the long-term
experimental trial literature by reporting on actual farmer experience with organic systems.
Data
Data used in this study come from farm operator reports made to USDA’s 2009 Agricultural
Resource Management Survey (ARMS) administered by the National Agricultural Statistics
Service and Economic Research Service. The ARMS data include detailed farm financial
information, such as farm income, expenses, assets, and debt, as well as farm and operator
characteristics. This study uses a version of the 2009 ARMS that includes detailed information
6
about the production practices and costs of U.S. wheat production. The wheat version targeted
wheat producers in states that included over 90 percent of U.S. planted wheat acreage in 2009.
USDA has targeted organic producers of field crops in commodity versions of the ARMS in
2006 (soybeans), 2009 (wheat), and 2010 (corn). Each ARMS commodity version included a
sub-sample targeting organic acreage of each crop. Of the total 2009 wheat sample of 3,699
farms, 483 samples targeted organic operations. After accounting for out of business operations,
survey refusals, and questionnaires with incomplete data, 1,339 conventional wheat farms and
182 organic wheat farms from CO, ID, IL, KS, MI, MN, MO, NE, ND, OH, OK, OR, SD, TX,
AND WA were used in this study. Farm survey weights on the ARMS data ensure that samples
expand to represent the appropriate crop acreage in the surveyed states, and that organic
operations represent their correct proportion of the target population despite their
disproportionate share of the sample.
Costs of organic and conventional wheat production are computed according to procedures used
by USDA (USDA, Economic Research Service, b) and endorsed by the American Agricultural
Economics Association. Costs are computed per bushel and divided into three categories:
operating costs, operating plus capital costs, and total economic costs. Operating costs include
costs for seed; fertilizer; chemicals; custom operations; fuel, lubrication, and electricity; repairs;
purchased irrigation water; hired labor; and operating interest. Capital costs include the
annualized cost of maintaining the capital (economic depreciation and interest) used in wheat
production, and costs for non-real estate property taxes and insurance. Total economic costs are
7
the sum of operating and capital costs, plus opportunity costs for land and unpaid labor, and
allocated costs for general farm overhead items.
Total operating costs is an indicator of the relative success of operations in terms of their ability
to meet short-term financial obligations. The sum of operating and capital costs provides an
indicator of whether operations can replace capital assets as needed and stay in business over
time. Other costs are primarily opportunity costs of owned resources (land and labor) that may
or may not influence production decisions. Opportunity costs of owned resources may vary
significantly among producers and producers may be willing to accept returns to these resources
different from assumed charges. Lifestyle preferences and costs of switching occupations,
among other factors, affect producers’ perceptions of their opportunity costs.
Survey Results
A summary of the 2009 ARMS data of wheat producers indicates that organic wheat production
was conducted on farms similar in size to conventional producers, but with less wheat acreage.
Conventional wheat producers harvested an average of 405 wheat acres as part of 1,641 total
farm acres, compared to 258 wheat acres on 1,469 total farm acres by organic wheat producers
(table 1). Operator characteristics, including operator age and education were statistically
different between organic and conventional wheat producers. Organic wheat producers were
younger, with a higher percentage less than 50 years old (33 versus 22 percent). Also, a higher
proportion of organic producers, 73 percent, had attended college, compared with 60 percent of
conventional wheat producers. Among wheat regions, conventional farms made up a
significantly larger percent of wheat farms in the Southern Plains (KS, OK, and TX) region than

8
did organic farms. Organic wheat farms were largely in the Northern Plains (CO, MT, NE, ND,
and SD) region (42 percent), but the percent of organic farms in the Northern Plains, Corn Belt
(IL, MI, MN, MO, and OH), and Northwest (ID, OR, and WA) was not statistically different
than the percent of conventional farms in each region..
Organic production practices varied from those used for conventional wheat. Most conventional
producers planted wheat in rotation with row crops, particularly corn and soybeans (54 percent).
Organic producers often used an idle year and other crops in rotation with wheat. Organic
producers more often controlled weeds by using intensive tillage practices with 30 percent using
a moldboard plow, compared with only 5 percent of conventional wheat producers. A third of
conventional producers used a no-till planter to sow wheat and relied on chemical weed control.
Only 14 percent of organic wheat growers used a no-till planter. Commercial fertilizers were
applied by more than 80 percent of conventional wheat producers, while about a third of organic
producers applied manure or compost.
Average costs per acre of producing wheat were not significantly different between conventional
and organic producers, but the composition of operating costs was very different (table 2).
Conventional wheat growers had significantly higher fertilizer and chemical costs than organic
growers, but lower costs for seed, fuel, and repairs as organic producers substituted these inputs
for fertilizers and chemicals. Total operating costs and operating plus capital costs per acre for
organic wheat were about $20 per acre lower than for conventional wheat, but were not
significantly different because of substantial variation in organic wheat production costs1.
1 The coefficient of variation (CV) on the estimates of organic wheat operating, and operating plus capital costs was
29 and 13 percent, respectively, compared to CVs less than 2 percent for conventional wheat cost estimates.

9
Organic wheat producers had an average yield of 30 bushels per acre in 2009, compared with 44
bushels for conventional producers (table 2). With lower yields, average operating costs per
bushel of organic wheat production were 45 cents higher, operating plus capital costs were $1.43
per bushel higher, and total economic costs were $3.04 per bushel higher than for conventional
wheat. The average price reportedly received for organic wheat in 2009 was $9.30 per bushel2,
compared with a harvest-period price of $5.51 per bushel for conventional wheat. With an
average organic price premium of $3.79 per bushel in 2009, average returns above all costs were
higher for organic wheat than for conventional wheat production in 2009.
Organic wheat producers report that they had been producing organic wheat for an average of 10
years as of 2009, and reported an average of 81 total hours used for organic wheat certification,
or about 2.5 hours per acre. About half of organic wheat producers reported all of the above in
response to a list of reasons for producing organic wheat3. Increasing income was the most
commonly reported single reason for producing organic wheat, reported by 30 percent of
producers. Forty percent of organic wheat producers reported that controlling weeds was the
most difficult aspect of organic wheat production, followed by achieving yields (17 percent) and
certification paperwork (16 percent).
Empirical Procedure
2 Organic food grade wheat comprised 89 percent of organic wheat sales and received higher prices than feed grade
wheat. The average price received for organic food grade wheat was $9.77 per bushel compared with $7.33 per
bushel for organic feed grade wheat. Production cost differences between organic food and feed grade wheat were
not statistically significant. 3 The list included the options of protecting health, more environmentally friendly, increasing income, some other
reason, and all of the above.

10
Identical weather and soil conditions and field management practices under which cropping
system experiments provide precise field measurements are not possible using producer survey
data. When using producer survey data to measure cost differences between cropping systems,
other factors that affect costs should be addressed. A simple comparison of the mean difference
between conventional and organic production costs can be misleading because other differences,
such as in farm size, location, technologies, input quality, and management, may also influence
cost levels. To isolate the effect that choice of the organic approach has on production costs, a
treatment-effect model is employed (Greene).
The model accounts for observable differences between organic and conventional production
using the detailed ARMS data. Unobservable differences are addressed by assuming a joint
normal distribution between the errors of a selection equation (choice of the organic approach or
not) and treatment equations (measures of production costs). This technique corrects for sample-
selection bias and allows for an unbiased estimate of the impact that choice of the organic
approach has on production costs. For example, differences in input quality and management are
not observable but may be correlated with both the choice between organic and conventional
production and the level of production costs.
Applying the treatment-effect model, the decision to chose the organic approach or not can be
expressed with the latent variable *
iO indicating the net benefit from using this approach
compared to not using, so that:
(1) iii uZO* ; where 1iO if 0*
iO , 0 otherwise,

11
where iZ is a vector of operator, farm, and regional characteristics. If the latent variable is
positive, then the variable indicating organic production iO equals one, and equals zero
otherwise. A measure of the impact of the organic approach on production costs iy can be
expressed by:
(2) iiii OXy
where iX is a vector of operator, farm, and regional characteristics.
Equation (2) cannot be estimated directly because the decision to choose the organic approach
may be determined by unobservable variables that may also affect production costs. If this is the
case, the error terms in equations (1) and (2) will be correlated, resulting in a biased estimate of
. This selection bias can be accounted for by assuming a joint normal error distribution with
the following form:
2
1,
0
0~ N
u
and by recognizing that the expected cost of choosing the organic approach is given by:
(3) iiii XOyE 1
where i is the inverse Mills ratio. To derive an unbiased estimate of , the two-stage approach
begins with a probit estimation of equation (1). In the second stage, estimates of are used to
compute the inverse Mills ratio, which is included as an additional term in a least-squares
estimation of equation (2). This two-stage Heckman procedure is consistent, albeit not efficient.
Efficient maximum likelihood parameter estimates can be obtained by maximizing:

12
1 0
**
0
0
** ,,,;,,,,;,,,,ii A
ii
A
ii dydAyAfdydAyAfL
where ,,,;,*
ii yAf is the joint normal density function, which is a function of the
parameters. In practice, the negative of the log of the likelihood function is minimized using the
estimates from the Heckman procedure as starting values.
The model is specified using the three levels of production costs as the dependent variables:
operating costs, operating plus capital costs, and total economic costs. The ARMS provides data
on a variety of operator, farm structural and financial, and enterprise characteristics that are used
as independent variables. Once estimated, the difference in costs between organic and
conventional systems is determined by (Greene):
(4) )1(
01ii
i
iiii OyEOyE
where φ is the standard normal density function and Φ is the standard normal cumulative
distribution function evaluated using the selection equation estimates.
Model Results
Estimates for a binomial probit model of choice of the organic approach by wheat producers are
shown in table 3. These estimates are nearly identical to those in the selection equations
estimated in the treatment-effect models and are shown in their stead for brevity. A coefficient
estimated for a farm operator education variable is statistically significant. Operator education is
specified using discrete categories with graduated from high school as the omitted group. The
results indicate that farm operators who had attended college were more likely to choose the
organic approach than high school graduates that had not attended college. Also, farm

13
operations with a livestock enterprise were more likely to choose organic wheat production than
others. Livestock provide a source of organic fertilizer, manure, for organic wheat.
Size of operation and location also play a role in choice of the organic approach. As operated
farm acreage increases, the likelihood of choosing the organic approach for wheat declines (at a
decreasing rate). This may be due to the additional labor requirement of organic production, but
also to the potentially higher returns per acre available to smaller farmers from producing a
higher-valued crop. Location in the Northern Plains States (CO, MT, NE, ND, and SD) and
Northwest States (ID, OR, and WA), relative to the Southern Plains (KS, OK, and TX) is also
associated with the adoption of organic wheat, possibly due to less weed pressure which
facilitates organic production in the areas further north.
Coefficients on farm operator characteristic variables are not statistically significant in any of the
treatment-effect models of wheat production costs, but those for farm location are significant
(table 4). Specifying the Southern Plains as the reference group, coefficients on variables for
location in the Northern Plains and Northwest indicate that wheat operating, operating plus
capital, and total economic costs per bushel are all lower in these regions. Operating plus
capital, and total economic costs per bushel are lower in the Corn Belt (IL, MI, MN, and OH)
than in the Southern Plains. Higher wheat yields in the Corn Belt and Northwest, compared with
the Southern Plains, contribute to lower unit costs in these regions4. Economies of size were
indicated only for total economic costs. Total economic costs per bushel for wheat decline as
size, measured as the number of wheat acres, increases.
4 Average wheat yields in 2009 were 58 and 69 bushels per acre in the Corn Belt and Northwest, respectively, and
45 and 42 bushels per acre in the Northern Plains and Southern Plains, respectively.
14
Few of the specified production practices have a statistically significant effect on wheat
production costs. Crop rotations are specified with idle land as the deleted group. The only
statistically significant rotation variable was that for monoculture wheat, which has higher
operating plus capital, and total economic costs than for the rotation including an idle year.
Also, using purchased seed instead of homegrown seed was associated with higher costs, while
the use of commercial fertilizer was associated with higher operating costs.
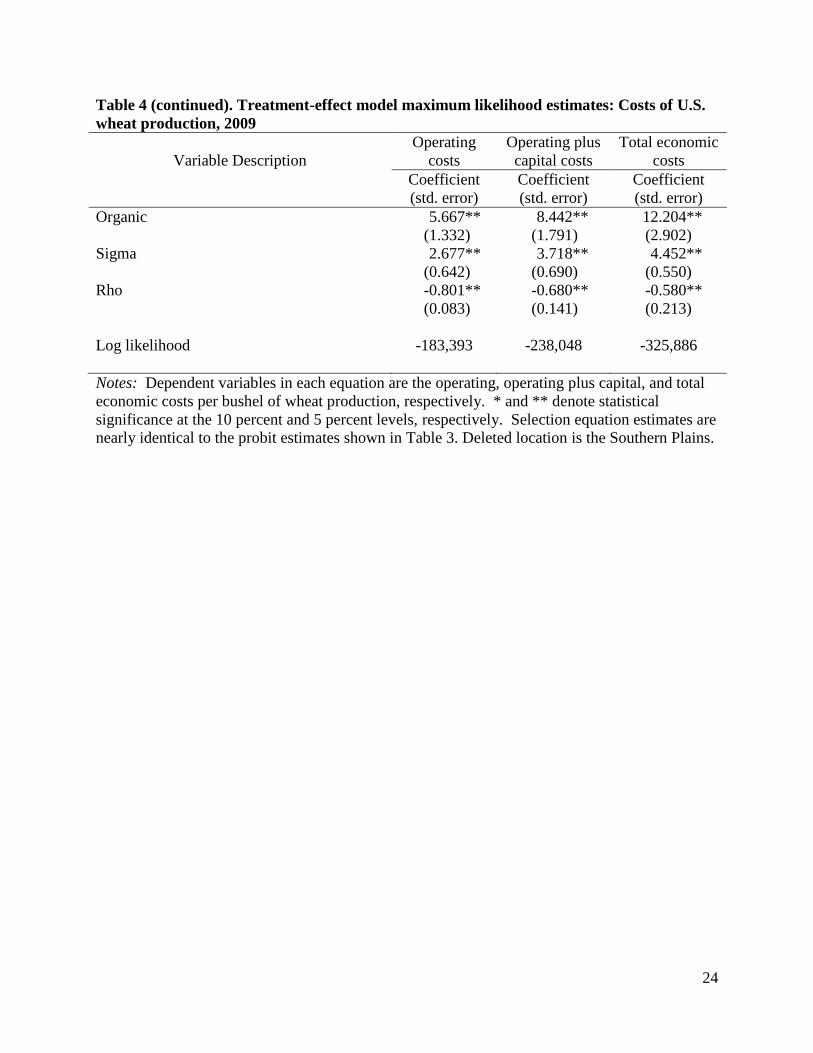
The estimated coefficients in table 4 on the variable for organic wheat production, and for sigma
and rho are used in equation (4) to estimate the difference in costs between organic and
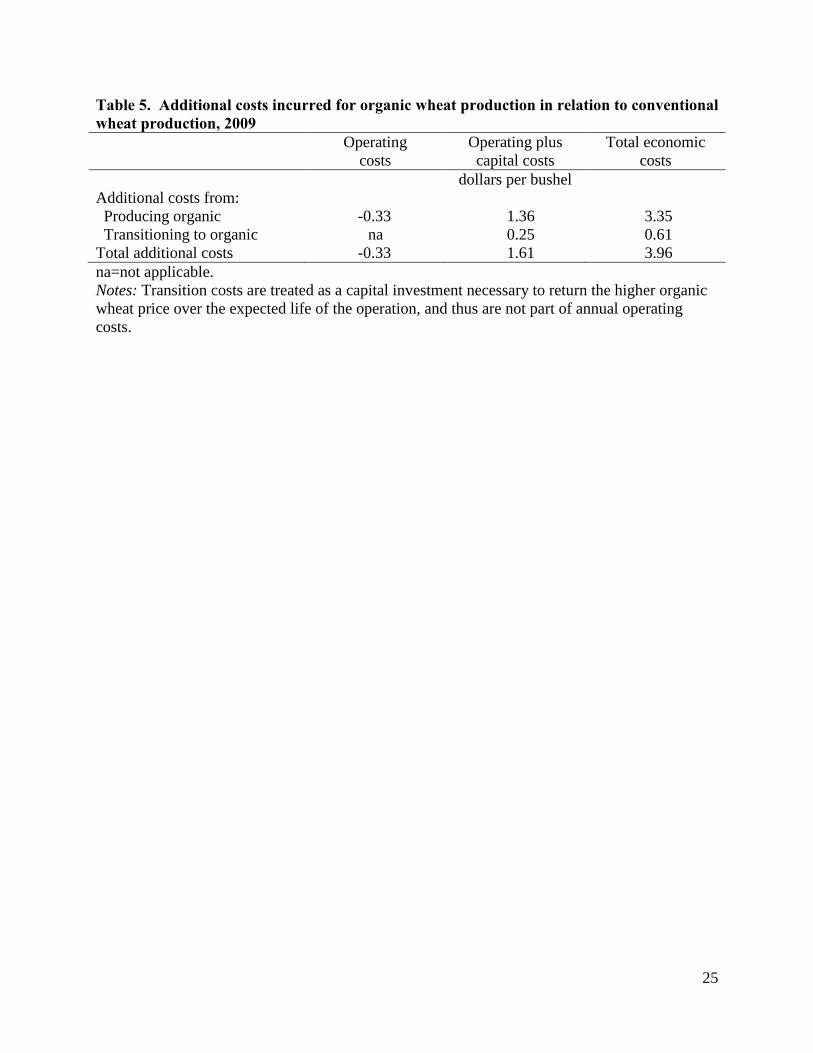
conventional wheat production. The results indicate that operating costs for organic wheat
production are $0.33 per bushel lower than for conventional wheat production. Operating plus
capital ownership costs are $1.36 per bushel higher, and total economic costs are $3.35 per
bushel higher in 2009, after accounting for the influence of other factors on production costs and
sample selection bias (table 5).
The estimated correlation of errors for the selection and cost equations, rho, is statistically
significant in all wheat production cost models. This is an indicator that self-selection bias was
present in the data. The negative coefficients on rho in each model indicate a negative selection
bias, meaning that the cost difference between organic and conventional wheat production would
have been overstated without the correction. Least squares estimates of the models show higher
costs of organic compared with and conventional wheat production of $1.00, $2.50, and $4.55
15
per bushel, respectively for operating, operating plus capital, and total economic costs. This
implies that the estimated selection bias is $1.33, $1.14, and $1.30 per bushel, respectively.
Transition Costs
The estimated cost differences indicate the additional costs incurred by operations producing
organic wheat relative to conventional wheat, but do not include the costs associated with the
transition to organic production. Before an operation is certified to sell organic wheat the
cropland must be managed organically for a minimum of 36 months. This means that operations
must undergo 3 years of higher costs before selling wheat as certified organic.
Higher costs for 3 years can be considered an investment necessary to return higher wheat prices
over the expected life of the operation. The investment is determined by the estimated additional
costs incurred by organic operations from the treatment-effect models for each year of the 3-year
transition period. The annualized cost of this investment is computed using the capital recovery
approach like the other capital costs. The investment is spread over an expected life of 20 years.
The estimated transition costs and total additional costs on organic operations are shown in table
5. Transition costs are $0.25 per bushel for operating plus capital costs and $0.61 per bushel for
total economic costs. Thus, the total estimated additional costs for producing organic relative to
conventional wheat are -$0.33 per bushel for operating costs, $1.61 per bushel for operating plus
capital costs, and $3.96 per bushel for total economic costs.
Conclusions

16
This study takes advantage of unique and detailed data collected in an economic survey of U.S.
wheat producers for the 2009 crop year. The data is unique in that it includes a targeted survey
of organic producers sampled at a much higher rate than their occurrence in the population. This
allows for a statistical analysis of differences between conventional and organic crop production
systems.
Size of operation is found to be one of the primary factors determining the likelihood of an
operation using the organic approach. Because of economies of size, small farms likely view the
organic approach as among the few alternatives to reorganize current resources to improve farm
returns. Larger farms likely have less incentive to consider alternatives because of economies of
size. Also, significant labor requirements associated with organic crop production may make
organic production less practical on larger farms due to the need to hire additional labor, while
the labor requirements on smaller farms are often meet by operator and other unpaid sources.
Results of the analysis in this study indicate that the average operating costs for producing
organic compared with conventional wheat are $0.33 per bushel lower, operating plus capital
costs are $1.61 per bushel higher, and total economic costs are $3.96 per bushel higher, after
accounting for the influence of other factors on production costs, sample selection bias, and
organic transition costs. These higher costs compare to an average price premium of $3.79 per
bushel for organic wheat in 2009. This suggests that organic wheat producers, on average when
compared to conventional producers, earned higher returns above operating costs of $4.12 per
bushel, and higher returns above operating plus capital costs of $2.18 per bushel in 2009. Total

17
economic costs of organic production were $0.17 per bushel higher than the organic wheat price
premium in 2009.
Previous research, based on long-term cropping system data, suggests that significant returns are
possible from organic wheat production. However, these returns are often the result of obtaining
similar conventional and organic yields and lower organic production costs. Findings of this
study show organic wheat yields to be much lower and organic production costs to be about the
same or somewhat higher than for conventional wheat. A reason for the yield differences
observed in the ARMS data may be the unique problems presented from implementing organic
systems outside of the experimental setting, such as achieving effective weed control. The main
reason that organic wheat returns above operating plus capital costs are higher in the analysis of
the 2009 ARMS data is not from higher yields, but rather from the price premiums paid for
organic wheat.
The negative self-selection bias found by the analysis in this study indicates that the cost
difference between organic and conventional wheat would have been overstated without the bias
correction. This means that unmeasured factors correlated with the selection and cost of organic
wheat production, result in higher wheat production costs. Two factors important to the costs
and yields of crop producers are land quality and producer management, both difficult to
measure. If organic wheat is more often planted on lower quality land than conventional wheat,
land quality differences would contribute to their cost difference. Also, producer management of
organic wheat may not be as refined as that for conventional wheat, adding to the difference in
production costs.

18
While results of this study provide insight about the returns to organic wheat production, the
findings are based only on a single year of data. The production of organic wheat, in contrast to
conventional wheat, is most often part of a multi-year rotation of crop enterprises and idled land.
Organic wheat producers may rotate with less profitable enterprises, lowering overall cropping
system returns, or the synergism associated with the management of multiple crop enterprises
may result in greater returns than indicated by this single-enterprise analysis. A more thorough
study of the economic returns to organic systems would account for the inherent multi-year
nature of organic cropping systems.

19
References
American Agricultural Economics Association. 2000. Commodity costs and returns estimation
handbook. A Report of the AAEA Task Force on Commodity Costs and Returns. Ames, Iowa.
Delate, K. M. Duffy, C. Chase, A. Holste, H. Friedrich, and N. Wantate. 2003. ―An Economic
Comparison of Organic and Conventional Grain Crops in a Long-Term Agroecological Research
(LTAR) site in Iowa. The American Journal of Alternative Agriculture. 18(2):59-69.
Greene, C. and A. Kremen. ―U.S. Organic Farming in 2000-2001.‖ U.S. Dept. of Agriculture,
Economic Research Service, Agricultural Information Bulletin Number 780, February 2003.
Greene, W. H. Econometric Analysis, 5th
edn. New Jersey: Prentice Hall. 2003.
Hanson, J.C., E. Lichtenberg, and S. E. Peters. 1997. ―Organic Versus Conventional Grain
Production in the Mid-Atlantic: An Economic and Farming System Overview.‖ The American
Journal of Alternative Agriculture. 12(1):2-9.
Mahoney, P.R., K.D. Olson, P.M. Porter, D.R. Huggins, C. A. Perillo, and R. K. Crookston.
2004. ―Profitability of Organic Cropping Systems in Southwestern Minnesota.‖ Renewable
Agriculture and Food Systems. 19(1):35-46.
McBride, W.D. and C. Greene. 2009. ―The Profitability of Organic Soybean Production.‖
Renewable Agriculture and Food Systems. 24(4):276-284.
Pimentel, D., P. Hepperly, J. Hanson, D. Doubs, and R. Seidel. 2005. ―Environmental, Energetic,
and Economic Comparisons of Organic and Conventional Farming Systems.‖ BioScience.
55(7):573-582.
Smith, E. G., J.M. Clapperton, and R.E. Blackshaw. 2004. ―Profitability and Risk of Organic
Production Systems in the Northern Great Plains.‖ Renewable Agriculture and Food Systems.
19(3):152-158.
U.S. Dept. of Agriculture, Economic Research Service. a. Organic Production.
http://www.ers.usda.gov/Data/Organic/. <accessed January 3, 2012>.
U.S. Dept. of Agriculture, Economic Research Service. b. Commodity Costs and Returns.
http://www.ers.usda.gov/Data/CostsAndReturns/. <accessed January 3, 2012.>.
U.S. Dept. of Agriculture, National Agricultural Statistics Service. Agricultural Prices.
http://usda.mannlib.cornell.edu/MannUsda/viewDocumentInfo.do?documentID=100.
<accessed January 3, 2012.>.

20
Table 1. Test of equality of means on characteristics and practices of conventional and
organic U.S. wheat farms, 2009
Item
Type of farm
Conventional Organic t-stat
Farm Characteristics:
Harvested wheat acres (per farm) 405 258 3.19
Farm acres operated (per farm) 1,641 1,458 0.92
Farm operator
Off-farm occupation (percent of farms) 16 22 1.62
Age (years) 58 55 1.52
Less than 50 years (percent of farms) 22 33 1.95
Education (percent of farms)
Less than high school 4 3 0.29
Completed high school 37 24 1.94
Attended college 60 73 1.91
Region (percent of farms)
Corn Belt 34 27 1.32
Northern Plains 34 42 0.97
Southern Plains 28 12 5.53
Northwest 3 19 1.40
Wheat Production Practices:
Seed (percent of farms)
Homegrown 45 50 0.59
Purchased 55 50 0.59
Crop rotation (percent of farms)
Monoculture 3 1 3.28
Row crops and small grains 54 40 1.93
Idle year 36 37 0.10
Other crop 8 22 0.99
Field Operations (percent of farms)
Moldboard plow 5 30 2.99
No-till planter 36 14 6.22
Other practices (percent of farms)
Irrigation 3 21 1.54
Applied commercial fertilizer 84 17 4.39
Applied manure or compost 6 37 2.50
Number of observations 1,339 182
Notes: Statistical significance in test of equality of means is indicated by t-statistics greater than
1.96 and 1.65 at the 5 and 10 percent levels, respectively. na=not applicable. States in each
region are: Corn Belt, IL, MI, MN, and OH; Northern Plains, CO, MT, NE, ND, and SD;
Southern Plains, KS, OK, and TX; Northwest, ID, OR, and WA.
Source: 2006 Agricultural Resource Management Survey, USDA National Agricultural Statistics
Service and Economic Research Service.

21
Table 2. Test of equality of means on production costs and returns of conventional and
organic U.S. wheat farms, 2009
Item
Type of farm
Conventional Organic t-stat
dollars per planted acre
Gross value of production 244.12 289.56 0.82
Operating costs:
Seed 14.19 20.28 7.60
Fertilizer 45.54 8.12 7.54
Chemicals 15.53 0.06 21.05
Custom operations 8.63 7.88 0.13
Fuel, lubrication, and electricity 11.40 15.75 3.00
Repairs 19.44 22.43 2.96
Purchased irrigation water 0.32 3.62 0.34
Hired labor 1.88 11.49 0.77
Other costs 0.49 4.14 1.14
Operating capital 0.17 0.14 0.88
Capital ownership costs:
Capital recovery 75.39 79.45 1.17
Taxes and Insurance 5.98 5.73 0.31
Other costs:
Opportunity cost of unpaid labor 16.50 20.93 1.04
Opportunity cost of land 43.34 56.77 0.63
General farm overhead 10.17 18.90 0.92
Cost summary:
Operating costs 117.59 93.90 0.88
Operating plus capital costs 198.95 179.08 0.80
Total economic costs 268.96 275.67 0.13
Value of production less:
Operating costs 130.53 195.66 2.58
Operating plus capital costs 49.16 110.48 2.27
Total economic costs -20.84 13.89 2.53
Cost summary: dollars per bushel
Operating costs 2.65 3.10 1.54
Operating plus capital costs 4.49 5.92 2.22
Total economic costs 6.07 9.11 4.52
Yield (bushels per planted acre) 44.31 30.26 2.02
Price (dollars per bushel) 5.51 9.30 5.52
Notes: Statistical significance in test of equality of means is indicated by t-statistics greater than
1.96 and 1.65 at the 5 and 10 percent levels, respectively. na=not applicable.
Source: 2009 Agricultural Resource Management Survey, USDA National Agricultural Statistics
Service and Economic Research Service.

22
Table 3. Binomial probit maximum likelihood estimates: Choice of the organic production
approach by U.S. wheat producers, 2009
Variable Description
Coefficient
Standard
Error
Constant -2.7977** 0.2156
Size (100 acres operated) -0.0094** 0.0035
Size squared 2.72e-5** 8.47e-6
Age class (less than 50 years) 0.0312 0.1234
Age class (more than 65 years) -0.1873 0.1343
Education class (less than high school) 0.0642 0.2054
Education class (attended college) 0.2113** 0.1014
Primary occupation is off-farm 0.0321 0.2004
Livestock operation on farm 0.2885** 0.1261
Location in Corn Belt 0.2063 0.1641
Location in Northern Plains 0.4016** 0.1655
Location in Northwest 1.0616** 0.3202
Log likelihood -3,776.5552
Pseudo R2 0.0692
Notes: Dependent variable in the probit equation is whether the farm produced organic wheat
(0,1). * and ** denote statistical significance at the 10 percent and 5 percent levels, respectively.
Deleted location is the Southern Plains.

23
Table 4. Treatment-effect model maximum likelihood estimates: Costs of U.S. wheat
production, 2009
Variable Description
Operating
costs
Operating plus
capital costs
Total economic
costs
Coefficient
(std. error)
Coefficient
(std. error)
Coefficient
(std. error)
Constant
3.2929**
(0.009)
7.007**
(2.215)
10.385**
(3.676)
Age (years)
0.121
(0.009)
0.016
(0.011)
0.023
(0.017)
Education (years)
-0.084
(0.087)
-0.178
(0.117)
-0.203
(0.175)
Primary occupation is off-farm
0.320
(0.309)
-0.0247
(0.408)
-0.133
(0.575)
Location in Corn Belt
-1.061
(0.659)
-1.864**
(0.838)
-2.093**
(1.215)
Location in Northern Plains
-1.247**
(0.556)
-1.616**
(0.723)
-2.248**
(1.064)
Location in Northwest
-1.355**
(0.618)
-1.886**
(0.808)
-2.073*
(1.112)
Size (100s of harvested wheat acres)
0.004
(0.016)
0.035
(0.024)
-0.023**
(0.038)
Size squared
1.36e-5
(1.66e-4)
-2.21e-4
(2.49e-4)
2.57e-4
(4.14e-4)
Rotation-monoculture wheat
0.396
(0.262)
1.247**
(0.417)
1.705**
(0.673)
Rotation-wheat and idle
-0.404
(0.355)
0.298
(0.469)
0.642
(0.718)
Rotation-wheat and other crops
1.498
(0.053)
2.016
(1.366)
2.855
(1.771)
Purchased seed
0.663**
(0.268)
0.632*
(0.361)
0.918*
(0.546)
No-till planter
-0.131
(0.198)
-0.322
(0.275)
-0.582
(0.390)
Moldboard plow
-0.575
(0.596)
-0.554
(0.918)
-0.861
(1.222)
Irrigation
0.402
(0.344)
0.253
(0.497)
0.116
(0.794)
Commercial fertilizer
0.782**
(0.210)
0.200
0.445
-0.752
(0.907)
Manure
0.424
(0.328)
0.020
(0.541)
-0.688
(0.822)
--continued--
24
Table 4 (continued). Treatment-effect model maximum likelihood estimates: Costs of U.S.
wheat production, 2009
Variable Description
Operating
costs
Operating plus
capital costs
Total economic
costs
Coefficient
(std. error)
Coefficient
(std. error)
Coefficient
(std. error)
Organic
5.667**
(1.332)
8.442**
(1.791)
12.204**
(2.902)
Sigma
2.677**
(0.642)
3.718**
(0.690)
4.452**
(0.550)
Rho
-0.801**
(0.083)
-0.680**
(0.141)
-0.580**
(0.213)
Log likelihood
-183,393 -238,048 -325,886
Notes: Dependent variables in each equation are the operating, operating plus capital, and total
economic costs per bushel of wheat production, respectively. * and ** denote statistical
significance at the 10 percent and 5 percent levels, respectively. Selection equation estimates are
nearly identical to the probit estimates shown in Table 3. Deleted location is the Southern Plains.
25
Table 5. Additional costs incurred for organic wheat production in relation to conventional
wheat production, 2009
Operating
costs
Operating plus
capital costs
Total economic
costs
dollars per bushel
Additional costs from:
Producing organic -0.33 1.36 3.35
Transitioning to organic na 0.25 0.61
Total additional costs -0.33 1.61 3.96
na=not applicable.
Notes: Transition costs are treated as a capital investment necessary to return the higher organic
wheat price over the expected life of the operation, and thus are not part of annual operating
costs.