Embed Size (px)
Citation preview
The Structure and Function of the
Expressed Portion of the Wheat Genomes
The Structure and Function of the
Expressed Portion of the Wheat Genomes
The long term goal of this project is to decipher the chromosomal location and biological
function of all genes in the wheat genomes.
The Structure and Function of the Expressed Portion of the Wheat Genomes
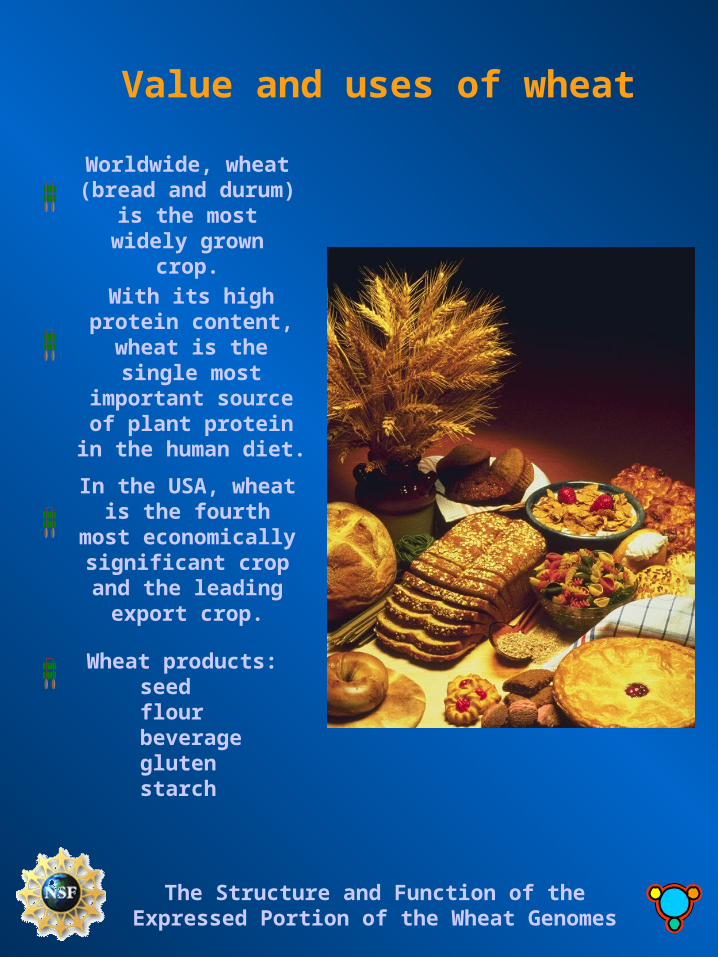
Value and uses of wheat
Worldwide, wheat (bread and durum) is
the most widely grown crop.
With its high protein content, wheat is the
single most important source of plant protein
in the human diet.
In the USA, wheat is the fourth most economically
significant crop and the leading export
crop.
Wheat products: seed
flourbeverageglutenstarch
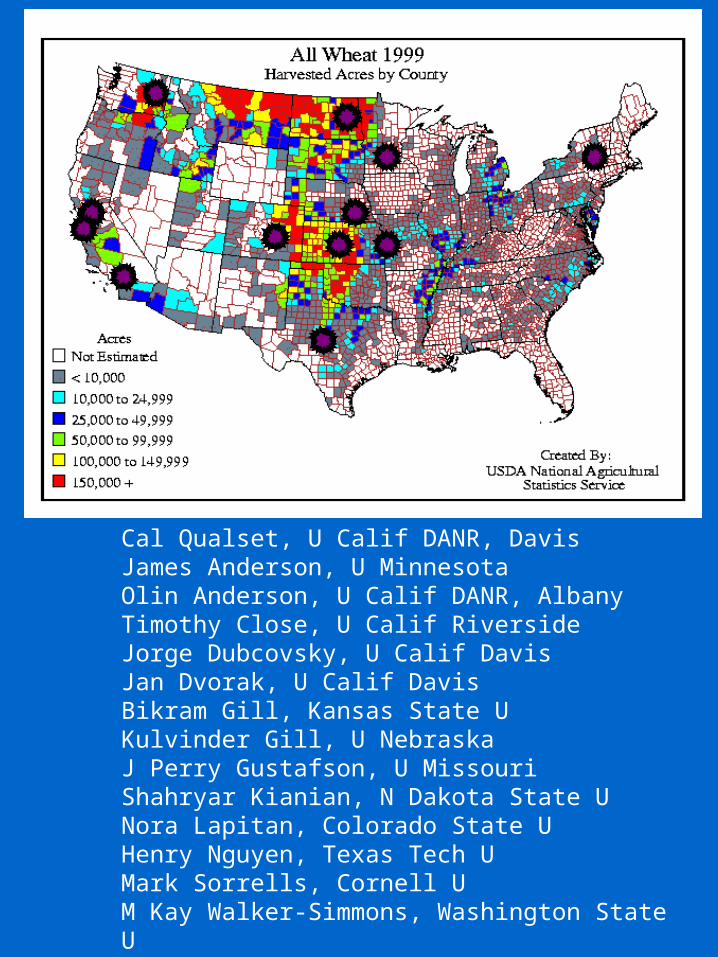
Cal Qualset, U Calif DANR, DavisJames Anderson, U MinnesotaOlin Anderson, U Calif DANR, AlbanyTimothy Close, U Calif RiversideJorge Dubcovsky, U Calif DavisJan Dvorak, U Calif DavisBikram Gill, Kansas State UKulvinder Gill, U NebraskaJ Perry Gustafson, U MissouriShahryar Kianian, N Dakota State UNora Lapitan, Colorado State UHenry Nguyen, Texas Tech UMark Sorrells, Cornell UM Kay Walker-Simmons, Washington State U
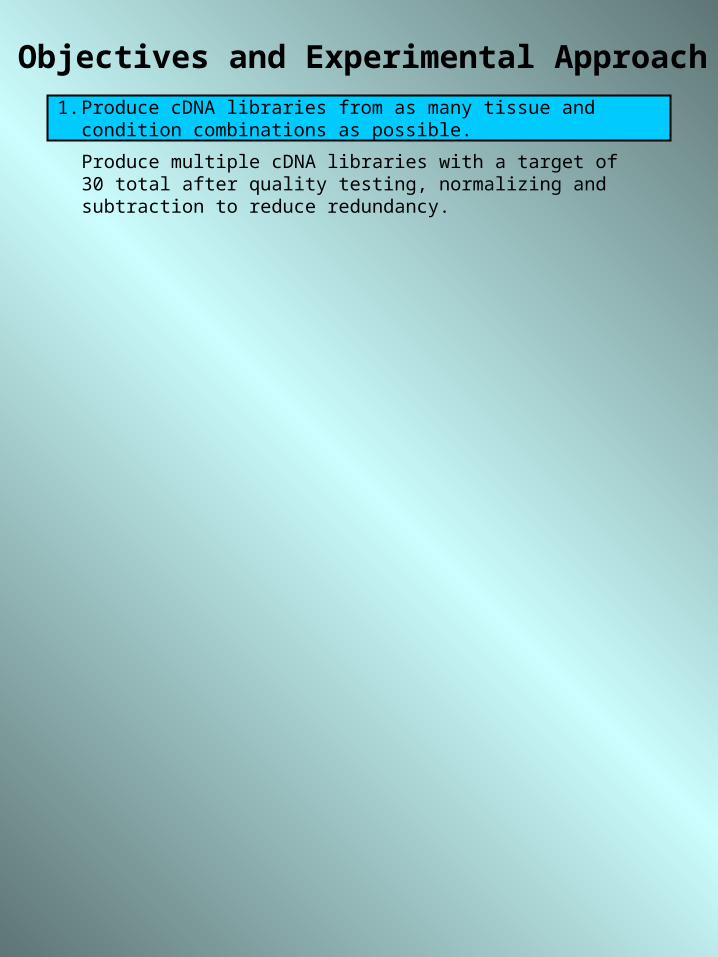
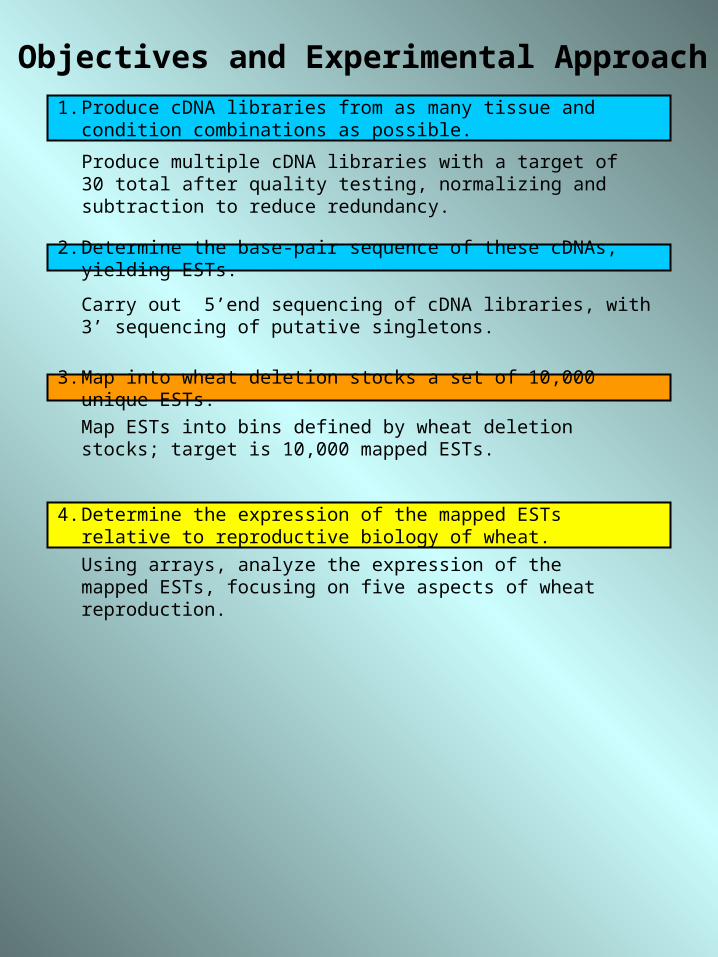
1. Produce cDNA libraries from as many tissue and condition combinations as possible.
Objectives and Experimental Approach
Produce multiple cDNA libraries with a target of 30 total after quality testing, normalizing and subtraction to reduce redundancy.
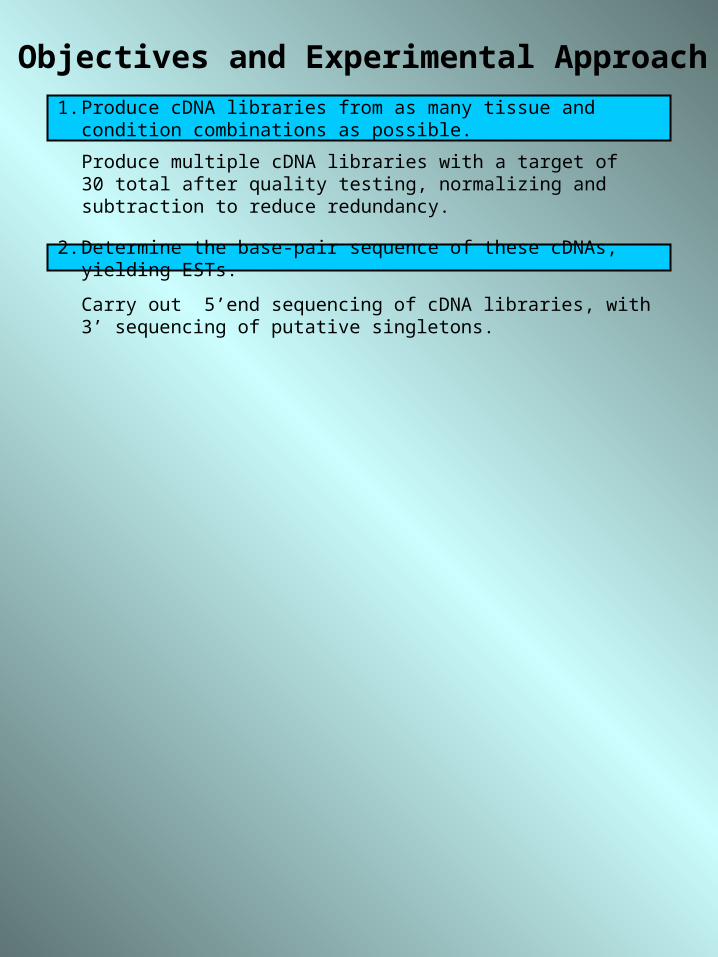
1. Produce cDNA libraries from as many tissue and condition combinations as possible.
Objectives and Experimental Approach
2. Determine the base-pair sequence of these cDNAs, yielding ESTs.
Carry out 5’end sequencing of cDNA libraries, with 3’ sequencing of putative singletons.
Produce multiple cDNA libraries with a target of 30 total after quality testing, normalizing and subtraction to reduce redundancy.
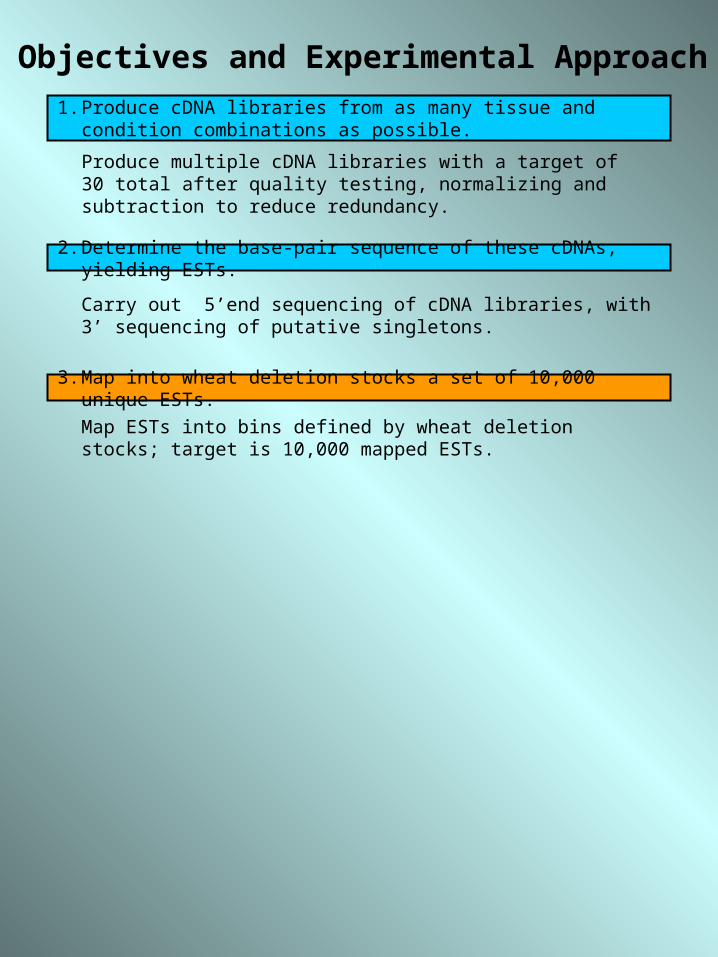
1. Produce cDNA libraries from as many tissue and condition combinations as possible.
Objectives and Experimental Approach
2. Determine the base-pair sequence of these cDNAs, yielding ESTs.
3. Map into wheat deletion stocks a set of 10,000 unique ESTs.
Map ESTs into bins defined by wheat deletion stocks; target is 10,000 mapped ESTs.
Carry out 5’end sequencing of cDNA libraries, with 3’ sequencing of putative singletons.
Produce multiple cDNA libraries with a target of 30 total after quality testing, normalizing and subtraction to reduce redundancy.
1. Produce cDNA libraries from as many tissue and condition combinations as possible.
Objectives and Experimental Approach
2. Determine the base-pair sequence of these cDNAs, yielding ESTs.
3. Map into wheat deletion stocks a set of 10,000 unique ESTs.
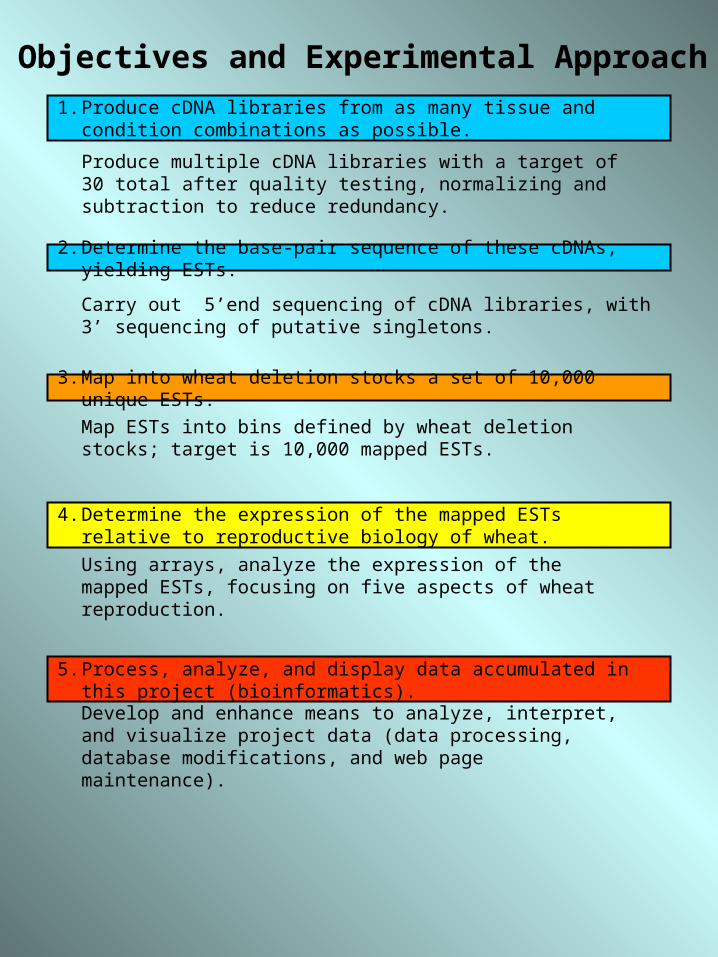
4. Determine the expression of the mapped ESTs relative to reproductive biology of wheat.
Using arrays, analyze the expression of the mapped ESTs, focusing on five aspects of wheat reproduction.
Map ESTs into bins defined by wheat deletion stocks; target is 10,000 mapped ESTs.
Carry out 5’end sequencing of cDNA libraries, with 3’ sequencing of putative singletons.
Produce multiple cDNA libraries with a target of 30 total after quality testing, normalizing and subtraction to reduce redundancy.
1. Produce cDNA libraries from as many tissue and condition combinations as possible.
Objectives and Experimental Approach
2. Determine the base-pair sequence of these cDNAs, yielding ESTs.
3. Map into wheat deletion stocks a set of 10,000 unique ESTs.
4. Determine the expression of the mapped ESTs relative to reproductive biology of wheat.
5. Process, analyze, and display data accumulated in this project (bioinformatics).
Develop and enhance means to analyze, interpret, and visualize project data (data processing, database modifications, and web page maintenance).
Using arrays, analyze the expression of the mapped ESTs, focusing on five aspects of wheat reproduction.
Map ESTs into bins defined by wheat deletion stocks; target is 10,000 mapped ESTs.
Carry out 5’end sequencing of cDNA libraries, with 3’ sequencing of putative singletons.
Produce multiple cDNA libraries with a target of 30 total after quality testing, normalizing and subtraction to reduce redundancy.
1. Produce cDNA libraries from as many tissue and condition combinations as possible.
Objectives and Experimental Approach
2. Determine the base-pair sequence of these cDNAs, yielding ESTs.
3. Map into wheat deletion stocks a set of 10,000 unique ESTs.
4. Determine the expression of the mapped ESTs relative to reproductive biology of wheat.
5. Process, analyze, and display data accumulated in this project (bioinformatics).
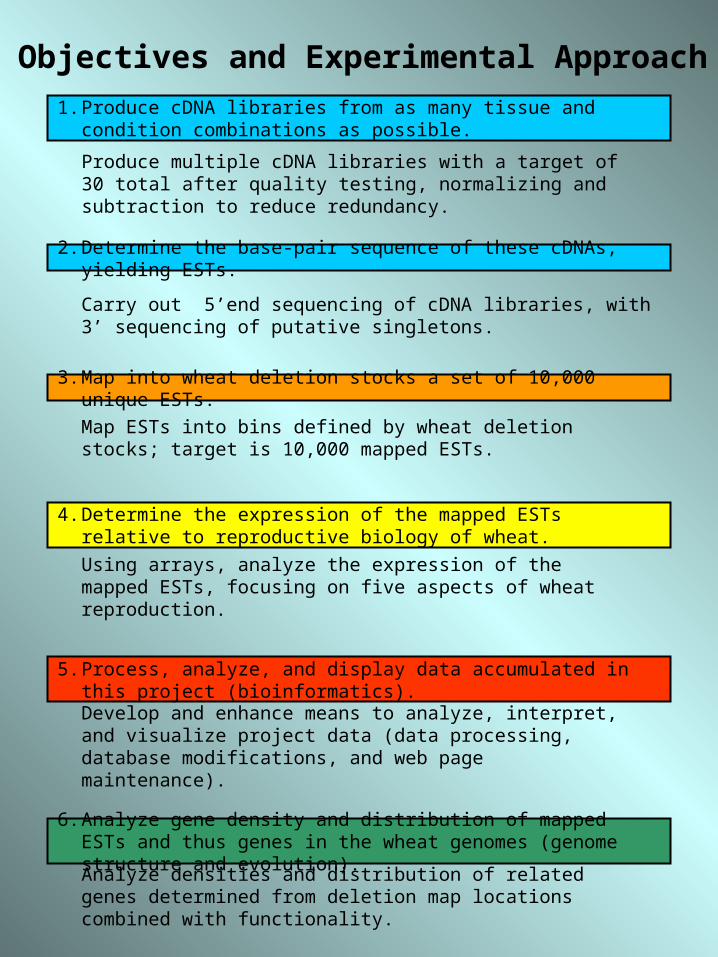
6. Analyze gene density and distribution of mapped ESTs and thus genes in the wheat genomes (genome structure and evolution).
Analyze densities and distribution of related genes determined from deletion map locations combined with functionality.
Develop and enhance means to analyze, interpret, and visualize project data (data processing, database modifications, and web page maintenance).
Using arrays, analyze the expression of the mapped ESTs, focusing on five aspects of wheat reproduction.
Map ESTs into bins defined by wheat deletion stocks; target is 10,000 mapped ESTs.
Carry out 5’end sequencing of cDNA libraries, with 3’ sequencing of putative singletons.
Produce multiple cDNA libraries with a target of 30 total after quality testing, normalizing and subtraction to reduce redundancy.
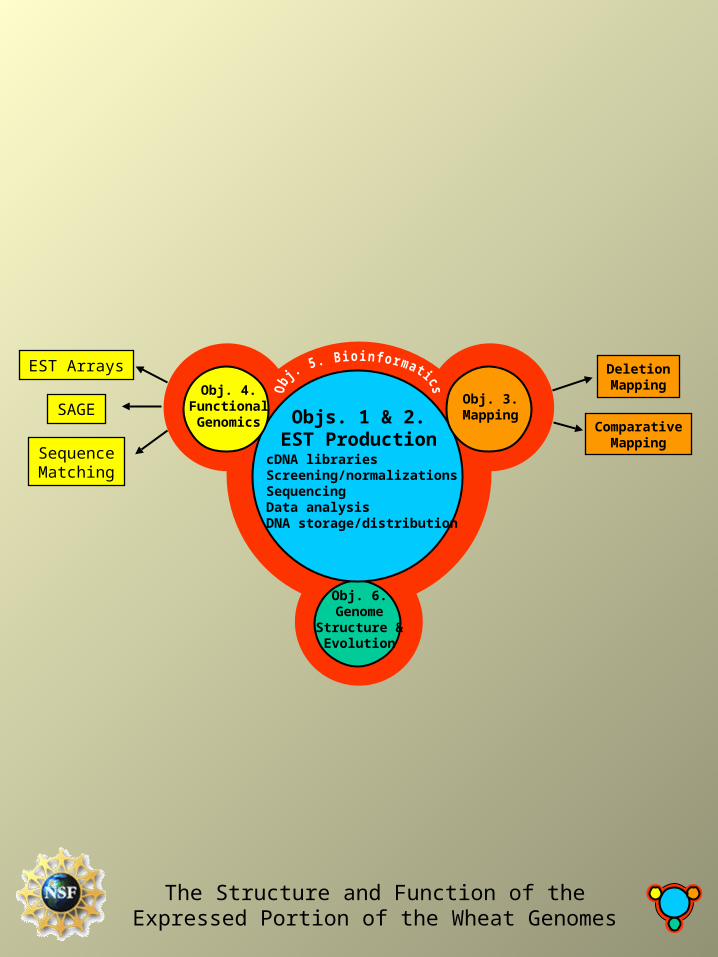
EST Arrays
SAGE
SequenceMatching
DeletionMapping
ComparativeMapping
Objs. 1 & 2.EST Production
cDNA librariesScreening/normalizationsSequencingData analysisDNA storage/distribution
Obj. 6.Genome
Structure &Evolution
Obj. 3.Mapping
Obj. 4.FunctionalGenomics
The Structure and Function of the Expressed Portion of the Wheat Genomes
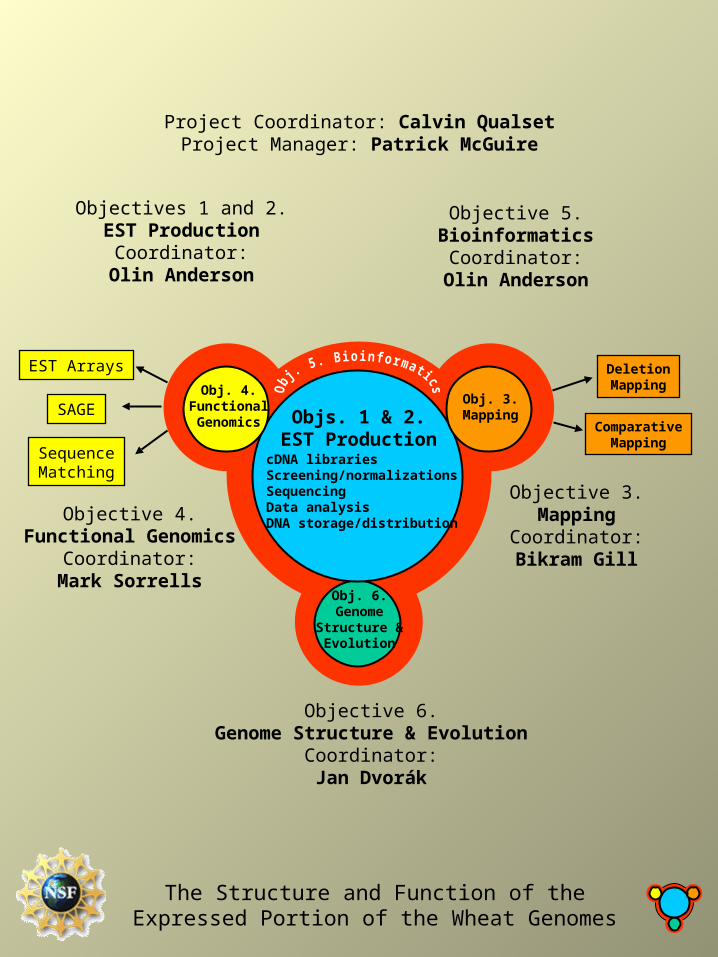
Project Coordinator: Calvin QualsetProject Manager: Patrick McGuire
Objectives 1 and 2.EST Production
Coordinator:Olin Anderson
Objective 5.Bioinformatics
Coordinator:Olin Anderson
Objective 3.Mapping
Coordinator:Bikram Gill
Objective 4.Functional Genomics
Coordinator:Mark Sorrells
Objective 6.Genome Structure & Evolution
Coordinator:Jan Dvorák
EST Arrays
SAGE
SequenceMatching
DeletionMapping
ComparativeMapping
Objs. 1 & 2.EST Production
cDNA librariesScreening/normalizationsSequencingData analysisDNA storage/distribution
Obj. 6.Genome
Structure &Evolution
Obj. 3.Mapping
Obj. 4.FunctionalGenomics
The Structure and Function of the Expressed Portion of the Wheat Genomes
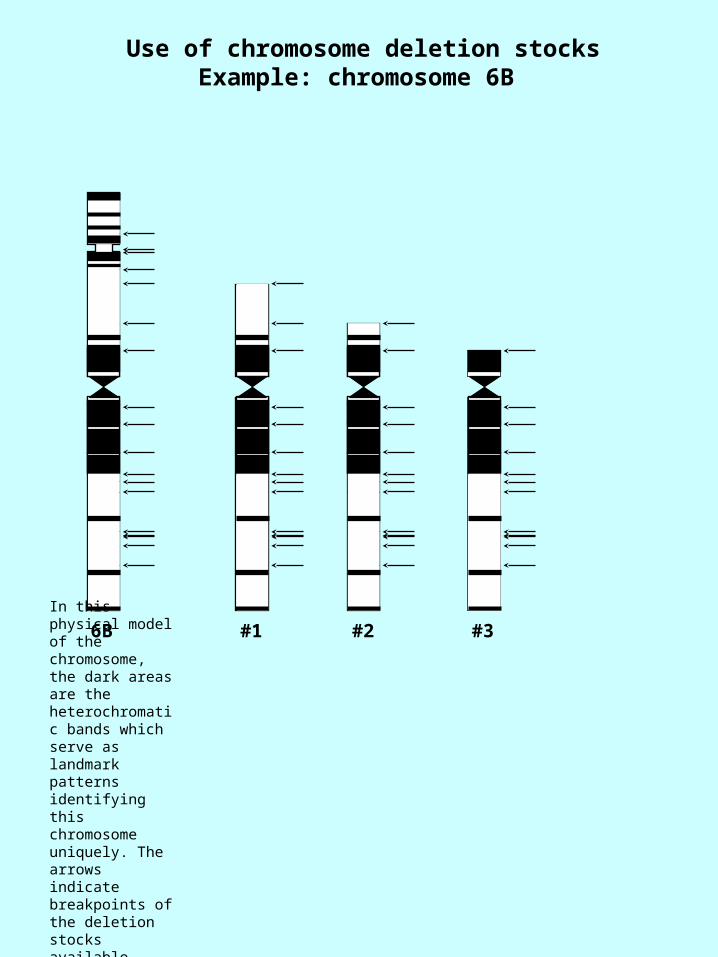
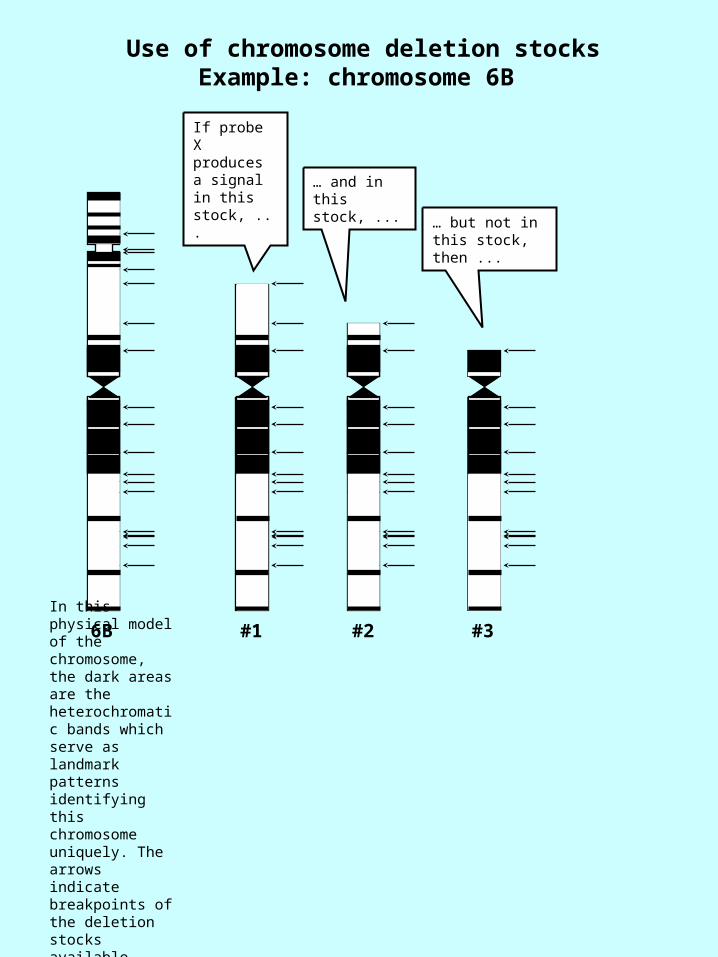
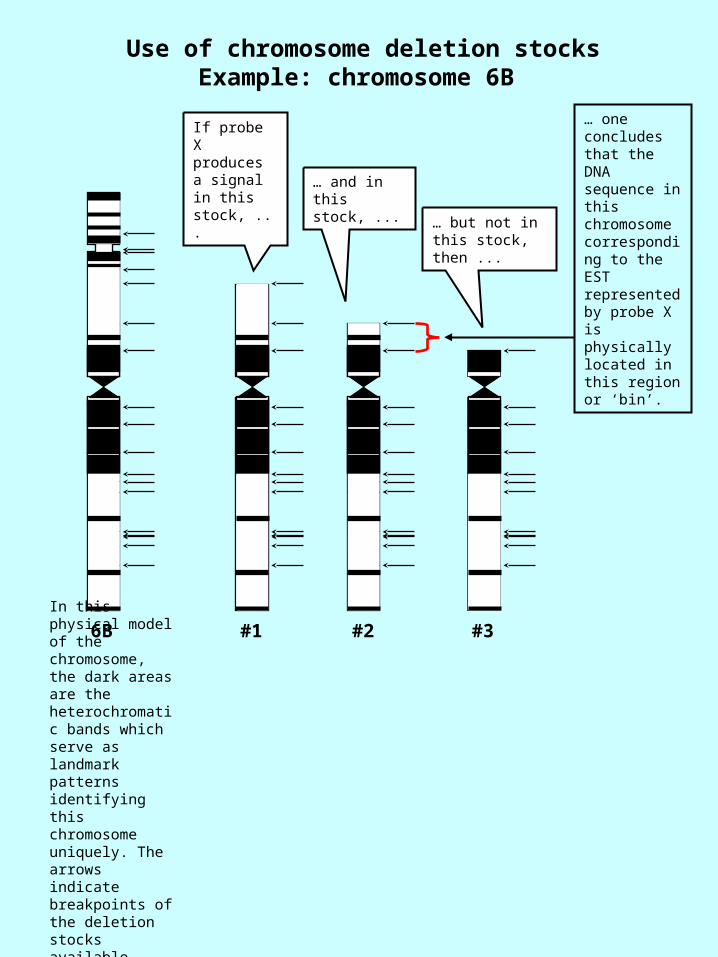
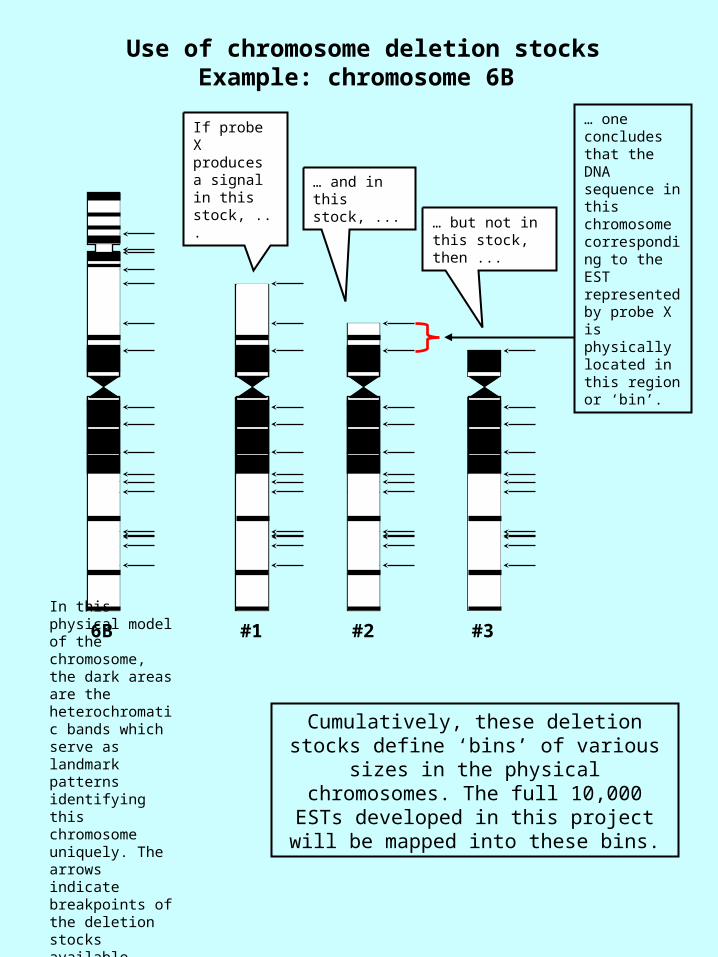
Use of chromosome deletion stocksExample: chromosome 6B
6B
In this physical model of the chromosome, the dark areas are the heterochromatic bands which serve as landmark patterns identifying this chromosome uniquely. The arrows indicate breakpoints of the deletion stocks available.
#1 #2 #3
Use of chromosome deletion stocksExample: chromosome 6B
6B
In this physical model of the chromosome, the dark areas are the heterochromatic bands which serve as landmark patterns identifying this chromosome uniquely. The arrows indicate breakpoints of the deletion stocks available.
#1 #2 #3
If probe X produces a signal in this stock, ...
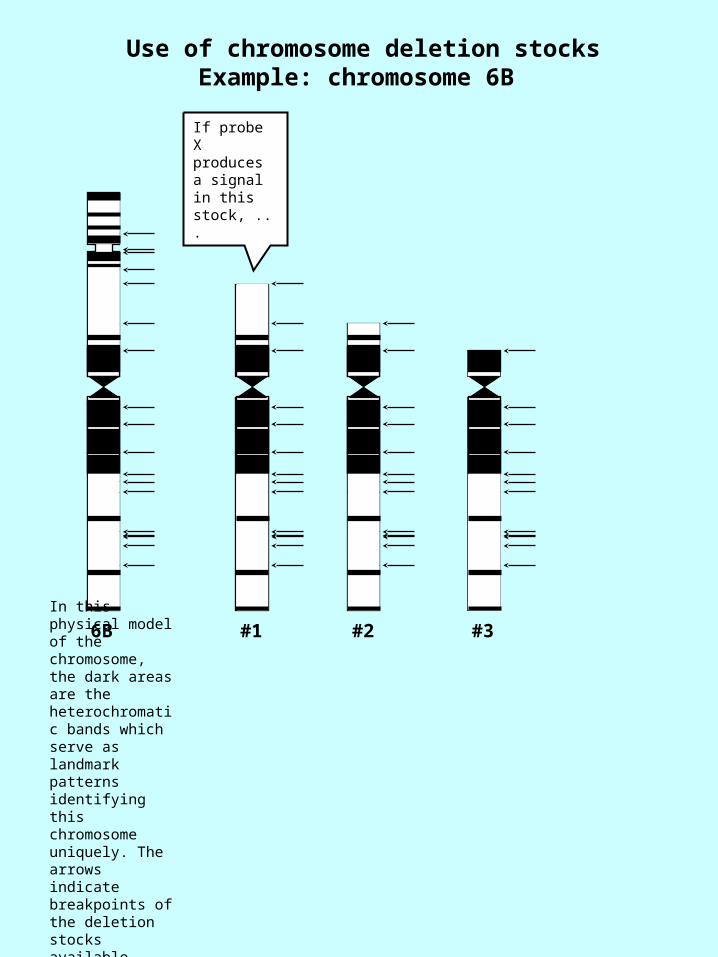
Use of chromosome deletion stocksExample: chromosome 6B
6B
In this physical model of the chromosome, the dark areas are the heterochromatic bands which serve as landmark patterns identifying this chromosome uniquely. The arrows indicate breakpoints of the deletion stocks available.
#1 #2 #3
… and in this stock, ...
If probe X produces a signal in this stock, ...
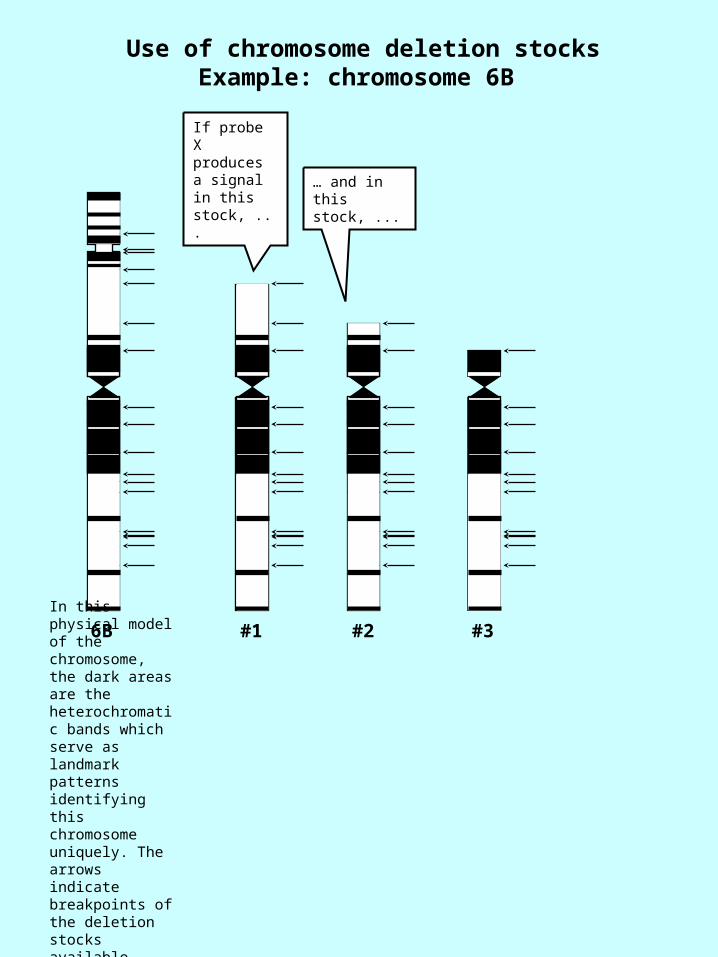
Use of chromosome deletion stocksExample: chromosome 6B
6B
In this physical model of the chromosome, the dark areas are the heterochromatic bands which serve as landmark patterns identifying this chromosome uniquely. The arrows indicate breakpoints of the deletion stocks available.
#1 #2 #3
… and in this stock, ...
… but not in this stock, then ...
If probe X produces a signal in this stock, ...
Use of chromosome deletion stocksExample: chromosome 6B
6B
In this physical model of the chromosome, the dark areas are the heterochromatic bands which serve as landmark patterns identifying this chromosome uniquely. The arrows indicate breakpoints of the deletion stocks available.
#1 #2 #3
… and in this stock, ...
… but not in this stock, then ...
… one concludes that the DNA sequence in this chromosome corresponding to the EST represented by probe X is physically located in this region or ‘bin’.
If probe X produces a signal in this stock, ...
Use of chromosome deletion stocksExample: chromosome 6B
6B
In this physical model of the chromosome, the dark areas are the heterochromatic bands which serve as landmark patterns identifying this chromosome uniquely. The arrows indicate breakpoints of the deletion stocks available.
Cumulatively, these deletion stocks define ‘bins’ of various sizes in the physical chromosomes. The full 10,000 ESTs
developed in this project will be mapped into these bins.
#1 #2 #3
… and in this stock, ...
… but not in this stock, then ...
… one concludes that the DNA sequence in this chromosome corresponding to the EST represented by probe X is physically located in this region or ‘bin’.
If probe X produces a signal in this stock, ...
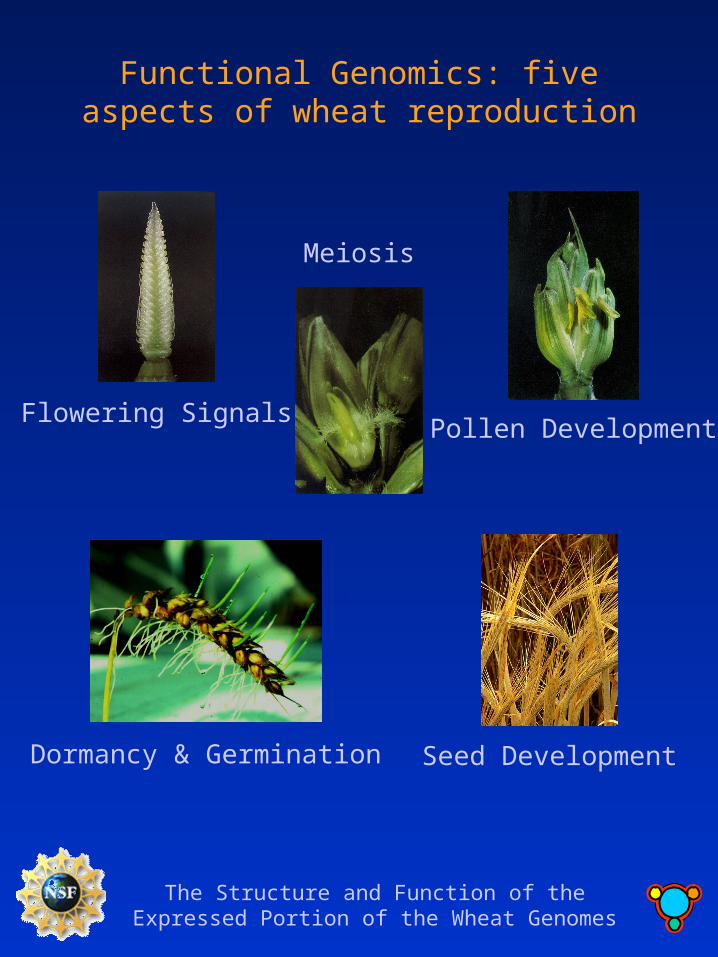
Functional Genomics: five aspects of wheat reproduction
The Structure and Function of the Expressed Portion of the Wheat Genomes
Flowering Signals
Meiosis
Pollen Development
Seed DevelopmentDormancy & Germination
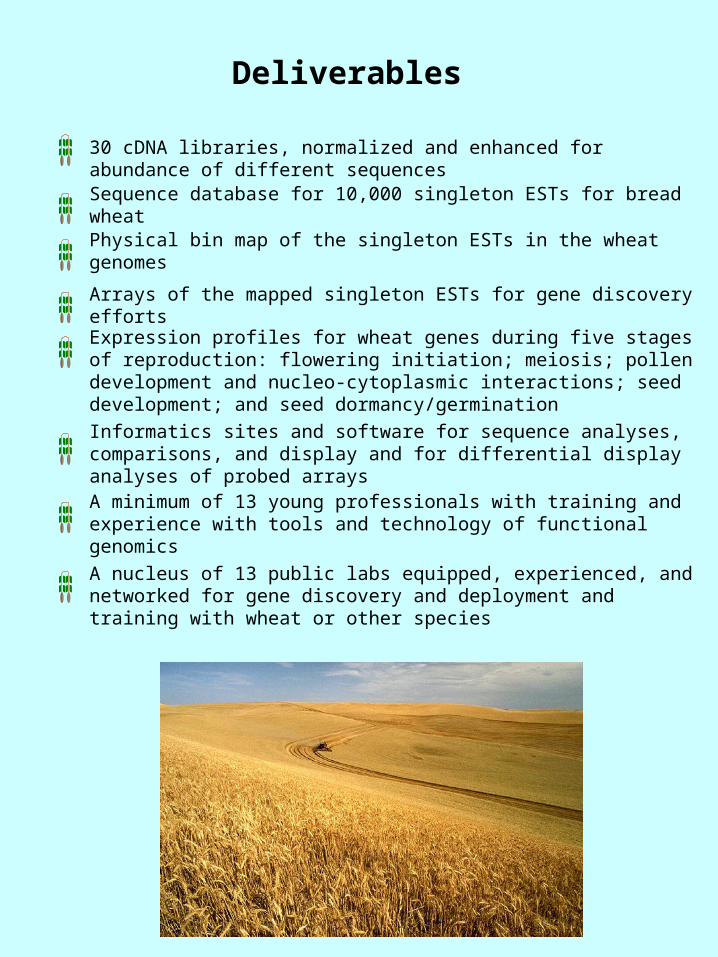
Deliverables
30 cDNA libraries, normalized and enhanced for abundance of different sequences
Sequence database for 10,000 singleton ESTs for bread wheat
Physical bin map of the singleton ESTs in the wheat genomes
Arrays of the mapped singleton ESTs for gene discovery efforts
Expression profiles for wheat genes during five stages of reproduction: flowering initiation; meiosis; pollen development and nucleo-cytoplasmic interactions; seed development; and seed dormancy/germination
Informatics sites and software for sequence analyses, comparisons, and display and for differential display analyses of probed arrays
A minimum of 13 young professionals with training and experience with tools and technology of functional genomics
A nucleus of 13 public labs equipped, experienced, and networked for gene discovery and deployment and training with wheat or other species
The Structure and Function of the Expressed Portion of the Wheat Genomes
Biology of bread wheat
Triticum aestivum L., tribe Triticeae, family Poaceae
Allohexaploid: six component genomes, AABBDD, 2n=6x=42
Bread wheat originated from two hybridization events, the first between two diploid species producing an AABB genome tetraploid, the second between the tetraploid species and another diploid species
Closest relatives to bread wheat in the tribe:the crops durum wheat (tetraploid, AABB), einkorn wheat (diploid, AA), barley (HH), rye (RR), and triticale (AABBRR), numerous weedy annual species of Aegilops and Triticum, and numerous forage species
Diploid species are the sources of the wheat genomes: A from Triticum urartu B from a primitive form of Aegilops speltoides or an extinct close relative D from Aegilops tauschii
The molecular genetic map has some 2000 markers.
Each chromosome pair has a unique pattern of heterochromatic bands allowing unequivocal cytological identification
Wheat tolerates aneuploidy and a huge library of aneuploid stocks exists in many different genotypes. Monosomics Deletions Ditelosomics Translocations Nullisomics-tetrasomics Alien introgression stocks
Aneuploids have been critical in gene discovery, gene mapping, chromosome manipulation, and gene transfer in classical cytogenetics and breeding. Coupled with molecular technology, the aneuploids offer tools for greater progress in all these areas plus gene cloning, transformation, and physical mapping.
Aneuploids have facilitated the understanding of syntenic relationships among thee three genomes: seven homoeologous groups have been defined, each with a chromosome from each genome.