Embed Size (px)
Citation preview
THE STRESS RESPONSE AND CIRCADIAN REGULATION OF TRANSLATION
IN NEUROSPORA CRASSA
A Dissertation
by
STEPHEN Z. CASTER
Submitted to the Office of Graduate and Professional Studies of
Texas A&M University
in partial fulfillment of the requirements for the degree of
DOCTOR OF PHILOSOPHY
Chair of Committee, Deborah Bell-Pedersen
Committee Members, Daniel J. Ebbole
Paul Hardin
Matthew Sachs
Terry Thomas
Head of Department, Dorothy Shippen
August 2016
Major Subject: Genetics
Copyright 2016 Stephen Caster
ii
ABSTRACT
Stress response pathways function to allow cells to adapt to changes in the environment.
In Neurospora crassa, acute osmotic stress activates the conserved p38-like
osmosensing mitogen-activated protein kinase (OS MAPK) pathway. When activated,
the terminal MAPK, OS-2 can activate transcription factors and kinases. We show an
acute osmotic stress activates OS-2, which phosphorylates and activates the conserved
kinase RCK-2. RCK-2 phosphorylates and inactivates the highly conserved eukaryotic
elongation factor 2 (eEF-2). To determine if this is a mechanism for translational
regulation of mRNAs, I examined ribosome profiling and RNAseq data from
osmotically stressed WT and Δrck-2 cultures. I found that RCK-2/eEF-2 regulate 69
constitutively expressed mRNAs at the level of translation. I also examined ribosome
profiling and RNAseq data from cultures given light exposure, and found that 36
constitutively expressed mRNAs were regulated at the level of translation. In both cases,
the translationally-controlled genes were enriched for metabolic processes, suggesting
that rapid regulation of metabolism through translational control helps the organism
overcome osmotic and light stress.
The circadian clock has a profound effect on gene regulation; however, little is known
about the role of the clock in controlling translation. I show that clock signaling through
the OS MAPK pathway promotes rhythmic phosphorylation of RCK-2 and eEF-2 in
iii
constant conditions. Using a cell-free translation assay, I demonstrated that clock
signaling to eEF-2 leads to rhythmic control of mRNA translation.
To determine the extent of clock regulation of translation in vivo, I examined ribosome
profiling and RNAseq data from WT cultures over a circadian time course. 637
Neurospora mRNAs showed rhythmic ribosome occupancy, and 549 of these were from
constitutively expressed mRNAs. To determine which of these translationally cycling
mRNAs required RCK-2/eEF-2 regulation, I examined ribosome profiling and RNAseq
data from Δrck-2 cultures over a circadian time course. I found 419 of the constitutive
mRNAs with cycling ribosomal occupancy required clock regulation of RCK-2/eEF-2.
While the regulation of initiation was thought to be the main control point of translation,
these data revealed a major role for eEF-2 activity and elongation in translation control
following stress and by the circadian clock.

iv
DEDICATION
I would like to dedicate my dissertation to my family, especially my mother and sister
who were always there for support and guidance. I would also like to dedicate this to my
grandparents, who taught me what it means to be strong.

v
ACKNOWLEDGEMENTS
I would like to acknowledge the members of the Bell-Pedersen lab, both past and present
for their continuous support and feedback. I would particularly like to thank Jay Dunlap
for collaborative support, as well as Bill Belden for the unique opportunity to learn how
to analyze big data. I would like to thank all the students and faculty in both the Texas
A&M Center for Biological Clocks Research and the Genetics department. I would also
like to thank my committee for their support and advice over these many years. And
lastly, I would like to thank Deborah Bell-Pedersen for all of her help, support, and
continuous effort to make our lab a successful one.
vi
TABLE OF CONTENTS
Page
ABSTRACT ....................................................................................................................... ii
DEDICATION .................................................................................................................. iv
ACKNOWLEDGEMENTS ............................................................................................... v
TABLE OF CONTENTS .................................................................................................. vi
LIST OF FIGURES ......................................................................................................... viii
LIST OF TABLES ............................................................................................................. x
CHAPTER I INTRODUCTION ........................................................................................ 1
Circadian Clock ...................................................................................................... 1
The Circadian Clock in Neurospora crassa ........................................................... 2
Clock Regulation of Output Pathways in Neurospora ........................................... 3
Post-transcriptional Control by the Circadian Clock ............................................. 4
Clock Regulation of Translation in Neurospora..................................................... 6
Objectives ............................................................................................................... 9
CHAPTER II CIRCADIAN CLOCK REGULATION OF mRNA TRANSLATION
THROUGH EUKARYOTIC ELONGATION FACTOR eEF-2 ..................................... 12
Introduction .......................................................................................................... 12
Results .................................................................................................................. 14
Discussion ............................................................................................................ 27
Materials and Methods ......................................................................................... 32
CHAPTER III REGULATION OF mRNA TRANSLATION ........................................ 39
Overview .............................................................................................................. 39
Introduction .......................................................................................................... 39
Results .................................................................................................................. 41
Discussion ............................................................................................................ 58
Materials and Methods ......................................................................................... 66
CHAPTER IV SUMMARY ............................................................................................. 73
vii
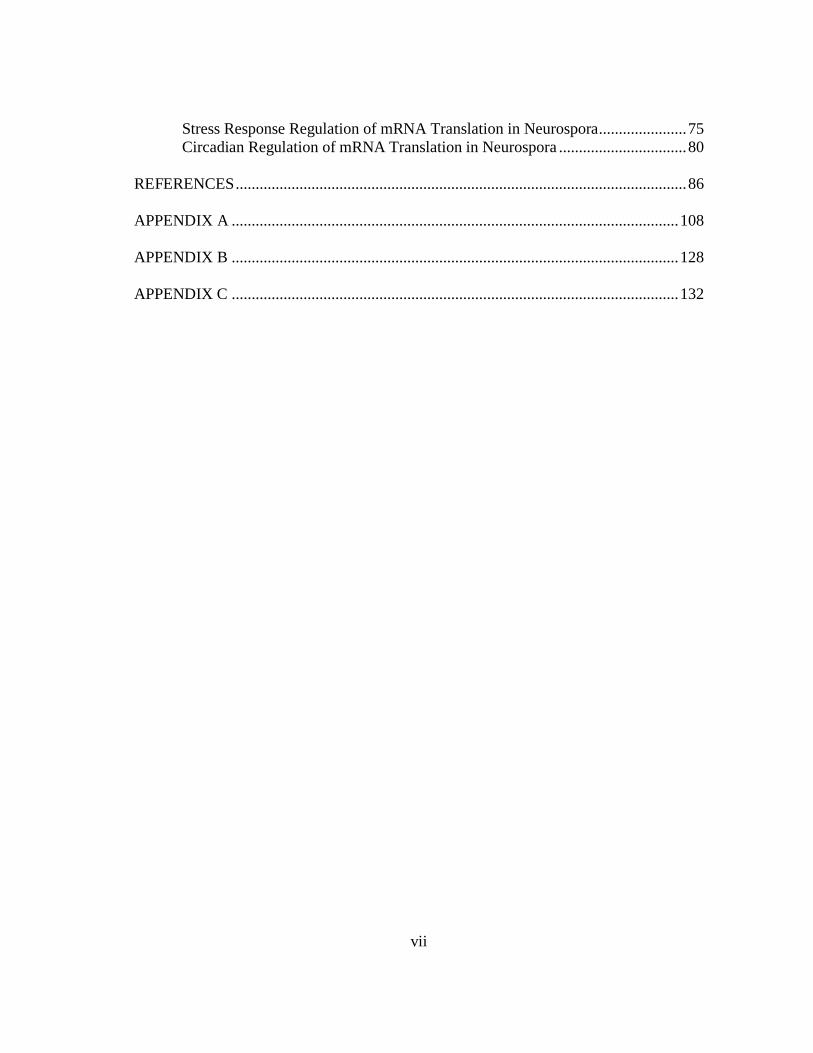
Stress Response Regulation of mRNA Translation in Neurospora ...................... 75
Circadian Regulation of mRNA Translation in Neurospora ................................ 80
REFERENCES ................................................................................................................. 86
APPENDIX A ................................................................................................................ 108
APPENDIX B ................................................................................................................ 128
APPENDIX C ................................................................................................................ 132
viii
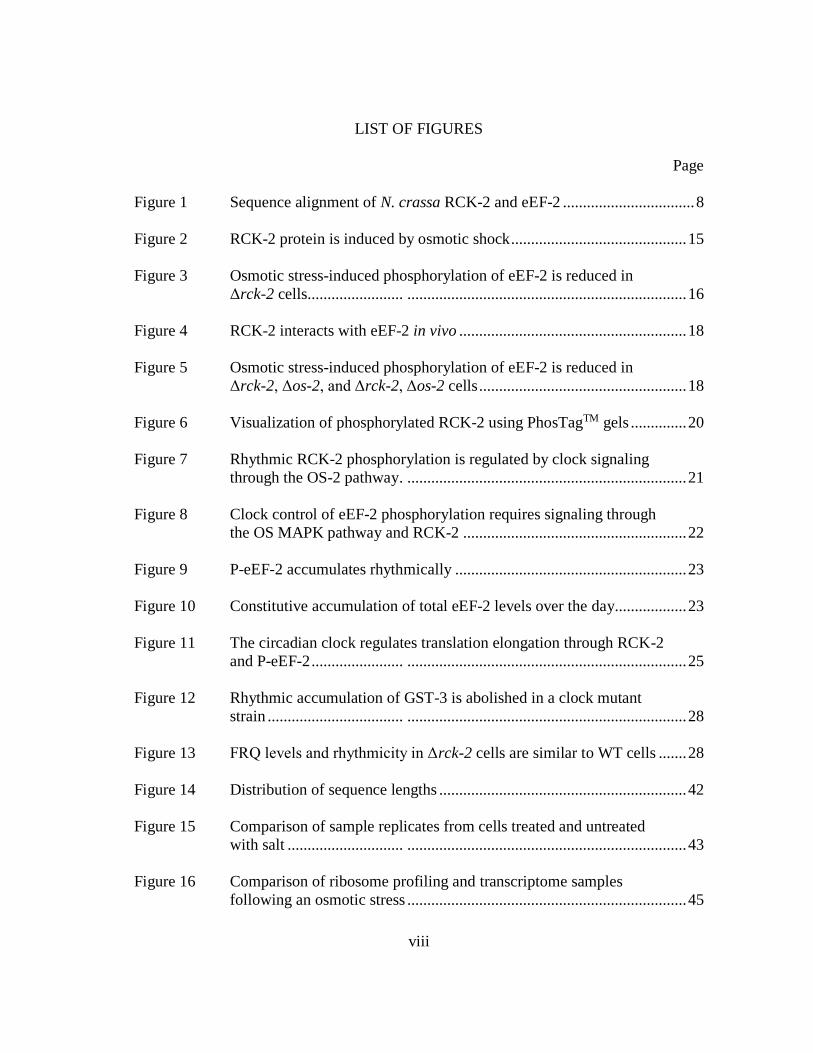
LIST OF FIGURES
Page
Figure 1 Sequence alignment of N. crassa RCK-2 and eEF-2 ................................. 8
Figure 2 RCK-2 protein is induced by osmotic shock ............................................ 15
Figure 3 Osmotic stress-induced phosphorylation of eEF-2 is reduced in
Δrck-2 cells ........................ ...................................................................... 16
Figure 4 RCK-2 interacts with eEF-2 in vivo ......................................................... 18
Figure 5 Osmotic stress-induced phosphorylation of eEF-2 is reduced in
Δrck-2, Δos-2, and Δrck-2, Δos-2 cells .................................................... 18
Figure 6 Visualization of phosphorylated RCK-2 using PhosTagTM gels .............. 20
Figure 7 Rhythmic RCK-2 phosphorylation is regulated by clock signaling
through the OS-2 pathway . ...................................................................... 21
Figure 8 Clock control of eEF-2 phosphorylation requires signaling through
the OS MAPK pathway and RCK-2 ........................................................ 22
Figure 9 P-eEF-2 accumulates rhythmically .......................................................... 23
Figure 10 Constitutive accumulation of total eEF-2 levels over the day.................. 23
Figure 11 The circadian clock regulates translation elongation through RCK-2
and P-eEF-2 ....................... ...................................................................... 25
Figure 12 Rhythmic accumulation of GST-3 is abolished in a clock mutant
strain .................................. ...................................................................... 28
Figure 13 FRQ levels and rhythmicity in Δrck-2 cells are similar to WT cells ....... 28
Figure 14 Distribution of sequence lengths .............................................................. 42
Figure 15 Comparison of sample replicates from cells treated and untreated
with salt ............................. ...................................................................... 43
Figure 16 Comparison of ribosome profiling and transcriptome samples
following an osmotic stress ...................................................................... 45
ix
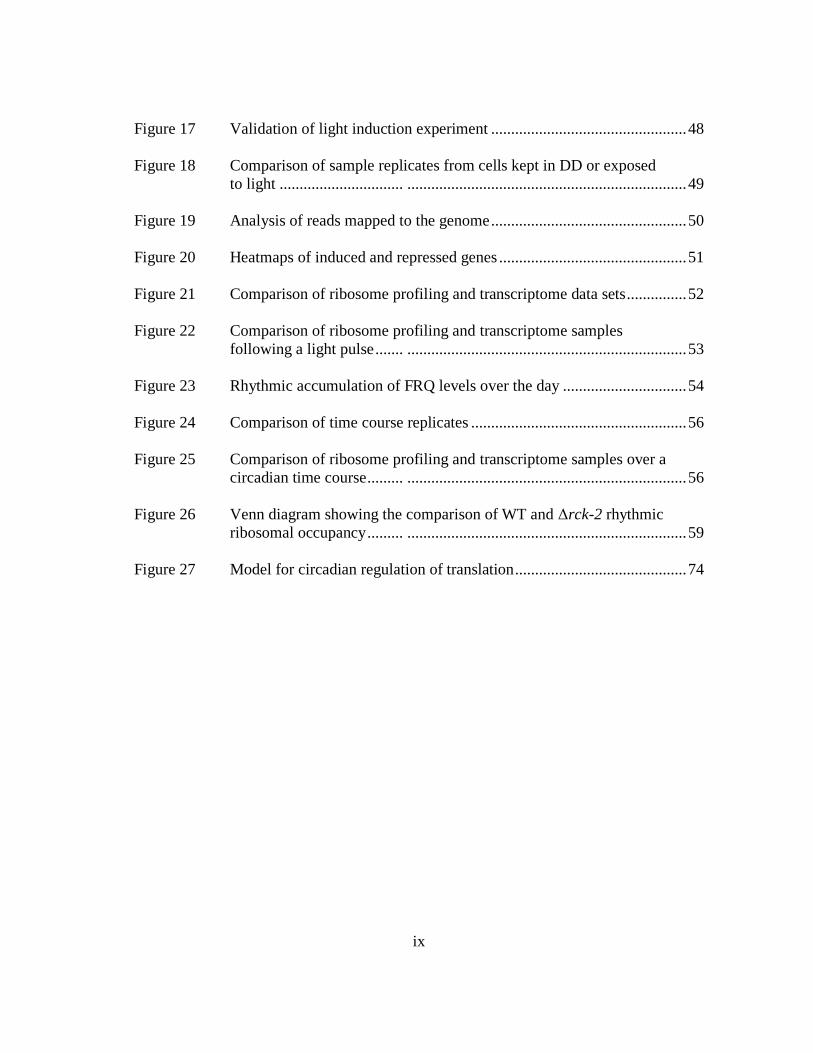
Figure 17 Validation of light induction experiment ................................................. 48
Figure 18 Comparison of sample replicates from cells kept in DD or exposed
to light ............................... ...................................................................... 49
Figure 19 Analysis of reads mapped to the genome ................................................. 50
Figure 20 Heatmaps of induced and repressed genes ............................................... 51
Figure 21 Comparison of ribosome profiling and transcriptome data sets ............... 52
Figure 22 Comparison of ribosome profiling and transcriptome samples
following a light pulse ....... ...................................................................... 53
Figure 23 Rhythmic accumulation of FRQ levels over the day ............................... 54
Figure 24 Comparison of time course replicates ...................................................... 56
Figure 25 Comparison of ribosome profiling and transcriptome samples over a
circadian time course ......... ...................................................................... 56
Figure 26 Venn diagram showing the comparison of WT and Δrck-2 rhythmic
ribosomal occupancy ......... ...................................................................... 59
Figure 27 Model for circadian regulation of translation ........................................... 74
x
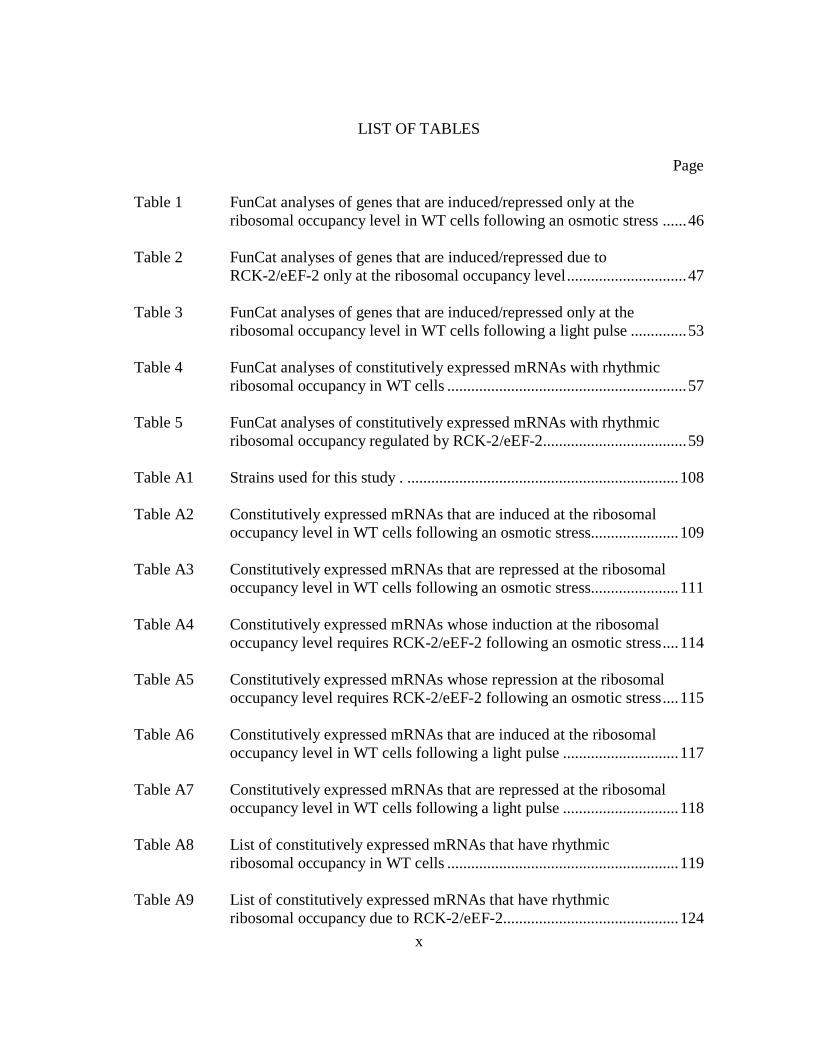
LIST OF TABLES
Page
Table 1 FunCat analyses of genes that are induced/repressed only at the
ribosomal occupancy level in WT cells following an osmotic stress ...... 46
Table 2 FunCat analyses of genes that are induced/repressed due to
RCK-2/eEF-2 only at the ribosomal occupancy level .............................. 47
Table 3 FunCat analyses of genes that are induced/repressed only at the
ribosomal occupancy level in WT cells following a light pulse .............. 53
Table 4 FunCat analyses of constitutively expressed mRNAs with rhythmic
ribosomal occupancy in WT cells ............................................................ 57
Table 5 FunCat analyses of constitutively expressed mRNAs with rhythmic
ribosomal occupancy regulated by RCK-2/eEF-2.................................... 59
Table A1 Strains used for this study . .................................................................... 108
Table A2 Constitutively expressed mRNAs that are induced at the ribosomal
occupancy level in WT cells following an osmotic stress...................... 109
Table A3 Constitutively expressed mRNAs that are repressed at the ribosomal
occupancy level in WT cells following an osmotic stress...................... 111
Table A4 Constitutively expressed mRNAs whose induction at the ribosomal
occupancy level requires RCK-2/eEF-2 following an osmotic stress .... 114
Table A5 Constitutively expressed mRNAs whose repression at the ribosomal
occupancy level requires RCK-2/eEF-2 following an osmotic stress .... 115
Table A6 Constitutively expressed mRNAs that are induced at the ribosomal
occupancy level in WT cells following a light pulse ............................. 117
Table A7 Constitutively expressed mRNAs that are repressed at the ribosomal
occupancy level in WT cells following a light pulse ............................. 118
Table A8 List of constitutively expressed mRNAs that have rhythmic
ribosomal occupancy in WT cells .......................................................... 119
Table A9 List of constitutively expressed mRNAs that have rhythmic
ribosomal occupancy due to RCK-2/eEF-2............................................ 124
1
CHAPTER I
INTRODUCTION
Circadian Clock
The circadian clock acts as an endogenous mechanism that regulates diverse biological
functions in many organisms, from prokaryotes to eukaryotes (1). The clock regulates
daily rhythms in biological processes ranging from sleep-wake cycles to metabolism and
gene expression. Disruption of the circadian clock has profound effects on human
physiology, and can lead to metabolic disorders and tumor development (2, 3). Evidence
for the circadian clock was first reported in 1729 by Jean Jacques d’Ortous deMairan in
which he observed leaf movement, even in the absence of light (4, 5). However, it was
not until the 1950s and 1960s that the study of biological clocks began in earnest, and
over the subsequent decades, the field of chronobiology has expanded into many
varieties of organisms ranging from cyanobacteria to humans (5).
The key properties for a circadian clock are defined as: i) the persistence of rhythms in
constant environmental conditions (e.g., constant darkness) with a period of about 24 h,
also called the free-running period; ii) temperature compensation (i.e., a change in
temperature does not affect the period length); and iii) the clock can be reset by
environmental input signals. The molecular clock consists of genes that encode positive
element(s) that activate downstream negative element(s) that in turn inhibit the activity
2
of the positive element(s). These elements form an auto-regulatory feedback loop that
controls daily rhythms (1, 6).
The Circadian Clock in Neurospora crassa
Many fundamental properties of the clock have been discovered using the simple
eukaryotic fungus Neurospora crassa as a model system (7). When Neurospora is grown
in constant conditions (i.e., in constant darkness (DD) at 25° C), the positive components
of the core oscillator, WHITE COLLAR-1 (WC-1) and WC-2, heterodimerize to form
the WHITE COLLAR COMPLEX (WCC). WC-1 is a zinc finger DNA transcription
factor with LOV (light, oxygen, and voltage-sensing) and PAS (Per-ARNT-Sim)
domains (8, 9). In addition to being a key component of the circadian clock, WC-1 is
also a blue-light photoreceptor (10, 11). WC-2 is also a zinc finger transcription factor,
with a single PAS domain (12). In the clock mechanism, WCC activates transcription of
frequency (frq), a negative element (13).
The frq gene acts as the main regulator of the WCC and encodes both a long and short
isoform of FRQ protein (14). FRQ accumulates over time and dimerizes, forming a
complex with FREQUENCY-INTERACTING RNA HELICASE (FRH) called the FCC.
FRH stabilizes FRQ, preventing its rapid degradation due to the intrinsically disordered
properties of FRQ protein (15). The FCC inhibits the activity of the WCC by recruiting
casein kinase 1a (CK1a) to the WCC, which results in hyperphosphorylation of the
WCC (16). Hyperphosphorylated WCC is stable but inactive, which in turn leads to
3
diminished transcription of frq. Over time FRQ is progressively phosphorylated and
interacts with FWD-1, an F-box/WD-40 repeat-containing protein that acts as a substrate
for the SCF (Skp1-Cul1-F-box-protein) ubiquitin ligase (17, 18). FRQ is then
ubiquitinated and degraded, and the WCC becomes dephosphorylated and active again,
through the activity of protein phosphatase 2A (PP2A) to restart the cycle (19).
Clock Regulation of Output Pathways in Neurospora
In addition to the WCC binding to the frq promoter, the WCC also binds to
approximately 5% of all genes in Neurospora, most of which are both clock- and light-
regulated (20). These genes encode transcription factors, as well as various output
pathway components and terminal clock-controlled genes (ccgs) (6). Circadian
regulation of the first tier transcription factors leads to clock control of approximately
40% of Neurospora genes.
One of the identified output pathway components, os-4, has WCC binding sites or light
response elements (LREs) found in the promoter region. OS-4 is the mitogen activated
protein kinase kinase kinase (MAPKKK) of the osmosensing (OS) MAPK pathway.
MAPK pathways consist of serine/threonine MAPKs that link extracellular signals to
regulate many cellular processes including, but not limited to stress response, apoptosis
and survival (21). The OS MAPK pathway in Neurospora is important for cell
adaptation in conditions of high osmolarity, and phosphorylation/activation of the
terminal MAPK (OS-2) is clock-controlled (22).
4
Clock regulation of MAPK pathways and cellular processes provides an adaptive
advantage in anticipation of daily environmental stressors (20, 23, 24). The WCC
rhythmically binds to the promoter of os-4, and OS-4 protein accumulates rhythmically.
When the LREs are deleted in the os-4 promoter, os-4 mRNA is arrhythmic and that in
turn results in constitutive phosphorylation of the downstream MAPK OS-2 (25).
Following osmotic stress, phosphorylated OS-2 (P-OS-2) can interact with other
proteins, including transcription factors, kinases, and chromatin remodeling proteins,
leading to activation or repression of target genes (26). However, not much is known
about the downstream effects of clock regulation of P-OS-2.
Post-transcriptional Control by the Circadian Clock
Depending on the organism and tissue, between 10 - 40% of the eukaryotic genome is
under control of the clock at the level of transcription (27-32). These transcripts peak in
abundance at all possible phases of the circadian cycle, implicating the action of a
network of transcription factors controlling phase. Such studies led to the dogma that
circadian output is primarily controlled at the transcriptional level. However, some
mammalian genes show post-transcriptional control of rhythmicity (33, 34), including
clock control of splicing (35), polyadenylation (36, 37), and deadenylation (38, 39). The
extent of this control, and the mechanisms for many of these events, have not been fully
elucidated. In addition, recent proteomic analysis of rhythmically accumulating soluble
5
proteins in mouse liver showed that up to 50% of the proteins examined had robust
rhythms in abundance, but no apparent rhythms in the associated mRNA levels (40).
Consistent with clock control of translation, the clock regulates the levels (eIF1, eIF4A2,
eF4G1, eIF5, eEF2, eEF1A1) and phosphorylation state (eIF4E, eIF4G, eIF4B, 4EBP1)
of translation initiation factors in mouse liver (41, 42), and the clock has been implicated
in regulating the translation efficiency of mRNAs with specific 5’-terminal oligo
pyrimidine tract (5’-TOP) sequences or with translation initiator of short 5’-UTR (TISU)
motifs (43). Furthermore, circadian rhythms can persist in the absence of transcription,
as exemplified by the non-transcriptional time-keeping mechanism in the cyanobacterial
Kai oscillator, and the evolutionarily conserved rhythms in post-translational
modification of the antioxidant peroxiredoxin proteins (44).
Also consistent with clock control of translation, individual genes from a variety of
organisms have rhythms in protein levels that arise from mRNAs that accumulate
constitutively over the course of the day. Examples include LBP in Gonyaulax (45),
Eip74EF in Drosophila (46), Nocturnin in Xenopus retina (38), Pdia3, Cat, and
Serpina1d in the mouse liver (40), and WC-1 in Neurospora (47). For LBP and Eip74EF,
translational regulation is due to rhythmic RNA-binding protein interactions at the 3’
UTR; however for the others, the mechanisms of circadian post-transcriptional control
have not been fully elucidated. Rhythmic antisense RNA and/or miRNA expression is
also implicated in translational control of core clock proteins, including antisense RNA
6
to frq in Neurospora, antisense RNA to per in Drosophila, and miR-141 control of Clock
in mice (33, 34). In mouse liver, the clock controls mRNA levels for several translation
initiation factors, ribosomal RNAs, and ribosomal protein mRNAs (41), suggesting that
aspects of ribosome biogenesis are clock-regulated. These data, although limited,
indicate that clock regulation of translation may be a widespread phenomenon.
Taken together, these data show that a wholly transcriptional model for rhythmic gene
regulation cannot account for the extent of rhythms of protein expression, and point to
important roles for post-transcriptional, translational, and/or post-translational
mechanisms in generating circadian output. Yet, while we know that rhythmic mRNA
does not necessarily reflect rhythmic protein expression, and the phase relationships
between mRNA levels and protein are not always overlapping, we lack basic
information on how the clock controls these fundamental post-transcriptional control
mechanisms. Elucidating the rhythmic proteome and the translational control points that
regulate circadian protein oscillations is a critical step needed to understand the
molecular programs that drive circadian physiology and associated disease.
Clock Regulation of Translation in Neurospora
In yeast, the homolog of Neurospora OS-2, Hog1, directly phosphorylates and activates
a conserved serine/threonine kinase, Rck2. The activation of Rck2 occurs when Hog1
phosphorylates serine and threonine residues within the C-terminal autoinhibitory
domain. (48, 49). Activated Rck2 then directly phosphorylates elongation factor-2 (EF-
7
2) (50-52). eEF-2 is the major regulator of peptide chain elongation in all eukaryotic
cells, critical for cell growth and proliferation (53). eEF-2 activity is increased in several
human tumors and cancer cell lines, including glioblastoma, gastrointestinal, breast, and
lung cancers (54-57). eEF-2 activity is also associated with cell cycle progression,
cellular differentiation, and development (58-60). Interestingly, while phosphorylation of
eEF-2 (P-eEF-2) is primarily associated with translation repression, in Aplysia and
mouse neurons, P-eEF-2 promotes translation of some mRNAs, while repressing others
(61, 62)
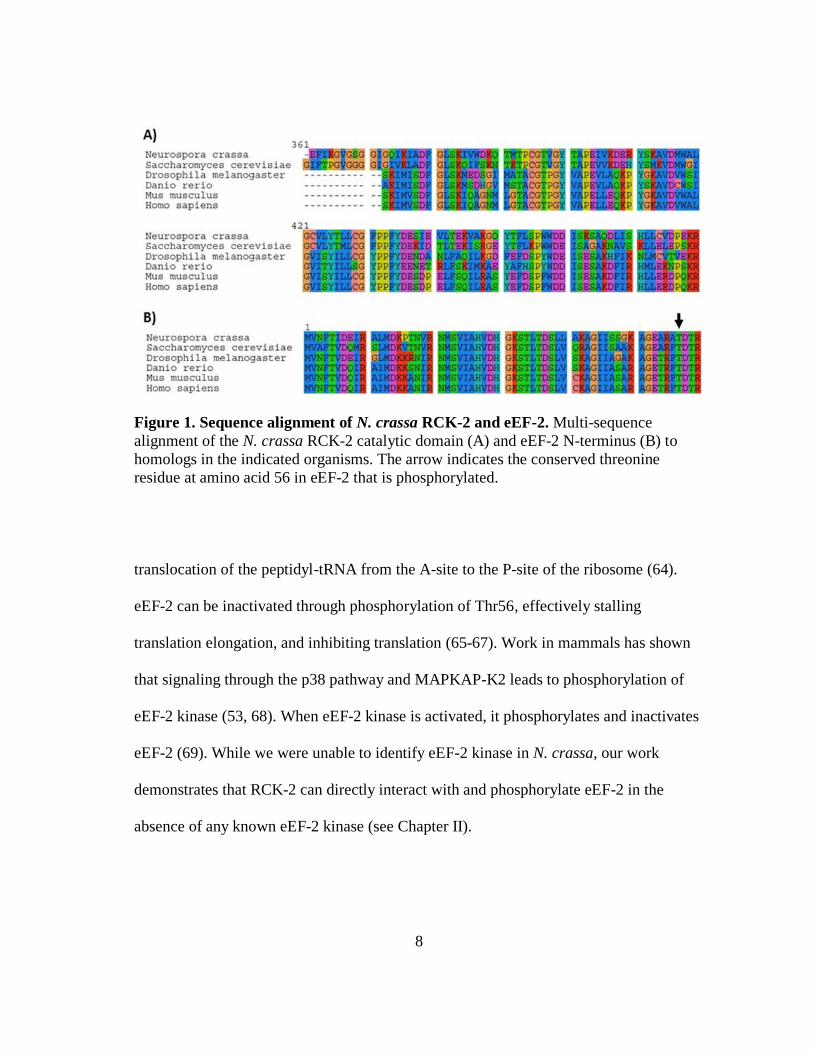
N. crassa RCK-2 was identified by comparing S. cerevisiae Rck2 to the Neurospora
genome. A protein was identified encoded by NCU09212 that had 40% amino acid
identity to yeast Rck2, with the majority of the sequence identity occurring within the
catalytic domain (Figure 1A). This domain is conserved throughout eukaryotes and is
homologous to mammalian MAPK-activated protein kinase 2 (MAPKAP-K2). It was
previously shown that p38, the mammalian homolog of Neurospora OS-2, directly
phosphorylates MAPKAP-K2, similar to yeast (63).
N. crassa eEF-2 was also identified by comparison of Neurospora proteins to EF-2 from
yeast. The protein encoded by NCU07700 has 79% identity to yeast EF-2 (Figure 1B).
This elongation factor is highly conserved throughout eukaryotes, and is homologous to
mammalian eEF-2. During translation elongation, eEF-2 is responsible for mediating the
8
Figure 1. Sequence alignment of N. crassa RCK-2 and eEF-2. Multi-sequence
alignment of the N. crassa RCK-2 catalytic domain (A) and eEF-2 N-terminus (B) to
homologs in the indicated organisms. The arrow indicates the conserved threonine
residue at amino acid 56 in eEF-2 that is phosphorylated.
translocation of the peptidyl-tRNA from the A-site to the P-site of the ribosome (64).
eEF-2 can be inactivated through phosphorylation of Thr56, effectively stalling
translation elongation, and inhibiting translation (65-67). Work in mammals has shown
that signaling through the p38 pathway and MAPKAP-K2 leads to phosphorylation of
eEF-2 kinase (53, 68). When eEF-2 kinase is activated, it phosphorylates and inactivates
eEF-2 (69). While we were unable to identify eEF-2 kinase in N. crassa, our work
demonstrates that RCK-2 can directly interact with and phosphorylate eEF-2 in the
absence of any known eEF-2 kinase (see Chapter II).
9
Objectives
The clock provides an endogenous mechanism for anticipation of daily environmental
stresses. Many studies have focused on cataloging rhythmic mRNA, and determining
how the clock regulates rhythmic mRNA levels through the activity of clock controlled
transcription factors (20, 70). However, little is known about how the clock regulates
translation. I propose that clock signaling through the OS MAPK pathway leads to
rhythmic phosphorylation and activation of RCK-2. RCK-2 then rhythmically
phosphorylates eEF-2, acting as a mechanism for clock regulation of translation of
specific mRNAs. The following hypotheses will be tested in order to validate this
proposal:
1. RCK-2 and eEF-2 are part of the osmotic stress response pathway. To test this
hypothesis, I first examined the response of RCK-2 and eEF-2 activity following
an osmotic stress. I found that RCK-2 protein is induced and highly
phosphorylated following osmotic stress, and that this response required OS-2. I
also found that eEF-2 is highly phosphorylated following osmotic stress, and that
phosphorylation of eEF-2 is partially due to OS-2 activation of RCK-2. These
data suggested that RCK-2 and eEF-2 are part of the stress response pathway, but
eEF-2 phosphorylation can be regulated by other kinase(s).
2. Clock signaling through the OS pathway, leads to rhythmic phosphorylation of
RCK-2 and eEF-2, acting as a mechanism for clock regulation of translation
10
elongation. To test this hypothesis, I examined phosphorylation of
RCK-2 and eEF-2 over a circadian time course. I discovered that both RCK-2
and eEF-2 phosphorylation are clock-controlled, and the rhythm in accumulation
of phosphorylated RCK-2 and eEF-2 requires clock signaling through the OS
pathway. Using translation extracts programmed with luciferase mRNA in an in
vitro assay, I found that clock control of the levels of phosphorylated eEF-2 leads
to rhythmic repression of translation, and that clock signaling through RCK-2
and eEF-2 leads to repression of translation elongation.
3. Because not all Neurospora proteins cycle in abundance, I hypothesized that
clock control of the levels of phosphorylated eEF-2 does not affect all mRNAs.
In order to test this hypothesis, I performed ribosome profiling (to determine
which mRNAs are being actively translated) and RNAseq (to identify all
mRNAs) following an osmotic stress, a light pulse, and over a circadian time
course. I identified 194 genes that were significantly up-regulated or down-
regulated at the level of ribosomal occupancy following an osmotic stress, and
showed that 69 of these genes required RCK-2 for regulation by osmotic stress.
Using functional categorization (FunCat) analyses, I found that these genes were
primarily enriched for metabolic processes. Following a light pulse, I identified
36 genes that were induced or repressed only at the level of translation. These
genes were also enriched for metabolic processes. When I examined circadian
regulation of mRNA translation by ribosome profiling, I identified 549 mRNAs
11
that have rhythmic ribosomal occupancy, but constitutive mRNA expression.
Some of these genes were also enriched for metabolic processes. Of these genes,
419 were arrhythmic in Δrck-2 cells, demonstrating that the clock is regulating a
specific set of mRNAs at the level of translation through control of the activity of
RCK-2 and eEF-2.
The subsequent chapters will describe the results of my research. Chapter II is a
manuscript that has been accepted by PNAS (Caster et al., 2016). Chapter III is a
combination of 3 papers that are currently in preparation that describe the results of
ribosome profiling and RNAseq following osmotic stress, light treatment, and over a
circadian time course. In chapter IV, I discuss the major findings of this research, the
significance of these findings, future plans for the 3 papers in preparation, and future
directions for this work. Appendix A consists of a list of strains used for these
experiments, as well as tables generated from the sequencing data from chapter III.
Appendix B provides information on the pipeline and script used to analyze both the
ribosome profiling and RNAseq data. Appendix C describes a grant proposal discussing
the ribosome code (i.e., ribosomes with distinct compositions translate specific mRNAs).
In Appendix C, my contribution to the grant is specified.
12
CHAPTER II
CIRCADIAN CLOCK REGULATION OF mRNA TRANSLATION THROUGH
EUKARYOTIC ELONGATION FACTOR eEF-2*
Introduction
Circadian rhythms are the outward manifestation of an endogenous clock mechanism
common to nearly all eukaryotes. Depending on the organism and tissue, nearly half of
an organism’s expressed genes are under control of the circadian clock at the level of
transcription (32, 70-72). However, mounting evidence indicates a role for the clock in
controlling post-transcriptional mechanisms (73), including translation initiation (41,
74), while clock control of translation elongation has not been investigated.
The driver of circadian rhythms in N. crassa is an autoregulatory molecular feedback
loop composed of the negative elements FREQUENCY (FRQ) and FRQ RNA-
interacting helicase (FRH), which inhibit the activity of the positive elements WHITE
COLLAR-1 (WC-1) and WC-2 (75-78). WC-1 and WC-2 heterodimerize to form the
white collar complex (WCC), which activates transcription of frequency (frq) (11, 75,
79), as well as activating transcription of a large set of downstream target genes
important for overt rhythmicity (20, 70). One gene directly controlled by the WCC is os-
____________________________
*Reprinted with permission from “Circadian clock regulation of mRNA translation
through eukaryotic elongation factor eEF-2” by S. Caster, K. Castillo, M. Sachs, D. Bell-
Pedersen (2016) Proc Natl Acad Sci ©The National Academy of Sciences of the USA
13
4, which encodes the mitogen-activated kinase kinase kinase (MAPKKK) in the
osmotically-sensitive (OS) MAPK pathway (25). Rhythmic transcription of os-4 leads to
rhythmic accumulation of the phosphorylated active form of the downstream p38-like
mitogen-activated protein kinase (MAPK) OS-2 (22). In Saccharomyces cerevisiae, the
homolog of OS-2, Hog1, directly phosphorylates and activates the MAPK-activated
protein kinase (MAPKAPK) Rck2 after acute osmotic stress (48, 49). Activated Rck2
phosphorylates EF-2, and as a result, represses translation elongation for most mRNAs
(50-52). Therefore, we hypothesized that circadian clock control of OS-2 activity in N.
crassa leads to temporal control of translation elongation through rhythmic activation of
RCK-2.
In support of this hypothesis, we show that clock control of OS-2 leads to rhythmic
phosphorylation of RCK-2 and eEF-2 in cells grown in constant conditions. Consistent
with the peak in phosphorylated eEF-2 during the morning, translation elongation rates
are reduced in extracts prepared from cells harvested at this time of the day.
Furthermore, clock-controlled translation of GST-3 protein from constitutive mRNA
levels in vivo is dependent on rhythmic eEF-2 activity, whereas rhythms in accumulation
of FRQ are not dependent on rhythms in phosphorylated eEF-2. Together, these data
support clock regulation of translation elongation of specific mRNAs as a mechanism to
control rhythmic protein accumulation.
14
Results
Phosphorylation of RCK-2 Protein Requires OS-2
Total Rck2 kinase levels, and Rck2 phosphorylation by Hog1, increase following
osmotic stress in S. cerevisiae cells (50). Rck2 then phosphorylates and inactivates EF-2,
leading to general repression of translation (50, 80). To investigate if a similar
mechanism exists for regulation of translation in N. crassa, we identified N. crassa
RCK-2 and eEF-2 through sequence homology. To determine if N. crassa RCK-2
functions in the osmotic stress response pathway, RCK-2 protein levels and
phosphorylation state were measured following acute osmotic stress in WT or Δos-2
cells containing a C-terminal hemagglutinin (HA)-tagged RCK-2 protein (RCK-2::HA)
grown in the dark for 24 h (DD24) and then subjected to acute osmotic stress. As in
yeast, N. crassa RCK-2::HA protein levels increased following osmotic stress, and
induction required OS-2 (Figure 2A). Two forms of RCK-2::HA protein were observed
by SDS-PAGE in WT cells, but not in Δos-2 cells (Figure 2A). Consistent with the idea
that the slower migrating form of RCK-2::HA was phosphorylated, the band disappeared
when protein extracts were treated with λ-phosphatase, but persisted in extracts treated
with λ-phosphatase and phosphatase inhibitors (Figure 2B). In yeast, phosphorylated
Rck2 is observed in osmotically stressed, but not in unstressed cells (50). In contrast,
phosphorylated RCK-2:HA (P-RCK-2) was present in unstressed N. crassa cells,
suggesting that OS-2-dependent phosphorylation of RCK-2 was directed by different
input signals to the OS MAPK pathway, possibly signals from the circadian clock.
15
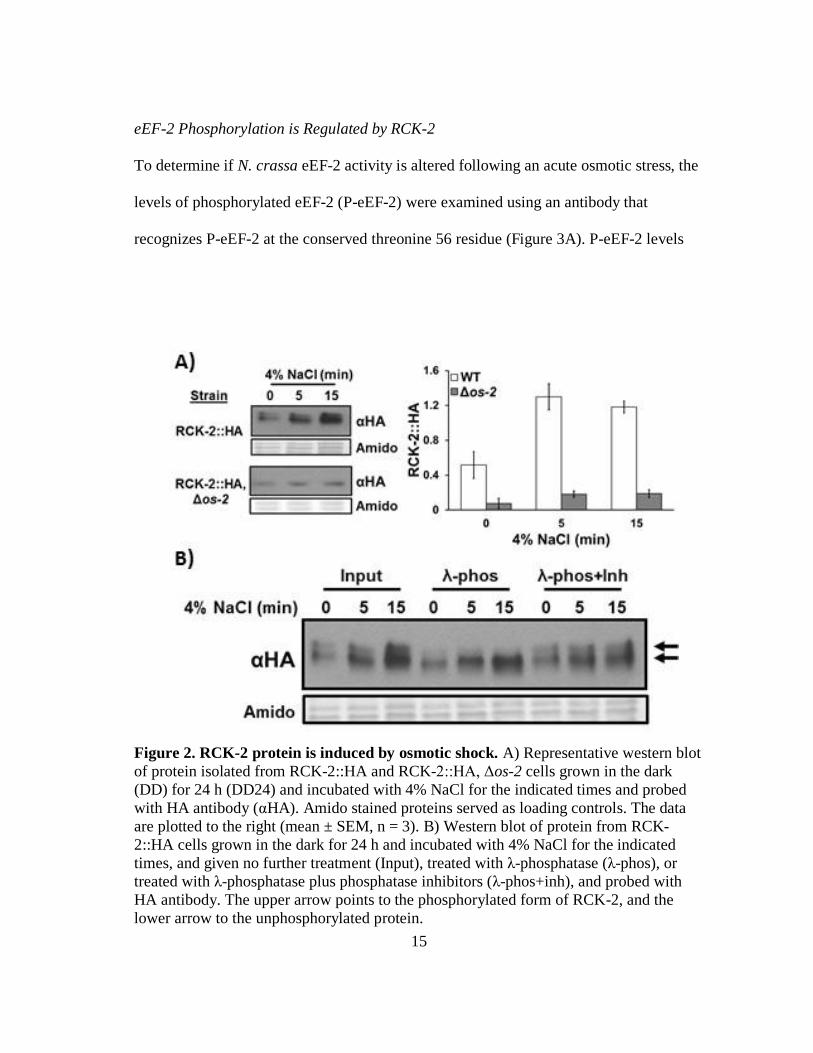
eEF-2 Phosphorylation is Regulated by RCK-2
To determine if N. crassa eEF-2 activity is altered following an acute osmotic stress, the
levels of phosphorylated eEF-2 (P-eEF-2) were examined using an antibody that
recognizes P-eEF-2 at the conserved threonine 56 residue (Figure 3A). P-eEF-2 levels
Figure 2. RCK-2 protein is induced by osmotic shock. A) Representative western blot
of protein isolated from RCK-2::HA and RCK-2::HA, Δos-2 cells grown in the dark
(DD) for 24 h (DD24) and incubated with 4% NaCl for the indicated times and probed
with HA antibody (αHA). Amido stained proteins served as loading controls. The data
are plotted to the right (mean ± SEM, n = 3). B) Western blot of protein from RCK-
2::HA cells grown in the dark for 24 h and incubated with 4% NaCl for the indicated
times, and given no further treatment (Input), treated with λ-phosphatase (λ-phos), or
treated with λ-phosphatase plus phosphatase inhibitors (λ-phos+inh), and probed with
HA antibody. The upper arrow points to the phosphorylated form of RCK-2, and the
lower arrow to the unphosphorylated protein.
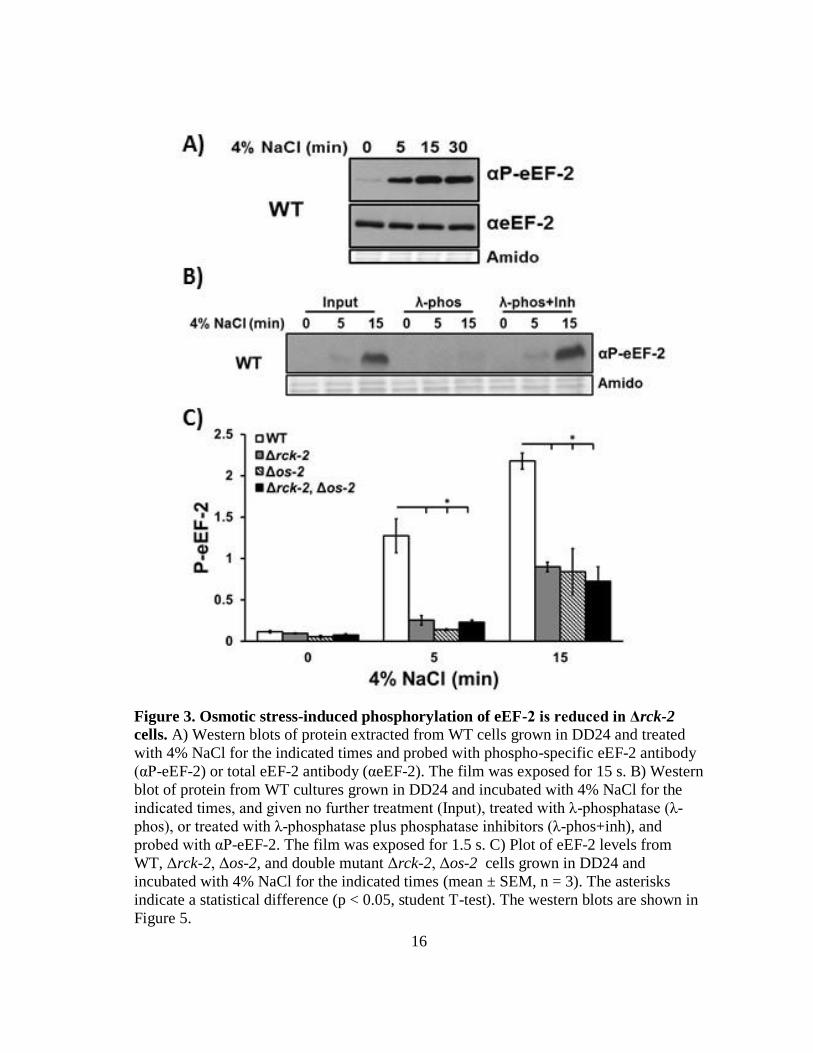
16
Figure 3. Osmotic stress-induced phosphorylation of eEF-2 is reduced in Δrck-2
cells. A) Western blots of protein extracted from WT cells grown in DD24 and treated
with 4% NaCl for the indicated times and probed with phospho-specific eEF-2 antibody
(αP-eEF-2) or total eEF-2 antibody (αeEF-2). The film was exposed for 15 s. B) Western
blot of protein from WT cultures grown in DD24 and incubated with 4% NaCl for the
indicated times, and given no further treatment (Input), treated with λ-phosphatase (λ-
phos), or treated with λ-phosphatase plus phosphatase inhibitors (λ-phos+inh), and
probed with αP-eEF-2. The film was exposed for 1.5 s. C) Plot of eEF-2 levels from
WT, Δrck-2, Δos-2, and double mutant Δrck-2, Δos-2 cells grown in DD24 and
incubated with 4% NaCl for the indicated times (mean ± SEM, n = 3). The asterisks
indicate a statistical difference (p < 0.05, student T-test). The western blots are shown in
Figure 5.
17
increased within 5 min of addition of 4% NaCl to the cultures at DD24, whereas total
eEF-2 levels, detected using an antibody generated to recognize all forms of eEF-2, were
similar in untreated and salt-treated samples. To verify the specificity of the P-eEF-2
antibody, salt-treated samples were incubated with λ-phosphatase (Figure 3B). As
expected, eEF-2 was not detected with P-eEF-2 antibody in the λ-phosphatase-treated
samples, but was detected in samples treated with λ-phosphatase plus phosphatase
inhibitors.
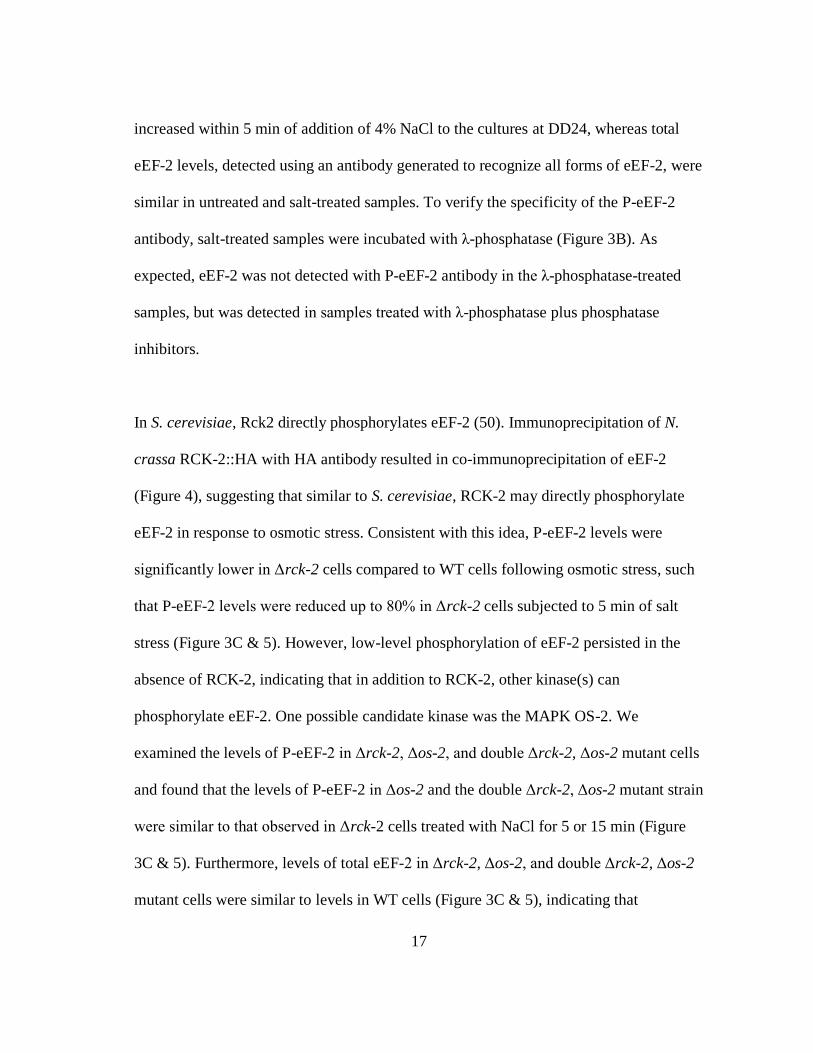
In S. cerevisiae, Rck2 directly phosphorylates eEF-2 (50). Immunoprecipitation of N.
crassa RCK-2::HA with HA antibody resulted in co-immunoprecipitation of eEF-2
(Figure 4), suggesting that similar to S. cerevisiae, RCK-2 may directly phosphorylate
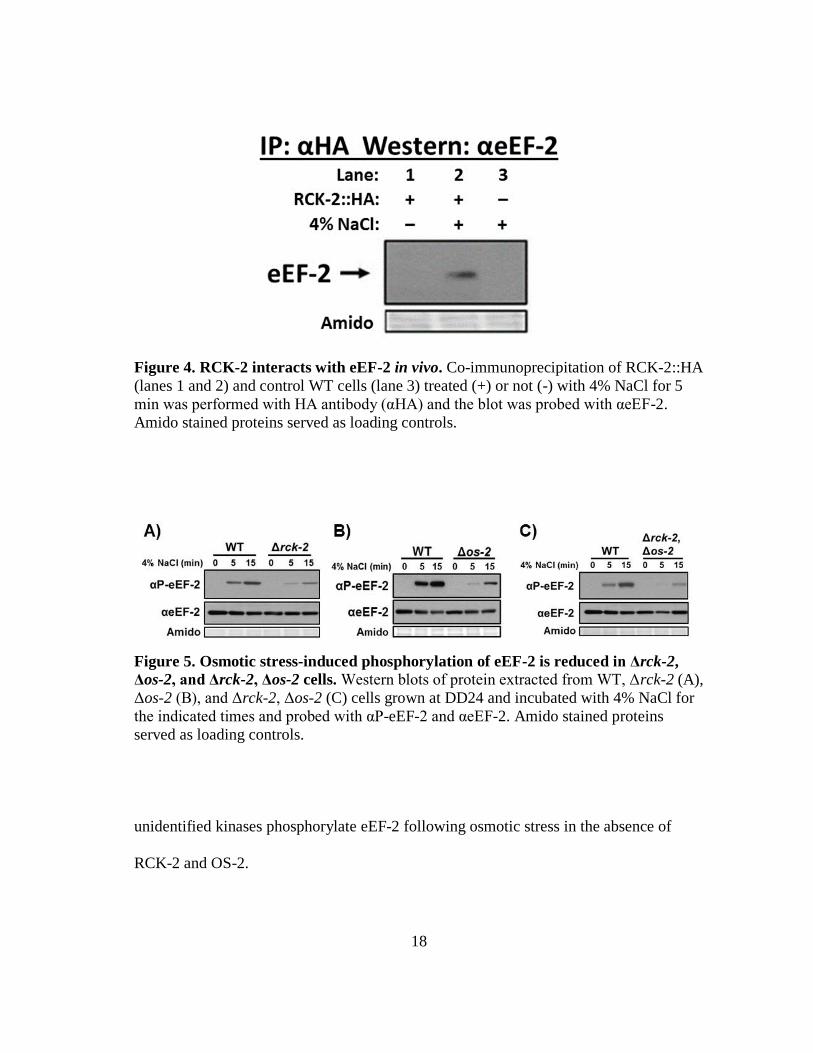
eEF-2 in response to osmotic stress. Consistent with this idea, P-eEF-2 levels were
significantly lower in Δrck-2 cells compared to WT cells following osmotic stress, such
that P-eEF-2 levels were reduced up to 80% in Δrck-2 cells subjected to 5 min of salt
stress (Figure 3C & 5). However, low-level phosphorylation of eEF-2 persisted in the
absence of RCK-2, indicating that in addition to RCK-2, other kinase(s) can
phosphorylate eEF-2. One possible candidate kinase was the MAPK OS-2. We
examined the levels of P-eEF-2 in Δrck-2, Δos-2, and double Δrck-2, Δos-2 mutant cells
and found that the levels of P-eEF-2 in Δos-2 and the double Δrck-2, Δos-2 mutant strain
were similar to that observed in Δrck-2 cells treated with NaCl for 5 or 15 min (Figure
3C & 5). Furthermore, levels of total eEF-2 in Δrck-2, Δos-2, and double Δrck-2, Δos-2
mutant cells were similar to levels in WT cells (Figure 3C & 5), indicating that
18
Figure 4. RCK-2 interacts with eEF-2 in vivo. Co-immunoprecipitation of RCK-2::HA
(lanes 1 and 2) and control WT cells (lane 3) treated (+) or not (-) with 4% NaCl for 5
min was performed with HA antibody (αHA) and the blot was probed with αeEF-2.
Amido stained proteins served as loading controls.
Figure 5. Osmotic stress-induced phosphorylation of eEF-2 is reduced in Δrck-2,
Δos-2, and Δrck-2, Δos-2 cells. Western blots of protein extracted from WT, Δrck-2 (A),
Δos-2 (B), and Δrck-2, Δos-2 (C) cells grown at DD24 and incubated with 4% NaCl for
the indicated times and probed with αP-eEF-2 and αeEF-2. Amido stained proteins
served as loading controls.
unidentified kinases phosphorylate eEF-2 following osmotic stress in the absence of
RCK-2 and OS-2.
19
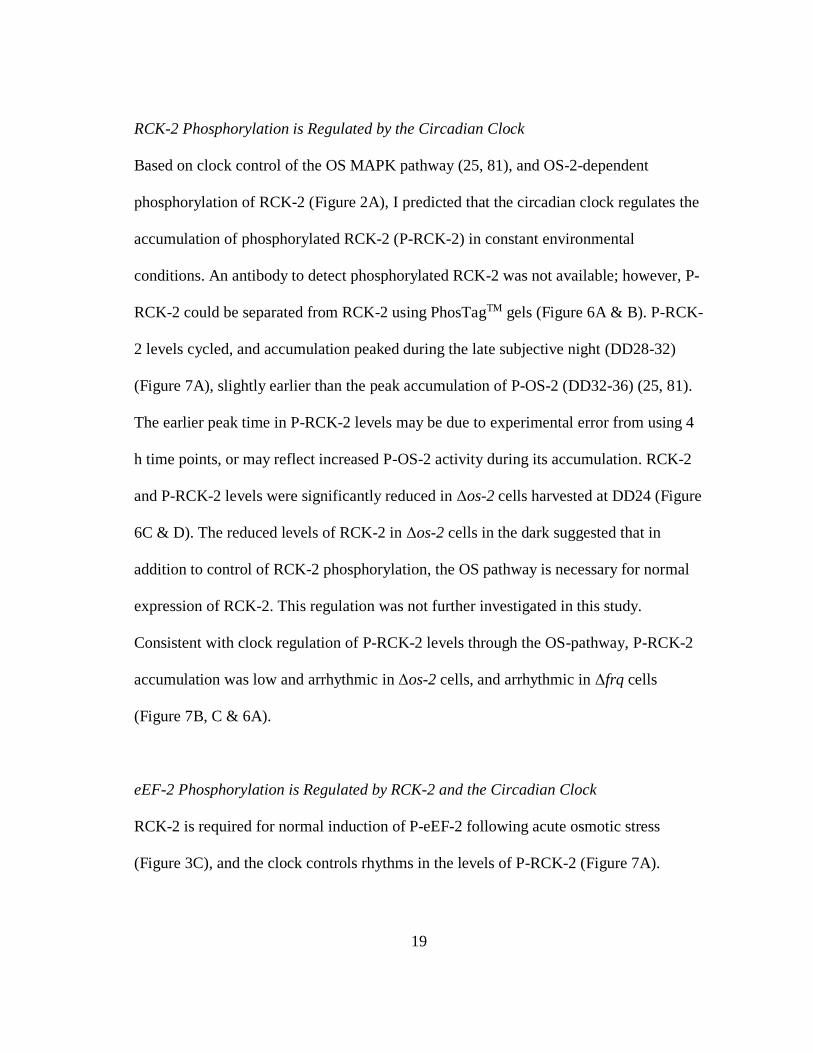
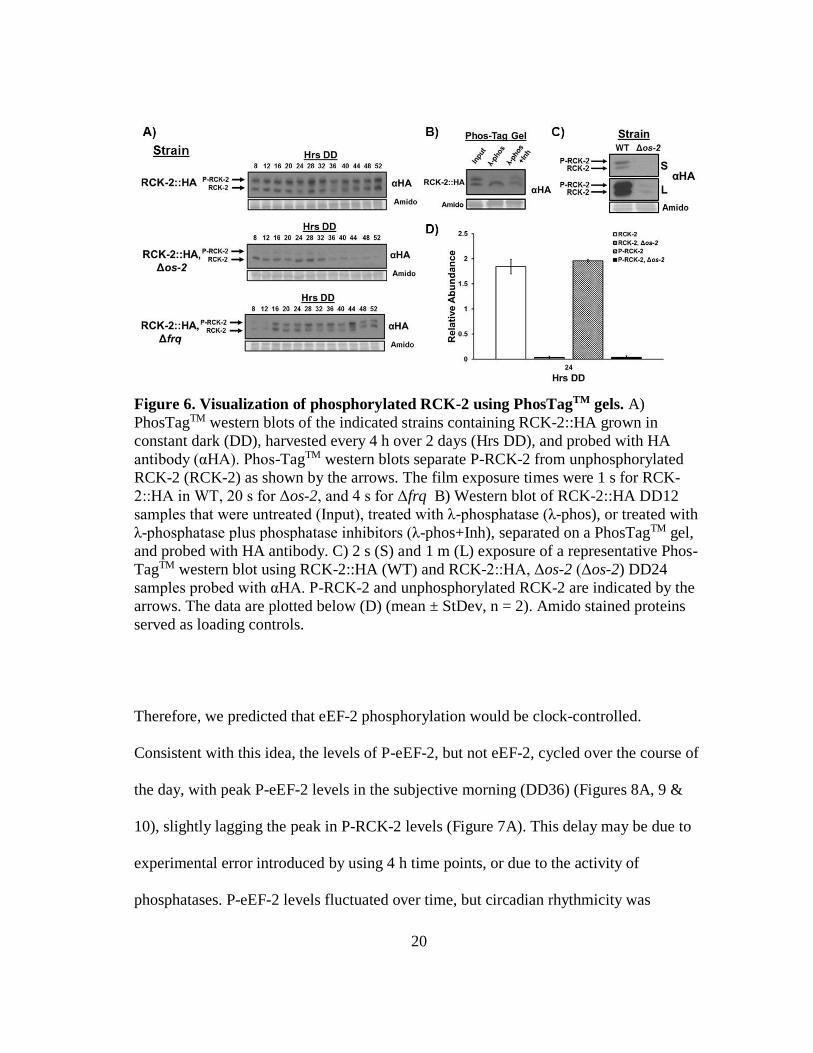
RCK-2 Phosphorylation is Regulated by the Circadian Clock
Based on clock control of the OS MAPK pathway (25, 81), and OS-2-dependent
phosphorylation of RCK-2 (Figure 2A), I predicted that the circadian clock regulates the
accumulation of phosphorylated RCK-2 (P-RCK-2) in constant environmental
conditions. An antibody to detect phosphorylated RCK-2 was not available; however, P-
RCK-2 could be separated from RCK-2 using PhosTagTM gels (Figure 6A & B). P-RCK-
2 levels cycled, and accumulation peaked during the late subjective night (DD28-32)
(Figure 7A), slightly earlier than the peak accumulation of P-OS-2 (DD32-36) (25, 81).
The earlier peak time in P-RCK-2 levels may be due to experimental error from using 4
h time points, or may reflect increased P-OS-2 activity during its accumulation. RCK-2
and P-RCK-2 levels were significantly reduced in Δos-2 cells harvested at DD24 (Figure
6C & D). The reduced levels of RCK-2 in Δos-2 cells in the dark suggested that in
addition to control of RCK-2 phosphorylation, the OS pathway is necessary for normal
expression of RCK-2. This regulation was not further investigated in this study.
Consistent with clock regulation of P-RCK-2 levels through the OS-pathway, P-RCK-2
accumulation was low and arrhythmic in Δos-2 cells, and arrhythmic in Δfrq cells
(Figure 7B, C & 6A).
eEF-2 Phosphorylation is Regulated by RCK-2 and the Circadian Clock
RCK-2 is required for normal induction of P-eEF-2 following acute osmotic stress
(Figure 3C), and the clock controls rhythms in the levels of P-RCK-2 (Figure 7A).
20
Figure 6. Visualization of phosphorylated RCK-2 using PhosTagTM gels. A)
PhosTagTM western blots of the indicated strains containing RCK-2::HA grown in
constant dark (DD), harvested every 4 h over 2 days (Hrs DD), and probed with HA
antibody (αHA). Phos-TagTM western blots separate P-RCK-2 from unphosphorylated
RCK-2 (RCK-2) as shown by the arrows. The film exposure times were 1 s for RCK-
2::HA in WT, 20 s for Δos-2, and 4 s for Δfrq B) Western blot of RCK-2::HA DD12
samples that were untreated (Input), treated with λ-phosphatase (λ-phos), or treated with
λ-phosphatase plus phosphatase inhibitors (λ-phos+Inh), separated on a PhosTagTM gel,
and probed with HA antibody. C) 2 s (S) and 1 m (L) exposure of a representative Phos-
TagTM western blot using RCK-2::HA (WT) and RCK-2::HA, Δos-2 (Δos-2) DD24
samples probed with αHA. P-RCK-2 and unphosphorylated RCK-2 are indicated by the
arrows. The data are plotted below (D) (mean ± StDev, n = 2). Amido stained proteins
served as loading controls.
Therefore, we predicted that eEF-2 phosphorylation would be clock-controlled.
Consistent with this idea, the levels of P-eEF-2, but not eEF-2, cycled over the course of
the day, with peak P-eEF-2 levels in the subjective morning (DD36) (Figures 8A, 9 &
10), slightly lagging the peak in P-RCK-2 levels (Figure 7A). This delay may be due to
experimental error introduced by using 4 h time points, or due to the activity of
phosphatases. P-eEF-2 levels fluctuated over time, but circadian rhythmicity was
21
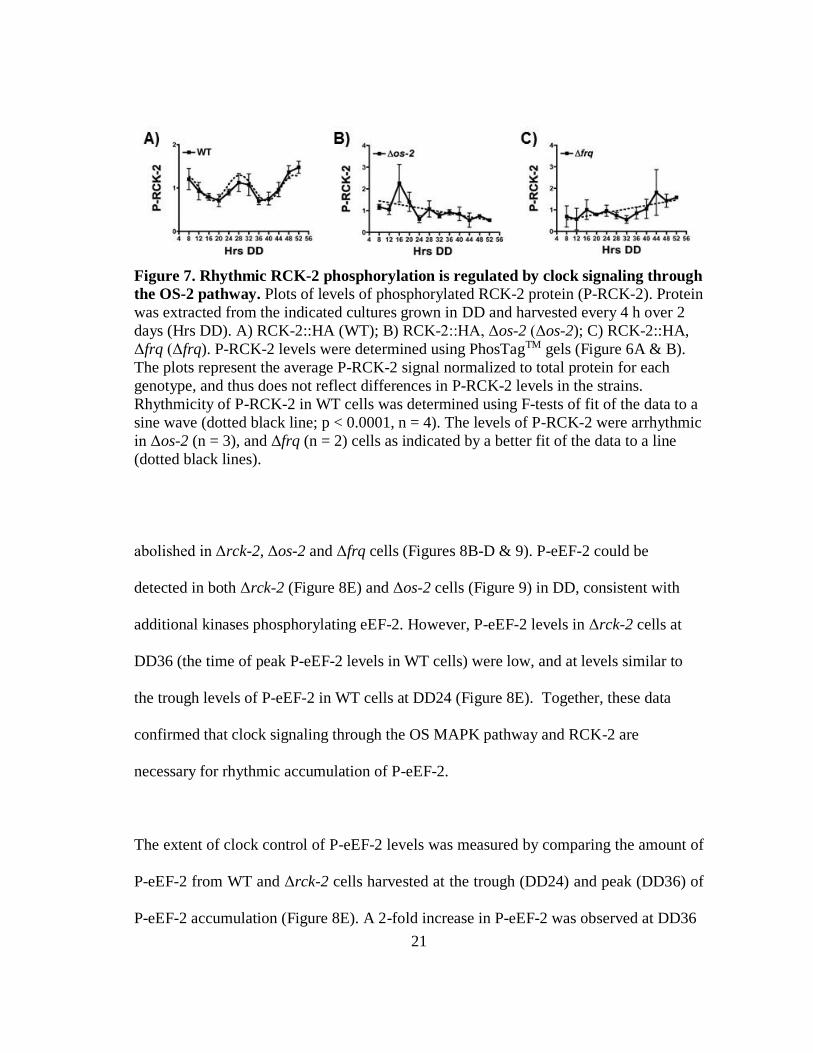
Figure 7. Rhythmic RCK-2 phosphorylation is regulated by clock signaling through
the OS-2 pathway. Plots of levels of phosphorylated RCK-2 protein (P-RCK-2). Protein
was extracted from the indicated cultures grown in DD and harvested every 4 h over 2
days (Hrs DD). A) RCK-2::HA (WT); B) RCK-2::HA, Δos-2 (Δos-2); C) RCK-2::HA,
Δfrq (Δfrq). P-RCK-2 levels were determined using PhosTagTM gels (Figure 6A & B).
The plots represent the average P-RCK-2 signal normalized to total protein for each
genotype, and thus does not reflect differences in P-RCK-2 levels in the strains.
Rhythmicity of P-RCK-2 in WT cells was determined using F-tests of fit of the data to a
sine wave (dotted black line; p < 0.0001, n = 4). The levels of P-RCK-2 were arrhythmic
in Δos-2 (n = 3), and Δfrq (n = 2) cells as indicated by a better fit of the data to a line
(dotted black lines).
abolished in Δrck-2, Δos-2 and Δfrq cells (Figures 8B-D & 9). P-eEF-2 could be
detected in both Δrck-2 (Figure 8E) and Δos-2 cells (Figure 9) in DD, consistent with
additional kinases phosphorylating eEF-2. However, P-eEF-2 levels in Δrck-2 cells at
DD36 (the time of peak P-eEF-2 levels in WT cells) were low, and at levels similar to
the trough levels of P-eEF-2 in WT cells at DD24 (Figure 8E). Together, these data
confirmed that clock signaling through the OS MAPK pathway and RCK-2 are
necessary for rhythmic accumulation of P-eEF-2.
The extent of clock control of P-eEF-2 levels was measured by comparing the amount of
P-eEF-2 from WT and Δrck-2 cells harvested at the trough (DD24) and peak (DD36) of
P-eEF-2 accumulation (Figure 8E). A 2-fold increase in P-eEF-2 was observed at DD36
22
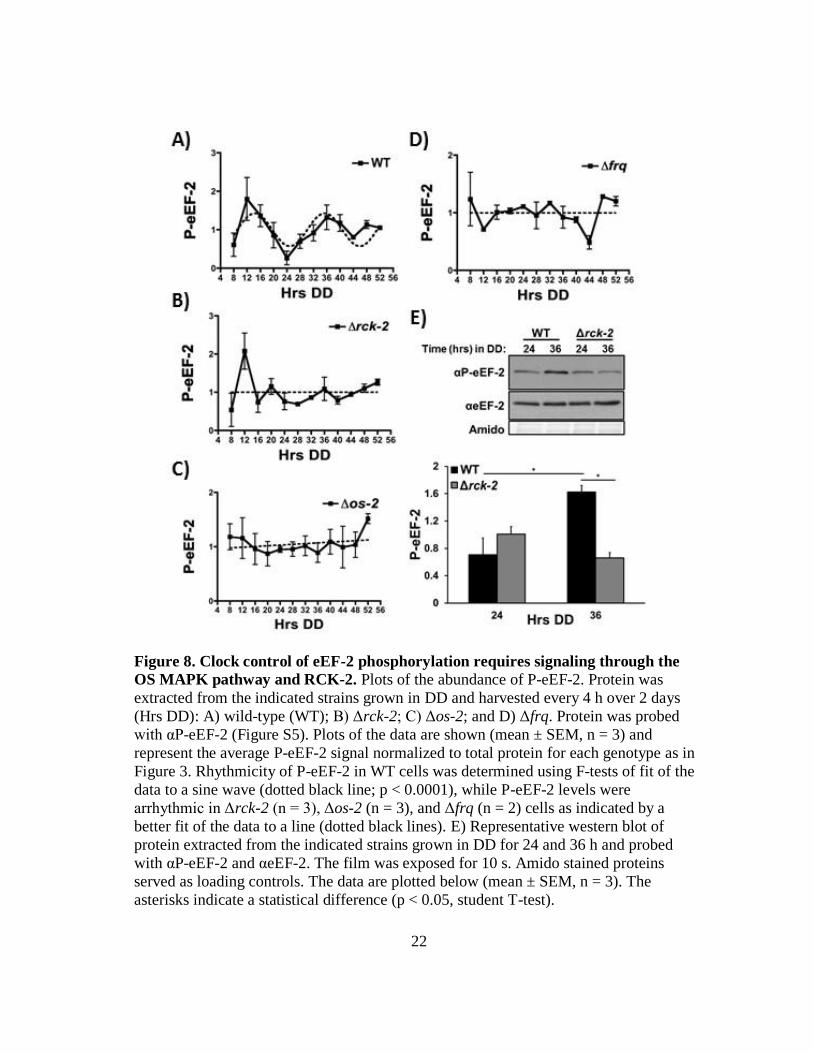
Figure 8. Clock control of eEF-2 phosphorylation requires signaling through the
OS MAPK pathway and RCK-2. Plots of the abundance of P-eEF-2. Protein was
extracted from the indicated strains grown in DD and harvested every 4 h over 2 days
(Hrs DD): A) wild-type (WT); B) Δrck-2; C) Δos-2; and D) Δfrq. Protein was probed
with αP-eEF-2 (Figure S5). Plots of the data are shown (mean ± SEM, n = 3) and
represent the average P-eEF-2 signal normalized to total protein for each genotype as in
Figure 3. Rhythmicity of P-eEF-2 in WT cells was determined using F-tests of fit of the
data to a sine wave (dotted black line; p < 0.0001), while P-eEF-2 levels were
arrhythmic in Δrck-2 (n = 3), Δos-2 (n = 3), and Δfrq (n = 2) cells as indicated by a
better fit of the data to a line (dotted black lines). E) Representative western blot of
protein extracted from the indicated strains grown in DD for 24 and 36 h and probed
with αP-eEF-2 and αeEF-2. The film was exposed for 10 s. Amido stained proteins
served as loading controls. The data are plotted below (mean ± SEM, n = 3). The
asterisks indicate a statistical difference (p < 0.05, student T-test).
23
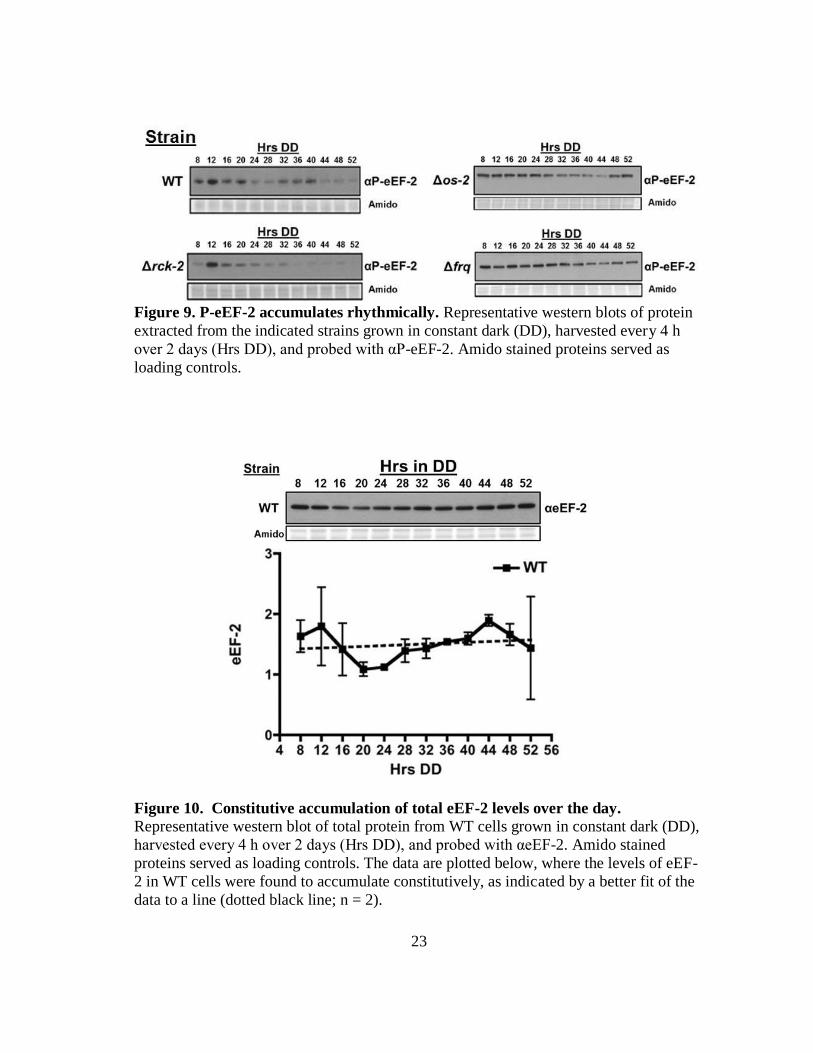
Figure 9. P-eEF-2 accumulates rhythmically. Representative western blots of protein
extracted from the indicated strains grown in constant dark (DD), harvested every 4 h
over 2 days (Hrs DD), and probed with αP-eEF-2. Amido stained proteins served as
loading controls.
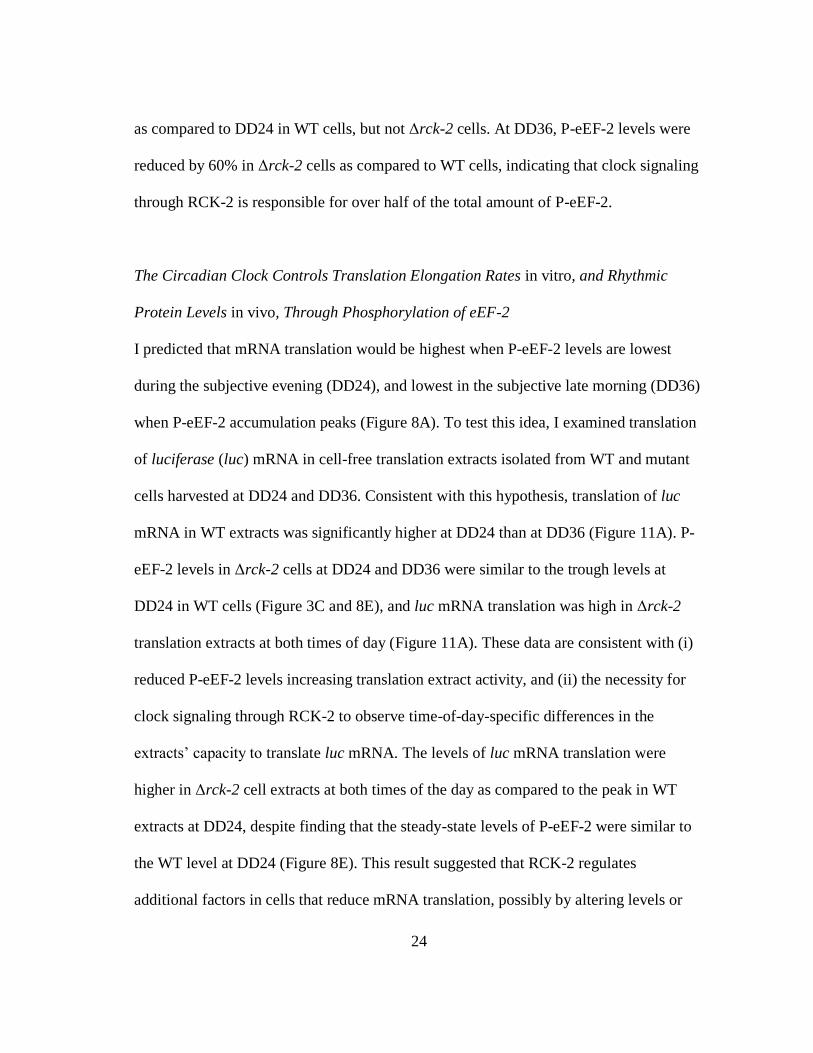
Figure 10. Constitutive accumulation of total eEF-2 levels over the day.
Representative western blot of total protein from WT cells grown in constant dark (DD),
harvested every 4 h over 2 days (Hrs DD), and probed with αeEF-2. Amido stained
proteins served as loading controls. The data are plotted below, where the levels of eEF-
2 in WT cells were found to accumulate constitutively, as indicated by a better fit of the
data to a line (dotted black line; n = 2).
24
as compared to DD24 in WT cells, but not Δrck-2 cells. At DD36, P-eEF-2 levels were
reduced by 60% in Δrck-2 cells as compared to WT cells, indicating that clock signaling
through RCK-2 is responsible for over half of the total amount of P-eEF-2.
The Circadian Clock Controls Translation Elongation Rates in vitro, and Rhythmic
Protein Levels in vivo, Through Phosphorylation of eEF-2
I predicted that mRNA translation would be highest when P-eEF-2 levels are lowest
during the subjective evening (DD24), and lowest in the subjective late morning (DD36)
when P-eEF-2 accumulation peaks (Figure 8A). To test this idea, I examined translation
of luciferase (luc) mRNA in cell-free translation extracts isolated from WT and mutant
cells harvested at DD24 and DD36. Consistent with this hypothesis, translation of luc
mRNA in WT extracts was significantly higher at DD24 than at DD36 (Figure 11A). P-
eEF-2 levels in Δrck-2 cells at DD24 and DD36 were similar to the trough levels at
DD24 in WT cells (Figure 3C and 8E), and luc mRNA translation was high in Δrck-2
translation extracts at both times of day (Figure 11A). These data are consistent with (i)
reduced P-eEF-2 levels increasing translation extract activity, and (ii) the necessity for
clock signaling through RCK-2 to observe time-of-day-specific differences in the
extracts’ capacity to translate luc mRNA. The levels of luc mRNA translation were
higher in Δrck-2 cell extracts at both times of the day as compared to the peak in WT
extracts at DD24, despite finding that the steady-state levels of P-eEF-2 were similar to
the WT level at DD24 (Figure 8E). This result suggested that RCK-2 regulates
additional factors in cells that reduce mRNA translation, possibly by altering levels or
25
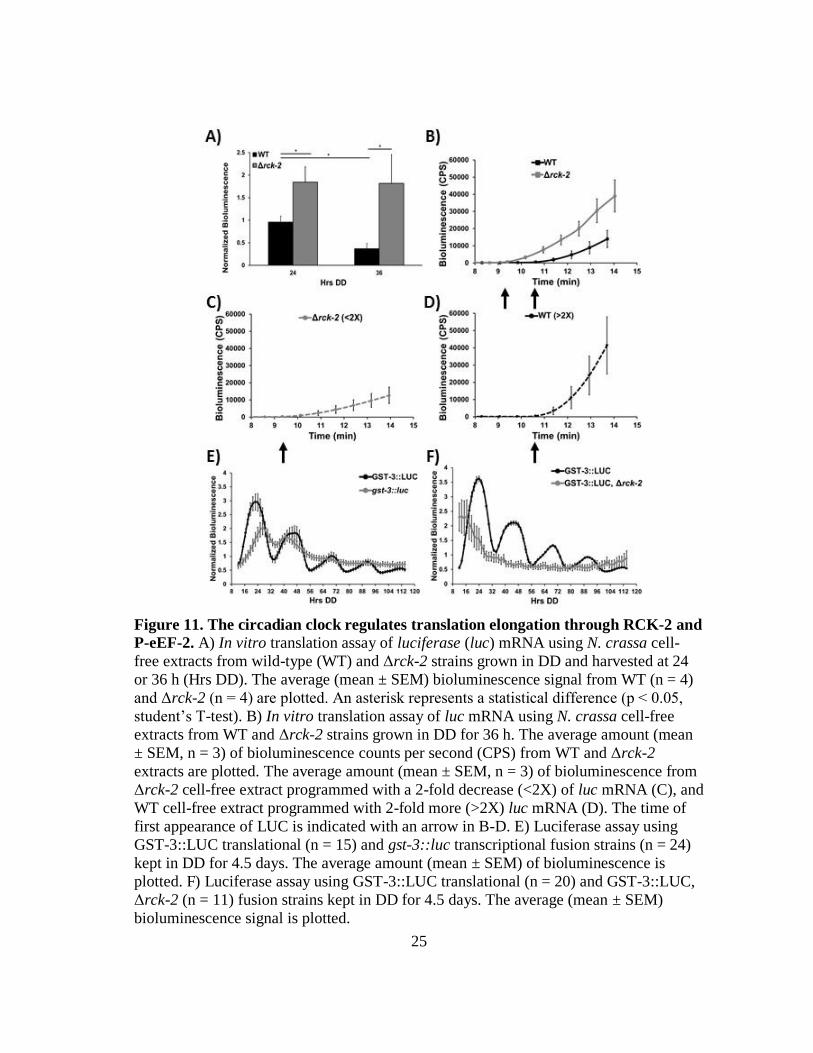
Figure 11. The circadian clock regulates translation elongation through RCK-2 and
P-eEF-2. A) In vitro translation assay of luciferase (luc) mRNA using N. crassa cell-
free extracts from wild-type (WT) and Δrck-2 strains grown in DD and harvested at 24
or 36 h (Hrs DD). The average (mean ± SEM) bioluminescence signal from WT (n = 4)
and Δrck-2 (n = 4) are plotted. An asterisk represents a statistical difference (p ˂ 0.05,
student’s T-test). B) In vitro translation assay of luc mRNA using N. crassa cell-free
extracts from WT and Δrck-2 strains grown in DD for 36 h. The average amount (mean
± SEM, n = 3) of bioluminescence counts per second (CPS) from WT and Δrck-2
extracts are plotted. The average amount (mean ± SEM, n = 3) of bioluminescence from
Δrck-2 cell-free extract programmed with a 2-fold decrease (<2X) of luc mRNA (C), and
WT cell-free extract programmed with 2-fold more (>2X) luc mRNA (D). The time of
first appearance of LUC is indicated with an arrow in B-D. E) Luciferase assay using
GST-3::LUC translational (n = 15) and gst-3::luc transcriptional fusion strains (n = 24)
kept in DD for 4.5 days. The average amount (mean ± SEM) of bioluminescence is
plotted. F) Luciferase assay using GST-3::LUC translational (n = 20) and GST-3::LUC,
Δrck-2 (n = 11) fusion strains kept in DD for 4.5 days. The average (mean ± SEM)
bioluminescence signal is plotted.
26
activities of ribosomes, tRNAs, or translation factors. The nature of this regulation will
be investigated in future studies.
To determine if rhythmic P-eEF-2 levels affect translation elongation rates, we used an
N. crassa cell-free translation protocol (82, 83) that accurately reflects protein translation
in vivo (82, 84). Firefly luc mRNA was used as the template in the cell-free system to
determine the time of first appearance (TFA) of the luminescence signal. TFA is a
measure of the time needed for the ribosome to complete protein synthesis and is
indicative of translation elongation rate (83, 84). Changes in translation elongation rates
as a function of eEF-2 phosphorylation were examined in cell-free extracts isolated from
WT and Δrck-2 cells harvested at the time of peak P-eEF-2 levels in WT cells (DD36).
As predicted, TFA was detected earlier in Δrck-2 than in WT extracts (Figure 11B), in
line with reduced P-eEF-2 levels and increased elongation rates in Δrck-2 cells as
compared to WT cells. In accordance with increased translation elongation rates in Δrck-
2 extracts, the slope of LUC accumulation over time was two-fold higher in Δrck-2
extracts compared to WT extracts (Figure 11B). To determine TFA under conditions
where LUC synthesis rates were overall similar, we examined the consequences of
varying the concentration of mRNA used to program extracts. The rate of accumulation
of LUC in Δrck-2 was comparable to that of WT when Δrck-2 was programmed with 2-
fold less mRNA than WT (Figure 11C). Importantly, the TFA was still earlier than in
WT extracts, consistent with an increased elongation rate in Δrck-2 extracts. Similarly,
when WT extracts were programmed with 2-fold more mRNA than Δrck-2 (Figure
27
11D), the accumulation of LUC after TFA correspondingly increased to levels similar to
Δrck-2, but TFA was still delayed relative to Δrck-2.
To examine if rhythmic accumulation of P-eEF-2 provides a mechanism to rhythmically
control mRNA translation elongation in vivo, we assayed rhythmicity of a GST-3
(encoding glutathione S-transferase)::LUC translational fusion in WT and Δrck-2 cells.
This gene was chosen based on constitutive gst-3 mRNA accumulation (70), and
evidence for rhythms of GST activity in mammalian cells (85). Consistent with the
transcriptome data (70), a gst-3 promoter::luc fusion was constitutively expressed in WT
cells (Figure 11E). In contrast, GST:LUC protein levels cycled in WT, but not in Δrck-2
or Δfrq cells (Figure 11E & F, 12), demonstrating that clock signaling through RCK-2
and eEF-2 provides a mechanism to control translation elongation and protein
accumulation. However, not all mRNAs are affected by rhythmic accumulation of P-
eEF-2. We found that the levels and cycling of the core clock protein FRQ was not
altered in Δrck-2 cells (Figure 13A & B).
Discussion
Increasing evidence points to the importance of the circadian clock in controlling mRNA
translation, including rhythmic activation of cap-dependent translation factors (41, 74,
86-88), and specific RNA binding proteins that control the translation of core clock
genes (89-93). While the initiation of translation has long been considered to be the
28
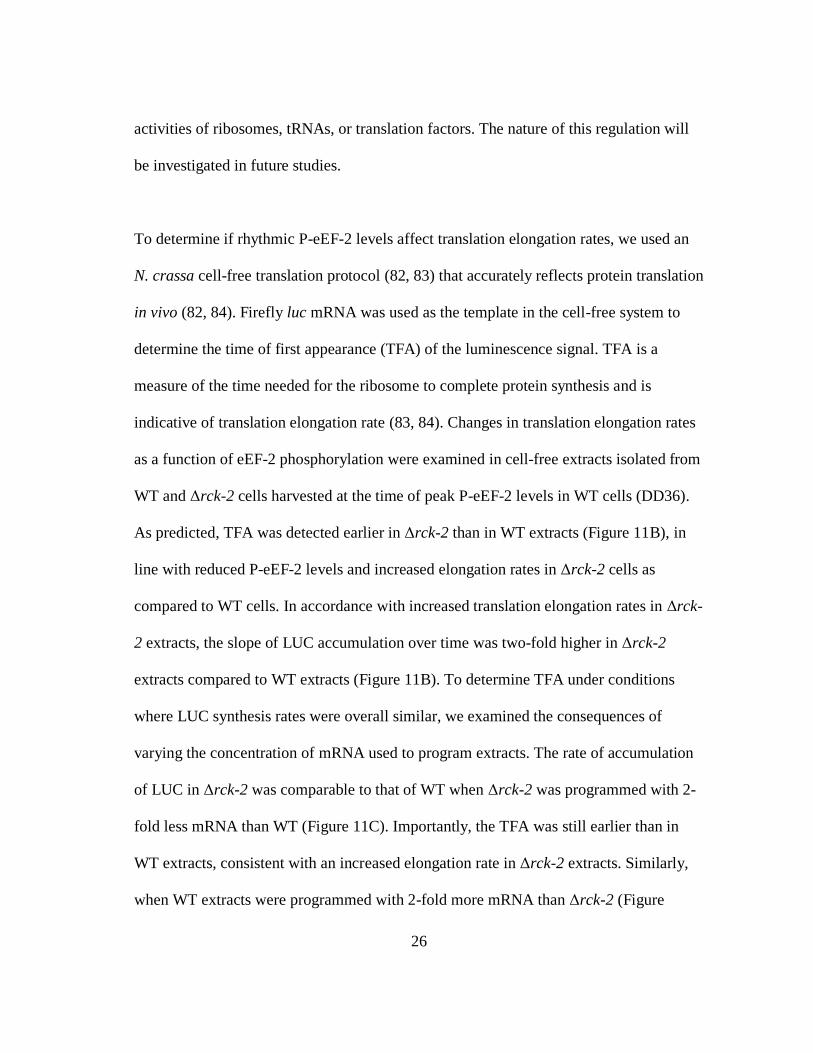
Figure 12. Rhythmic accumulation of GST-3 is abolished in a clock mutant strain. The average amount (mean ± SEM, n = 24) of bioluminescence from GST-3::LUC, Δfrq
cells grown in the dark for the indicated times (Hrs DD) is plotted.
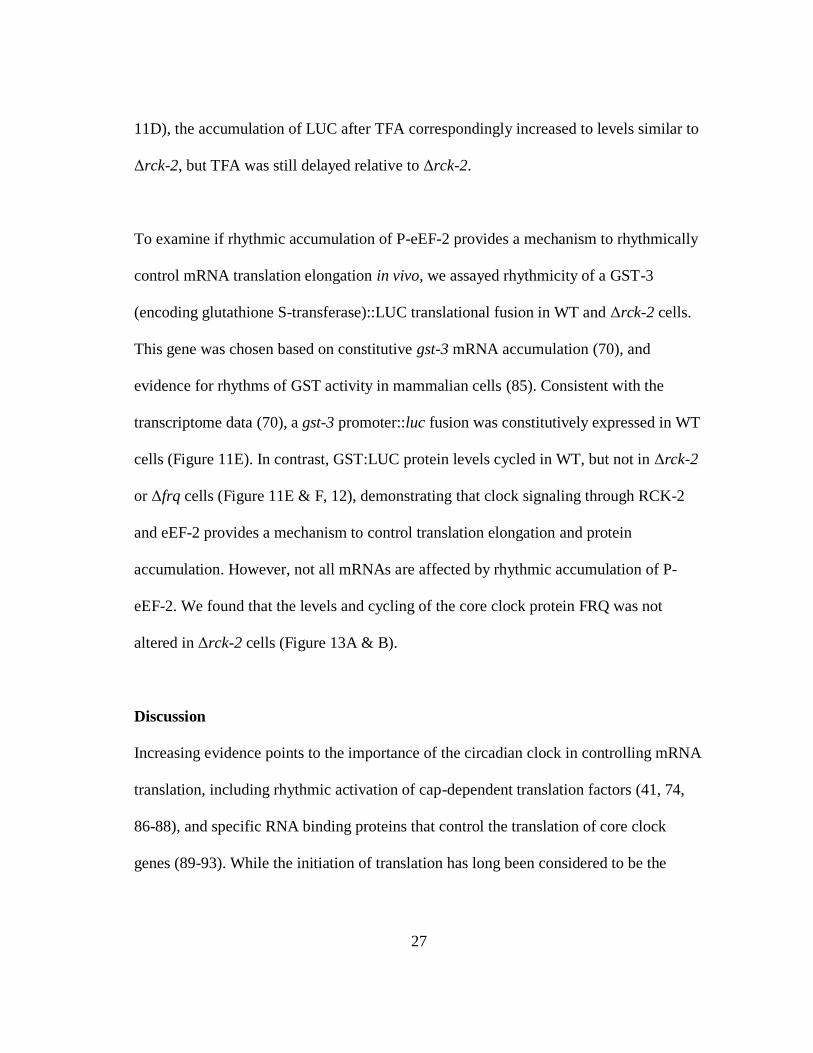
Figure 13. FRQ levels and rhythmicity in Δrck-2 cells are similar to WT cells.
Western blots of protein extracted from WT (A) and Δrck-2 (B) cells grown in DD,
harvested every 4 h over 2 days (Hrs DD), and probed with FRQ antibody (αFRQ).
Amido stained proteins served as loading controls. The data are plotted below (mean ±
SEM, n = 3). Rhythmicity of FRQ in WT and Δrck-2 cells was determined using F-tests
of fit of the data to a sine wave (dotted black line; p < 0.0001). The period of the
rhythms are given below.
29
primary control step in translation (94), a growing body of evidence points to translation
elongation being regulated (95, 96), with phosphorylation and reduction in activity of
eEF-2 being a central point in this control. Here, we showed that the N. crassa circadian
clock, through rhythmic control of the OS MAPK pathway and downstream effector
protein RCK-2, generates a rhythm in P-eEF-2 levels, peaking in the subjective day.
This regulation leads to decreased translation activity and decreased translation
elongation rates during the day in vitro.
N. crassa RCK-2 most closely resembles mammalian eEF-2 kinase MAPKAP-K2.
Similar to RCK-2 in fungi, mammalian MAPKAP-K2 activity is controlled by the stress-
induced p38 MAPK pathway (63, 97). MAPKAP-K2 phosphorylates and activates eEF-
2 kinase (eEF-2K), which in turn phosphorylates and inactivates eEF-2 (53). In
mammals, several different signaling pathways converge on eEF-2K to activate or
repress its activity and ultimately control the levels of P-eEF-2. In response to
environmental stress, hypoxia, and nutrient status, p38 MAPK and mTOR signaling
pathways inhibit eEF-2K (98-100), while AMP-kinase and cyclic AMP (cAMP)-
dependent protein kinase A signaling activate eEF-2K (101-104). N. crassa cells lack an
obvious homolog of eEF-2K. While my data showing that eEF-2 and RCK-2
coimmunoprecipitate in total protein extractions is consistent with a direct interaction
between the two proteins, I cannot exclude the possibility that phosphorylation of eEF-2
by RCK-2 may be indirect and mediated through an unidentified kinase that functions
similarly to eEF-2K. However, because low levels of P-eEF-2 were observed in Δrck-2,
30
Δos-2, and in Δrck-2, Δos-2 double mutants following osmotic stress (Figure 3C & 5), it
appears that RCK-2 is the major pathway leading to phosphorylation of eEF-2, although
other kinases, such as AMPK, PKA, and/or TOR-pathway directed kinases, may also
have minor roles. Importantly, p38, as well as TOR, AMPK activity, and cAMP levels,
are clock-controlled in higher eukaryotes (105-110), suggesting that clock control of
translation elongation through rhythmic eEF-2 phosphorylation may be conserved.
Furthermore, recent studies have shown that eEF-2 levels cycle in abundance in mouse
liver (42, 111); however, it remains to be determined if rhythms in mammalian eEF-2
levels affect its activity.
Our studies have uncovered a new mechanism for circadian clock control of protein
abundance through the effects of rhythmic accumulation of P-eEF-2 on protein
synthesis. These data lead to additional questions, including (i) to what extent does clock
control of translation elongation affect rhythmic protein levels, and (ii) what is the
advantage of clock control of translation elongation to the organism? Recent ribosome
profiling in mammalian cells revealed that ~10% of mRNAs with rhythmic ribosome
occupancy lacked corresponding rhythmic mRNA levels (111, 112). These data support
a role for the clock in controlling translation of specific, rather than all, mRNAs.
Consistent with clock control of eEF-2 activity promoting rhythmic translation of
specific mRNAs, rather than providing a mechanism to globally control translation, we
show that RCK-2, which is needed for rhythms in P-eEF-2 levels, is not necessary for
rhythms in accumulation of the clock protein FRQ (Figure 13), whereas rhythms in
31
GST-3 protein levels require RCK-2 (Figure 11). Although there may be several ways to
achieve specificity, we speculate that a slow-down in translation elongation rate during
the day could reduce the expression of mRNAs for which elongation is rate-limiting,
while the expression of mRNAs for which initiation is rate-limiting, would either not be
affected, or would show relatively increased translation rates as a result of increased
availability of initiation factors.
The clock plays a major role in controlling metabolism (113), including energy
metabolism (114) and its major currency, ATP (115-117). As translation is one of the
most energy demanding processes in the cell, it makes sense to coordinate protein
translation to times of day when energy levels are highest. In N. crassa, clock-controlled
mRNAs generally peak at two phases, dawn and dusk, with dusk phase enriched for
genes involved in ATP-requiring anabolic processes, and dawn-phase enriched for genes
involved in ATP-generating catabolism (70, 71). Based on our data showing that the
levels of P-eEF-2 peak during the day, we predict increased rates of mRNA translation at
night, directly following the peak production of ATP during the day, and in coordination
with other anabolic processes, including lipid and nucleotide metabolism. In addition,
environmental stress to the organism peaks during the day (118). Linking translation
elongation control to stress-induced and clock-controlled MAPK signaling, as well as to
nutrient sensing pathways, likely provides an adaptive mechanism to partition the
energy-demanding processes of translation to times of the day that are less stressful to
the organism.
32
Materials and Methods
Strains and Growth Conditions
Vegetative growth conditions and crossing protocols were as previously described (25,
119). Unless otherwise indicated, the strains used in this study contained the ras-1bd
mutation (Table A1). RCK-2::HA homokaryotic strains (DBP 1254 mat A, rck-2::3X
HA::hph, and DBP 1255; mat a, rck-2::3X HA::hph) were generated by transforming
FGSC9718 (mat a, Δmus-51::bar+) with pRCK-2::3X HA, and crossing transformants
(mat a, Δmus-51::bar+, rck-2::3X HA) with FGSC 2489 (mat A). pRCK-2::3X HA was
generated by 3-way PCR (120) combining a 2.4 kb fragment of rck-2 (without the
translational stop codon), a 10X glycine linker – 3X hemagglutinin (HA) – hygromycin-
B resistance gene (hph), and 1.5 kb of the 3’ UTR of rck-2. The resulting PCR product
was cloned into pCRTM – Blunt vector (#K2700-20, Thermo Fisher Scientific Inc.,
Waltham, MA, USA). Incorporation of 3X HA into the native locus was verified by
PCR, and integration of the HA-tagged RCK-2 construct was confirmed by detection of
a ̴ 75 kDa HA-tagged protein (RCK-2::HA predicted size = 72.6 kDa) in the
transformants by western blot. The GST-3::LUC translational fusion was generated by
3-way PCR using a fully codon-optimized luciferase gene (121), and co-transformed
with either pBP15 (DBP301) into WT (FGSC 2489) and frq (DBP 1320), or with
pBARGEM7-2 (DBP 425) into rck2 (DBP 828). The gst-3 gene was targeted for
replacement by the GST-3::LUC construct via homologous recombination. Hygromycin
or basta-resistant transformants were picked and screened for luciferase activity. To
generate the Pgst-3::luc transcriptional fusion, a 1.3-kb promoter region of gst-3 was
33
amplified with primers gst3SpeI F (5’ GGACGCTACTAGTTGACAAGATT 3’) and
gst3AscI R (5’ CGATGGCGCGCCGTCTGACATGGTAACG 3’). The PCR product
was digested with SpeI and AscI, and cloned into plasmid pRMP57 containing the
codon-optimized luciferase gene. The resulting plasmid (DBP 594), targeted to the his-3
locus, was digested with PciI, and co-transformed with either pBP15 (DBP 301) into
wild-type 74-OR23-IV (FGSC 2489) and frq (DBP 1320) cells, or with pBARGEM7-2
(DBP 425) into rck2 (DBP 828). Hygromycin or basta-resistant transformants were
picked and screened for luciferase activity. Verification of gene deletions for the strains
generated in this study was accomplished by PCR, and integration of HA-tagged
constructs was confirmed by western blot. All strains containing the hph construct were
maintained on Vogel’s minimal media, supplemented with 200 μg/mL of hygromycin B
(#80055-286, VWR, Radner, PA). Strains containing the bar cassette were maintained
on Vogel’s minimal media lacking NH4NO3 and supplemented with 0.5% proline and
200 μg/mL of BASTA (Liberty 280 SL Herbicide, Bayer, NC). Osmotic stress was
carried out on cells grown in Vogel’s minimal media, 2% glucose, 0.5% arginine, pH 6.0
and shaking in constant light (LL) for 24 h at 25°C. The cultures were transferred to
constant dark (DD) for 24 h at 25°C and 4% NaCl was added 5, 10, 15, and 30 min prior
to harvest. Tissue for RNA and protein extraction was harvested by flash freezing in
liquid N2. Circadian time course experiments were conducted as previously described
(25) with cells synchronized by a light-to-dark transfer (25°C in LL to 25°C in DD).
34
Protein Extraction, Western Blotting, λ-protein Phosphatase Treatment, and Co-
immunoprecipitation
To determine levels of RCK-2 phosphorylation, protein was extracted as previously
described (122) with the following modification: the extraction buffer was 50 mM
HEPES pH 7.4, 137 mM NaCl, 10% glycerol, 5 mM EDTA, 10 mM NaF, 1 mM PMSF,
1 mM sodium ortho-vanadate, 1 mM β-glycerophosphate, 1X aprotinin (#A1153, Sigma-
Aldrich, St. Louis, MO), 1X leupeptin hemisulfate salt (#L2884, Sigma-Aldrich), and
1X pepstatin A (#P5318, Sigma-Aldrich). To assay levels of total eEF-2 and
phosphorylation of eEF-2, protein was extracted as previously described for RCK-2 with
the following modification: the extraction buffer contained 100 mM Tris pH 7.0, 1%
SDS. FRQ protein was extracted as previously described for RCK-2 with the following
modification: the extraction buffer was 50 mM HEPES pH 7.4, 137 mM NaCl, 10%
glycerol, 5 mM EDTA, 10 mM NaF, 1 mM PMSF, 1 mM sodium ortho-vanadate, and 1
mM β-glycerophosphate. For samples that were separated on PhosTagTM acrylamide
gels, the extraction buffer consisted of 50 mM HEPES pH 7.4, 137 mM NaCl, 10%
glycerol, plus protease and phosphatase inhibitors.
Protein concentration was determined using the Bradford assay (#500-0112, Bio-Rad
Laboratories, Hercules, CA). Protein samples (50 μg) were separated on 10%
SDS/PAGE gels and blotted to an Immobilon-P nitrocellulose membrane (#IPVH00010,
Millipore, Billerica, MA) according to standard methods. Phos-tagTM acrylamide gels
consisted of 8% SDS/PAGE gels with the addition of 35 μM Phos-tagTM Acrylamide
35
AAL-107 (#300-93523, Wako Chemicals USA, Inc., Richmond) and 70 μM MnCl2
according to the manufacturer’s recommendations.
RCK-2::HA was detected using Rat monoclonal anti-HA primary antibody
(#11867423001, Roche Diagnostics, Indianapolis, IN) in 5% milk, 1X TBS, 0.1%
Tween-20 at a concentration of 1:1,000 and anti-Rat IgG-Peroxidase secondary antibody
(#A5795, Sigma-Aldrich) at a concentration of 1:5,000. Total eEF-2 protein was
detected using Rabbit anti-eEF-2 primary antibody (#2332S, Cell Signaling Technology,
Beverley, MA) in 5% BSA, 1X TBS, 0.1% Tween-20 at a concentration of 1:5,000 and
anti-Rabbit IgG HRP secondary antibody (#170-6515, Bio-Rad Laboratories) at a
concentration of 1:10,000. Phosphorylated eEF-2 protein was detected using Rabbit anti-
Phospho-eEF-2 (Thr56) primary antibody (#2331S, Cell Signaling Technology) in 5%
BSA, 1X TBS, 0.1% Tween-20 at a concentration of 1:5,000 and anti-Rabbit IgG HRP
secondary antibody (#170-6515, Bio-Rad Laboratories) at a concentration of 1:10,000.
FRQ protein was detected using mouse monoclonal anti-FRQ primary antibody
(supernatant from clone 3G11-1B10-E2, a gift from M. Brunner’s lab) in 7.5% milk, 1X
TBS, 0.1% Tween-20 at a concentration of 1:200 and anti-mouse IgG-Peroxidase
secondary antibody (#170-6516, BioRad Laboratories) at a concentration of 1:10,000.
Detection of all proteins was by chemi-luminescence using SuperSignal® West Pico
Substrate (#34077, Thermo Scientific, Rockford, IL). Western blot signals were
quantitated using ImageJ (NIH) and normalized to total protein levels from amido
36
stained protein gels. The ratio of signal to total protein for each sample/gel (value X)
was averaged (Av), and each value of X was divided by the Av signal for plotting.
To verify phosphate-specific signals, 50 μg of protein were treated with 20 U of λ-
protein phosphatase (#P0753S, New England Biolabs, Ipswich, MA) for 30 min at 30°C,
followed by boiling for 5 min in 1X Laemmli sample buffer. Inhibition of λ-protein
phosphatase was accomplished by adding 10 mM NaF, 1 mM sodium ortho-vanadate
and 1 mM β-glycerophosphate to samples just prior to the addition of λ-protein
phosphatase.
Co-immunoprecipitation was carried out using 25 μL of GammaBindTM G SepharoseTM
beads (#17-0885-01, Ge Healthcare Bio-Sciences, Pittsburgh, PA) as recommended by
the manufacturer. Rat monoclonal anti-HA antibody (1:100; #11867423001, Roche
Diagnostics) was bound to prewashed beads overnight at 4°C. Total protein (2 mg) was
added to the beads and incubated overnight at 4°C.
Cell-Free Extracts and in vitro Translation for Assaying Luciferase
Cell-free extracts were prepared from germinated conidia as previously described (123,
124). In vitro translation of luc mRNA was accomplished as previously described using
capped pQ101-Luc mRNA (124, 125). Incubations were carried out for 45 min at 26°C,
and the reactions were stopped by adding 1X passive lysis buffer (#E1941, Promega,
Madison, WI). 50 μL of luciferase assay reagent (126) and 15 μL of sample reaction
37
were loaded per well on an OptiPlateTM-96 F plate (#6005279, Perkin Elmer, Waltham,
MA, USA), and bioluminescence was then immediately measured using a Victor3-V
multi-label counter (#1420-252, Perkin Elmer, Waltham, MA). Relative
bioluminescence was determined by normalizing the bioluminescence (CPS) values to
the average of each plate. To examine the rate of translation elongation, the reaction
buffer was modified to include 5 μM amino acids, 25 mM firefly luciferin (#306,
Prolume Ltd., Pinetop, AZ, USA) and 5 mM Coenzyme A (#309, Prolume Ltd., Pinetop,
AZ, USA). 25 μL of cell-free extract, 5 μL (12 ng/µL) of luc mRNA, and 20 μL of
reaction buffer were loaded per well on an OptiPlateTM-96 F plate, and bioluminescence
was continuously measured for up to 15 min.
In vivo Luciferase Assay
Each well of a 96-well plate was filled with 150 µl of solid assay media (1X Vogel’s
salt, 0.03% glucose, 0.05% arginine, 0.5 mg/ml biotin, 0.1M quinic acid,1.5% agar and
25 µM D-luciferin) (Gold Biotechnology, St Louise, MO) (pH = 6.0). Quinic acid was
added to the media to increase the amplitude of the luciferase rhythms (127). The plates
were air dried for 12 h in a sterile laminar flow hood. A conidial suspension (2X10⁵
cells/ml) was prepared from slant cultures, and 5 µl was used per well. The plate was
covered with a breathable membrane (Diversified Biotech, Dedham, MA). The cultures
were grown at 30°C for 24 h and moved to an Envision Xcite plate reader at 25°C
(Perkin Elmer, Boston, MA) for measuring bioluminescence. Luminescence was
counted every 90 min for at least 5 continuous days.
38
Statistical Analysis
Rhythmic data was fit either to a sine wave or a line as previously described (25, 128).
P-values represent the probability that the sine wave best fits the data. The student T-test
was used to determine significance in changes in the levels of P-eEF-2 and
bioluminescence. Error bars in all graphs represent the SEM from at least 3 independent
experiments, unless otherwise indicated.
39
CHAPTER III
REGULATION OF mRNA TRANSLATION
Overview
In this section, I describe experiments that were performed to identify mRNAs that are
being translationally regulated. By comparing ribosome profiling and transcriptome
(RNAseq) data, I identified sets of genes that are being regulated at the level of
translation, but not at the level of transcription, either following an osmotic stress, a light
pulse, or over a circadian time course. These genes were enriched for metabolic process,
and may represent a mechanism for clock regulation of metabolism.
Introduction
Stress response pathways act as a mechanism for cells to respond to extracellular stimuli
(i.e., osmotic shock, light response, etc.) that may be detrimental or beneficial to their
survival (129-131). After the cell encounters a stress, response pathways are activated
which activate many downstream genes (132). Evidence suggests that genes are not just
being regulated at the level of transcription following stress, but that specific mRNAs
are translationally up- or down-regulated, in the absence of an increase or decrease in
their total mRNA levels (52). In Neurospora, little is known about which constitutively
expressed mRNAs are preferentially targeted to the translational machinery following an
external stimuli (i.e., after osmotic stress or a light pulse) or if there is a mechanism for
this specificity.
40
The circadian clock acts as an endogenous mechanism to regulate response pathways,
allowing organisms to anticipate daily environmental stresses (128, 133). Depending on
the organism and tissue, nearly half of an organism’s expressed genes are under control
of the circadian clock at the level of transcription (32, 70-72). Mounting evidence
indicates a role for the clock in controlling post-transcriptional mechanisms (73),
including translation initiation (41, 74), and translation elongation (chapter II). However,
what clock regulation of translation means for protein accumulation on a genome wide
scale, and the mechanism(s) for specifying which mRNAs are targeted for translational
regulation are unknown.
The driver of circadian rhythms in N. crassa is an autoregulatory molecular feedback
loop composed of the negative elements FRQ and FRH, which inhibit the activity of the
positive elements WC-1 and WC-2 (75-78). WC-1 and WC-2 heterodimerize to form the
WCC, which activates transcription of frequency (frq) (11, 75, 79), as well as activating
transcription of a large set of downstream target genes important for overt rhythmicity
and light responses (20). These genes encode transcription factors, as well as various
output pathway components and terminal clock-controlled genes (ccgs) (6). One gene
directly controlled by the WCC is os-4, which encodes the MAPKKK in the
osmotically-sensitive OS MAPK pathway (25). Rhythmic transcription of os-4 leads to
rhythmic accumulation of the phosphorylated active form of the downstream p38-like
MAPK OS-2 (22). We have previously demonstrated that this leads to rhythmic
41
phosphorylation of the stress response pathway components RCK-2 and eEF-2, which in
turn leads to rhythmic regulation of translation elongation (chapter II).
To better understand which constitutively expressed mRNAs are being regulated at the
level of translation, I helped develop, and performed, ribosome profiling experiments,
coupled with RNAseq in Neurospora cells, to determine which mRNAs are being
translated under various conditions. I predicted that following a stress or over a circadian
time course, specific mRNAs would be targeted to the translational machinery, and
some, but not all mRNAs will be regulated by signaling to eEF-2. In support of this
hypothesis, I found genes that were up- or down-regulated only at the level of ribosomal
occupancy following an osmotic stress, light pulse, or over a circadian time course.
Furthermore, I found specific mRNAs whose ribosomal occupancy was regulated by
RCK-2/eEF-2. Taken together, these data support the idea that stress and clock
regulation of translation elongation act as mechanisms to control the synthesis of
specific proteins, rather than as a general mechanism to regulate translation of all
mRNAs.
Results
Translational Regulation Following an Osmotic Stress
To identify which mRNAs are being regulated at the level of translation by RCK-2 after
an osmotic stress, ribosome profiling and RNAseq analyses were carried out for WT and
Δrck-2 cells that were untreated, or treated with 4% NaCl for 30 min. The quality of the
42
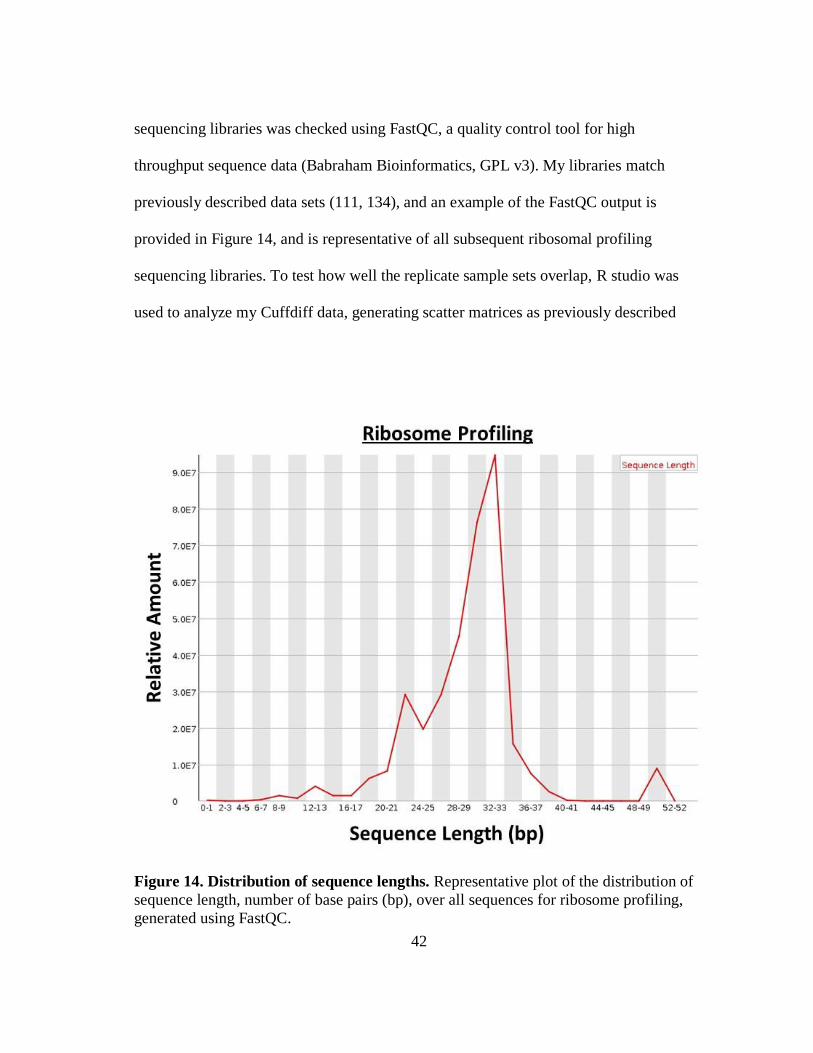
sequencing libraries was checked using FastQC, a quality control tool for high
throughput sequence data (Babraham Bioinformatics, GPL v3). My libraries match
previously described data sets (111, 134), and an example of the FastQC output is
provided in Figure 14, and is representative of all subsequent ribosomal profiling
sequencing libraries. To test how well the replicate sample sets overlap, R studio was
used to analyze my Cuffdiff data, generating scatter matrices as previously described
Figure 14. Distribution of sequence lengths. Representative plot of the distribution of
sequence length, number of base pairs (bp), over all sequences for ribosome profiling,
generated using FastQC.
43
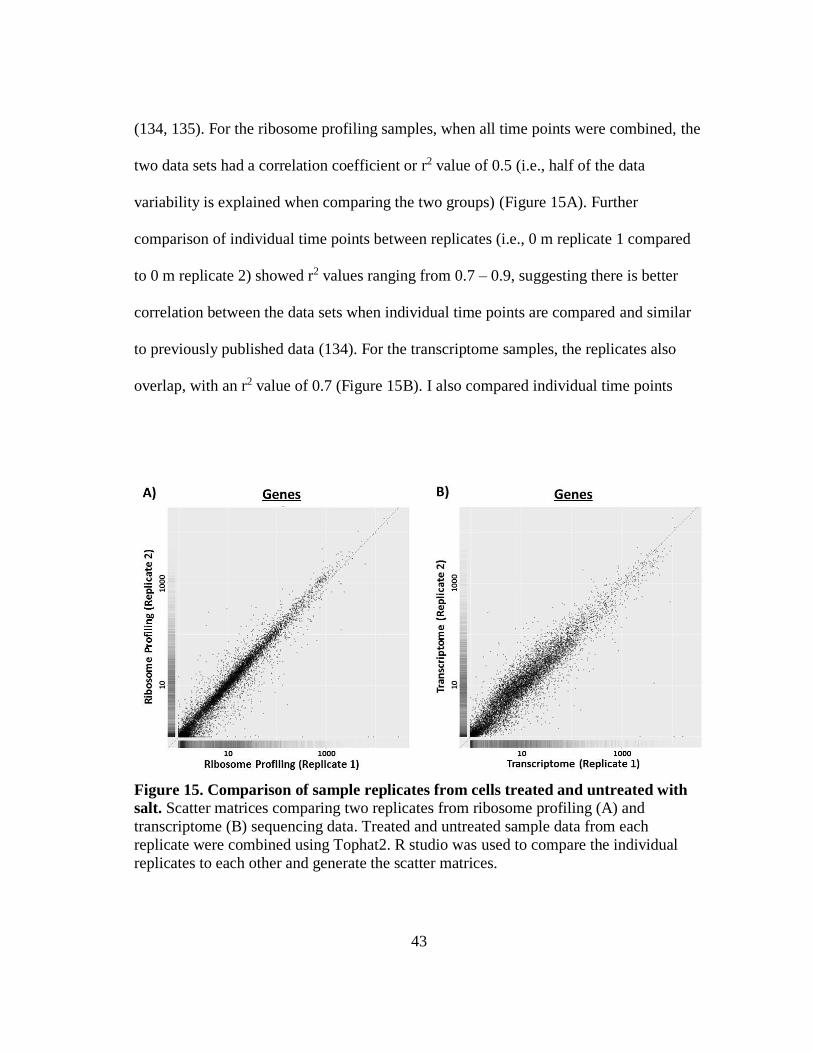
(134, 135). For the ribosome profiling samples, when all time points were combined, the
two data sets had a correlation coefficient or r2 value of 0.5 (i.e., half of the data
variability is explained when comparing the two groups) (Figure 15A). Further
comparison of individual time points between replicates (i.e., 0 m replicate 1 compared
to 0 m replicate 2) showed r2 values ranging from 0.7 – 0.9, suggesting there is better
correlation between the data sets when individual time points are compared and similar
to previously published data (134). For the transcriptome samples, the replicates also
overlap, with an r2 value of 0.7 (Figure 15B). I also compared individual time points
Figure 15. Comparison of sample replicates from cells treated and untreated with
salt. Scatter matrices comparing two replicates from ribosome profiling (A) and
transcriptome (B) sequencing data. Treated and untreated sample data from each
replicate were combined using Tophat2. R studio was used to compare the individual
replicates to each other and generate the scatter matrices.
44
between replicates and found that the r2 values ranged from 0.7 – 0.8. Taken together,
these data indicate that there is high correlation between the sequencing replicates.
To determine which genes were being either up- or down-regulated at the level of
ribosomal occupancy, I first combined the replicates using Cufflinks and then used the
resulting Cuffdiff data and R studio to generate lists of Neurospora genes with their
associated fragments per kilobase of transcript per million mapped reads (FPKM)
values. First, any NCUs with FPKM values less than 1 were removed. I then identified
genes with a log2-fold change > 1 (induction) or < -1 (repression) when comparing the
ribosome profiling WT time 30 m to time 0 m. 1,068 genes had at least a log2-fold
change > 1 or < -1 in ribosomal occupancy following an osmotic stress. To identify
which genes were being induced/repressed at the level of mRNA, Cuffdiff was used to
determine which samples had at least a log2-fold change > 1 or < -1 when comparing the
transcriptome WT time 30 m to time 0 m. I found 1,045 genes that had at least a log2-
fold induction or repression in mRNA expression following an osmotic stress. 752 genes
overlapped between the data sets (Figure 16), representing 70% of mRNAs targeted to
the ribosomal machinery and 72% of the mRNAs. To increase the specificity of
identified genes that are up- or down-regulated in ribosomal occupancy, but not in
mRNA level, the threshold for mRNAs (transcriptome data) called as osmotically
induced/repressed was changed to either a log2-fold change of > 0.75 or < -0.75. I
compared the resulting list to my ribosome profiling data and found 194 mRNAs that
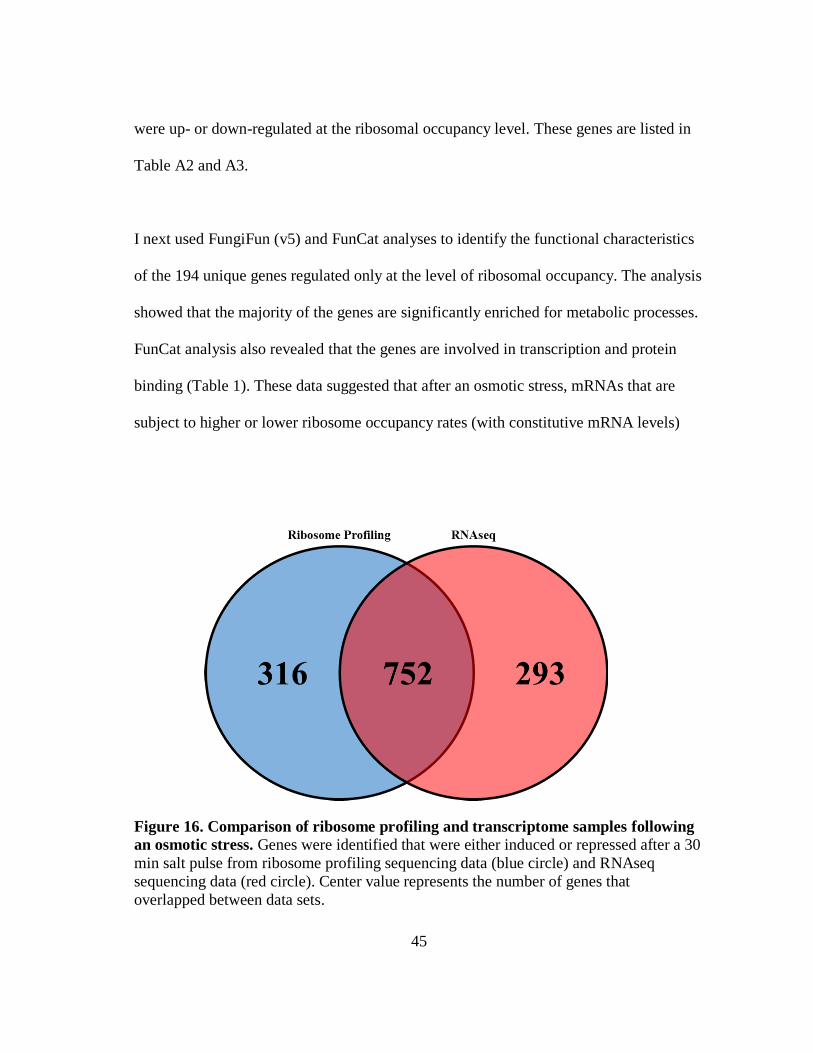
45
were up- or down-regulated at the ribosomal occupancy level. These genes are listed in
Table A2 and A3.
I next used FungiFun (v5) and FunCat analyses to identify the functional characteristics
of the 194 unique genes regulated only at the level of ribosomal occupancy. The analysis
showed that the majority of the genes are significantly enriched for metabolic processes.
FunCat analysis also revealed that the genes are involved in transcription and protein
binding (Table 1). These data suggested that after an osmotic stress, mRNAs that are
subject to higher or lower ribosome occupancy rates (with constitutive mRNA levels)
Figure 16. Comparison of ribosome profiling and transcriptome samples following
an osmotic stress. Genes were identified that were either induced or repressed after a 30
min salt pulse from ribosome profiling sequencing data (blue circle) and RNAseq
sequencing data (red circle). Center value represents the number of genes that
overlapped between data sets.
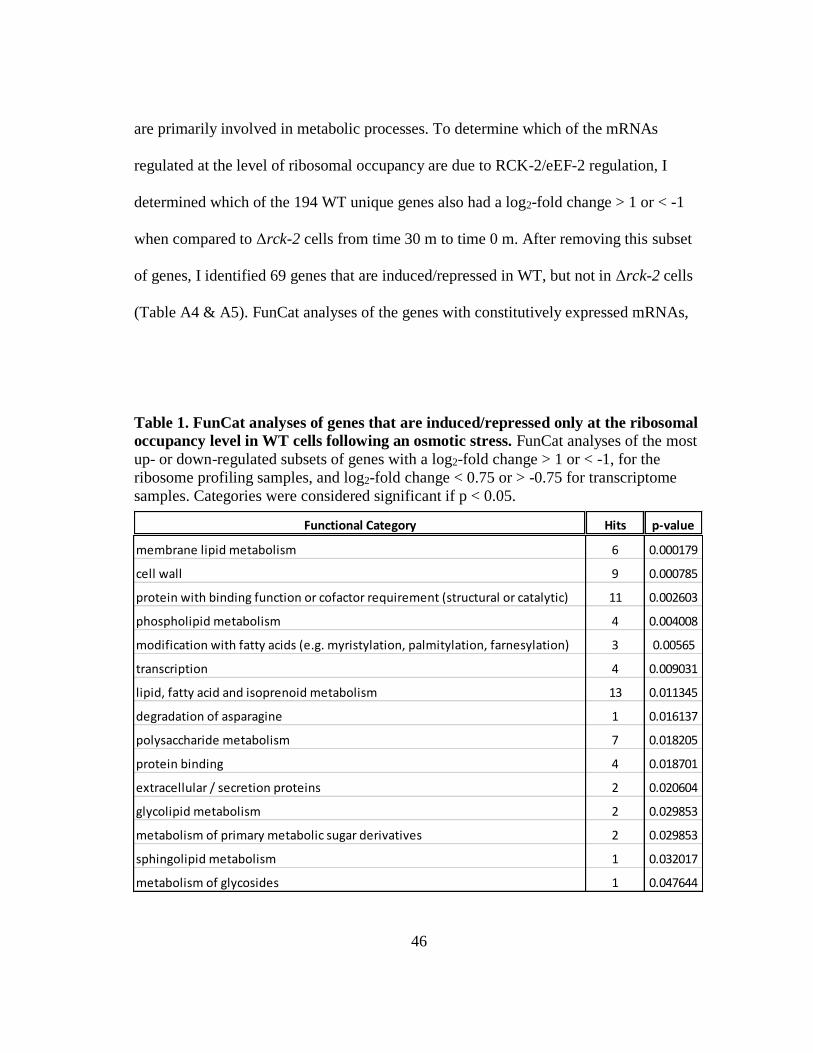
46
are primarily involved in metabolic processes. To determine which of the mRNAs
regulated at the level of ribosomal occupancy are due to RCK-2/eEF-2 regulation, I
determined which of the 194 WT unique genes also had a log2-fold change > 1 or < -1
when compared to Δrck-2 cells from time 30 m to time 0 m. After removing this subset
of genes, I identified 69 genes that are induced/repressed in WT, but not in Δrck-2 cells
(Table A4 & A5). FunCat analyses of the genes with constitutively expressed mRNAs,
Table 1. FunCat analyses of genes that are induced/repressed only at the ribosomal
occupancy level in WT cells following an osmotic stress. FunCat analyses of the most
up- or down-regulated subsets of genes with a log2-fold change > 1 or < -1, for the
ribosome profiling samples, and log2-fold change < 0.75 or > -0.75 for transcriptome
samples. Categories were considered significant if p < 0.05.
Functional Category Hits p-value
membrane lipid metabolism 6 0.000179
cell wall 9 0.000785
protein with binding function or cofactor requirement (structural or catalytic) 11 0.002603
phospholipid metabolism 4 0.004008
modification with fatty acids (e.g. myristylation, palmitylation, farnesylation) 3 0.00565
transcription 4 0.009031
lipid, fatty acid and isoprenoid metabolism 13 0.011345
degradation of asparagine 1 0.016137
polysaccharide metabolism 7 0.018205
protein binding 4 0.018701
extracellular / secretion proteins 2 0.020604
glycolipid metabolism 2 0.029853
metabolism of primary metabolic sugar derivatives 2 0.029853
sphingolipid metabolism 1 0.032017
metabolism of glycosides 1 0.047644
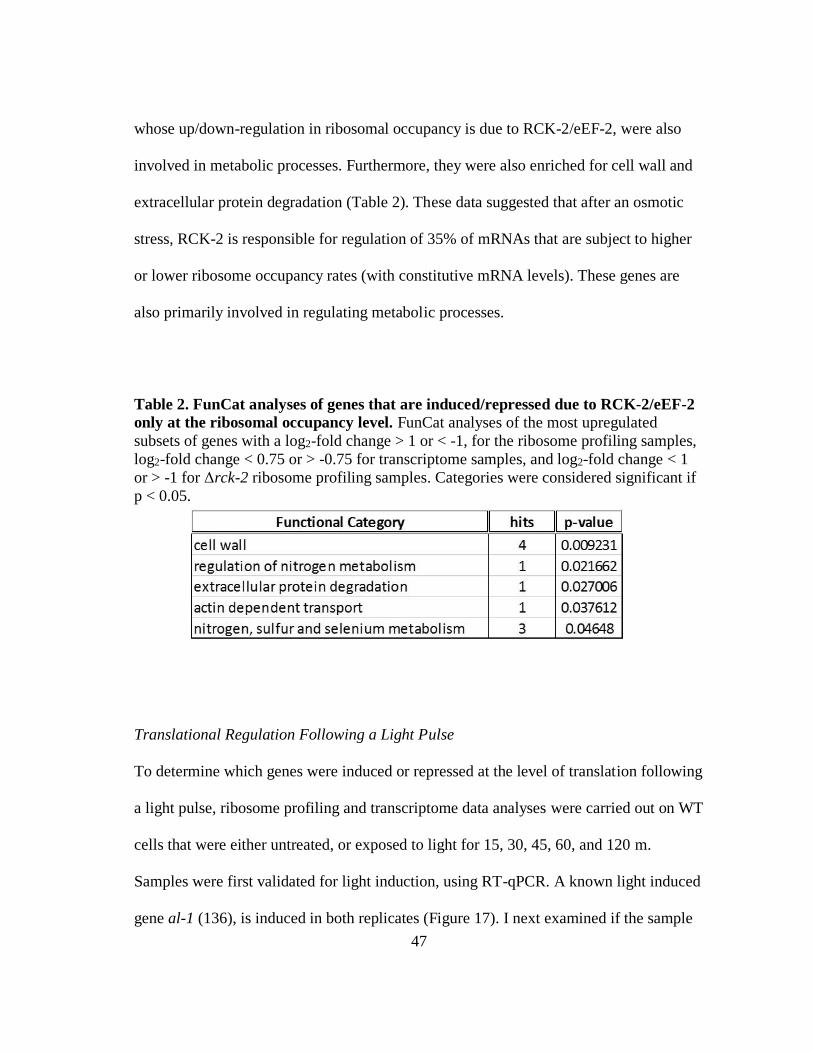
47
whose up/down-regulation in ribosomal occupancy is due to RCK-2/eEF-2, were also
involved in metabolic processes. Furthermore, they were also enriched for cell wall and
extracellular protein degradation (Table 2). These data suggested that after an osmotic
stress, RCK-2 is responsible for regulation of 35% of mRNAs that are subject to higher
or lower ribosome occupancy rates (with constitutive mRNA levels). These genes are
also primarily involved in regulating metabolic processes.
Table 2. FunCat analyses of genes that are induced/repressed due to RCK-2/eEF-2
only at the ribosomal occupancy level. FunCat analyses of the most upregulated
subsets of genes with a log2-fold change > 1 or < -1, for the ribosome profiling samples,
log2-fold change < 0.75 or > -0.75 for transcriptome samples, and log2-fold change < 1
or > -1 for Δrck-2 ribosome profiling samples. Categories were considered significant if
p < 0.05.
Translational Regulation Following a Light Pulse
To determine which genes were induced or repressed at the level of translation following
a light pulse, ribosome profiling and transcriptome data analyses were carried out on WT
cells that were either untreated, or exposed to light for 15, 30, 45, 60, and 120 m.
Samples were first validated for light induction, using RT-qPCR. A known light induced
gene al-1 (136), is induced in both replicates (Figure 17). I next examined if the sample
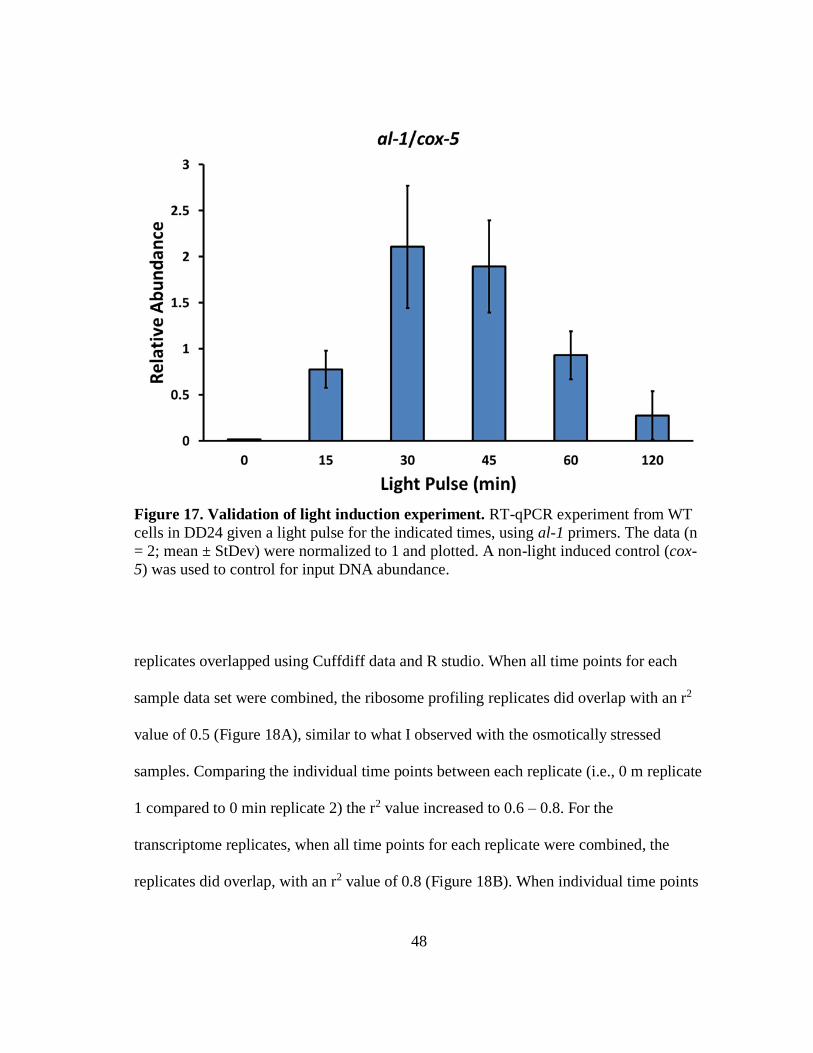
48
Figure 17. Validation of light induction experiment. RT-qPCR experiment from WT
cells in DD24 given a light pulse for the indicated times, using al-1 primers. The data (n
= 2; mean ± StDev) were normalized to 1 and plotted. A non-light induced control (cox-
5) was used to control for input DNA abundance.
replicates overlapped using Cuffdiff data and R studio. When all time points for each
sample data set were combined, the ribosome profiling replicates did overlap with an r2
value of 0.5 (Figure 18A), similar to what I observed with the osmotically stressed
samples. Comparing the individual time points between each replicate (i.e., 0 m replicate
1 compared to 0 min replicate 2) the r2 value increased to 0.6 – 0.8. For the
transcriptome replicates, when all time points for each replicate were combined, the
replicates did overlap, with an r2 value of 0.8 (Figure 18B). When individual time points
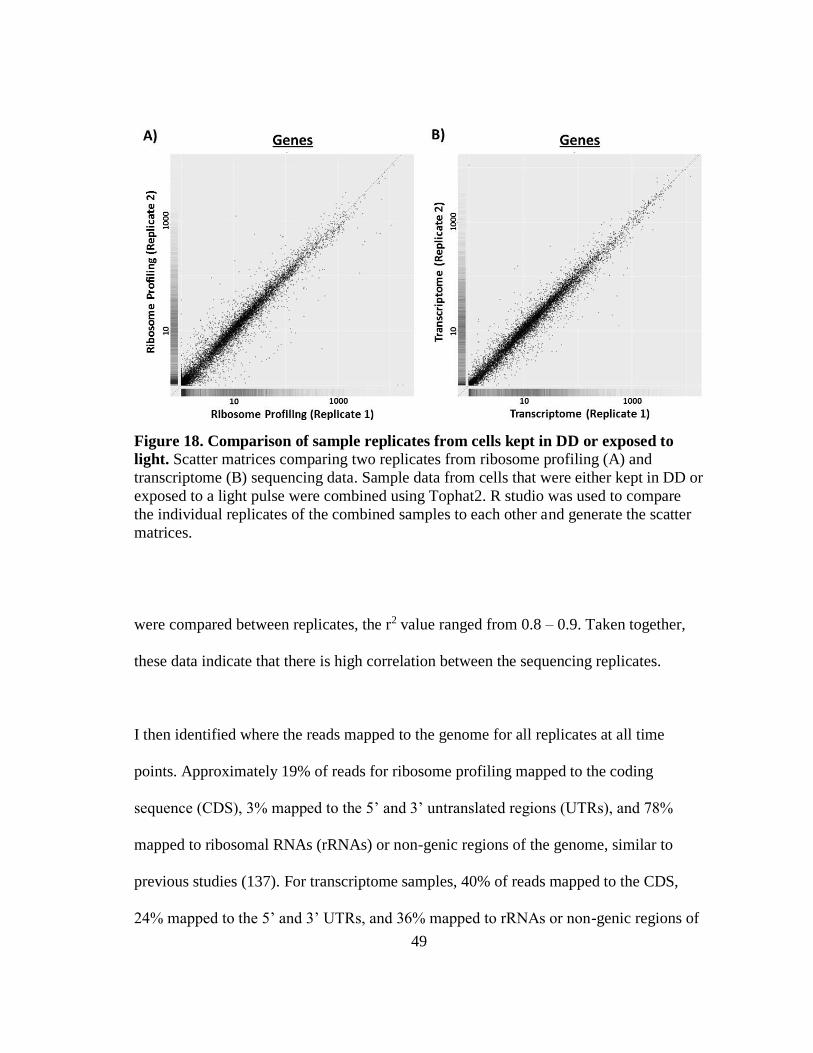
49
Figure 18. Comparison of sample replicates from cells kept in DD or exposed to
light. Scatter matrices comparing two replicates from ribosome profiling (A) and
transcriptome (B) sequencing data. Sample data from cells that were either kept in DD or
exposed to a light pulse were combined using Tophat2. R studio was used to compare
the individual replicates of the combined samples to each other and generate the scatter
matrices.
were compared between replicates, the r2 value ranged from 0.8 – 0.9. Taken together,
these data indicate that there is high correlation between the sequencing replicates.
I then identified where the reads mapped to the genome for all replicates at all time
points. Approximately 19% of reads for ribosome profiling mapped to the coding
sequence (CDS), 3% mapped to the 5’ and 3’ untranslated regions (UTRs), and 78%
mapped to ribosomal RNAs (rRNAs) or non-genic regions of the genome, similar to
previous studies (137). For transcriptome samples, 40% of reads mapped to the CDS,
24% mapped to the 5’ and 3’ UTRs, and 36% mapped to rRNAs or non-genic regions of
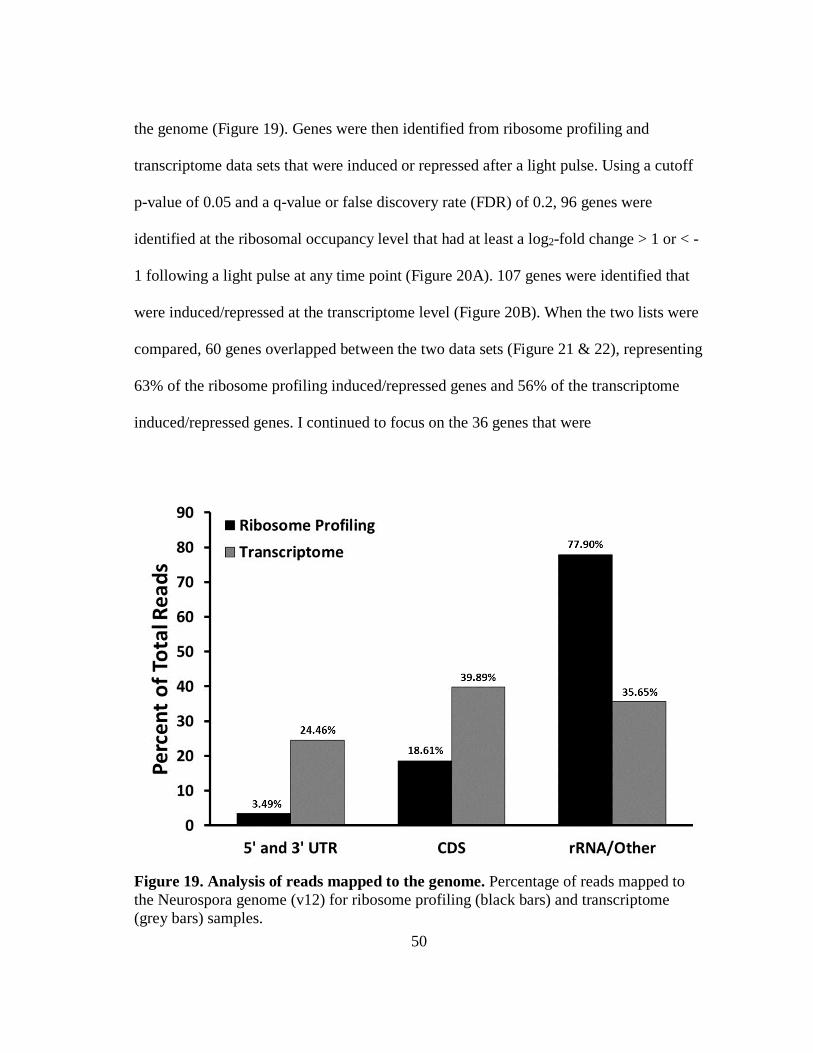
50
the genome (Figure 19). Genes were then identified from ribosome profiling and
transcriptome data sets that were induced or repressed after a light pulse. Using a cutoff
p-value of 0.05 and a q-value or false discovery rate (FDR) of 0.2, 96 genes were
identified at the ribosomal occupancy level that had at least a log2-fold change > 1 or < -
1 following a light pulse at any time point (Figure 20A). 107 genes were identified that
were induced/repressed at the transcriptome level (Figure 20B). When the two lists were
compared, 60 genes overlapped between the two data sets (Figure 21 & 22), representing
63% of the ribosome profiling induced/repressed genes and 56% of the transcriptome
induced/repressed genes. I continued to focus on the 36 genes that were
Figure 19. Analysis of reads mapped to the genome. Percentage of reads mapped to
the Neurospora genome (v12) for ribosome profiling (black bars) and transcriptome
(grey bars) samples.
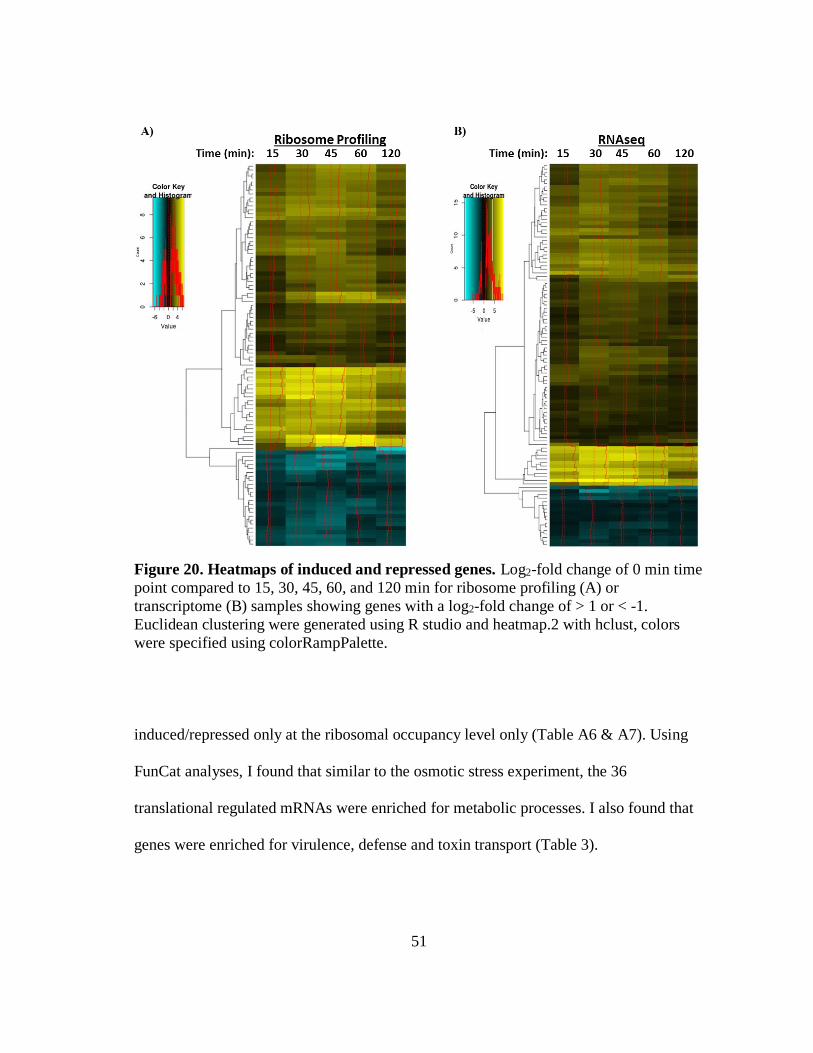
51
Figure 20. Heatmaps of induced and repressed genes. Log2-fold change of 0 min time
point compared to 15, 30, 45, 60, and 120 min for ribosome profiling (A) or
transcriptome (B) samples showing genes with a log2-fold change of > 1 or < -1.
Euclidean clustering were generated using R studio and heatmap.2 with hclust, colors
were specified using colorRampPalette.
induced/repressed only at the ribosomal occupancy level only (Table A6 & A7). Using
FunCat analyses, I found that similar to the osmotic stress experiment, the 36
translational regulated mRNAs were enriched for metabolic processes. I also found that
genes were enriched for virulence, defense and toxin transport (Table 3).
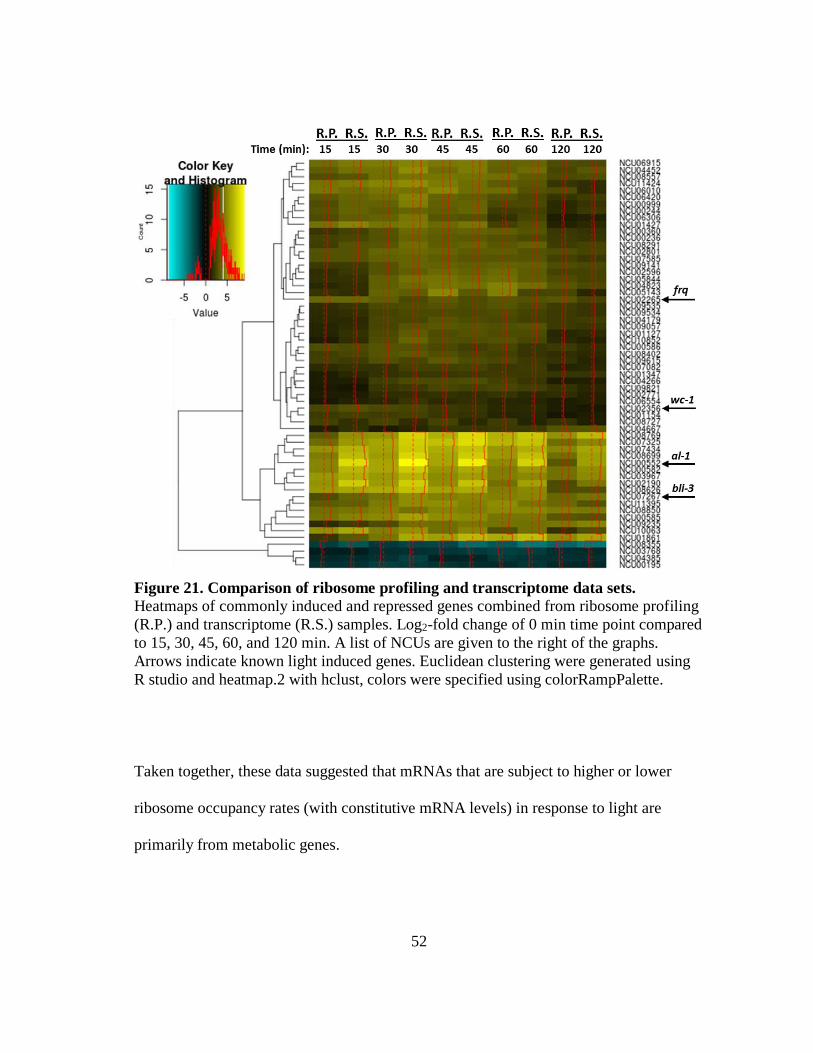
52
Figure 21. Comparison of ribosome profiling and transcriptome data sets.
Heatmaps of commonly induced and repressed genes combined from ribosome profiling
(R.P.) and transcriptome (R.S.) samples. Log2-fold change of 0 min time point compared
to 15, 30, 45, 60, and 120 min. A list of NCUs are given to the right of the graphs.
Arrows indicate known light induced genes. Euclidean clustering were generated using
R studio and heatmap.2 with hclust, colors were specified using colorRampPalette.
Taken together, these data suggested that mRNAs that are subject to higher or lower
ribosome occupancy rates (with constitutive mRNA levels) in response to light are
primarily from metabolic genes.
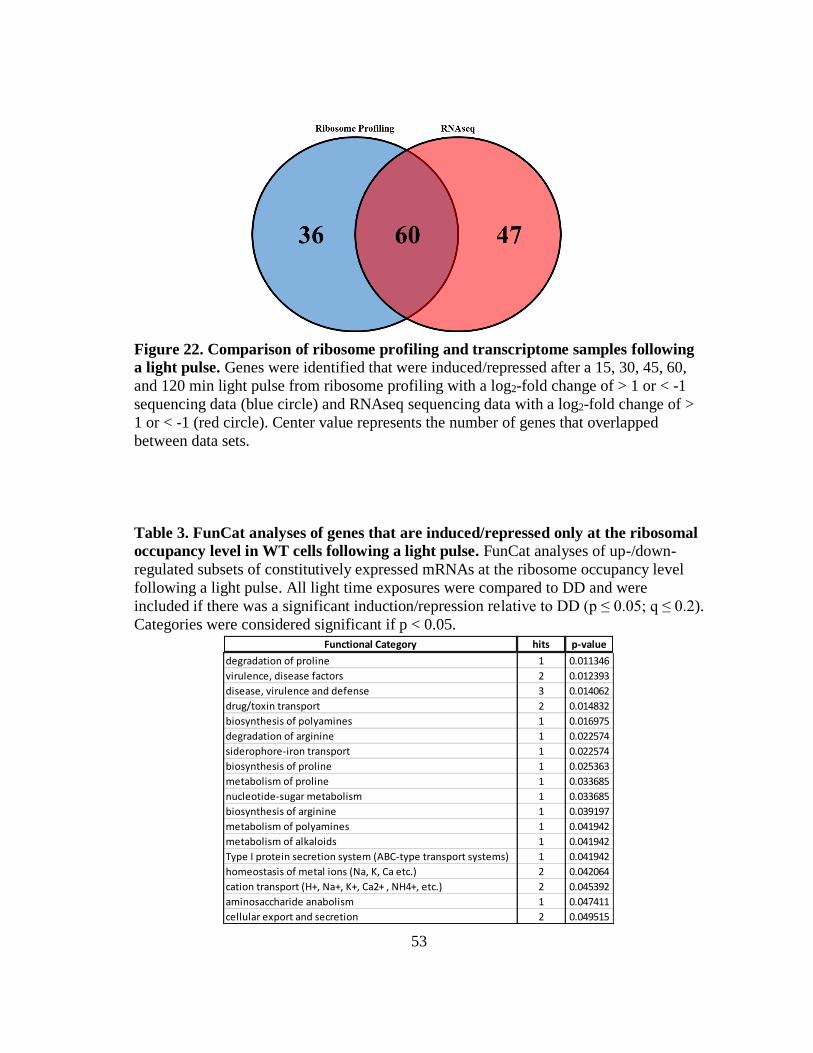
53
Figure 22. Comparison of ribosome profiling and transcriptome samples following
a light pulse. Genes were identified that were induced/repressed after a 15, 30, 45, 60,
and 120 min light pulse from ribosome profiling with a log2-fold change of > 1 or < -1
sequencing data (blue circle) and RNAseq sequencing data with a log2-fold change of >
1 or < -1 (red circle). Center value represents the number of genes that overlapped
between data sets.
Table 3. FunCat analyses of genes that are induced/repressed only at the ribosomal
occupancy level in WT cells following a light pulse. FunCat analyses of up-/down-
regulated subsets of constitutively expressed mRNAs at the ribosome occupancy level
following a light pulse. All light time exposures were compared to DD and were
included if there was a significant induction/repression relative to DD (p ≤ 0.05; q ≤ 0.2).
Categories were considered significant if p < 0.05.
Functional Category hits p-value
degradation of proline 1 0.011346
virulence, disease factors 2 0.012393
disease, virulence and defense 3 0.014062
drug/toxin transport 2 0.014832
biosynthesis of polyamines 1 0.016975
degradation of arginine 1 0.022574
siderophore-iron transport 1 0.022574
biosynthesis of proline 1 0.025363
metabolism of proline 1 0.033685
nucleotide-sugar metabolism 1 0.033685
biosynthesis of arginine 1 0.039197
metabolism of polyamines 1 0.041942
metabolism of alkaloids 1 0.041942
Type I protein secretion system (ABC-type transport systems) 1 0.041942
homeostasis of metal ions (Na, K, Ca etc.) 2 0.042064
cation transport (H+, Na+, K+, Ca2+ , NH4+, etc.) 2 0.045392
aminosaccharide anabolism 1 0.047411
cellular export and secretion 2 0.049515
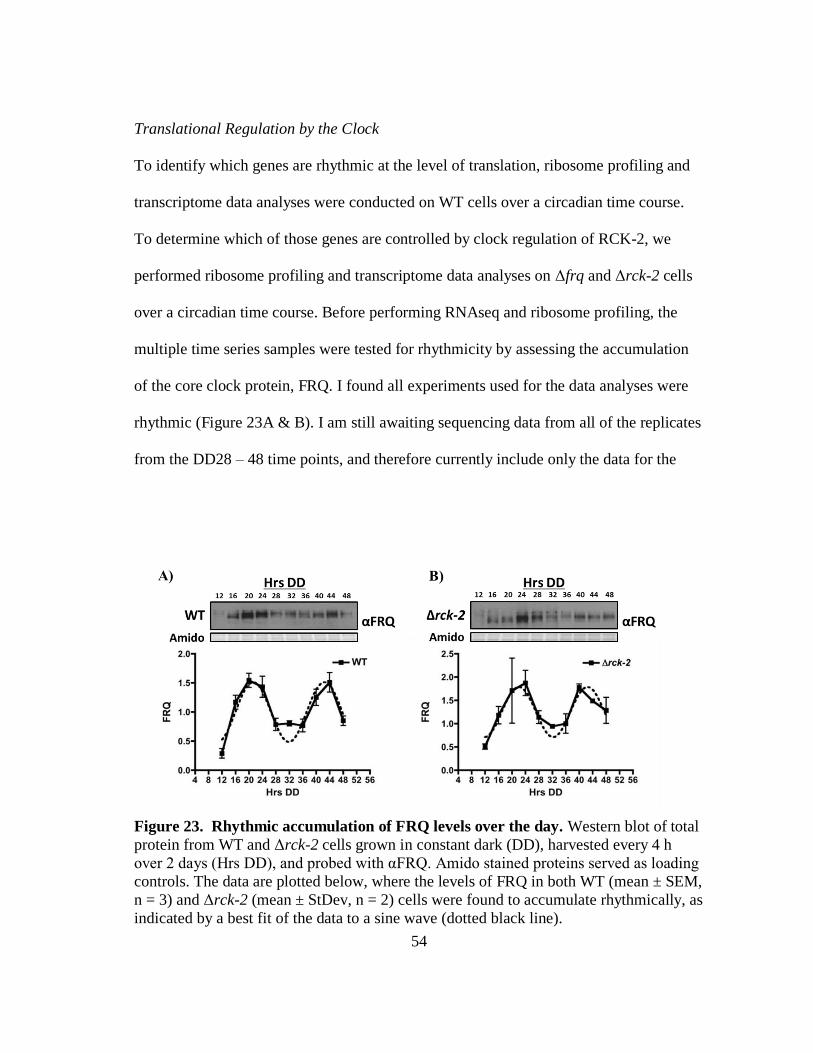
54
Translational Regulation by the Clock
To identify which genes are rhythmic at the level of translation, ribosome profiling and
transcriptome data analyses were conducted on WT cells over a circadian time course.
To determine which of those genes are controlled by clock regulation of RCK-2, we
performed ribosome profiling and transcriptome data analyses on Δfrq and Δrck-2 cells
over a circadian time course. Before performing RNAseq and ribosome profiling, the
multiple time series samples were tested for rhythmicity by assessing the accumulation
of the core clock protein, FRQ. I found all experiments used for the data analyses were
rhythmic (Figure 23A & B). I am still awaiting sequencing data from all of the replicates
from the DD28 – 48 time points, and therefore currently include only the data for the
Figure 23. Rhythmic accumulation of FRQ levels over the day. Western blot of total
protein from WT and Δrck-2 cells grown in constant dark (DD), harvested every 4 h
over 2 days (Hrs DD), and probed with αFRQ. Amido stained proteins served as loading
controls. The data are plotted below, where the levels of FRQ in both WT (mean ± SEM,
n = 3) and Δrck-2 (mean ± StDev, n = 2) cells were found to accumulate rhythmically, as
indicated by a best fit of the data to a sine wave (dotted black line).
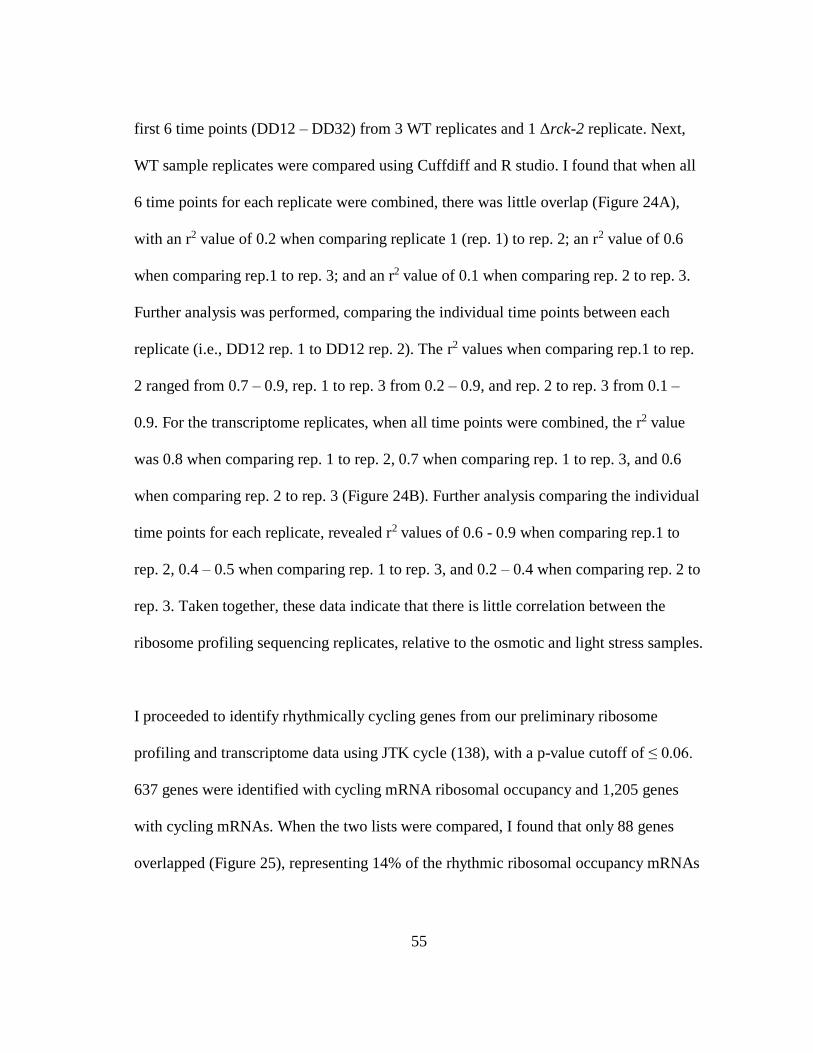
55
first 6 time points (DD12 – DD32) from 3 WT replicates and 1 Δrck-2 replicate. Next,
WT sample replicates were compared using Cuffdiff and R studio. I found that when all
6 time points for each replicate were combined, there was little overlap (Figure 24A),
with an r2 value of 0.2 when comparing replicate 1 (rep. 1) to rep. 2; an r2 value of 0.6
when comparing rep.1 to rep. 3; and an r2 value of 0.1 when comparing rep. 2 to rep. 3.
Further analysis was performed, comparing the individual time points between each
replicate (i.e., DD12 rep. 1 to DD12 rep. 2). The r2 values when comparing rep.1 to rep.
2 ranged from 0.7 – 0.9, rep. 1 to rep. 3 from 0.2 – 0.9, and rep. 2 to rep. 3 from 0.1 –
0.9. For the transcriptome replicates, when all time points were combined, the r2 value
was 0.8 when comparing rep. 1 to rep. 2, 0.7 when comparing rep. 1 to rep. 3, and 0.6
when comparing rep. 2 to rep. 3 (Figure 24B). Further analysis comparing the individual
time points for each replicate, revealed r2 values of 0.6 - 0.9 when comparing rep.1 to
rep. 2, 0.4 – 0.5 when comparing rep. 1 to rep. 3, and 0.2 – 0.4 when comparing rep. 2 to
rep. 3. Taken together, these data indicate that there is little correlation between the
ribosome profiling sequencing replicates, relative to the osmotic and light stress samples.
I proceeded to identify rhythmically cycling genes from our preliminary ribosome
profiling and transcriptome data using JTK cycle (138), with a p-value cutoff of ≤ 0.06.
637 genes were identified with cycling mRNA ribosomal occupancy and 1,205 genes
with cycling mRNAs. When the two lists were compared, I found that only 88 genes
overlapped (Figure 25), representing 14% of the rhythmic ribosomal occupancy mRNAs
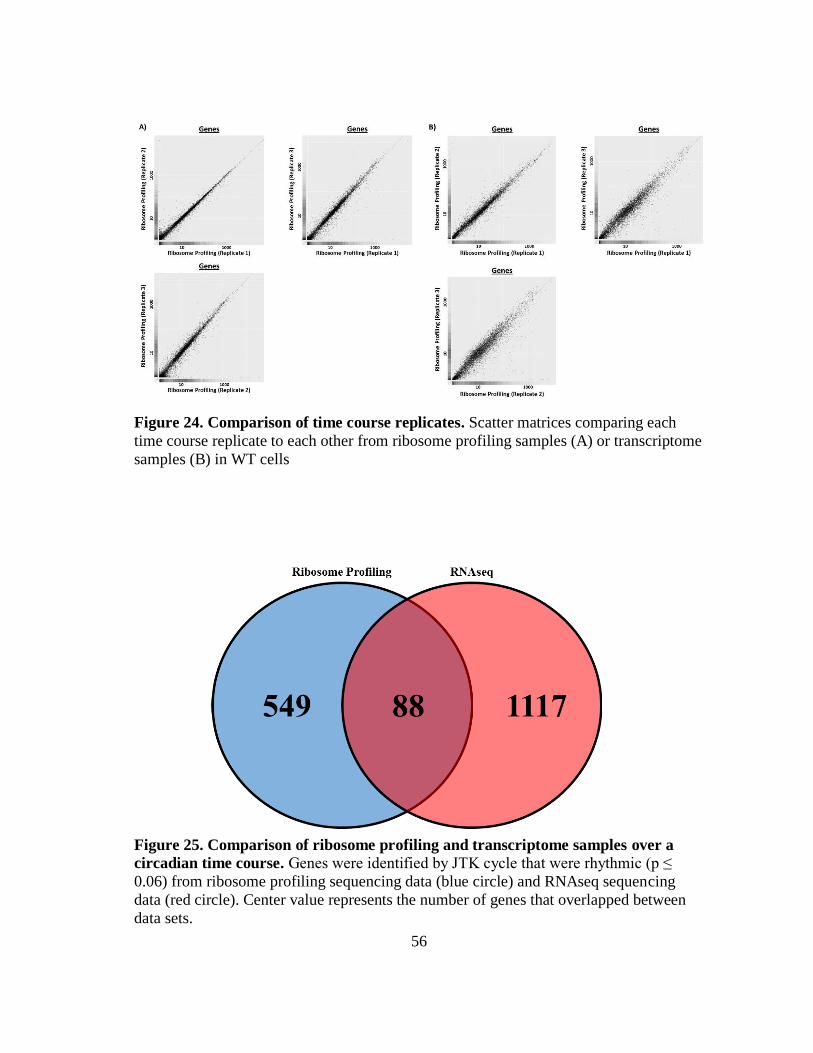
56
Figure 24. Comparison of time course replicates. Scatter matrices comparing each
time course replicate to each other from ribosome profiling samples (A) or transcriptome
samples (B) in WT cells
Figure 25. Comparison of ribosome profiling and transcriptome samples over a
circadian time course. Genes were identified by JTK cycle that were rhythmic (p ≤
0.06) from ribosome profiling sequencing data (blue circle) and RNAseq sequencing
data (red circle). Center value represents the number of genes that overlapped between
data sets.
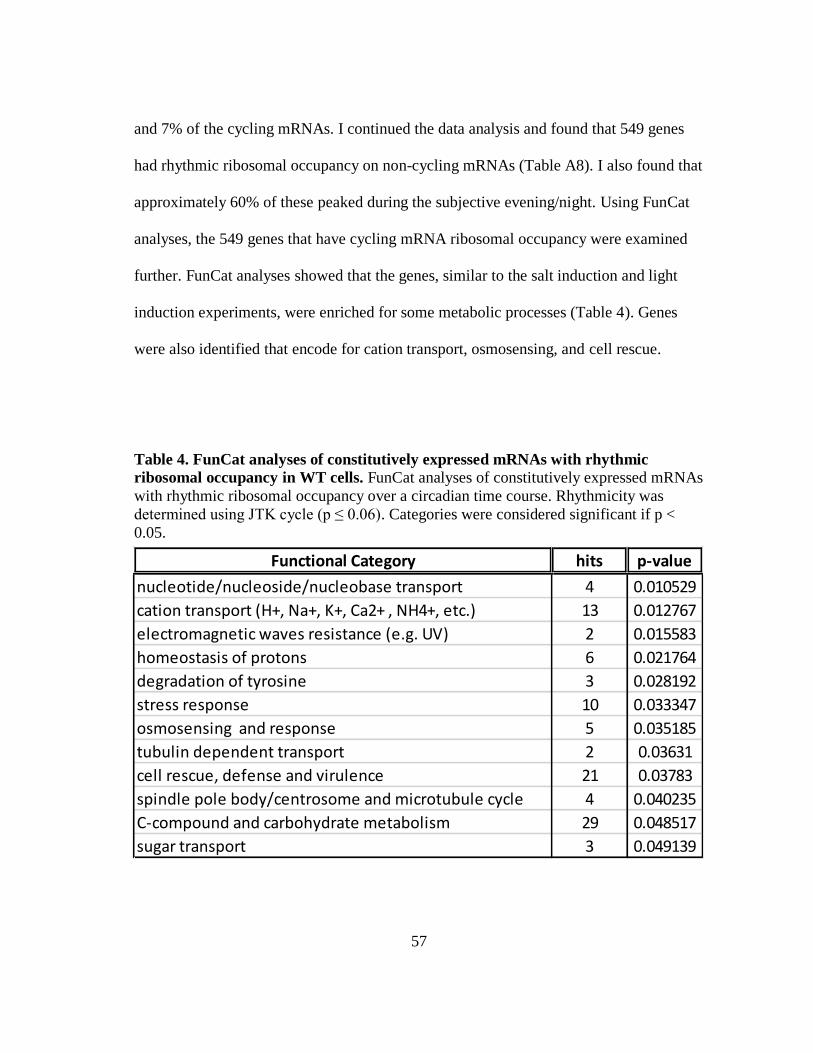
57
and 7% of the cycling mRNAs. I continued the data analysis and found that 549 genes
had rhythmic ribosomal occupancy on non-cycling mRNAs (Table A8). I also found that
approximately 60% of these peaked during the subjective evening/night. Using FunCat
analyses, the 549 genes that have cycling mRNA ribosomal occupancy were examined
further. FunCat analyses showed that the genes, similar to the salt induction and light
induction experiments, were enriched for some metabolic processes (Table 4). Genes
were also identified that encode for cation transport, osmosensing, and cell rescue.
Table 4. FunCat analyses of constitutively expressed mRNAs with rhythmic
ribosomal occupancy in WT cells. FunCat analyses of constitutively expressed mRNAs
with rhythmic ribosomal occupancy over a circadian time course. Rhythmicity was
determined using JTK cycle (p ≤ 0.06). Categories were considered significant if p <
0.05.
Functional Category hits p-value
nucleotide/nucleoside/nucleobase transport 4 0.010529
cation transport (H+, Na+, K+, Ca2+ , NH4+, etc.) 13 0.012767
electromagnetic waves resistance (e.g. UV) 2 0.015583
homeostasis of protons 6 0.021764
degradation of tyrosine 3 0.028192
stress response 10 0.033347
osmosensing and response 5 0.035185
tubulin dependent transport 2 0.03631
cell rescue, defense and virulence 21 0.03783
spindle pole body/centrosome and microtubule cycle 4 0.040235
C-compound and carbohydrate metabolism 29 0.048517
sugar transport 3 0.049139
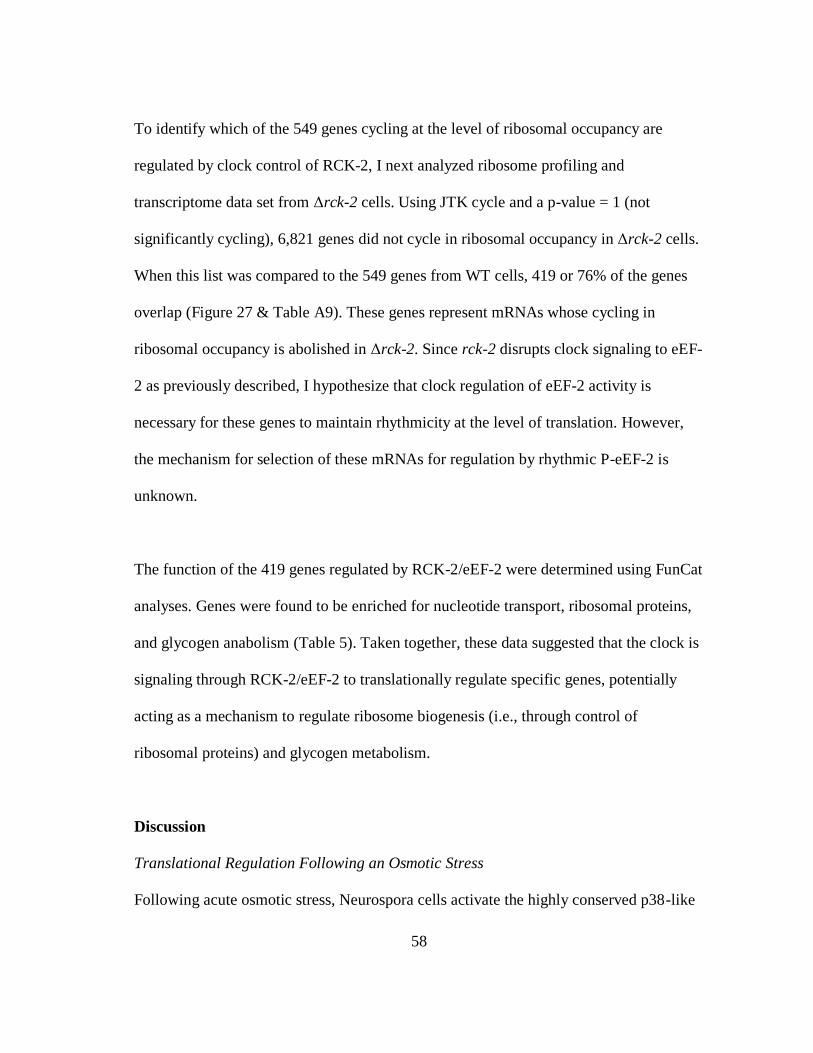
58
To identify which of the 549 genes cycling at the level of ribosomal occupancy are
regulated by clock control of RCK-2, I next analyzed ribosome profiling and
transcriptome data set from Δrck-2 cells. Using JTK cycle and a p-value = 1 (not
significantly cycling), 6,821 genes did not cycle in ribosomal occupancy in Δrck-2 cells.
When this list was compared to the 549 genes from WT cells, 419 or 76% of the genes
overlap (Figure 27 & Table A9). These genes represent mRNAs whose cycling in
ribosomal occupancy is abolished in Δrck-2. Since rck-2 disrupts clock signaling to eEF-
2 as previously described, I hypothesize that clock regulation of eEF-2 activity is
necessary for these genes to maintain rhythmicity at the level of translation. However,
the mechanism for selection of these mRNAs for regulation by rhythmic P-eEF-2 is
unknown.
The function of the 419 genes regulated by RCK-2/eEF-2 were determined using FunCat
analyses. Genes were found to be enriched for nucleotide transport, ribosomal proteins,
and glycogen anabolism (Table 5). Taken together, these data suggested that the clock is
signaling through RCK-2/eEF-2 to translationally regulate specific genes, potentially
acting as a mechanism to regulate ribosome biogenesis (i.e., through control of
ribosomal proteins) and glycogen metabolism.
Discussion
Translational Regulation Following an Osmotic Stress
Following acute osmotic stress, Neurospora cells activate the highly conserved p38-like
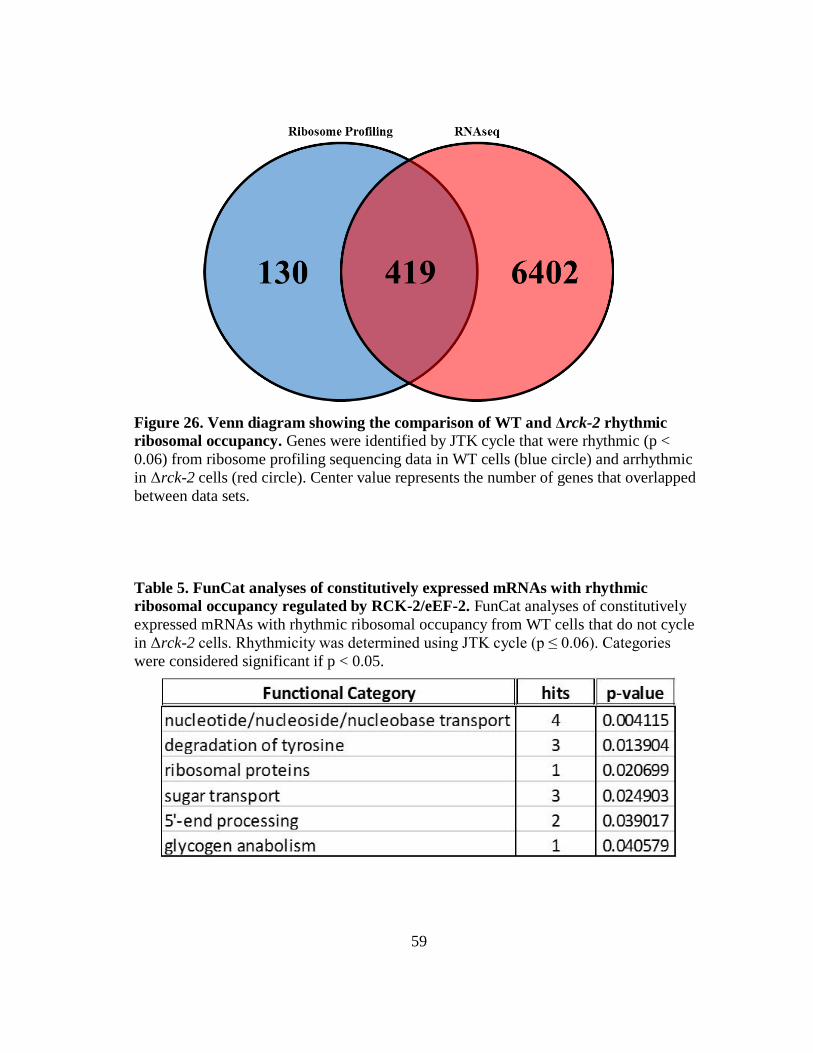
59
Figure 26. Venn diagram showing the comparison of WT and Δrck-2 rhythmic
ribosomal occupancy. Genes were identified by JTK cycle that were rhythmic (p <
0.06) from ribosome profiling sequencing data in WT cells (blue circle) and arrhythmic
in Δrck-2 cells (red circle). Center value represents the number of genes that overlapped
between data sets.
Table 5. FunCat analyses of constitutively expressed mRNAs with rhythmic
ribosomal occupancy regulated by RCK-2/eEF-2. FunCat analyses of constitutively
expressed mRNAs with rhythmic ribosomal occupancy from WT cells that do not cycle
in Δrck-2 cells. Rhythmicity was determined using JTK cycle (p ≤ 0.06). Categories
were considered significant if p < 0.05.
60
OS MAPK pathway. The OS pathway in turn activates downstream kinases and
transcription factors (26, 139), including the previously described serine/threonine
kinase RCK-2. RCK-2 in turn phosphorylates and inactivates eEF-2. To determine the
role of eEF-2 regulation on translation following acute osmotic stress, I performed
ribosome profiling and RNAseq on WT and Δrck-2 cells, before and after treatment with
salt. From preliminary sequence analyses, I found that specific mRNAs are being
translationally regulated in WT cells following acute osmotic stress, with genes enriched
for metabolic processes. I also found that a subset of the translationally regulated
mRNAs are controlled by RCK-2/eEF-2 and enriched for metabolic processes. These
data suggested that following acute osmotic stress, components of primary metabolic
pathways are translationally controlled. Since metabolism is responsible for vital
processes essential for cell survival and growth, it is not surprising that during the stress
response, metabolic genes are being regulated not only at the level of transcription, as
previously described (139, 140), but also at the level of translation. I suggest that by
controlling both transcription and translation, cells are provided with an adaptive
advantage by (i) up-regulating transcription of genes needed for adaptation; (ii) turning
off transcription of non-essential genes; (iii) targeting mRNAs to the ribosomal
machinery for rapid synthesis of necessary proteins; and (iv) stopping translation of non-
essential mRNAs to conserve energy. Previous work has demonstrated that following an
osmotic stress the translational response in both mammals and yeast exceeds that of the
transcriptional response (141, 142), I therefore suggest that by rapidly responding to an
osmotic stress, and instantaneously turning off translation of mRNAs not required for
61
cell survival, Neurospora conserves energy and is provided with an adaptive advantage.
While my data provides information on the translational regulation of mRNA following
a 30 min salt pulse, to determine the rapid response effect, ribosome profiling and
RNAseq would need to be conducted with cells treated with an acute osmotic stress for
shorter periods of time (i.e., 1 min, 5 min, etc.). This would allow us to determine if the
Neurospora translational response following an osmotic stress is similar to that found in
both mammals and yeast.
Translational Regulation Following a Light Pulse
Light regulates many molecular and physiological processes in N. crassa (143), ranging
from growth to conidiation. Previous work has shown extensive control of gene
expression following a light pulse, through binding of the WCC to various transcription
factors, which in turn bind to downstream genes and transcription factors creating a
network of transcriptional regulation (20, 134). However, nothing was known about the
effect of light on translational regulation.
To determine if light alters mRNA translation, I performed a light induction experiment
on WT cells kept in DD or exposed to varying times of light. Using preliminary
sequencing analysis, I found 36 highly significant genes that had constitutive mRNAs
that were translational up- or down-regulated. Similar to our osmotic stress experiment,
genes were enriched for metabolic processes suggesting that following exposure to light,
specific metabolic genes are being translationally regulated. Light is also a stress for
62
Neurospora; thus, the overall trend is that upon exposure of cells to stress, rapid changes
in the levels of primary metabolism can help to overcome the stress.
Translational Regulation by the Clock
The circadian clock regulates many biological functions and physiological processes in
diverse organisms (1). Much work in Neurospora has focused on cataloging rhythmic
mRNAs, and determining the mechanisms involved in clock regulation of transcription
(20, 70, 71, 134). However, little is known about clock regulation of translation in
Neurospora or any other clock model system.
To better understand how the clock might regulate mRNA translation, I performed
ribosome profiling and RNAseq experiments over a circadian time course with WT and
Δfrq cells. To determine which mRNAs were rhythmically regulated at the translation
level through clock-control of eEF-2, I conducted the same experiments in Δrck-2 cells.
We are still awaiting sequencing data for the 2nd Δfrq and Δrck-2 DD12 - 32 replicates,
as well as most of the DD28 – 48 time points, and therefore only included the data for
the first 6 time points (DD12 – DD32) from 3 WT replicates and 1 Δrck-2 replicate.
Generally, when comparing the overlap between WT replicates from combined or
individual time points, there was little correlation, relative to the osmotic and light stress
replicates. I also saw the least overlap between replicates for time points DD12 and
DD32, although the reason for this is unknown. The low correlation between replicates
63
could be due to the differences in sequencing depth/coverage. My original time course
replicates (rep. 1 and 2, DD12 – 32) were sequenced with 8 samples per flow cell lane,
resulting in low depth of coverage. However, all subsequent sequencing has involved
fewer multiplexed samples (approx. 4 per lane), leading to higher coverage and an
increase in the number of reads for rep. 3. Future work will involve re-sequencing the
low depth of coverage replicates, if enough sample remains, otherwise new time course
experiments will be performed.
From preliminary data analyses, I found that few genes (88) overlapped when comparing
rhythmically cycling mRNAs to mRNAs with rhythmic ribosomal occupancy. This
discrepancy can be explained by the high false discovery rate (FDR) since our q-values
were generally 0.5 or higher. JTK cycle is an excellent script for analyzing rhythmic
sequencing data, however it does have its limits. To increase the number of identified
cycling genes and decrease the FDR, the algorithm requires a 2 h sampling resolution
over 2 consecutive days. Unfortunately, I was unable to sample this often due to the cost
of the experiments (144). An example of an improperly called gene by JTK cycle is ccg-
1 (NCU03753), which is known to be transcriptionally rhythmic. In our ribosome
profiling data set, this gene is called rhythmic, however in the RNAseq data set ccg-1, is
called arrhythmic (Table A5). When the rest of the sequencing data arrives, I will
reanalyze the data to see if ccg-1 is still called arrhythmic. If so, there are alternative
scripts and algorithms to analyze the data, such as Detection of Differential Rhythmicity
(DODR) (145, 146).
64
Despite not having all of the data, I continued with the analysis of the rhythmic ribosome
profiling to generate a list of preliminary candidates for further study. 549 constitutively
expressed genes in WT cells had cycling mRNA ribosomal occupancy, and these were
enriched for glycogen anabolism. Of the 549 mRNAs rhythmically regulated by
translation, the majority of these peaked during the subjective evening/night time, which
coordinates with an increase in anabolic functions as previously described (70, 71). The
549 mRNAs regulated by translation were examined further, and I identified 419 that
were controlled by clock signaling to RCK-2/eEF-2.
Future work for all 3 experiments, osmotic stress, light induction, and circadian clock
control of translation, will involve deeper analysis of the sequencing data. For the
circadian data set, once all of the data is received, I will reanalyze the data with JTK
cycle, and use alternate scripts to validate the results (i.e., DODR). In all 3 data sets,
deeper analyses will be performed to determine the translational efficiencies of the
mRNAs, as well as to investigate the role of the translationally regulated mRNAs in
metabolism. I will also determine if there are any unique motifs, with specialized
sequences or secondary structures for these mRNAs. There may also be novel upstream
open reading frames (uORFs) that are controlling initiation for these mRNAs. For RCK-
2/eEF-2 translationally regulated mRNAs, I will examine the levels of mRNA and
whether this has any effect on their specificity. If these mRNAs are highly expressed,
they may have increased sensitivity to elongation inhibition. There may also be unique
domains within the coding sequence that effect elongation rates. If unique motifs are

65
identified, mutations will be made in those domains to determine if they are responsible
for osmotic, light, and/or clock regulation of translation. We are also currently validating
the ribosome profiling data using luc translational and transcriptional fusions of several
candidate genes.
To determine the biological significance of Neurospora regulation of translation after an
osmotic stress, light stress, or over a circadian time course, we can examine if WT
strains outcompete motif deleted/mutated strains, as well as the Δrck-2 strain. These
strains would be exposed to (i) osmotic stresses with differing concentrations and
durations; (ii) light of various intensities and duration; and (iii) stresses presented at
different times of the day. From these experiments, it may be possible to determine the
biological significance for Neurospora regulation of translation.
In summary, once we have a better idea of the mechanism for how certain mRNAs are
selected for translational regulation, and given that both translation and circadian clock
mechanisms are highly conserved, this work will offer fundamental insights into
translation control by the clock, and will provide a platform to extend these studies into
mammalian clocks. Determining the circadian proteome will lead to a better
understanding of clock control of cellular metabolism, and why some drugs are more
effective or toxic at specific times of the day.
66
Materials and Methods
Strains and Growth Conditions
Vegetative growth conditions were as previously described (119). The N. crassa wild-
type (WT) FGSC#4200 (mat a, 74-OR23-IV) and FGSC#11545 (mat a, Δrck-2::hph)
strains were used for all analyses. Verification of gene deletion for the Δrck-2 strain was
accomplished by PCR, and the Δrck-2 strain containing the hph construct was
maintained on Vogel’s minimal media, supplemented with 200 μg/mL of hygromycin B
(#80055-286, VWR, Radner, PA). All experiments were conducted using germinated
conidia as previously described (123, 134, 147). Briefly, for the salt and light induction
experiments, 1X10⁶ conidia were added to 500 mL of 1X Vogel’s minimal media pH
6.0, containing 2% glucose and grown for 4 h at 25° C in LL with orbital shaking (100
rpm). The cultures were then transferred to DD for 24 h at 25° C with orbital shaking.
4% NaCl was added to the salt induction samples 30 min prior to harvest. For the light
induction samples, cultures were transferred to LL for 15, 30, 45, 60, and 120 min at 25°
C prior to harvest. For the DD12 – 32 time course experiments, 1X10⁵ conidia were
added to 500 mL of 1X Vogel’s minimal media pH 6.0, containing 2% glucose and
grown for 4 h at 25° C in LL with orbital shaking. Cultures were transferred to DD every
4 h for the indicated times at 25° C. For the DD28 – 48 time course experiments, 1X10⁴
conidia were added to 500 mL of 1X Vogel’s minimal media pH 6.0, containing 2%
glucose and grown for 2 h at 25° C in LL with orbital shaking. Cultures were transferred
to DD every 4 h for the indicated times at 25° C. All samples were harvested onto filter
paper by vacuum filtration, and washed with ice-cold DEPC water. The resulting
67
mycelial pad was cut into pieces (approx. 100 mg/piece) and placed into a 50 mL conical
tube, snap-frozen in liquid nitrogen, and stored at -80° C.
Protein Extraction and Western Blotting
To assay FRQ protein levels, protein was extracted as previously described (122) with
the following modification: the extraction buffer consisted of 50 mM HEPES pH 7.4,
137 mM NaCl, 10% glycerol, 5 mM EDTA, 10 mM NaF, 1 mM PMSF, 1 mM sodium
ortho-vanadate, and 1 mM β-glycerophosphate. Protein concentration was determined
using the Bradford assay (#500-0112, Bio-Rad Laboratories, Hercules, CA). Protein
samples (50 μg) were separated on 10% SDS/PAGE gels and blotted to an Immobilon-P
nitrocellulose membrane (#IPVH00010, Millipore, Billerica, MA) according to standard
methods. FRQ was detected using mouse monoclonal anti-FRQ primary antibody
(Supernatant from clone 3G11-1B10-E2, a gift from M. Brunner’s lab) in 7.5% milk, 1X
TBS, 0.1% Tween-20 at a concentration of 1:200 and anti-mouse IgG-Peroxidase
secondary antibody (#170-6516, BioRad Laboratories) at a concentration of 1:10,000.
Reverse Transcription Quantitative PCR (RT-qPCR)
Total RNA was extracted as previously described (148) using 750 μL of extraction
buffer (0.1 M NaOAc pH 5.3, 1% SDS, 10 mM EDTA), 500 μL acid phenol:chloroform,
and approx. 200 μL glass beads (#11079105, BioSpec Products Inc., Bartlesville, OK).
Total RNA was quantified using a NanoDrop spectrophotometer (Thermo Fisher
68
Scientific Inc., Waltham, MA) and RNA quality was assessed by denaturing gel
electrophoresis.
Synthesis of cDNA was performed as previously described (82). Briefly, total RNA (4
μg) was treated with 1 μL TURBOTM DNase (#AM1907, Thermo Fisher Scientific Inc.,
Waltham, MA for 30 min at 37° C to remove genomic DNA, and the reaction was
stopped using 1 μL DNase inactivation reagent at room temperature (RT) for 2 min.
Following centrifugation, the supernatant was transferred into a fresh tube and the RNA
was quantified using a NanoDrop spectrophotometer. DNA-free total RNA (1 μg) was
used as the template for first-strand cDNA synthesis as described by Wei et al., 2013.
Quantitative PCR (qPCR) was performed as described (82) using 3 μL of cDNA, 1X
SYBR® Green I (#S-7563, Thermo Fisher Scientific Inc., Waltham, MA), 0.25 U of
TaKaRaTM rTaq DNA polymerase (#R001A, EMD Millipore Corporation, Billerica,
MA), and 500nM of each primer. PCR was performed using an Applied Biosystems
7300 real-time PCR machine (Thermo Fisher Scientific Inc., Waltham, MA).
RNAseq
Total RNA was isolated from frozen mycelia, and poly(A) mRNA was purified from
125 μg of total RNA as previously described (134, 147) using oligo d(T)25 magnetic
beads (#S1419S, New England Biolabs, Ipswich, MA). Isolated mRNA was enriched
using Epicentre TerminatorTM 5’-phosphate-dependent exonuclease (#TER51020,
69
Illumina (Epicentre), Madison, WI). cDNA and sequencing libraries were prepared as
previously described (134, 147).
Ribosome Profiling
Ribosome profiling was carried out as previously described (149) using frozen mycelia.
Briefly, 2 g of frozen mycelia were added to pre-chilled grinding vials, along with 2 mL
of lysis beads made by dripping lysis buffer into liquid nitrogen. Samples were
pulverized in a SPEX CertiPrep 6850 Freezer/Mill® (#6850, SPEX SamplePrep,
Metuchen, NJ) using a 10 min pre-cooling cycle, followed by 3X 2 min grind cycles,
with 1 min re-cooling between each cycle. Pulverized cells were transferred to pre-
chilled 50 mL polycarbonate centrifuge tubes and allowed to thaw on ice (approx. 30
min), and then centrifuged at 4° C for 15 min at 16,000 rpm using a JA-20 rotor. The
supernatant (approx. 2 mL) was carefully removed, avoiding both the pellet and lipid
upper layer, and placed in a pre-chilled 15 mL conical tube. Cell extract was quantified
by measuring the A260 of the extract using a Varian Cary® 50 UV-Vis
Spectrophotometer (Agilent Technologies, Santa Clara, CA). 50 A260 units of extract
were brought to a final volume of 300 µL with lysis buffer, which consists of 20 mM
Tris-Cl (pH 7.5), 150 mM NaCl, 5 mM MgCl2, 1 mM DTT, 1% Triton X-100, 25 U/mL
Turbo DNase (#AM2238, Thermo Fisher Scientific Inc., Waltham, MA), and 100 μg/mL
cycloheximide; and treated with 1.875 μL of RNase I (#AM2294, Thermo Fisher
Scientific Inc., Waltham, MA) for 45 min at RT with gentle mixing. The extract was
immediately transferred to a pre-chilled 3.5 mL, 13 X 51 mm polycarbonate
70
ultracentrifuge tube, 0.9 mL of a 1M sucrose cushion underlay was added, and the
ribosomes were pelleted by centrifugation at 70,000 rpm at 4° C for 4 h. All subsequent
steps to step 46 were followed as described by Ingolia et al., 2012. The rRNA depletion
step was not performed, but instead after heat-inactivation of CircLigase (#CL4111K,
Illumina (Epicentre), Madison, WI), 2.0 µL of GlycoBlueTM (#AM9515, Thermo Fisher
Scientific Inc., Waltham, MA), 6.0 µL 5 M NaCl, 74 µL of DEPC water, and 150 µL of
isopropanol were added to each tube and precipitation was carried out overnight at -80°
C. The DNA was pelleted by centrifugation for 30 min at 20,000 g at 4° C; samples were
washed with 70% ethanol and allowed to air-dry for 10 min. The pellet was then
resuspended in 5.0 µL of 10 mM Tris (pH 8.0), and PCR amplification/barcode addition
were performed as described (149). Sequencing libraries were quantified and checked
for quality on an Agilent 2100 Bioanalyzer using a DNA high-sensitivity chip (Agilent,
Santa Clara, CA) per the manufacturer’s instructions. Sequencing was carried out on an
Illumina HiSeq 3000 (Illumina, Inc., San Diego, CA).
Read Processing
Ribosome profiling reads were trimmed using Cutadapt to remove all adapter sequences.
Before alignment, all sets of reads were individually, and as a group, analyzed using
FastQC to check read quality and length for both ribosome profiling and RNA-seq data.
Trimmed ribosome profiling reads were then aligned to N. crassa assembly 12 using
Tophat2 with Bowtie1. RNA-seq reads were aligned to N. crassa assembly 12 using
Tophat2 with Bowtie2. A maximum of 2 mismatches were allowed for any one read for
71
both ribosome profiling read alignment and RNA-seq read alignment. To determine the
amount of ribosome profiling and RNA-seq reads that mapped to the 5’ or 3’ UTR,
CDS, or other regions of the genome, read sets were concatenated into one file and
mapped to the N. crassa assembly 12 CDS annotation using “--unaligned” and “--
aligned” as outputs. The unaligned reads were then mapped to the N. crassa assembly 12
gene annotation, and the percent of reads that mapped to the CDS, the remainder of the
genes, and unmapped reads was determined.
Quantification and Analysis
Quantification of FPKM values was done using Cuffdiff and output was analyzed in R
studio as previously described (135). Briefly, cummeRbund was used to compare FPKM
values between data sets, generate scatter matrices, and compare each salt induced (30
min), light pulse (15, 30, 45, 60, and 120 min) to time 0 min. For the time course
experiments, cummeRbund was used to compare FPKM values between data sets and
generate scatter matrices. JTK cycle was then used to analyze the time course data and
identify rhythmically cycling genes (138), with the following script modification: line 14
was changed to periods <- 5:7 (to identify genes with a period range of 20 – 28) and line
15 was changed to jtk.init(periods,4) (indicating the amount of time between time
points). These data produced tables that were able to be extracted and sent to MySQL.
MySQL was used to extract all statistically significant FPKM changes (q < 0.2 and p <
0.05) for the subsequent data tables. Extracted data were analyzed using R studio in
order to produce more specific data plots. Heat maps with Euclidean clustering were

72
generated using R studio and heatmap.2 with hclust and colors were specified using
colorRampPalette. A list of the commands and script used for all sequencing data are
provided in Appendix B.
73
CHAPTER IV
SUMMARY
The results presented in this dissertation have provided additional insight into the stress
response and circadian clock regulation of translation in Neurospora. I have
demonstrated that following an osmotic stress, the p38-like OS-2 MAPK phosphorylates
the conserved serine/threonine kinase RCK-2, which in turn phosphorylates the highly
conserved eEF-2. Using ribosome profiling, coupled with RNAseq, I show that this leads
to regulation of a specific set of mRNAs that are enriched for metabolic processes. I also
demonstrate that following a light pulse, there are a specific set of mRNAs that are being
regulated in their ribosomal occupancy. These mRNAs are also enriched for metabolic
processes.
I show that the clock signals through the OS pathway to generate rhythms in
phosphorylation of RCK-2, which in turn results in rhythmic phosphorylation of eEF-2.
Clock signaling to eEF-2 leads to repression of translation during the subjective daytime,
with higher levels of translation occurring during the subjective evening (Figure 27). I
have also shown that clock regulation of eEF-2 does not globally regulate all mRNAs,
since not all proteins cycle in abundance. However, there are specific mRNAs that are
being translationally regulated by the clock, as well as by clock-control of eEF-2. Some
of these mRNAs regulate anabolism and peak in the evening, the time when anabolic
processes are highest (70, 71). Translation of mRNA is the most energy-demanding
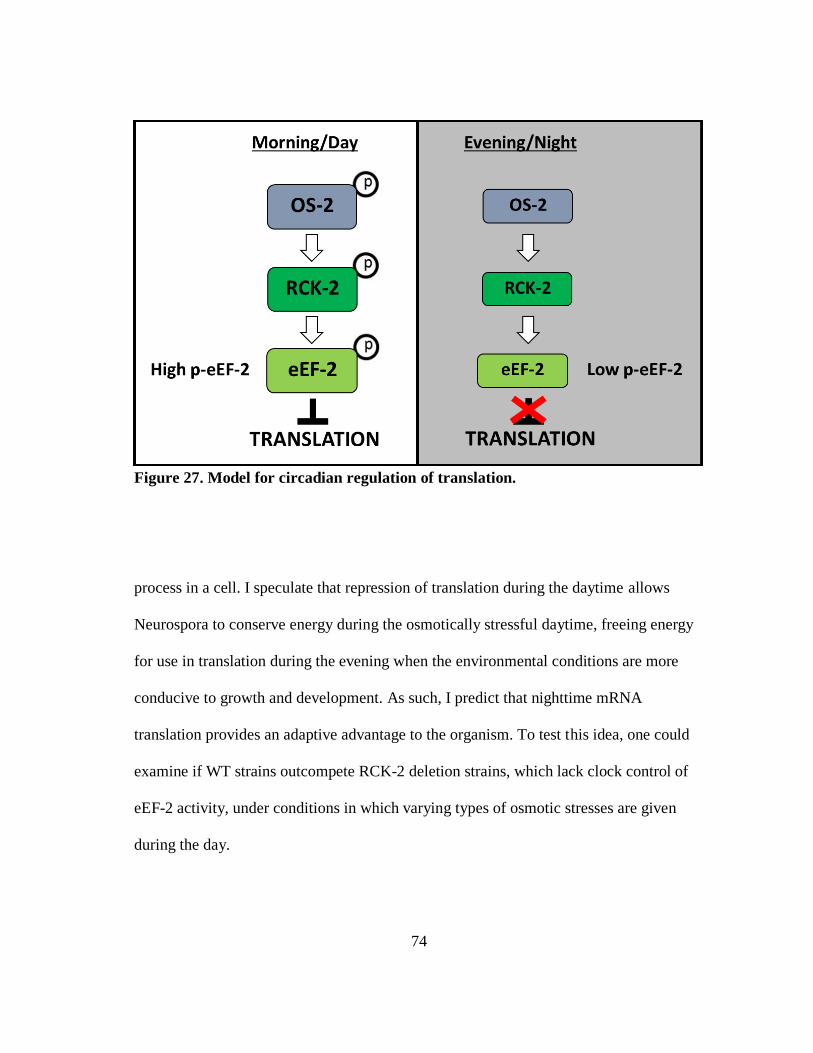
74
Figure 27. Model for circadian regulation of translation.
process in a cell. I speculate that repression of translation during the daytime allows
Neurospora to conserve energy during the osmotically stressful daytime, freeing energy
for use in translation during the evening when the environmental conditions are more
conducive to growth and development. As such, I predict that nighttime mRNA
translation provides an adaptive advantage to the organism. To test this idea, one could
examine if WT strains outcompete RCK-2 deletion strains, which lack clock control of
eEF-2 activity, under conditions in which varying types of osmotic stresses are given
during the day.
75
Stress Response Regulation of mRNA Translation in Neurospora
Translational Regulation Following an Osmotic Stress
The ability of cells to quickly respond to osmotic stress is essential for survival. Cellular
pathways are activated that lead to transcriptional activation of genes needed for
survival, or if the osmotic stress is too great, apoptosis will be triggered (150, 151).
Organisms have learned to adapt to osmotically stressful situations. In Neurospora, the
OS pathway is activated following an osmotic stress and the terminal MAPK OS-2
interacts with key transcription factors and kinases to activate genes needed to survive
the stress, and to inactivate most other genes to conserve energy (26). I identified
Neurospora RCK-2 and eEF-2 and showed that they are part of the stress response
pathway (chapter II). Overall, it makes sense to alter translation after an acute stress is
encountered as this would be the most rapid way to turn on genes needed to survive the
stress, and turn off genes that are not essential for survival. Interestingly, I found that
following an osmotic stress, specific mRNAs are regulated at the translational level and
these primarily encode for metabolic processes (chapter III). Yet, several questions still
remain.
I previously observed that induction of RCK-2 protein and phosphorylation require OS-
2, however when we compared WT and Δos-2 protein extracts on the same western gel,
the overall abundance of RCK-2 was dramatically reduced in Δos-2 cells (chapter II).
While exposure times to detect RCK-2 from WT extracts ranged from 2 – 10 s, exposure
times to detect RCK-2 from Δos-2 extracts ranged from 1 – 2 m. These data suggested
76
that not only is OS-2 regulating induction and phosphorylation of RCK-2, but also the
overall abundance of RCK-2 protein. Consistent with low levels of RCK-2 protein in
Δos-2, I found that the level of rck-2 mRNA is significantly lower in Δos-2 cells,
suggesting that the components of the OS pathway positively regulate rck-2 expression.
Previous work in our lab has shown that after an osmotic stress, OS-2 interacts with and
activates a transcription factor, ASL-1, that in turn regulates downstream stress response
genes (26). Thus, one explanation for the reduced abundance of RCK-2 in Δos-2 cells is
that ASL-1 binds to the promoter of rck-2, or to another gene that encodes a
transcription factor that regulates the expression of rck-2. To test this hypothesis, ASL-1
could be tagged with V5, followed by ChIP-seq to determine which genes are bound by
ASL-1. If rck-2 is not one of the direct targets of ASL-1, I would next examine the
possibility that other transcription factors or chromatin modifying genes regulated by
ASL-1 are responsible for the low levels of rck-2 mRNA.
Following an osmotic stress, eEF-2 phosphorylation is induced and in the absence of
rck-2 and/or os-2 this phosphorylation is reduced (chapter II). However, I still observed
low level phosphorylation of eEF-2 in the individual and doubly mutant strains,
suggesting that other kinase(s) can phosphorylate eEF-2. It is known that in mammals,
eEF-2 kinase, which regulates eEF-2, is activated by environmental stress, hypoxia, and
nutrient status (53). While we were unable to identify a Neurospora eEF-2 kinase, it is
possible that kinases associated with activation of mammalian eEF-2 kinase, including
TOR-dependent kinases, AMP-kinase, or cyclic AMP dependent protein kinase A, could
77
be directly phosphorylating eEF-2. To determine what other kinase(s) may regulate eEF-
2, I would first examine in knockouts, or knockdowns (for essential genes) of the
candidate kinases if levels of P-eEF-2 are reduced, and if so, I would generate a double
mutant strain containing a mutation in the candidate kinase, and deletion of RCK-2. If I
find that eEF-2 is not phosphorylated in the double mutant when cells are stressed by
salt, hypoxia, or nutrient depravation, I would then carry out an in vitro phosphorylation
assay using purified eEF-2 and the candidate kinase from N. crassa. If all of the
candidate kinases are ruled out as being able to phosphorylate eEF-2, I would perform an
IP with eEF-2 following an osmotic stress. However, in many cases, interactions
between kinases and their substrates are transient, and therefore difficult to IP. If I am
successful and able to pull down RCK-2 as a control with eEF-2, I would then use mass
spectrometry to identify possible candidate kinases that are associated with eEF-2.
Knockouts, or knockdowns of these candidates would then be used to validate if they are
indeed necessary for phosphorylation of eEF-2 as described above. It is also possible
that phosphates play a role in rhythmic accumulation of P-eEF-2, although this has not
been examined. In mammals, protein phosphatase 2A (PP2A) converts P-eEF-2 to an
active form (152, 153). To test if PP2A plays a role in Neurospora cells, we could
examine the levels of P-eEF-2 in an available rgb-1 mutant in Neurospora, which
encodes for the regulatory subunit of PP2A (154).
Specific mRNAs enriched for metabolic processes are being regulated at the level of
translation, in cells given an acute osmotic stress (chapter III). A subset of these
78
translationally regulated mRNAs are controlled by RCK-2/eEF-2 and are also enriched
for metabolism. However, the mechanism for this specificity is unknown. Further
analysis of the ribosome profiling sequencing data may reveal unique motifs with
specialized sequences or secondary structures for these mRNAs. There may also be
novel upstream open reading frames (uORFs) that are controlling initiation for these
mRNAs. For the mRNAs whose translational regulation is due to RCK-2/eEF-2, the
levels of mRNA could be affecting their specificity. If these mRNAs are highly
expressed, they may have increased sensitivity to elongation inhibition. There may also
be unique domains within the coding sequence that effect elongation rates.
I also showed that mRNAs are up- and down-regulated at the translational level. Further
analysis of the sequencing data may reveal that induced mRNAs have different
motifs/codon usage than repressed mRNAs. Once the mechanism(s) is/are identified,
further work would include mutating these regulatory elements to determine if they are
indeed required for specificity. This work could then be expanded to other organisms to
see if this is a conserved mechanism for mRNA regulation of translation following an
osmotic stress. The question still remains, why would these mRNAs be enriched for
metabolic processes? It is known that reactive oxygen species (ROS) are generated by
metabolism (155, 156). I speculate that following an osmotic stress, in addition to
conserving energy, Neurospora reduces translation of metabolic genes to decrease ROS
production, which in turn would increase the chance for survivability/adaptation. This
idea could be tested by examining ROS production in the RCK-2 deletion strain that
79
cannot rhythmically control the levels of P-eEF-2 following varying types of osmotic
stresses. If my hypothesis is correct, the levels of ROS would be lower in WT cells
versus Δrck-2 cells under these conditions.
Translational Regulation Following a Light Pulse
Light provides energy for growth and development, but also is damaging to DNA.
Therefore, organisms have evolved to respond to light in many different ways, including
producing photo protective proteins such as melanin in mammalian cells, and
carotenoids in plants and fungi. Following a light pulse, in Neurospora, a complex
transcription factor network is activated to extensively regulate the expression of many
genes (20). However, nothing was known about translational regulation following light
exposure. I identified specific mRNAs that were only regulated in ribosomal occupancy
in response to a light pulse, and these mRNAs, similar to the osmotic translationally
regulated mRNAs, were enriched for metabolic processes (chapter III). Further
sequencing analysis should shed light on the mechanism for this regulation by
identifying unique motifs, secondary structures, etc., as described above. Validation of
the mechanism(s) would follow as previously described, and would serve as the basis to
extend these studies into other organisms to determine if this is a conserved mechanism
for mRNA regulation of translation following a light pulse. Similar to osmotic stress,
light stress in Neurospora can lead to rapid regulation of gene expression by shutting
down translation of specific mRNAs involved in metabolism, which would be predicted
to reduce ROS production to help overcome the adverse effects of the stress.
80
Circadian Regulation of mRNA Translation in Neurospora
Circadian clocks allow organisms to anticipate daily environmental cycles, and regulate
physiology and behavior to optimize the timing of resource allocation for improved
fitness (157). For example, our heart rate and blood pressure increase in anticipation of
waking up each morning (158). In preparation for eating, our liver and fat cells
maximize the production of metabolizing and energy storage proteins (159-161). Our
capacity for learning and memory, and the onset of sleep, are clock-controlled (158).
The clock also provides a mechanism to predict and prepare for daily changes in
environmental and genotoxic stress (22, 162, 163). As a consequence of the widespread
influence of the clock on physiology, disruption of the clock, either through mutation, or
by living against the clock (e.g. shift work), significantly impacts our health (164), and
through clock regulation of metabolism, many drugs are more effective or more toxic
depending on the time of administration (165). Understanding the clock and how it
regulates these diverse biological functions has been the focus of studies from all over
the world for the past 60 years.
Neurospora has been one of the most valuable tools for circadian researchers, not just
because of the rapid generation time, ease of genetic manipulation, or the amazing
knockout library, but because of the high conservation of many of the genes and
pathways in Neurospora (i.e., what is found in Neurospora can be applicable to higher
eukaryotes). In Neurospora, the clock regulates gene expression, as well as diverse
biological functions such as growth and development. Much work has focused on the
81
regulation of transcription, but growing evidence suggests a role for the clock in
regulating translation. My work in Neurospora has focused on a mechanism for clock
regulation of translation. I found that clock signaling through the p38-like OS pathway
leads to rhythmic phosphorylation of RCK-2, which ultimately leads to phosphorylation
of eEF-2 (chapter II). I was able to show in vitro that this regulation acts as a mechanism
for clock-control of translation. Our in vitro studies used only a single optimized luc
mRNA. However, once we have a better idea of the mechanism for how certain mRNAs
are selected for regulation by eEF-2, we can validate the mechanism by using selected
and non-selected RNAs, as well as RNAs with mutations in the unique sequences, in the
in vitro translation system. Furthermore, while I was able to show that RCK-2 accounts
for 60% of the levels of P-eEF-2, we still do not know how much of the total amount of
eEF-2 is phosphorylated by stress or by the clock. Although I attempted to answer this
question, I was unable to do so because the antibody available to detect total eEF-2 only
recognizes non-phosphorylated eEF-2. Thus, I was unable to use the same antibody to
accurately quantitate the amounts of unphosphorylated and phosphorylated eEF-2 in
cells. In the future, a new antibody could be generated that can detect both forms; eEF-2
could be tagged and the phosphorylated and unphosphorylated forms separated using
Phos-TagTM gels; or alternatively, eEF-2 phosphorylation levels could be measured by
quantitative mass spectrometry.
To identify the circadian proteome, with the caveat that there are post-translational
modifications (PTMs) that regulate the stability, activity, interactions, etc. of proteins
82
(166, 167), and to determine how clock regulation of eEF-2 activity affects rhythmic
translation in vivo, I adapted a previously described ribosome profiling protocol (149)
for use with Neurospora cells. Ribosome profiling, coupled with RNAseq, showed that
specific constitutively expressed mRNAs are being translationally regulated (chapter
III). Some of these mRNAs encode metabolic processes, similar to the mRNAs enriched
following osmotic and light stress. I also found that the majority (~ 60%) peak in the
evening, the same time when anabolic processes occur in Neurospora. Further analysis
will determine if these evening specific translationally regulated mRNAs have unique
motifs with specialized sequences or secondary structures.
I found that a specific set of these constitutive mRNAs with rhythmic ribosomal
occupancy require clock signaling through RCK-2/eEF-2 to maintain rhythmicity. Since
not all of the rhythmic ribosomal occupancy mRNAs were affected, this would suggest
there are other mechanisms for clock regulation of mRNA translation. One possibility is
through clock regulation of translation initiation. I performed some preliminary
experiments and found that eIF-2α, a key factor in translation initiation, is rhythmically
phosphorylated, suggesting a possible mechanism for clock regulation of translation
initiation. These preliminary experiments are currently being followed up by another
graduate student in the lab, Shanta Karki. She demonstrated that the clock controls
rhythms in accumulation of P-eIF-2α, and she showed that the Neurospora homolog of
GCN2 kinase, CPC-3, is necessary for phosphorylation of P-eIF-2α. She just completed
a circadian ribosome profiling experiment in cells deleted for CPC-3. Thus, once we
83
obtain the results from her experiment, we will be able to assess the contribution of
rhythmic initiation control to rhythmic ribosome occupancy. If deletion of both RCK-2
and CPC-3 abolish rhythmic ribosome occupancy of all of the mRNAs, then we can
conclude that these pathways are responsible for the bulk of rhythmic translation control.
If we find that many of the mRNAs still show rhythmic occupancy, then future
experiments will be needed to identify the mechanisms responsible for this activity,
including examining the effects of deletion of other translation initiation, elongation, or
termination factors on rhythmic ribosome occupancy.
To determine how clock signaling to RCK-2/eEF-2 specifically affects translationally
regulated mRNAs, I could also determine the overall levels for mRNAs from the
RNAseq data. It may be that highly expressed mRNAs, which are predicted to have
increased ribosomal occupancy due to the abundance of mRNA availability, would have
increased sensitivity to elongation inhibition. Since not all eEF-2 is phosphorylated, as
previously indicated (chapter II), any change in the levels of P-eEF-2 could affect the
rate of translation elongation of these mRNAs. Low abundance mRNAs, which are
predicted to have decreased ribosomal occupancy, may escape this regulation. It is also
possible that there may be unique domains within the coding sequence affecting codon
usage. Future work would include mutating the identified motifs and/or regulatory
elements, and assaying mutations in these elements for loss of rhythmicity in vitro and in
vivo.
84
Another interesting possibility that has not been examined is if rhythmic ribosomal
occupancy of mRNA provides a mechanism to control the peak phase of protein
accumulation. In the future, to examine translational regulation of phase control,
candidate genes that display a discordance between rhythmic mRNA peaks and peaks in
ribosome occupancy can be selected. For each of these candidates, transcriptional and
translational luciferase fusions in WT, Δfrq, and Δrck-2 strains can be generated and
used to validate the phases of the mRNA rhythm and the protein rhythm. In cases where
changes in phase that are dependent on eEF-2 phosphorylation rhythms are validated,
possible signature motifs that confer delays in translation rates associated with
elongation can be screened. If found, these motifs can be mutated to validate their role in
phase regulation, and once confirmed, used to screen the remainder of the genome. For
example, if the majority of genes showing phase shifts between the mRNA and protein
have an unusual codon bias (168), mutants in which the codon bias in one of these genes
is altered could be assessed for changes in the phase of rhythmic protein accumulation
relative to the mRNA.
Lastly, I would like to comment on the technical limitations of analyses of genome-wide
rhythmic RNA and ribosome occupancy studies. While the development of next-
generation sequencing has revolutionized and accelerated studies of global gene
regulation, problems in statistical analyses due to depth of sequence analyses, limitations
in the numbers of replicates and time points can greatly limit the usefulness of the
results. To try to overcome these issues, John Hogenesh’s group has carried out
85
computational simulations on RNA-seq data to create standards for the field (144). They
found that 2 h sampling resolution over 2 consecutive days increases the number of
identified rhythmic transcripts and results in fewer false positives. Unfortunately, we
were unable to sample this often due to the cost of the experiments. Thus, new
bioinformatics tools are needed to overcome such limitations in experimental design,
and low sequence depth inherent in ribosome profiling data.
In summary, components of translation, stress response pathways, and the circadian
clock are all highly conserved. This work offers fundamental insights into mRNA
translational regulation due to osmotic stress, light response, and control by the clock,
providing a platform to extend these studies into mammalian stress response pathways
and clocks. Determining the effects of the stress response proteome and circadian
proteome will lead to a better understanding of how cellular metabolism is regulated,
and may lead to a better understanding of how clock defects in humans can lead to heart
disease and cancer, and could help predict drug targets that would benefit from selected
time of day administration.
86
REFERENCES
1. Dunlap JC (1999) Molecular bases for circadian clocks. Cell 96(2):271-290.
2. Karlsson B, Knutsson A, & Lindahl B (2001) Is there an association between
shift work and having a metabolic syndrome? Results from a population based
study of 27,485 people. Occupational and Environmental Medicine 58(11):747-
752.
3. Ishida N (2007) Circadian clock, cancer and lipid metabolism. Neuroscience
Research 57(4):483-490.
4. DeMarian JJ (1729) Observation botanique. L'Histoire de l'Academie Royale
Scientifique:47-48.
5. Dunlap JC, Loros JJ, & DeCoursey PJ. (2004). Chronobiology: Biological
timekeeping. Sunderland, MA: Sinauer Associates, Inc.
6. Bell-Pedersen D, et al. (2005) Circadian rhythms from multiple oscillators:
Lessons from diverse organisms. Nat Rev Genet 6(7):544-556.
7. Liu Y & Bell-Pedersen D (2006) Circadian rhythms in Neurospora crassa and
other filamentous fungi. Eukaryotic Cell 5(8):1184-1193.
8. Ballario P, et al. (1996) White collar-1, a central regulator of blue light responses
in Neurospora, is a zinc finger protein. Embo J 15(7):1650-1657.
9. Ballario P, Talora C, Galli D, Linden H, & Macino G (1998) Roles in
dimerization and blue light photoresponse of the PAS and LOV domains of
Neurospora crassa white collar proteins. Molecular Microbiology 29(3):719-729.
87
10. Sommer T, Chambers JA, Eberle J, Lauter FR, & Russo VE (1989) Fast light-
regulated genes of Neurospora crassa. Nucleic Acids Research 17(14):5713-
5723.
11. Froehlich AC, Liu Y, Loros JJ, & Dunlap JC (2002) White Collar-1, a circadian
blue light photoreceptor, binding to the frequency promoter. Science
297(5582):815-819.
12. Linden H & Macino G (1997) White collar 2, a partner in blue-light signal
transduction, controlling expression of light-regulated genes in Neurospora
crassa. Embo J 16(1):98-109.
13. Crosthwaite SK, Dunlap JC, & Loros JJ (1997) Neurospora wc-1 and wc-2:
transcription, photoresponses, and the origins of circadian rhythmicity. Science
276(5313):763-769.
14. Diernfellner A, et al. (2007) Long and short isoforms of Neurospora clock
protein FRQ support temperature-compensated circadian rhythms. FEBS Lett
581(30):5759-5764.
15. Hurley JM, Larrondo LF, Loros JJ, & Dunlap JC (2013) Conserved RNA
helicase FRH acts nonenzymatically to support the intrinsically disordered
neurospora clock protein FRQ. Molecular Cell 52(6):832-843.
16. Querfurth C, et al. (2007) Posttranslational regulation of Neurospora circadian
clock by CK1a-dependent phosphorylation. Cold Spring Harb Symp Quant Biol
72:177-183.
88
17. He Q, et al. (2003) FWD1-mediated degradation of FREQUENCY in
Neurospora establishes a conserved mechanism for circadian clock regulation.
Embo J 22(17):4421-4430.
18. Brunner M & Schafmeier T (2006) Transcriptional and post-transcriptional
regulation of the circadian clock of cyanobacteria and Neurospora. Genes Dev
20(9):1061-1074.
19. Schafmeier T, et al. (2005) Transcriptional feedback of Neurospora circadian
clock gene by phosphorylation-dependent inactivation of its transcription factor.
Cell 122(2):235-246.
20. Smith KM, et al. (2010) Transcription factors in light and circadian clock
signaling networks revealed by genomewide mapping of direct targets for
neurospora white collar complex. Eukaryotic Cell 9(10):1549-1556.
21. Coulthard LR, White DE, Jones DL, McDermott MF, & Burchill SA (2009)
p38(MAPK): Stress responses from molecular mechanisms to therapeutics.
Trends Mol Med 15(8):369-379.
22. Vitalini MW, et al. (2007) Circadian rhythmicity mediated by temporal
regulation of the activity of p38 MAPK. Proceedings of the National Academy of
Sciences of the United States of America 104(46):18223-18228.
23. Woelfle MA, Ouyang Y, Phanvijhitsiri K, & Johnson CH (2004) The adaptive
value of circadian clocks: An experimental assessment in cyanobacteria. Current
Biology : CB 14(16):1481-1486.
89
24. Dodd AN, et al. (2005) Plant circadian clocks increase photosynthesis, growth,
survival, and competitive advantage. Science 309(5734):630-633.
25. Lamb TM, Goldsmith CS, Bennett L, Finch KE, & Bell-Pedersen D (2011)
Direct transcriptional control of a p38 MAPK pathway by the circadian clock in
Neurospora crassa. Plos One 6(11).
26. Lamb TM, Finch KE, & Bell-Pedersen D (2012) The Neurospora crassa OS
MAPK pathway-activated transcription factor ASL-1 contributes to circadian
rhythms in pathway responsive clock-controlled genes. Fungal Genet Biol
49(2):180-188.
27. Vitalini MW, de Paula RM, Park WD, & Bell-Pedersen D (2006) The rhythms of
life: Circadian output pathways in Neurospora. Journal of Biological Rhythms
21(6):432-444.
28. Koike N, et al. (2012) Transcriptional architecture and chromatin landscape of
the core circadian clock in mammals. Science 338(6105):349-354.
29. Menet JS, Rodriguez J, Abruzzi KC, & Rosbash M (2012) Nascent-Seq reveals
novel features of mouse circadian transcriptional regulation. Elife 1:e00011.
30. Duffield GE (2003) DNA microarray analyses of circadian timing: The genomic
basis of biological time. J Neuroendocrinol 15(10):991-1002.
31. Partch CL, Green CB, & Takahashi JS (2014) Molecular architecture of the
mammalian circadian clock. Trends Cell Biol 24(2):90-99.
32. Nagel DH & Kay SA (2012) Complexity in the wiring and regulation of plant
circadian networks. Current Biology : CB 22(16):R648-657.
90
33. Kojima S, Shingle DL, & Green CB (2011) Post-transcriptional control of
circadian rhythms. J Cell Sci 124(Pt 3):311-320.
34. Staiger D & Koster T (2011) Spotlight on post-transcriptional control in the
circadian system. Cell Mol Life Sci 68(1):71-83.
35. Belanger V, Picard N, & Cermakian N (2006) The circadian regulation of
Presenilin-2 gene expression. Chronobiol Int 23(4):747-766.
36. Robinson BG, Frim DM, Schwartz WJ, & Majzoub JA (1988) Vasopressin
mRNA in the suprachiasmatic nuclei: Daily regulation of polyadenylate tail
length. Science 241(4863):342-344.
37. Cagampang FR, Yang J, Nakayama Y, Fukuhara C, & Inouye ST (1994)
Circadian variation of arginine-vasopressin messenger RNA in the rat
suprachiasmatic nucleus. Brain Res Mol Brain Res 24(1-4):179-184.
38. Baggs JE & Green CB (2003) Nocturnin, a deadenylase in Xenopus laevis retina:
A mechanism for posttranscriptional control of circadian-related mRNA. Current
Biology : CB 13(3):189-198.
39. Garbarino-Pico E, et al. (2007) Immediate early response of the circadian polyA
ribonuclease nocturnin to two extracellular stimuli. Rna 13(5):745-755.
40. Reddy AB, et al. (2006) Circadian orchestration of the hepatic proteome. Current
Biology : CB 16(11):1107-1115.
41. Jouffe C, et al. (2013) The circadian clock coordinates ribosome biogenesis.
PLoS Biology 11(1):e1001455.
91
42. Robles MS, Cox J, & Mann M (2014) In-vivo quantitative proteomics reveals a
key contribution of post-transcriptional mechanisms to the circadian regulation of
liver metabolism. PLoS Genet 10(1):e1004047.
43. Atger F, et al. (2015) Circadian and feeding rhythms differentially affect
rhythmic mRNA transcription and translation in mouse liver. Proceedings of the
National Academy of Sciences of the United States of America 112(47):E6579-
6588.
44. van Ooijen G & Millar AJ (2012) Non-transcriptional oscillators in circadian
timekeeping. Trends Biochem Sci 37(11):484-492.
45. Mittag M, Lee DH, & Hastings JW (1994) Circadian expression of the luciferin-
binding protein correlates with the binding of a protein to the 3' untranslated
region of its mRNA. Proceedings of the National Academy of Sciences of the
United States of America 91(12):5257-5261.
46. Huang Y, Genova G, Roberts M, & Jackson FR (2007) The LARK RNA-binding
protein selectively regulates the circadian eclosion rhythm by controlling E74
protein expression. Plos One 2(10):e1107.
47. Lee K, Loros JJ, & Dunlap JC (2000) Interconnected feedback loops in the
Neurospora circadian system. Science 289(5476):107-110.
48. Zhang Y, Lamm R, Pillonel C, Lam S, & Xu JR (2002) Osmoregulation and
fungicide resistance: The Neurospora crassa os-2 gene encodes a HOG1
mitogen-activated protein kinase homologue. Applied and Environmental
Microbiology 68(2):532-538.
92
49. Bilsland-Marchesan E, Arino J, Saito H, Sunnerhagen P, & Posas F (2000) Rck2
kinase is a substrate for the osmotic stress-activated mitogen-activated protein
kinase Hog1. Molecular and Cellular Biology 20(11):3887-3895.
50. Teige M, Scheikl E, Reiser V, Ruis H, & Ammerer G (2001) Rck2, a member of
the calmodulin-protein kinase family, links protein synthesis to high osmolarity
MAP kinase signaling in budding yeast. Proceedings of the National Academy of
Sciences of the United States of America 98(10):5625-5630.
51. Swaminathan S, Masek T, Molin C, Pospisek M, & Sunnerhagen P (2006) Rck2
is required for reprogramming of ribosomes during oxidative stress. Molecular
Biology of the Cell 17(3):1472-1482.
52. Warringer J, Hult M, Regot S, Posas F, & Sunnerhagen P (2010) The HOG
pathway dictates the short-term translational response after hyperosmotic shock.
Molecular Biology of the Cell 21(17):3080-3092.
53. Kaul G, Pattan G, & Rafeequi T (2011) Eukaryotic elongation factor-2 (eEF2):
Its regulation and peptide chain elongation. Cell Biochem Funct 29(3):227-234.
54. Nakamura J, et al. (2009) Overexpression of eukaryotic elongation factor eEF2
in gastrointestinal cancers and its involvement in G2/M progression in the cell
cycle. Int J Oncol 34(5):1181-1189.
55. Chen CY, et al. (2011) Sumoylation of eukaryotic elongation factor 2 is vital for
protein stability and anti-apoptotic activity in lung adenocarcinoma cells. Cancer
Sci 102(8):1582-1589.
93
56. Bagaglio DM, et al. (1993) Phosphorylation of elongation factor 2 in normal and
malignant rat glial cells. Cancer Research 53(10 Suppl):2260-2264.
57. Parmer TG, et al. (1999) Activity and regulation by growth factors of
calmodulin-dependent protein kinase III (elongation factor 2-kinase) in human
breast cancer. Br J Cancer 79(1):59-64.
58. Calberg U, Nilsson A, Skog S, Palmquist K, & Nygard O (1991) Increased
activity of the eEF-2 specific, Ca2+ and calmodulin dependent protein kinase III
during the S-phase in Ehrlich ascites cells. Biochemical and Biophysical
Research Communications 180(3):1372-1376.
59. Bagaglio DM & Hait WN (1994) Role of calmodulin-dependent phosphorylation
of elongation factor 2 in the proliferation of rat glial cells. Cell Growth Differ
5(12):1403-1408.
60. Celis JE, Madsen P, & Ryazanov AG (1990) Increased phosphorylation of
elongation factor 2 during mitosis in transformed human amnion cells correlates
with a decreased rate of protein synthesis. Proceedings of the National Academy
of Sciences of the United States of America 87(11):4231-4235.
61. Park S, et al. (2008) Elongation factor 2 and fragile X mental retardation protein
control the dynamic translation of Arc/Arg3.1 essential for mGluR-LTD. Neuron
59(1):70-83.
62. Weatherill DB, et al. (2011) Compartment-specific, differential regulation of
eukaryotic elongation factor 2 and its kinase within Aplysia sensory neurons. J
Neurochem 117(5):841-855.
94
63. Sudo T, Kawai K, Matsuzaki H, & Osada H (2005) p38 mitogen-activated
protein kinase plays a key role in regulating MAPKAPK2 expression.
Biochemical and Biophysical Research Communications 337(2):415-421.
64. Redpath NT, Foulstone EJ, & Proud CG (1996) Regulation of translation
elongation factor-2 by insulin via a rapamycin-sensitive signalling pathway.
Embo J 15(9):2291-2297.
65. Perentesis JP, et al. (1992) Saccharomyces cerevisiae elongation factor 2.
Genetic cloning, characterization of expression, and G-domain modeling. J Biol
Chem 267(2):1190-1197.
66. Redpath NT, Price NT, Severinov KV, & Proud CG (1993) Regulation of
elongation factor-2 by multisite phosphorylation. European Journal of
Biochemistry / FEBS 213(2):689-699.
67. Ruys SPD, et al. (2012) Identification of autophosphorylation sites in eukaryotic
elongation factor-2 kinase. Biochem J 442:681-692.
68. Knebel A, Haydon CE, Morrice N, & Cohen P (2002) Stress-induced regulation
of eukaryotic elongation factor 2 kinase by SB 203580-sensitive and -insensitive
pathways. Biochem J 367(Pt 2):525-532.
69. Hizli AA, et al. (2013) Phosphorylation of eukaryotic elongation factor 2 (eEF2)
by cyclin A-cyclin-dependent kinase 2 regulates its inhibition by eEF2 kinase.
Molecular and Cellular Biology 33(3):596-604.
95
70. Hurley JM, et al. (2014) Analysis of clock-regulated genes in Neurospora reveals
widespread posttranscriptional control of metabolic potential. Proceedings of the
National Academy of Sciences of the United States of America 111(48):16995-
17002.
71. Sancar C, Sancar G, Ha N, Cesbron F, & Brunner M (2015) Dawn- and dusk-
phased circadian transcription rhythms coordinate anabolic and catabolic
functions in Neurospora. BMC Biol 13:17.
72. Zhang R, Lahens NF, Ballance HI, Hughes ME, & Hogenesch JB (2014) A
circadian gene expression atlas in mammals: implications for biology and
medicine. Proceedings of the National Academy of Sciences of the United States
of America 111(45):16219-16224.
73. Beckwith EJ & Yanovsky MJ (2014) Circadian regulation of gene expression: At
the crossroads of transcriptional and post-transcriptional regulatory networks.
Current Opinion in Genetics & Development 27:35-42.
74. Lipton JO, et al. (2015) The Circadian Protein BMAL1 Regulates translation in
response to S6K1-mediated phosphorylation. Cell 161(5):1138-1151.
75. Cheng P, He Q, He Q, Wang L, & Liu Y (2005) Regulation of the Neurospora
circadian clock by an RNA helicase. Genes & Development 19(2):234-241.
76. He Q, Cha J, Lee HC, Yang Y, & Liu Y (2006) CKI and CKII mediate the
FREQUENCY-dependent phosphorylation of the WHITE COLLAR complex to
close the Neurospora circadian negative feedback loop. Genes & Development
20(18):2552-2565.
96
77. Schafmeier T, Kaldi K, Diernfellner A, Mohr C, & Brunner M (2006)
Phosphorylation-dependent maturation of Neurospora circadian clock protein
from a nuclear repressor toward a cytoplasmic activator. Genes & Development
20(3):297-306.
78. Heintzen C & Liu Y (2007) The Neurospora crassa circadian clock. Advances in
Genetics 58:25-66.
79. Froehlich AC, Loros JJ, & Dunlap JC (2003) Rhythmic binding of a WHITE
COLLAR-containing complex to the frequency promoter is inhibited by
FREQUENCY. Proceedings of the National Academy of Sciences of the United
States of America 100(10):5914-5919.
80. Bilsland E, Molin C, Swaminathan S, Ramne A, & Sunnerhagen P (2004) Rck1
and Rck2 MAPKAP kinases and the HOG pathway are required for oxidative
stress resistance. Molecular Microbiology 53(6):1743-1756.
81. de Paula RM, Lamb TM, Bennett L, & Bell-Pedersen D (2008) A connection
between MAPK pathways and circadian clocks. Cell Cycle 7(17):2630-2634.
82. Wei J, Zhang Y, Ivanov IP, & Sachs MS (2013) The stringency of start codon
selection in the filamentous fungus Neurospora crassa. J Biol Chem
288(13):9549-9562.
83. Wang Z, Fang P, & Sachs MS (1998) The evolutionarily conserved eukaryotic
arginine attenuator peptide regulates the movement of ribosomes that have
translated it. Molecular and Cellular Biology 18(12):7528-7536.
97
84. Yu CH, et al. (2015) Codon usage influences the local rate of translation
elongation to regulate co-translational protein folding. Molecular Cell 59(5):744-
754.
85. Tunon MJ, Gonzalez P, Lopez P, Salido GM, & Madrid JA (1992) Circadian
rhythms in glutathione and glutathione-S transferase activity of rat liver. Arch Int
Physiol Biochim Biophys 100(1):83-87.
86. Cao R, et al. (2015) Light-regulated translational control of circadian behavior by
eIF4E phosphorylation. Nature Neuroscience 18(6):855-862.
87. Cao R, et al. (2013) Translational control of entrainment and synchrony of the
suprachiasmatic circadian clock by mTOR/4E-BP1 signaling. Neuron 79(4):712-
724.
88. Cornu M, et al. (2014) Hepatic mTORC1 controls locomotor activity, body
temperature, and lipid metabolism through FGF21. Proceedings of the National
Academy of Sciences of the United States of America 111(32):11592-11599.
89. Lim C & Allada R (2013) ATAXIN-2 activates PERIOD translation to sustain
circadian rhythms in Drosophila. Science 340(6134):875-879.
90. Zhang Y, Ling J, Yuan C, Dubruille R, & Emery P (2013) A role for Drosophila
ATX2 in activation of PER translation and circadian behavior. Science
340(6134):879-882.
91. Bradley S, Narayanan S, & Rosbash M (2012) NAT1/DAP5/p97 and atypical
translational control in the Drosophila Circadian Oscillator. Genetics 192(3):943-
957.
98
92. Morf J, et al. (2012) Cold-inducible RNA-binding protein modulates circadian
gene expression posttranscriptionally. Science 338(6105):379-383.
93. Kojima S, et al. (2007) LARK activates posttranscriptional expression of an
essential mammalian clock protein, PERIOD1. Proceedings of the National
Academy of Sciences of the United States of America 104(6):1859-1864.
94. Aitken CE & Lorsch JR (2012) A mechanistic overview of translation initiation
in eukaryotes. Nature Structural & Molecular Biology 19(6):568-576.
95. Richter JD & Coller J (2015) Pausing on polyribosomes: Make way for
elongation in translational control. Cell 163(2):292-300.
96. Liu B & Qian SB (2014) Translational reprogramming in cellular stress response.
Wiley Interdiscip Rev RNA 5(3):301-315.
97. Zarubin T & Han J (2005) Activation and signaling of the p38 MAP kinase
pathway. Cell Research 15(1):11-18.
98. Knebel A, Morrice N, & Cohen P (2001) A novel method to identify protein
kinase substrates: EEF2 kinase is phosphorylated and inhibited by
SAPK4/p38delta. The EMBO Journal 20(16):4360-4369.
99. Redpath NT, Foulstone EJ, & Proud CG (1996) Regulation of translation
elongation factor-2 by insulin via a rapamycin-sensitive signalling pathway. The
EMBO Journal 15(9):2291-2297.
100. Wang X, et al. (2001) Regulation of elongation factor 2 kinase by p90(RSK1)
and p70 S6 kinase. The EMBO Journal 20(16):4370-4379.
99
101. Althausen S, et al. (2001) Changes in the phosphorylation of initiation factor eIF-
2alpha, elongation factor eEF-2 and p70 S6 kinase after transient focal cerebral
ischaemia in mice. Journal of Neurochemistry 78(4):779-787.
102. Browne GJ, Finn SG, & Proud CG (2004) Stimulation of the AMP-activated
protein kinase leads to activation of eukaryotic elongation factor 2 kinase and to
its phosphorylation at a novel site, serine 398. The Journal of Biological
Chemistry 279(13):12220-12231.
103. Horman S, et al. (2002) Activation of AMP-activated protein kinase leads to the
phosphorylation of elongation factor 2 and an inhibition of protein synthesis.
Current Biology : CB 12(16):1419-1423.
104. Redpath NT & Proud CG (1993) Cyclic AMP-dependent protein kinase
phosphorylates rabbit reticulocyte elongation factor-2 kinase and induces
calcium-independent activity. The Biochemical Journal 293 ( Pt 1):31-34.
105. Williams JA, Su HS, Bernards A, Field J, & Sehgal A (2001) A circadian output
in Drosophila mediated by neurofibromatosis-1 and Ras/MAPK. Science
293(5538):2251-2256.
106. Hayashi Y, Sanada K, Hirota T, Shimizu F, & Fukada Y (2003) p38 Mitogen-
activated Protein Kinase Regulates Oscillation of Chick Pineal Circadian Clock.
J. Biol. Chem. 278(27):25166-25171.
107. Pizzio G, Hainich E, Ferreyra G, Coso O, & Golombek D (2003) Circadian and
photic regulation of ERK, JNK and p38 in the hamster SCN. Neurochemistry
14(2):1417-1419.
100
108. Cao R, Anderson FE, Jung YJ, Dziema H, & Obrietan K (2011) Circadian
regulation of mammalian target of rapamycin signaling in the mouse
suprachiasmatic nucleus. Neuroscience 181:79-88.
109. Nikaido SS & Takahashi JS (1998) Day/night differences in the stimulation of
adenylate cyclase activity by calcium/calmodulin in chick pineal cell cultures:
evidence for circadian regulation of cyclic AMP. Journal of Biological Rhythms
13(6):479-493.
110. Lamia KA, et al. (2009) AMPK regulates the circadian clock by cryptochrome
phosphorylation and degradation. Science 326(5951):437-440.
111. Janich P, Arpat AB, Castelo-Szekely V, Lopes M, & Gatfield D (2015)
Ribosome profiling reveals the rhythmic liver translatome and circadian clock
regulation by upstream open reading frames. Genome Research 25(12):1848-
1859.
112. Jang C, Lahens NF, Hogenesch JB, & Sehgal A (2015) Ribosome profiling
reveals an important role for translational control in circadian gene expression.
Genome Research 25(12):1836-1847.
113. Bass J (2012) Circadian topology of metabolism. Nature 491(7424):348-356.
114. Froy O (2013) Circadian aspects of energy metabolism and aging. Ageing
Research Reviews 12(4):931-940.
101
115. Burkeen JF, Womac AD, Earnest DJ, & Zoran MJ (2011) Mitochondrial calcium
signaling mediates rhythmic extracellular ATP accumulation in suprachiasmatic
nucleus astrocytes. The Journal of Neuroscience : The Official Journal of the
Society for Neuroscience 31(23):8432-8440.
116. Yamazaki S, Ishida Y, & Inouye S (1994) Circadian rhythms of adenosine
triphosphate contents in the suprachiasmatic nucleus, anterior hypothalamic area
and caudate putamen of the rat--negative correlation with electrical activity.
Brain Research 664(1-2):237-240.
117. Marpegan L, et al. (2011) Circadian regulation of ATP release in astrocytes. The
Journal of Neuroscience : The Official Journal of the Society for Neuroscience
31(23):8342-8350.
118. Lakin-Thomas PL, Bell-Pedersen D, & Brody S (2011) The genetics of circadian
rhythms in Neurospora. Adv Genet 74:55-103.
119. Loros JJ, Denome SA, & Dunlap JC (1989) Molecular cloning of genes under
control of the circadian clock in Neurospora. Science 243(4889):385-388.
120. Honda S & Selker EU (2009) Tools for fungal proteomics: multifunctional
neurospora vectors for gene replacement, protein expression and protein
purification. Genetics 182(1):11-23.
102
121. Gooch VD, et al. (2008) Fully codon-optimized luciferase uncovers novel
temperature characteristics of the Neurospora clock. Eukaryotic Cell 7(1):28-37.
122. Garceau NY, Liu Y, Loros JJ, & Dunlap JC (1997) Alternative initiation of
translation and time-specific phosphorylation yield multiple forms of the
essential clock protein FREQUENCY. Cell 89(3):469-476.
123. Davis RH & de Serres FJ (1970) Genetic and microbiological research
techniques for Neurospora crassa. Methods in Enzymology 17:79-143.
124. Wang Z & Sachs MS (1997) Arginine-specific regulation mediated by the
Neurospora crassa arg-2 upstream open reading frame in a homologous, cell-free
in vitro translation system. J Biol Chem 272(1):255-261.
125. Zeenko VV, et al. (2008) An efficient in vitro translation system from
mammalian cells lacking the translational inhibition caused by eIF2
phosphorylation. Rna 14(3):593-602.
126. Dyer BW, Ferrer FA, Klinedinst DK, & Rodriguez R (2000) A noncommercial
dual luciferase enzyme assay system for reporter gene analysis. Analytical
Biochemistry 282(1):158-161.
127. Larrondo LF, Olivares-Yanez C, Baker CL, Loros JJ, & Dunlap JC (2015)
Circadian rhythms. Decoupling circadian clock protein turnover from circadian
period determination. Science 347(6221):1257277.
128. Bennett LD, Beremand P, Thomas TL, & Bell-Pedersen D (2013) Circadian
activation of the mitogen-activated protein kinase MAK-1 facilitates rhythms in
clock-controlled genes in Neurospora crassa. Eukaryotic Cell 12(1):59-69.
103
129. Waskiewicz AJ & Cooper JA (1995) Mitogen and stress response pathways:
MAP kinase cascades and phosphatase regulation in mammals and yeast. Curr
Opin Cell Biol 7(6):798-805.
130. Fulda S, Gorman AM, Hori O, & Samali A (2010) Cellular stress responses: Cell
survival and cell death. Int J Cell Biol 2010:214074.
131. Idnurm A & Heitman J (2005) Light controls growth and development via a
conserved pathway in the fungal kingdom. PLoS Biology 3(4):e95.
132. de Nadal E, Ammerer G, & Posas F (2011) Controlling gene expression in
response to stress. Nat Rev Genet 12(12):833-845.
133. Young MW & Kay SA (2001) Time zones: A comparative genetics of circadian
clocks. Nat Rev Genet 2(9):702-715.
134. Wu C, et al. (2014) Genome-wide characterization of light-regulated genes in
Neurospora crassa. G3 4(9):1731-1745.
135. Trapnell C, et al. (2012) Differential gene and transcript expression analysis of
RNA-seq experiments with TopHat and Cufflinks. Nature Protocols 7(3):562-
578.
136. Lauter FR & Russo VE (1991) Blue light induction of conidiation-specific genes
in Neurospora crassa. Nucleic Acids Research 19(24):6883-6886.
137. Ingolia NT, Ghaemmaghami S, Newman JR, & Weissman JS (2009) Genome-
wide analysis in vivo of translation with nucleotide resolution using ribosome
profiling. Science 324(5924):218-223.
104
138. Hughes ME, Hogenesch JB, & Kornacker K (2010) JTK_CYCLE: an efficient
nonparametric algorithm for detecting rhythmic components in genome-scale
data sets. Journal of Biological Rhythms 25(5):372-380.
139. Noguchi R, et al. (2007) Identification of OS-2 MAP kinase-dependent genes
induced in response to osmotic stress, antifungal agent fludioxonil, and heat
shock in Neurospora crassa. Fungal Genet Biol 44(3):208-218.
140. Freitas FZ, et al. (2016) The SEB-1 Transcription Factor Binds to the STRE
Motif in Neurospora crassa and Regulates a Variety of Cellular Processes
Including the Stress Response and Reserve Carbohydrate Metabolism. G3
6(5):1327-1343.
141. Rajasekhar VK, et al. (2003) Oncogenic Ras and Akt signaling contribute to
glioblastoma formation by differential recruitment of existing mRNAs to
polysomes. Molecular Cell 12(4):889-901.
142. Halbeisen RE & Gerber AP (2009) Stress-dependent coordination of
transcriptome and translatome in yeast. PLoS Biology 7(5):e1000105.
143. He Q & Liu Y (2005) Molecular mechanism of light responses in Neurospora:
from light-induced transcription to photoadaptation. Genes Dev 19(23):2888-
2899.
144. Li J, Grant GR, Hogenesch JB, & Hughes ME (2015) Considerations for RNA-
seq analysis of circadian rhythms. Methods Enzymol 551:349-367.
145. Luck S & Westermark PO (2016) Circadian mRNA expression: Insights from
modeling and transcriptomics. Cell Mol Life Sci 73(3):497-521.
105
146. Thaben PF & Westermark PO (2016) Differential rhythmicity: Detecting altered
rhythmicity in biological data. Bioinformatics.
147. Sachs MS & Yanofsky C (1991) Developmental expression of genes involved in
conidiation and amino acid biosynthesis in Neurospora crassa. Dev Biol
148(1):117-128.
148. Yarden O, Plamann M, Ebbole DJ, & Yanofsky C (1992) cot-1, a gene required
for hyphal elongation in Neurospora crassa, encodes a protein kinase. Embo J
11(6):2159-2166.
149. Ingolia NT, Brar GA, Rouskin S, McGeachy AM, & Weissman JS (2012) The
ribosome profiling strategy for monitoring translation in vivo by deep sequencing
of ribosome-protected mRNA fragments. Nature Protocols 7(8):1534-1550.
150. Bortner CD, Scoltock AB, Sifre MI, & Cidlowski JA (2012) Osmotic stress
resistance imparts acquired anti-apoptotic mechanisms in lymphocytes. J Biol
Chem 287(9):6284-6295.
151. Dmitrieva NI, Michea LF, Rocha GM, & Burg MB (2001) Cell cycle delay and
apoptosis in response to osmotic stress. Comp Biochem Physiol A Mol Integr
Physiol 130(3):411-420.
152. Redpath NT & Proud CG (1989) The tumour promoter okadaic acid inhibits
reticulocyte-lysate protein synthesis by increasing the net phosphorylation of
elongation factor 2. Biochem J 262(1):69-75.
106
153. Gschwendt M, Kittstein W, Mieskes G, & Marks F (1989) A type 2A protein
phosphatase dephosphorylates the elongation factor 2 and is stimulated by the
phorbol ester TPA in mouse epidermis in vivo. FEBS Lett 257(2):357-360.
154. Yang Y, et al. (2004) Distinct roles for PP1 and PP2A in the Neurospora
circadian clock. Genes Dev 18(3):255-260.
155. Apel K & Hirt H (2004) Reactive oxygen species: Metabolism, oxidative stress,
and signal transduction. Annu Rev Plant Biol 55:373-399.
156. Ha H & Lee HB (2000) Reactive oxygen species as glucose signaling molecules
in mesangial cells cultured under high glucose. Kidney Int Suppl 77:S19-25.
157. Sharma VK (2003) Adaptive significance of circadian clocks. Chronobiol Int
20(6):901-919.
158. Kyriacou CP & Hastings MH (2010) Circadian clocks: Genes, sleep, and
cognition. Trends Cogn Sci 14(6):259-267.
159. Green CB, Takahashi JS, & Bass J (2008) The meter of metabolism. Cell
134(5):728-742.
160. Froy O (2010) Metabolism and circadian rhythms--implications for obesity.
Endocr Rev 31(1):1-24.
161. Kovac J, Husse J, & Oster H (2009) A time to fast, a time to feast: The crosstalk
between metabolism and the circadian clock. Mol Cells 28(2):75-80.
162. Miki T, Matsumoto T, Zhao Z, & Lee CC (2013) p53 regulates Period2
expression and the circadian clock. Nat Commun 4:2444.
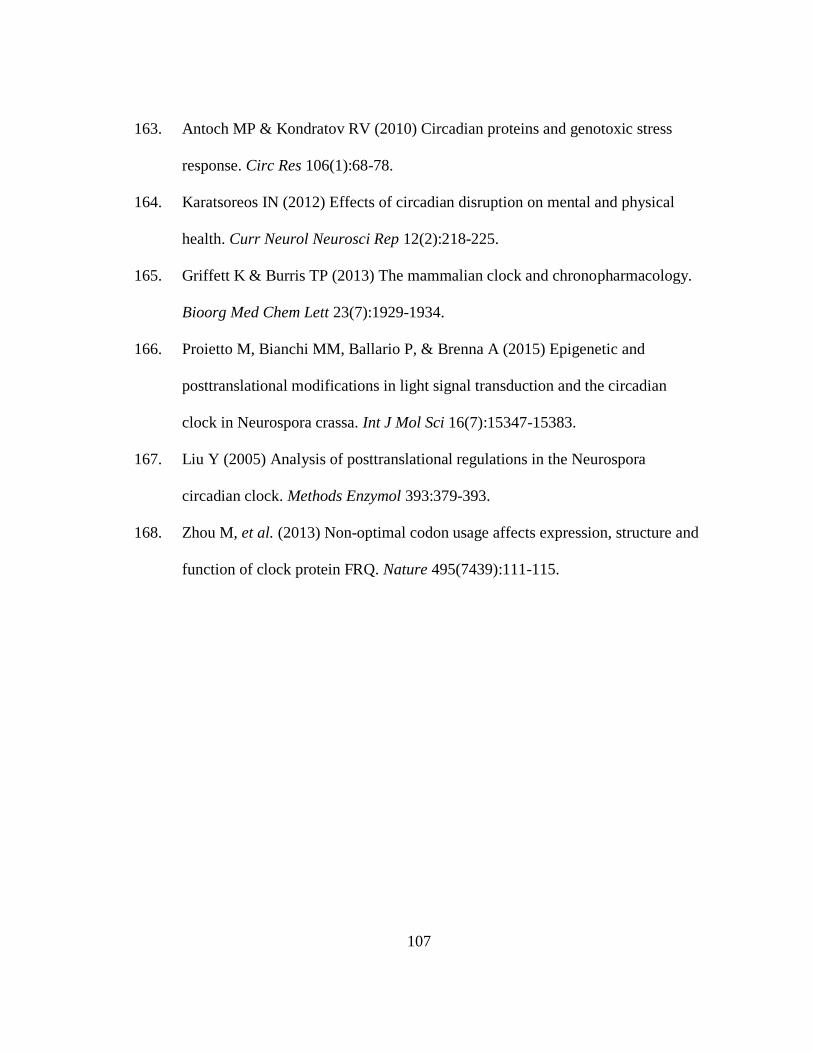
107
163. Antoch MP & Kondratov RV (2010) Circadian proteins and genotoxic stress
response. Circ Res 106(1):68-78.
164. Karatsoreos IN (2012) Effects of circadian disruption on mental and physical
health. Curr Neurol Neurosci Rep 12(2):218-225.
165. Griffett K & Burris TP (2013) The mammalian clock and chronopharmacology.
Bioorg Med Chem Lett 23(7):1929-1934.
166. Proietto M, Bianchi MM, Ballario P, & Brenna A (2015) Epigenetic and
posttranslational modifications in light signal transduction and the circadian
clock in Neurospora crassa. Int J Mol Sci 16(7):15347-15383.
167. Liu Y (2005) Analysis of posttranslational regulations in the Neurospora
circadian clock. Methods Enzymol 393:379-393.
168. Zhou M, et al. (2013) Non-optimal codon usage affects expression, structure and
function of clock protein FRQ. Nature 495(7439):111-115.
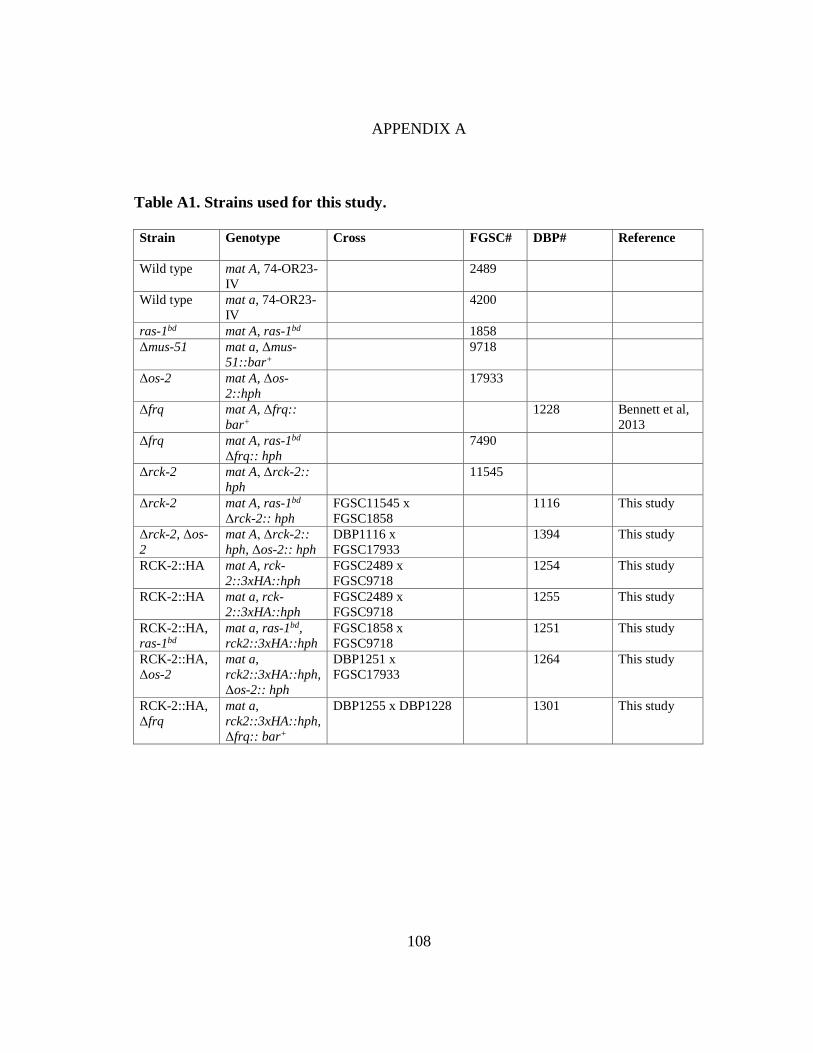
108
APPENDIX A
Table A1. Strains used for this study.
Strain Genotype Cross FGSC# DBP# Reference
Wild type mat A, 74-OR23-
IV
2489
Wild type mat a, 74-OR23-
IV
4200
ras-1bd mat A, ras-1bd 1858
Δmus-51 mat a, Δmus-
51::bar+
9718
Δos-2 mat A, Δos-
2::hph
17933
Δfrq mat A, Δfrq::
bar+
1228 Bennett et al,
2013
Δfrq mat A, ras-1bd
Δfrq:: hph
7490
Δrck-2 mat A, Δrck-2::
hph
11545
Δrck-2 mat A, ras-1bd
Δrck-2:: hph
FGSC11545 x
FGSC1858
1116 This study
Δrck-2, Δos-
2
mat A, Δrck-2::
hph, Δos-2:: hph
DBP1116 x
FGSC17933
1394 This study
RCK-2::HA mat A, rck-
2::3xHA::hph
FGSC2489 x
FGSC9718
1254 This study
RCK-2::HA mat a, rck-
2::3xHA::hph
FGSC2489 x
FGSC9718
1255 This study
RCK-2::HA,
ras-1bd
mat a, ras-1bd,
rck2::3xHA::hph
FGSC1858 x
FGSC9718
1251 This study
RCK-2::HA,
Δos-2
mat a,
rck2::3xHA::hph,
Δos-2:: hph
DBP1251 x
FGSC17933
1264 This study
RCK-2::HA,
Δfrq
mat a,
rck2::3xHA::hph,
Δfrq:: bar+
DBP1255 x DBP1228 1301 This study
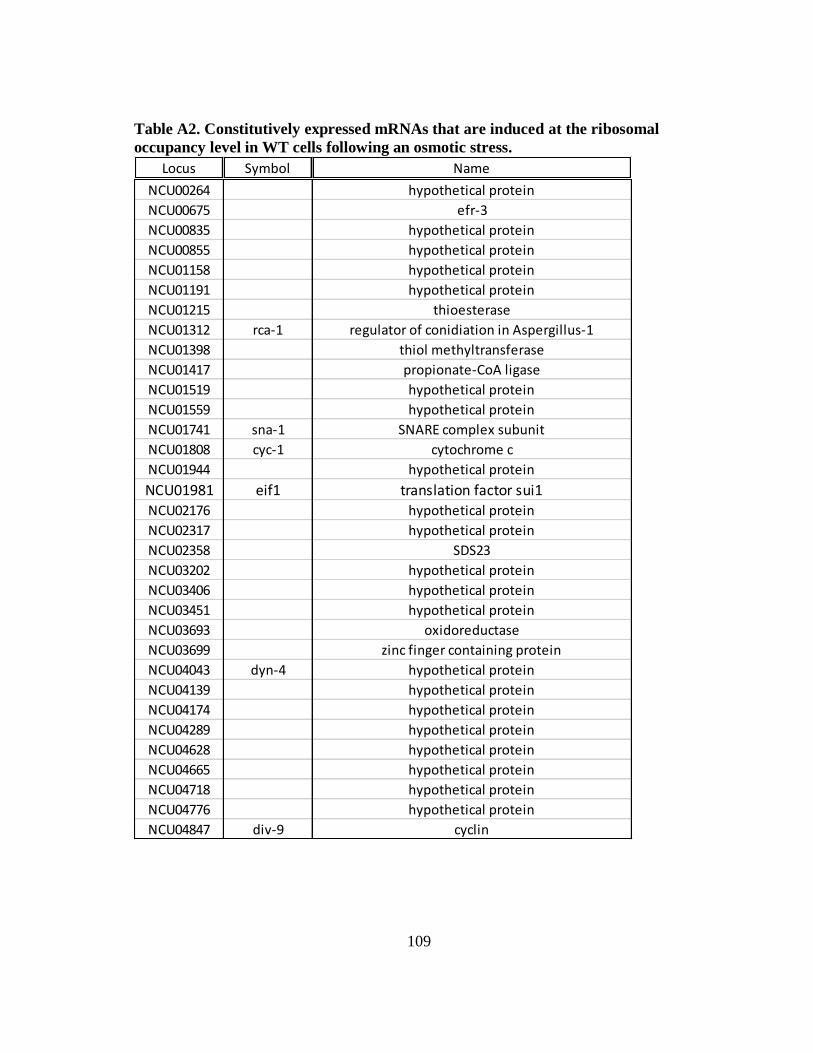
109
Table A2. Constitutively expressed mRNAs that are induced at the ribosomal
occupancy level in WT cells following an osmotic stress.
Locus Symbol Name
NCU00264 hypothetical protein
NCU00675 efr-3
NCU00835 hypothetical protein
NCU00855 hypothetical protein
NCU01158 hypothetical protein
NCU01191 hypothetical protein
NCU01215 thioesterase
NCU01312 rca-1 regulator of conidiation in Aspergillus-1
NCU01398 thiol methyltransferase
NCU01417 propionate-CoA ligase
NCU01519 hypothetical protein
NCU01559 hypothetical protein
NCU01741 sna-1 SNARE complex subunit
NCU01808 cyc-1 cytochrome c
NCU01944 hypothetical protein
NCU01981 eif1 translation factor sui1NCU02176 hypothetical protein
NCU02317 hypothetical protein
NCU02358 SDS23
NCU03202 hypothetical protein
NCU03406 hypothetical protein
NCU03451 hypothetical protein
NCU03693 oxidoreductase
NCU03699 zinc finger containing protein
NCU04043 dyn-4 hypothetical protein
NCU04139 hypothetical protein
NCU04174 hypothetical protein
NCU04289 hypothetical protein
NCU04628 hypothetical protein
NCU04665 hypothetical protein
NCU04718 hypothetical protein
NCU04776 hypothetical protein
NCU04847 div-9 cyclin
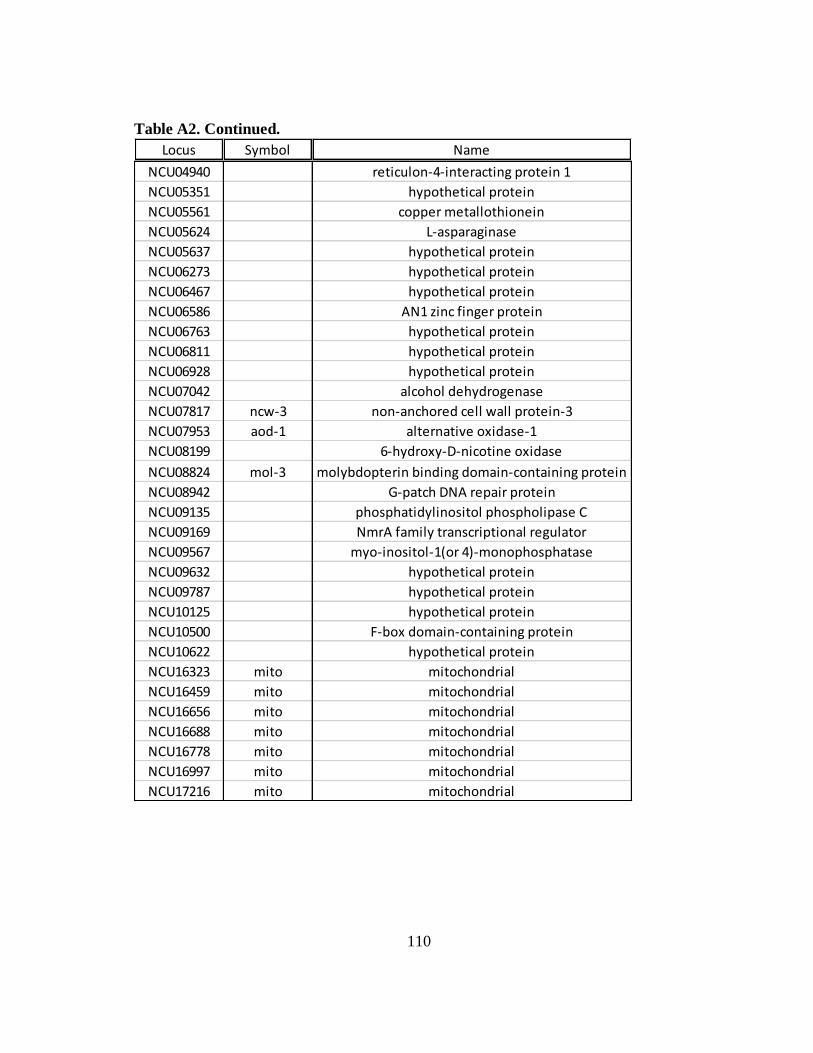
110
Table A2. Continued.
Locus Symbol Name
NCU04940 reticulon-4-interacting protein 1
NCU05351 hypothetical protein
NCU05561 copper metallothionein
NCU05624 L-asparaginase
NCU05637 hypothetical protein
NCU06273 hypothetical protein
NCU06467 hypothetical protein
NCU06586 AN1 zinc finger protein
NCU06763 hypothetical protein
NCU06811 hypothetical protein
NCU06928 hypothetical protein
NCU07042 alcohol dehydrogenase
NCU07817 ncw-3 non-anchored cell wall protein-3
NCU07953 aod-1 alternative oxidase-1
NCU08199 6-hydroxy-D-nicotine oxidase
NCU08824 mol-3 molybdopterin binding domain-containing protein
NCU08942 G-patch DNA repair protein
NCU09135 phosphatidylinositol phospholipase C
NCU09169 NmrA family transcriptional regulator
NCU09567 myo-inositol-1(or 4)-monophosphatase
NCU09632 hypothetical protein
NCU09787 hypothetical protein
NCU10125 hypothetical protein
NCU10500 F-box domain-containing protein
NCU10622 hypothetical protein
NCU16323 mito mitochondrial
NCU16459 mito mitochondrial
NCU16656 mito mitochondrial
NCU16688 mito mitochondrial
NCU16778 mito mitochondrial
NCU16997 mito mitochondrial
NCU17216 mito mitochondrial
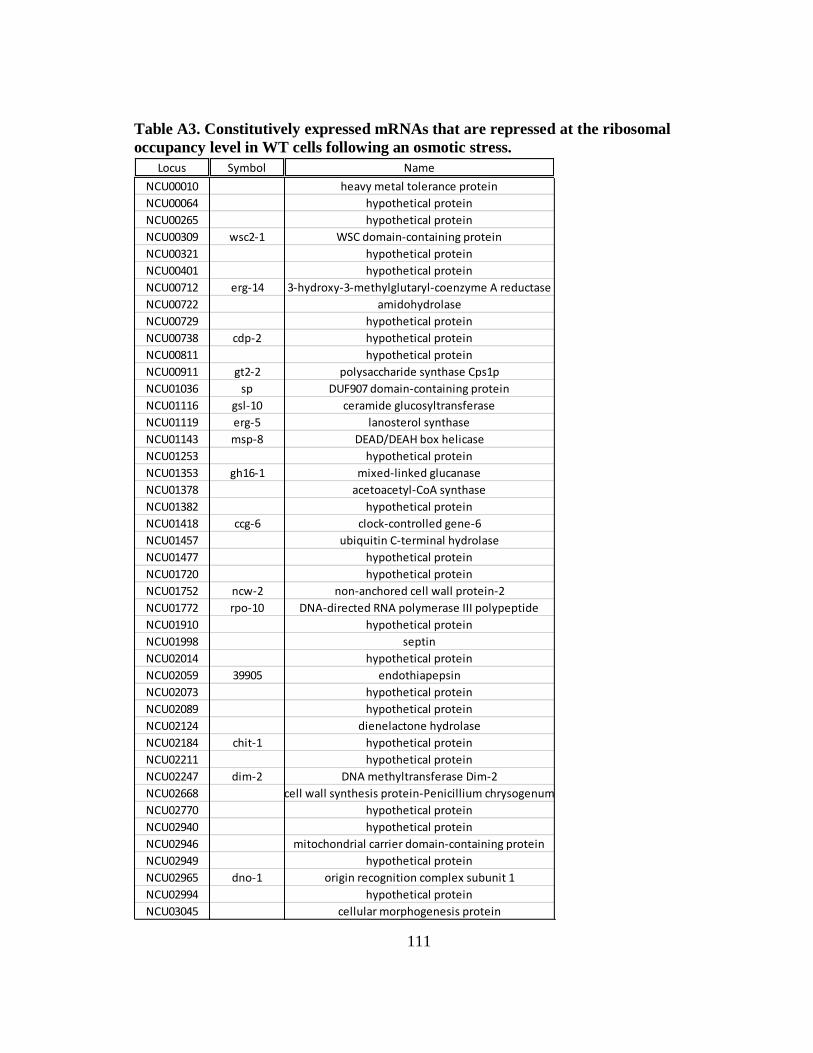
111
Table A3. Constitutively expressed mRNAs that are repressed at the ribosomal
occupancy level in WT cells following an osmotic stress.
Locus Symbol Name
NCU00010 heavy metal tolerance protein
NCU00064 hypothetical protein
NCU00265 hypothetical protein
NCU00309 wsc2-1 WSC domain-containing protein
NCU00321 hypothetical protein
NCU00401 hypothetical protein
NCU00712 erg-14 3-hydroxy-3-methylglutaryl-coenzyme A reductase
NCU00722 amidohydrolase
NCU00729 hypothetical protein
NCU00738 cdp-2 hypothetical protein
NCU00811 hypothetical protein
NCU00911 gt2-2 polysaccharide synthase Cps1p
NCU01036 sp DUF907 domain-containing protein
NCU01116 gsl-10 ceramide glucosyltransferase
NCU01119 erg-5 lanosterol synthase
NCU01143 msp-8 DEAD/DEAH box helicase
NCU01253 hypothetical protein
NCU01353 gh16-1 mixed-linked glucanase
NCU01378 acetoacetyl-CoA synthase
NCU01382 hypothetical protein
NCU01418 ccg-6 clock-controlled gene-6
NCU01457 ubiquitin C-terminal hydrolase
NCU01477 hypothetical protein
NCU01720 hypothetical protein
NCU01752 ncw-2 non-anchored cell wall protein-2
NCU01772 rpo-10 DNA-directed RNA polymerase III polypeptide
NCU01910 hypothetical protein
NCU01998 septin
NCU02014 hypothetical protein
NCU02059 39905 endothiapepsin
NCU02073 hypothetical protein
NCU02089 hypothetical protein
NCU02124 dienelactone hydrolase
NCU02184 chit-1 hypothetical protein
NCU02211 hypothetical protein
NCU02247 dim-2 DNA methyltransferase Dim-2
NCU02668 cell wall synthesis protein-Penicillium chrysogenum
NCU02770 hypothetical protein
NCU02940 hypothetical protein
NCU02946 mitochondrial carrier domain-containing protein
NCU02949 hypothetical protein
NCU02965 dno-1 origin recognition complex subunit 1
NCU02994 hypothetical protein
NCU03045 cellular morphogenesis protein
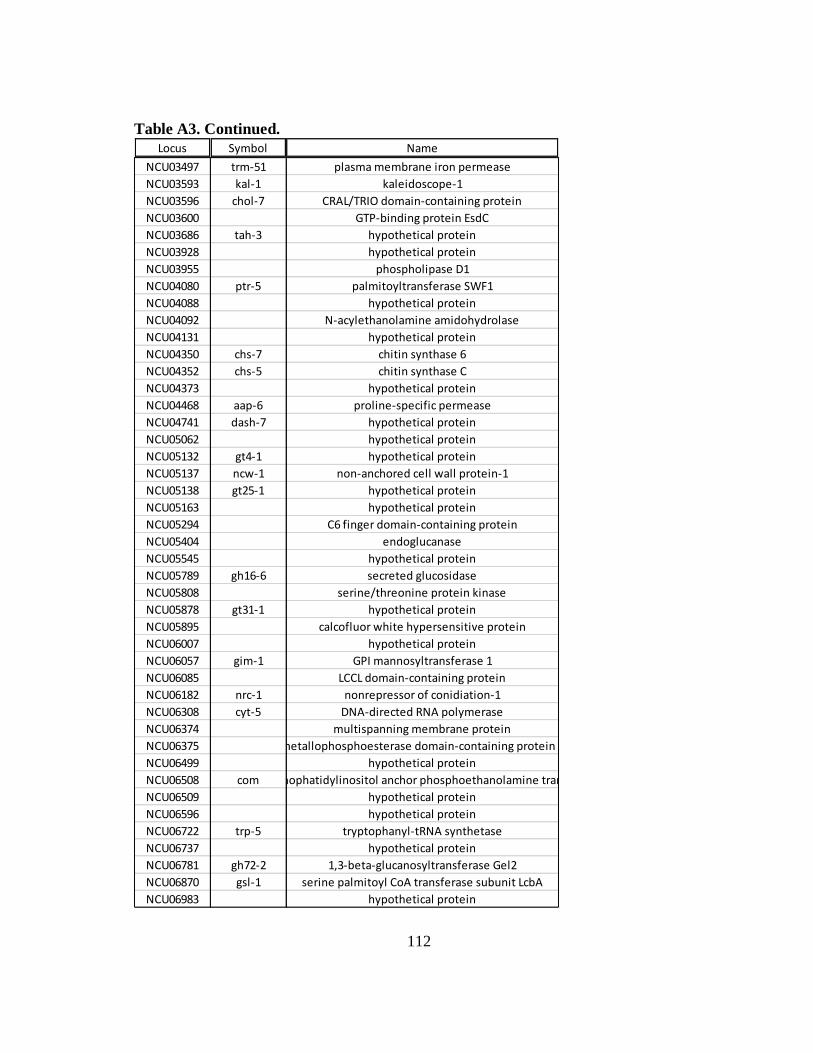
112
Table A3. Continued.
Locus Symbol Name
NCU03497 trm-51 plasma membrane iron permease
NCU03593 kal-1 kaleidoscope-1
NCU03596 chol-7 CRAL/TRIO domain-containing protein
NCU03600 GTP-binding protein EsdC
NCU03686 tah-3 hypothetical protein
NCU03928 hypothetical protein
NCU03955 phospholipase D1
NCU04080 ptr-5 palmitoyltransferase SWF1
NCU04088 hypothetical protein
NCU04092 N-acylethanolamine amidohydrolase
NCU04131 hypothetical protein
NCU04350 chs-7 chitin synthase 6
NCU04352 chs-5 chitin synthase C
NCU04373 hypothetical protein
NCU04468 aap-6 proline-specific permease
NCU04741 dash-7 hypothetical protein
NCU05062 hypothetical protein
NCU05132 gt4-1 hypothetical protein
NCU05137 ncw-1 non-anchored cell wall protein-1
NCU05138 gt25-1 hypothetical protein
NCU05163 hypothetical protein
NCU05294 C6 finger domain-containing protein
NCU05404 endoglucanase
NCU05545 hypothetical protein
NCU05789 gh16-6 secreted glucosidase
NCU05808 serine/threonine protein kinase
NCU05878 gt31-1 hypothetical protein
NCU05895 calcofluor white hypersensitive protein
NCU06007 hypothetical protein
NCU06057 gim-1 GPI mannosyltransferase 1
NCU06085 LCCL domain-containing protein
NCU06182 nrc-1 nonrepressor of conidiation-1
NCU06308 cyt-5 DNA-directed RNA polymerase
NCU06374 multispanning membrane protein
NCU06375 metallophosphoesterase domain-containing protein 2
NCU06499 hypothetical protein
NCU06508 comglycosylphophatidylinositol anchor phosphoethanolamine transferase 3
NCU06509 hypothetical protein
NCU06596 hypothetical protein
NCU06722 trp-5 tryptophanyl-tRNA synthetase
NCU06737 hypothetical protein
NCU06781 gh72-2 1,3-beta-glucanosyltransferase Gel2
NCU06870 gsl-1 serine palmitoyl CoA transferase subunit LcbA
NCU06983 hypothetical protein
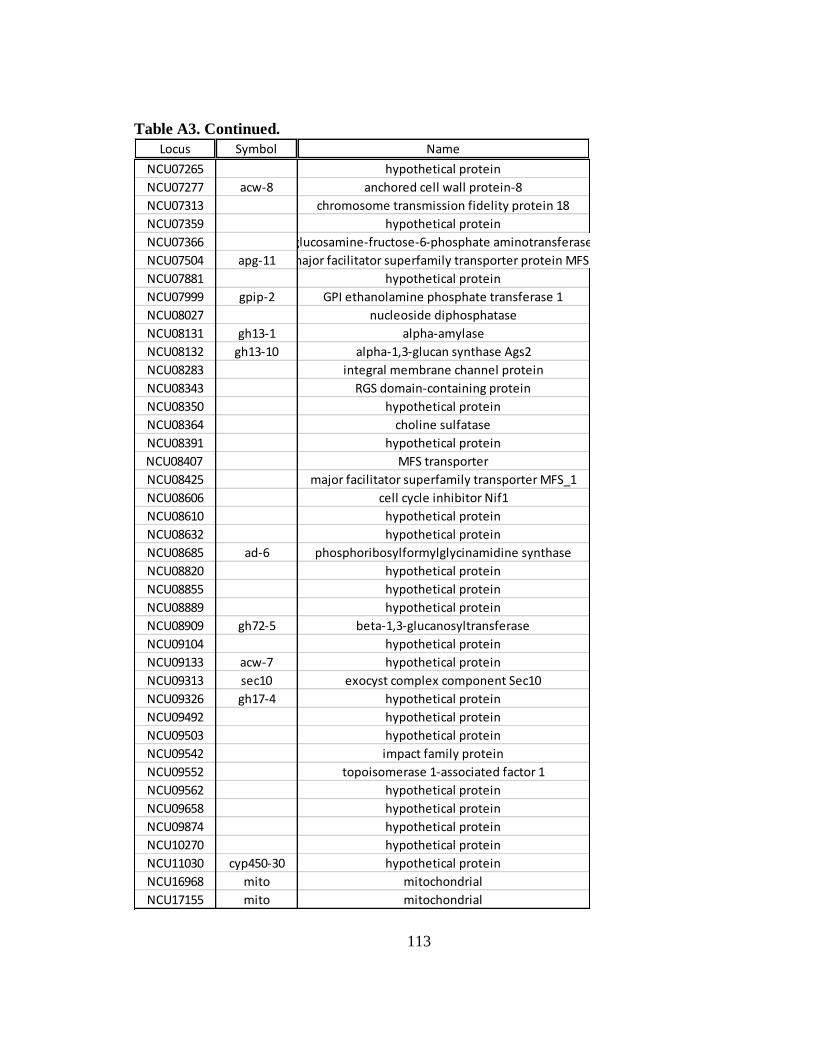
113
Table A3. Continued.
Locus Symbol Name
NCU07265 hypothetical protein
NCU07277 acw-8 anchored cell wall protein-8
NCU07313 chromosome transmission fidelity protein 18
NCU07359 hypothetical protein
NCU07366 glucosamine-fructose-6-phosphate aminotransferase
NCU07504 apg-11 major facilitator superfamily transporter protein MFS1
NCU07881 hypothetical protein
NCU07999 gpip-2 GPI ethanolamine phosphate transferase 1
NCU08027 nucleoside diphosphatase
NCU08131 gh13-1 alpha-amylase
NCU08132 gh13-10 alpha-1,3-glucan synthase Ags2
NCU08283 integral membrane channel protein
NCU08343 RGS domain-containing protein
NCU08350 hypothetical protein
NCU08364 choline sulfatase
NCU08391 hypothetical protein
NCU08407 MFS transporter
NCU08425 major facilitator superfamily transporter MFS_1
NCU08606 cell cycle inhibitor Nif1
NCU08610 hypothetical protein
NCU08632 hypothetical protein
NCU08685 ad-6 phosphoribosylformylglycinamidine synthase
NCU08820 hypothetical protein
NCU08855 hypothetical protein
NCU08889 hypothetical protein
NCU08909 gh72-5 beta-1,3-glucanosyltransferase
NCU09104 hypothetical protein
NCU09133 acw-7 hypothetical protein
NCU09313 sec10 exocyst complex component Sec10
NCU09326 gh17-4 hypothetical protein
NCU09492 hypothetical protein
NCU09503 hypothetical protein
NCU09542 impact family protein
NCU09552 topoisomerase 1-associated factor 1
NCU09562 hypothetical protein
NCU09658 hypothetical protein
NCU09874 hypothetical protein
NCU10270 hypothetical protein
NCU11030 cyp450-30 hypothetical protein
NCU16968 mito mitochondrial
NCU17155 mito mitochondrial
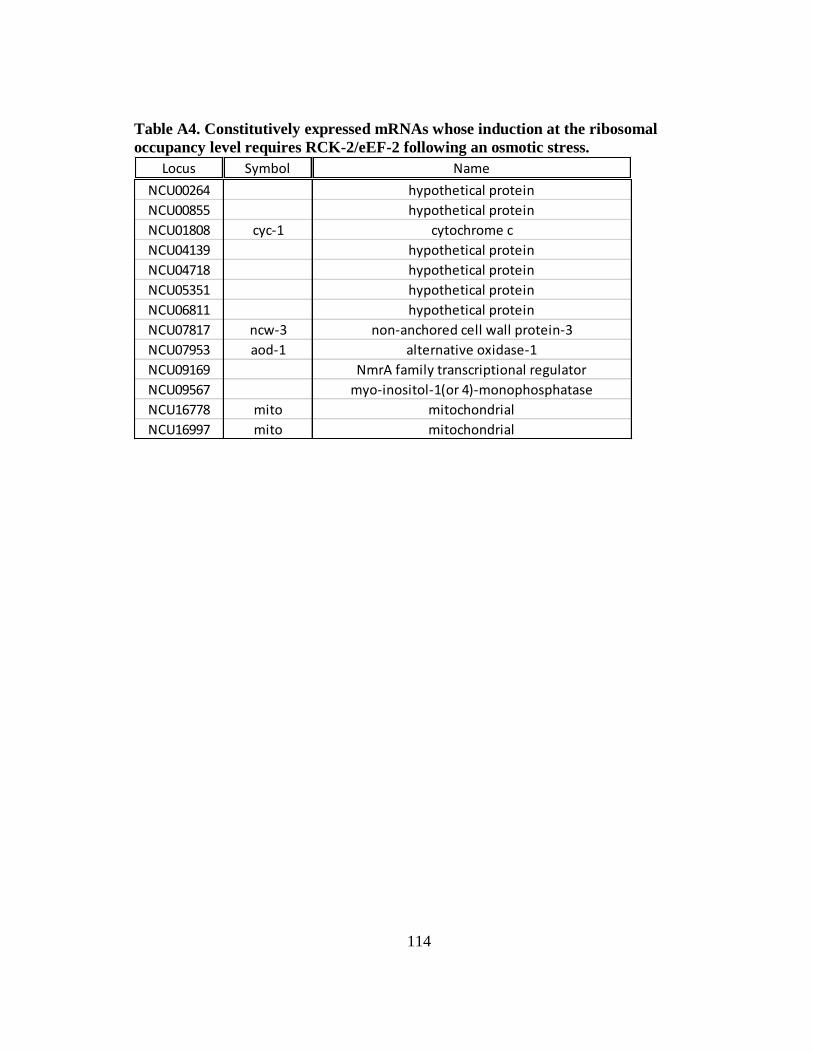
114
Table A4. Constitutively expressed mRNAs whose induction at the ribosomal
occupancy level requires RCK-2/eEF-2 following an osmotic stress.
Locus Symbol Name
NCU00264 hypothetical protein
NCU00855 hypothetical protein
NCU01808 cyc-1 cytochrome c
NCU04139 hypothetical protein
NCU04718 hypothetical protein
NCU05351 hypothetical protein
NCU06811 hypothetical protein
NCU07817 ncw-3 non-anchored cell wall protein-3
NCU07953 aod-1 alternative oxidase-1
NCU09169 NmrA family transcriptional regulator
NCU09567 myo-inositol-1(or 4)-monophosphatase
NCU16778 mito mitochondrial
NCU16997 mito mitochondrial
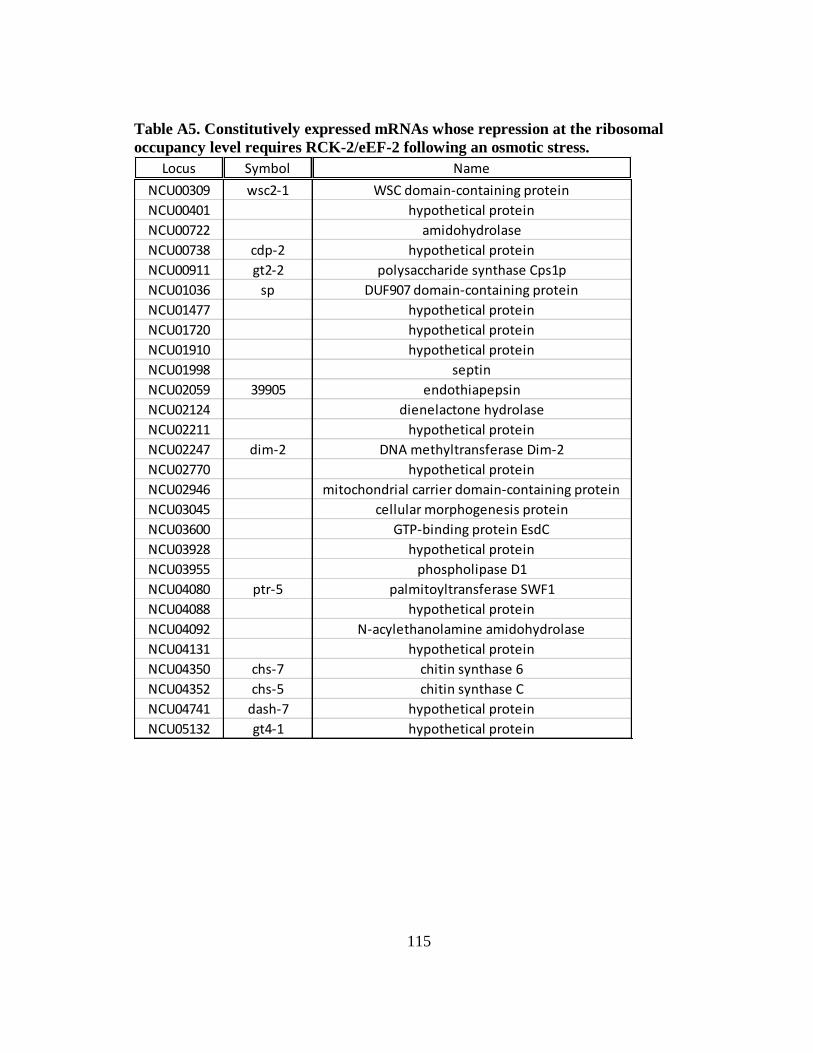
115
Table A5. Constitutively expressed mRNAs whose repression at the ribosomal
occupancy level requires RCK-2/eEF-2 following an osmotic stress.
Locus Symbol Name
NCU00309 wsc2-1 WSC domain-containing protein
NCU00401 hypothetical protein
NCU00722 amidohydrolase
NCU00738 cdp-2 hypothetical protein
NCU00911 gt2-2 polysaccharide synthase Cps1p
NCU01036 sp DUF907 domain-containing protein
NCU01477 hypothetical protein
NCU01720 hypothetical protein
NCU01910 hypothetical protein
NCU01998 septin
NCU02059 39905 endothiapepsin
NCU02124 dienelactone hydrolase
NCU02211 hypothetical protein
NCU02247 dim-2 DNA methyltransferase Dim-2
NCU02770 hypothetical protein
NCU02946 mitochondrial carrier domain-containing protein
NCU03045 cellular morphogenesis protein
NCU03600 GTP-binding protein EsdC
NCU03928 hypothetical protein
NCU03955 phospholipase D1
NCU04080 ptr-5 palmitoyltransferase SWF1
NCU04088 hypothetical protein
NCU04092 N-acylethanolamine amidohydrolase
NCU04131 hypothetical protein
NCU04350 chs-7 chitin synthase 6
NCU04352 chs-5 chitin synthase C
NCU04741 dash-7 hypothetical protein
NCU05132 gt4-1 hypothetical protein
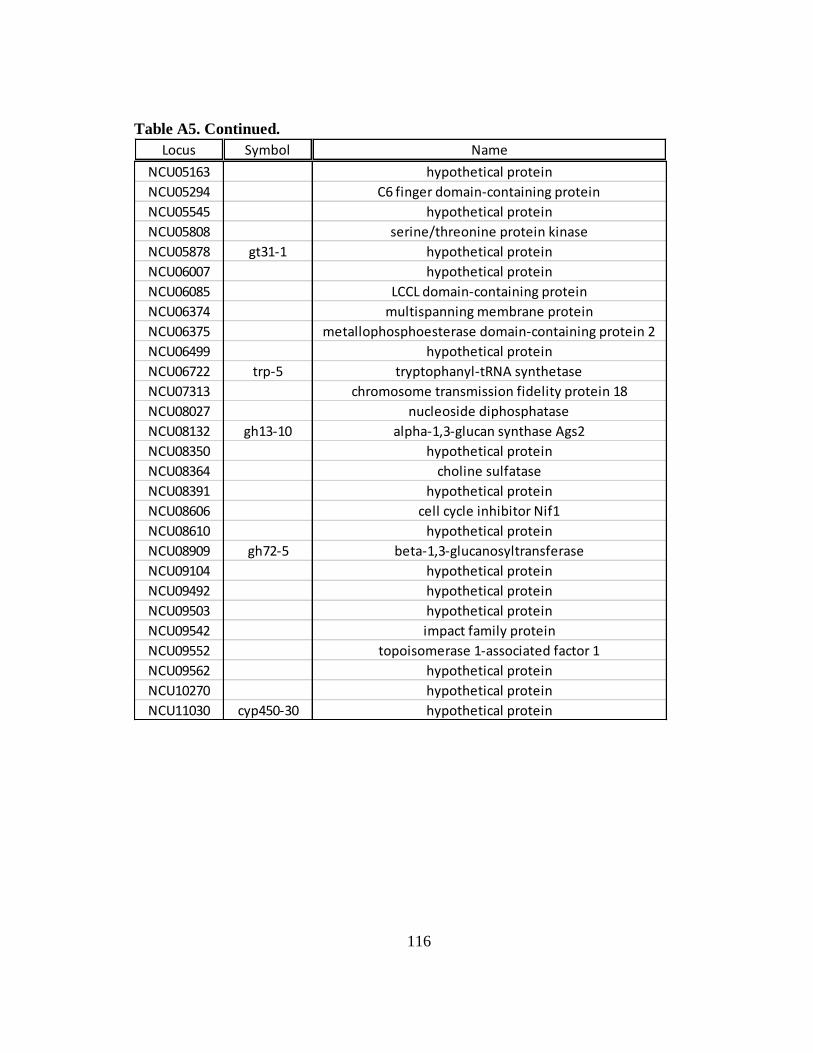
116
Table A5. Continued.
Locus Symbol Name
NCU05163 hypothetical protein
NCU05294 C6 finger domain-containing protein
NCU05545 hypothetical protein
NCU05808 serine/threonine protein kinase
NCU05878 gt31-1 hypothetical protein
NCU06007 hypothetical protein
NCU06085 LCCL domain-containing protein
NCU06374 multispanning membrane protein
NCU06375 metallophosphoesterase domain-containing protein 2
NCU06499 hypothetical protein
NCU06722 trp-5 tryptophanyl-tRNA synthetase
NCU07313 chromosome transmission fidelity protein 18
NCU08027 nucleoside diphosphatase
NCU08132 gh13-10 alpha-1,3-glucan synthase Ags2
NCU08350 hypothetical protein
NCU08364 choline sulfatase
NCU08391 hypothetical protein
NCU08606 cell cycle inhibitor Nif1
NCU08610 hypothetical protein
NCU08909 gh72-5 beta-1,3-glucanosyltransferase
NCU09104 hypothetical protein
NCU09492 hypothetical protein
NCU09503 hypothetical protein
NCU09542 impact family protein
NCU09552 topoisomerase 1-associated factor 1
NCU09562 hypothetical protein
NCU10270 hypothetical protein
NCU11030 cyp450-30 hypothetical protein
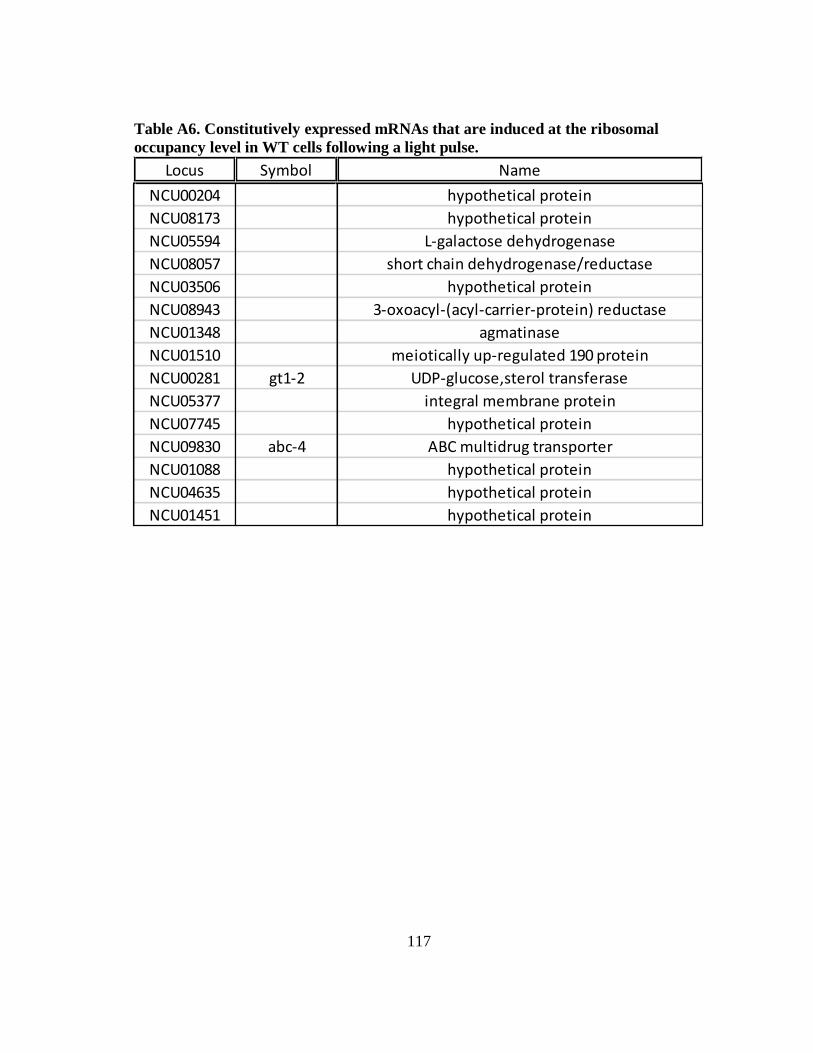
117
Table A6. Constitutively expressed mRNAs that are induced at the ribosomal
occupancy level in WT cells following a light pulse.
Locus Symbol Name
NCU00204 hypothetical protein
NCU08173 hypothetical protein
NCU05594 L-galactose dehydrogenase
NCU08057 short chain dehydrogenase/reductase
NCU03506 hypothetical protein
NCU08943 3-oxoacyl-(acyl-carrier-protein) reductase
NCU01348 agmatinase
NCU01510 meiotically up-regulated 190 protein
NCU00281 gt1-2 UDP-glucose,sterol transferase
NCU05377 integral membrane protein
NCU07745 hypothetical protein
NCU09830 abc-4 ABC multidrug transporter
NCU01088 hypothetical protein
NCU04635 hypothetical protein
NCU01451 hypothetical protein
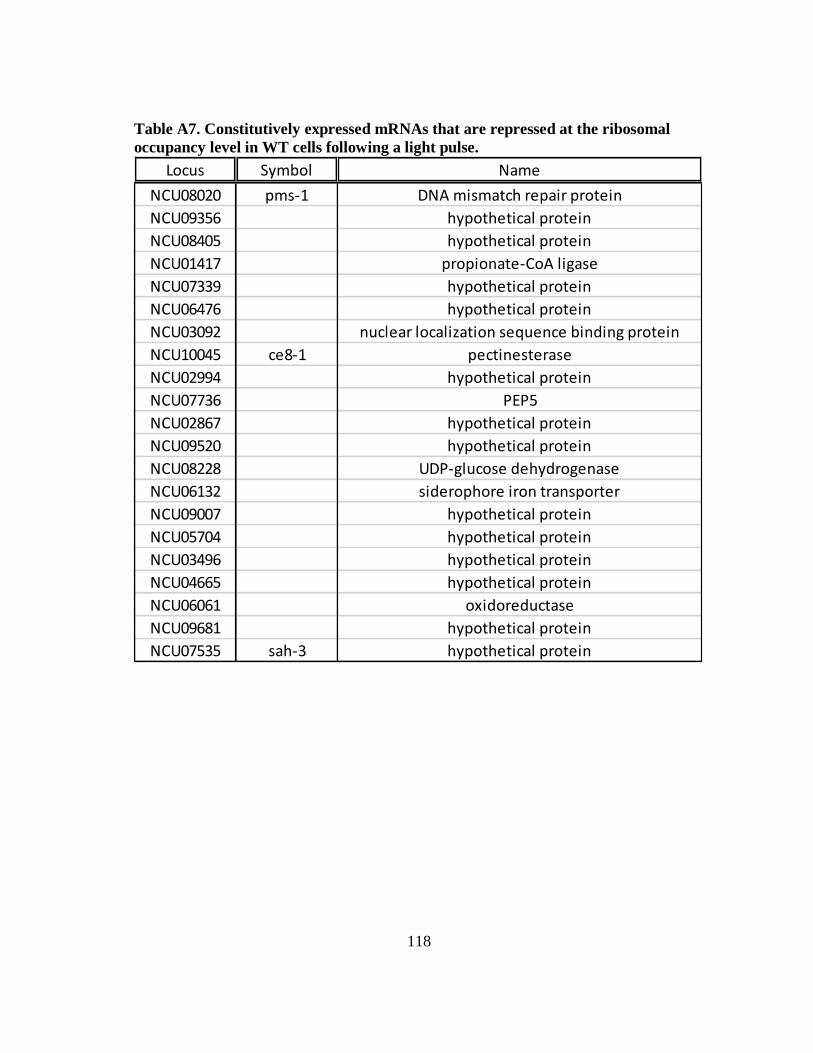
118
Table A7. Constitutively expressed mRNAs that are repressed at the ribosomal
occupancy level in WT cells following a light pulse.
Locus Symbol Name
NCU08020 pms-1 DNA mismatch repair protein
NCU09356 hypothetical protein
NCU08405 hypothetical protein
NCU01417 propionate-CoA ligase
NCU07339 hypothetical protein
NCU06476 hypothetical protein
NCU03092 nuclear localization sequence binding protein
NCU10045 ce8-1 pectinesterase
NCU02994 hypothetical protein
NCU07736 PEP5
NCU02867 hypothetical protein
NCU09520 hypothetical protein
NCU08228 UDP-glucose dehydrogenase
NCU06132 siderophore iron transporter
NCU09007 hypothetical protein
NCU05704 hypothetical protein
NCU03496 hypothetical protein
NCU04665 hypothetical protein
NCU06061 oxidoreductase
NCU09681 hypothetical protein
NCU07535 sah-3 hypothetical protein
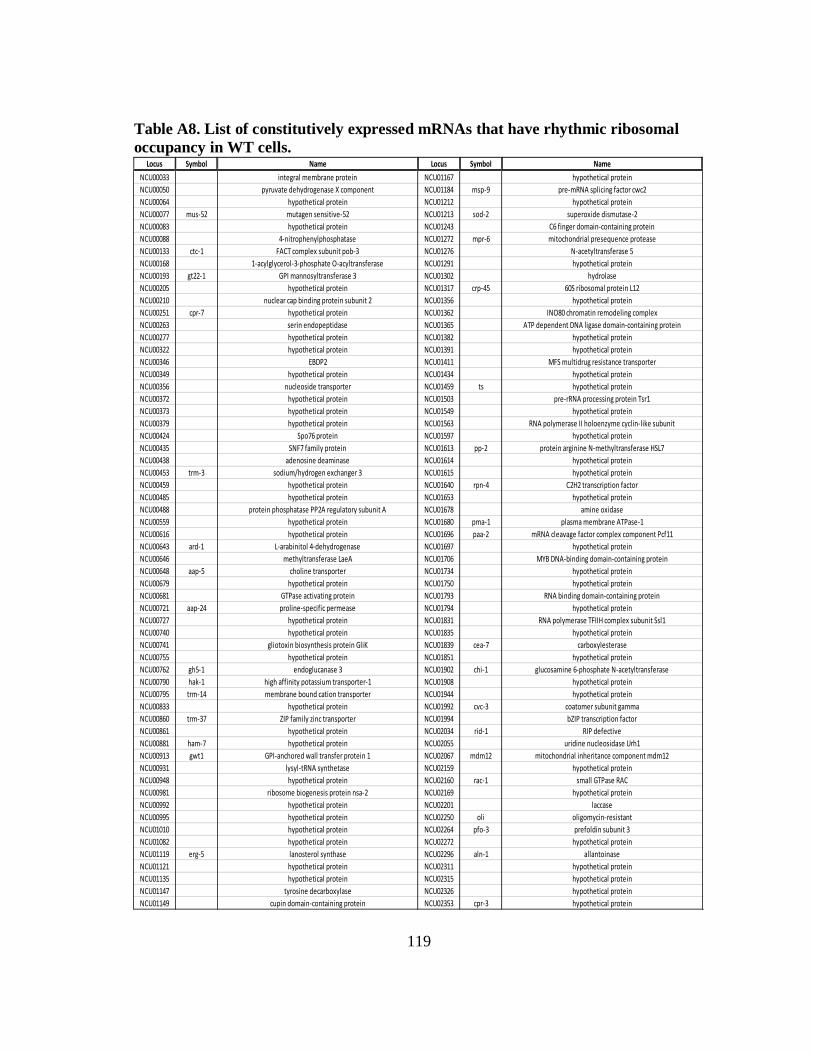
119
Table A8. List of constitutively expressed mRNAs that have rhythmic ribosomal
occupancy in WT cells.
Locus Symbol Name Locus Symbol Name Locus
NCU00033 integral membrane protein NCU01167 hypothetical protein NCU02355
NCU00050 pyruvate dehydrogenase X component NCU01184 msp-9 pre-mRNA splicing factor cwc2 NCU02362
NCU00064 hypothetical protein NCU01212 hypothetical protein NCU02371
NCU00077 mus-52 mutagen sensitive-52 NCU01213 sod-2 superoxide dismutase-2 NCU02385
NCU00083 hypothetical protein NCU01243 C6 finger domain-containing protein NCU02415
NCU00088 4-nitrophenylphosphatase NCU01272 mpr-6 mitochondrial presequence protease NCU02428
NCU00133 ctc-1 FACT complex subunit pob-3 NCU01276 N-acetyltransferase 5 NCU02460
NCU00168 1-acylglycerol-3-phosphate O-acyltransferase NCU01291 hypothetical protein NCU02482
NCU00193 gt22-1 GPI mannosyltransferase 3 NCU01302 hydrolase NCU02496
NCU00205 hypothetical protein NCU01317 crp-45 60S ribosomal protein L12 NCU02536
NCU00210 nuclear cap binding protein subunit 2 NCU01356 hypothetical protein NCU02559
NCU00251 cpr-7 hypothetical protein NCU01362 INO80 chromatin remodeling complex NCU02561
NCU00263 serin endopeptidase NCU01365 ATP dependent DNA ligase domain-containing protein NCU02578
NCU00277 hypothetical protein NCU01382 hypothetical protein NCU02614
NCU00322 hypothetical protein NCU01391 hypothetical protein NCU02631
NCU00346 EBDP2 NCU01411 MFS multidrug resistance transporter NCU02651
NCU00349 hypothetical protein NCU01434 hypothetical protein NCU02663
NCU00356 nucleoside transporter NCU01459 ts hypothetical protein NCU02678
NCU00372 hypothetical protein NCU01503 pre-rRNA processing protein Tsr1 NCU02679
NCU00373 hypothetical protein NCU01549 hypothetical protein NCU02682
NCU00379 hypothetical protein NCU01563 RNA polymerase II holoenzyme cyclin-like subunit NCU02705
NCU00424 Spo76 protein NCU01597 hypothetical protein NCU02717
NCU00435 SNF7 family protein NCU01613 pp-2 protein arginine N-methyltransferase HSL7 NCU02743
NCU00438 adenosine deaminase NCU01614 hypothetical protein NCU02748
NCU00453 trm-3 sodium/hydrogen exchanger 3 NCU01615 hypothetical protein NCU02753
NCU00459 hypothetical protein NCU01640 rpn-4 C2H2 transcription factor NCU02780
NCU00485 hypothetical protein NCU01653 hypothetical protein NCU02789
NCU00488 protein phosphatase PP2A regulatory subunit A NCU01678 amine oxidase NCU02811
NCU00559 hypothetical protein NCU01680 pma-1 plasma membrane ATPase-1 NCU02830
NCU00616 hypothetical protein NCU01696 paa-2 mRNA cleavage factor complex component Pcf11 NCU02852
NCU00643 ard-1 L-arabinitol 4-dehydrogenase NCU01697 hypothetical protein NCU02869
NCU00646 methyltransferase LaeA NCU01706 MYB DNA-binding domain-containing protein NCU02877
NCU00648 aap-5 choline transporter NCU01734 hypothetical protein NCU02896
NCU00679 hypothetical protein NCU01750 hypothetical protein NCU02913
NCU00681 GTPase activating protein NCU01793 RNA binding domain-containing protein NCU02975
NCU00721 aap-24 proline-specific permease NCU01794 hypothetical protein NCU03019
NCU00727 hypothetical protein NCU01831 RNA polymerase TFIIH complex subunit Ssl1 NCU03023
NCU00740 hypothetical protein NCU01835 hypothetical protein NCU03061
NCU00741 gliotoxin biosynthesis protein GliK NCU01839 cea-7 carboxylesterase NCU03068
NCU00755 hypothetical protein NCU01851 hypothetical protein NCU03070
NCU00762 gh5-1 endoglucanase 3 NCU01902 chi-1 glucosamine 6-phosphate N-acetyltransferase NCU03136
NCU00790 hak-1 high affinity potassium transporter-1 NCU01908 hypothetical protein NCU03142
NCU00795 trm-14 membrane bound cation transporter NCU01944 hypothetical protein NCU03158
NCU00833 hypothetical protein NCU01992 cvc-3 coatomer subunit gamma NCU03166
NCU00860 trm-37 ZIP family zinc transporter NCU01994 bZIP transcription factor NCU03208
NCU00861 hypothetical protein NCU02034 rid-1 RIP defective NCU03233
NCU00881 ham-7 hypothetical protein NCU02055 uridine nucleosidase Urh1 NCU03245
NCU00913 gwt1 GPI-anchored wall transfer protein 1 NCU02067 mdm12 mitochondrial inheritance component mdm12 NCU03265
NCU00931 lysyl-tRNA synthetase NCU02159 hypothetical protein NCU03283
NCU00948 hypothetical protein NCU02160 rac-1 small GTPase RAC NCU03298
NCU00981 ribosome biogenesis protein nsa-2 NCU02169 hypothetical protein NCU03310
NCU00992 hypothetical protein NCU02201 laccase NCU03316
NCU00995 hypothetical protein NCU02250 oli oligomycin-resistant NCU03355
NCU01010 hypothetical protein NCU02264 pfo-3 prefoldin subunit 3 NCU03359
NCU01082 hypothetical protein NCU02272 hypothetical protein NCU03401
NCU01119 erg-5 lanosterol synthase NCU02296 aln-1 allantoinase NCU03413
NCU01121 hypothetical protein NCU02311 hypothetical protein NCU03546
NCU01135 hypothetical protein NCU02315 hypothetical protein NCU03561
NCU01147 tyrosine decarboxylase NCU02326 hypothetical protein NCU03564
NCU01149 cupin domain-containing protein NCU02353 cpr-3 hypothetical protein NCU03566
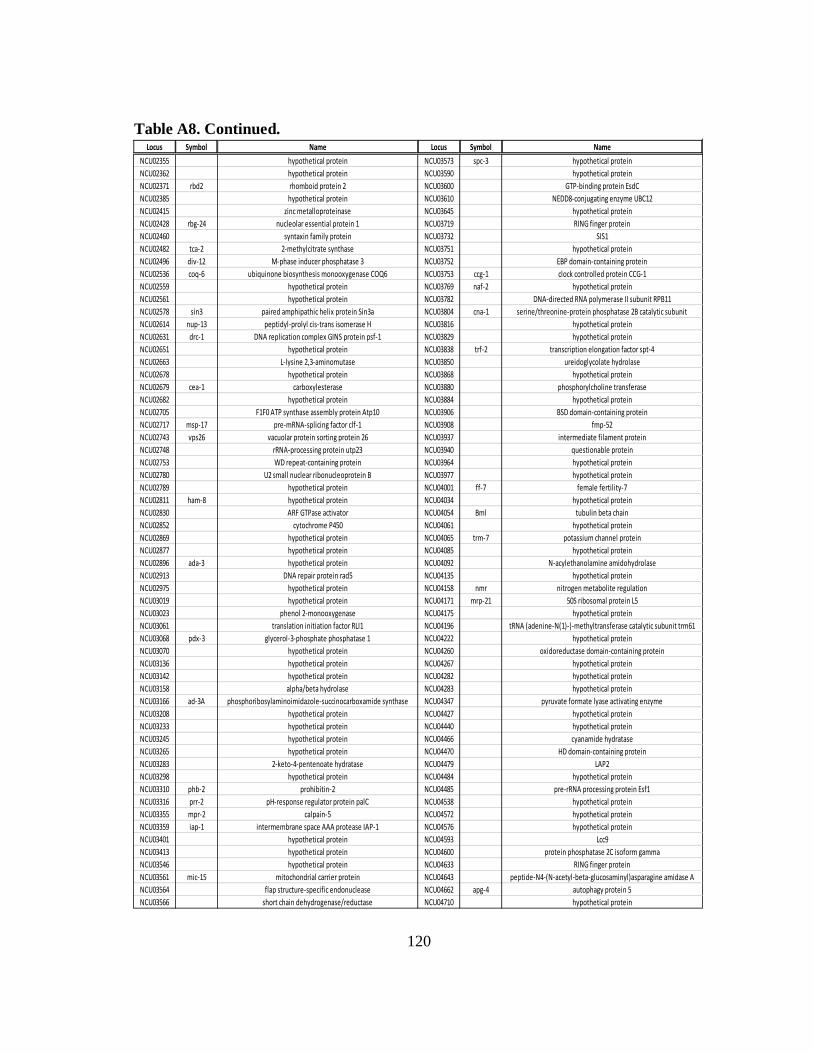
120
Table A8. Continued.
Locus Symbol Name Locus Symbol Name
NCU02355 hypothetical protein NCU03573 spc-3 hypothetical protein
NCU02362 hypothetical protein NCU03590 hypothetical protein
NCU02371 rbd2 rhomboid protein 2 NCU03600 GTP-binding protein EsdC
NCU02385 hypothetical protein NCU03610 NEDD8-conjugating enzyme UBC12
NCU02415 zinc metalloproteinase NCU03645 hypothetical protein
NCU02428 rbg-24 nucleolar essential protein 1 NCU03719 RING finger protein
NCU02460 syntaxin family protein NCU03732 SIS1
NCU02482 tca-2 2-methylcitrate synthase NCU03751 hypothetical protein
NCU02496 div-12 M-phase inducer phosphatase 3 NCU03752 EBP domain-containing protein
NCU02536 coq-6 ubiquinone biosynthesis monooxygenase COQ6 NCU03753 ccg-1 clock controlled protein CCG-1
NCU02559 hypothetical protein NCU03769 naf-2 hypothetical protein
NCU02561 hypothetical protein NCU03782 DNA-directed RNA polymerase II subunit RPB11
NCU02578 sin3 paired amphipathic helix protein Sin3a NCU03804 cna-1 serine/threonine-protein phosphatase 2B catalytic subunit
NCU02614 nup-13 peptidyl-prolyl cis-trans isomerase H NCU03816 hypothetical protein
NCU02631 drc-1 DNA replication complex GINS protein psf-1 NCU03829 hypothetical protein
NCU02651 hypothetical protein NCU03838 trf-2 transcription elongation factor spt-4
NCU02663 L-lysine 2,3-aminomutase NCU03850 ureidoglycolate hydrolase
NCU02678 hypothetical protein NCU03868 hypothetical protein
NCU02679 cea-1 carboxylesterase NCU03880 phosphorylcholine transferase
NCU02682 hypothetical protein NCU03884 hypothetical protein
NCU02705 F1F0 ATP synthase assembly protein Atp10 NCU03906 BSD domain-containing protein
NCU02717 msp-17 pre-mRNA-splicing factor clf-1 NCU03908 fmp-52
NCU02743 vps26 vacuolar protein sorting protein 26 NCU03937 intermediate filament protein
NCU02748 rRNA-processing protein utp23 NCU03940 questionable protein
NCU02753 WD repeat-containing protein NCU03964 hypothetical protein
NCU02780 U2 small nuclear ribonucleoprotein B NCU03977 hypothetical protein
NCU02789 hypothetical protein NCU04001 ff-7 female fertility-7
NCU02811 ham-8 hypothetical protein NCU04034 hypothetical protein
NCU02830 ARF GTPase activator NCU04054 Bml tubulin beta chain
NCU02852 cytochrome P450 NCU04061 hypothetical protein
NCU02869 hypothetical protein NCU04065 trm-7 potassium channel protein
NCU02877 hypothetical protein NCU04085 hypothetical protein
NCU02896 ada-3 hypothetical protein NCU04092 N-acylethanolamine amidohydrolase
NCU02913 DNA repair protein rad5 NCU04135 hypothetical protein
NCU02975 hypothetical protein NCU04158 nmr nitrogen metabolite regulation
NCU03019 hypothetical protein NCU04171 mrp-21 50S ribosomal protein L5
NCU03023 phenol 2-monooxygenase NCU04175 hypothetical protein
NCU03061 translation initiation factor RLI1 NCU04196 tRNA (adenine-N(1)-)-methyltransferase catalytic subunit trm61
NCU03068 pdx-3 glycerol-3-phosphate phosphatase 1 NCU04222 hypothetical protein
NCU03070 hypothetical protein NCU04260 oxidoreductase domain-containing protein
NCU03136 hypothetical protein NCU04267 hypothetical protein
NCU03142 hypothetical protein NCU04282 hypothetical protein
NCU03158 alpha/beta hydrolase NCU04283 hypothetical protein
NCU03166 ad-3A phosphoribosylaminoimidazole-succinocarboxamide synthase NCU04347 pyruvate formate lyase activating enzyme
NCU03208 hypothetical protein NCU04427 hypothetical protein
NCU03233 hypothetical protein NCU04440 hypothetical protein
NCU03245 hypothetical protein NCU04466 cyanamide hydratase
NCU03265 hypothetical protein NCU04470 HD domain-containing protein
NCU03283 2-keto-4-pentenoate hydratase NCU04479 LAP2
NCU03298 hypothetical protein NCU04484 hypothetical protein
NCU03310 phb-2 prohibitin-2 NCU04485 pre-rRNA processing protein Esf1
NCU03316 prr-2 pH-response regulator protein palC NCU04538 hypothetical protein
NCU03355 mpr-2 calpain-5 NCU04572 hypothetical protein
NCU03359 iap-1 intermembrane space AAA protease IAP-1 NCU04576 hypothetical protein
NCU03401 hypothetical protein NCU04593 Lcc9
NCU03413 hypothetical protein NCU04600 protein phosphatase 2C isoform gamma
NCU03546 hypothetical protein NCU04633 RING finger protein
NCU03561 mic-15 mitochondrial carrier protein NCU04643 peptide-N4-(N-acetyl-beta-glucosaminyl)asparagine amidase A
NCU03564 flap structure-specific endonuclease NCU04662 apg-4 autophagy protein 5
NCU03566 short chain dehydrogenase/reductase NCU04710 hypothetical protein
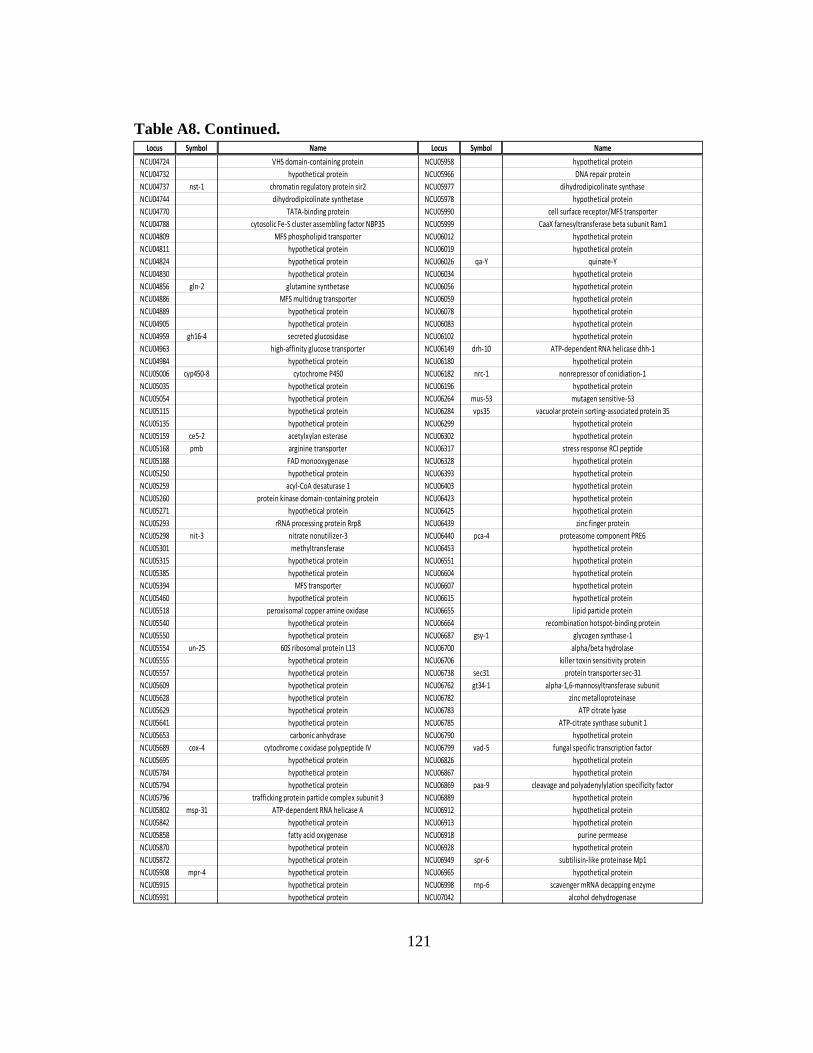
121
Table A8. Continued.
Locus Symbol Name Locus Symbol Name
NCU04724 VHS domain-containing protein NCU05958 hypothetical protein
NCU04732 hypothetical protein NCU05966 DNA repair protein
NCU04737 nst-1 chromatin regulatory protein sir2 NCU05977 dihydrodipicolinate synthase
NCU04744 dihydrodipicolinate synthetase NCU05978 hypothetical protein
NCU04770 TATA-binding protein NCU05990 cell surface receptor/MFS transporter
NCU04788 cytosolic Fe-S cluster assembling factor NBP35 NCU05999 CaaX farnesyltransferase beta subunit Ram1
NCU04809 MFS phospholipid transporter NCU06012 hypothetical protein
NCU04811 hypothetical protein NCU06019 hypothetical protein
NCU04824 hypothetical protein NCU06026 qa-Y quinate-Y
NCU04830 hypothetical protein NCU06034 hypothetical protein
NCU04856 gln-2 glutamine synthetase NCU06056 hypothetical protein
NCU04886 MFS multidrug transporter NCU06059 hypothetical protein
NCU04889 hypothetical protein NCU06078 hypothetical protein
NCU04905 hypothetical protein NCU06083 hypothetical protein
NCU04959 gh16-4 secreted glucosidase NCU06102 hypothetical protein
NCU04963 high-affinity glucose transporter NCU06149 drh-10 ATP-dependent RNA helicase dhh-1
NCU04984 hypothetical protein NCU06180 hypothetical protein
NCU05006 cyp450-8 cytochrome P450 NCU06182 nrc-1 nonrepressor of conidiation-1
NCU05035 hypothetical protein NCU06196 hypothetical protein
NCU05054 hypothetical protein NCU06264 mus-53 mutagen sensitive-53
NCU05115 hypothetical protein NCU06284 vps35 vacuolar protein sorting-associated protein 35
NCU05135 hypothetical protein NCU06299 hypothetical protein
NCU05159 ce5-2 acetylxylan esterase NCU06302 hypothetical protein
NCU05168 pmb arginine transporter NCU06317 stress response RCI peptide
NCU05188 FAD monooxygenase NCU06328 hypothetical protein
NCU05250 hypothetical protein NCU06393 hypothetical protein
NCU05259 acyl-CoA desaturase 1 NCU06403 hypothetical protein
NCU05260 protein kinase domain-containing protein NCU06423 hypothetical protein
NCU05271 hypothetical protein NCU06425 hypothetical protein
NCU05293 rRNA processing protein Rrp8 NCU06439 zinc finger protein
NCU05298 nit-3 nitrate nonutilizer-3 NCU06440 pca-4 proteasome component PRE6
NCU05301 methyltransferase NCU06453 hypothetical protein
NCU05315 hypothetical protein NCU06551 hypothetical protein
NCU05385 hypothetical protein NCU06604 hypothetical protein
NCU05394 MFS transporter NCU06607 hypothetical protein
NCU05460 hypothetical protein NCU06615 hypothetical protein
NCU05518 peroxisomal copper amine oxidase NCU06655 lipid particle protein
NCU05540 hypothetical protein NCU06664 recombination hotspot-binding protein
NCU05550 hypothetical protein NCU06687 gsy-1 glycogen synthase-1
NCU05554 un-25 60S ribosomal protein L13 NCU06700 alpha/beta hydrolase
NCU05555 hypothetical protein NCU06706 killer toxin sensitivity protein
NCU05557 hypothetical protein NCU06738 sec31 protein transporter sec-31
NCU05609 hypothetical protein NCU06762 gt34-1 alpha-1,6-mannosyltransferase subunit
NCU05628 hypothetical protein NCU06782 zinc metalloproteinase
NCU05629 hypothetical protein NCU06783 ATP citrate lyase
NCU05641 hypothetical protein NCU06785 ATP-citrate synthase subunit 1
NCU05653 carbonic anhydrase NCU06790 hypothetical protein
NCU05689 cox-4 cytochrome c oxidase polypeptide IV NCU06799 vad-5 fungal specific transcription factor
NCU05695 hypothetical protein NCU06826 hypothetical protein
NCU05784 hypothetical protein NCU06867 hypothetical protein
NCU05794 hypothetical protein NCU06869 paa-9 cleavage and polyadenylylation specificity factor
NCU05796 trafficking protein particle complex subunit 3 NCU06889 hypothetical protein
NCU05802 msp-31 ATP-dependent RNA helicase A NCU06912 hypothetical protein
NCU05842 hypothetical protein NCU06913 hypothetical protein
NCU05858 fatty acid oxygenase NCU06918 purine permease
NCU05870 hypothetical protein NCU06928 hypothetical protein
NCU05872 hypothetical protein NCU06949 spr-6 subtilisin-like proteinase Mp1
NCU05908 mpr-4 hypothetical protein NCU06965 hypothetical protein
NCU05915 hypothetical protein NCU06998 rnp-6 scavenger mRNA decapping enzyme
NCU05931 hypothetical protein NCU07042 alcohol dehydrogenase
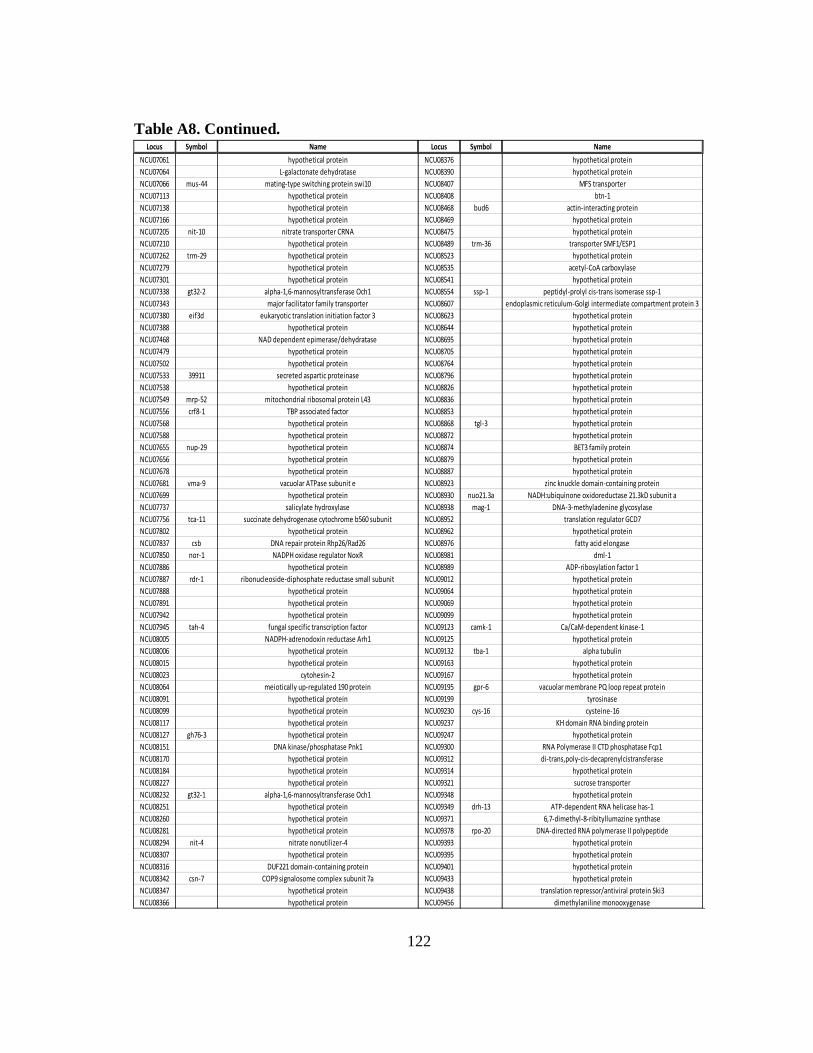
122
Table A8. Continued.
Locus Symbol Name Locus Symbol Name Locus
NCU07061 hypothetical protein NCU08376 hypothetical protein NCU09458
NCU07064 L-galactonate dehydratase NCU08390 hypothetical protein NCU09465
NCU07066 mus-44 mating-type switching protein swi10 NCU08407 MFS transporter NCU09472
NCU07113 hypothetical protein NCU08408 btn-1 NCU09516
NCU07138 hypothetical protein NCU08468 bud6 actin-interacting protein NCU09606
NCU07166 hypothetical protein NCU08469 hypothetical protein NCU09629
NCU07205 nit-10 nitrate transporter CRNA NCU08475 hypothetical protein NCU09657
NCU07210 hypothetical protein NCU08489 trm-36 transporter SMF1/ESP1 NCU09702
NCU07262 trm-29 hypothetical protein NCU08523 hypothetical protein NCU09707
NCU07279 hypothetical protein NCU08535 acetyl-CoA carboxylase NCU09724
NCU07301 hypothetical protein NCU08541 hypothetical protein NCU09767
NCU07338 gt32-2 alpha-1,6-mannosyltransferase Och1 NCU08554 ssp-1 peptidyl-prolyl cis-trans isomerase ssp-1 NCU09786
NCU07343 major facilitator family transporter NCU08607 endoplasmic reticulum-Golgi intermediate compartment protein 3 NCU09792
NCU07380 eif3d eukaryotic translation initiation factor 3 NCU08623 hypothetical protein NCU09800
NCU07388 hypothetical protein NCU08644 hypothetical protein NCU09831
NCU07468 NAD dependent epimerase/dehydratase NCU08695 hypothetical protein NCU09842
NCU07479 hypothetical protein NCU08705 hypothetical protein NCU09897
NCU07502 hypothetical protein NCU08764 hypothetical protein NCU09900
NCU07533 39911 secreted aspartic proteinase NCU08796 hypothetical protein NCU09910
NCU07538 hypothetical protein NCU08826 hypothetical protein NCU09977
NCU07549 mrp-52 mitochondrial ribosomal protein L43 NCU08836 hypothetical protein NCU09990
NCU07556 crf8-1 TBP associated factor NCU08853 hypothetical protein NCU10021
NCU07568 hypothetical protein NCU08868 tgl-3 hypothetical protein NCU10027
NCU07588 hypothetical protein NCU08872 hypothetical protein NCU10101
NCU07655 nup-29 hypothetical protein NCU08874 BET3 family protein NCU10304
NCU07656 hypothetical protein NCU08879 hypothetical protein NCU10400
NCU07678 hypothetical protein NCU08887 hypothetical protein NCU10610
NCU07681 vma-9 vacuolar ATPase subunit e NCU08923 zinc knuckle domain-containing protein NCU10651
NCU07699 hypothetical protein NCU08930 nuo21.3a NADH:ubiquinone oxidoreductase 21.3kD subunit a NCU10658
NCU07737 salicylate hydroxylase NCU08938 mag-1 DNA-3-methyladenine glycosylase NCU10760
NCU07756 tca-11 succinate dehydrogenase cytochrome b560 subunit NCU08952 translation regulator GCD7 NCU10810
NCU07802 hypothetical protein NCU08962 hypothetical protein NCU10905
NCU07837 csb DNA repair protein Rhp26/Rad26 NCU08976 fatty acid elongase NCU10906
NCU07850 nor-1 NADPH oxidase regulator NoxR NCU08981 dml-1 NCU10987
NCU07886 hypothetical protein NCU08989 ADP-ribosylation factor 1 NCU11095
NCU07887 rdr-1 ribonucleoside-diphosphate reductase small subunit NCU09012 hypothetical protein NCU11252
NCU07888 hypothetical protein NCU09064 hypothetical protein NCU11307
NCU07891 hypothetical protein NCU09069 hypothetical protein NCU11314
NCU07942 hypothetical protein NCU09099 hypothetical protein NCU11409
NCU07945 tah-4 fungal specific transcription factor NCU09123 camk-1 Ca/CaM-dependent kinase-1 NCU12033
NCU08005 NADPH-adrenodoxin reductase Arh1 NCU09125 hypothetical protein NCU12068
NCU08006 hypothetical protein NCU09132 tba-1 alpha tubulin NCU12099
NCU08015 hypothetical protein NCU09163 hypothetical protein NCU12104
NCU08023 cytohesin-2 NCU09167 hypothetical protein NCU12151
NCU08064 meiotically up-regulated 190 protein NCU09195 gpr-6 vacuolar membrane PQ loop repeat protein NCU16390
NCU08091 hypothetical protein NCU09199 tyrosinase NCU16411
NCU08099 hypothetical protein NCU09230 cys-16 cysteine-16 NCU16497
NCU08117 hypothetical protein NCU09237 KH domain RNA binding protein NCU16572
NCU08127 gh76-3 hypothetical protein NCU09247 hypothetical protein NCU16597
NCU08151 DNA kinase/phosphatase Pnk1 NCU09300 RNA Polymerase II CTD phosphatase Fcp1 NCU16648
NCU08170 hypothetical protein NCU09312 di-trans,poly-cis-decaprenylcistransferase NCU16704
NCU08184 hypothetical protein NCU09314 hypothetical protein NCU16716
NCU08227 hypothetical protein NCU09321 sucrose transporter NCU16720
NCU08232 gt32-1 alpha-1,6-mannosyltransferase Och1 NCU09348 hypothetical protein NCU16722
NCU08251 hypothetical protein NCU09349 drh-13 ATP-dependent RNA helicase has-1 NCU16779
NCU08260 hypothetical protein NCU09371 6,7-dimethyl-8-ribityllumazine synthase NCU16807
NCU08281 hypothetical protein NCU09378 rpo-20 DNA-directed RNA polymerase II polypeptide NCU16941
NCU08294 nit-4 nitrate nonutilizer-4 NCU09393 hypothetical protein NCU16967
NCU08307 hypothetical protein NCU09395 hypothetical protein NCU17116
NCU08316 DUF221 domain-containing protein NCU09401 hypothetical protein NCU17123
NCU08342 csn-7 COP9 signalosome complex subunit 7a NCU09433 hypothetical protein NCU17138
NCU08347 hypothetical protein NCU09438 translation repressor/antiviral protein Ski3 NCU17249
NCU08366 hypothetical protein NCU09456 dimethylaniline monooxygenase NCU17252
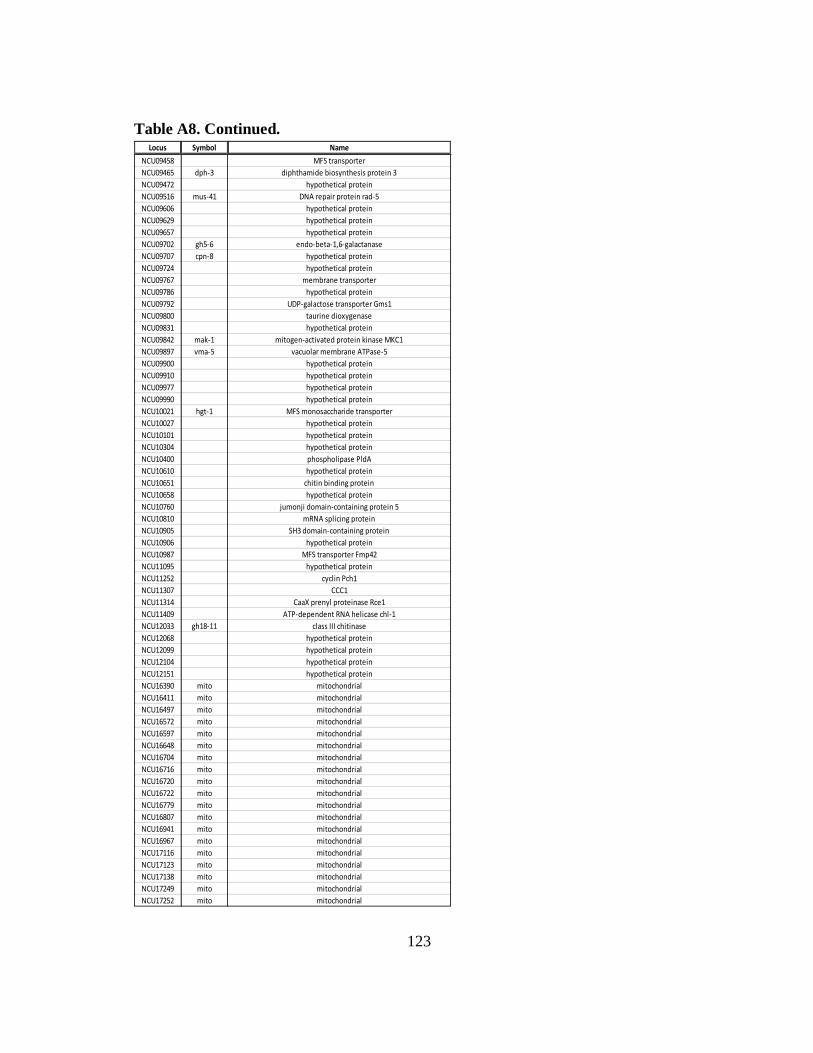
123
Table A8. Continued.
Locus Symbol Name
NCU09458 MFS transporter
NCU09465 dph-3 diphthamide biosynthesis protein 3
NCU09472 hypothetical protein
NCU09516 mus-41 DNA repair protein rad-5
NCU09606 hypothetical protein
NCU09629 hypothetical protein
NCU09657 hypothetical protein
NCU09702 gh5-6 endo-beta-1,6-galactanase
NCU09707 cpn-8 hypothetical protein
NCU09724 hypothetical protein
NCU09767 membrane transporter
NCU09786 hypothetical protein
NCU09792 UDP-galactose transporter Gms1
NCU09800 taurine dioxygenase
NCU09831 hypothetical protein
NCU09842 mak-1 mitogen-activated protein kinase MKC1
NCU09897 vma-5 vacuolar membrane ATPase-5
NCU09900 hypothetical protein
NCU09910 hypothetical protein
NCU09977 hypothetical protein
NCU09990 hypothetical protein
NCU10021 hgt-1 MFS monosaccharide transporter
NCU10027 hypothetical protein
NCU10101 hypothetical protein
NCU10304 hypothetical protein
NCU10400 phospholipase PldA
NCU10610 hypothetical protein
NCU10651 chitin binding protein
NCU10658 hypothetical protein
NCU10760 jumonji domain-containing protein 5
NCU10810 mRNA splicing protein
NCU10905 SH3 domain-containing protein
NCU10906 hypothetical protein
NCU10987 MFS transporter Fmp42
NCU11095 hypothetical protein
NCU11252 cyclin Pch1
NCU11307 CCC1
NCU11314 CaaX prenyl proteinase Rce1
NCU11409 ATP-dependent RNA helicase chl-1
NCU12033 gh18-11 class III chitinase
NCU12068 hypothetical protein
NCU12099 hypothetical protein
NCU12104 hypothetical protein
NCU12151 hypothetical protein
NCU16390 mito mitochondrial
NCU16411 mito mitochondrial
NCU16497 mito mitochondrial
NCU16572 mito mitochondrial
NCU16597 mito mitochondrial
NCU16648 mito mitochondrial
NCU16704 mito mitochondrial
NCU16716 mito mitochondrial
NCU16720 mito mitochondrial
NCU16722 mito mitochondrial
NCU16779 mito mitochondrial
NCU16807 mito mitochondrial
NCU16941 mito mitochondrial
NCU16967 mito mitochondrial
NCU17116 mito mitochondrial
NCU17123 mito mitochondrial
NCU17138 mito mitochondrial
NCU17249 mito mitochondrial
NCU17252 mito mitochondrial
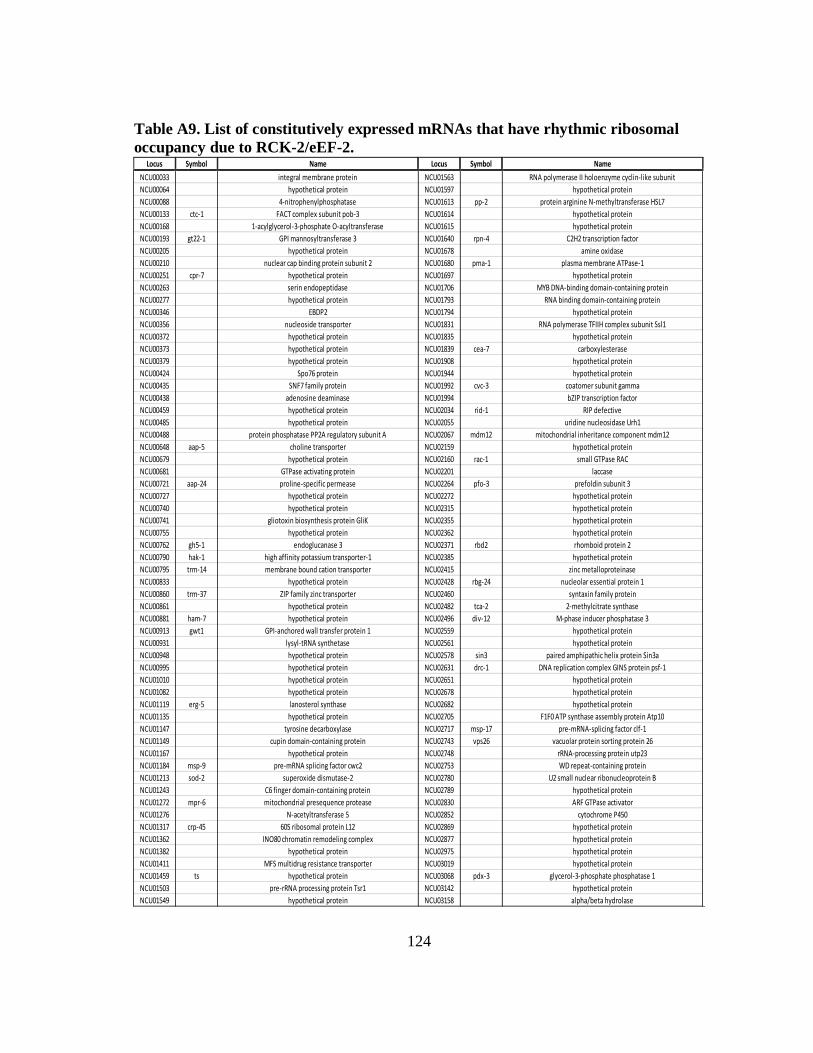
124
Table A9. List of constitutively expressed mRNAs that have rhythmic ribosomal
occupancy due to RCK-2/eEF-2.
Locus Symbol Name Locus Symbol Name Locus
NCU00033 integral membrane protein NCU01563 RNA polymerase II holoenzyme cyclin-like subunit NCU03166
NCU00064 hypothetical protein NCU01597 hypothetical protein NCU03208
NCU00088 4-nitrophenylphosphatase NCU01613 pp-2 protein arginine N-methyltransferase HSL7 NCU03233
NCU00133 ctc-1 FACT complex subunit pob-3 NCU01614 hypothetical protein NCU03245
NCU00168 1-acylglycerol-3-phosphate O-acyltransferase NCU01615 hypothetical protein NCU03265
NCU00193 gt22-1 GPI mannosyltransferase 3 NCU01640 rpn-4 C2H2 transcription factor NCU03283
NCU00205 hypothetical protein NCU01678 amine oxidase NCU03298
NCU00210 nuclear cap binding protein subunit 2 NCU01680 pma-1 plasma membrane ATPase-1 NCU03316
NCU00251 cpr-7 hypothetical protein NCU01697 hypothetical protein NCU03355
NCU00263 serin endopeptidase NCU01706 MYB DNA-binding domain-containing protein NCU03359
NCU00277 hypothetical protein NCU01793 RNA binding domain-containing protein NCU03401
NCU00346 EBDP2 NCU01794 hypothetical protein NCU03413
NCU00356 nucleoside transporter NCU01831 RNA polymerase TFIIH complex subunit Ssl1 NCU03546
NCU00372 hypothetical protein NCU01835 hypothetical protein NCU03561
NCU00373 hypothetical protein NCU01839 cea-7 carboxylesterase NCU03566
NCU00379 hypothetical protein NCU01908 hypothetical protein NCU03573
NCU00424 Spo76 protein NCU01944 hypothetical protein NCU03590
NCU00435 SNF7 family protein NCU01992 cvc-3 coatomer subunit gamma NCU03600
NCU00438 adenosine deaminase NCU01994 bZIP transcription factor NCU03610
NCU00459 hypothetical protein NCU02034 rid-1 RIP defective NCU03645
NCU00485 hypothetical protein NCU02055 uridine nucleosidase Urh1 NCU03732
NCU00488 protein phosphatase PP2A regulatory subunit A NCU02067 mdm12 mitochondrial inheritance component mdm12 NCU03752
NCU00648 aap-5 choline transporter NCU02159 hypothetical protein NCU03753
NCU00679 hypothetical protein NCU02160 rac-1 small GTPase RAC NCU03769
NCU00681 GTPase activating protein NCU02201 laccase NCU03782
NCU00721 aap-24 proline-specific permease NCU02264 pfo-3 prefoldin subunit 3 NCU03804
NCU00727 hypothetical protein NCU02272 hypothetical protein NCU03816
NCU00740 hypothetical protein NCU02315 hypothetical protein NCU03838
NCU00741 gliotoxin biosynthesis protein GliK NCU02355 hypothetical protein NCU03850
NCU00755 hypothetical protein NCU02362 hypothetical protein NCU03880
NCU00762 gh5-1 endoglucanase 3 NCU02371 rbd2 rhomboid protein 2 NCU03884
NCU00790 hak-1 high affinity potassium transporter-1 NCU02385 hypothetical protein NCU03906
NCU00795 trm-14 membrane bound cation transporter NCU02415 zinc metalloproteinase NCU03908
NCU00833 hypothetical protein NCU02428 rbg-24 nucleolar essential protein 1 NCU03937
NCU00860 trm-37 ZIP family zinc transporter NCU02460 syntaxin family protein NCU03940
NCU00861 hypothetical protein NCU02482 tca-2 2-methylcitrate synthase NCU03977
NCU00881 ham-7 hypothetical protein NCU02496 div-12 M-phase inducer phosphatase 3 NCU04001
NCU00913 gwt1 GPI-anchored wall transfer protein 1 NCU02559 hypothetical protein NCU04061
NCU00931 lysyl-tRNA synthetase NCU02561 hypothetical protein NCU04092
NCU00948 hypothetical protein NCU02578 sin3 paired amphipathic helix protein Sin3a NCU04158
NCU00995 hypothetical protein NCU02631 drc-1 DNA replication complex GINS protein psf-1 NCU04171
NCU01010 hypothetical protein NCU02651 hypothetical protein NCU04175
NCU01082 hypothetical protein NCU02678 hypothetical protein NCU04196
NCU01119 erg-5 lanosterol synthase NCU02682 hypothetical protein NCU04222
NCU01135 hypothetical protein NCU02705 F1F0 ATP synthase assembly protein Atp10 NCU04260
NCU01147 tyrosine decarboxylase NCU02717 msp-17 pre-mRNA-splicing factor clf-1 NCU04267
NCU01149 cupin domain-containing protein NCU02743 vps26 vacuolar protein sorting protein 26 NCU04283
NCU01167 hypothetical protein NCU02748 rRNA-processing protein utp23 NCU04347
NCU01184 msp-9 pre-mRNA splicing factor cwc2 NCU02753 WD repeat-containing protein NCU04466
NCU01213 sod-2 superoxide dismutase-2 NCU02780 U2 small nuclear ribonucleoprotein B NCU04470
NCU01243 C6 finger domain-containing protein NCU02789 hypothetical protein NCU04479
NCU01272 mpr-6 mitochondrial presequence protease NCU02830 ARF GTPase activator NCU04484
NCU01276 N-acetyltransferase 5 NCU02852 cytochrome P450 NCU04485
NCU01317 crp-45 60S ribosomal protein L12 NCU02869 hypothetical protein NCU04572
NCU01362 INO80 chromatin remodeling complex NCU02877 hypothetical protein NCU04576
NCU01382 hypothetical protein NCU02975 hypothetical protein NCU04600
NCU01411 MFS multidrug resistance transporter NCU03019 hypothetical protein NCU04633
NCU01459 ts hypothetical protein NCU03068 pdx-3 glycerol-3-phosphate phosphatase 1 NCU04643
NCU01503 pre-rRNA processing protein Tsr1 NCU03142 hypothetical protein NCU04662
NCU01549 hypothetical protein NCU03158 alpha/beta hydrolase NCU04710
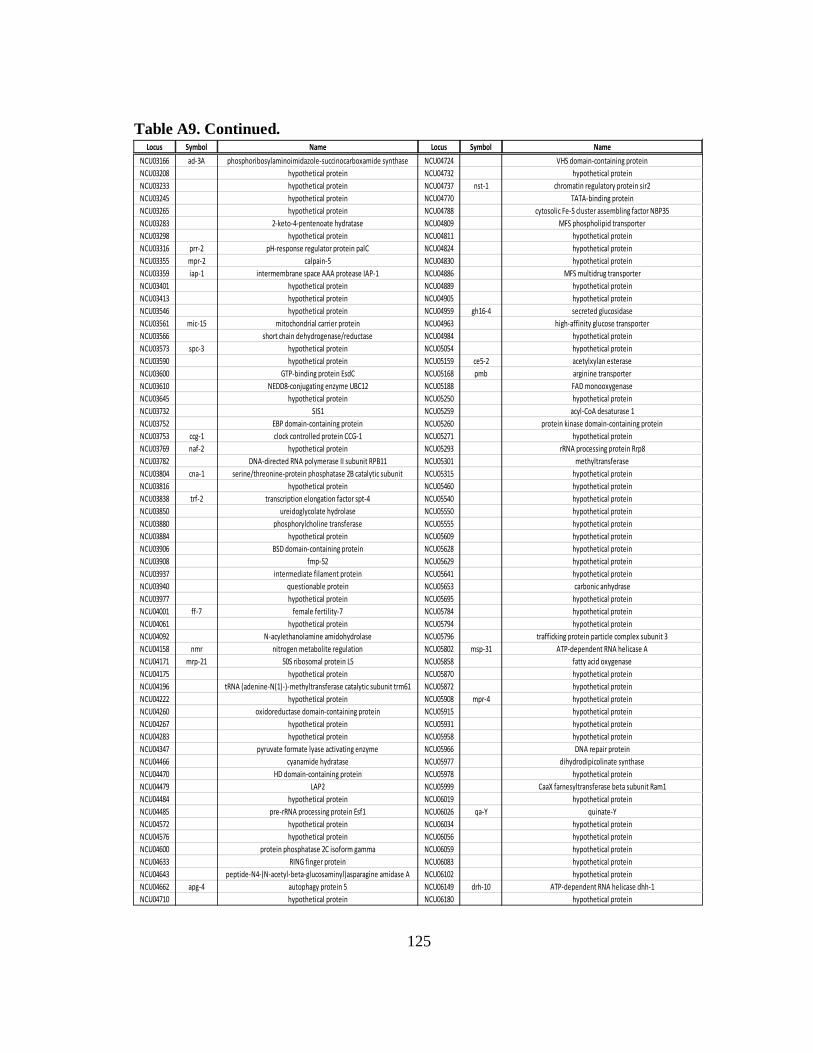
125
Table A9. Continued.
Locus Symbol Name Locus Symbol Name
NCU03166 ad-3A phosphoribosylaminoimidazole-succinocarboxamide synthase NCU04724 VHS domain-containing protein
NCU03208 hypothetical protein NCU04732 hypothetical protein
NCU03233 hypothetical protein NCU04737 nst-1 chromatin regulatory protein sir2
NCU03245 hypothetical protein NCU04770 TATA-binding protein
NCU03265 hypothetical protein NCU04788 cytosolic Fe-S cluster assembling factor NBP35
NCU03283 2-keto-4-pentenoate hydratase NCU04809 MFS phospholipid transporter
NCU03298 hypothetical protein NCU04811 hypothetical protein
NCU03316 prr-2 pH-response regulator protein palC NCU04824 hypothetical protein
NCU03355 mpr-2 calpain-5 NCU04830 hypothetical protein
NCU03359 iap-1 intermembrane space AAA protease IAP-1 NCU04886 MFS multidrug transporter
NCU03401 hypothetical protein NCU04889 hypothetical protein
NCU03413 hypothetical protein NCU04905 hypothetical protein
NCU03546 hypothetical protein NCU04959 gh16-4 secreted glucosidase
NCU03561 mic-15 mitochondrial carrier protein NCU04963 high-affinity glucose transporter
NCU03566 short chain dehydrogenase/reductase NCU04984 hypothetical protein
NCU03573 spc-3 hypothetical protein NCU05054 hypothetical protein
NCU03590 hypothetical protein NCU05159 ce5-2 acetylxylan esterase
NCU03600 GTP-binding protein EsdC NCU05168 pmb arginine transporter
NCU03610 NEDD8-conjugating enzyme UBC12 NCU05188 FAD monooxygenase
NCU03645 hypothetical protein NCU05250 hypothetical protein
NCU03732 SIS1 NCU05259 acyl-CoA desaturase 1
NCU03752 EBP domain-containing protein NCU05260 protein kinase domain-containing protein
NCU03753 ccg-1 clock controlled protein CCG-1 NCU05271 hypothetical protein
NCU03769 naf-2 hypothetical protein NCU05293 rRNA processing protein Rrp8
NCU03782 DNA-directed RNA polymerase II subunit RPB11 NCU05301 methyltransferase
NCU03804 cna-1 serine/threonine-protein phosphatase 2B catalytic subunit NCU05315 hypothetical protein
NCU03816 hypothetical protein NCU05460 hypothetical protein
NCU03838 trf-2 transcription elongation factor spt-4 NCU05540 hypothetical protein
NCU03850 ureidoglycolate hydrolase NCU05550 hypothetical protein
NCU03880 phosphorylcholine transferase NCU05555 hypothetical protein
NCU03884 hypothetical protein NCU05609 hypothetical protein
NCU03906 BSD domain-containing protein NCU05628 hypothetical protein
NCU03908 fmp-52 NCU05629 hypothetical protein
NCU03937 intermediate filament protein NCU05641 hypothetical protein
NCU03940 questionable protein NCU05653 carbonic anhydrase
NCU03977 hypothetical protein NCU05695 hypothetical protein
NCU04001 ff-7 female fertility-7 NCU05784 hypothetical protein
NCU04061 hypothetical protein NCU05794 hypothetical protein
NCU04092 N-acylethanolamine amidohydrolase NCU05796 trafficking protein particle complex subunit 3
NCU04158 nmr nitrogen metabolite regulation NCU05802 msp-31 ATP-dependent RNA helicase A
NCU04171 mrp-21 50S ribosomal protein L5 NCU05858 fatty acid oxygenase
NCU04175 hypothetical protein NCU05870 hypothetical protein
NCU04196 tRNA (adenine-N(1)-)-methyltransferase catalytic subunit trm61 NCU05872 hypothetical protein
NCU04222 hypothetical protein NCU05908 mpr-4 hypothetical protein
NCU04260 oxidoreductase domain-containing protein NCU05915 hypothetical protein
NCU04267 hypothetical protein NCU05931 hypothetical protein
NCU04283 hypothetical protein NCU05958 hypothetical protein
NCU04347 pyruvate formate lyase activating enzyme NCU05966 DNA repair protein
NCU04466 cyanamide hydratase NCU05977 dihydrodipicolinate synthase
NCU04470 HD domain-containing protein NCU05978 hypothetical protein
NCU04479 LAP2 NCU05999 CaaX farnesyltransferase beta subunit Ram1
NCU04484 hypothetical protein NCU06019 hypothetical protein
NCU04485 pre-rRNA processing protein Esf1 NCU06026 qa-Y quinate-Y
NCU04572 hypothetical protein NCU06034 hypothetical protein
NCU04576 hypothetical protein NCU06056 hypothetical protein
NCU04600 protein phosphatase 2C isoform gamma NCU06059 hypothetical protein
NCU04633 RING finger protein NCU06083 hypothetical protein
NCU04643 peptide-N4-(N-acetyl-beta-glucosaminyl)asparagine amidase A NCU06102 hypothetical protein
NCU04662 apg-4 autophagy protein 5 NCU06149 drh-10 ATP-dependent RNA helicase dhh-1
NCU04710 hypothetical protein NCU06180 hypothetical protein
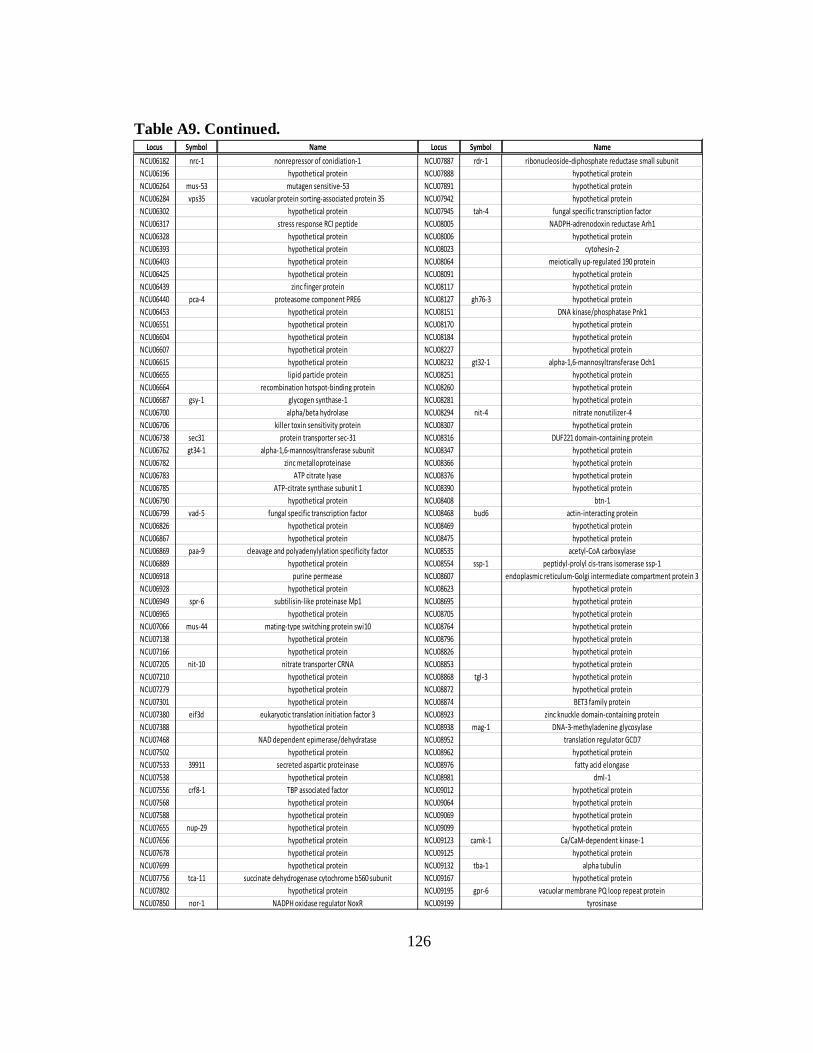
126
Table A9. Continued.
Locus Symbol Name Locus Symbol Name
NCU06182 nrc-1 nonrepressor of conidiation-1 NCU07887 rdr-1 ribonucleoside-diphosphate reductase small subunit
NCU06196 hypothetical protein NCU07888 hypothetical protein
NCU06264 mus-53 mutagen sensitive-53 NCU07891 hypothetical protein
NCU06284 vps35 vacuolar protein sorting-associated protein 35 NCU07942 hypothetical protein
NCU06302 hypothetical protein NCU07945 tah-4 fungal specific transcription factor
NCU06317 stress response RCI peptide NCU08005 NADPH-adrenodoxin reductase Arh1
NCU06328 hypothetical protein NCU08006 hypothetical protein
NCU06393 hypothetical protein NCU08023 cytohesin-2
NCU06403 hypothetical protein NCU08064 meiotically up-regulated 190 protein
NCU06425 hypothetical protein NCU08091 hypothetical protein
NCU06439 zinc finger protein NCU08117 hypothetical protein
NCU06440 pca-4 proteasome component PRE6 NCU08127 gh76-3 hypothetical protein
NCU06453 hypothetical protein NCU08151 DNA kinase/phosphatase Pnk1
NCU06551 hypothetical protein NCU08170 hypothetical protein
NCU06604 hypothetical protein NCU08184 hypothetical protein
NCU06607 hypothetical protein NCU08227 hypothetical protein
NCU06615 hypothetical protein NCU08232 gt32-1 alpha-1,6-mannosyltransferase Och1
NCU06655 lipid particle protein NCU08251 hypothetical protein
NCU06664 recombination hotspot-binding protein NCU08260 hypothetical protein
NCU06687 gsy-1 glycogen synthase-1 NCU08281 hypothetical protein
NCU06700 alpha/beta hydrolase NCU08294 nit-4 nitrate nonutilizer-4
NCU06706 killer toxin sensitivity protein NCU08307 hypothetical protein
NCU06738 sec31 protein transporter sec-31 NCU08316 DUF221 domain-containing protein
NCU06762 gt34-1 alpha-1,6-mannosyltransferase subunit NCU08347 hypothetical protein
NCU06782 zinc metalloproteinase NCU08366 hypothetical protein
NCU06783 ATP citrate lyase NCU08376 hypothetical protein
NCU06785 ATP-citrate synthase subunit 1 NCU08390 hypothetical protein
NCU06790 hypothetical protein NCU08408 btn-1
NCU06799 vad-5 fungal specific transcription factor NCU08468 bud6 actin-interacting protein
NCU06826 hypothetical protein NCU08469 hypothetical protein
NCU06867 hypothetical protein NCU08475 hypothetical protein
NCU06869 paa-9 cleavage and polyadenylylation specificity factor NCU08535 acetyl-CoA carboxylase
NCU06889 hypothetical protein NCU08554 ssp-1 peptidyl-prolyl cis-trans isomerase ssp-1
NCU06918 purine permease NCU08607 endoplasmic reticulum-Golgi intermediate compartment protein 3
NCU06928 hypothetical protein NCU08623 hypothetical protein
NCU06949 spr-6 subtilisin-like proteinase Mp1 NCU08695 hypothetical protein
NCU06965 hypothetical protein NCU08705 hypothetical protein
NCU07066 mus-44 mating-type switching protein swi10 NCU08764 hypothetical protein
NCU07138 hypothetical protein NCU08796 hypothetical protein
NCU07166 hypothetical protein NCU08826 hypothetical protein
NCU07205 nit-10 nitrate transporter CRNA NCU08853 hypothetical protein
NCU07210 hypothetical protein NCU08868 tgl-3 hypothetical protein
NCU07279 hypothetical protein NCU08872 hypothetical protein
NCU07301 hypothetical protein NCU08874 BET3 family protein
NCU07380 eif3d eukaryotic translation initiation factor 3 NCU08923 zinc knuckle domain-containing protein
NCU07388 hypothetical protein NCU08938 mag-1 DNA-3-methyladenine glycosylase
NCU07468 NAD dependent epimerase/dehydratase NCU08952 translation regulator GCD7
NCU07502 hypothetical protein NCU08962 hypothetical protein
NCU07533 39911 secreted aspartic proteinase NCU08976 fatty acid elongase
NCU07538 hypothetical protein NCU08981 dml-1
NCU07556 crf8-1 TBP associated factor NCU09012 hypothetical protein
NCU07568 hypothetical protein NCU09064 hypothetical protein
NCU07588 hypothetical protein NCU09069 hypothetical protein
NCU07655 nup-29 hypothetical protein NCU09099 hypothetical protein
NCU07656 hypothetical protein NCU09123 camk-1 Ca/CaM-dependent kinase-1
NCU07678 hypothetical protein NCU09125 hypothetical protein
NCU07699 hypothetical protein NCU09132 tba-1 alpha tubulin
NCU07756 tca-11 succinate dehydrogenase cytochrome b560 subunit NCU09167 hypothetical protein
NCU07802 hypothetical protein NCU09195 gpr-6 vacuolar membrane PQ loop repeat protein
NCU07850 nor-1 NADPH oxidase regulator NoxR NCU09199 tyrosinase
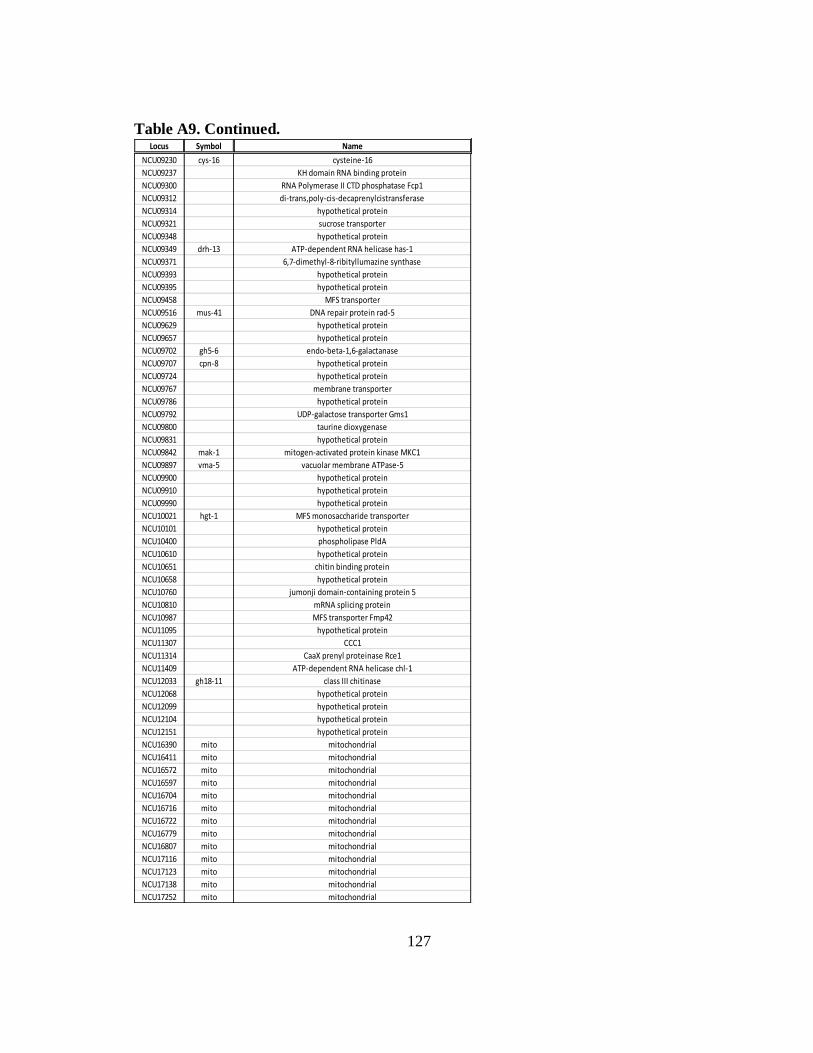
127
Table A9. Continued.
Locus Symbol Name
NCU09230 cys-16 cysteine-16
NCU09237 KH domain RNA binding protein
NCU09300 RNA Polymerase II CTD phosphatase Fcp1
NCU09312 di-trans,poly-cis-decaprenylcistransferase
NCU09314 hypothetical protein
NCU09321 sucrose transporter
NCU09348 hypothetical protein
NCU09349 drh-13 ATP-dependent RNA helicase has-1
NCU09371 6,7-dimethyl-8-ribityllumazine synthase
NCU09393 hypothetical protein
NCU09395 hypothetical protein
NCU09458 MFS transporter
NCU09516 mus-41 DNA repair protein rad-5
NCU09629 hypothetical protein
NCU09657 hypothetical protein
NCU09702 gh5-6 endo-beta-1,6-galactanase
NCU09707 cpn-8 hypothetical protein
NCU09724 hypothetical protein
NCU09767 membrane transporter
NCU09786 hypothetical protein
NCU09792 UDP-galactose transporter Gms1
NCU09800 taurine dioxygenase
NCU09831 hypothetical protein
NCU09842 mak-1 mitogen-activated protein kinase MKC1
NCU09897 vma-5 vacuolar membrane ATPase-5
NCU09900 hypothetical protein
NCU09910 hypothetical protein
NCU09990 hypothetical protein
NCU10021 hgt-1 MFS monosaccharide transporter
NCU10101 hypothetical protein
NCU10400 phospholipase PldA
NCU10610 hypothetical protein
NCU10651 chitin binding protein
NCU10658 hypothetical protein
NCU10760 jumonji domain-containing protein 5
NCU10810 mRNA splicing protein
NCU10987 MFS transporter Fmp42
NCU11095 hypothetical protein
NCU11307 CCC1
NCU11314 CaaX prenyl proteinase Rce1
NCU11409 ATP-dependent RNA helicase chl-1
NCU12033 gh18-11 class III chitinase
NCU12068 hypothetical protein
NCU12099 hypothetical protein
NCU12104 hypothetical protein
NCU12151 hypothetical protein
NCU16390 mito mitochondrial
NCU16411 mito mitochondrial
NCU16572 mito mitochondrial
NCU16597 mito mitochondrial
NCU16704 mito mitochondrial
NCU16716 mito mitochondrial
NCU16722 mito mitochondrial
NCU16779 mito mitochondrial
NCU16807 mito mitochondrial
NCU17116 mito mitochondrial
NCU17123 mito mitochondrial
NCU17138 mito mitochondrial
NCU17252 mito mitochondrial
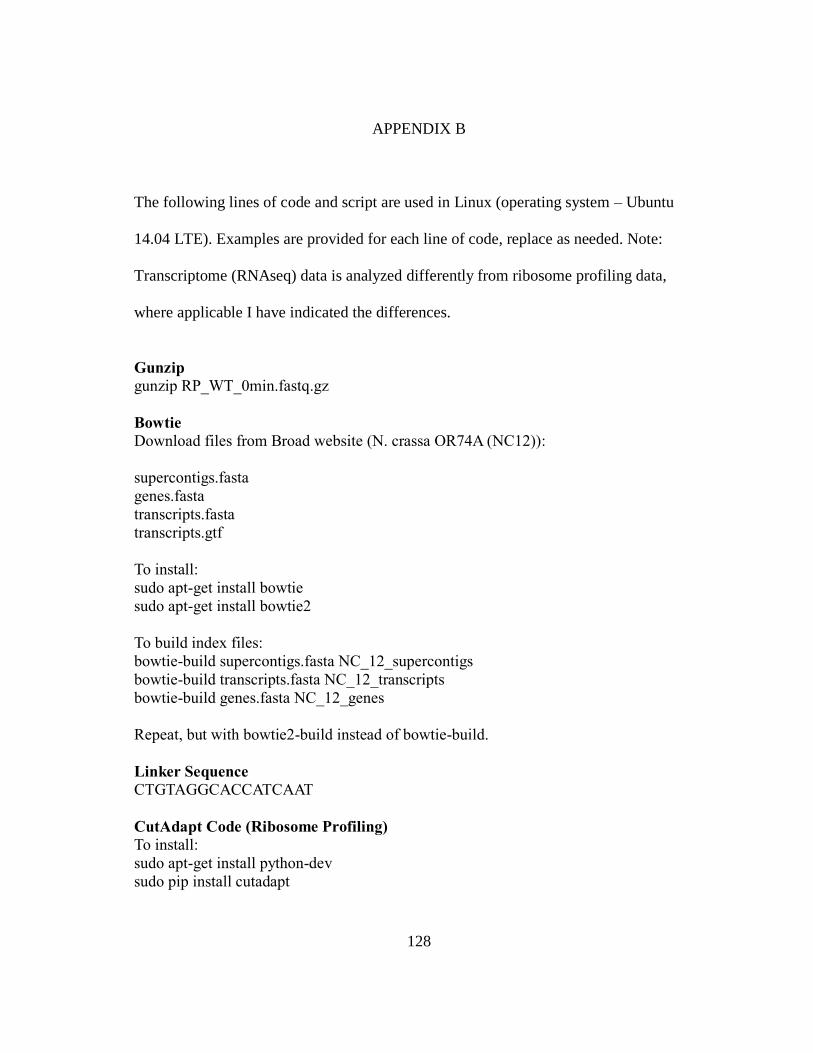
128
APPENDIX B
The following lines of code and script are used in Linux (operating system – Ubuntu
14.04 LTE). Examples are provided for each line of code, replace as needed. Note:
Transcriptome (RNAseq) data is analyzed differently from ribosome profiling data,
where applicable I have indicated the differences.
Gunzip
gunzip RP_WT_0min.fastq.gz
Bowtie
Download files from Broad website (N. crassa OR74A (NC12)):
supercontigs.fasta
genes.fasta
transcripts.fasta
transcripts.gtf
To install:
sudo apt-get install bowtie
sudo apt-get install bowtie2
To build index files:
bowtie-build supercontigs.fasta NC_12_supercontigs
bowtie-build transcripts.fasta NC_12_transcripts
bowtie-build genes.fasta NC_12_genes
Repeat, but with bowtie2-build instead of bowtie-build.
Linker Sequence
CTGTAGGCACCATCAAT
CutAdapt Code (Ribosome Profiling)
To install:
sudo apt-get install python-dev
sudo pip install cutadapt
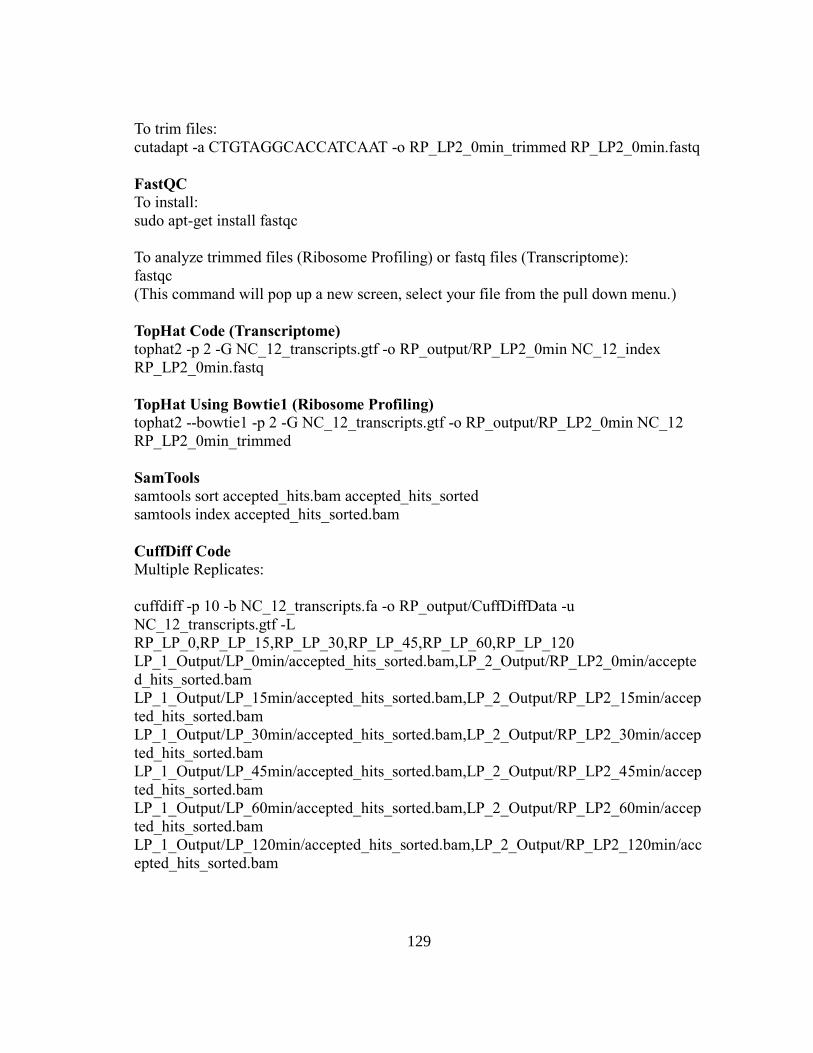
129
To trim files:
cutadapt -a CTGTAGGCACCATCAAT -o RP_LP2_0min_trimmed RP_LP2_0min.fastq
FastQC
To install:
sudo apt-get install fastqc
To analyze trimmed files (Ribosome Profiling) or fastq files (Transcriptome):
fastqc
(This command will pop up a new screen, select your file from the pull down menu.)
TopHat Code (Transcriptome)
tophat2 -p 2 -G NC_12_transcripts.gtf -o RP_output/RP_LP2_0min NC_12_index
RP_LP2_0min.fastq
TopHat Using Bowtie1 (Ribosome Profiling)
tophat2 --bowtie1 -p 2 -G NC_12_transcripts.gtf -o RP_output/RP_LP2_0min NC_12
RP_LP2_0min_trimmed
SamTools
samtools sort accepted_hits.bam accepted_hits_sorted
samtools index accepted_hits_sorted.bam
CuffDiff Code
Multiple Replicates:
cuffdiff -p 10 -b NC_12_transcripts.fa -o RP_output/CuffDiffData -u
NC_12_transcripts.gtf -L
RP_LP_0,RP_LP_15,RP_LP_30,RP_LP_45,RP_LP_60,RP_LP_120
LP_1_Output/LP_0min/accepted_hits_sorted.bam,LP_2_Output/RP_LP2_0min/accepte
d_hits_sorted.bam
LP_1_Output/LP_15min/accepted_hits_sorted.bam,LP_2_Output/RP_LP2_15min/accep
ted_hits_sorted.bam
LP_1_Output/LP_30min/accepted_hits_sorted.bam,LP_2_Output/RP_LP2_30min/accep
ted_hits_sorted.bam
LP_1_Output/LP_45min/accepted_hits_sorted.bam,LP_2_Output/RP_LP2_45min/accep
ted_hits_sorted.bam
LP_1_Output/LP_60min/accepted_hits_sorted.bam,LP_2_Output/RP_LP2_60min/accep
ted_hits_sorted.bam
LP_1_Output/LP_120min/accepted_hits_sorted.bam,LP_2_Output/RP_LP2_120min/acc
epted_hits_sorted.bam
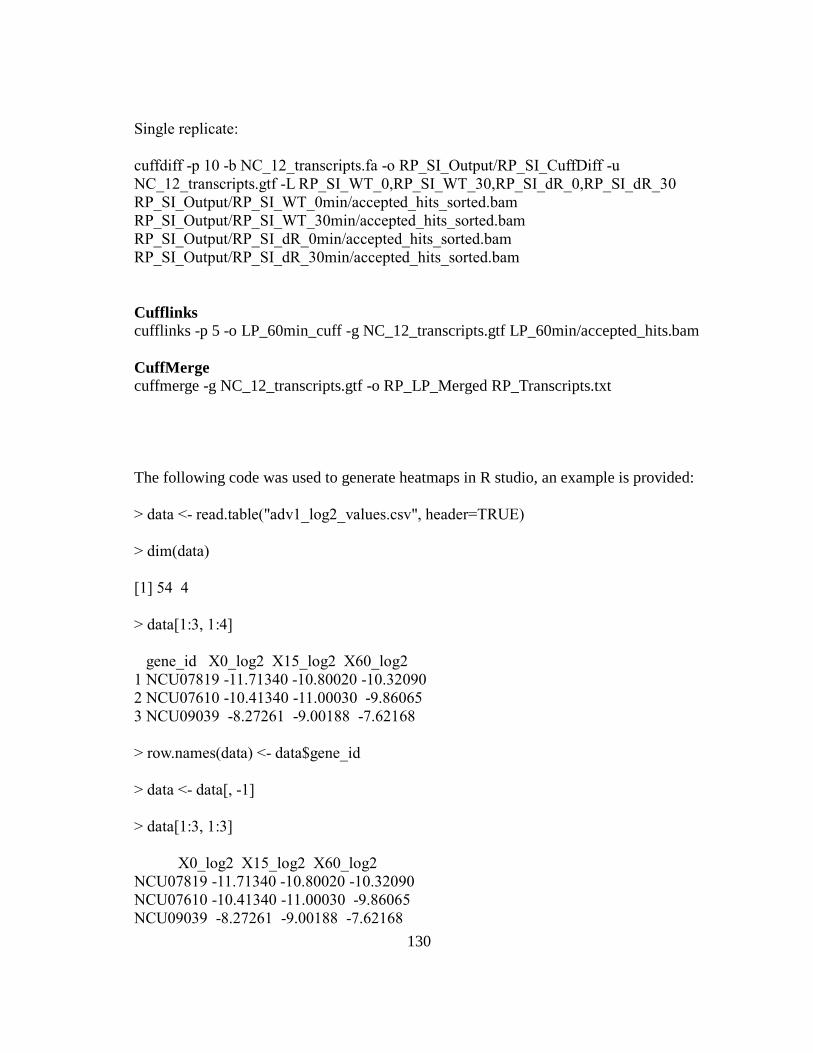
130
Single replicate:
cuffdiff -p 10 -b NC_12_transcripts.fa -o RP_SI_Output/RP_SI_CuffDiff -u
NC_12_transcripts.gtf -L RP_SI_WT_0,RP_SI_WT_30,RP_SI_dR_0,RP_SI_dR_30
RP_SI_Output/RP_SI_WT_0min/accepted_hits_sorted.bam
RP_SI_Output/RP_SI_WT_30min/accepted_hits_sorted.bam
RP_SI_Output/RP_SI_dR_0min/accepted_hits_sorted.bam
RP_SI_Output/RP_SI_dR_30min/accepted_hits_sorted.bam
Cufflinks
cufflinks -p 5 -o LP_60min_cuff -g NC_12_transcripts.gtf LP_60min/accepted_hits.bam
CuffMerge
cuffmerge -g NC_12_transcripts.gtf -o RP_LP_Merged RP_Transcripts.txt
The following code was used to generate heatmaps in R studio, an example is provided:
> data <- read.table("adv1_log2_values.csv", header=TRUE)
> dim(data)
[1] 54 4
> data[1:3, 1:4]
gene_id X0_log2 X15_log2 X60_log2
1 NCU07819 -11.71340 -10.80020 -10.32090
2 NCU07610 -10.41340 -11.00030 -9.86065
3 NCU09039 -8.27261 -9.00188 -7.62168
> row.names(data) <- data$gene_id
> data <- data[, -1]
> data[1:3, 1:3]
X0_log2 X15_log2 X60_log2
NCU07819 -11.71340 -10.80020 -10.32090
NCU07610 -10.41340 -11.00030 -9.86065
NCU09039 -8.27261 -9.00188 -7.62168
131
> my_palette <- colorRampPalette(c("red", "yellow", "green"))(n = 299)
> myfun <- function(data) hclust(as.dist(1-cor(t(as.matrix(data)), method = "pearson")),
method = "average")
> heatmap.2(as.matrix(data),Colv=FALSE, dendrogram = "row", hclustfun = myfun,
col=my_palette, tracecol="red")
132
APPENDIX C
SPECIALIZED RIBOSOMES: A NEW FRONTIER IN GENE REGULATION
This appendix describes a submitted and accepted grant proposal sent to the Joint
Genome Institute (JGI) that is a collaboration between the laboratories of Deborah Bell-
Pedersen and Matthew Sachs at Texas A&M University.
The goal of the project is to define the “ribosome code” and if ribosomes have distinct
compositions at different times of the day, leading to the translation of specific mRNAs.
The idea being that ribosomes are not all the same, and the circadian clock plays a role
in regulating the composition of ribosomal proteins (rproteins) and/or accessory proteins.
To determine the role of the clock in the composition of ribosomes, ribosomes were
isolated from WT and Δfrq cells harvested over a circadian time course. The isolated
ribosomes will then be analyzed using mass spectrometry (mass spec). The mass spec
data will be used to identify (i) rprotein composition; (ii) modifications to rproteins; and
(iii) composition of associated accessory proteins. Further work will involve determining
the mechanism(s) for clock regulation of rproteins, rpotein modifications, and accessory
proteins. The final goal of the project is to identify which mRNAs are translated by
ribosomes with unique ribosome compositions. Using ribosome profiling in WT cells
and in cells with misexpressed rproteins, rproteins that have altered modification sites,
and deleted/mutated accessory proteins; specific mRNAs will be identified that are
translated by the heterogeneous ribosomes. This project will provide a better
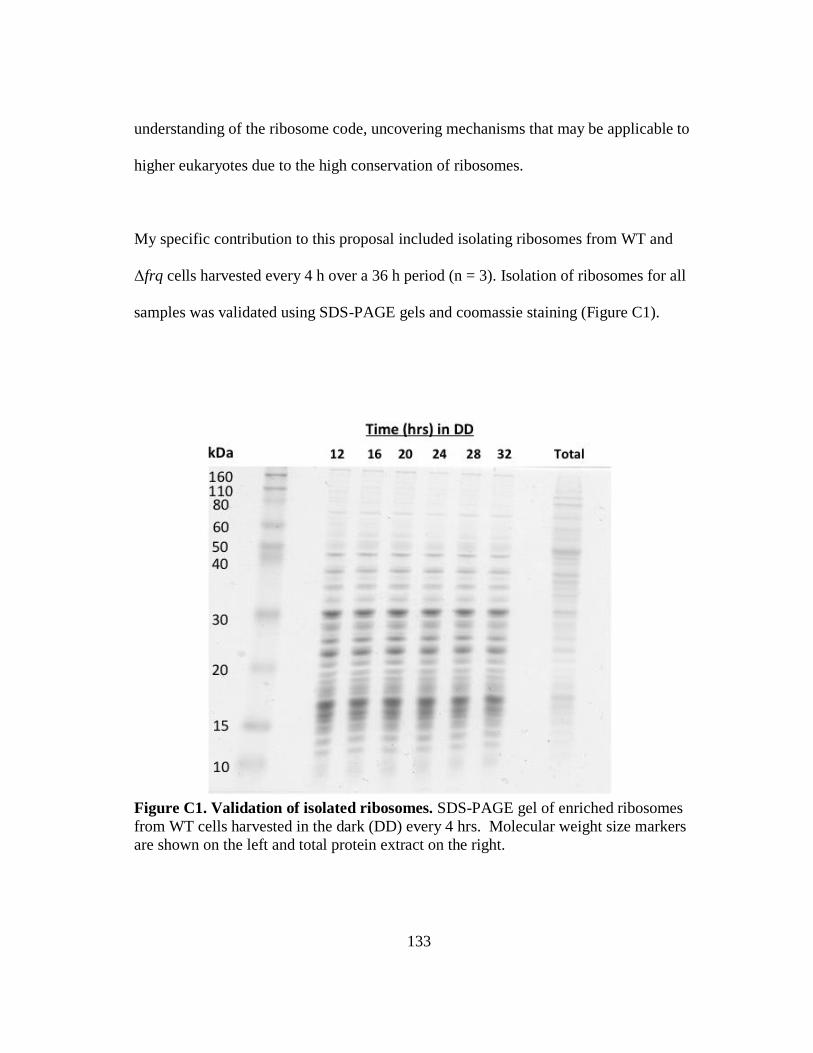
133
understanding of the ribosome code, uncovering mechanisms that may be applicable to
higher eukaryotes due to the high conservation of ribosomes.
My specific contribution to this proposal included isolating ribosomes from WT and
Δfrq cells harvested every 4 h over a 36 h period (n = 3). Isolation of ribosomes for all
samples was validated using SDS-PAGE gels and coomassie staining (Figure C1).
Figure C1. Validation of isolated ribosomes. SDS-PAGE gel of enriched ribosomes
from WT cells harvested in the dark (DD) every 4 hrs. Molecular weight size markers
are shown on the left and total protein extract on the right.