Embed Size (px)
Citation preview
21
doi.org/10.11336/jjcrs.8.21 Jpn J Compr Rehabil Sci Vol 8, 2017
ABSTRACTTokunaga M, Tori K, Eguchi H, Kado Y, Ikejima Y, Ushijima M, Miyabe S, Tsujimoto S, Fukuda E. The stratification of motor FIM and cognitive FIM and the creation of four prediction formulas to enable higher prediction accuracy of multiple linear regression analysis with motor FIM gain as the objective variable ― An analysis of the Japan Rehabilitation Database. Jpn J Compr Rehabil Sci 2017; 8: 21-29.Objective: The aim of our study was to stratify the contributing factors in order to increase the prediction accuracy of the multiple linear regression analysis with motor FIM gain as the objective variable.Methods: The subjects for our study were 2,542 stroke patients. In the multiple linear regression analysis with motor FIM gain as the objective variable, eight contributing factors were stratified. Prediction formulas were created and the correlation between the measured motor FIM gain values and the predicted values was investigated.Results: The correlation coefficient was higher with the stratification of gender (0.509), stroke type (0.512), number of hospital days (0.516), days from onset to admission (0.518), modified Rankin Scale before onset (0.520), age (0.541), cognitive FIM at admission (0.588) and motor FIM at admission (0.641), than with the use of one prediction formula (0.507), and it was 0.653 with stratification into four groups with the two factors of motor FIM and cognitive FIM at admission.
Conclusion: By stratifying the contributing factors, we were able to increase the prediction accuracy of motor FIM gain.Key words: Functional Independence Measure, FIM gain, multiple linear regression analysis, stratification, stroke
Introduction
As the objective variable of multiple linear regression analysis for the prediction of functional outcome, the Functional Independence Measure (FIM) score at discharge and FIM gain (FIM score at discharge-FIM score at admission) are used. Meyer et al. [1] conducted reviews of 27 reports, which contained 63 formulas predicting the functional outcome of acute stroke patients using multiple linear regression analysis. The objective variables were: FIM score at discharge in 33 prediction formulas, FIM gain in 20 formulas, FIM efficiency (FIM gain/number of hospital days) in three formulas, Barthel Index (BI) score at discharge in five formulas and BI efficiency in two formulas. It is considered that there were fewer reports using FIM gain than reports using FIM score at discharge due to the effect of the size of the coefficient of determination or R2, meaning to what degree the explanatory variable could explain the objective variable. In the case of predicting FIM score at discharge, the average R2 was 0.65 (min. 0.35– max. 0.82). In contrast, the average was small at 0.22 (0.08–0.4) in the case of predicting FIM gain [1]. For that reason, in a multiple linear regression analysis predicting FIM gain, a technique for increasing prediction accuracy is required. One approach is the technique of ‘creating multiple prediction formulas.’ In a multiple linear regression analysis, the prediction formula Y = aX1 + bX2 + cX3 (Y: objective variable, X1–X3: explanatory variable,
Japanese Journal of Comprehensive Rehabilitation Science (2017)
Original Article
The stratification of motor FIM and cognitive FIM and the creation of four prediction formulas to enable higher prediction accuracy of multiple linear regression analysis with motor FIM gain as the objective variable ― An analysis of the Japan Rehabilitation Database
Makoto Tokunaga, MD, PhD,1 Kenichi Tori, RPT,1 Hiroshi Eguchi, RPT,1 Youko Kado, RPT,1 Yuki Ikejima, RPT,1 Miyuki Ushijima, RPT,1 Shinko Miyabe, OTR,1 Shinya Tsujimoto, RPT,1 Emiko Fukuda, OTR1
1Department of Sogo Rehabilitation, Kumamoto Kinoh Hospital, Kumamoto, Japan
Correspondence: Makoto Tokunaga, MD, PhDDepartment of Rehabilitation, Kumamoto Kinoh Hospital, 6-8-1 Yamamuro, Kita-ku, Kumamoto 860-8518, Japan.E-mail: [email protected]: February 8, 2017.No benefits in any form have been or will be received from any commercial party related directly or indirectly to the subject of this manuscript.
©Kaifukuki Rehabilitation Ward Association 2017
Tokunaga M et al.: Increasing the prediction accuracy of multiple linear regression analysis for the prediction of FIM gain
Jpn J Compr Rehabil Sci Vol 8, 2017
22
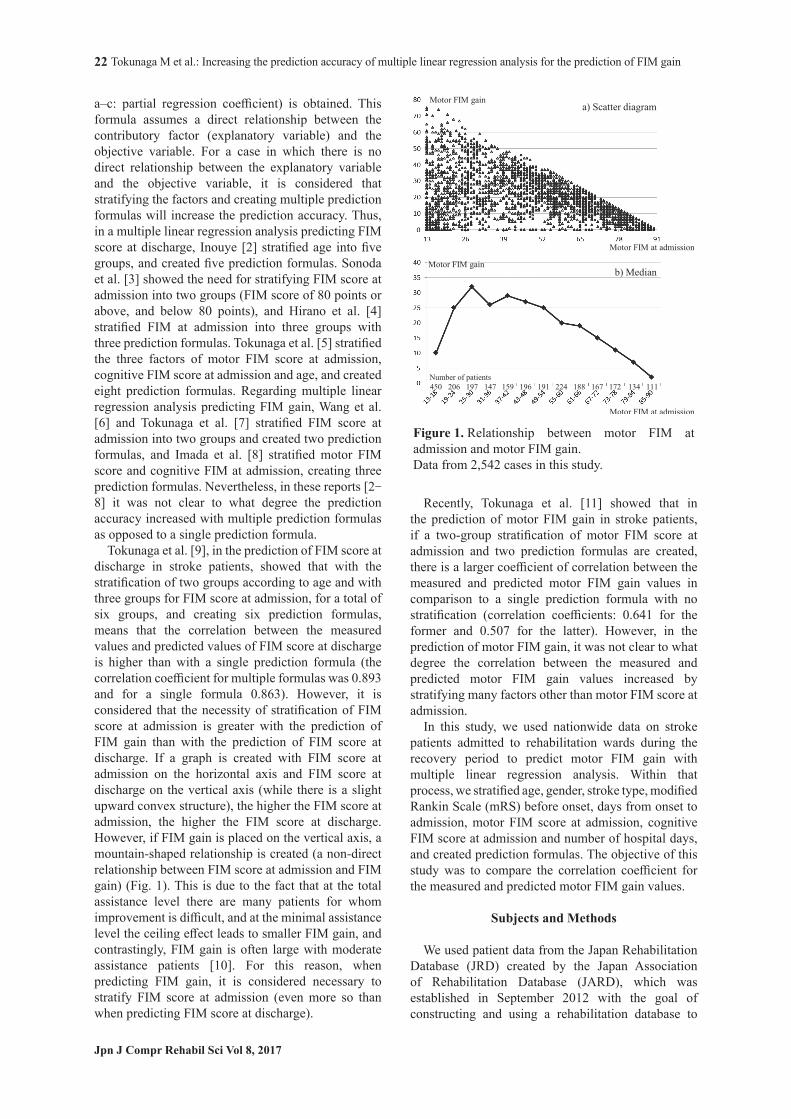
a–c: partial regression coefficient) is obtained. This formula assumes a direct relationship between the contributory factor (explanatory variable) and the objective variable. For a case in which there is no direct relationship between the explanatory variable and the objective variable, it is considered that stratifying the factors and creating multiple prediction formulas will increase the prediction accuracy. Thus, in a multiple linear regression analysis predicting FIM score at discharge, Inouye [2] stratified age into five groups, and created five prediction formulas. Sonoda et al. [3] showed the need for stratifying FIM score at admission into two groups (FIM score of 80 points or above, and below 80 points), and Hirano et al. [4] stratified FIM at admission into three groups with three prediction formulas. Tokunaga et al. [5] stratified the three factors of motor FIM score at admission, cognitive FIM score at admission and age, and created eight prediction formulas. Regarding multiple linear regression analysis predicting FIM gain, Wang et al. [6] and Tokunaga et al. [7] stratified FIM score at admission into two groups and created two prediction formulas, and Imada et al. [8] stratified motor FIM score and cognitive FIM at admission, creating three prediction formulas. Nevertheless, in these reports [2-8] it was not clear to what degree the prediction accuracy increased with multiple prediction formulas as opposed to a single prediction formula. Tokunaga et al. [9], in the prediction of FIM score at discharge in stroke patients, showed that with the stratification of two groups according to age and with three groups for FIM score at admission, for a total of six groups, and creating six prediction formulas, means that the correlation between the measured values and predicted values of FIM score at discharge is higher than with a single prediction formula (the correlation coefficient for multiple formulas was 0.893 and for a single formula 0.863). However, it is considered that the necessity of stratification of FIM score at admission is greater with the prediction of FIM gain than with the prediction of FIM score at discharge. If a graph is created with FIM score at admission on the horizontal axis and FIM score at discharge on the vertical axis (while there is a slight upward convex structure), the higher the FIM score at admission, the higher the FIM score at discharge. However, if FIM gain is placed on the vertical axis, a mountain-shaped relationship is created (a non-direct relationship between FIM score at admission and FIM gain) (Fig. 1). This is due to the fact that at the total assistance level there are many patients for whom improvement is difficult, and at the minimal assistance level the ceiling effect leads to smaller FIM gain, and contrastingly, FIM gain is often large with moderate assistance patients [10]. For this reason, when predicting FIM gain, it is considered necessary to stratify FIM score at admission (even more so than when predicting FIM score at discharge).
Recently, Tokunaga et al. [11] showed that in the prediction of motor FIM gain in stroke patients, if a two-group stratification of motor FIM score at admission and two prediction formulas are created, there is a larger coefficient of correlation between the measured and predicted motor FIM gain values in comparison to a single prediction formula with no stratification (correlation coefficients: 0.641 for the former and 0.507 for the latter). However, in the prediction of motor FIM gain, it was not clear to what degree the correlation between the measured and predicted motor FIM gain values increased by stratifying many factors other than motor FIM score at admission. In this study, we used nationwide data on stroke patients admitted to rehabilitation wards during the recovery period to predict motor FIM gain with multiple linear regression analysis. Within that process, we stratified age, gender, stroke type, modified Rankin Scale (mRS) before onset, days from onset to admission, motor FIM score at admission, cognitive FIM score at admission and number of hospital days, and created prediction formulas. The objective of this study was to compare the correlation coefficient for the measured and predicted motor FIM gain values.
Subjects and Methods
We used patient data from the Japan Rehabilitation Database (JRD) created by the Japan Association of Rehabilitation Database (JARD), which was established in September 2012 with the goal of constructing and using a rehabilitation database to
Figure 1. Relationship between motor FIM at admission and motor FIM gain.Data from 2,542 cases in this study.
Tokunaga M et al.: Increasing the prediction accuracy of multiple linear regression analysis for the prediction of FIM gain
Jpn J Compr Rehabil Sci Vol 8, 2017
23
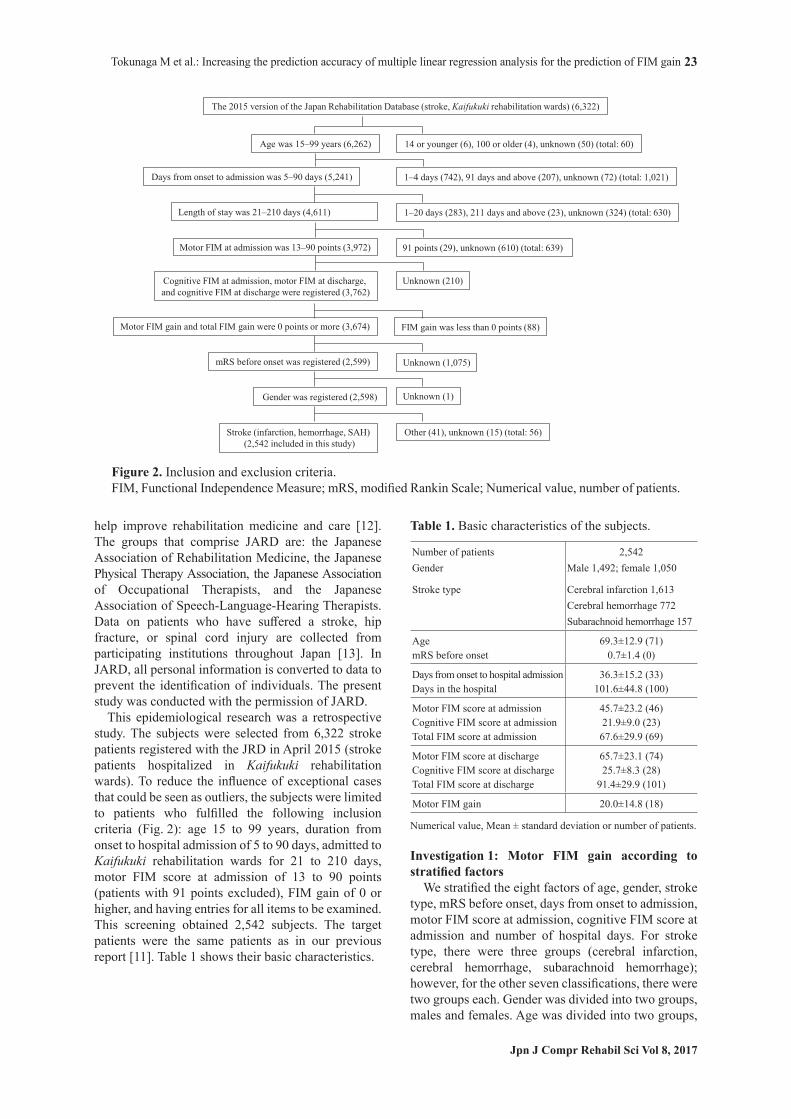
help improve rehabilitation medicine and care [12]. The groups that comprise JARD are: the Japanese Association of Rehabilitation Medicine, the Japanese Physical Therapy Association, the Japanese Association of Occupational Therapists, and the Japanese Association of Speech-Language-Hearing Therapists. Data on patients who have suffered a stroke, hip fracture, or spinal cord injury are collected from participating institutions throughout Japan [13]. In JARD, all personal information is converted to data to prevent the identification of individuals. The present study was conducted with the permission of JARD. This epidemiological research was a retrospective study. The subjects were selected from 6,322 stroke patients registered with the JRD in April 2015 (stroke patients hospitalized in Kaifukuki rehabilitation wards). To reduce the influence of exceptional cases that could be seen as outliers, the subjects were limited to patients who fulfilled the following inclusion criteria (Fig. 2): age 15 to 99 years, duration from onset to hospital admission of 5 to 90 days, admitted to Kaifukuki rehabilitation wards for 21 to 210 days, motor FIM score at admission of 13 to 90 points (patients with 91 points excluded), FIM gain of 0 or higher, and having entries for all items to be examined. This screening obtained 2,542 subjects. The target patients were the same patients as in our previous report [11]. Table 1 shows their basic characteristics.
Investigation 1: Motor FIM gain according to stratified factors We stratified the eight factors of age, gender, stroke type, mRS before onset, days from onset to admission, motor FIM score at admission, cognitive FIM score at admission and number of hospital days. For stroke type, there were three groups (cerebral infarction, cerebral hemorrhage, subarachnoid hemorrhage); however, for the other seven classifications, there were two groups each. Gender was divided into two groups, males and females. Age was divided into two groups,
Figure 2. Inclusion and exclusion criteria.FIM, Functional Independence Measure; mRS, modified Rankin Scale; Numerical value, number of patients.
Table 1. Basic characteristics of the subjects.
Number of patientsGender
Stroke type
2,542Male 1,492; female 1,050
Cerebral infarction 1,613 Cerebral hemorrhage 772 Subarachnoid hemorrhage 157
Age 69.3±12.9 (71)mRS before onset 0.7±1.4 (0)
Days from onset to hospital admission 36.3±15.2 (33)Days in the hospital 101.6±44.8 (100)
Motor FIM score at admission 45.7±23.2 (46)Cognitive FIM score at admission 21.9±9.0 (23)Total FIM score at admission 67.6±29.9 (69)
Motor FIM score at discharge 65.7±23.1 (74)Cognitive FIM score at discharge 25.7±8.3 (28)Total FIM score at discharge 91.4±29.9 (101)
Motor FIM gain 20.0±14.8 (18)
Numerical value, Mean ± standard deviation or number of patients.
Tokunaga M et al.: Increasing the prediction accuracy of multiple linear regression analysis for the prediction of FIM gain
Jpn J Compr Rehabil Sci Vol 8, 2017
24
69 years and younger, and 70 years and older, given that FIM improvement for patients aged 70 years and over generally decreases linearly with increasing age [14-16]. In terms of days from onset to admission, and cognitive FIM score at admission, there were two groups for each of these factors, given that FIM improvement differed if the number of days was 41 and below, or above 41, and if cognitive FIM score at admission was 5–14 points or 15–35 points [17]. Given that the peak of motor FIM gain has been 25–30 points [14] and 31–36 points [17], motor FIM score at admission was divided into two groups, 13–30 points and 31–90 points, as in our previous report [11]. Median values were used for dividing mRS before onset and number of hospital days (Table 1). mRS before onset was divided into two groups, 0 points and 1–5 points, and number of hospital days was divided into two groups, 99 days or less and 100 days or longer. Thus, with these two groups (with the exception of three groups for stroke type), motor FIM gain was compared. For a comparison between the two groups, the Mann-Whitney U test was used. For a comparison of the three groups, the Kruskal-Wallis test was conducted, and if there was a statistical significance, a multiple comparison was made using Scheffé’s method.
Investigation 2: Multiple linear regression analysis with motor FIM gain as the objective variable As in our previous report [11], we conducted a multiple linear regression analysis with motor FIM gain as the objective variable, and the five items of age, mRS before onset, days from onset to admission, motor FIM score at admission, and cognitive FIM score at admission were the explanatory variables. At this time, we created two prediction methods with the division of age into 69 years or younger and 70 years or older. Similarly, for the other seven factors, stratifications were made as in Investigation 1, with two prediction formulas created (three for stroke type).
Investigation 3: Stratification with the two factors of motor FIM and cognitive FIM In Investigation 2, the effect of the stratification of eight factors was large for motor FIM score at admission and cognitive FIM score at admission; thus, we used these two factors for stratification. Specifically, there were two groups for motor FIM score at admission (13–30 points and 31–90 points), and two groups for cognitive FIM score at admission (5–14 points and 15–35 points), for a total of four stratified groups and four prediction formulas for the multiple linear regression analysis.
Investigation 4: Motor FIM gain was predicted using a multiple linear regression analysis by subtracting motor FIM score at admission from motor FIM score at discharge In a report using a multiple linear regression analysis [1], given that a larger R2, coefficient of determination, was gained with the prediction of motor FIM score at discharge as opposed to the prediction of motor FIM gain, we initially predicted motor FIM score at discharge using multiple linear regression analysis. Then, we subtracted motor FIM score at admission from the predicted motor FIM score at discharge to obtain the predicted value for motor FIM gain. We looked at the correlation between the predicted and measured values for motor FIM gain obtained in Investigations 2–4, and examined the difference between the measured values and predicted values. The correlation coefficient was obtained with the Pearson correlation coefficient formula. The statistical software used was Statcel 4 [18] and Mulcel [19]. The level of significance was set as < 5%.
Results
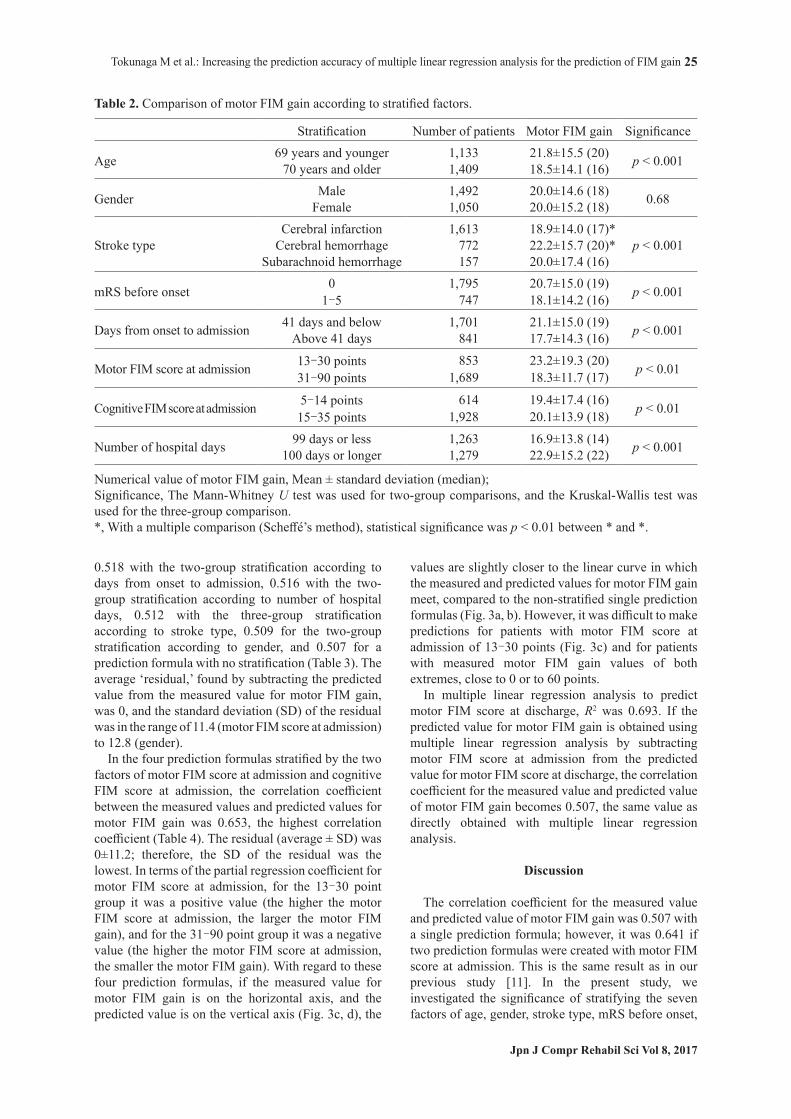
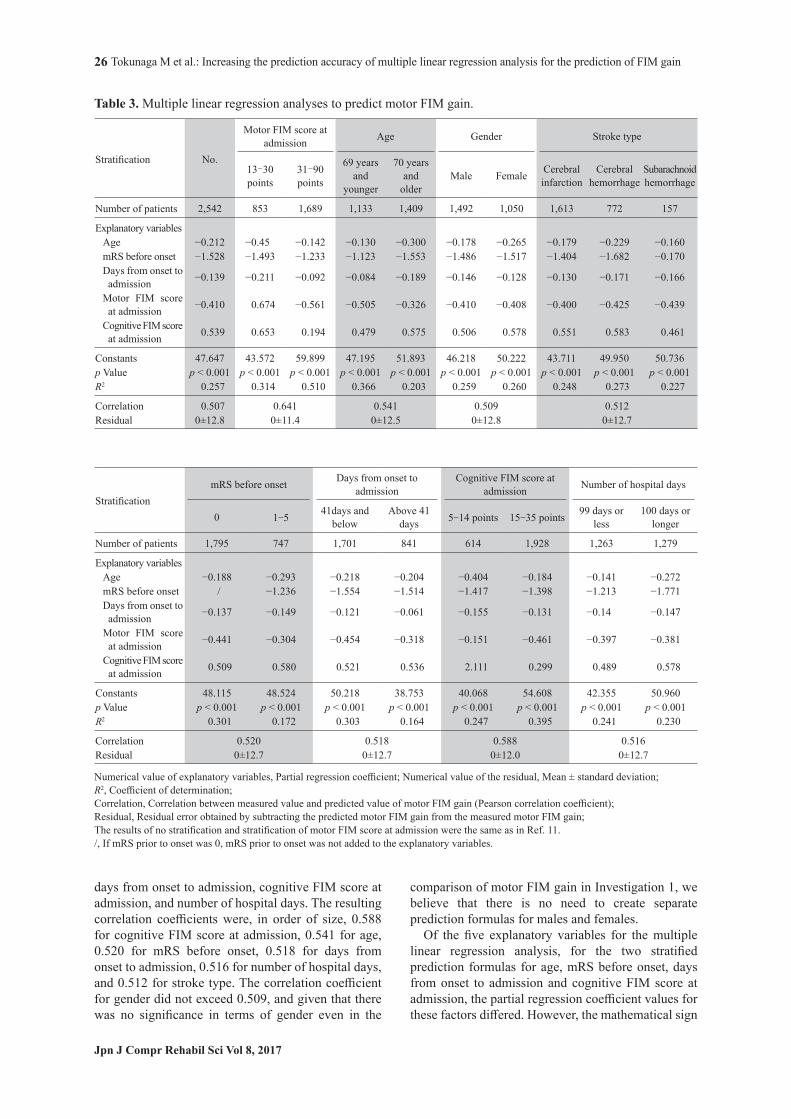
Statistical significance was observed with motor FIM gain in the two stratified groups of age, mRS before onset, days from onset to admission, motor FIM score at admission, cognitive FIM score at admission and number of hospital days (Mann-Whitney U test). Specifically, motor FIM gain was larger in patients 69 years or younger, with mRS before onset 0 points, less than 41 days from onset to admission, motor FIM score at admission 30 points or less, cognitive FIM score at admission 15 points or higher, and number of hospital days 100 days or longer (Table 2). Statistical significance was also observed in the three groups for stroke type (Kruskal-Wallis test), and there was significantly higher motor FIM gain with cerebral hemorrhage than with cerebral infarction (Scheffé’s method). In contrast, there was no clear statistical significance with motor FIM gain according to gender. The partial regression coefficient for the multiple linear regression analysis was a negative value for age, mRS before onset, days from onset to admission, and motor FIM score at admission (the larger these values, the smaller the motor FIM gain), and it was a positive value for cognitive FIM score at admission (the higher the cognitive FIM score at admission, the larger the motor FIM gain) (Table 3). The correlation coefficients for measured and predicted values for motor FIM gain were, from largest to smallest, 0.641 with the two-group stratification according to motor FIM score at admission, 0.588 with the two-group stratification according to cognitive FIM score at admission, 0.541 with the two-group stratification according to age, 0.520 with the two-group stratification according to mRS before onset,
Tokunaga M et al.: Increasing the prediction accuracy of multiple linear regression analysis for the prediction of FIM gain
Jpn J Compr Rehabil Sci Vol 8, 2017
25
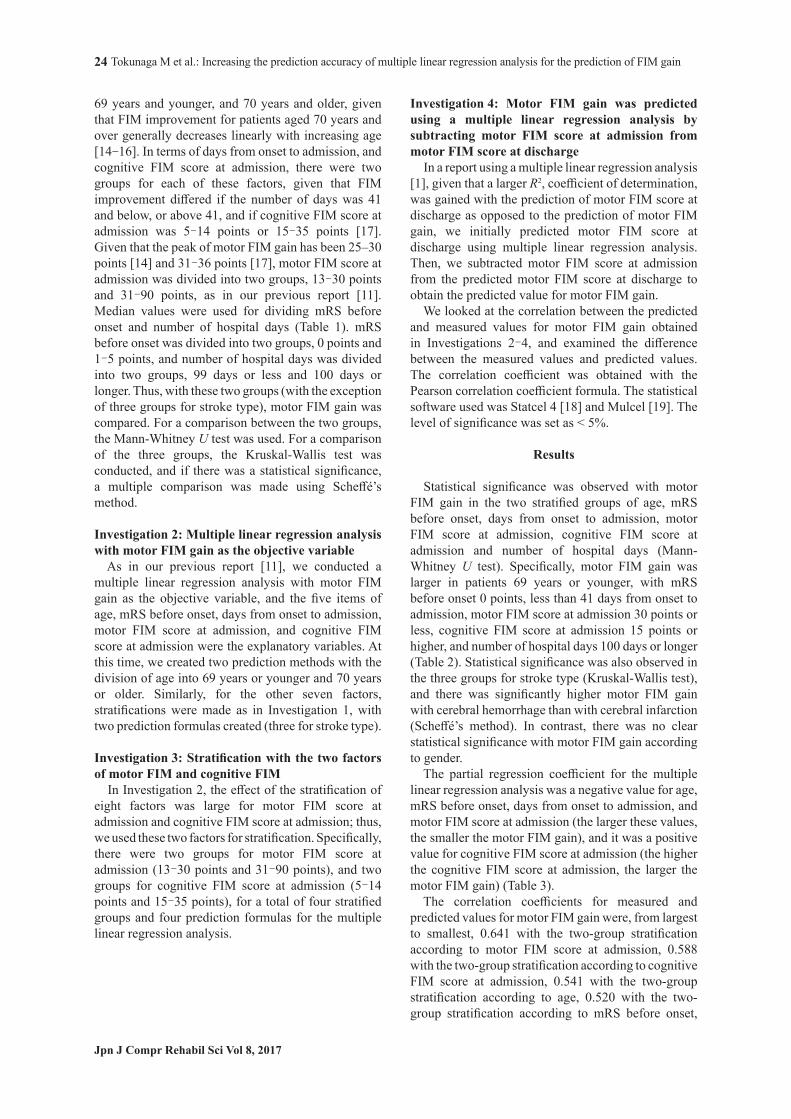
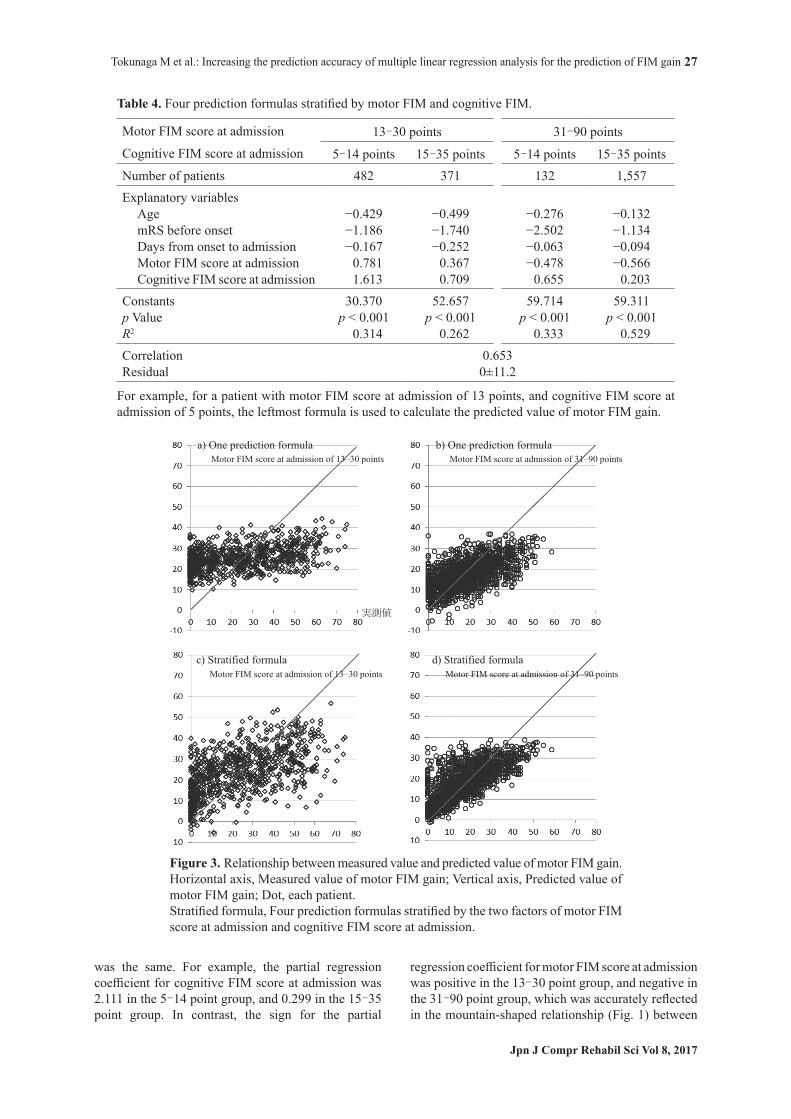
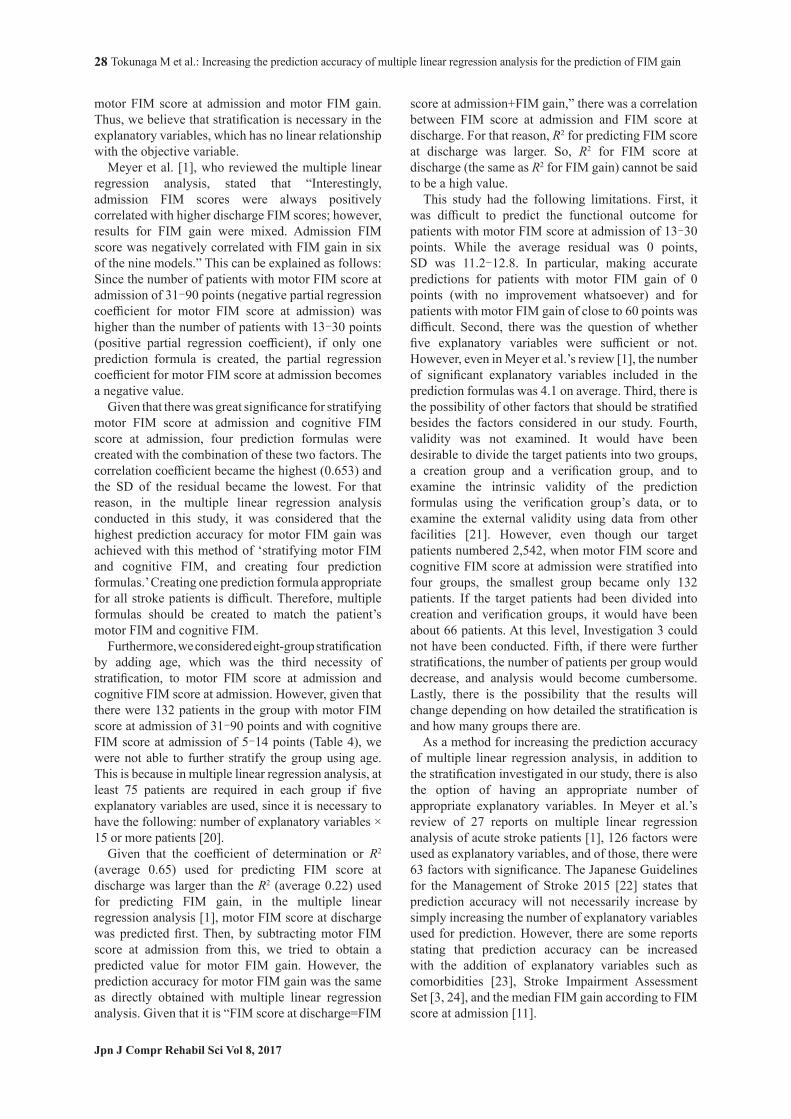
0.518 with the two-group stratification according to days from onset to admission, 0.516 with the two-group stratification according to number of hospital days, 0.512 with the three-group stratification according to stroke type, 0.509 for the two-group stratification according to gender, and 0.507 for a prediction formula with no stratification (Table 3). The average ‘residual,’ found by subtracting the predicted value from the measured value for motor FIM gain, was 0, and the standard deviation (SD) of the residual was in the range of 11.4 (motor FIM score at admission) to 12.8 (gender). In the four prediction formulas stratified by the two factors of motor FIM score at admission and cognitive FIM score at admission, the correlation coefficient between the measured values and predicted values for motor FIM gain was 0.653, the highest correlation coefficient (Table 4). The residual (average ± SD) was 0±11.2; therefore, the SD of the residual was the lowest. In terms of the partial regression coefficient for motor FIM score at admission, for the 13–30 point group it was a positive value (the higher the motor FIM score at admission, the larger the motor FIM gain), and for the 31–90 point group it was a negative value (the higher the motor FIM score at admission, the smaller the motor FIM gain). With regard to these four prediction formulas, if the measured value for motor FIM gain is on the horizontal axis, and the predicted value is on the vertical axis (Fig. 3c, d), the
values are slightly closer to the linear curve in which the measured and predicted values for motor FIM gain meet, compared to the non-stratified single prediction formulas (Fig. 3a, b). However, it was difficult to make predictions for patients with motor FIM score at admission of 13–30 points (Fig. 3c) and for patients with measured motor FIM gain values of both extremes, close to 0 or to 60 points. In multiple linear regression analysis to predict motor FIM score at discharge, R2 was 0.693. If the predicted value for motor FIM gain is obtained using multiple linear regression analysis by subtracting motor FIM score at admission from the predicted value for motor FIM score at discharge, the correlation coefficient for the measured value and predicted value of motor FIM gain becomes 0.507, the same value as directly obtained with multiple linear regression analysis.
Discussion
The correlation coefficient for the measured value and predicted value of motor FIM gain was 0.507 with a single prediction formula; however, it was 0.641 if two prediction formulas were created with motor FIM score at admission. This is the same result as in our previous study [11]. In the present study, we investigated the significance of stratifying the seven factors of age, gender, stroke type, mRS before onset,
Table 2. Comparison of motor FIM gain according to stratified factors.
Stratification Number of patients Motor FIM gain Significance
Age 69 years and younger 1,133 21.8±15.5 (20) p < 0.00170 years and older 1,409 18.5±14.1 (16)
Gender Male 1,492 20.0±14.6 (18) 0.68Female 1,050 20.0±15.2 (18)
Stroke typeCerebral infarction 1,613 18.9±14.0 (17)*
p < 0.001Cerebral hemorrhage 772 22.2±15.7 (20)*Subarachnoid hemorrhage 157 20.0±17.4 (16)
mRS before onset 0 1,795 20.7±15.0 (19) p < 0.0011‐5 747 18.1±14.2 (16)
Days from onset to admission 41 days and below 1,701 21.1±15.0 (19) p < 0.001Above 41 days 841 17.7±14.3 (16)
Motor FIM score at admission 13‐30 points 853 23.2±19.3 (20) p < 0.0131‐90 points 1,689 18.3±11.7 (17)
Cognitive FIM score at admission 5‐14 points 614 19.4±17.4 (16) p < 0.0115‐35 points 1,928 20.1±13.9 (18)
Number of hospital days 99 days or less 1,263 16.9±13.8 (14) p < 0.001100 days or longer 1,279 22.9±15.2 (22)
Numerical value of motor FIM gain, Mean ± standard deviation (median);Significance, The Mann-Whitney U test was used for two-group comparisons, and the Kruskal-Wallis test was used for the three-group comparison.*, With a multiple comparison (Scheffé’s method), statistical significance was p < 0.01 between * and *.
Tokunaga M et al.: Increasing the prediction accuracy of multiple linear regression analysis for the prediction of FIM gain
Jpn J Compr Rehabil Sci Vol 8, 2017
26
days from onset to admission, cognitive FIM score at admission, and number of hospital days. The resulting correlation coefficients were, in order of size, 0.588 for cognitive FIM score at admission, 0.541 for age, 0.520 for mRS before onset, 0.518 for days from onset to admission, 0.516 for number of hospital days, and 0.512 for stroke type. The correlation coefficient for gender did not exceed 0.509, and given that there was no significance in terms of gender even in the
comparison of motor FIM gain in Investigation 1, we believe that there is no need to create separate prediction formulas for males and females. Of the five explanatory variables for the multiple linear regression analysis, for the two stratified prediction formulas for age, mRS before onset, days from onset to admission and cognitive FIM score at admission, the partial regression coefficient values for these factors differed. However, the mathematical sign
Table 3. Multiple linear regression analyses to predict motor FIM gain.
Stratification No.
Motor FIM score at admission Age Gender Stroke type
13–30 points
31–90 points
69 years and
younger
70 years and
olderMale Female Cerebral
infarctionCerebral
hemorrhageSubarachnoid hemorrhage
Number of patients 2,542 853 1,689 1,133 1,409 1,492 1,050 1,613 772 157
Explanatory variablesAge −0.212 −0.45 −0.142 −0.130 −0.300 −0.178 −0.265 −0.179 −0.229 −0.160mRS before onset −1.528 −1.493 −1.233 −1.123 −1.553 −1.486 −1.517 −1.404 −1.682 −0.170Days from onset to admission −0.139 −0.211 −0.092 −0.084 −0.189 −0.146 −0.128 −0.130 −0.171 −0.166
Motor FIM score at admission −0.410 0.674 −0.561 −0.505 −0.326 −0.410 −0.408 −0.400 −0.425 −0.439
Cognitive FIM score at admission 0.539 0.653 0.194 0.479 0.575 0.506 0.578 0.551 0.583 0.461
Constants 47.647 43.572 59.899 47.195 51.893 46.218 50.222 43.711 49.950 50.736p Value p < 0.001 p < 0.001 p < 0.001 p < 0.001 p < 0.001 p < 0.001 p < 0.001 p < 0.001 p < 0.001 p < 0.001R2 0.257 0.314 0.510 0.366 0.203 0.259 0.260 0.248 0.273 0.227
Correlation 0.507 0.641 0.541 0.509 0.512 Residual 0±12.8 0±11.4 0±12.5 0±12.8 0±12.7
StratificationmRS before onset Days from onset to
admissionCognitive FIM score at
admission Number of hospital days
0 1-5 41days and below
Above 41 days 5-14 points 15-35 points 99 days or
less100 days or
longer
Number of patients 1,795 747 1,701 841 614 1,928 1,263 1,279
Explanatory variablesAge −0.188 −0.293 −0.218 −0.204 −0.404 −0.184 −0.141 −0.272mRS before onset / −1.236 −1.554 −1.514 −1.417 −1.398 −1.213 −1.771Days from onset to admission −0.137 −0.149 −0.121 −0.061 −0.155 −0.131 −0.14 −0.147
Motor FIM score at admission −0.441 −0.304 −0.454 −0.318 −0.151 −0.461 −0.397 −0.381
Cognitive FIM score at admission 0.509 0.580 0.521 0.536 2.111 0.299 0.489 0.578
Constants 48.115 48.524 50.218 38.753 40.068 54.608 42.355 50.960p Value p < 0.001 p < 0.001 p < 0.001 p < 0.001 p < 0.001 p < 0.001 p < 0.001 p < 0.001R2 0.301 0.172 0.303 0.164 0.247 0.395 0.241 0.230
Correlation 0.520 0.518 0.588 0.516 Residual 0±12.7 0±12.7 0±12.0 0±12.7
Numerical value of explanatory variables, Partial regression coefficient; Numerical value of the residual, Mean ± standard deviation; R2, Coefficient of determination;Correlation, Correlation between measured value and predicted value of motor FIM gain (Pearson correlation coefficient); Residual, Residual error obtained by subtracting the predicted motor FIM gain from the measured motor FIM gain;The results of no stratification and stratification of motor FIM score at admission were the same as in Ref. 11./, If mRS prior to onset was 0, mRS prior to onset was not added to the explanatory variables.
Tokunaga M et al.: Increasing the prediction accuracy of multiple linear regression analysis for the prediction of FIM gain
Jpn J Compr Rehabil Sci Vol 8, 2017
27
was the same. For example, the partial regression coefficient for cognitive FIM score at admission was 2.111 in the 5–14 point group, and 0.299 in the 15–35 point group. In contrast, the sign for the partial
regression coefficient for motor FIM score at admission was positive in the 13–30 point group, and negative in the 31–90 point group, which was accurately reflected in the mountain-shaped relationship (Fig. 1) between
Figure 3. Relationship between measured value and predicted value of motor FIM gain.Horizontal axis, Measured value of motor FIM gain; Vertical axis, Predicted value of motor FIM gain; Dot, each patient. Stratified formula, Four prediction formulas stratified by the two factors of motor FIM score at admission and cognitive FIM score at admission.
Table 4. Four prediction formulas stratified by motor FIM and cognitive FIM.
Motor FIM score at admission 13–30 points 31–90 pointsCognitive FIM score at admission 5–14 points 15–35 points 5–14 points 15–35 pointsNumber of patients 482 371 132 1,557 Explanatory variables
Age −0.429 −0.499 −0.276 −0.132mRS before onset −1.186 −1.740 −2.502 −1.134Days from onset to admission −0.167 −0.252 −0.063 −0.094Motor FIM score at admission 0.781 0.367 −0.478 −0.566Cognitive FIM score at admission 1.613 0.709 0.655 0.203
Constants 30.370 52.657 59.714 59.311 p Value p < 0.001 p < 0.001 p < 0.001 p < 0.001R2 0.314 0.262 0.333 0.529 Correlation 0.653 Residual 0±11.2
For example, for a patient with motor FIM score at admission of 13 points, and cognitive FIM score at admission of 5 points, the leftmost formula is used to calculate the predicted value of motor FIM gain.
Tokunaga M et al.: Increasing the prediction accuracy of multiple linear regression analysis for the prediction of FIM gain
Jpn J Compr Rehabil Sci Vol 8, 2017
28
motor FIM score at admission and motor FIM gain. Thus, we believe that stratification is necessary in the explanatory variables, which has no linear relationship with the objective variable. Meyer et al. [1], who reviewed the multiple linear regression analysis, stated that “Interestingly, admission FIM scores were always positively correlated with higher discharge FIM scores; however, results for FIM gain were mixed. Admission FIM score was negatively correlated with FIM gain in six of the nine models.” This can be explained as follows: Since the number of patients with motor FIM score at admission of 31–90 points (negative partial regression coefficient for motor FIM score at admission) was higher than the number of patients with 13–30 points (positive partial regression coefficient), if only one prediction formula is created, the partial regression coefficient for motor FIM score at admission becomes a negative value. Given that there was great significance for stratifying motor FIM score at admission and cognitive FIM score at admission, four prediction formulas were created with the combination of these two factors. The correlation coefficient became the highest (0.653) and the SD of the residual became the lowest. For that reason, in the multiple linear regression analysis conducted in this study, it was considered that the highest prediction accuracy for motor FIM gain was achieved with this method of ‘stratifying motor FIM and cognitive FIM, and creating four prediction formulas.’ Creating one prediction formula appropriate for all stroke patients is difficult. Therefore, multiple formulas should be created to match the patient’s motor FIM and cognitive FIM. Furthermore, we considered eight-group stratification by adding age, which was the third necessity of stratification, to motor FIM score at admission and cognitive FIM score at admission. However, given that there were 132 patients in the group with motor FIM score at admission of 31–90 points and with cognitive FIM score at admission of 5–14 points (Table 4), we were not able to further stratify the group using age. This is because in multiple linear regression analysis, at least 75 patients are required in each group if five explanatory variables are used, since it is necessary to have the following: number of explanatory variables × 15 or more patients [20]. Given that the coefficient of determination or R2 (average 0.65) used for predicting FIM score at discharge was larger than the R2 (average 0.22) used for predicting FIM gain, in the multiple linear regression analysis [1], motor FIM score at discharge was predicted first. Then, by subtracting motor FIM score at admission from this, we tried to obtain a predicted value for motor FIM gain. However, the prediction accuracy for motor FIM gain was the same as directly obtained with multiple linear regression analysis. Given that it is “FIM score at discharge=FIM
score at admission+FIM gain,” there was a correlation between FIM score at admission and FIM score at discharge. For that reason, R2 for predicting FIM score at discharge was larger. So, R2 for FIM score at discharge (the same as R2 for FIM gain) cannot be said to be a high value. This study had the following limitations. First, it was difficult to predict the functional outcome for patients with motor FIM score at admission of 13–30 points. While the average residual was 0 points, SD was 11.2–12.8. In particular, making accurate predictions for patients with motor FIM gain of 0 points (with no improvement whatsoever) and for patients with motor FIM gain of close to 60 points was difficult. Second, there was the question of whether five explanatory variables were sufficient or not. However, even in Meyer et al.’s review [1], the number of significant explanatory variables included in the prediction formulas was 4.1 on average. Third, there is the possibility of other factors that should be stratified besides the factors considered in our study. Fourth, validity was not examined. It would have been desirable to divide the target patients into two groups, a creation group and a verification group, and to examine the intrinsic validity of the prediction formulas using the verification group’s data, or to examine the external validity using data from other facilities [21]. However, even though our target patients numbered 2,542, when motor FIM score and cognitive FIM score at admission were stratified into four groups, the smallest group became only 132 patients. If the target patients had been divided into creation and verification groups, it would have been about 66 patients. At this level, Investigation 3 could not have been conducted. Fifth, if there were further stratifications, the number of patients per group would decrease, and analysis would become cumbersome. Lastly, there is the possibility that the results will change depending on how detailed the stratification is and how many groups there are. As a method for increasing the prediction accuracy of multiple linear regression analysis, in addition to the stratification investigated in our study, there is also the option of having an appropriate number of appropriate explanatory variables. In Meyer et al.’s review of 27 reports on multiple linear regression analysis of acute stroke patients [1], 126 factors were used as explanatory variables, and of those, there were 63 factors with significance. The Japanese Guidelines for the Management of Stroke 2015 [22] states that prediction accuracy will not necessarily increase by simply increasing the number of explanatory variables used for prediction. However, there are some reports stating that prediction accuracy can be increased with the addition of explanatory variables such as comorbidities [23], Stroke Impairment Assessment Set [3, 24], and the median FIM gain according to FIM score at admission [11].
Tokunaga M et al.: Increasing the prediction accuracy of multiple linear regression analysis for the prediction of FIM gain
Jpn J Compr Rehabil Sci Vol 8, 2017
29
An issue for future research is accurate prediction for patients with FIM gain of 0 points and for patients with extremely high FIM gain.
Acknowledgements
This study used the Japan Rehabilitation Database managed by the Japan Association of Rehabilitation Database, to whom we extend our gratitude. The contents and conclusions of this study are not the opinions of the Association, but rather the viewpoints of the authors.
References 1 . Meyer MJ, Pereira S, McClure A, Teasell R, Thind A,
Koval J, et al. A systematic review of studies reporting multivariable models to predict functional outcomes after post-stroke inpatient rehabilitation. Disabil Rehabil 2015; 37: 1316-23.
2 . Inouye M. Predicting models of outcome stratified by age after first stroke rehabilitation in Japan. Am J Phys Med Rehabil 2001; 80: 586-91.
3 . Sonoda S, Saitoh E, Domen K, Chino N. Prognostication of stroke patients using SIAS and FIM. In: Chino N, Melvin JL, editor. Functional Evaluation of Stroke Patients. Tokyo: Springer-Verlag; 1995. p.103-14.
4 . Hirano Y, Okura Y, Takeuchi M. The influence of ADL severity at admission on ADL at discharge in convalescent stroke rehabilitation. Tohoku Rigaku-ryoho Kagaku 2011; 23: 32-7. Japanese.
5 . Tokunaga M, Taniguchi M, Nakakado K, Mihono T, Okido A, Ushijima T, et al. Assessment of the effects of factors in stroke rehabilitation using eight multiple regression analyses. Jpn J Compr Rehabil Sci 2015; 6: 78-85.
6 . Wang H, Camicia M, Terdiman J, Hung YY, Sandel ME. Time to inpatient rehabilitation hospital admission and functional outcomes of stroke patients. PM & R 2011; Apr 3(4): 296-304.
7 . Tokunaga M, Kondo K. Training time and FIM gain in patients with stroke in Kaifukuki rehabilitation hospitals. Sogo Rehabil 2014; 42: 245-52. Japanese.
8 . Imada Y, Tokunaga M, Fukunaga K, Sannomiya K, Inoue R, Hamasaki H, et al. Relationship between cognitive FIM score and motor FIM gain in patients with stroke in a Kaifukuki rehabilitation ward. Jpn J Compr Rehabil Sci 2014; 5: 12-8.
9 . Tokunaga M, Ikeda Y, Inoue M, Kodama J, Sakamoto M, Nagatomo M, et al. Multiple regression analysis stratified by age and FIM at admission. J Clin Rehabil 2015; 24: 828-34. Japanese.
10 . Sonoda S, Nagai S, Saitoh E. A viewpoint and problem
of the convalescent rehabilitation wards. Jpn J Rehabil Med 2005; 42: 614-7. Japanese.
11 . Tokunaga M, Mori Y, Ogata Y, Tanaka Y, Uchino K, Maeda Y, et al. Predicting FIM gain in stroke patients by adding median FIM gain stratified by FIM score at hospital admission to the explanatory variables in multiple regression analysis. Jpn J Compr Rehabil Sci 2016; 7: 13-8.
12 . Kondo K. Secondary analysis of the rehabilitation patient database. Jpn J Rehabil Med 2012; 49: 142-8. Japanese.
13 . Japan Association of Rehabilitation Database. Japanese. Available from: http://square.umin.ac.jp/JARD/
14 . Tokunaga M, Nakanishi R, Eguchi G, Kihara K, Tokisato K, Katsura K, et al. The influence of age on corrected motor FIM effectiveness. Jpn J Compr Rehabil Sci 2014; 5: 56-60.
15 . Tokunaga M, Watanabe S, Nakanishi R, Yamanaga H, Yonemitsu H, Mita S, et al. The influence of stroke type, gender, and age on FIM improvement. Jpn J Compr Rehabil Sci 2014; 5: 136-40.
16 . Tokunaga M, Honda S, Uyama E, Mita S, Terasaki T, Hirata Y, et al. Difference of FIM improvement between subtypes of brain infarction. J Clin Rehabil 2014; 23: 1236-40. Japanese.
17 . Tokunaga M, Sannomiya K, Nakashima Y, Nojiri S, Tokisato K, Katsura K, et al. Formula for predicting FIM gain and discharge FIM: methods using median values of FIM gain stratified by admission FIM, age, cognitive function, and transfer interval. Jpn J Compr Rehabil Sci 2015; 6: 6-13.
18 . Yanai H. 4 Steps Excel Statistics. Saitama: OMS Publishing Inc; 2005. p. 1-309. Japanese.
19 . Yanai H. Practical Multivariate Analysis Greate Utilities on Excel. Saitama: OMS Publishing Inc; 2005. p. 1-174. Japanese.
20 . Shintani A. Medical Statistics. Tokyo: Igaku-shoin; 2015. p.1-167. Japanese.
21 . Tokunaga M, Sannomiya K, Nakanishi R, Yonemitsu H. The external validity of multiple regression analyses predicting discharge FIM score in patients with stroke hospitalized in Kaifukuki rehabilitation wards. Jpn J Compr Rehabil Sci 2015; 6: 14-20.
22 . The Japan Stroke Society. Japanese Guidelines for the Management of Stroke 2015. Tokyo: Kyowa Kikaku; 2015. p.1-337. Japanese.
23 . Liu M, Domen K, Chino N. Comorbidity measures for stroke outcome research. Arch Phys Med Rehabil 1997; 78: 166-72.
24 . Tsuji T, Liu M, Sonoda S, Domen K, Chino N. The stroke impairment assessment set. Arch Phys Med Rehabil 2000; 81: 863-8.