Embed Size (px)
Citation preview
i
The Strategic Challenges Facing UK Aviation: Assessing the future of UK air connectivity
Dr Rebecca DriverAnalytically Driven Ltd
November 2017
The Strategic Challenges Facing UK Aviation
ii
Published by the Independent Transport Commission
The Independent Transport Commission (ITC) is one of Britain’s leading research charities with a mission to explore all aspects of transport and land use policy. Through our independent research work and educational events we aim to improve and better inform public policy making. For more information on our current research and activities please see our website: www.theitc.org.uk
Independent Transport Commission 70 Cowcross Street London EC1M 6EJ
Tel No: 0207 253 5510 www.theitc.org.uk
Registered Charity No. 1080134 November 2017 © Copyright Independent Transport Commission
Acknowledgements:
This report was authored by Dr Rebecca Driver and Analytically Driven Ltd, with guidance from an ITC steering group comprising Dr Stephen Hickey, Professor Peter Jones OBE, Terry Hill CBE, Dr Matthew Niblett and Bright Pryde-Saha. The ITC would like to acknowledge its gratitude to all those who contributed to the ITC Call for Evidence, a list of contributors to which is given in the appendix to this report.
The ITC would also like to record its gratitude to its Core Benefactors, a list of whom can be found on the main ITC website (www.theitc.org.uk). Their generous support has made this research possible.
November 2017
INDEPENDENT TRANSPORT COMMISSION
3
INDEPENDENT TRANSPORT COMMISSION
UK aviation policy has been dominated for years - even decades - by the debate on whether and where to develop airport capacity in the South East. The Independent Transport Commission (ITC) has contributed actively through a series of reports. Now that the Government has announced its conclusions, the time is ripe to look forward. The ITC therefore commissioned this broader strategic review of the aviation sector, its wider significance for the UK, and the challenges that lie ahead.
Based on wide-ranging analysis and an external consultation exercise, the report highlights the importance of the aviation sector, and the global ‘connectivity’ it provides – for individuals and families, for businesses across the country, for the productivity of the UK economy, and more widely for jobs, skills and wages.
But it also reveals a paradoxical picture. An industry that is competitive and market driven yet very highly regulated. Price-conscious and fast-changing, it needs (and finances) long-term investment in key infrastructure. Attractive to new entrants and ‘disruptors’, its returns often seem poor. Global in nature, its biggest challenges are often local. And it is an industry fundamentally important to the UK, but on which public debate is polarised and often hostile.
The report highlights many of the challenges ahead for the industry and policymakers. Some are urgent, notably the need for a range of post-Brexit international aviation agreements (the complexities of which are highlighted). And the policy on new runway capacity still remains to be converted into action on the ground. But it is clear that resolving these immediate priorities will not be enough: Brexit will only increase the importance for the UK of strong global connectivity.
The report highlights future challenges around four main areas: the post-Brexit international regulatory regime; the continuing need for passenger and freight aviation capacity (not just in the South East, and not just in airports and on the ground); the crucial need to balance global connectivity with the impacts on local communities; and the role of the regulatory and tax regime in incentivising optimal behaviours, including sustainability, skills and consumer protection. Crossing these issues are questions around the planning and regulatory mechanisms necessary to balance national, regional and local priorities. How might these develop in the years ahead, and what more can be done to build public trust (all too often lacking today) around issues which are both enormously important and highly contentious?
There is much here for the industry, for Government and the wider community to consider. The Government itself has recently launched work on a longer-term aviation strategy. We hope that this report and its insights will inform that work.
Dr Stephen Hickey Commissioner, Independent Transport Commission Chair of the ITC Aviation Working Group
Foreword by Dr Stephen Hickey

The Strategic Challenges Facing UK Aviation
44
INDEPENDENT TRANSPORT COMMISSION
5
INDEPENDENT TRANSPORT COMMISSION
The Strategic Challenges Facing UK Aviation: Assessing the future of UK air connectivity
Contents
Foreword 3
List of Figures 8
List of Tables 10
Executive Summary 11
1. Introduction 15
1.1 The aviation sector and air connectivity 16
1.2 The wider policy debate on UK aviation strategy 17
1.3 The structure of this report 17
2. Why air connectivity matters for prosperity 19
2.1 The impact of air connectivity on economic outcomes 19
2.2 How is air connectivity measured? 21
Judging the air connectivity supported by airports 23
Surface access and connectivity 24
2.3 How does UK air connectivity compare? 25
A comparison of air connectivity in selected European countries 25
The customer perspective 31
Comparing the relative quality of freight processes 32
3. Delivering air connectivity – how the aviation sector operates 33
3.1 What makes up the aviation value chain? 33
Where is the value in the aviation value chain? 36
Former flag carriers versus low cost carriers 38
3.2 Trends in the supply and demand of aviation services 39
3.3 Output and employment in the global aviation sector 42
5
The Strategic Challenges Facing UK Aviation
6
3.4 The aviation sector in the UK economy 45
Employment in the UK aviation sector 46
Pay in the UK aviation sector 48
Growth and value added in the UK aviation sector 51
UK trade in aviation 54
3.5 Aviation and local communities in the UK 56
4. The regulatory challenges of air connectivity 61
4.1 Air connectivity and the environment 62
Aviation’s carbon footprint 62
Aviation and air quality 64
Noise and aviation 66
Incentives to upgrade fleets 67
Hub airports and the environment 69
4.2 Aviation and the UK planning regime 71
4.3 Safety, standard setting and the governance of international airspace 71
ICAO 73
The European Aviation Framework 73
The CAA 74
Managing airspace 74
4.4 Air Service Agreements, connectivity and the nine Freedoms of the Air 76
Nationality and ownership 78
Air Service Agreements and the EU aviation market 78
The intra-EU aviation market and the use of Freedoms of the Air in practice 79
4.5 Economic regulation and promoting competition 80
The impact of state aid rules in creating a level playing field 84
4.6 Taxing aviation 85
5. Consultation feedback on key issues for the sector 86
5.1 Background to the Independent Transport Commission’s Call for Evidence 86
5.2 The UK aviation sector’s strengths and weaknesses 87
5.3 The prospects for growth 87
5.4 Brexit 88
5.5 Customer expectations and perceptions of the sector 89
INDEPENDENT TRANSPORT COMMISSION
7
5.6 Air connectivity: airspace management and transport links 90
5.7 The regions 91
5.8 Environmental issues 91
5.9 Regulation and tax 92
6. Looking to the future: strategic challenges for UK aviation 93
6.1 Challenge 1: Brexit, Air Service Agreements and the aviation sector 94
Brexit and barriers to trade in the aviation manufacturing sector 94
Brexit and non-tariff barriers in the aviation services sector 95
The implications of renegotiating Air Service Agreements under Brexit 96
Do all countries need their own airlines? 98
6.2 Challenge 2: Providing the capacity to support global connectivity 99
Will Heathrow expansion fix aviation capacity constraints? 100
Could the effectiveness of the UK’s planning regime be improved? 102
How to pay for change? 103
6.3 Challenge 3: Aviation as a local business 104
Becoming better local partners 105
Independent Commission on Civil Aviation Noise 105
6.4 Challenge 4: Incentives and innovation in the aviation sector 106
Innovation and aviation manufacturing 106
Does Air Passenger Duty create the right incentives? 107
Innovation and the quality of connectivity 108
Competition and the sustainability of the aviation business model 109
7. Conclusions 110
Appendix 1 References 112
Appendix 2 Abbreviations and definitions 115
Appendix 3 Questionnaire used in the ITC’s consultation on the strategic challenges for UK aviation 120
Author Profile 122
Disclaimer 122
The Strategic Challenges Facing UK Aviation
Figure 1. Mapping global aviation networks 23
Figure 2. Average travel time to the alpha-cities by region, 2015 25
Figure 3. Top 10 European countries for Direct and Indirect Air Connectivity in 2017 26
Figure 4. Airport connectivity compared to hub connectivity, selected European countries, 2017 27
Figure 5. Change in connectivity indices relative to Germany, 2007 to 2017 28
Figure 6. Intra-EU air connectivity in 2017Q1 by region, percentage of EU population reachable via a direct flight 29
Figure 7. Executives’ opinions of the quality of their country’s air transport infrastructure, selected countries, 2017 31
Figure 8. The aviation value chain 34
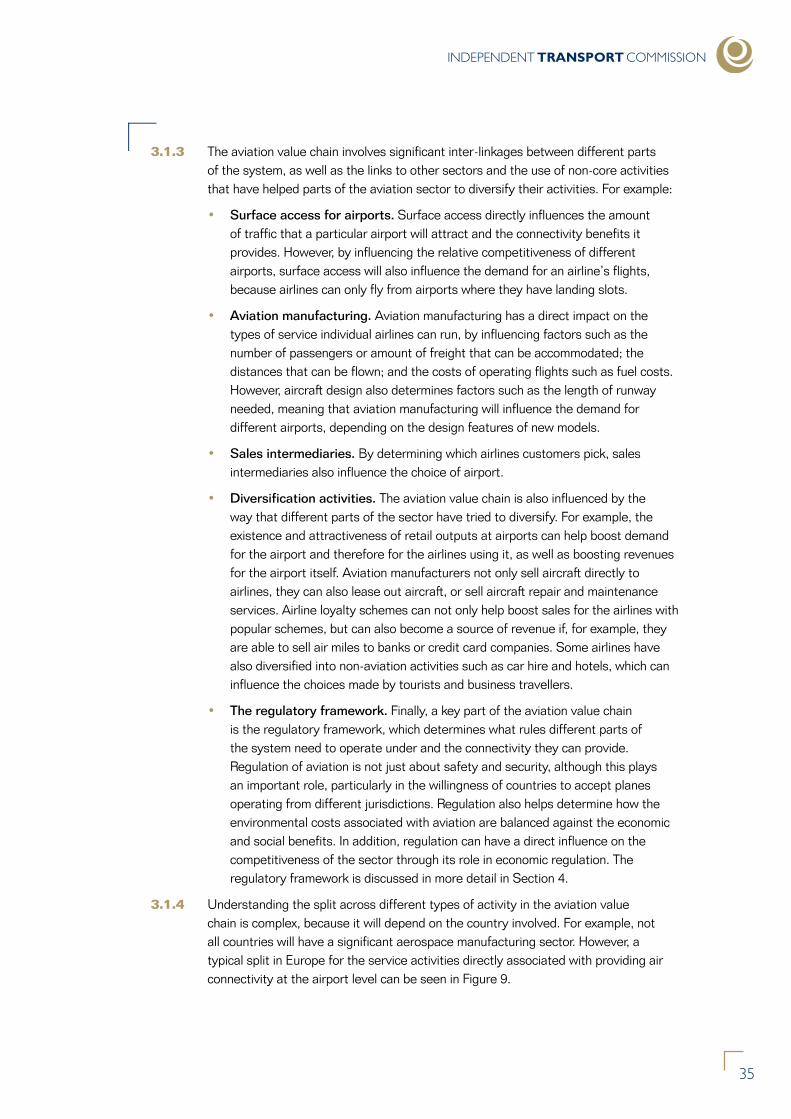
Figure 9. The employment split across activities at a typical European airport 36
Figure 10. Capital investment by air transport value chain sectors, 2011 37
Figure 11. Return on invested capital in the commercial air transport value chain, 2004-2011 37
Figure 12. Examples of ancillary revenue sources at airline level, 2016 38
Figure 13. The evolution of the average price of air travel since 1950, US dollars per revenue tonne kilometre in real terms 39
Figure 14. Income per capita and the global propensity to travel by air, 2012 40
Figure 15. Change in world passenger and cargo revenue kilometres compared to world economic growth, 2005-2016 40
Figure 16. Share of the population in England taking flights abroad, 2006-16 41
Figure 17. Revenue tonne kilometres (passenger, freight and mail) (mn) on scheduled services by country, 2016 42
Figure 18 . Output supported by aviation, selected countries, 2014 43
Figure 19. Employment supported by aviation, selected countries, 2014 44
8
List of Figures
INDEPENDENT TRANSPORT COMMISSION
9
Figure 20 . GDP per employee supported by aviation, selected countries, 2014 45
Figure 21. Employment split in the UK aviation sector in 2016 46
Figure 22. The employment structure of UK airlines in 2005 and 2015 47
Figure 23. UK exports and imports of transportation services by destination, 2015 55
Figure 24. Use of regional airports in July 2017, compared to UK share of population 56
Figure 25. Intra-EU air connectivity in 2017Q1, percentage of EU population reachable from each NUTS 3 area via a direct flight 57
Figure 26. Source of CO2 emissions within the aviation sector 62
Figure 27. Trends in emissions in the aviation sector 63
Figure 28. Mode of travel used by passengers travelling to and from the UK’s busiest airports (%) 66
Figure 29. Land area and population within the 57dBA Noise Contour at Heathrow 67
Figure 30. Aircraft efficiency gains since 1955 67
Figure 31. When will using an older fleet make sense? 68
Figure 32. Comparison of the network map for direct versus hub services between Europe and North America 70
Figure 33. Aviation accidents by type of plane and region, average 2011-15 72
Figure 34. Categorisation of intra-EU15+2 flights by freedom of the air for selected European carriers, 2001-2013 80
Figure 35. Competition on routes by region, 2004 to 2014 81
Figure 36. Intra-EU air connectivity in 2017Q1: Number of carriers, average to all EU destinations from each NUTS 3 area via a direct flight 82
Figure 37. Intra-EU air connectivity in 2017Q1: Flight choice per day, average to all EU destinations from each NUTS 3 area via a direct flight 83
Figure 38. A Pictorial description of the nine Freedoms of the Air 96
Figure 39. Identifying the trade-off between noise and emissions for aviation 106
Figure 40. Air freight on passenger aircraft versus freighters 108
10
The Strategic Challenges Facing UK Aviation
Table 1. Number of employees and gross hourly pay in the aviation sector compared to the rest of the economy, 2016 and 2011 49
Table 2. Comparison of hours worked and gross annual pay in the aviation sector compared to the rest of the economy in 2016 50
Table 3. Output and employment in the UK aviation sector 52
Table 4. Growth in the UK aviation sector between 2004 and 2014 53
Table 5. Output, GVA and employment multipliers in the UK aviation sector 54
Table 6. Distribution of aviation sector employment at Mid-layer Super Output Area level in 2016 58
Table 7. Employment patterns in the location of Top 10 Airports in England 60
Table 8. Commuting patterns in the location of Top 10 Airports in England 65
Table 9. Simplified hub model impact on CO2 emissions 69
Table 10. Proportion of connecting routes where selected European airports face competition 84
Table 11. Air Passenger Duty in Great Britain 85
Table 12. Freedoms of the Air and examples of the change to ASAs needed to preserve post-BREXIT route choices for flights between the UK, EU and third countries 97
Table 13. Capacity constraints and passenger numbers at England’s airports 101
List of Tables
INDEPENDENT TRANSPORT COMMISSION
11
1 The process of upgrading the UK’s aviation infrastructure has begun. Since the start of 2017, the UK Government has consulted on both the implementation of the Airports Commission’s recommendation to provide a third runway at Heathrow, and on the options for improving the management of UK airspace. More recently, it has also begun a two year process aimed at identifying what the UK’s aviation strategy should look like in future, and on October 24th 2017 launched a consultation on the Revised Draft Airports National Policy Statement.
2 In light of the Government’s decision to address some of the capacity issues affecting UK aviation, the Independent Transport Commission (ITC) considered that it was time to review the policy needs of the aviation sector, and how these needs will influence outcomes in other policy areas. To inform the policy debate, the ITC therefore undertook a Call for Evidence to assess the views of key industry players and observers, and commissioned Analytically Driven Ltd to address two questions, namely:
• What does the evidence suggest about the state of the UK’s air connectivity, how the aviation sector itself operates, and the regulatory challenges associated with providing air connectivity?; and
• Looking to the future, what are some of the key strategic challenges facing the UK aviation sector that will influence both air connectivity and the wider policy impacts of aviation?
Air connectivity
3 This report focuses on air connectivity, rather than simply the aviation sector, because air connectivity has important benefits over and above output and employment within the aviation sector itself, or even the induced impact of aviation on demand in sectors like tourism. In particular, good air connectivity helps foster collaboration between people and firms; makes it easier for firms to operate and trade effectively in multiple locations; and supports global supply chains by managing time sensitivities. Improvements in air connectivity therefore have measurable impacts on how economic activity is structured and the benefits that flow from it. In other words, for a given amount of spending on aviation, improvements in the quality of air connectivity will allow other sectors to operate more effectively, even though the amount of aviation spending has not changed. From a policy perspective therefore, the quality of air connectivity has key implications for the functioning of the UK economy.
Executive Summary
The Strategic Challenges Facing UK Aviation
1212
4 The different dimensions to air connectivity mean that it is hard to combine all these issues into a single measure. In general, though, the evidence suggests that UK air connectivity is relatively strong, with the UK ranking in the top 5 in Europe on a range of connectivity measures and first for direct connectivity in 2017. However, when it comes to hub connectivity London Heathrow is the only UK airport to rank highly. This compares, for example, to Germany, where both Frankfurt and Munich airports score well. In addition, the UK does poorly when executives are asked about perceptions of its air transport infrastructure compared to elsewhere (ranking only 28th). The UK also scores less strongly in measures of air freight connectivity.
The aviation value chain
5 Good air connectivity depends on the health and effectiveness of different parts of the aviation value chain. Here the picture is somewhat mixed. On the one hand, aviation is a major global industry and a key contributor to the UK economy at both a national and local level. For example, the aviation sector accounts for 1.1% of UK employment, roughly evenly split between manufacturing and service activities, and pay across the sector is significantly above the UK average. The aviation sector as a whole also accounts for around 2.0% of UK output, or roughly £62.8bn, of which £26.8bn is from the aviation manufacturing sector, £20.3bn from the air transport services sector and the remainder from the operation of airports.1 The sector also accounts for 6.2% of UK exports, of which around 4.5% are generated within the manufacturing sector.
6 At a local level, major UK airports also act as a significant source of local employment. For example, of the 7,201 mid-layer super output areas in England, the area that contained Heathrow ranked as 14th in terms of net employment opportunities, with Gatwick ranking as 50th and Manchester as 75th.
7 However, from the perspective of the firms operating within the sector, the evidence suggests that key parts of the aviation value chain face significant challenges, with the return on capital invested in the sector persistently averaging below the sector’s weighted average cost of capital, particularly for airlines.
Regulating aviation
8 While air connectivity is beneficial, the aviation sector creates a range of regulatory challenges, including the need to balance the interaction between national and local interests. For example, hub airports significantly reduce emissions for the aviation sector as a whole, but in doing so can create problems with noise, congestion and air quality at a local level. Indeed, in the case of the top 10 airports in England, for example, average commuting distances for workers in the area were significantly above the national average, and in addition a much higher proportion of workers used a car to drive to work.
1 Output for the operation of airports is estimated from employment shares. This sector excludes non-aviation employment at airports, such as retail services and government agencies.
INDEPENDENT TRANSPORT COMMISSION
13
9 It is not just environmental and planning issues that present challenges for the regulation of aviation. Safety and security are also key issues for regulators. Another key issue is the need to promote competition within the sector, which brings significant benefits in terms of lower prices. In addition, international air travel is governed by bilateral Air Service Agreements (ASAs) between countries, rather than WTO rules, meaning that the quality of the air connectivity that national airlines can support is determined by the quality of the network of ASA treaties for their country, including how many of the nine Freedoms of the Air are permitted.
Identifying key strategic challenges for the aviation sector
10 Given the evidence, this report identifies four broad policy areas that represent strategic challenges for the aviation sector and are therefore likely to shape the future of UK aviation and air connectivity. The list is by no means definitive and the challenges are clearly interlinked. However, they represent some of the key themes that emerged in the analysis.
11 Furthermore, while several of the challenges have been triggered by some of the more immediate issues facing the sector, in each case how these issues are addressed will potentially have profound long-term implications for the future of UK aviation and air connectivity.
Brexit, Air Service Agreements and the aviation sector
12 Brexit will have a significant impact on the regulatory framework governing trade in aviation, particularly for the UK’s ability to participate in cross-border EU aviation initiatives; the potential to create non-tariff barriers; and the UK’s ability to maintain the same level of air connectivity. For example, a key determinant of the UK’s air connectivity will be the permissions associated with international Air Service Agreements (ASAs), which will need to be renegotiated once the UK leaves the EU. This is complex, because of ASAs’ reliance on rules covering the national ownership of airlines. These mean that in order for the UK to be able to maintain the same level of air connectivity post-Brexit, not only will the UK need to renegotiate its ASAs with third countries, but the EU will have to as well.
13 This therefore raises the question as to whether the global regulatory framework governing trade in aviation, which largely relies on bilateral ASAs, is effective and in particular whether national ownership rules make sense. While the pressures of Brexit and the rise of Trump’s America First agenda might make it a difficult time to institute changes to the rules underpinning aviation, the need to make changes to address Brexit makes now a good time to ask difficult questions. Furthermore, the answers to these questions could help inform the strategic choices that the UK and other governments will need to make.
The Strategic Challenges Facing UK Aviation
14
Providing the capacity to support global connectivity
14 While progress has been made on enabling Heathrow expansion, as well as on the issue of how to upgrade the UK’s management of its airspace, the question remains as to whether the UK is effective at planning to deal with capacity constraints in aviation. Evidence suggests that while the proposed third runway at Heathrow will ease capacity constraints in the short run, looking further ahead capacity constraints are again likely to be evident, including at key regional airports. The UK’s ability to address these capacity needs will depend on whether the UK has an effective planning regime at both a national and local level. This means, for example, that it could be helpful to assess whether lessons can be learnt from the experience of the Airports Commission. As surface access options have an important impact on air connectivity, it also means that it will be important that the national planning regime supports a joined up approach to considering infrastructure, to maximise the potential benefits of chosen options. Similarly, if the UK is to ensure it has the right infrastructure, it is also important to assess whether reliance on private sector financing of aviation capacity will always meet the UK’s needs. The benefits of air connectivity go beyond the output of the aviation sector and there are also low returns on invested capital within the aviation sector, meaning in some circumstances relying purely on private sector financing of aviation capacity might create an undersupply.
Aviation as a local business
15 While aviation is important for the air connectivity it provides, aviation businesses themselves tend to be geographically concentrated. This creates important interactions between the aviation sector and local areas where it is based. For example, while the aviation sector brings key benefits to the areas where it is based, in particular connectivity and jobs, these need to be offset against costs such as pollution and noise. Therefore, could the aviation sector do more to influence these trade-offs, for example by working to reduce roadside pollution levels? Similarly, will the Government’s new Independent Commission on Civil Aviation Noise be able to balance competing interests effectively, including the trade-off between noise and emissions, in order to reduce local tensions?
Incentives and innovation in the aviation sector
16 All sectors need to innovate in order to thrive and there can be a variety of motivations for innovation to take place, including competition, tax incentives, and regulatory change. An important question for the aviation sector is whether the incentives to innovate within the sector are effective. For example, does UK air passenger duty provide the right incentives both to reduce emissions and to support air connectivity to destinations outside Europe? What are the implications of the sustainability of the business model operated by firms within the aviation sector for issues such as fleet upgrades? Does Brexit provide an opportunity for the UK to improve its air freight connectivity? Do the needs of the aviation manufacturing sector, or indeed the aviation service sector, have any specific implications for UK Government policy on issues such as education or immigration, in order to ensure the sector has access to the necessary skills?
INDEPENDENT TRANSPORT COMMISSION
15
1. Introduction
1.0.1 The issue of how to expand airport capacity in London and the South East has dominated the UK Government’s aviation policy for some time. However, in February 2017, the UK Government launched a consultation into its “Draft Airports National Policy Statement: new runway capacity and infrastructure at airports in the South East of England”.2 The aim of this consultation was to start the process of implementing the recommendation of the Airports Commission, namely that provision of a third runway at Heathrow Airport was the preferred approach to expanding airport capacity in London and the South East.On October 24th 2017 the UK Government launched a consultation on the Revised Draft Airports National Policy Statement, as the next step in this process.3
1.0.2 In light of the UK Government’s decision to proceed with Heathrow expansion, the Independent Transport Commission (ITC) considered that it would be a good time to undertake a broad-based assessment of the UK aviation sector and aviation policy - one that looked beyond airport expansion in the South East.4 The ITC therefore commissioned Analytically Driven Ltd to assess the strategic challenges facing both UK aviation and UK air connectivity, as well as to identify where further research into the policy issues identified might be beneficial. A key input into this research has been a Call for Evidence undertaken by the ITC, in order to solicit feedback from key industry players and observers. The ITC worked with Analytically Driven to design the Call for Evidence, and the consultation took place between May and August 2017.
1.0.3 The purpose of this report is twofold. Firstly, it presents the analysis that was undertaken on the state of UK air connectivity and the UK aviation sector, together with the findings from the Call for Evidence, to help inform the policy debate. Secondly, the report uses this analysis to help identify both the key strategic challenges facing the sector, as well as any gaps where further research would be beneficial.
1.0.4 The decision to focus on both air connectivity and the UK aviation sector reflects the fact that good air connectivity has important benefits that go beyond simply the output, income and employment directly attributable to the aviation sector itself. Therefore, by examining both the sector itself and its wider implications for air connectivity, this report also illustrates how the aviation sector and aviation policy will influence three key challenges facing the UK, as well as the trade-offs between them, namely: supporting prosperity; facilitating a national rebalancing to help reduce inequality; and protecting and enhancing the environment.
2 https://www.gov.uk/government/uploads/system/uploads/attachment_data/file/588764/draft-airports-nps-web-version.pdf.
3 See Department for Transport (2017b).
4 Based on similar reasoning, the UK Government also launched a consultation on the future of UK aviation in July 2017, see HM Government (2017). The aim is therefore that these two pieces of work should be complementary.
The Strategic Challenges Facing UK Aviation
1616
1.1 The aviation sector and air connectivity
1.1.1 Aviation is a major global industry. Estimates suggest that 3.37 million people worldwide are employed in sectors directly involved in providing air transport services, namely the running of airports, airlines and air navigation services. Alongside this, an additional 1.1 million people are employed designing and building the aircraft needed to run these services. On top of the jobs directly linked to aviation activities, a further 5.5 million people are employed in other on-airport jobs such as retail, car hire and government agencies. Combined with the impact of aviation on tourism demand, in total around 62.7 million people worldwide rely on aviation for their jobs.5
1.1.2 In the UK, the aviation sector alone accounts for around 1.1% of employment (roughly evenly split between manufacturing and service activities). The aviation sector as a whole also accounts for around 2.0% of UK output, or roughly £62.8bn, of which £26.8bn is from the aviation manufacturing sector, £20.3bn from the air transport services sector and the remainder from the operation of airports. It also accounts for 1.7% of employee compensation, 2.0% of UK total output, 1.4% of UK gross value added (GVA) and 6.2% of UK total exports.6 As such, the sector is a major contributor to the UK economy, including as a source of jobs that typically pay well above the national average.
1.1.3 As this report identifies, however, over and above the aviation sector’s measured share of jobs and output, or even the induced impact of aviation on demand in sectors like tourism, air connectivity itself plays an important role in how the world (and the UK) economy functions. This is because good air connectivity helps foster collaboration between people and firms; makes it easier for firms to operate and trade effectively in multiple locations; and supports global supply chains by managing time sensitivities. Improvements in air connectivity such as the introduction of direct flights, an increase in the number of flights offered, or increased competition from low cost airlines can be shown to have measurable impacts on how activity in economies is structured and the benefits that flow from it. In other words, for a given amount of spending on aviation, improvements in the quality of air connectivity will improve the ability of other sectors to operate effectively, even though the amount of aviation spending has not changed. From a policy perspective therefore, the quality of air connectivity has key implications for the functioning of the UK economy.
5 See ATAG (2016).
6 These estimates are based on air transport services linked to the running of airports, airlines and air navigation services, together with manufacturing activities linked to aviation. The estimates exclude the additional jobs linked to on-airport employment (such as retail, car hire and government agencies), as well as the impact of aviation on other sectors such as tourism. Data for output, GVA and exports for the service activities incidental to air transportation sector (the operation of airports) are not provided separately with the input-output tables and have therefore been estimated using the sector’s share of employment (of 38%) within the warehousing and support services for transportation sector.
INDEPENDENT TRANSPORT COMMISSION
17
1.2 The wider policy debate on UK aviation strategy
1.2.1 It is not just the ITC that has identified that, after years of focusing on the question of airport expansion in the South East, now would be a good time to undertake an assessment of the UK’s aviation strategy. Based on similar reasoning, the UK Government also launched a consultation on the future of UK aviation in July that ran until 13 October 2017.7 The Government’s consultation was designed to be the first of a series of consultations that will take place between 2017 and 2018, and focused on how the Government’s aviation strategy should address six key objectives, which were to:
• help the aviation industry work for its customers;
• ensure a safe and secure way to travel;
• build a global and connected Britain;
• encourage competitive markets;
• support growth while tackling environmental impacts; and
• develop innovation, technology and skills.
1.2.2 This research is clearly complementary to the Government’s consultation, as both look to identify the strategic challenges around aviation. In addition, this report draws together a significant body of evidence about how the sector functions at both a global, national and local level that can be used to inform the Government’s strategy.
1.2.3 Furthermore, although the ways in which the strategic challenges are framed within this report differ from the approach taken by Government, there is significant commonality in the two approaches. However, there is one issue that has been addressed in this report that was explicitly ruled out of the Government’s consultation, namely Brexit. The reason for including it here is both that Brexit will have a clear impact on the sector’s ability to address other strategic challenges and because Brexit raises questions about the effectiveness of the system of Air Service Agreements that govern international aviation.
1.3 The structure of this report
1.3.1 Given the importance of the UK aviation sector, as well as the wider strategic benefits that flow from good air connectivity, the purpose of this report is to provide an assessment of the strategic challenges facing the UK aviation sector and UK air connectivity. The aim is to provide a broad overview of the role of air connectivity, the global aviation sector and how the UK fits within it and to draw this together to highlight the key issues that will shape the evolution of UK aviation and air connectivity going forward and the implications of this for UK policy. The report also looks to identify areas where further research would be valuable.
7 See HM Government (2017).
The Strategic Challenges Facing UK Aviation
18
1.3.2 To provide insight, the analysis draws on three different types of information: published material by academics, policymakers and relevant industry organisations; existing data sources; and the results of the ITC’s recent Call for Evidence on the strategic challenges for UK aviation. The analysis is structured as follows:
1.3.3 Section 2 provides an assessment of what air connectivity is; why it matters; and how UK air connectivity compares to the connectivity achieved by other countries.
1.3.4 As good air connectivity depends on the health and effectiveness of the aviation sector, Section 3 draws together evidence on how the aviation sector functions. It starts by reviewing the evidence on how the different parts of the aviation value chain fit together and what their role is in promoting air connectivity. It then examines some of the key trends that have shaped demand for aviation. Finally, it reviews the evidence on the role of aviation in the economy at a global, UK and local community level.
1.3.5 Having looked at how the aviation sector functions, Section 4 then turns to the question of identifying the regulatory challenges associated with promoting good air connectivity, including: the environmental constraints that the sector faces; the intersection between aviation and planning policy; how safety issues and standard setting are handled, including for the governance of international airspace; how Air Service Agreements between countries and the choice of which of the nine freedoms of the air are permitted helps determine the quality of the connectivity achieved, including the ability of airport hubs to operate; the importance of economic regulation and promoting competition within the sector; and the impact of the tax regime.
1.3.6 Section 5 provides an analysis of the findings of the Call for Evidence undertaken by the ITC between May and August 2017 on the strategic challenges for UK aviation covering feedback on: the sector’s strengths and weaknesses; the prospects for growth; Brexit; customers’ expectations and perceptions of the sector; the UK’s air connectivity and the importance of both airspace management and transport links; the regions; the environment; and regulation and tax.
1.3.7 Section 6 draws on the analysis from the previous sections in order to highlight four strategic challenges that will shape UK aviation and UK air connectivity in future, namely: the impact of Brexit on how the UK approaches aviation policy, including Air Service Agreements; how to improve the system of planning for aviation capacity; the implications for the aviation sector of being a local, geographically concentrated business and the sector’s ability to balance costs and benefits at both a local, national and global level; and the need to ensure incentives, such as tax, are effectively aligned to support innovation in the sector, including the incentives to reduce the sector’s environmental impact at the same time as improving its ability to support good air connectivity.
1.3.8 Finally Section 7 presents some conclusions.
1.3.9 In addition, Appendix 1 contains a list of the reports referred to in the analysis; Appendix 2 provides a list of the definitions of any abbreviations or key terms used in the report; and Appendix 3 details of the ITC’s Call for Evidence.
INDEPENDENT TRANSPORT COMMISSION
19
2. Why air connectivity matters for prosperity
2.0.1 Connectivity matters. To flourish businesses need to be able to connect with both existing and potential customers and ensure that their goods and services are delivered to the right place at the right time. Connectivity also has important social benefits, because it allows people to keep in touch with friends and family and to explore new horizons through travel. Not all connectivity is physical – the internet has opened up dramatic new ways of staying in touch. However, physical connectivity, which enables people and things to move between places, is essential and continues to grow in importance.
2.0.2 A key benefit of aviation is that it facilitates connectivity, particularly over longer distances, meaning that achieving good air connectivity is an important goal if economies are to prosper. This section therefore reviews the evidence on air connectivity. It starts by examining how air connectivity can influence economic outcomes, to demonstrate some of the ways that air connectivity can contribute to economic success beyond simply measuring the output of the sector itself. The next part of the section addresses the question of what air connectivity means in practice, and the different ways that it can be defined, including questions such as: whether measurements should be purely based on onward travel; whether measurements should also consider inwards travel to capture how effectively airports operate as hubs; and the importance of surface access for air connectivity. The final part of the section then assesses the evidence on how UK air connectivity compares to air connectivity elsewhere.
2.1 The impact of air connectivity on economic outcomes
2.1.1 Good air connectivity has important and positive impacts on both economic and social outcomes through its impact on how businesses function and the ability of people around the world to stay in touch and forge new connections. In the case of economic outcomes, the benefits of good air connectivity are over and above the output, income and employment directly attributable to the aviation sector itself. Indeed, the overall benefits of good air connectivity on economic outcomes are also more complex than can be measured simply using the spending multipliers associated with spending in the aviation sector – in other words, measures that capture not just spending on aviation, but the knock-on effects that this spending has on spending in other sectors.
2.1.2 This is because air connectivity is not simply a function of the amount of money spent on aviation itself (or even the amount of money that is spent as a result of any spending on aviation). Instead air connectivity measures the effectiveness of the air transport network’s ability to support people and firms in their own activities.
The Strategic Challenges Facing UK Aviation
2020
2.1.3 In other words, for a given amount of spending on aviation, improvements in the quality of air connectivity will improve the ability of other sectors to operate effectively, even though the amount of aviation spending has not changed. This means that the quality of air connectivity influences not just the amount of activity that takes place, but the effectiveness of that activity and the amount of innovation that is supported. Examples of the wider benefits of air connectivity on economic outcomes include:8
• Trade: The costs of crossing a border in order to export either goods or services are significant and relate to far more than simply tariff costs, as non-tariff barriers are typically much higher.9 Improvements in air connectivity can help reduce these costs, both by making it easier to meet potential clients and by improving air freight options. Overall, the evidence suggests that having a direct flight between cities compensates for around 10% of the negative effects of international borders.10 Therefore improvements in air connectivity, for example facilitated by international air service agreements, can have an important impact on the cost of trade, making it easier for firms to enter new export markets and maintain existing ones.
• Global supply chains: The impact of the quality of air connectivity on geographic barriers is not just about communication. It also plays an important role in delivery times. On average it takes 20 days for a cargo ship to reach the US from a European port and 30 days to reach Japan.11 Distance therefore plays a key role in firms’ abilities to deliver their products in the sort of timescales that allow them to be competitive. Estimates suggest that the impact on demand for each day a good spends in transit is equivalent to applying a value added tax of between 0.6 to 2.1 percent. Furthermore, the most time-sensitive trade flows are those involving the parts and components trade.12 Therefore, air connectivity plays a particularly important role in facilitating global supply chains because it can help to overcome the impact of distance on delivery times.
• Investment: When firms are investing in more than one location, whether overseas or domestically, a key factor in the decision to invest is how well connected the location is, compared to their headquarters. In the US, for example, the introduction of a new airline route between two Metropolitan Statistical Areas has been found to lead in a 4.6% increase in total venture capital investments as well as a 2.5% increase in the likelihood of venture capital activity between the two Metropolitan Statistical Areas. Furthermore, it is not just the amount of investment that increases following the introduction of new airline routes, the likelihood of any investment being successful (calculated using a variety of different measures) is also improved.13 As such, improvements in air connectivity achieved through the introduction of new routes will help improve investment performance.
8 See Driver (2015) for a more comprehensive analysis of the links between air connectivity and the economy.
9 See, for example, the discussion in Anderson and van Wincoop (2004) and Driver (2014).
10 Yilmazkuday and Yilmazkuday (2017).
11 See Hummels and Schaur (2013).
12 See Hummels and Schaur (2013).
13 Bernstein et al (2016).
INDEPENDENT TRANSPORT COMMISSION
21
• Foreign Direct Investment (FDI): It is not just the number of routes that is important for investment decisions – the number of flights also matters. Air connectivity has an important impact on where firms undertaking foreign direct investment choose to set up their headquarters, because easy access is important for managing an enterprise with locations around the world. In practice estimates suggest that a 10% increase in the number of intercontinental flights leads to a 4% increase in the number of headquarters located in the corresponding urban area.14 These effects are particularly strong for firms involved in knowledge-intensive activities.
• Collaboration: Finally, the quality of air connectivity is also influenced by the cost of travel, which is in part a function of the degree of competition in the market. This is important because face-to-face meetings are important for communicating complex ideas, meaning the cost of travel influences the ability of people and firms in different locations to collaborate together on research. The impact of this can be illustrated using the example of scientific collaboration amongst US faculty members in chemistry departments between 1991 and 2012 and the impact of the introduction of new routes by the low cost carrier Southwest Airlines. Analysis shows that when Southwest Airlines added a new route not only did fares drop on average by 20%, but there was a 50% increase in scientific collaboration as a result. This influence is even stronger when weighting the collaboration by its future impact, and particularly benefits younger and more productive researchers.15
2.1.4 These examples demonstrate that economic outcomes can benefit significantly from improvements in the quality of air connectivity. However, each example also used a different aspect of the air transport network’s performance in its analysis, meaning that there is no simple measure that will encompass all the attributes of air connectivity that might be important for economic outcomes. This raises the question, what are the important components that make up air connectivity and how can it be measured?
2.2 How is air connectivity measured?
2.2.1 In practice, from a customer perspective good air connectivity depends on:
• The range of destinations available from their location. Having more destinations on offer, especially with direct flights, improves access to different markets;
• The frequency of flights to each destination. Having more frequent flights to a destination improves flexibility by allowing people to choose when they travel and by giving freight companies (particularly express couriers) more options to meet their deadlines;
14 See Bel and Fageda (2008).
15 Catalini et al (2016).
The Strategic Challenges Facing UK Aviation
22
• The cost of flights in terms of both time and money. If flights are expensive then, even if the routes exist, fewer people will be able to take advantage of them. Similarly the longer it takes to reach a destination, the less likely it is that people will choose to travel there. Good connectivity therefore depends on keeping these costs down;
• The range of flight options available. Not everyone wants to fly on a no frills airline, or can afford to indulge in first class travel, therefore the ability of an airport to cater to a range of different tastes and budgets will increase the likelihood that people will use it;
• The timing of flights to each destination. For business travellers and freight operators the timing of flights has important business implications – flights at the wrong times will not allow travellers to make meetings without staying overnight, or ensure that packages can meet their overnight delivery targets;
• The reliability of the air transport network. If flights are unreliable then this will have a negative impact on customers’ ability to use services effectively, particularly in the case of business travellers and freight operators. So for good connectivity the system needs to have sufficient capacity to be resilient;
• The quality of the airport experience. How an airport is run, including the speed of the check-in process and security checks at an airport and the range of duty-free shops on offer, all have an impact on people’s perceptions of how easy and pleasant it is to travel, and therefore the likelihood that they will do so. Similarly, having high quality freight facilities, which are not only well designed and equipped, but also conveniently positioned for transit and custom checks, is equally important to enable freight companies to operate efficiently;
• The accessibility of the airport. If airports are hard to reach by potential travellers, or it takes a long time to reach them, it discourages people from using them; and
• The number of airports that are easily accessible. Easy access to more than one airport will increase the range of flights available.
2.2.2 From a public policy perspective, therefore, all these issues need to be included in the mix when assessing the effectiveness of the local air transport network.
2.2.3 However, the different dimensions to air connectivity mean that it is hard to combine all these issues into a single measure, especially as the number of factors that need to be assessed can multiply significantly. For example, a study of air connectivity in 25 European Union member states plus Switzerland, Norway and Iceland in September 2008 involved assessing scheduled passenger flights for 224 airlines, 485 airports, 5,200 routes, 17,000 flights, almost 74,000 indirect connections and around 2.5 million seats a day.16
16 Burghouwt and Redondi (2013). The EU members excluded Bulgaria, Romania and Croatia.
INDEPENDENT TRANSPORT COMMISSION
23
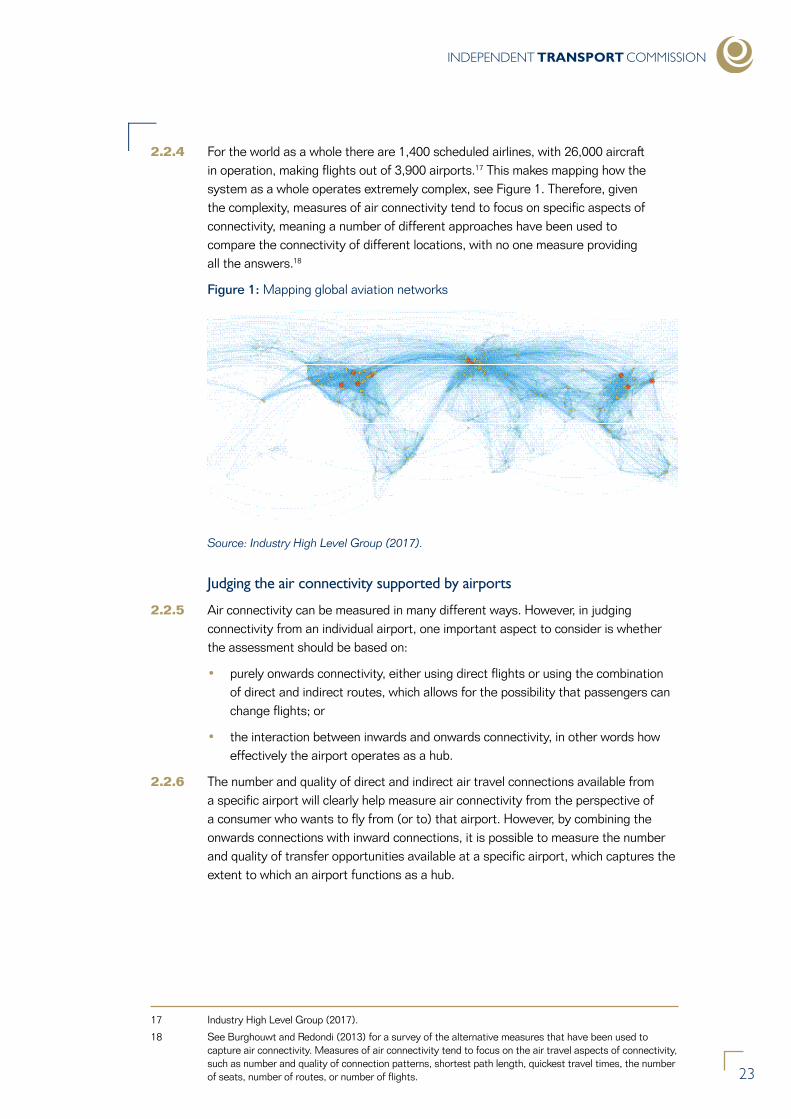
2.2.4 For the world as a whole there are 1,400 scheduled airlines, with 26,000 aircraft in operation, making flights out of 3,900 airports.17 This makes mapping how the system as a whole operates extremely complex, see Figure 1. Therefore, given the complexity, measures of air connectivity tend to focus on specific aspects of connectivity, meaning a number of different approaches have been used to compare the connectivity of different locations, with no one measure providing all the answers.18
Figure 1: Mapping global aviation networks
Source: Industry High Level Group (2017).
Judging the air connectivity supported by airports
2.2.5 Air connectivity can be measured in many different ways. However, in judging connectivity from an individual airport, one important aspect to consider is whether the assessment should be based on:
• purely onwards connectivity, either using direct flights or using the combination of direct and indirect routes, which allows for the possibility that passengers can change flights; or
• the interaction between inwards and onwards connectivity, in other words how effectively the airport operates as a hub.
2.2.6 The number and quality of direct and indirect air travel connections available from a specific airport will clearly help measure air connectivity from the perspective of a consumer who wants to fly from (or to) that airport. However, by combining the onwards connections with inward connections, it is possible to measure the number and quality of transfer opportunities available at a specific airport, which captures the extent to which an airport functions as a hub.
17 Industry High Level Group (2017).
18 See Burghouwt and Redondi (2013) for a survey of the alternative measures that have been used to capture air connectivity. Measures of air connectivity tend to focus on the air travel aspects of connectivity, such as number and quality of connection patterns, shortest path length, quickest travel times, the number of seats, number of routes, or number of flights.
The Strategic Challenges Facing UK Aviation
24
2.2.7 While good connectivity measured using onwards connections only will be what matters from the perspective of local consumers, an airport’s position as an effective hub offers additional benefits, including:
• the number of jobs that the airport will be able to support, with more passengers supporting more jobs;19
• the ability to introduce and support flights to less frequently used destinations. By combining passengers from several locations hub airports are able to generate sufficient demand to support less popular routes, which also benefits the hub’s local customers by increasing the number of destinations which they can fly to directly;20 and
• the ability to limit the environmental impacts for the system as a whole associated with supporting a given number of journeys.21
2.2.8 In the case of both indirect onwards connectivity (where customers need to change flights) and the operation of hubs, what will be important is not just the number of potential connections, but also their quality (for example the amount of time between flight connections, the number of changes needed to reach a destination and the total journey length). In general, compared to measures that adjust for quality, simple size based measures (such as number of flights, number of routes or offered seats) can underestimate the onwards connectivity available, because, for example, a minor airport can achieve good connectivity, if it has sufficient flights to a major hub airport. Similarly, simple size based measures tend to overestimate the importance of airports as connecting hubs, because the multiplier characteristics of hub operations means that as size increases hub connectivity will increase more than proportionately.22
Surface access and connectivity
2.2.9 Most measures of air connectivity focus purely on air travel issues, such as the number and quality of connection patterns, shortest path length, quickest flight times, the number of seats, number of routes, or number of flights.23 However, it is important to recognise that surface access to airports also plays a very important role.
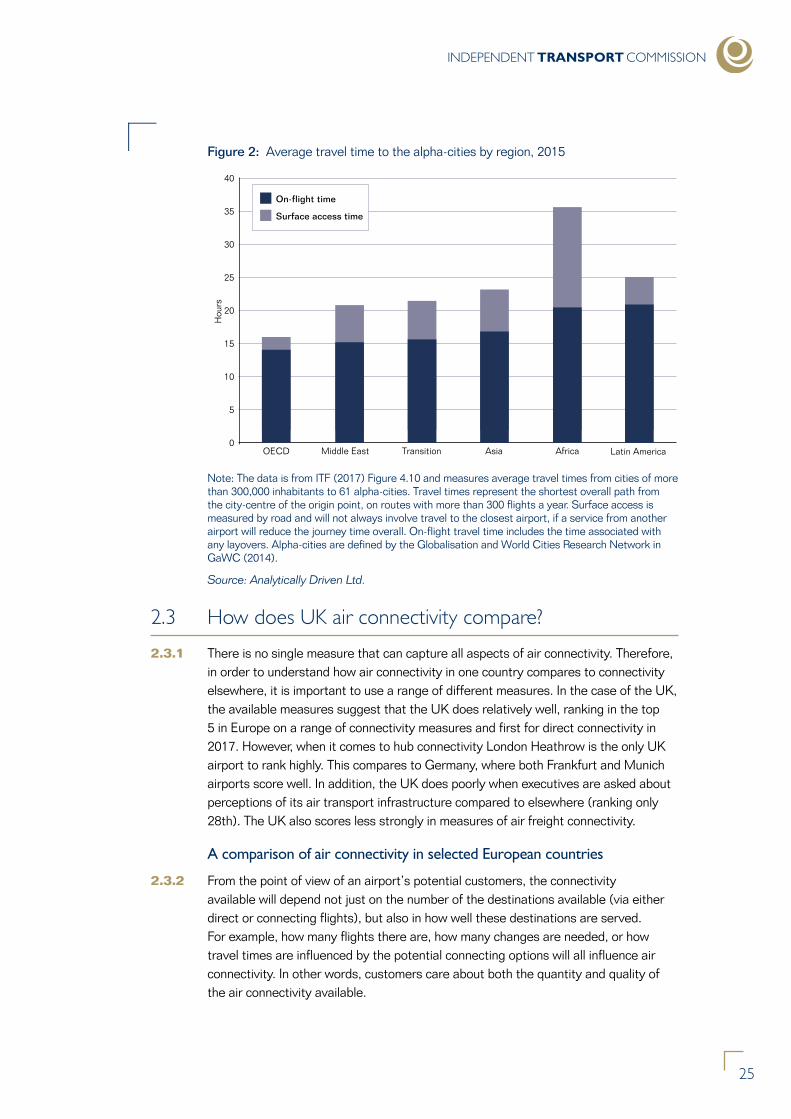
2.2.10 The impact of surface access on connectivity can be seen from Figure 2. In 2015, the average time it took to access an airport from city centres in OECD countries was less than two hours, or 11.8% of the average of total journey times for journeys between each origin city and 61 alpha cities. However, in Africa on average it took more than 15 hours, or 42.8% of the total journey time. Indeed, while the average on-flight time to the 61 alpha cities was longer for journeys originating in Latin America than in Africa, differences in the surface access times meant that journeys from Africa took on average over 10 hours longer.24
19 See ATAG (2016).
20 See the discussion in Hind (2014) and Driver (2015).
21 See the discussion in Hind and RDC Aviation Ltd (2016).
22 See the discussion in Burghouwt and Redondi (2013).
23 See Burghouwt and Redondi (2013) for a survey of the alternative measures that have been used to capture air connectivity.
24 See the discussion in ITF (2017) for more details.
INDEPENDENT TRANSPORT COMMISSION
25
Figure 2: Average travel time to the alpha-cities by region, 2015
40
35
30
25
20
15
10
5
0OECD Middle East Transition Asia Africa Latin America
Hou
rs
On-flight time
Surface access time
Note: The data is from ITF (2017) Figure 4.10 and measures average travel times from cities of more than 300,000 inhabitants to 61 alpha-cities. Travel times represent the shortest overall path from the city-centre of the origin point, on routes with more than 300 flights a year. Surface access is measured by road and will not always involve travel to the closest airport, if a service from another airport will reduce the journey time overall. On-flight travel time includes the time associated with any layovers. Alpha-cities are defined by the Globalisation and World Cities Research Network in GaWC (2014).
Source: Analytically Driven Ltd.
2.3 How does UK air connectivity compare?
2.3.1 There is no single measure that can capture all aspects of air connectivity. Therefore, in order to understand how air connectivity in one country compares to connectivity elsewhere, it is important to use a range of different measures. In the case of the UK, the available measures suggest that the UK does relatively well, ranking in the top 5 in Europe on a range of connectivity measures and first for direct connectivity in 2017. However, when it comes to hub connectivity London Heathrow is the only UK airport to rank highly. This compares to Germany, where both Frankfurt and Munich airports score well. In addition, the UK does poorly when executives are asked about perceptions of its air transport infrastructure compared to elsewhere (ranking only 28th). The UK also scores less strongly in measures of air freight connectivity.
A comparison of air connectivity in selected European countries
2.3.2 From the point of view of an airport’s potential customers, the connectivity available will depend not just on the number of the destinations available (via either direct or connecting flights), but also in how well these destinations are served. For example, how many flights there are, how many changes are needed, or how travel times are influenced by the potential connecting options will all influence air connectivity. In other words, customers care about both the quantity and quality of the air connectivity available.
The Strategic Challenges Facing UK Aviation
26
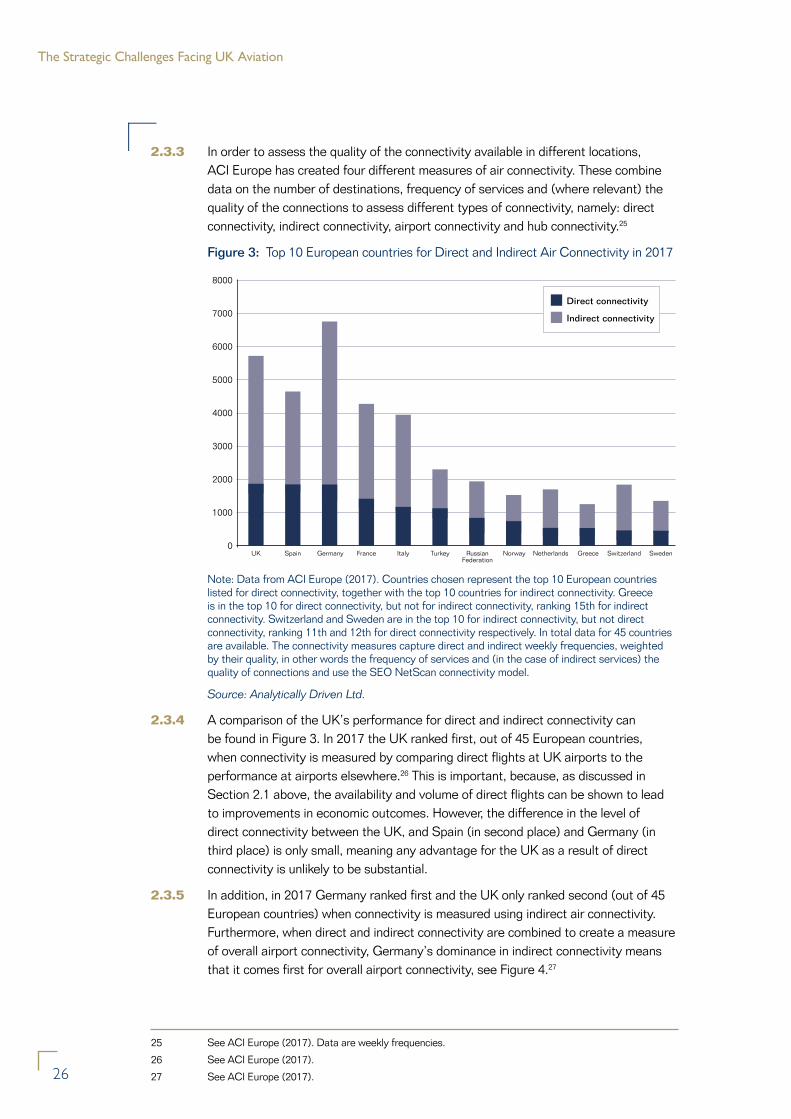
2.3.3 In order to assess the quality of the connectivity available in different locations, ACI Europe has created four different measures of air connectivity. These combine data on the number of destinations, frequency of services and (where relevant) the quality of the connections to assess different types of connectivity, namely: direct connectivity, indirect connectivity, airport connectivity and hub connectivity.25
Figure 3: Top 10 European countries for Direct and Indirect Air Connectivity in 2017
UK Spain Germany France Italy Turkey RussianFederation
Norway Netherlands Greece Switzerland Sweden
8000
7000
6000
5000
4000
3000
2000
1000
0
Direct connectivity
Indirect connectivity
Note: Data from ACI Europe (2017). Countries chosen represent the top 10 European countries listed for direct connectivity, together with the top 10 countries for indirect connectivity. Greece is in the top 10 for direct connectivity, but not for indirect connectivity, ranking 15th for indirect connectivity. Switzerland and Sweden are in the top 10 for indirect connectivity, but not direct connectivity, ranking 11th and 12th for direct connectivity respectively. In total data for 45 countries are available. The connectivity measures capture direct and indirect weekly frequencies, weighted by their quality, in other words the frequency of services and (in the case of indirect services) the quality of connections and use the SEO NetScan connectivity model.
Source: Analytically Driven Ltd.
2.3.4 A comparison of the UK’s performance for direct and indirect connectivity can be found in Figure 3. In 2017 the UK ranked first, out of 45 European countries, when connectivity is measured by comparing direct flights at UK airports to the performance at airports elsewhere.26 This is important, because, as discussed in Section 2.1 above, the availability and volume of direct flights can be shown to lead to improvements in economic outcomes. However, the difference in the level of direct connectivity between the UK, and Spain (in second place) and Germany (in third place) is only small, meaning any advantage for the UK as a result of direct connectivity is unlikely to be substantial.
2.3.5 In addition, in 2017 Germany ranked first and the UK only ranked second (out of 45 European countries) when connectivity is measured using indirect air connectivity. Furthermore, when direct and indirect connectivity are combined to create a measure of overall airport connectivity, Germany’s dominance in indirect connectivity means that it comes first for overall airport connectivity, see Figure 4.27
25 See ACI Europe (2017). Data are weekly frequencies.
26 See ACI Europe (2017).
27 See ACI Europe (2017).
INDEPENDENT TRANSPORT COMMISSION
27
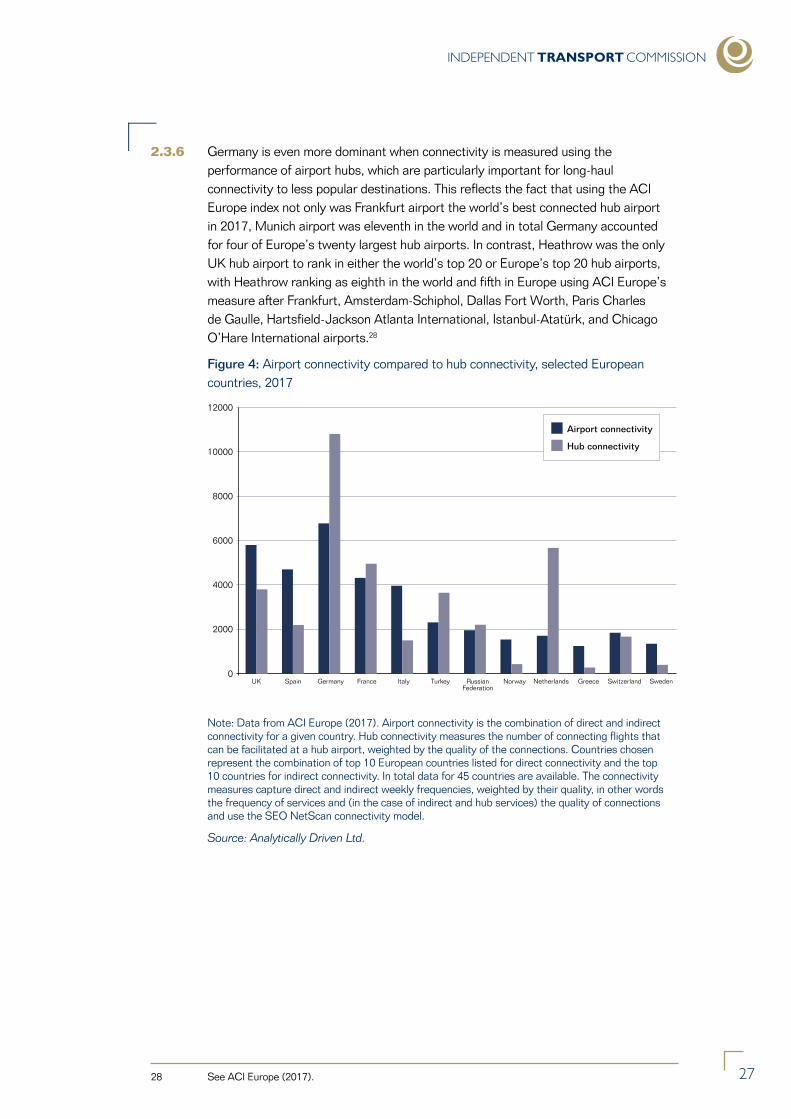
2.3.6 Germany is even more dominant when connectivity is measured using the performance of airport hubs, which are particularly important for long-haul connectivity to less popular destinations. This reflects the fact that using the ACI Europe index not only was Frankfurt airport the world’s best connected hub airport in 2017, Munich airport was eleventh in the world and in total Germany accounted for four of Europe’s twenty largest hub airports. In contrast, Heathrow was the only UK hub airport to rank in either the world’s top 20 or Europe’s top 20 hub airports, with Heathrow ranking as eighth in the world and fifth in Europe using ACI Europe’s measure after Frankfurt, Amsterdam-Schiphol, Dallas Fort Worth, Paris Charles de Gaulle, Hartsfield-Jackson Atlanta International, Istanbul-Atatürk, and Chicago O’Hare International airports.28
Figure 4: Airport connectivity compared to hub connectivity, selected European countries, 2017
UK Spain Germany France Italy Turkey RussianFederation
Norway Netherlands Greece Switzerland Sweden
2000
4000
6000
8000
10000
12000
0
Airport connectivity
Hub connectivity
Note: Data from ACI Europe (2017). Airport connectivity is the combination of direct and indirect connectivity for a given country. Hub connectivity measures the number of connecting flights that can be facilitated at a hub airport, weighted by the quality of the connections. Countries chosen represent the combination of top 10 European countries listed for direct connectivity and the top 10 countries for indirect connectivity. In total data for 45 countries are available. The connectivity measures capture direct and indirect weekly frequencies, weighted by their quality, in other words the frequency of services and (in the case of indirect and hub services) the quality of connections and use the SEO NetScan connectivity model.
Source: Analytically Driven Ltd.
28 See ACI Europe (2017).
The Strategic Challenges Facing UK Aviation
28
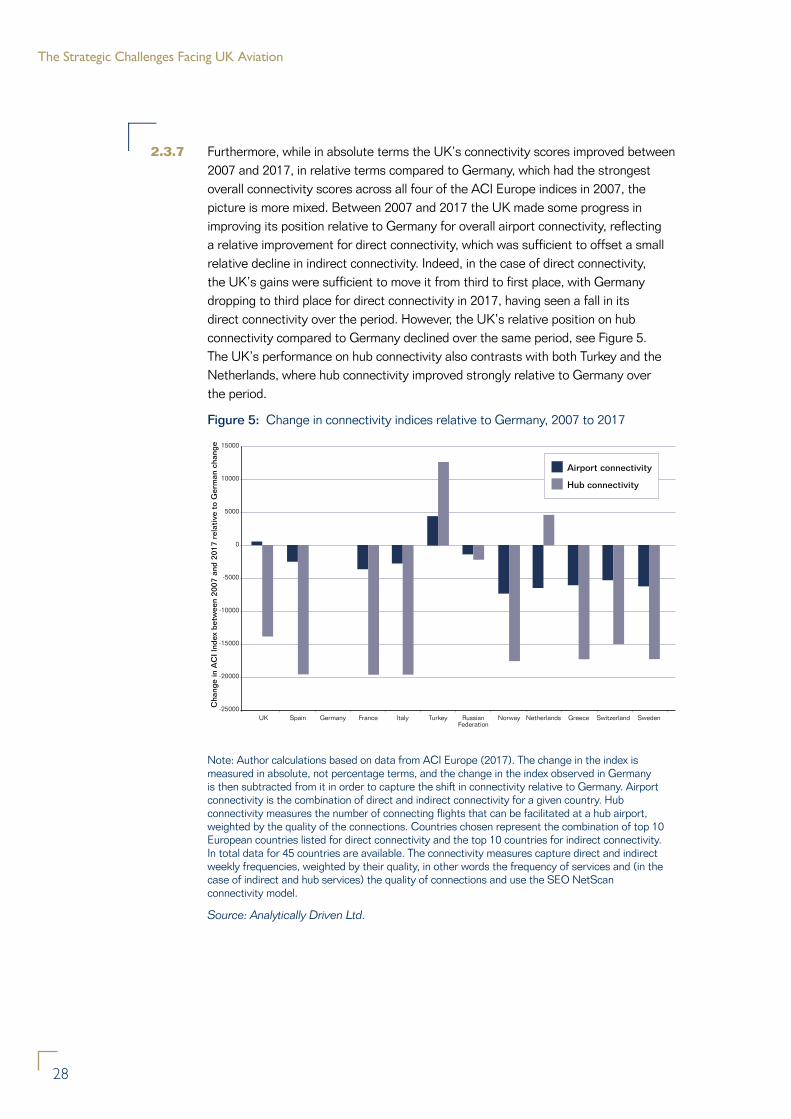
2.3.7 Furthermore, while in absolute terms the UK’s connectivity scores improved between 2007 and 2017, in relative terms compared to Germany, which had the strongest overall connectivity scores across all four of the ACI Europe indices in 2007, the picture is more mixed. Between 2007 and 2017 the UK made some progress in improving its position relative to Germany for overall airport connectivity, reflecting a relative improvement for direct connectivity, which was sufficient to offset a small relative decline in indirect connectivity. Indeed, in the case of direct connectivity, the UK’s gains were sufficient to move it from third to first place, with Germany dropping to third place for direct connectivity in 2017, having seen a fall in its direct connectivity over the period. However, the UK’s relative position on hub connectivity compared to Germany declined over the same period, see Figure 5. The UK’s performance on hub connectivity also contrasts with both Turkey and the Netherlands, where hub connectivity improved strongly relative to Germany over the period.
Figure 5: Change in connectivity indices relative to Germany, 2007 to 2017
Cha
nge
in A
CI I
ndex
bet
wee
n 20
07 a
nd 2
017
rela
tive
to
Ger
man
cha
nge
SpainUK Germany France Italy Turkey RussianFederation
Norway Netherlands Greece Switzerland Sweden
-10000
-15000
-20000
-25000
-5000
0
5000
10000
15000
Airport connectivity
Hub connectivity
Note: Author calculations based on data from ACI Europe (2017). The change in the index is measured in absolute, not percentage terms, and the change in the index observed in Germany is then subtracted from it in order to capture the shift in connectivity relative to Germany. Airport connectivity is the combination of direct and indirect connectivity for a given country. Hub connectivity measures the number of connecting flights that can be facilitated at a hub airport, weighted by the quality of the connections. Countries chosen represent the combination of top 10 European countries listed for direct connectivity and the top 10 countries for indirect connectivity. In total data for 45 countries are available. The connectivity measures capture direct and indirect weekly frequencies, weighted by their quality, in other words the frequency of services and (in the case of indirect and hub services) the quality of connections and use the SEO NetScan connectivity model.
Source: Analytically Driven Ltd.
INDEPENDENT TRANSPORT COMMISSION
29
2.3.8 However, it is important to recognise that there is no definitive approach to measuring connectivity, or even hub connectivity. For example, OAG have created an index based on the total possible connections between inbound and outbound flights within a six-hour window where at least one flight is international on the busiest day for global aviation in the twelve months to July 2017. Using this measure London Heathrow ranks as the hub airport with the highest connectivity score in the world in 2017, rather than Frankfurt, which comes second. However, again Heathrow is the only UK hub listed (in the world’s top 50 hub airports), while both Frankfurt and Munich rank in the world’s top 15 hub airports.29
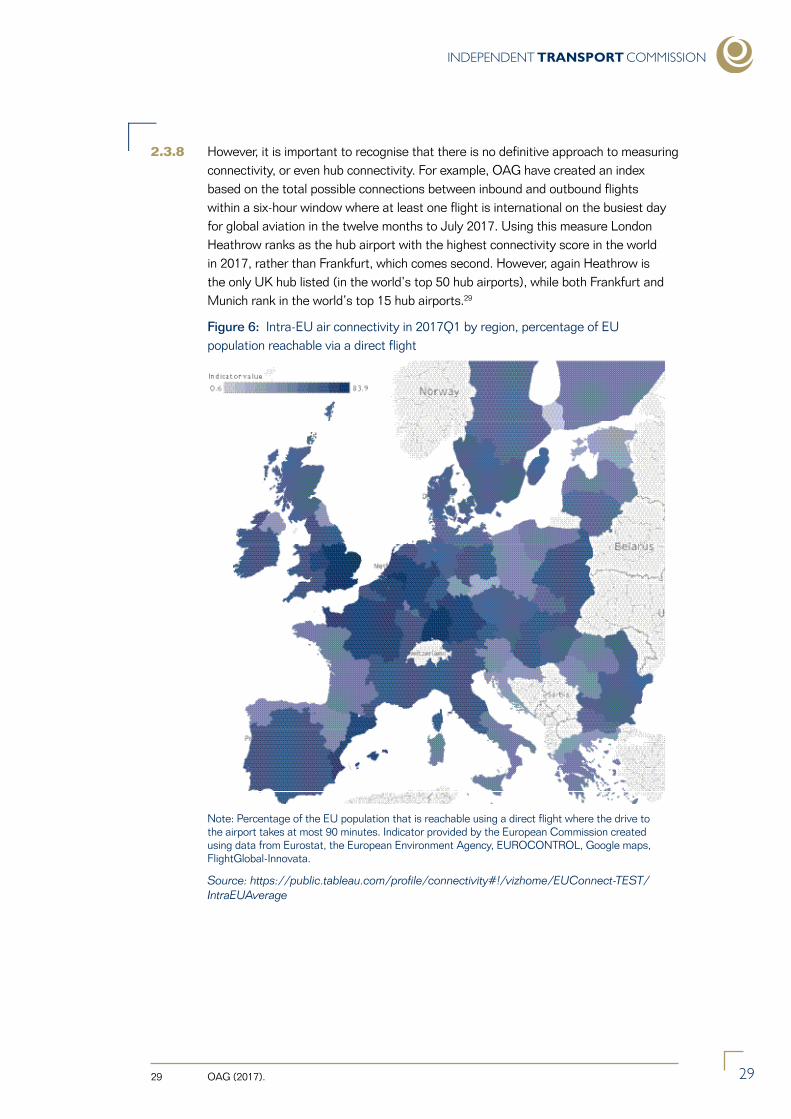
Figure 6: Intra-EU air connectivity in 2017Q1 by region, percentage of EU population reachable via a direct flight
Note: Percentage of the EU population that is reachable using a direct flight where the drive to the airport takes at most 90 minutes. Indicator provided by the European Commission created using data from Eurostat, the European Environment Agency, EUROCONTROL, Google maps, FlightGlobal-Innovata.
Source: https://public.tableau.com/profile/connectivity#!/vizhome/EUConnect-TEST/IntraEUAverage
29 OAG (2017).
The Strategic Challenges Facing UK Aviation
30
2.3.9 Furthermore, an assessment of intra-EU connectivity suggests that four UK regions outperform the rest of the EU in terms of the intra-EU connectivity available, see Figure 6. Based on at most a 90 minute drive to the airport, residents in the East region of the UK can reach 83.9% of EU residents using a direct flight; residents in the South East can reach 83.5% of EU residents; residents in London can reach 82.1% of EU residents; and residents in the East Midlands can reach 80.8% of EU residents. In the rest of the EU the top ranking EU region is Baden-Württemberg, which ranks fifth in terms of the share of EU residents that can be reached via a direct flight, with 79.2% of EU residents being reachable.
2.3.10 This suggests that not only does the UK benefit from a strong network of flights to the rest of the EU, but also that its surface access times are relatively strong, given that the analysis was based on a drive time of at most 90 minutes.
2.3.11 However, it is important to recognise that intra-EU connectivity is only a subset of global connectivity. Indeed, it is noticeable that London, which includes Heathrow airport, scores less well than the East region in the UK, which has Luton and Stansted airports, reflecting the relative balance of flights to the EU versus the rest of the world. Similarly, only 69.1% of EU residents can be reached via a direct flight from the Hessen region in Germany, despite the fact that this region includes Frankfurt airport, which scores very highly on global connectivity indices. This is likely to reflect both the geography of Hessen, as its position means that more EU areas will be easily reachable by road or rail, reducing the need for intra-EU flights, and also the relative prioritisation of flights outside the EU.
2.3.12 Furthermore, in the case of Heathrow, as previous research for the ITC has highlighted, one of the problems with lack of capacity at Heathrow is that less profitable routes have tended to be dropped. This means Heathrow has tended to serve fewer destinations than some of its European competitors, but on the routes it does serve it offers more seats and a more frequent service.30
30 See the discussion in Driver (2015) and Hind (2014).
INDEPENDENT TRANSPORT COMMISSION
31
The customer perspective
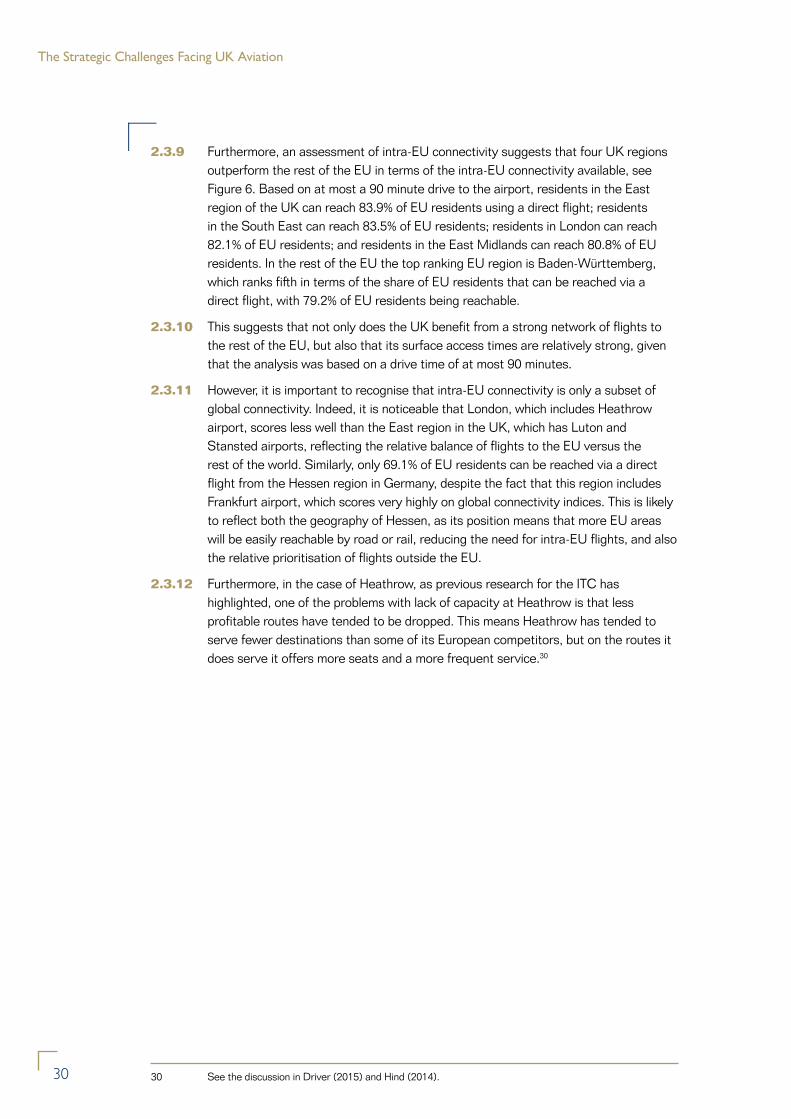
2.3.13 Although the UK appears to do well when connectivity is compared using metrics such as the availability of flights, one potential concern is that the UK’s air transport infrastructure only ranks as 28th in the world when its quality is compared using more subjective measures based on the views of executives. Indeed, in total 14 European countries score better than the UK when judged on the views of executives. Furthermore, based on customer perceptions the UK only beats four of the twelve countries that ranked in the top 10 in Europe either for direct or indirect connectivity using the ACI Europe connectivity indices, despite having scored well on the ACI Europe metrics, see Figure 7. Although clearly the strength of the actual connections available is extremely important, perceptions of strengths of the air transport infrastructure could act as a potential impediment to the use of the system by customers, and will therefore influence the quality of air connectivity in its broadest sense.
Figure 7: Executives’ opinions of the quality of their country’s air transport infrastructure, selected countries, 2017
1.0
2.0
3.0
4.0
5.0
6.0
7.0
0
UKSpa
in
German
y
Fran
ce Italy
Turke
y
Russia
n Fed
erat
ion
Norway
Nethe
rland
s
Greec
e
Switzer
land
Sweden
Singap
ore
Hong K
ong S
ARUAE US
Note: Data from the World Economic Forum (WEF), Executive Opinion Survey 2017, Table 2.05. Countries chosen represent the combination of top 10 European countries listed for direct connectivity and the top 10 countries for indirect connectivity from ACI Europe (2017), plus selected non-European countries. Singapore, Hong Kong SAR and UAE ranked 1st, 2nd and 3rd respectively in the WEF survey, the US ranked 9th and the UK ranked 28th. Respondents in the WEF survey were asked “In your country,, how is the quality (extensiveness and condition) of airports (1 = extremely poor – among the worst in the world; 7 = extremely good – among the best in the world).
Source: Analytically Driven Ltd.
The Strategic Challenges Facing UK Aviation
32
Comparing the relative quality of freight processes
2.3.14 While the UK may perform relatively well in terms of connectivity for air passengers, another important consideration for air connectivity is how effective the UK is at supporting the needs of air freight, particularly in a world where global value chains have become very important.
2.3.15 IATA has developed two measures, the Air Trade Facilitation Index (ATFI) and the eFreight Friendliness Index (EFFI), to assess the effectiveness of smart border regulation, customs services and logistics chains from the perspective of air cargo. The ATFI provides a general indicator of the trade facilitation environment surrounding air cargo, while the EFFI relates to the ability to undertake cargo transactions electronically, which has clear benefits in terms of time and cost for exporters and importers. Both measures are positively correlated with the value of trade as well as the level of global value chain participation.31
2.3.16 Using these measures to assess connectivity, the UK’s relative performance is less strong than it is using measures of air connectivity based on passenger flights. In particular, from the perspective of the effectiveness of the UK’s air cargo processes, the UK ranks as 22nd in the world on the EFFI index and 13th in the world on the ATFI index. In the case of the EFFI, the UK’s score was just 72.2% of the score achieved by the top ranked country, namely the UAE. In the case of the ATFI, the UK’s score was 93.4% of the top ranked country, which in this case was Austria.32
31 See the discussion in Shepherd et al (2016).
32 See Shepherd et al (2016).
INDEPENDENT TRANSPORT COMMISSION
33
3. Delivering air connectivity - How the aviation sector operates
3.0.1 Air connectivity has important benefits, particularly for how economies function, and achieving good air connectivity depends on the health and effectiveness of the different parts of the aviation sector. Furthermore, even before the benefits of air connectivity are considered, the aviation sector itself is an important part of the economy, both at a national and a local level. This Section therefore reviews some of the evidence on how the aviation sector operates, what role different parts of the sector play in promoting connectivity and what the sector’s economic contribution is.
3.1 What makes up the aviation value chain?
3.1.1 In order to understand air connectivity, it is necessary to understand how the aviation sector itself operates and how the different parts of the sector are linked through the aviation value chain. For example, air connectivity is not purely a function of the service sector activities linked to the operation of airports and airlines. It also depends on access to the aviation manufacturing sector, either at home or abroad, without which it would not be possible to get off the ground. Furthermore, air connectivity also benefits from the contribution of other sectors outside aviation, such as surface transport links, which can help make it easier to access airports, or retail outlets and restaurants at airports that can boost demand for travel by helping passengers to enjoy their journey more.
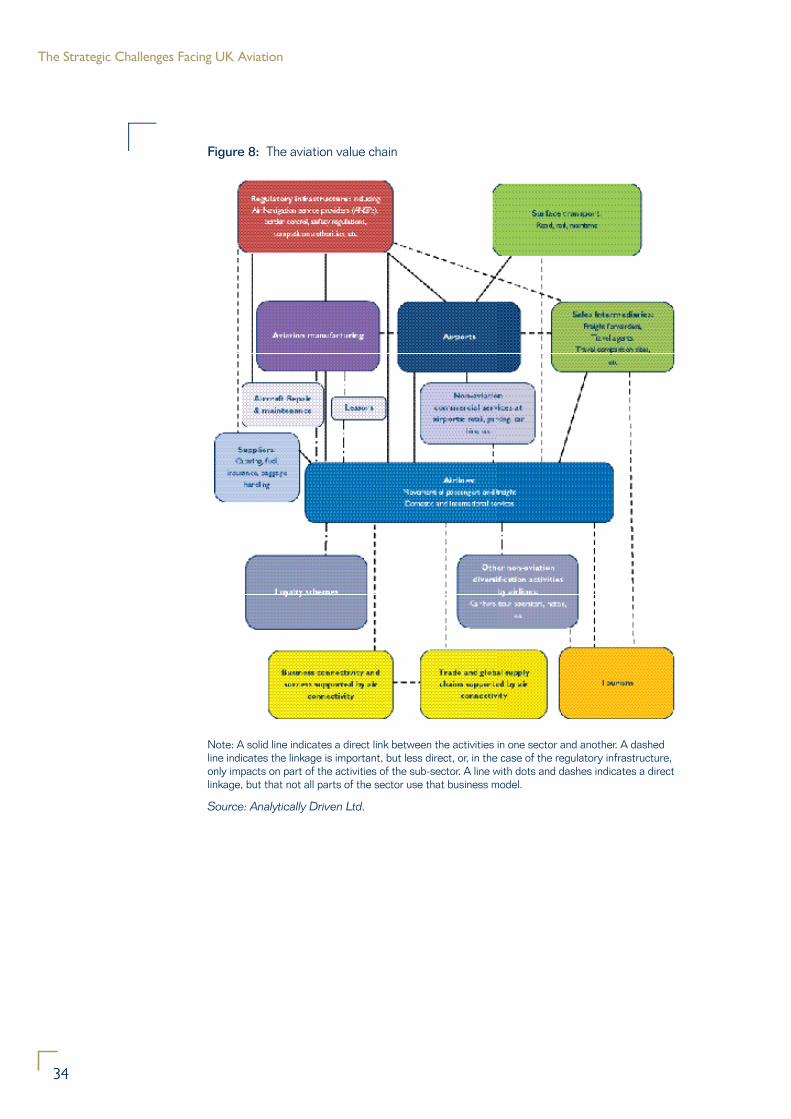
3.1.2 The aviation value chain is therefore a complex one covering both manufacturing and service parts of the aviation sector itself, as well as contributions from other sectors, see Figure 8. In addition, the aviation sector is itself an input into activities such as tourism, as well as enabling countries to realise the economic benefits associated with the existence of good air connectivity. These activities in turn help determine the demand for the goods and services offered by the aviation sector.
The Strategic Challenges Facing UK Aviation
3434
Figure 8: The aviation value chain
Note: A solid line indicates a direct link between the activities in one sector and another. A dashed line indicates the linkage is important, but less direct, or, in the case of the regulatory infrastructure, only impacts on part of the activities of the sub-sector. A line with dots and dashes indicates a direct linkage, but that not all parts of the sector use that business model.
Source: Analytically Driven Ltd.
INDEPENDENT TRANSPORT COMMISSION
35
3.1.3 The aviation value chain involves significant inter-linkages between different parts of the system, as well as the links to other sectors and the use of non-core activities that have helped parts of the aviation sector to diversify their activities. For example:
• Surface access for airports. Surface access directly influences the amount of traffic that a particular airport will attract and the connectivity benefits it provides. However, by influencing the relative competitiveness of different airports, surface access will also influence the demand for an airline’s flights, because airlines can only fly from airports where they have landing slots.
• Aviation manufacturing. Aviation manufacturing has a direct impact on the types of service individual airlines can run, by influencing factors such as the number of passengers or amount of freight that can be accommodated; the distances that can be flown; and the costs of operating flights such as fuel costs. However, aircraft design also determines factors such as the length of runway needed, meaning that aviation manufacturing will influence the demand for different airports, depending on the design features of new models.
• Sales intermediaries. By determining which airlines customers pick, sales intermediaries also influence the choice of airport.
• Diversification activities. The aviation value chain is also influenced by the way that different parts of the sector have tried to diversify. For example, the existence and attractiveness of retail outputs at airports can help boost demand for the airport and therefore for the airlines using it, as well as boosting revenues for the airport itself. Aviation manufacturers not only sell aircraft directly to airlines, they can also lease out aircraft, or sell aircraft repair and maintenance services. Airline loyalty schemes can not only help boost sales for the airlines with popular schemes, but can also become a source of revenue if, for example, they are able to sell air miles to banks or credit card companies. Some airlines have also diversified into non-aviation activities such as car hire and hotels, which can influence the choices made by tourists and business travellers.
• The regulatory framework. Finally, a key part of the aviation value chain is the regulatory framework, which determines what rules different parts of the system need to operate under and the connectivity they can provide. Regulation of aviation is not just about safety and security, although this plays an important role, particularly in the willingness of countries to accept planes operating from different jurisdictions. Regulation also helps determine how the environmental costs associated with aviation are balanced against the economic and social benefits. In addition, regulation can have a direct influence on the competitiveness of the sector through its role in economic regulation. The regulatory framework is discussed in more detail in Section 4.
3.1.4 Understanding the split across different types of activity in the aviation value chain is complex, because it will depend on the country involved. For example, not all countries will have a significant aerospace manufacturing sector. However, a typical split in Europe for the service activities directly associated with providing air connectivity at the airport level can be seen in Figure 9.
The Strategic Challenges Facing UK Aviation
36
Figure 9: The employment split across activities at a typical European airport
Note: From ACI Europe and Intervistas, “Economic Impact of European airports”, 2015.
Source: ATAG (2016).
Where is the value in the aviation value chain?
3.1.5 One of the things that puzzles commentators on the aviation industry is the seemingly poor return on invested capital (ROIC) achieved by key parts of the aviation value chain, particularly airlines.33 While the airline sector accounts for the largest share of capital invested within the aviation value chain, at around 48% in 2011 (see Figure 10), average returns have been persistently low. For example, as illustrated in Figure 11, between 2004 and 2011 on average the ROIC for airlines was just 4%, a rate that was both below the airline industry’s weighted average cost of capital and returns in other parts of the aviation sector.34 However, even the airport sector, which accounted for 36% of capital invested, only had an ROIC of around 6% on average.
3.1.6 Despite the fact that capital requirements are high and returns are low, there does not appear to be a shortage of capital affecting the airline sector, or indeed new entrants. There are a variety of explanations for this.35 For example, accounting standards for everything from maintenance costs to labour costs favour new entrants. In addition, unlike investing in a factory, aircraft are highly portable, meaning they are easy to resell and redeploy. Furthermore, the cash generated by airlines is typically easily enough to cover the cost of an aircraft lease or interest payments plus accounting depreciation (depending on how the aircraft has been acquired), even if it does not fully meet the risk adjusted returns necessary to justify the capital expenditure. In addition, a small number of airlines, particularly in the low cost part of the sector, have earned strong returns on invested capital. However, despite these exceptions, it remains hard for commentators to explain why the airline sector does not face more constraints when raising capital.36
33 See, for example, the discussion in Dichter (2017) and Tretheway and Markhvida (2013).
34 See the discussion in Tretheway and Markhvida (2013).
35 See, for example, the discussion in Dichter (2017).
36 See, for example, the discussion in Dichter (2017) and Tretheway and Markhvida (2013).
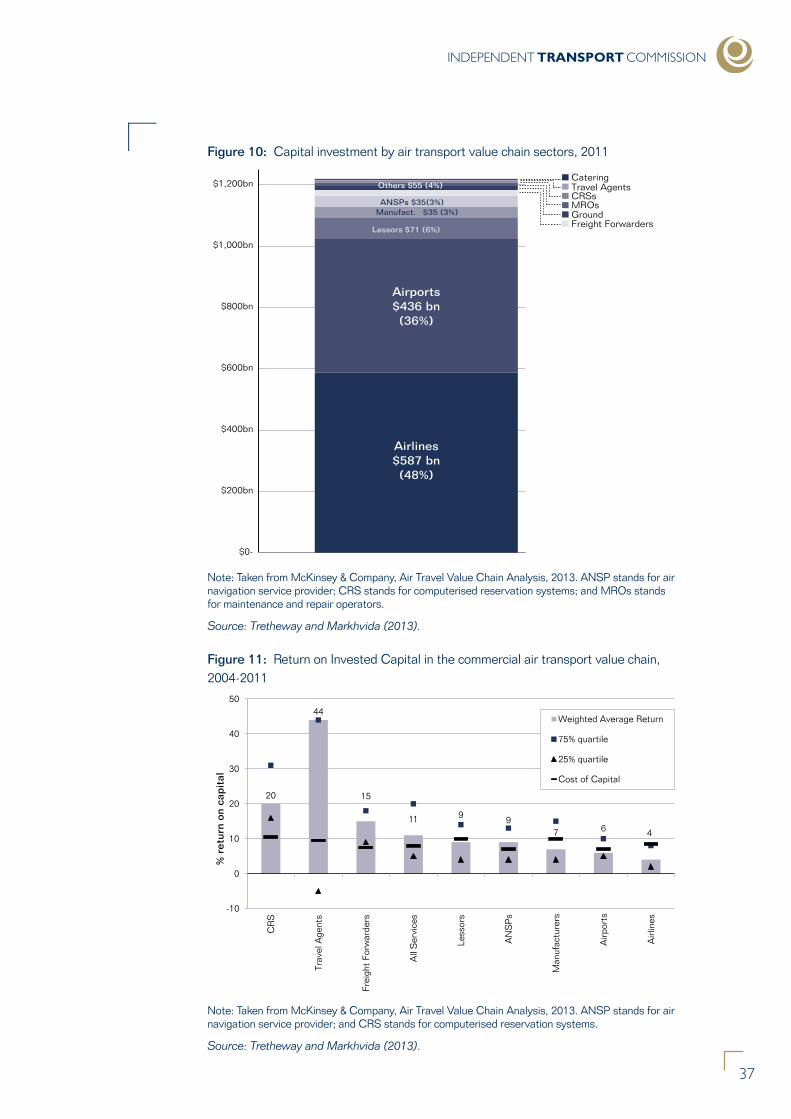
INDEPENDENT TRANSPORT COMMISSION
37
Figure 10: Capital investment by air transport value chain sectors, 2011
Airlines$587 bn(48%)
Airports$436 bn(36%)
Lessors $71 (6%)
Manufact. $35 (3%) ANSPs $35(3%)
Others $55 (4%)
$0-
$200bn
$400bn
$600bn
$800bn
$1,000bn
$1,200bnCateringTravel Agents
MROsGroundFreight Forwarders
CRSs
Note: Taken from McKinsey & Company, Air Travel Value Chain Analysis, 2013. ANSP stands for air navigation service provider; CRS stands for computerised reservation systems; and MROs stands for maintenance and repair operators.
Source: Tretheway and Markhvida (2013).
Figure 11: Return on Invested Capital in the commercial air transport value chain, 2004-2011
20
44
15
11 9 97 6 4
-10
0
10
20
30
40
50
CR
S
Trav
el A
gent
s
Frei
ght
Forw
arde
rs
All
Ser
vice
s
Less
ors
AN
SP
s
Man
ufac
ture
rs
Airp
orts
Airl
ines
% r
etur
n on
cap
ital
Weighted Average Return
75% quartile
25% quartile
Cost of Capital
Note: Taken from McKinsey & Company, Air Travel Value Chain Analysis, 2013. ANSP stands for air navigation service provider; and CRS stands for computerised reservation systems.
Source: Tretheway and Markhvida (2013).
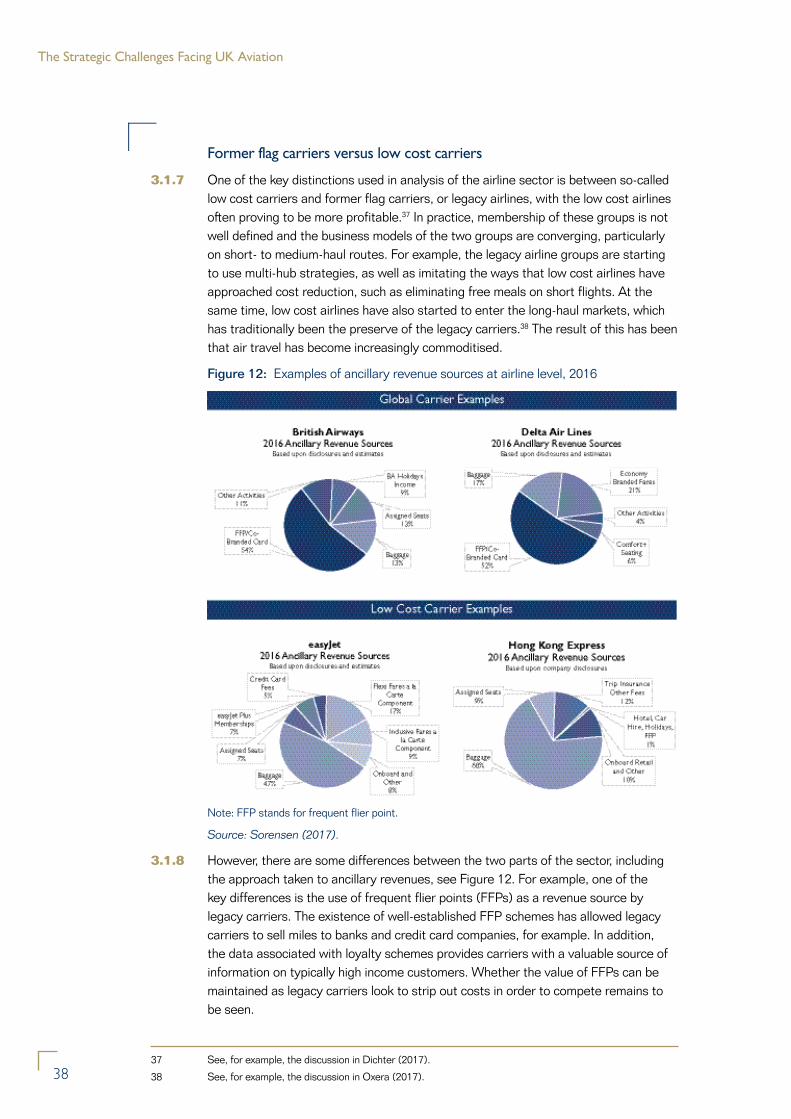
The Strategic Challenges Facing UK Aviation
38
Former flag carriers versus low cost carriers
3.1.7 One of the key distinctions used in analysis of the airline sector is between so-called low cost carriers and former flag carriers, or legacy airlines, with the low cost airlines often proving to be more profitable.37 In practice, membership of these groups is not well defined and the business models of the two groups are converging, particularly on short- to medium-haul routes. For example, the legacy airline groups are starting to use multi-hub strategies, as well as imitating the ways that low cost airlines have approached cost reduction, such as eliminating free meals on short flights. At the same time, low cost airlines have also started to enter the long-haul markets, which has traditionally been the preserve of the legacy carriers.38 The result of this has been that air travel has become increasingly commoditised.
Figure 12: Examples of ancillary revenue sources at airline level, 2016
Note: FFP stands for frequent flier point.
Source: Sorensen (2017).
3.1.8 However, there are some differences between the two parts of the sector, including the approach taken to ancillary revenues, see Figure 12. For example, one of the key differences is the use of frequent flier points (FFPs) as a revenue source by legacy carriers. The existence of well-established FFP schemes has allowed legacy carriers to sell miles to banks and credit card companies, for example. In addition, the data associated with loyalty schemes provides carriers with a valuable source of information on typically high income customers. Whether the value of FFPs can be maintained as legacy carriers look to strip out costs in order to compete remains to be seen.
37 See, for example, the discussion in Dichter (2017).
38 See, for example, the discussion in Oxera (2017).
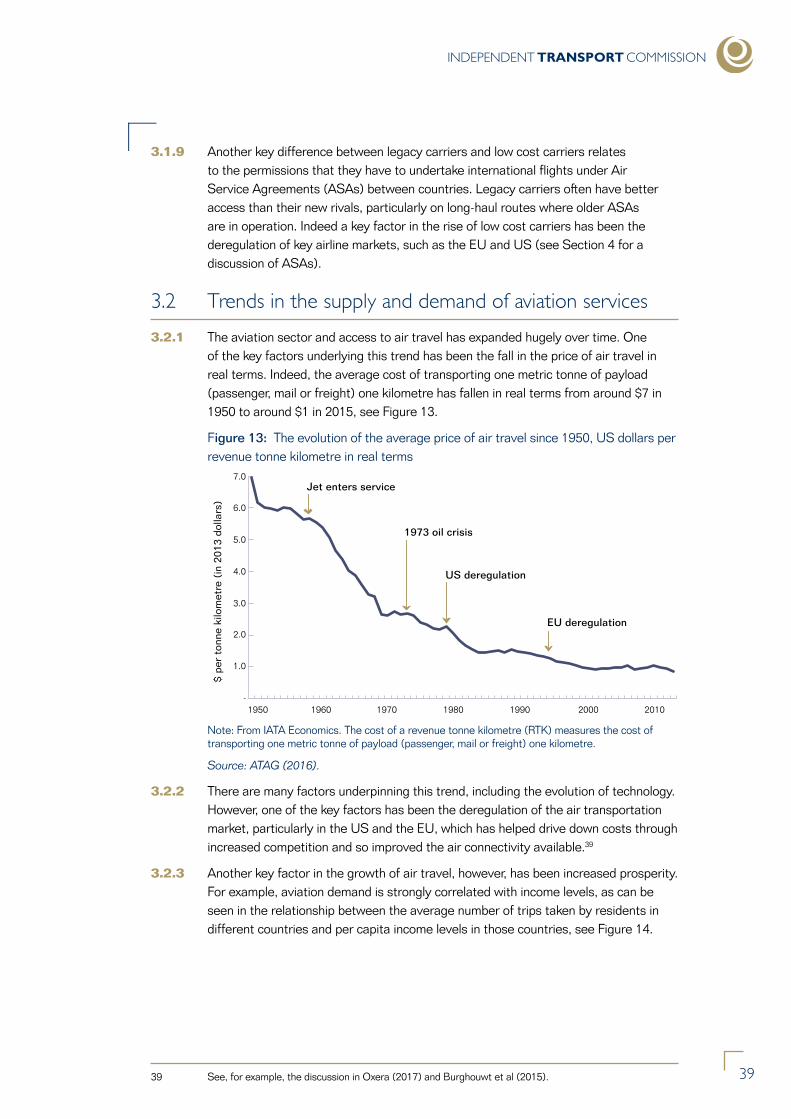
INDEPENDENT TRANSPORT COMMISSION
39
3.1.9 Another key difference between legacy carriers and low cost carriers relates to the permissions that they have to undertake international flights under Air Service Agreements (ASAs) between countries. Legacy carriers often have better access than their new rivals, particularly on long-haul routes where older ASAs are in operation. Indeed a key factor in the rise of low cost carriers has been the deregulation of key airline markets, such as the EU and US (see Section 4 for a discussion of ASAs).
3.2 Trends in the supply and demand of aviation services
3.2.1 The aviation sector and access to air travel has expanded hugely over time. One of the key factors underlying this trend has been the fall in the price of air travel in real terms. Indeed, the average cost of transporting one metric tonne of payload (passenger, mail or freight) one kilometre has fallen in real terms from around $7 in 1950 to around $1 in 2015, see Figure 13.
Figure 13: The evolution of the average price of air travel since 1950, US dollars per revenue tonne kilometre in real terms
-
$ pe
r to
nne
kilo
met
re (
in 2
013
dolla
rs)
1.0
1950 1960 1970 1980 1990
EU deregulation
US deregulation
1973 oil crisis
Jet enters service
2000 2010
2.0
3.0
4.0
5.0
6.0
7.0
Note: From IATA Economics. The cost of a revenue tonne kilometre (RTK) measures the cost of transporting one metric tonne of payload (passenger, mail or freight) one kilometre.
Source: ATAG (2016).
3.2.2 There are many factors underpinning this trend, including the evolution of technology. However, one of the key factors has been the deregulation of the air transportation market, particularly in the US and the EU, which has helped drive down costs through increased competition and so improved the air connectivity available.39
3.2.3 Another key factor in the growth of air travel, however, has been increased prosperity. For example, aviation demand is strongly correlated with income levels, as can be seen in the relationship between the average number of trips taken by residents in different countries and per capita income levels in those countries, see Figure 14.
39 See, for example, the discussion in Oxera (2017) and Burghouwt et al (2015).
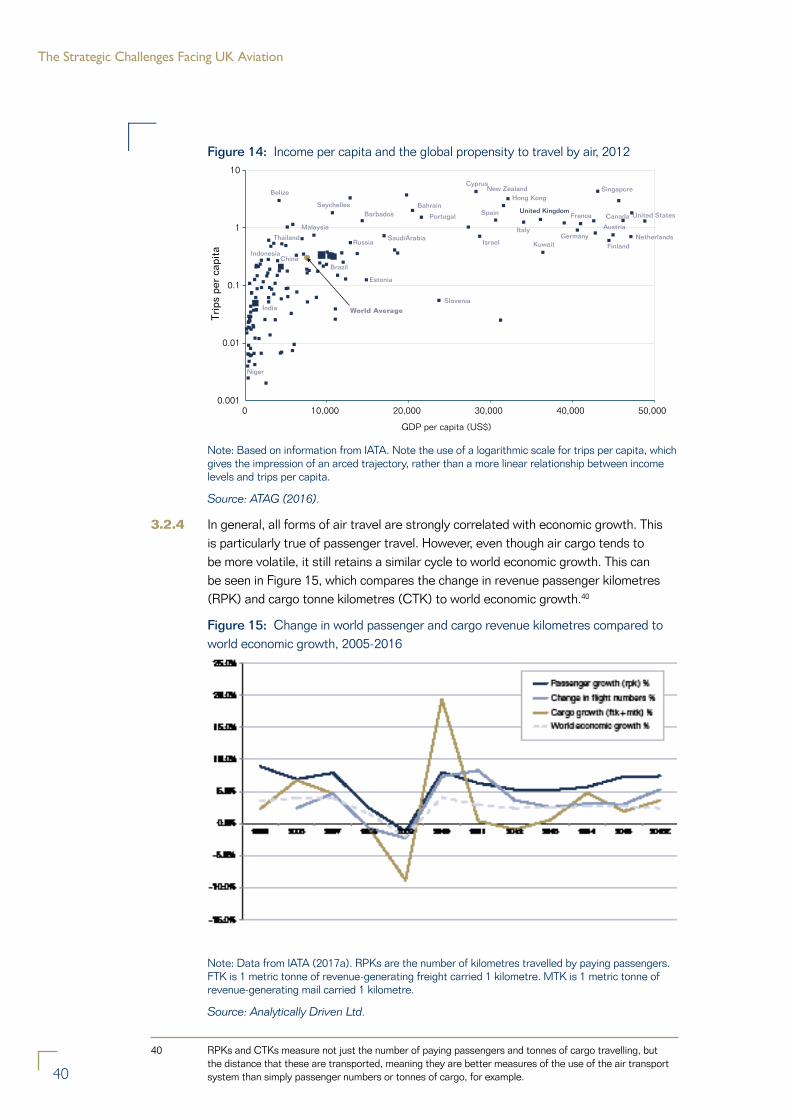
The Strategic Challenges Facing UK Aviation
40
Figure 14: Income per capita and the global propensity to travel by air, 2012
Niger
India Slovenia
Estonia
Indonesia China
Brazil
Russia Kuwait Thailand
Finland Netherlands
IsraelSaudi Arabia
Malaysia AustriaGermany
France
Italy
Barbados Canada Spain United KingdomPortugal United States
Seychelles Bahrain Hong Kong
Belize New Zealand Cyprus
Singapore
0.001
0.01
0.1
1
10
0 10,000 20,000 30,000 40,000 50,000
GDP per capita (US$)
Trip
s pe
r ca
pita
World Average
Note: Based on information from IATA. Note the use of a logarithmic scale for trips per capita, which gives the impression of an arced trajectory, rather than a more linear relationship between income levels and trips per capita.
Source: ATAG (2016).
3.2.4 In general, all forms of air travel are strongly correlated with economic growth. This is particularly true of passenger travel. However, even though air cargo tends to be more volatile, it still retains a similar cycle to world economic growth. This can be seen in Figure 15, which compares the change in revenue passenger kilometres (RPK) and cargo tonne kilometres (CTK) to world economic growth.40
Figure 15: Change in world passenger and cargo revenue kilometres compared to world economic growth, 2005-2016
Note: Data from IATA (2017a). RPKs are the number of kilometres travelled by paying passengers. FTK is 1 metric tonne of revenue-generating freight carried 1 kilometre. MTK is 1 metric tonne of revenue-generating mail carried 1 kilometre.
Source: Analytically Driven Ltd.
40 RPKs and CTKs measure not just the number of paying passengers and tonnes of cargo travelling, but the distance that these are transported, meaning they are better measures of the use of the air transport system than simply passenger numbers or tonnes of cargo, for example.
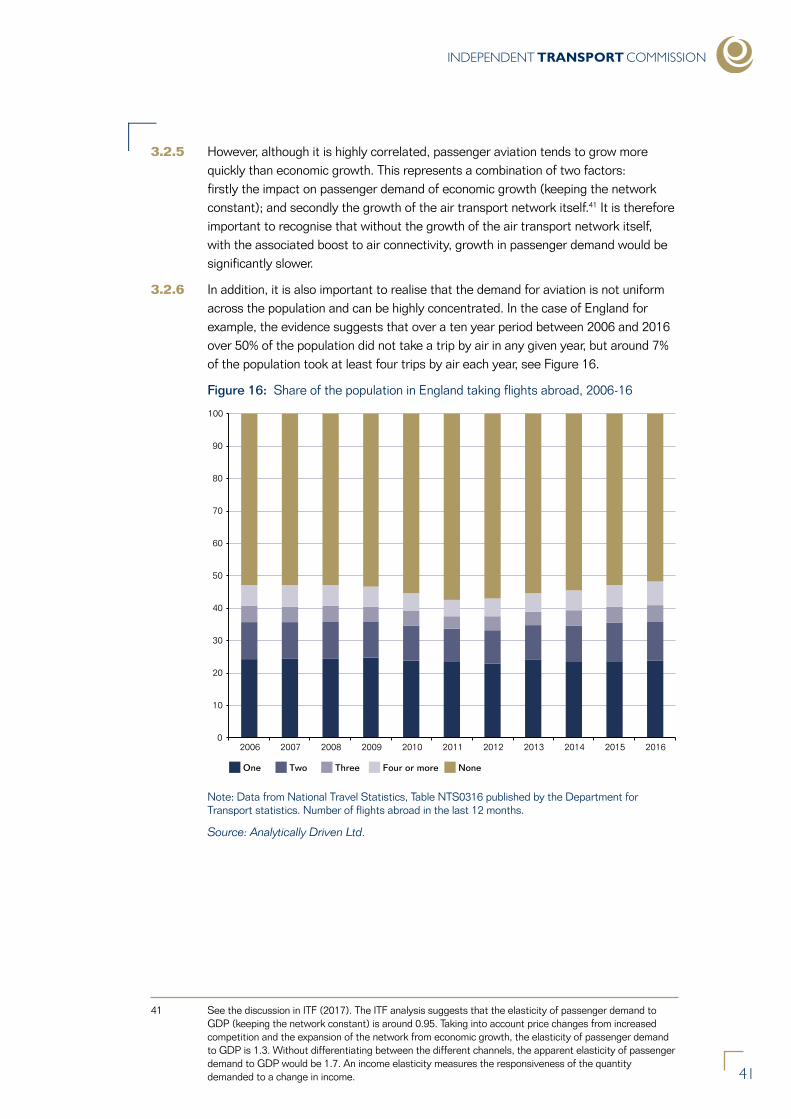
INDEPENDENT TRANSPORT COMMISSION
41
3.2.5 However, although it is highly correlated, passenger aviation tends to grow more quickly than economic growth. This represents a combination of two factors: firstly the impact on passenger demand of economic growth (keeping the network constant); and secondly the growth of the air transport network itself.41 It is therefore important to recognise that without the growth of the air transport network itself, with the associated boost to air connectivity, growth in passenger demand would be significantly slower.
3.2.6 In addition, it is also important to realise that the demand for aviation is not uniform across the population and can be highly concentrated. In the case of England for example, the evidence suggests that over a ten year period between 2006 and 2016 over 50% of the population did not take a trip by air in any given year, but around 7% of the population took at least four trips by air each year, see Figure 16.
Figure 16: Share of the population in England taking flights abroad, 2006-16
0
10
20
30
40
50
60
70
80
90
100
2006 2007 2008 2009 2010 2011 2012 2013 2014 2015 2016
One Two Three Four or more None
Note: Data from National Travel Statistics, Table NTS0316 published by the Department for Transport statistics. Number of flights abroad in the last 12 months.
Source: Analytically Driven Ltd.
41 See the discussion in ITF (2017). The ITF analysis suggests that the elasticity of passenger demand to GDP (keeping the network constant) is around 0.95. Taking into account price changes from increased competition and the expansion of the network from economic growth, the elasticity of passenger demand to GDP is 1.3. Without differentiating between the different channels, the apparent elasticity of passenger demand to GDP would be 1.7. An income elasticity measures the responsiveness of the quantity demanded to a change in income.
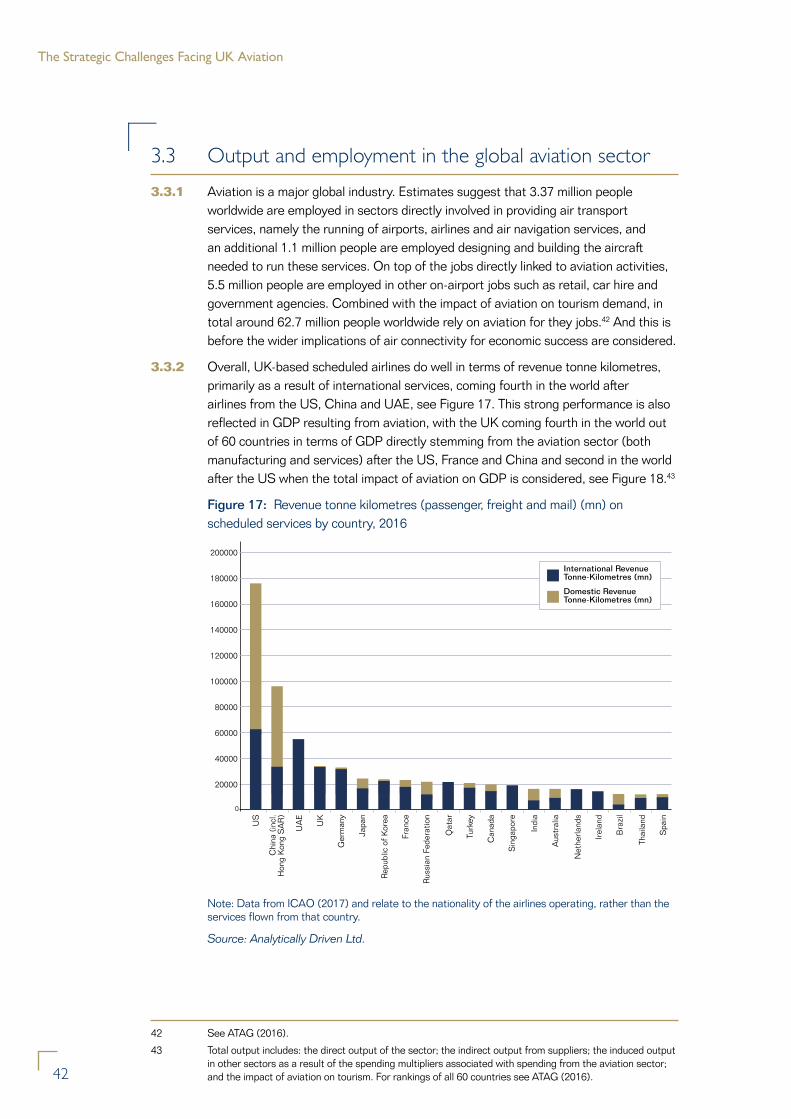
The Strategic Challenges Facing UK Aviation
42
3.3 Output and employment in the global aviation sector
3.3.1 Aviation is a major global industry. Estimates suggest that 3.37 million people worldwide are employed in sectors directly involved in providing air transport services, namely the running of airports, airlines and air navigation services, and an additional 1.1 million people are employed designing and building the aircraft needed to run these services. On top of the jobs directly linked to aviation activities, 5.5 million people are employed in other on-airport jobs such as retail, car hire and government agencies. Combined with the impact of aviation on tourism demand, in total around 62.7 million people worldwide rely on aviation for they jobs.42 And this is before the wider implications of air connectivity for economic success are considered.
3.3.2 Overall, UK-based scheduled airlines do well in terms of revenue tonne kilometres, primarily as a result of international services, coming fourth in the world after airlines from the US, China and UAE, see Figure 17. This strong performance is also reflected in GDP resulting from aviation, with the UK coming fourth in the world out of 60 countries in terms of GDP directly stemming from the aviation sector (both manufacturing and services) after the US, France and China and second in the world after the US when the total impact of aviation on GDP is considered, see Figure 18.43
Figure 17: Revenue tonne kilometres (passenger, freight and mail) (mn) on scheduled services by country, 2016
0
US
Chi
na (
incl
.H
ong
Kon
g S
AR
)
UA
E
UK
Ger
man
y
Japa
n
Rep
ublic
of K
orea
Fran
ce
Rus
sian
Fed
erat
ion
Qat
ar
Turk
ey
Can
ada
Sin
gapo
re
Indi
a
Aus
tral
ia
Net
herla
nds
Irel
and
Bra
zil
Thai
land
Spa
in
20000
40000
60000
80000
100000
120000
140000
160000
180000
200000
International RevenueTonne-Kilometres (mn)
Domestic RevenueTonne-Kilometres (mn)
Note: Data from ICAO (2017) and relate to the nationality of the airlines operating, rather than the services flown from that country.
Source: Analytically Driven Ltd.
42 See ATAG (2016).
43 Total output includes: the direct output of the sector; the indirect output from suppliers; the induced output in other sectors as a result of the spending multipliers associated with spending from the aviation sector; and the impact of aviation on tourism. For rankings of all 60 countries see ATAG (2016).
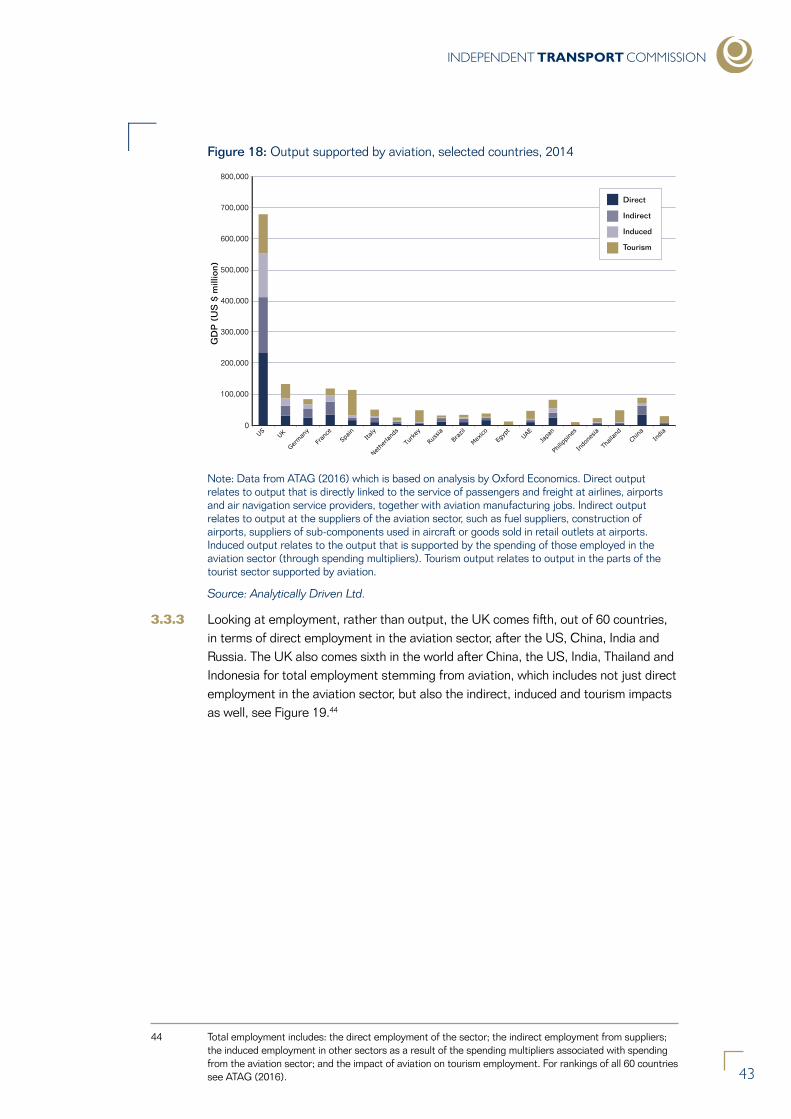
INDEPENDENT TRANSPORT COMMISSION
43
Figure 18: Output supported by aviation, selected countries, 2014
0
100,000
200,000
300,000
400,000
500,000
600,000
700,000
800,000
GD
P (
US
$ m
illio
n)Direct
Indirect
Induced
Tourism
Note: Data from ATAG (2016) which is based on analysis by Oxford Economics. Direct output relates to output that is directly linked to the service of passengers and freight at airlines, airports and air navigation service providers, together with aviation manufacturing jobs. Indirect output relates to output at the suppliers of the aviation sector, such as fuel suppliers, construction of airports, suppliers of sub-components used in aircraft or goods sold in retail outlets at airports. Induced output relates to the output that is supported by the spending of those employed in the aviation sector (through spending multipliers). Tourism output relates to output in the parts of the tourist sector supported by aviation.
Source: Analytically Driven Ltd.
3.3.3 Looking at employment, rather than output, the UK comes fifth, out of 60 countries, in terms of direct employment in the aviation sector, after the US, China, India and Russia. The UK also comes sixth in the world after China, the US, India, Thailand and Indonesia for total employment stemming from aviation, which includes not just direct employment in the aviation sector, but also the indirect, induced and tourism impacts as well, see Figure 19.44
44 Total employment includes: the direct employment of the sector; the indirect employment from suppliers; the induced employment in other sectors as a result of the spending multipliers associated with spending from the aviation sector; and the impact of aviation on tourism employment. For rankings of all 60 countries see ATAG (2016).
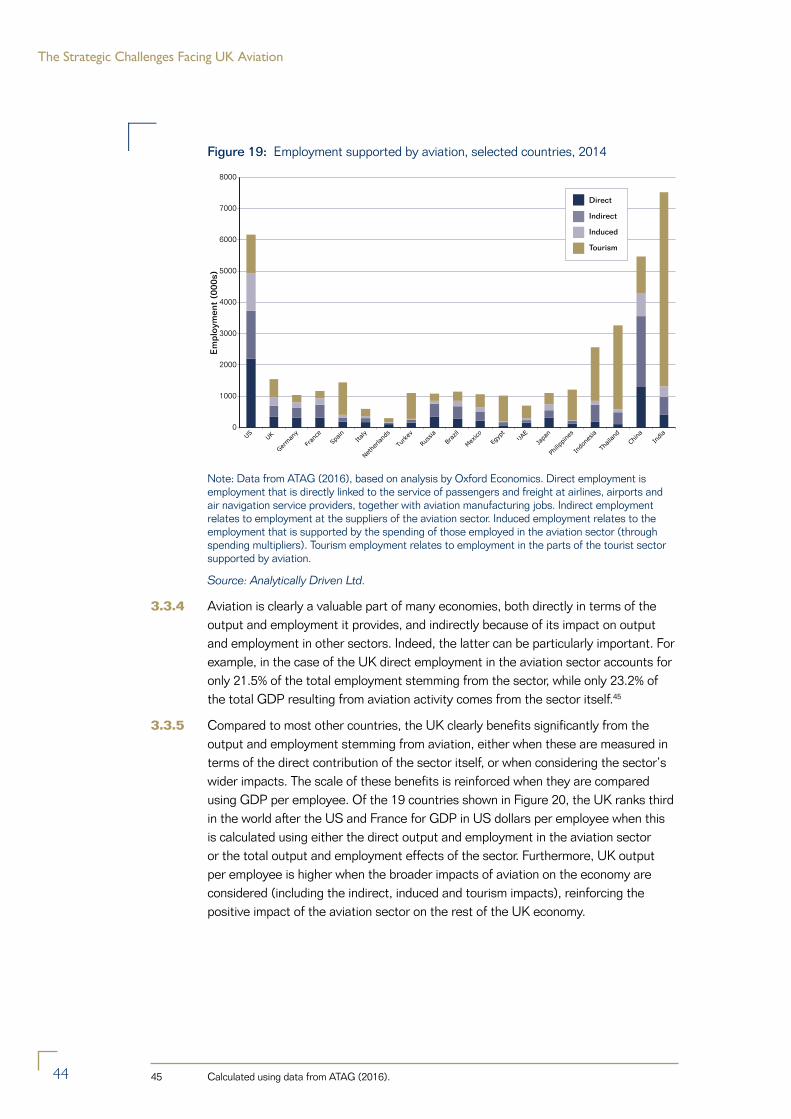
The Strategic Challenges Facing UK Aviation
44
Figure 19: Employment supported by aviation, selected countries, 2014
0
1000
2000
3000
4000
5000
6000
7000
8000
Em
ploy
men
t (0
00s)
Direct
Indirect
Induced
Tourism
Note: Data from ATAG (2016), based on analysis by Oxford Economics. Direct employment is employment that is directly linked to the service of passengers and freight at airlines, airports and air navigation service providers, together with aviation manufacturing jobs. Indirect employment relates to employment at the suppliers of the aviation sector. Induced employment relates to the employment that is supported by the spending of those employed in the aviation sector (through spending multipliers). Tourism employment relates to employment in the parts of the tourist sector supported by aviation.
Source: Analytically Driven Ltd.
3.3.4 Aviation is clearly a valuable part of many economies, both directly in terms of the output and employment it provides, and indirectly because of its impact on output and employment in other sectors. Indeed, the latter can be particularly important. For example, in the case of the UK direct employment in the aviation sector accounts for only 21.5% of the total employment stemming from the sector, while only 23.2% of the total GDP resulting from aviation activity comes from the sector itself.45
3.3.5 Compared to most other countries, the UK clearly benefits significantly from the output and employment stemming from aviation, either when these are measured in terms of the direct contribution of the sector itself, or when considering the sector’s wider impacts. The scale of these benefits is reinforced when they are compared using GDP per employee. Of the 19 countries shown in Figure 20, the UK ranks third in the world after the US and France for GDP in US dollars per employee when this is calculated using either the direct output and employment in the aviation sector or the total output and employment effects of the sector. Furthermore, UK output per employee is higher when the broader impacts of aviation on the economy are considered (including the indirect, induced and tourism impacts), reinforcing the positive impact of the aviation sector on the rest of the UK economy.
45 Calculated using data from ATAG (2016).
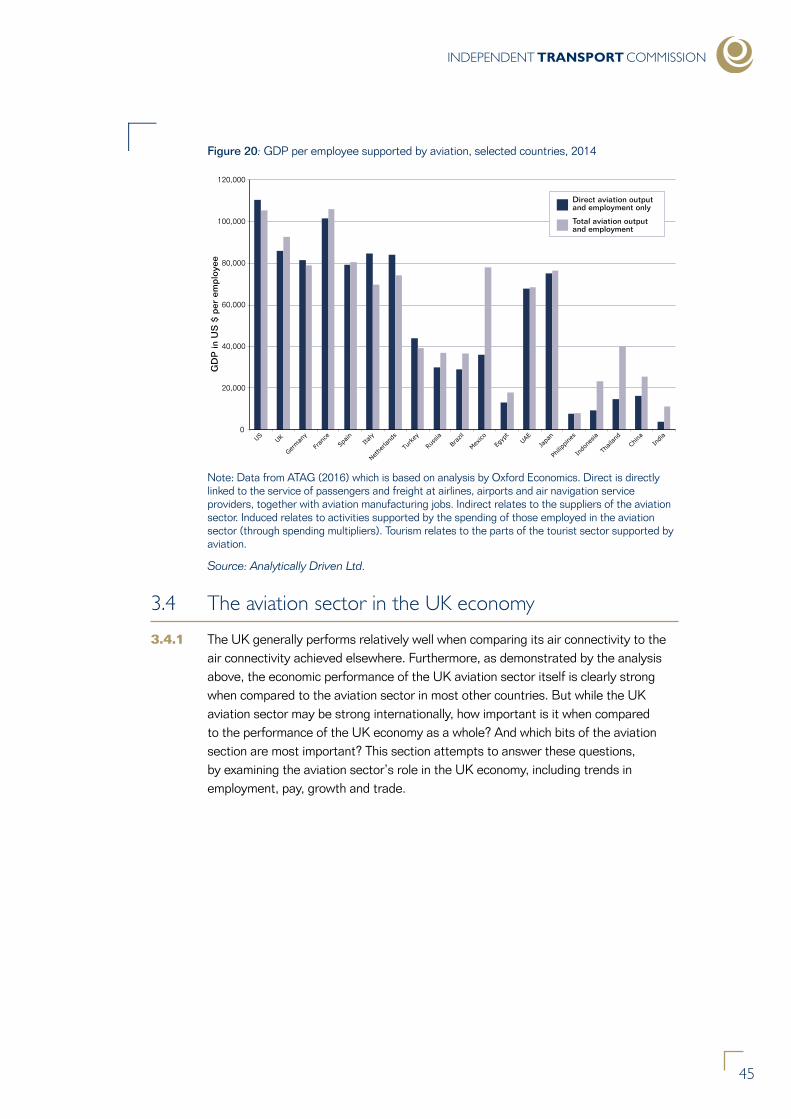
INDEPENDENT TRANSPORT COMMISSION
45
Figure 20: GDP per employee supported by aviation, selected countries, 2014
0
20,000
40,000
60,000
80,000
100,000
120,000
GD
P in
US
$ p
er e
mpl
oyee
Direct aviation outputand employment only
Total aviation outputand employment
Note: Data from ATAG (2016) which is based on analysis by Oxford Economics. Direct is directly linked to the service of passengers and freight at airlines, airports and air navigation service providers, together with aviation manufacturing jobs. Indirect relates to the suppliers of the aviation sector. Induced relates to activities supported by the spending of those employed in the aviation sector (through spending multipliers). Tourism relates to the parts of the tourist sector supported by aviation.
Source: Analytically Driven Ltd.
3.4 The aviation sector in the UK economy
3.4.1 The UK generally performs relatively well when comparing its air connectivity to the air connectivity achieved elsewhere. Furthermore, as demonstrated by the analysis above, the economic performance of the UK aviation sector itself is clearly strong when compared to the aviation sector in most other countries. But while the UK aviation sector may be strong internationally, how important is it when compared to the performance of the UK economy as a whole? And which bits of the aviation section are most important? This section attempts to answer these questions, by examining the aviation sector’s role in the UK economy, including trends in employment, pay, growth and trade.
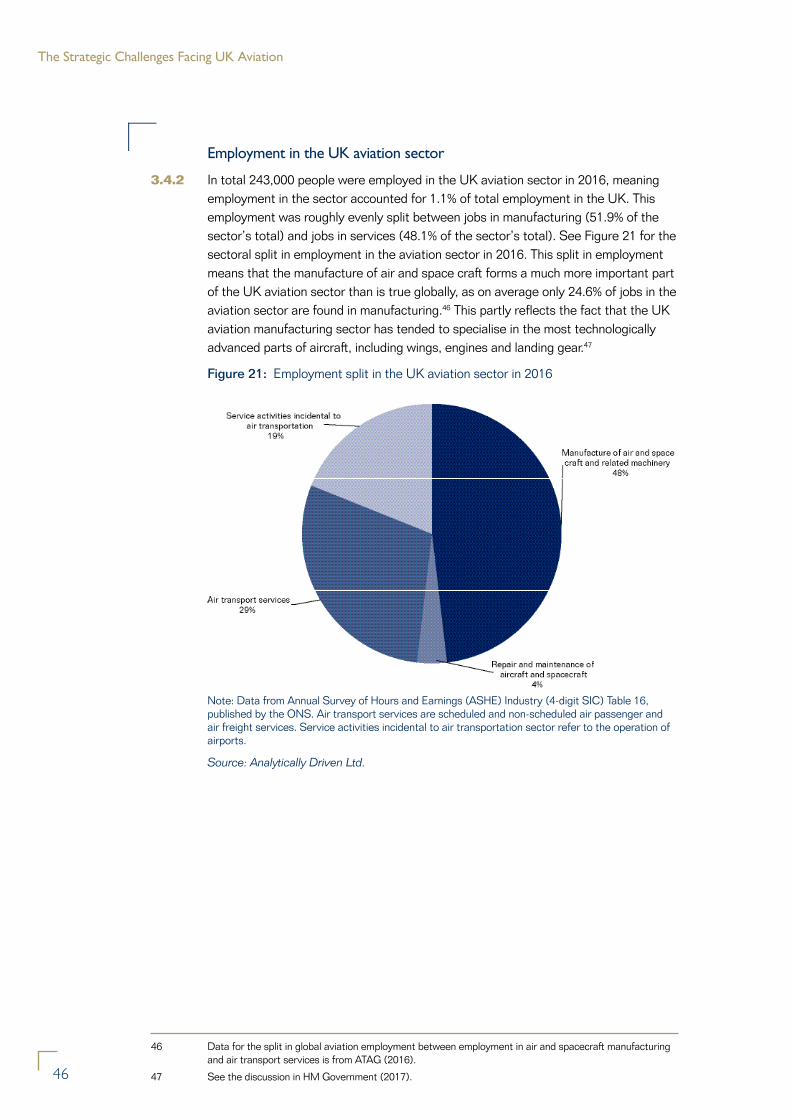
The Strategic Challenges Facing UK Aviation
46
Employment in the UK aviation sector
3.4.2 In total 243,000 people were employed in the UK aviation sector in 2016, meaning employment in the sector accounted for 1.1% of total employment in the UK. This employment was roughly evenly split between jobs in manufacturing (51.9% of the sector’s total) and jobs in services (48.1% of the sector’s total). See Figure 21 for the sectoral split in employment in the aviation sector in 2016. This split in employment means that the manufacture of air and space craft forms a much more important part of the UK aviation sector than is true globally, as on average only 24.6% of jobs in the aviation sector are found in manufacturing.46 This partly reflects the fact that the UK aviation manufacturing sector has tended to specialise in the most technologically advanced parts of aircraft, including wings, engines and landing gear.47
Figure 21: Employment split in the UK aviation sector in 2016
Note: Data from Annual Survey of Hours and Earnings (ASHE) Industry (4-digit SIC) Table 16, published by the ONS. Air transport services are scheduled and non-scheduled air passenger and air freight services. Service activities incidental to air transportation sector refer to the operation of airports.
Source: Analytically Driven Ltd.
46 Data for the split in global aviation employment between employment in air and spacecraft manufacturing and air transport services is from ATAG (2016).
47 See the discussion in HM Government (2017).
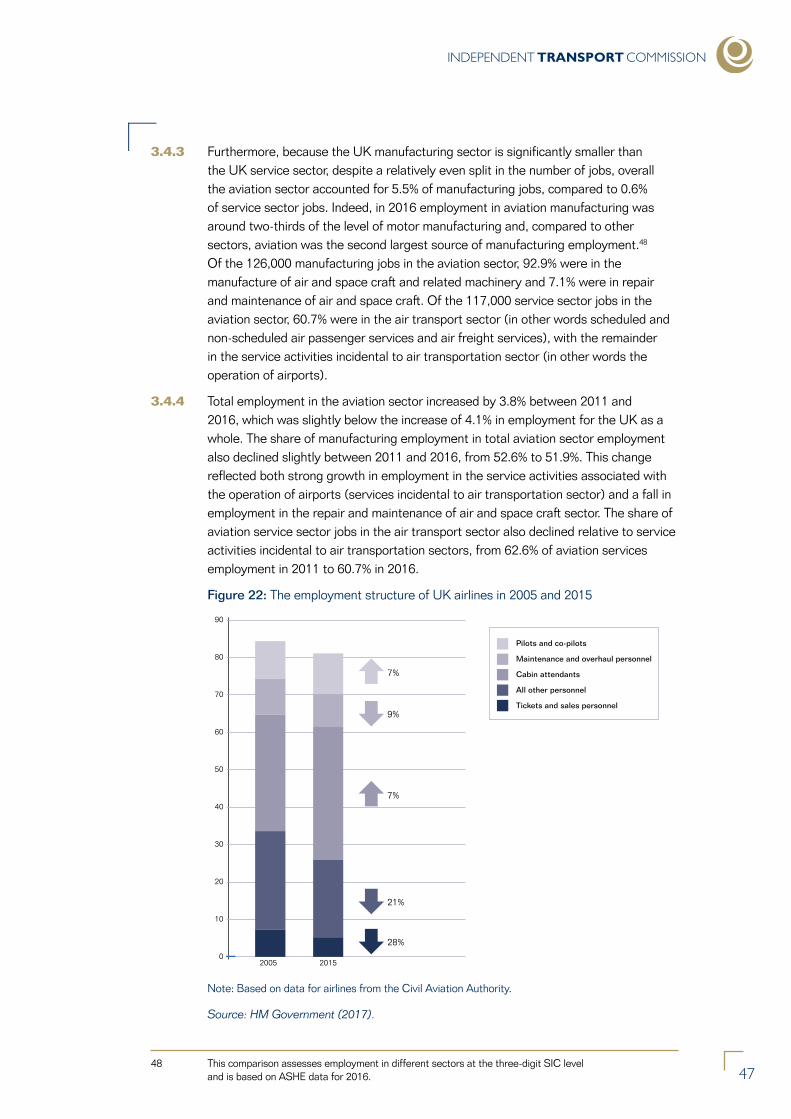
INDEPENDENT TRANSPORT COMMISSION
47
3.4.3 Furthermore, because the UK manufacturing sector is significantly smaller than the UK service sector, despite a relatively even split in the number of jobs, overall the aviation sector accounted for 5.5% of manufacturing jobs, compared to 0.6% of service sector jobs. Indeed, in 2016 employment in aviation manufacturing was around two-thirds of the level of motor manufacturing and, compared to other sectors, aviation was the second largest source of manufacturing employment.48 Of the 126,000 manufacturing jobs in the aviation sector, 92.9% were in the manufacture of air and space craft and related machinery and 7.1% were in repair and maintenance of air and space craft. Of the 117,000 service sector jobs in the aviation sector, 60.7% were in the air transport sector (in other words scheduled and non-scheduled air passenger services and air freight services), with the remainder in the service activities incidental to air transportation sector (in other words the operation of airports).
3.4.4 Total employment in the aviation sector increased by 3.8% between 2011 and 2016, which was slightly below the increase of 4.1% in employment for the UK as a whole. The share of manufacturing employment in total aviation sector employment also declined slightly between 2011 and 2016, from 52.6% to 51.9%. This change reflected both strong growth in employment in the service activities associated with the operation of airports (services incidental to air transportation sector) and a fall in employment in the repair and maintenance of air and space craft sector. The share of aviation service sector jobs in the air transport sector also declined relative to service activities incidental to air transportation sectors, from 62.6% of aviation services employment in 2011 to 60.7% in 2016.
Figure 22: The employment structure of UK airlines in 2005 and 2015
0
10
20
30
40
50
60
70
80
90
20152005
21%
7%
7%
28%
9%
Pilots and co-pilots
Maintenance and overhaul personnel
Cabin attendants
All other personnel
Tickets and sales personnel
Note: Based on data for airlines from the Civil Aviation Authority.
Source: HM Government (2017).
48 This comparison assesses employment in different sectors at the three-digit SIC level and is based on ASHE data for 2016.
The Strategic Challenges Facing UK Aviation
48
3.4.5 The fall in the employment associated with the repair and maintenance of aircraft can also be seen when examining the employment patterns for UK airlines, see Figure 22. On average between 2005 and 2015 employment amongst pilots, co-pilots and cabin crew increased, undoubtedly reflecting increased demand for flights. However, at the same time UK airlines have been cutting back employment on the ground, not just for repair and maintenance, but also in other areas, such as ticket sales. Despite the shift the airline sector, and aviation more generally, continues to provide a range of employment options, many of which are highly skilled.
Pay in the UK aviation sector
3.4.6 Pay in aviation in both the manufacturing and service sectors compares favourably to pay in other sectors. For example, gross hourly pay in the manufacture of air and spacecraft sector was 133% of the average level of pay for all employees in the UK; in the case of the repair and maintenance of air and space craft it was 121% of the UK average; in the case of air transport services it was 141% of the UK average; and in the case of service activities incidental to air transportation (in other words running airports) it was 135% of the UK average. Except in the case of repair and maintenance, average hourly pay is also significantly higher than in the comparable manufacturing and services sectors associated with land transport and water transport. Pay levels in the aviation sector also compare well at both the 20th and 80th percentiles.
3.4.7 Although pay in the freight air segment of the air transport services sector was lower than for the sector as a whole in 2016, it remains above the UK average. However, average hourly pay in the freight air transport services sector fell by -12% between 2011 and 2016, the only part of the aviation sector to see hourly pay decline over the period. This decline in hourly pay in the freight air transport services sector was partly compensated for by an 11.5% increase in average hours worked, meaning there was only a -1.3% decline in gross annual pay. However, the decline in hourly pay still suggests that freight air transport has not been performing as strongly as other parts of the sector.
3.4.8 A more detailed comparison of the pay and hours worked within the sector can be found in Tables 1 and 2.
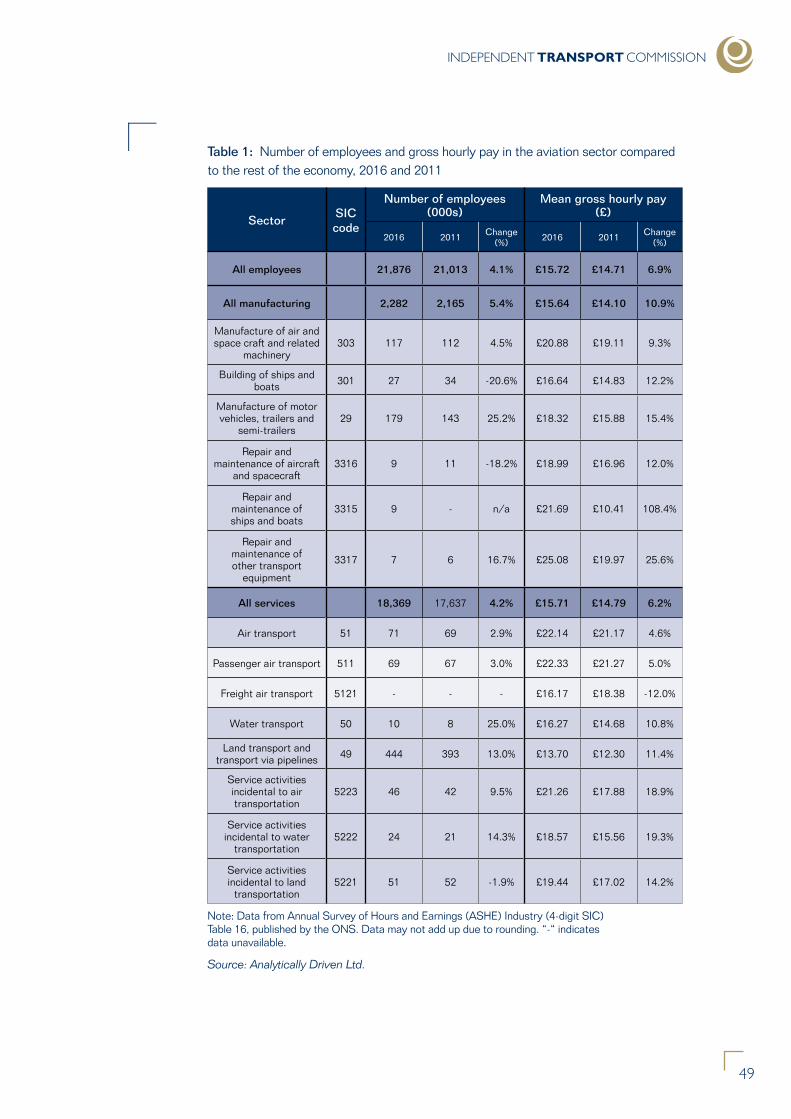
INDEPENDENT TRANSPORT COMMISSION
49
Table 1: Number of employees and gross hourly pay in the aviation sector compared to the rest of the economy, 2016 and 2011
SectorSIC code
Number of employees (000s)
Mean gross hourly pay (£)
2016 2011 Change (%) 2016 2011 Change
(%)
All employees 21,876 21,013 4.1% £15.72 £14.71 6.9%
All manufacturing 2,282 2,165 5.4% £15.64 £14.10 10.9%
Manufacture of air and space craft and related
machinery303 117 112 4.5% £20.88 £19.11 9.3%
Building of ships and boats 301 27 34 -20.6% £16.64 £14.83 12.2%
Manufacture of motor vehicles, trailers and
semi-trailers29 179 143 25.2% £18.32 £15.88 15.4%
Repair and maintenance of aircraft
and spacecraft3316 9 11 -18.2% £18.99 £16.96 12.0%
Repair and maintenance of ships and boats
3315 9 - n/a £21.69 £10.41 108.4%
Repair and maintenance of other transport
equipment
3317 7 6 16.7% £25.08 £19.97 25.6%
All services 18,369 17,637 4.2% £15.71 £14.79 6.2%
Air transport 51 71 69 2.9% £22.14 £21.17 4.6%
Passenger air transport 511 69 67 3.0% £22.33 £21.27 5.0%
Freight air transport 5121 - - - £16.17 £18.38 -12.0%
Water transport 50 10 8 25.0% £16.27 £14.68 10.8%
Land transport and transport via pipelines 49 444 393 13.0% £13.70 £12.30 11.4%
Service activities incidental to air transportation
5223 46 42 9.5% £21.26 £17.88 18.9%
Service activities incidental to water
transportation5222 24 21 14.3% £18.57 £15.56 19.3%
Service activities incidental to land
transportation5221 51 52 -1.9% £19.44 £17.02 14.2%
Note: Data from Annual Survey of Hours and Earnings (ASHE) Industry (4-digit SIC) Table 16, published by the ONS. Data may not add up due to rounding. “-“ indicates data unavailable.
Source: Analytically Driven Ltd.

The Strategic Challenges Facing UK Aviation
50
Table 2: Comparison of hours worked and gross annual pay in the aviation sector compared to the rest of the economy in 2016
SectorSIC code
Paid hours worked (mean)
Share of full time
employees (%)
Gross annual pay, all employees (£)
Mean 20th percentile
80th percentile
All employees 33.4 72.7% £28,296 £11,962 £38,791
All manufacturing 39.1 91.8% £32,047 £17,991 £42,000
Manufacture of air and space craft and related
machinery303 38.4 96.6% £40,800 £29,449 £49,607
Building of ships and boats 301 41.0 100.0% £33,772 £23,600 £41,792
Manufacture of motor vehicles, trailers and
semi-trailers29 40.1 96.6% £39,066 £22,516 £49,896
Repair and maintenance of aircraft
and spacecraft3316 38.7 100.0% £37,970 £25,445 -
Repair and maintenance of ships and boats
3315 36.9 100.0% £40,860 - -
Repair and maintenance of other transport
equipment
3317 39.5 - £53,659 - -
All services 32.4 69.4% £27,548 £10,945 £37,887
Air transport 51 34.3 63.4% £39,557 £19,828 £52,164
Passenger air transport 511 34.0 63.8% £39,588 £19,772 £52,042
Freight air transport 5121 43.7 - £38,280 - -
Water transport 50 36.5 90.0% £31,394 £17,983 -
Land transport and transport via pipelines 49 41.9 87.4% £29,029 £18,339 £38,097
Service activities incidental to air transportation
5223 38.4 89.1% £43,513 - -
Service activities incidental to water
transportation5222 39.1 91.7% £36,823 £23,390 -
Service activities incidental to land
transportation5221 38.5 96.1% £40,323 £22,298 £53,665
Note: Data from Annual Survey of Hours and Earnings (ASHE) Industry (4-digit SIC) Table 16, published by the ONS. Data may not add up due to rounding. “-“ indicates data unavailable.
Source: Analytically Driven Ltd.
INDEPENDENT TRANSPORT COMMISSION
51
3.4.9 As noted above, the UK aviation sector as a whole accounted for 1.1% of employment in 2016. Estimates suggest that in 2014 the aviation sector also accounted for 2.0% of UK total output, or roughly £62.8bn (of which £26.8bn came from the aviation manufacturing sector, £20.3bn from the air transport services sector and the remainder from the operation of airports), as well as 1.4% of UK gross value added (GVA) and 6.2% of UK total exports.49 In addition estimates suggest that in 2014 the sector accounted for 1.7% of employee compensation in the UK. In terms of the sectoral split between manufacturing and services, the UK aviation manufacturing sector accounted for 52% of employment in the aviation sector, 45% of the sector’s total output, 34% of its GVA, 74% of its exports and 38% of employee compensation. See Table 3 for more details.
3.4.10 The UK aviation sector has clear economic benefits, including high rates of pay, strong employment growth in much of the sector, and sectoral shares of UK total output and UK gross value added that are higher than the sector’s employment share in almost all cases. However, the growth rates in the sector over the period 2004 to 2014 (which are the latest data available) have been more mixed. This is particularly true of aviation manufacturing. While exports grew strongly over that period, compared to exports for the UK as a whole, the growth in output and in employee compensation were both below the national average, while GVA for the aviation manufacturing sector fell over that period, see Table 4.
49 Data for output, GVA and exports for the service activities incidental to air transportation sector (the operation of airports) are not provided separately with the input-output tables and have therefore been estimated using the sector’s share of employment (of 38%) within the warehousing and support services for transportation sector. It is not possible to obtain a comparable breakdown for the UK national accounts, because the warehousing and support services for transportation sector is not split between its components for air, land and water. The operations of airports sector only contains aviation activities and excludes for example retail outlets at airports, or government agencies working at airports.
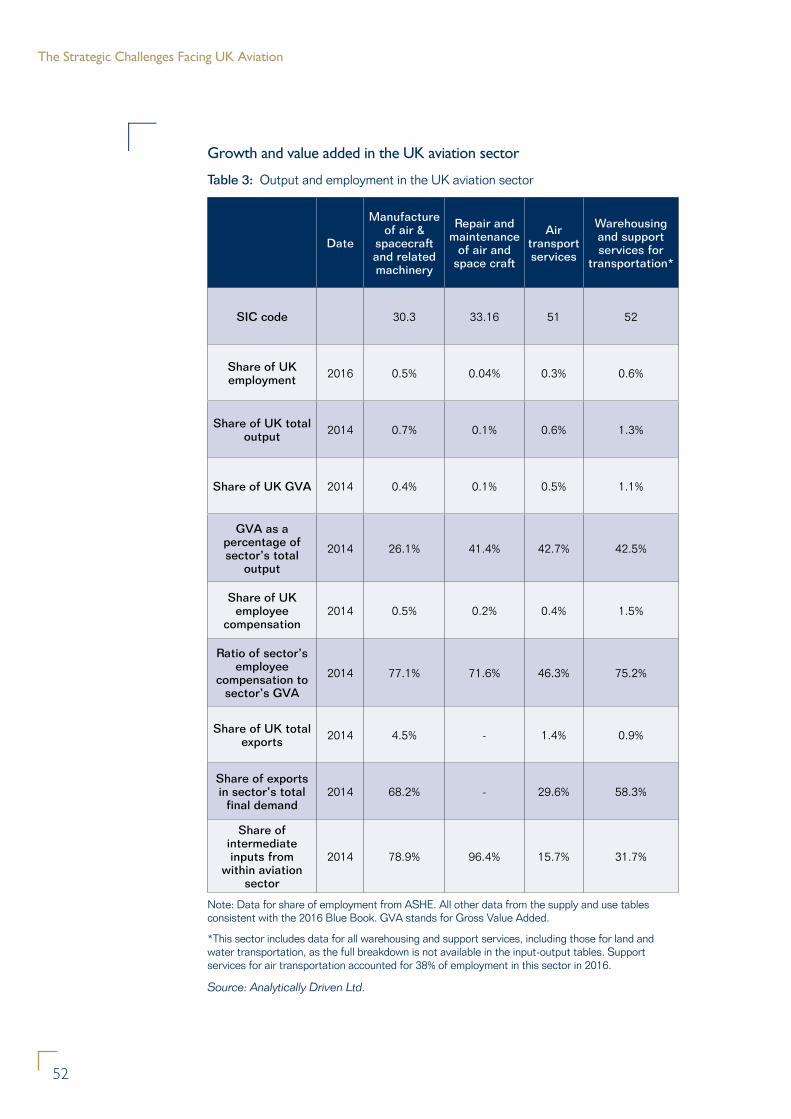
The Strategic Challenges Facing UK Aviation
52
Growth and value added in the UK aviation sector
Table 3: Output and employment in the UK aviation sector
Date
Manufacture of air &
spacecraft and related machinery
Repair and maintenance
of air and space craft
Air transport services
Warehousing and support services for
transportation*
SIC code 30.3 33.16 51 52
Share of UK employment 2016 0.5% 0.04% 0.3% 0.6%
Share of UK total output 2014 0.7% 0.1% 0.6% 1.3%
Share of UK GVA 2014 0.4% 0.1% 0.5% 1.1%
GVA as a percentage of sector’s total
output
2014 26.1% 41.4% 42.7% 42.5%
Share of UK employee
compensation2014 0.5% 0.2% 0.4% 1.5%
Ratio of sector’s employee
compensation to sector’s GVA
2014 77.1% 71.6% 46.3% 75.2%
Share of UK total exports 2014 4.5% - 1.4% 0.9%
Share of exports in sector’s total
final demand2014 68.2% - 29.6% 58.3%
Share of intermediate inputs from
within aviation sector
2014 78.9% 96.4% 15.7% 31.7%
Note: Data for share of employment from ASHE. All other data from the supply and use tables consistent with the 2016 Blue Book. GVA stands for Gross Value Added.
*This sector includes data for all warehousing and support services, including those for land and water transportation, as the full breakdown is not available in the input-output tables. Support services for air transportation accounted for 38% of employment in this sector in 2016.
Source: Analytically Driven Ltd.
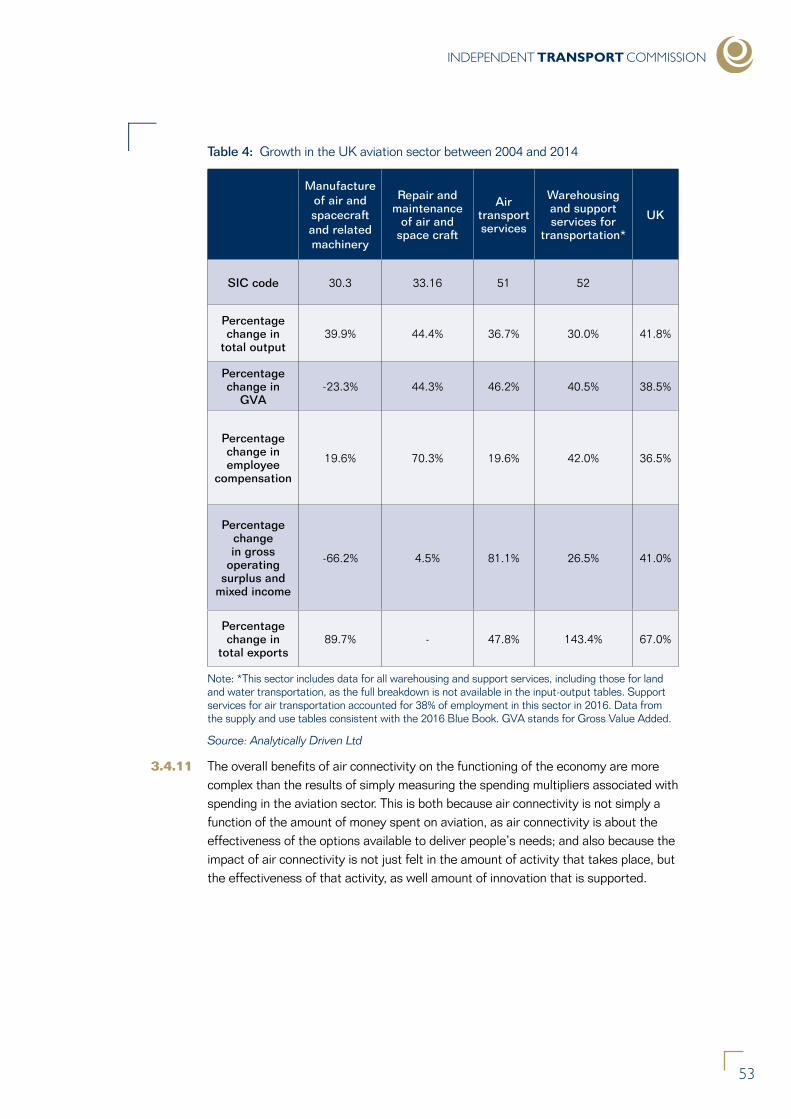
INDEPENDENT TRANSPORT COMMISSION
53
Table 4: Growth in the UK aviation sector between 2004 and 2014
Manufacture of air and spacecraft and related machinery
Repair and maintenance
of air and space craft
Air transport services
Warehousing and support services for
transportation*
UK
SIC code 30.3 33.16 51 52
Percentage change in
total output39.9% 44.4% 36.7% 30.0% 41.8%
Percentage change in
GVA-23.3% 44.3% 46.2% 40.5% 38.5%
Percentage change in employee
compensation
19.6% 70.3% 19.6% 42.0% 36.5%
Percentage change in gross
operating surplus and
mixed income
-66.2% 4.5% 81.1% 26.5% 41.0%
Percentage change in
total exports89.7% - 47.8% 143.4% 67.0%
Note: *This sector includes data for all warehousing and support services, including those for land and water transportation, as the full breakdown is not available in the input-output tables. Support services for air transportation accounted for 38% of employment in this sector in 2016. Data from the supply and use tables consistent with the 2016 Blue Book. GVA stands for Gross Value Added.
Source: Analytically Driven Ltd
3.4.11 The overall benefits of air connectivity on the functioning of the economy are more complex than the results of simply measuring the spending multipliers associated with spending in the aviation sector. This is both because air connectivity is not simply a function of the amount of money spent on aviation, as air connectivity is about the effectiveness of the options available to deliver people’s needs; and also because the impact of air connectivity is not just felt in the amount of activity that takes place, but the effectiveness of that activity, as well amount of innovation that is supported.
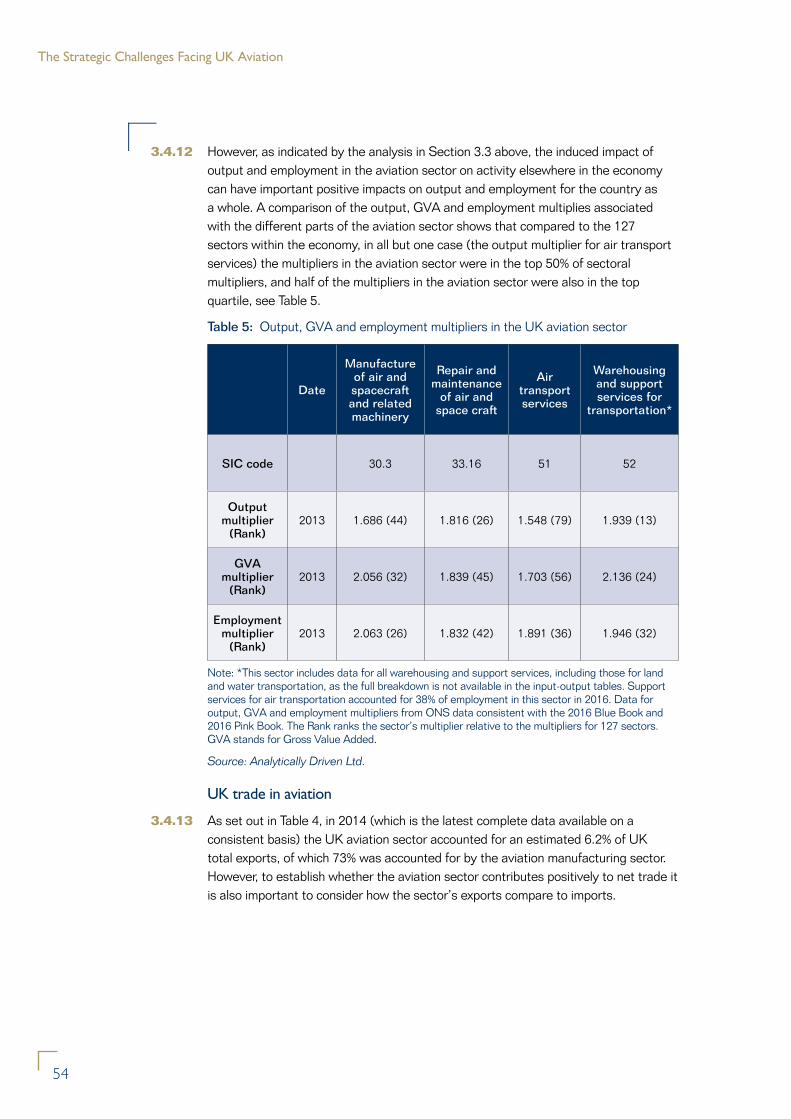
The Strategic Challenges Facing UK Aviation
54
3.4.12 However, as indicated by the analysis in Section 3.3 above, the induced impact of output and employment in the aviation sector on activity elsewhere in the economy can have important positive impacts on output and employment for the country as a whole. A comparison of the output, GVA and employment multiplies associated with the different parts of the aviation sector shows that compared to the 127 sectors within the economy, in all but one case (the output multiplier for air transport services) the multipliers in the aviation sector were in the top 50% of sectoral multipliers, and half of the multipliers in the aviation sector were also in the top quartile, see Table 5.
Table 5: Output, GVA and employment multipliers in the UK aviation sector
Date
Manufacture of air and spacecraft and related machinery
Repair and maintenance
of air and space craft
Air transport services
Warehousing and support services for
transportation*
SIC code 30.3 33.16 51 52
Output multiplier
(Rank)2013 1.686 (44) 1.816 (26) 1.548 (79) 1.939 (13)
GVA multiplier
(Rank)2013 2.056 (32) 1.839 (45) 1.703 (56) 2.136 (24)
Employment multiplier
(Rank)2013 2.063 (26) 1.832 (42) 1.891 (36) 1.946 (32)
Note: *This sector includes data for all warehousing and support services, including those for land and water transportation, as the full breakdown is not available in the input-output tables. Support services for air transportation accounted for 38% of employment in this sector in 2016. Data for output, GVA and employment multipliers from ONS data consistent with the 2016 Blue Book and 2016 Pink Book. The Rank ranks the sector’s multiplier relative to the multipliers for 127 sectors. GVA stands for Gross Value Added.
Source: Analytically Driven Ltd.
UK trade in aviation
3.4.13 As set out in Table 4, in 2014 (which is the latest complete data available on a consistent basis) the UK aviation sector accounted for an estimated 6.2% of UK total exports, of which 73% was accounted for by the aviation manufacturing sector. However, to establish whether the aviation sector contributes positively to net trade it is also important to consider how the sector’s exports compare to imports.
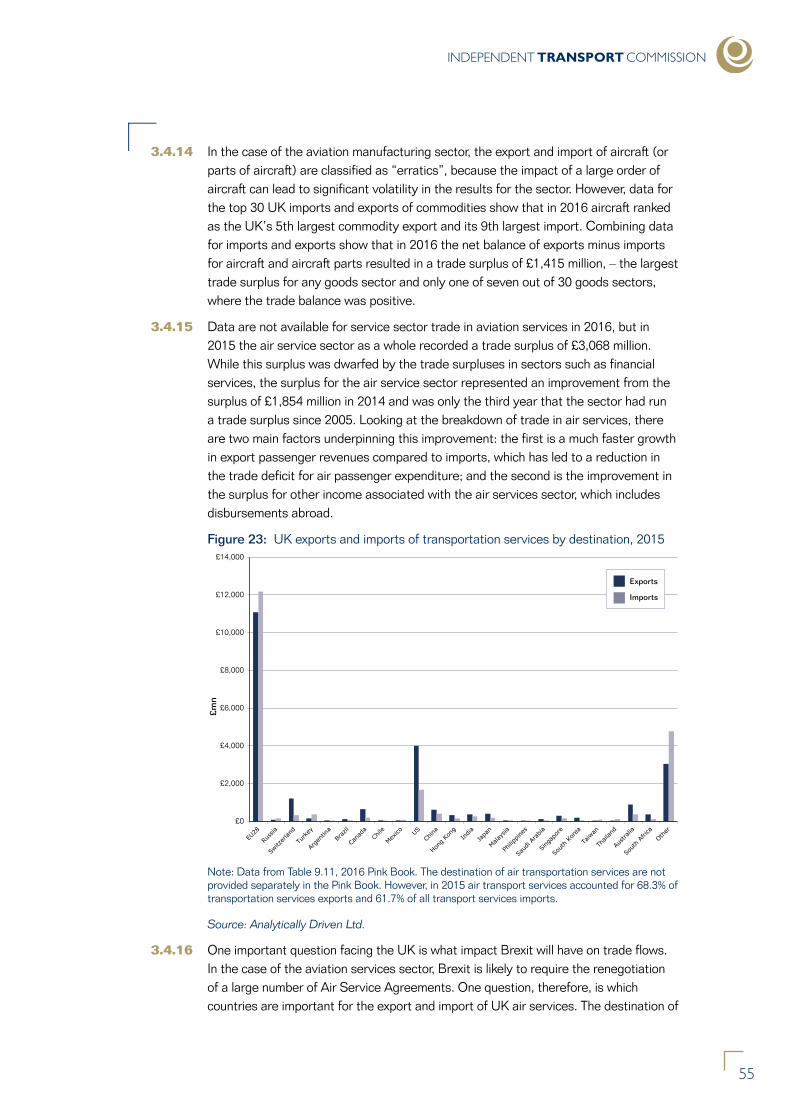
INDEPENDENT TRANSPORT COMMISSION
55
3.4.14 In the case of the aviation manufacturing sector, the export and import of aircraft (or parts of aircraft) are classified as “erratics”, because the impact of a large order of aircraft can lead to significant volatility in the results for the sector. However, data for the top 30 UK imports and exports of commodities show that in 2016 aircraft ranked as the UK’s 5th largest commodity export and its 9th largest import. Combining data for imports and exports show that in 2016 the net balance of exports minus imports for aircraft and aircraft parts resulted in a trade surplus of £1,415 million, – the largest trade surplus for any goods sector and only one of seven out of 30 goods sectors, where the trade balance was positive.
3.4.15 Data are not available for service sector trade in aviation services in 2016, but in 2015 the air service sector as a whole recorded a trade surplus of £3,068 million. While this surplus was dwarfed by the trade surpluses in sectors such as financial services, the surplus for the air service sector represented an improvement from the surplus of £1,854 million in 2014 and was only the third year that the sector had run a trade surplus since 2005. Looking at the breakdown of trade in air services, there are two main factors underpinning this improvement: the first is a much faster growth in export passenger revenues compared to imports, which has led to a reduction in the trade deficit for air passenger expenditure; and the second is the improvement in the surplus for other income associated with the air services sector, which includes disbursements abroad.
Figure 23: UK exports and imports of transportation services by destination, 2015
£0
£2,000
£4,000
£6,000
£8,000
£10,000
£12,000
£14,000
£mn
Exports
Imports
Note: Data from Table 9.11, 2016 Pink Book. The destination of air transportation services are not provided separately in the Pink Book. However, in 2015 air transport services accounted for 68.3% of transportation services exports and 61.7% of all transport services imports.
Source: Analytically Driven Ltd.
3.4.16 One important question facing the UK is what impact Brexit will have on trade flows. In the case of the aviation services sector, Brexit is likely to require the renegotiation of a large number of Air Service Agreements. One question, therefore, is which countries are important for the export and import of UK air services. The destination of
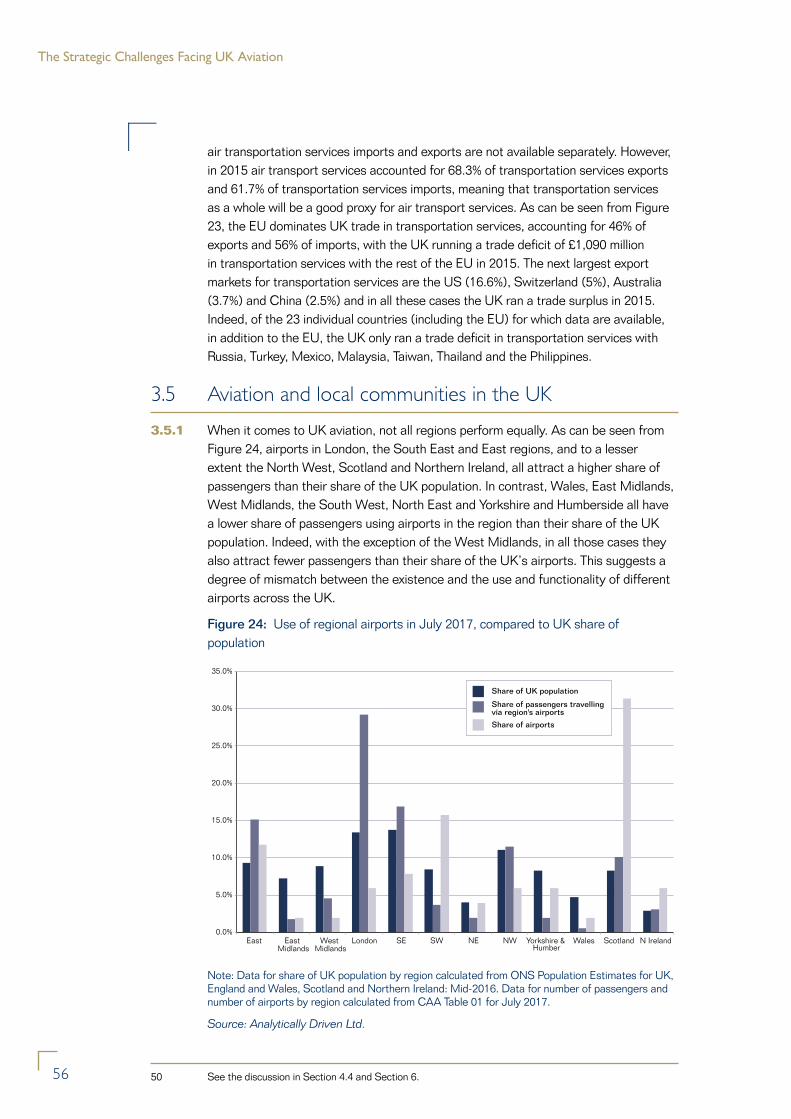
The Strategic Challenges Facing UK Aviation
56
air transportation services imports and exports are not available separately. However, in 2015 air transport services accounted for 68.3% of transportation services exports and 61.7% of transportation services imports, meaning that transportation services as a whole will be a good proxy for air transport services. As can be seen from Figure 23, the EU dominates UK trade in transportation services, accounting for 46% of exports and 56% of imports, with the UK running a trade deficit of £1,090 million in transportation services with the rest of the EU in 2015. The next largest export markets for transportation services are the US (16.6%), Switzerland (5%), Australia (3.7%) and China (2.5%) and in all these cases the UK ran a trade surplus in 2015. Indeed, of the 23 individual countries (including the EU) for which data are available, in addition to the EU, the UK only ran a trade deficit in transportation services with Russia, Turkey, Mexico, Malaysia, Taiwan, Thailand and the Philippines.
3.5 Aviation and local communities in the UK
3.5.1 When it comes to UK aviation, not all regions perform equally. As can be seen from Figure 24, airports in London, the South East and East regions, and to a lesser extent the North West, Scotland and Northern Ireland, all attract a higher share of passengers than their share of the UK population. In contrast, Wales, East Midlands, West Midlands, the South West, North East and Yorkshire and Humberside all have a lower share of passengers using airports in the region than their share of the UK population. Indeed, with the exception of the West Midlands, in all those cases they also attract fewer passengers than their share of the UK’s airports. This suggests a degree of mismatch between the existence and the use and functionality of different airports across the UK.
Figure 24: Use of regional airports in July 2017, compared to UK share of population
0.0%
5.0%
10.0%
15.0%
20.0%
25.0%
30.0%
35.0%
East East Midlands
West Midlands
London SE SW NE NW Yorkshire & Humber
Wales Scotland N Ireland
Share of UK population
Share of passengers travellingvia region's airports
Share of airports
Note: Data for share of UK population by region calculated from ONS Population Estimates for UK, England and Wales, Scotland and Northern Ireland: Mid-2016. Data for number of passengers and number of airports by region calculated from CAA Table 01 for July 2017.
Source: Analytically Driven Ltd.
50 See the discussion in Section 4.4 and Section 6.
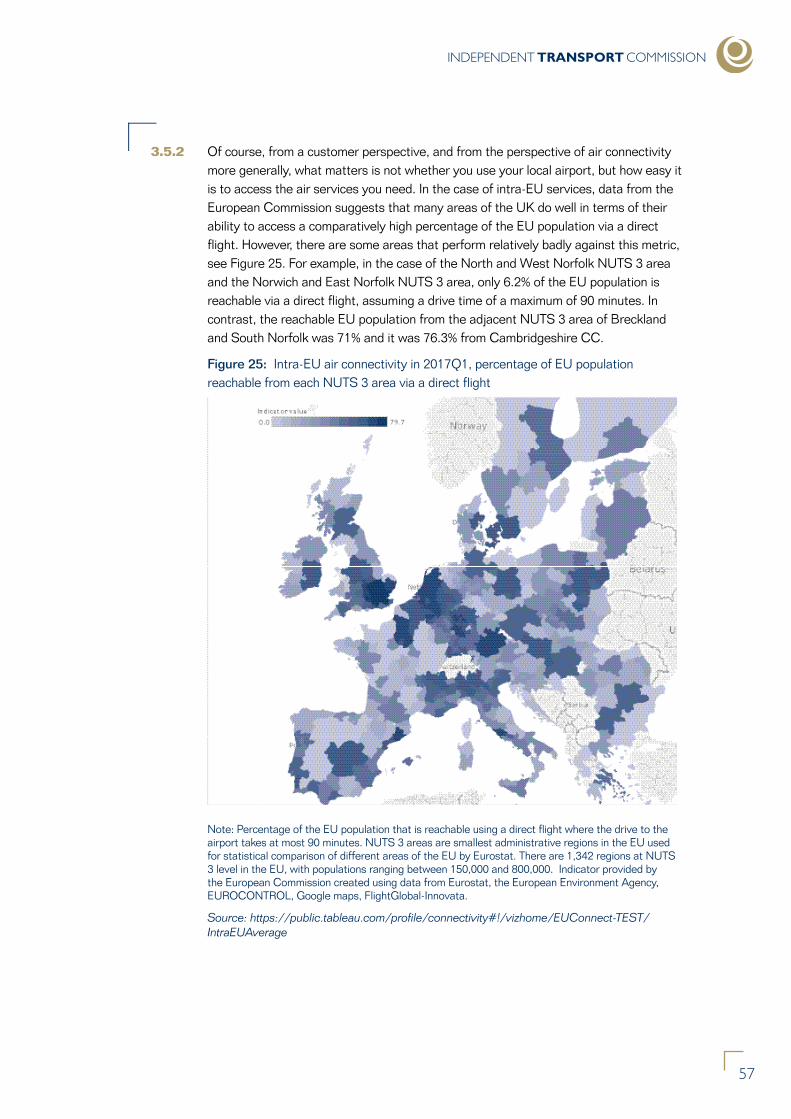
INDEPENDENT TRANSPORT COMMISSION
57
3.5.2 Of course, from a customer perspective, and from the perspective of air connectivity more generally, what matters is not whether you use your local airport, but how easy it is to access the air services you need. In the case of intra-EU services, data from the European Commission suggests that many areas of the UK do well in terms of their ability to access a comparatively high percentage of the EU population via a direct flight. However, there are some areas that perform relatively badly against this metric, see Figure 25. For example, in the case of the North and West Norfolk NUTS 3 area and the Norwich and East Norfolk NUTS 3 area, only 6.2% of the EU population is reachable via a direct flight, assuming a drive time of a maximum of 90 minutes. In contrast, the reachable EU population from the adjacent NUTS 3 area of Breckland and South Norfolk was 71% and it was 76.3% from Cambridgeshire CC.
Figure 25: Intra-EU air connectivity in 2017Q1, percentage of EU population reachable from each NUTS 3 area via a direct flight
Note: Percentage of the EU population that is reachable using a direct flight where the drive to the airport takes at most 90 minutes. NUTS 3 areas are smallest administrative regions in the EU used for statistical comparison of different areas of the EU by Eurostat. There are 1,342 regions at NUTS 3 level in the EU, with populations ranging between 150,000 and 800,000. Indicator provided by the European Commission created using data from Eurostat, the European Environment Agency, EUROCONTROL, Google maps, FlightGlobal-Innovata.
Source: https://public.tableau.com/profile/connectivity#!/vizhome/EUConnect-TEST/IntraEUAverage
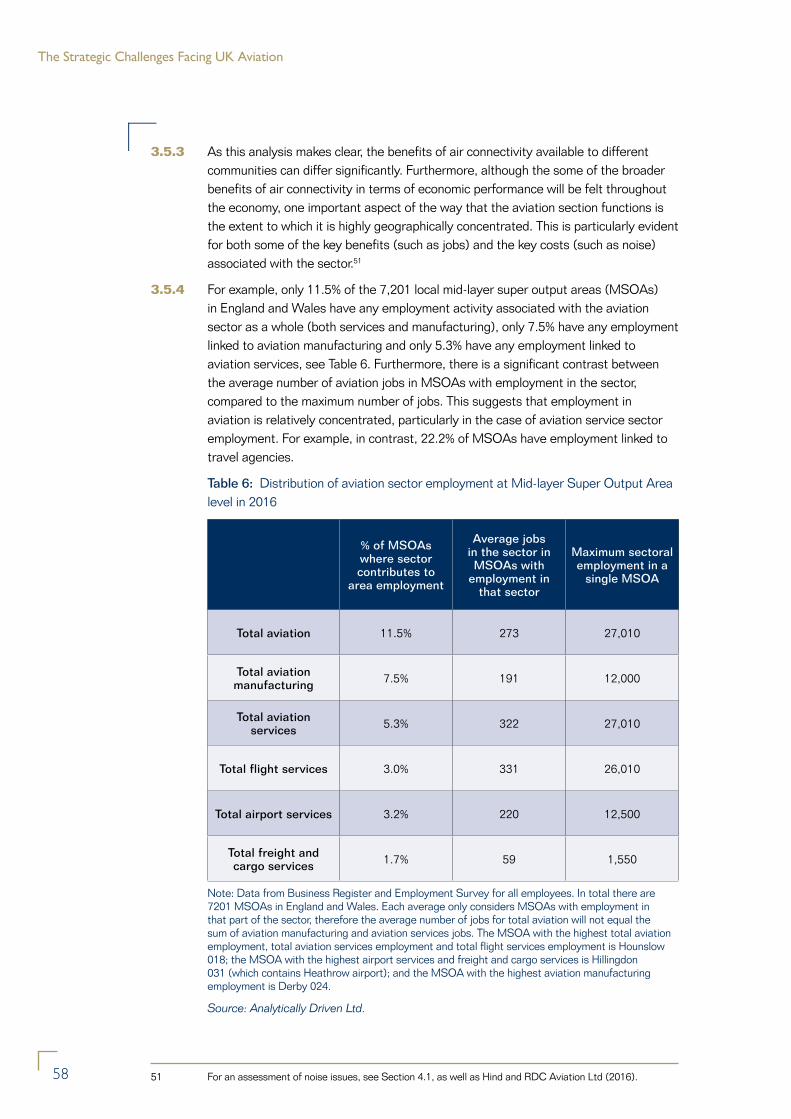
The Strategic Challenges Facing UK Aviation
58
3.5.3 As this analysis makes clear, the benefits of air connectivity available to different communities can differ significantly. Furthermore, although the some of the broader benefits of air connectivity in terms of economic performance will be felt throughout the economy, one important aspect of the way that the aviation section functions is the extent to which it is highly geographically concentrated. This is particularly evident for both some of the key benefits (such as jobs) and the key costs (such as noise) associated with the sector.51
3.5.4 For example, only 11.5% of the 7,201 local mid-layer super output areas (MSOAs) in England and Wales have any employment activity associated with the aviation sector as a whole (both services and manufacturing), only 7.5% have any employment linked to aviation manufacturing and only 5.3% have any employment linked to aviation services, see Table 6. Furthermore, there is a significant contrast between the average number of aviation jobs in MSOAs with employment in the sector, compared to the maximum number of jobs. This suggests that employment in aviation is relatively concentrated, particularly in the case of aviation service sector employment. For example, in contrast, 22.2% of MSOAs have employment linked to travel agencies.
Table 6: Distribution of aviation sector employment at Mid-layer Super Output Area level in 2016
% of MSOAs where sector contributes to
area employment
Average jobs in the sector in MSOAs with
employment in that sector
Maximum sectoral employment in a
single MSOA
Total aviation 11.5% 273 27,010
Total aviation manufacturing 7.5% 191 12,000
Total aviation services 5.3% 322 27,010
Total flight services 3.0% 331 26,010
Total airport services 3.2% 220 12,500
Total freight and cargo services 1.7% 59 1,550
Note: Data from Business Register and Employment Survey for all employees. In total there are 7201 MSOAs in England and Wales. Each average only considers MSOAs with employment in that part of the sector, therefore the average number of jobs for total aviation will not equal the sum of aviation manufacturing and aviation services jobs. The MSOA with the highest total aviation employment, total aviation services employment and total flight services employment is Hounslow 018; the MSOA with the highest airport services and freight and cargo services is Hillingdon 031 (which contains Heathrow airport); and the MSOA with the highest aviation manufacturing employment is Derby 024.
Source: Analytically Driven Ltd.
51 For an assessment of noise issues, see Section 4.1, as well as Hind and RDC Aviation Ltd (2016).
INDEPENDENT TRANSPORT COMMISSION
59
3.5.5 The geographic concentration of aviation employment is even easier to see when assessing employment patterns associated with the Top 10 airports in England and Wales by passenger numbers, see Table 7. In total aviation employment in the 10 MSOAs where these airports are located accounted for 30.7% of total aviation employment (manufacturing and services) in England in 2016. In addition, in all but one case aviation employment accounted for over 10% local employment in the MSOA and in seven cases it accounted for over 30% of the local MSOA employment. Furthermore, this employment only represents the employment in the aviation sector itself, meaning that there will be significant numbers of additional jobs in the non-aviation parts of the aviation value chain at these locations, such as work in retail outlets and government agencies.
3.5.6 In general, the positive impact of major airports on local employment patterns can be seen by using 2011 Census data to compare the commuting patterns between employed people who live in the relevant MSOA and those who work in it. For example, as shown in Table 7, in all cases the average commuting distances for those working in the MSOA associated with a top 10 airport were above the distances commuted on average by employed residents in the MSOA, indicating that a top 10 airport acts as a significant draw for those seeking employment. This observation is reinforced by the fact that in all cases more workers were employed in the MSOAs associated with a top 10 airport than lived there, which is only true for 28.1% of MSOAs, and in some cases these differences are substantial. For example, in the case of Heathrow the difference between the number of workers based for work in Heathrow’s MSOA and those living there was 41,599. Indeed there were only 3,316 residents in employment living in the MSOA for Heathrow at the time of the 2011 Census. It is not surprising, therefore, that when the 7201 MSOAs are ranked by the extent to which they account for more employment than there are residents in employment, Heathrow ranks as 14th in the country, with Gatwick ranking as 50th and Manchester as 75th.
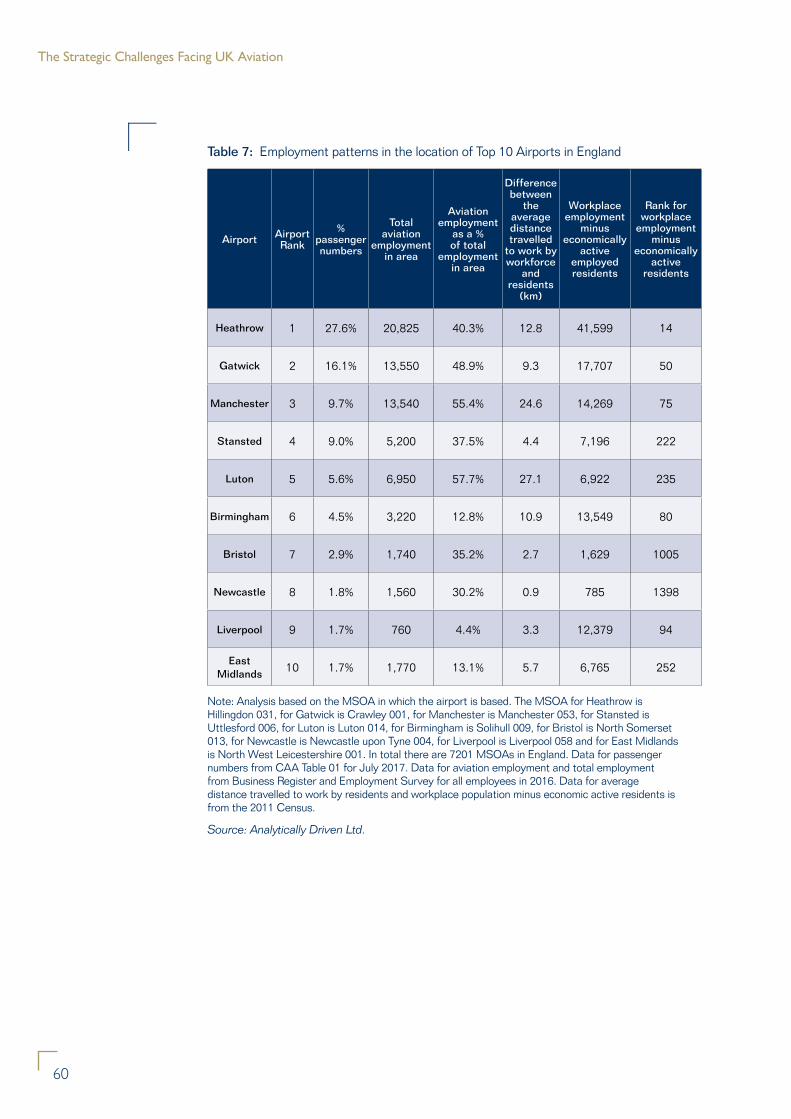
The Strategic Challenges Facing UK Aviation
60
Table 7: Employment patterns in the location of Top 10 Airports in England
Airport Airport Rank
% passenger numbers
Total aviation
employment in area
Aviation employment
as a % of total
employment in area
Difference between
the average distance travelled
to work by workforce
and residents
(km)
Workplace employment
minus economically
active employed residents
Rank for workplace
employment minus
economically active
residents
Heathrow 1 27.6% 20,825 40.3% 12.8 41,599 14
Gatwick 2 16.1% 13,550 48.9% 9.3 17,707 50
Manchester 3 9.7% 13,540 55.4% 24.6 14,269 75
Stansted 4 9.0% 5,200 37.5% 4.4 7,196 222
Luton 5 5.6% 6,950 57.7% 27.1 6,922 235
Birmingham 6 4.5% 3,220 12.8% 10.9 13,549 80
Bristol 7 2.9% 1,740 35.2% 2.7 1,629 1005
Newcastle 8 1.8% 1,560 30.2% 0.9 785 1398
Liverpool 9 1.7% 760 4.4% 3.3 12,379 94
East Midlands 10 1.7% 1,770 13.1% 5.7 6,765 252
Note: Analysis based on the MSOA in which the airport is based. The MSOA for Heathrow is Hillingdon 031, for Gatwick is Crawley 001, for Manchester is Manchester 053, for Stansted is Uttlesford 006, for Luton is Luton 014, for Birmingham is Solihull 009, for Bristol is North Somerset 013, for Newcastle is Newcastle upon Tyne 004, for Liverpool is Liverpool 058 and for East Midlands is North West Leicestershire 001. In total there are 7201 MSOAs in England. Data for passenger numbers from CAA Table 01 for July 2017. Data for aviation employment and total employment from Business Register and Employment Survey for all employees in 2016. Data for average distance travelled to work by residents and workplace population minus economic active residents is from the 2011 Census.
Source: Analytically Driven Ltd.
INDEPENDENT TRANSPORT COMMISSION
61
4. The regulatory challenges of air connectivity
4.0.1 The benefits of good air connectivity extend well beyond the aviation sector itself. It is therefore important that there is a regulatory framework in place that can help ensure these benefits are achievable, for example by enabling flights to take place between countries. However, the benefits of air connectivity also need to be balanced against the potential costs, including to the environment, and this again necessitates the existence of a regulatory framework, one that is capable of balancing the costs and benefits in an effective way.
4.0.2 This section therefore considers some of the regulatory challenges associated with aviation, both locally, nationally and internationally.
4.0.3 It starts by reviewing some of the tensions between air connectivity and the environment, and the approaches that have been taken to managing these issues. As the discussion of environmental issues makes clear, one of the challenges for ensuring environmental regulation is effective can be the interaction between national and local interests – a hub airport provides the option of significantly reducing carbon emissions for the system as a whole, but may do so at the risk of creating local environmental problems. Indeed, one of the areas where balancing national versus local interests can be hardest is in the case of planning policy. Therefore Section 4.2 takes a look at some of the challenges that the aviation sector can create for planning policy in the UK.
4.0.4 However, it is not just environmental issues that present challenges. Safety and security are also a major concern. Section 4.3 therefore some of the approaches to addressing safety and security concerns at an international level, including the issue of how to regulate the use of air space. Safety and security concerns were one of the main reasons that it was felt that trade in air services should be treated differently when the WTO’s GATS regime to govern trade in services between WTO members was introduced. In the absence of an overarching international policy regime governing trade in air services, Section 4.4 therefore looks at the issue of how Air Service Agreements between countries determine the quality of the connectivity achieved, through choices on which of the nine Freedoms of the Air are allowed, as well as how these freedoms shape the ability of airport hubs to operate.
4.0.5 The final two parts of this section consider some of the economic aspects of regulating aviation. In particular, Section 4.5 considers the importance of economic regulation and promoting competition within the sector, as a way of ensuring that air connectivity benefits are maximised. Finally Section 4.6 considers some of the implications of different approaches to taxing aviation.
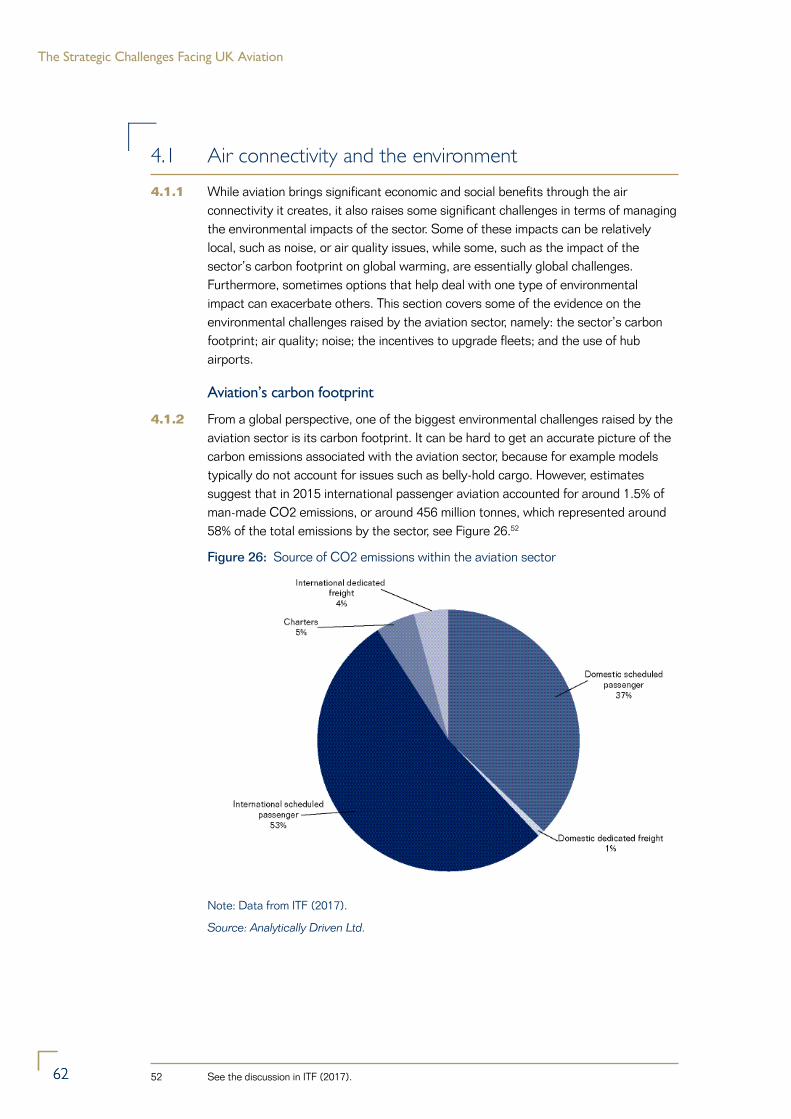
The Strategic Challenges Facing UK Aviation
6262
4.1 Air connectivity and the environment
4.1.1 While aviation brings significant economic and social benefits through the air connectivity it creates, it also raises some significant challenges in terms of managing the environmental impacts of the sector. Some of these impacts can be relatively local, such as noise, or air quality issues, while some, such as the impact of the sector’s carbon footprint on global warming, are essentially global challenges. Furthermore, sometimes options that help deal with one type of environmental impact can exacerbate others. This section covers some of the evidence on the environmental challenges raised by the aviation sector, namely: the sector’s carbon footprint; air quality; noise; the incentives to upgrade fleets; and the use of hub airports.
Aviation’s carbon footprint
4.1.2 From a global perspective, one of the biggest environmental challenges raised by the aviation sector is its carbon footprint. It can be hard to get an accurate picture of the carbon emissions associated with the aviation sector, because for example models typically do not account for issues such as belly-hold cargo. However, estimates suggest that in 2015 international passenger aviation accounted for around 1.5% of man-made CO2 emissions, or around 456 million tonnes, which represented around 58% of the total emissions by the sector, see Figure 26.52
Figure 26: Source of CO2 emissions within the aviation sector
Note: Data from ITF (2017).
Source: Analytically Driven Ltd.
52 See the discussion in ITF (2017).
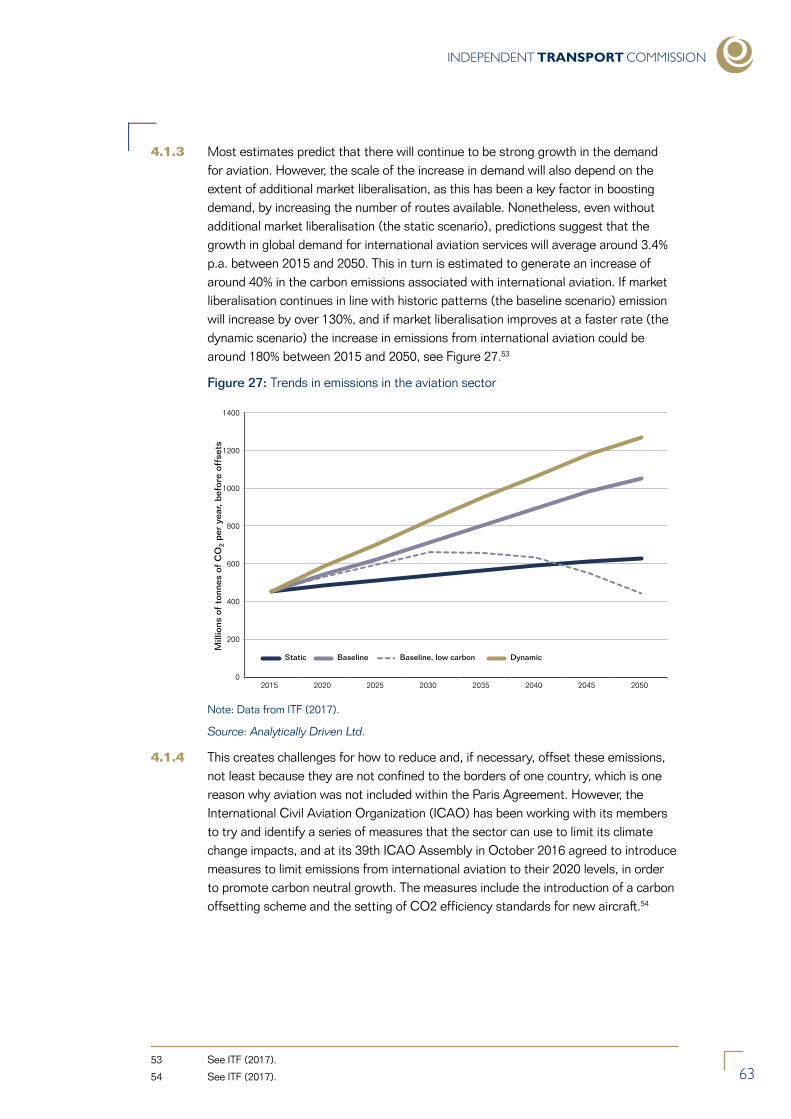
INDEPENDENT TRANSPORT COMMISSION
63
4.1.3 Most estimates predict that there will continue to be strong growth in the demand for aviation. However, the scale of the increase in demand will also depend on the extent of additional market liberalisation, as this has been a key factor in boosting demand, by increasing the number of routes available. Nonetheless, even without additional market liberalisation (the static scenario), predictions suggest that the growth in global demand for international aviation services will average around 3.4% p.a. between 2015 and 2050. This in turn is estimated to generate an increase of around 40% in the carbon emissions associated with international aviation. If market liberalisation continues in line with historic patterns (the baseline scenario) emission will increase by over 130%, and if market liberalisation improves at a faster rate (the dynamic scenario) the increase in emissions from international aviation could be around 180% between 2015 and 2050, see Figure 27.53
Figure 27: Trends in emissions in the aviation sector
0
200
400
600
800
1000
1200
1400
2015 2020 2025 2030 2035 2040 2045 2050
Mill
ions
of
tonn
es o
f C
O2
per
year
, bef
ore
offs
ets
Static Baseline Baseline, low carbon Dynamic
Note: Data from ITF (2017).
Source: Analytically Driven Ltd.
4.1.4 This creates challenges for how to reduce and, if necessary, offset these emissions, not least because they are not confined to the borders of one country, which is one reason why aviation was not included within the Paris Agreement. However, the International Civil Aviation Organization (ICAO) has been working with its members to try and identify a series of measures that the sector can use to limit its climate change impacts, and at its 39th ICAO Assembly in October 2016 agreed to introduce measures to limit emissions from international aviation to their 2020 levels, in order to promote carbon neutral growth. The measures include the introduction of a carbon offsetting scheme and the setting of CO2 efficiency standards for new aircraft.54
53 See ITF (2017).
54 See ITF (2017).
The Strategic Challenges Facing UK Aviation
64
4.1.5 Airports have also introduced an Airport Carbon Accreditation Programme under the auspices of the Airports Council International (ACI) to encourage airports to manage the carbon emissions under their control.55 At October 2017 there were 199 airports worldwide participating in the scheme, with 35 airports having the highest level of certification, including Gatwick, Manchester and East Midlands, and a further 43 having the second highest level of certification, including Heathrow, London Stansted and London City.56
Aviation and air quality
4.1.6 It is not just carbon emissions that can be a problem for aviation. Other forms of emissions, such as nitrogen oxides (NOX) and particulate matter (PM10 and PM2.5) emissions, can also have a negative impact, particularly in terms of health in areas with high concentrations of harmful emissions.57 While aviation only accounts for a tiny proportion of particulate matter emissions at an EU level, it accounts for around 5% of EU NOX emissions. However, because NOX is not directly linked to fuel burn, there are moves within the industry to reduce these emissions, particularly in new aircraft.58
4.1.7 However, it is also well understood that other forms of transport and in particular road transport can have a very negative impact on air quality. In this respect, one of the issues that airports face is the volume of staff and visitors travelling to airports on a daily basis. To the extent that these journeys are made by road in petrol or diesel vehicles this can lead to concentration of emissions on the roads around airports, as well as an increase in congestion. For example, in the case of Heathrow airport, estimates suggests that in 2015 aircraft movements contributed on average 17% of local NOX concentrations at nearby roadside locations, with road transport contributing 64%.59
4.1.8 Not all road users in the vicinity of airports are visiting the airport itself. However, the evidence suggests that more could be done at airports to encourage a switch in the mode of transport used away from car journeys. For example, as Table 8 demonstrates, in the case of those working in the vicinity of the Top 10 airports in England, on average 72.4% of workers commute by car, compared to 60.3% for England as a whole. Furthermore, the average distances travelled are also higher than those for England as a whole, meaning the amount of fuel used and therefore total emissions (including carbon emissions) will on average be higher as well.
4.1.9 The evidence on the mode of transport used by passengers at the top 5 airports in England suggests that in four out of five cases passengers are less likely to use a car (either private car or taxi) to arrive at the airport than is the case for employees, see Figure 28. This is particularly true of Gatwick and Stansted. However, in the case of Manchester, if taxis are considered as well as private cars, the use of vehicles by passengers is even higher than amongst staff. Furthermore, even in cases where the use of vehicles is lower than amongst the staff, it still remains high in percentage terms, which again has implications both for emissions and congestion on local roads.
55 See ITF (2017).
56 http://airportcarbonaccredited.org/airport/participants/all.html
57 See, for example, the discussion in Driver (2017).
58 See the discussion in Hind and RDC Aviation Ltd (2016).
59 See the discussion in Department for Transport (2017b). Of the remaining NOX emissions, off-road transport and mobile machinery (which includes airside vehicles) contributed 5%.
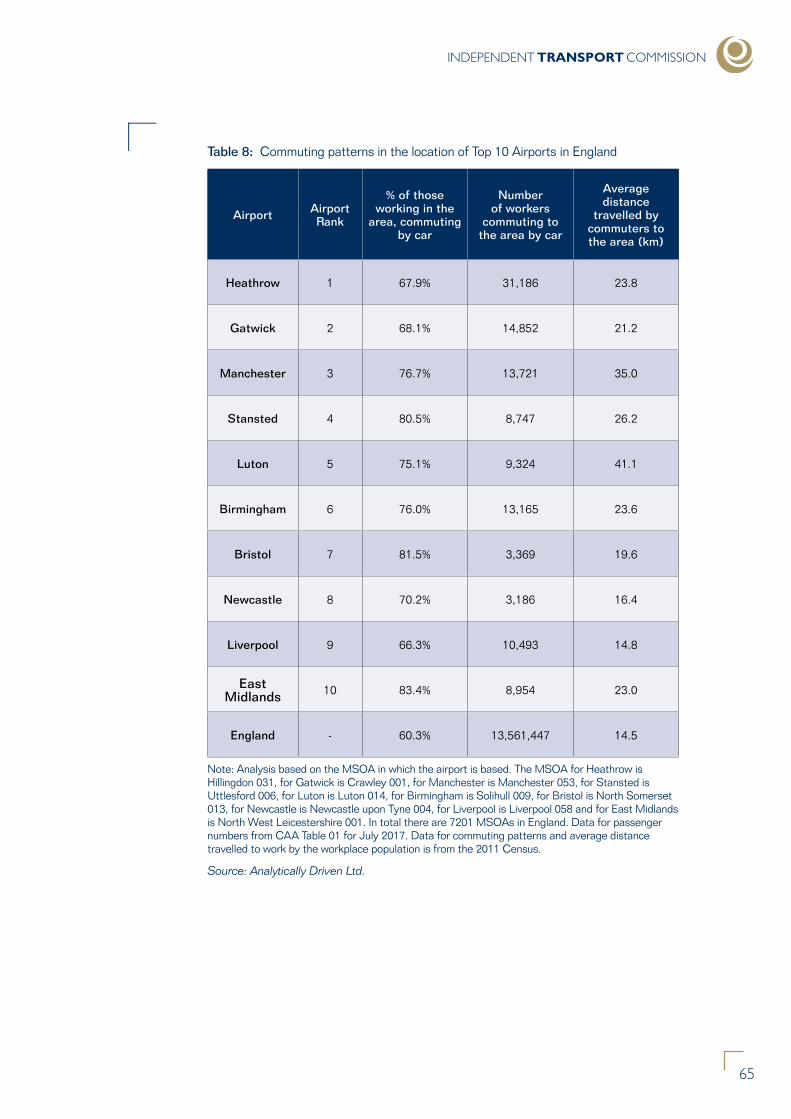
INDEPENDENT TRANSPORT COMMISSION
65
Table 8: Commuting patterns in the location of Top 10 Airports in England
Airport Airport Rank
% of those working in the
area, commuting by car
Number of workers
commuting to the area by car
Average distance
travelled by commuters to the area (km)
Heathrow 1 67.9% 31,186 23.8
Gatwick 2 68.1% 14,852 21.2
Manchester 3 76.7% 13,721 35.0
Stansted 4 80.5% 8,747 26.2
Luton 5 75.1% 9,324 41.1
Birmingham 6 76.0% 13,165 23.6
Bristol 7 81.5% 3,369 19.6
Newcastle 8 70.2% 3,186 16.4
Liverpool 9 66.3% 10,493 14.8
East Midlands 10 83.4% 8,954 23.0
England - 60.3% 13,561,447 14.5
Note: Analysis based on the MSOA in which the airport is based. The MSOA for Heathrow is Hillingdon 031, for Gatwick is Crawley 001, for Manchester is Manchester 053, for Stansted is Uttlesford 006, for Luton is Luton 014, for Birmingham is Solihull 009, for Bristol is North Somerset 013, for Newcastle is Newcastle upon Tyne 004, for Liverpool is Liverpool 058 and for East Midlands is North West Leicestershire 001. In total there are 7201 MSOAs in England. Data for passenger numbers from CAA Table 01 for July 2017. Data for commuting patterns and average distance travelled to work by the workplace population is from the 2011 Census.
Source: Analytically Driven Ltd.
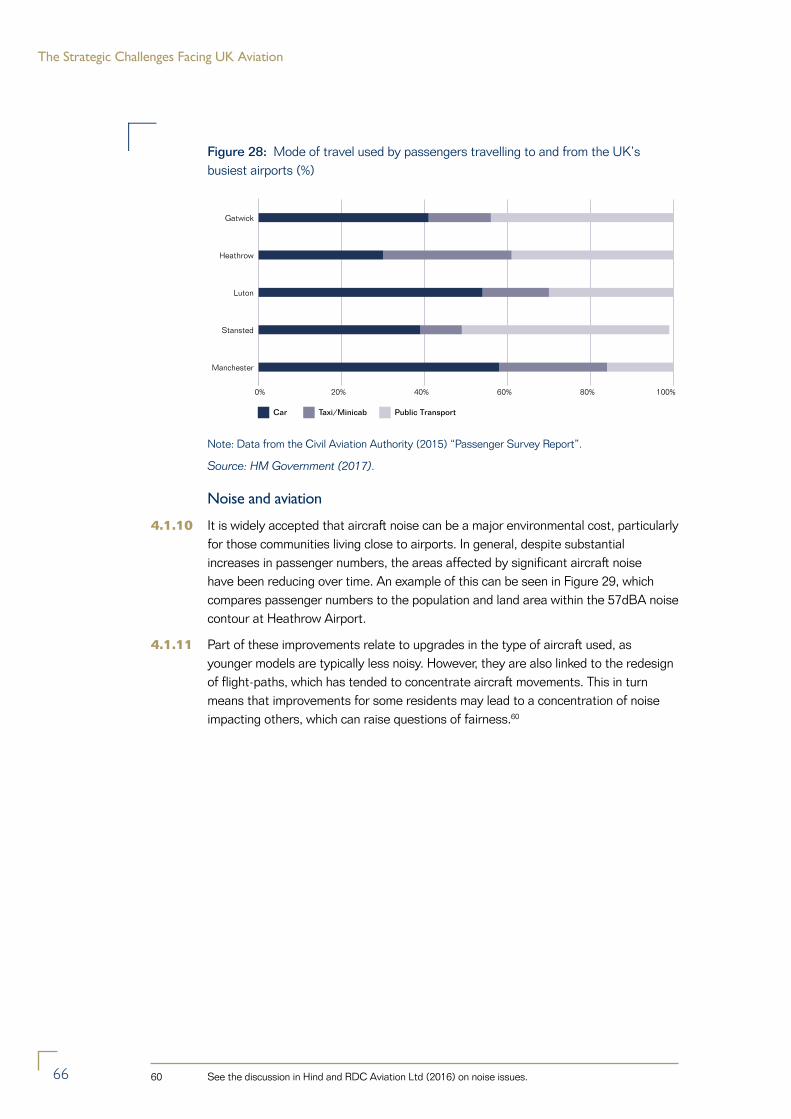
The Strategic Challenges Facing UK Aviation
66
Figure 28: Mode of travel used by passengers travelling to and from the UK’s busiest airports (%)
0% 20% 40% 60% 80% 100%
Public TransportTaxi/MinicabCar
Manchester
Stansted
Luton
Heathrow
Gatwick
Note: Data from the Civil Aviation Authority (2015) “Passenger Survey Report”.
Source: HM Government (2017).
Noise and aviation
4.1.10 It is widely accepted that aircraft noise can be a major environmental cost, particularly for those communities living close to airports. In general, despite substantial increases in passenger numbers, the areas affected by significant aircraft noise have been reducing over time. An example of this can be seen in Figure 29, which compares passenger numbers to the population and land area within the 57dBA noise contour at Heathrow Airport.
4.1.11 Part of these improvements relate to upgrades in the type of aircraft used, as younger models are typically less noisy. However, they are also linked to the redesign of flight-paths, which has tended to concentrate aircraft movements. This in turn means that improvements for some residents may lead to a concentration of noise impacting others, which can raise questions of fairness.60
60 See the discussion in Hind and RDC Aviation Ltd (2016) on noise issues.
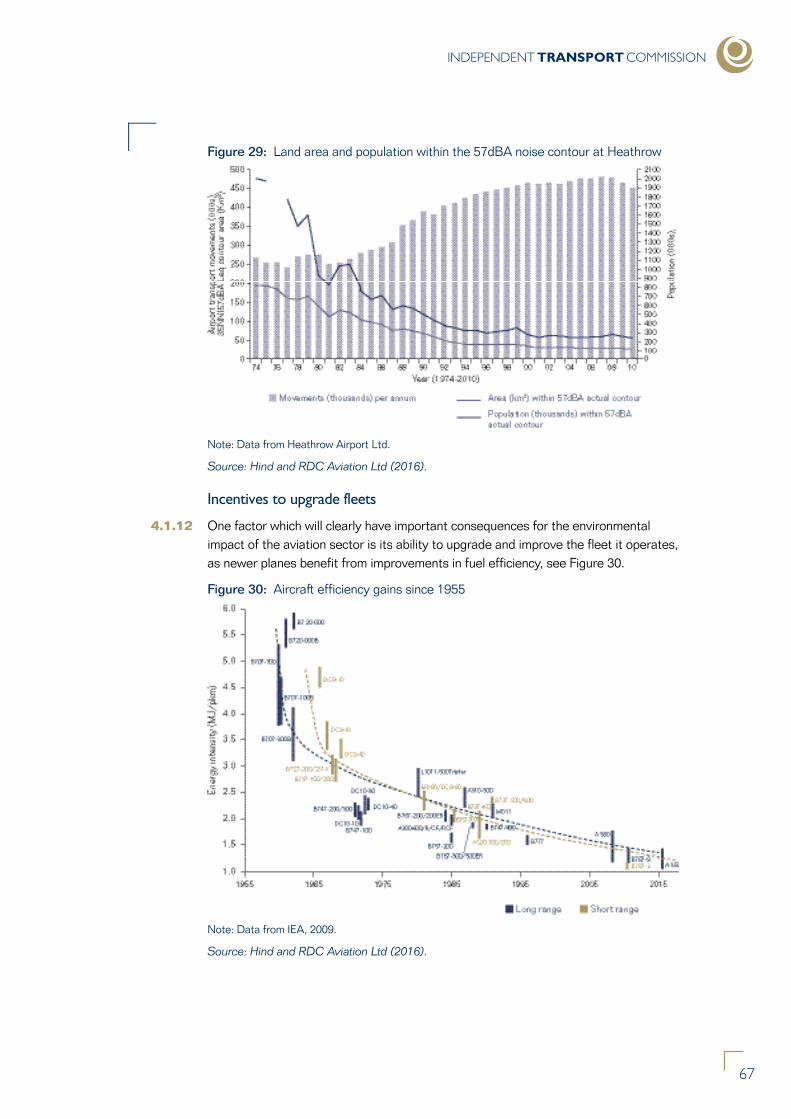
INDEPENDENT TRANSPORT COMMISSION
67
Figure 29: Land area and population within the 57dBA noise contour at Heathrow
Note: Data from Heathrow Airport Ltd.
Source: Hind and RDC Aviation Ltd (2016).
Incentives to upgrade fleets
4.1.12 One factor which will clearly have important consequences for the environmental impact of the aviation sector is its ability to upgrade and improve the fleet it operates, as newer planes benefit from improvements in fuel efficiency, see Figure 30.
Figure 30: Aircraft efficiency gains since 1955
Note: Data from IEA, 2009.
Source: Hind and RDC Aviation Ltd (2016).
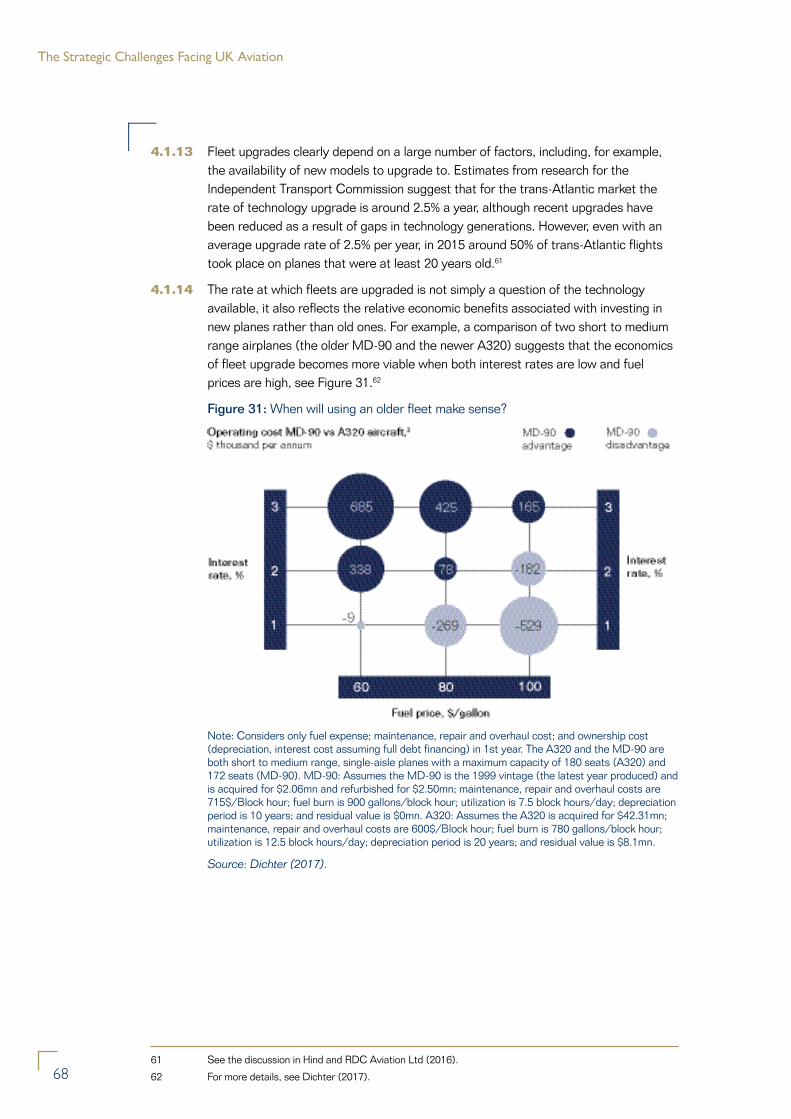
The Strategic Challenges Facing UK Aviation
68
4.1.13 Fleet upgrades clearly depend on a large number of factors, including, for example, the availability of new models to upgrade to. Estimates from research for the Independent Transport Commission suggest that for the trans-Atlantic market the rate of technology upgrade is around 2.5% a year, although recent upgrades have been reduced as a result of gaps in technology generations. However, even with an average upgrade rate of 2.5% per year, in 2015 around 50% of trans-Atlantic flights took place on planes that were at least 20 years old.61
4.1.14 The rate at which fleets are upgraded is not simply a question of the technology available, it also reflects the relative economic benefits associated with investing in new planes rather than old ones. For example, a comparison of two short to medium range airplanes (the older MD-90 and the newer A320) suggests that the economics of fleet upgrade becomes more viable when both interest rates are low and fuel prices are high, see Figure 31.62
Figure 31: When will using an older fleet make sense?
Note: Considers only fuel expense; maintenance, repair and overhaul cost; and ownership cost (depreciation, interest cost assuming full debt financing) in 1st year. The A320 and the MD-90 are both short to medium range, single-aisle planes with a maximum capacity of 180 seats (A320) and 172 seats (MD-90). MD-90: Assumes the MD-90 is the 1999 vintage (the latest year produced) and is acquired for $2.06mn and refurbished for $2.50mn; maintenance, repair and overhaul costs are 715$/Block hour; fuel burn is 900 gallons/block hour; utilization is 7.5 block hours/day; depreciation period is 10 years; and residual value is $0mn. A320: Assumes the A320 is acquired for $42.31mn; maintenance, repair and overhaul costs are 600$/Block hour; fuel burn is 780 gallons/block hour; utilization is 12.5 block hours/day; depreciation period is 20 years; and residual value is $8.1mn.
Source: Dichter (2017).
61 See the discussion in Hind and RDC Aviation Ltd (2016).
62 For more details, see Dichter (2017).
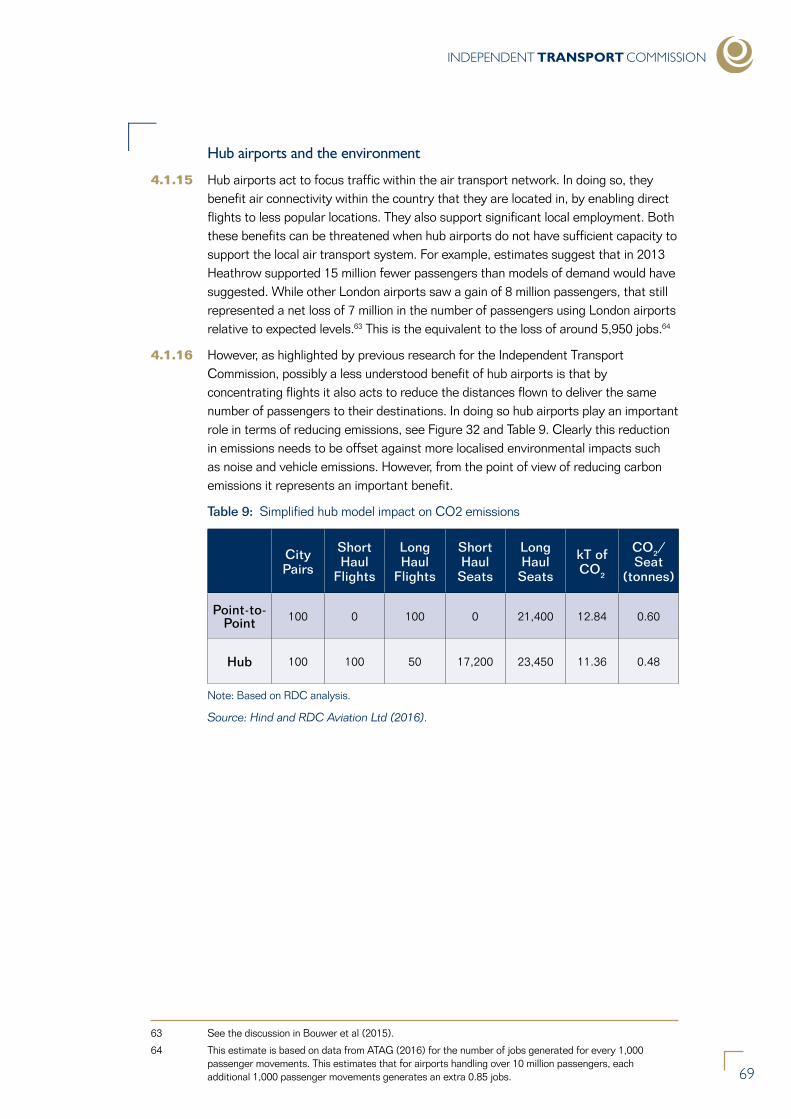
INDEPENDENT TRANSPORT COMMISSION
69
Hub airports and the environment
4.1.15 Hub airports act to focus traffic within the air transport network. In doing so, they benefit air connectivity within the country that they are located in, by enabling direct flights to less popular locations. They also support significant local employment. Both these benefits can be threatened when hub airports do not have sufficient capacity to support the local air transport system. For example, estimates suggest that in 2013 Heathrow supported 15 million fewer passengers than models of demand would have suggested. While other London airports saw a gain of 8 million passengers, that still represented a net loss of 7 million in the number of passengers using London airports relative to expected levels.63 This is the equivalent to the loss of around 5,950 jobs.64
4.1.16 However, as highlighted by previous research for the Independent Transport Commission, possibly a less understood benefit of hub airports is that by concentrating flights it also acts to reduce the distances flown to deliver the same number of passengers to their destinations. In doing so hub airports play an important role in terms of reducing emissions, see Figure 32 and Table 9. Clearly this reduction in emissions needs to be offset against more localised environmental impacts such as noise and vehicle emissions. However, from the point of view of reducing carbon emissions it represents an important benefit.
Table 9: Simplified hub model impact on CO2 emissions
City Pairs
Short Haul
Flights
Long Haul
Flights
Short Haul Seats
Long Haul Seats
kT of CO2
CO2/Seat
(tonnes)
Point-to-Point 100 0 100 0 21,400 12.84 0.60
Hub 100 100 50 17,200 23,450 11.36 0.48
Note: Based on RDC analysis.
Source: Hind and RDC Aviation Ltd (2016).
63 See the discussion in Bouwer et al (2015).
64 This estimate is based on data from ATAG (2016) for the number of jobs generated for every 1,000 passenger movements. This estimates that for airports handling over 10 million passengers, each additional 1,000 passenger movements generates an extra 0.85 jobs.
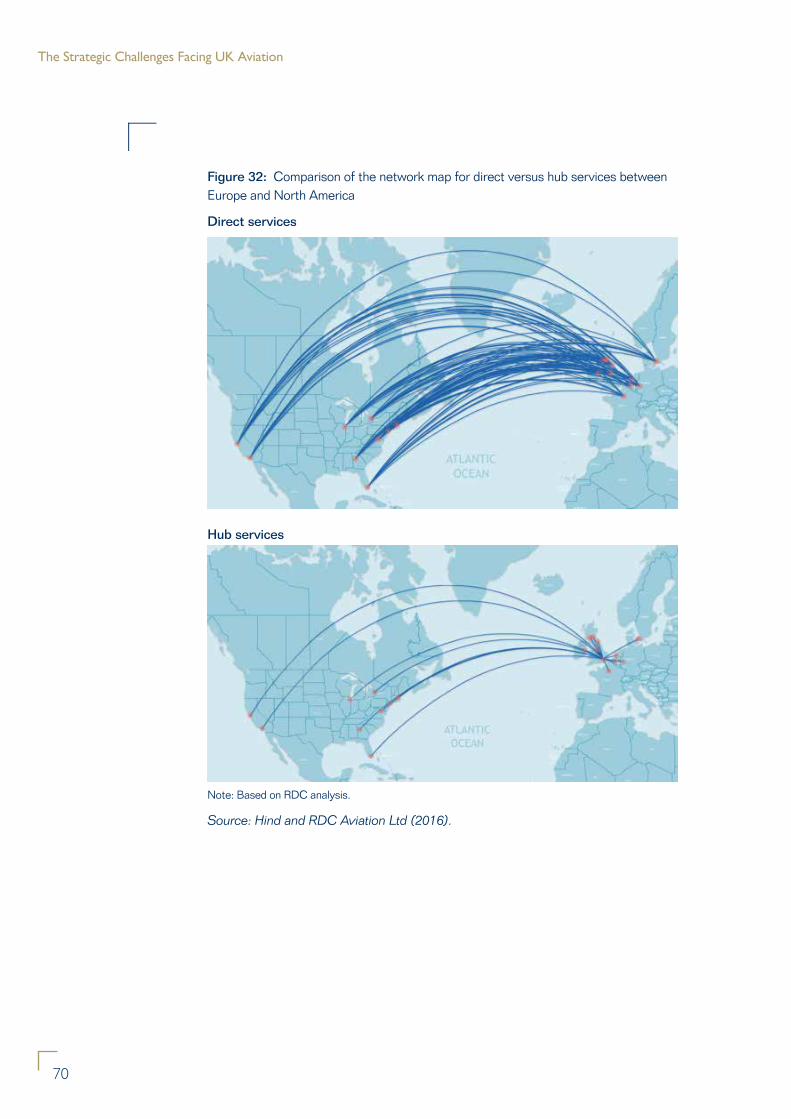
The Strategic Challenges Facing UK Aviation
70
Figure 32: Comparison of the network map for direct versus hub services between Europe and North America
Direct services
Hub services
Note: Based on RDC analysis.
Source: Hind and RDC Aviation Ltd (2016).
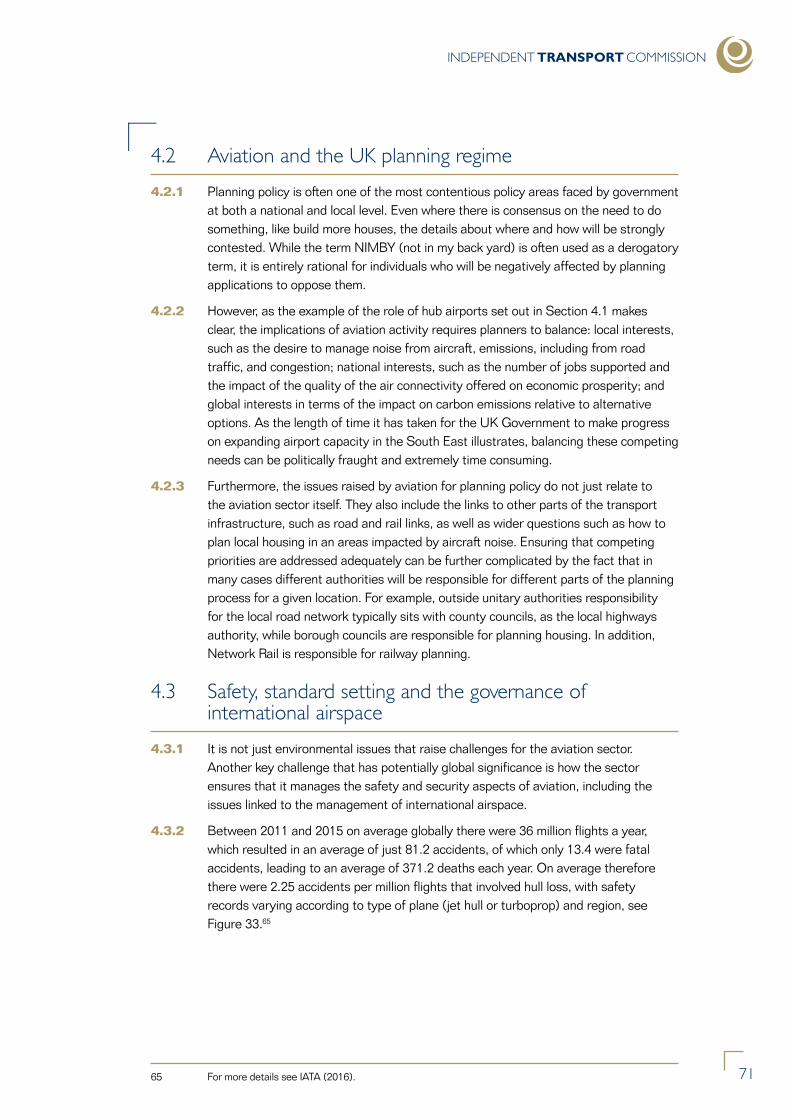
INDEPENDENT TRANSPORT COMMISSION
71
4.2 Aviation and the UK planning regime
4.2.1 Planning policy is often one of the most contentious policy areas faced by government at both a national and local level. Even where there is consensus on the need to do something, like build more houses, the details about where and how will be strongly contested. While the term NIMBY (not in my back yard) is often used as a derogatory term, it is entirely rational for individuals who will be negatively affected by planning applications to oppose them.
4.2.2 However, as the example of the role of hub airports set out in Section 4.1 makes clear, the implications of aviation activity requires planners to balance: local interests, such as the desire to manage noise from aircraft, emissions, including from road traffic, and congestion; national interests, such as the number of jobs supported and the impact of the quality of the air connectivity offered on economic prosperity; and global interests in terms of the impact on carbon emissions relative to alternative options. As the length of time it has taken for the UK Government to make progress on expanding airport capacity in the South East illustrates, balancing these competing needs can be politically fraught and extremely time consuming.
4.2.3 Furthermore, the issues raised by aviation for planning policy do not just relate to the aviation sector itself. They also include the links to other parts of the transport infrastructure, such as road and rail links, as well as wider questions such as how to plan local housing in an areas impacted by aircraft noise. Ensuring that competing priorities are addressed adequately can be further complicated by the fact that in many cases different authorities will be responsible for different parts of the planning process for a given location. For example, outside unitary authorities responsibility for the local road network typically sits with county councils, as the local highways authority, while borough councils are responsible for planning housing. In addition, Network Rail is responsible for railway planning.
4.3 Safety, standard setting and the governance of international airspace
4.3.1 It is not just environmental issues that raise challenges for the aviation sector. Another key challenge that has potentially global significance is how the sector ensures that it manages the safety and security aspects of aviation, including the issues linked to the management of international airspace.
4.3.2 Between 2011 and 2015 on average globally there were 36 million flights a year, which resulted in an average of just 81.2 accidents, of which only 13.4 were fatal accidents, leading to an average of 371.2 deaths each year. On average therefore there were 2.25 accidents per million flights that involved hull loss, with safety records varying according to type of plane (jet hull or turboprop) and region, see Figure 33.65
65 For more details see IATA (2016).
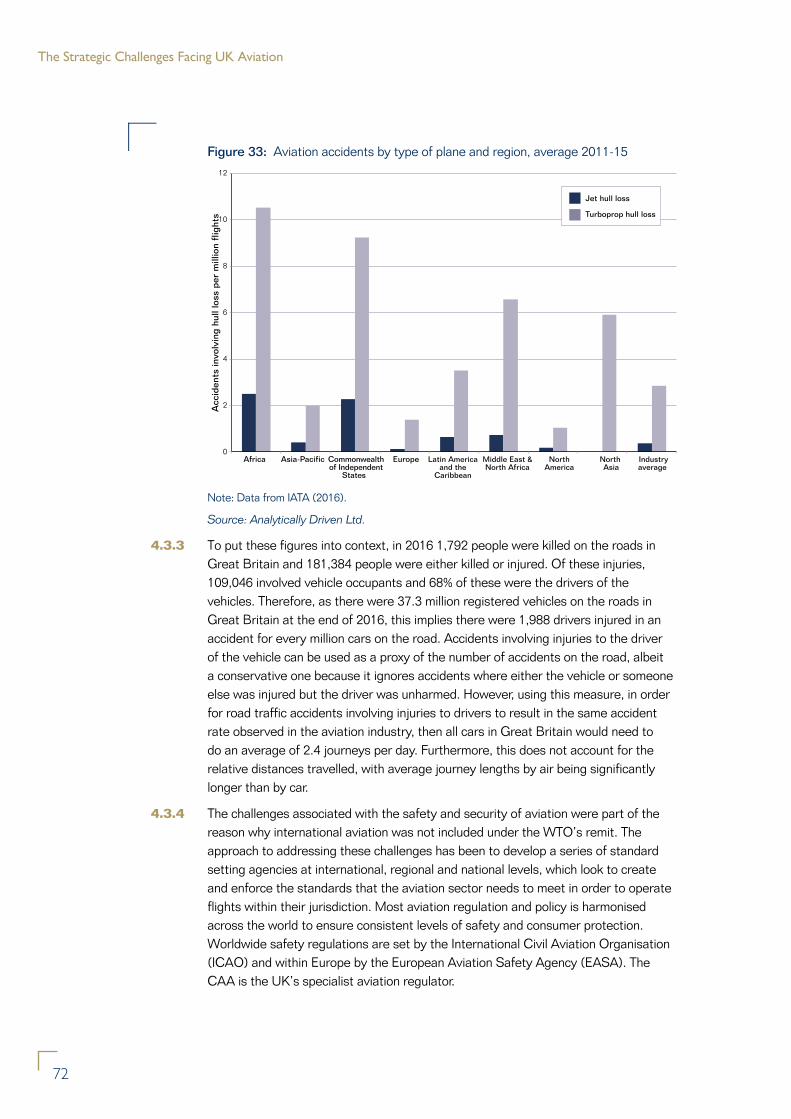
The Strategic Challenges Facing UK Aviation
72
Figure 33: Aviation accidents by type of plane and region, average 2011-15
0
2
4
6
8
10
12
Africa Asia-Pacific Commonwealthof Independent
States
Europe NorthAmerica
Middle East &North Africa
Latin Americaand the
Caribbean
North Asia
Industryaverage
Acc
iden
ts in
volv
ing
hull
loss
per
mill
ion
flig
hts
Jet hull loss
Turboprop hull loss
Note: Data from IATA (2016).
Source: Analytically Driven Ltd.
4.3.3 To put these figures into context, in 2016 1,792 people were killed on the roads in Great Britain and 181,384 people were either killed or injured. Of these injuries, 109,046 involved vehicle occupants and 68% of these were the drivers of the vehicles. Therefore, as there were 37.3 million registered vehicles on the roads in Great Britain at the end of 2016, this implies there were 1,988 drivers injured in an accident for every million cars on the road. Accidents involving injuries to the driver of the vehicle can be used as a proxy of the number of accidents on the road, albeit a conservative one because it ignores accidents where either the vehicle or someone else was injured but the driver was unharmed. However, using this measure, in order for road traffic accidents involving injuries to drivers to result in the same accident rate observed in the aviation industry, then all cars in Great Britain would need to do an average of 2.4 journeys per day. Furthermore, this does not account for the relative distances travelled, with average journey lengths by air being significantly longer than by car.
4.3.4 The challenges associated with the safety and security of aviation were part of the reason why international aviation was not included under the WTO’s remit. The approach to addressing these challenges has been to develop a series of standard setting agencies at international, regional and national levels, which look to create and enforce the standards that the aviation sector needs to meet in order to operate flights within their jurisdiction. Most aviation regulation and policy is harmonised across the world to ensure consistent levels of safety and consumer protection. Worldwide safety regulations are set by the International Civil Aviation Organisation (ICAO) and within Europe by the European Aviation Safety Agency (EASA). The CAA is the UK’s specialist aviation regulator.
INDEPENDENT TRANSPORT COMMISSION
73
ICAO
4.3.5 At an international level the ICAO is a key part of the system of standard setting for the aviation sector. The ICAO is a specialist agency of the UN with the objective of ensuring that:
“international civil aviation may be developed in a safe and orderly manner and that international air transport services may be established on the basis of equality of opportunity and operated soundly and economically”.
4.3.6 The ICAO was established in 1944 to manage the administration and governance of the Convention on International Civil Aviation, the co-called “Chicago Convention”. The ICAO works with the Convention’s 191 Member States and industry groups to reach consensus on international civil aviation Standards and Recommended Practices (SARPs) and policies to support a safe, efficient, secure, economically sustainable and environmentally responsible civil aviation sector. These SARPs and policies are used by ICAO Member States to ensure that their local civil aviation operations and regulations conform to global norms, which in turn permits more than 100,000 daily flights in aviation’s global network to operate safely and reliably in every region of the world.
4.3.7 In addition to its core work resolving consensus-driven international SARPs and policies among its Member States and industry, the ICAO also coordinates assistance and capacity building for States to support aviation development objectives; produces global plans to coordinate multilateral strategic progress for safety and air navigation; monitors and reports on performance metrics for the air transport sector; and audits States’ civil aviation oversight capabilities in the areas of safety and security.
The European Aviation Framework
4.3.8 At a European level, the EASA is the EU agency with responsibility for regulatory and executive tasks in the field of civilian aviation safety. The role of the EASA is:
• to ensure that common rules allow EU citizens to benefit from the highest level of safety protection and environmental protection;
• to provide a single regulatory and certification process among Member States;
• to facilitate the internal aviation single market and the creation of a level playing field within the aviation market; and
• to work with other international aviation organisations and regulators.
4.3.9 To achieve this, the EASA is responsible for:
• creating draft implementing rules in all fields pertinent to the EASA mission;
• certifying and approving products and organisations, in fields where EASA has exclusive competence (e.g. airworthiness);
The Strategic Challenges Facing UK Aviation
74
• providing oversight and support to Member States in fields where EASA has shared competence (e.g. Air Operations and Air Traffic Management);
• promoting the use of European and worldwide standards; and
• cooperating with international organisations in order to achieve the highest safety level for EU citizens globally (e.g. EU safety list, Third Country Operators authorisations).
4.3.10 Within the EU, member states are responsible for interpreting and implementing EU law, meaning the oversight of firms and organisations domiciled in EU countries is the responsibility of the competent national authority designated by that member state. However, the EASA is responsible for the authorisation and oversight of relevant activities by firms from third countries that want to participate in the EU market. The exceptions to this are where there are bilateral mutual recognition of standards agreements, such as the ones with the US and Canada.
4.3.11 Although the EASA is an EU body, European Free Trade Association (EFTA) countries have been granted participation in the agency and have representatives on the EASA’s Management Board. In addition, Albania, Bosnia and Herzegovina, Serbia, Montenegro, the former Yugoslav Republic of Macedonia, Moldova and Georgia have observer status on the EASA’s Management Board.
The CAA
4.3.12 The Civil Aviation Authority (CAA) is the UK’s specialist aviation regulator with responsibility for ensuring that:
• the aviation industry meets the highest safety standards;
• consumers have choice, value for money, are protected and treated fairly when they fly;
• the environmental impact of aviation on local communities is effectively managed and CO2 emissions are reduced through the efficient use of airspace; and
• the aviation industry manages security risks effectively.
4.3.13 As part of its work, the CAA runs the ATOL holiday financial protection scheme and also economically regulates some airports and certain aspects of air traffic control.
Managing airspace
4.3.14 In order for the aviation sector to operate effectively, aircraft need to be able to navigate through international airspace, as well as the airspace belonging to individual countries, which have exclusive sovereignty over the airspace above their territory. As set out in Section 4.4 below, the rights to run aviation services between one country and another are largely governed by a series of bilateral agreements between countries.
INDEPENDENT TRANSPORT COMMISSION
75
4.3.15 However, over and above determining who has the rights to fly though a country’s airspace, a key question is how they can do this safely. Under the Chicago Convention, member states have responsibility for providing the necessary facilities to facilitate international air navigation in accordance with the recommended standards and practices. However, member states have the option of either fulfilling these obligations themselves, or delegating to a private body, which has led to the development of specialist companies providing air navigation services. In total there are 173 air navigation service providers around the world.66
4.3.16 The fact that airports in one country can sit close to another country’s borders can create challenges for air navigation services. At an EU level, therefore, the Single European Sky (SES) programme has been developed covering Air Traffic Management (ATM). The SES programme is designed to increase safety, reduce costs, improve flight efficiency and reduce the environmental impact of air traffic within the EU and Europe. Norway, Switzerland, Iceland Albania, Bosnia and Herzegovina, Serbia and the former Yugoslav Republic of Macedonia are third country members of the SES.
4.3.17 One of the concerns that has been expressed about the SES framework is that it remains very fragmented, involving 37 air navigation service providers (ANSPs), 62 en route centres and 16 stand-alone Approach Control Units, making for a total of 78 facilities. In contrast, in the US contiguous airspace has just one provider and there are just 46 facilities, namely 20 en route centres and 26 stand-alone Terminal Radar Approach controls. The result is that air traffic management costs per flight hour in the US are 34% less than in European SES members.67
4.3.18 Over and above the need to promote efficiency in the way that air traffic management is handled across borders, the efficiency of air traffic management also has implications for the capacity and effectiveness of the system within borders. For example, the UK government has recently consulted on the need to upgrade the way in which UK airspace is managed, both to increase capacity and reduce emissions. However, while the proposals are likely to improve the management of the system as a whole, there is a risk that they will concentrate some of the noise issues, again
indicating the complexity of the trade-offs needed when planning for aviation.68
66 Industry High Level Group (2017).
67 See the discussion in IATA (2017b).
68 See Department for Transport (2017a).
The Strategic Challenges Facing UK Aviation
76
4.4 Air Service Agreements, connectivity and the nine Freedoms of the Air
4.4.1 International aviation is a sector that by its nature needs to cross borders, and the ability to cross borders is vital for the quality of air connectivity available. However, given the safety risks, the ability of airlines to offer international flights depends on countries trusting each other that appropriate safety regulations will be enforced on national carriers. Partly because of safety concerns, trade in international aviation is therefore regulated differently to most trade, with the WTO’s General Agreement on Trade in Services (GATS) specifically excluding air traffic rights from inclusion in the regime.69 This means that even for WTO members the most favoured nation (MFN) regime does not apply.70
4.4.2 Instead, international aviation is governed by a large number of Air Service Agreements (ASAs).71 These are either bilateral agreements, or agreements between groups of countries governing what international aviation services are allowed. ASAs can include not just restrictions on the nature of the services that can be offered, but also restrictions on issues such as which carriers are allowed to fly, the routes available, the number of flights allowed, the number of seats allowed, and even the number of landing slots to be provided at specified airports.72
4.4.3 As part of negotiating an ASA, each country needs to decide how much access to their territory they are willing to give to carriers from their fellow signatories. The more access they give, then the greater the competition in the domestic market, promoting choice and reducing prices. By the same token, however, this may make it harder for national carriers to compete with foreign competitors, leading to potential calls for protection.
4.4.4 The complex menu of choices governing how carriers from other countries can access a country’s territory is encapsulated in the nine Freedoms of the Air, see Box 4.1. These nine Freedoms cover whether and in what circumstances carriers from one country can access the territory of another.73 The first four Freedoms are those most commonly offered in traditional ASAs. It is more unusual for the remaining Freedoms to be granted as part of international ASAs.
69 Although the GATS regime excludes traffic rights, it does include: aircraft repair and maintenance; selling and marketing of air transport services; and computer reservation system services. Paragraph 6(d) of the GATS Annex on Air Transport Services states that “traffic rights mean the right for scheduled and non-scheduled services to operate and/or carry passengers, cargo and mail for remuneration or hire from, to, within, or over the territory of a member, including points to be served, routes to be operated, types of traffic to be carried, capacity to be provided, tariffs to be charged and their conditions, and criteria for designation of airlines, including such criteria as number, ownership and control”.
70 Under Most-Favoured-Nation (MFN) rules WTO members agree that the trading arrangements (such as tariffs and quotas) offered to other WTO members will not discriminate between them. Therefore, as all WTO members must be treated equally, a change in the arrangements benefiting one member must benefit all m embers, as all members must be treated the same as the most favoured nation. Some limited exceptions to this equal treatment are allowed, such as free trade agreements, providing they follow WTO rules.
71 The framework that ASAs operate in is provided by the International Civil Aviation Organisation (ICAO). ASAs should be consistent with the Convention on International Civil Aviation, sometimes referred to as the Chicago Convention.
72 See the discussion in Tretheway and Andriulaitis (2015).
73 The first five of these have even been officially recognised by international treaty. See ICAO Manual on the Regulation of International Air Transport (Doc 9626, Part 4).
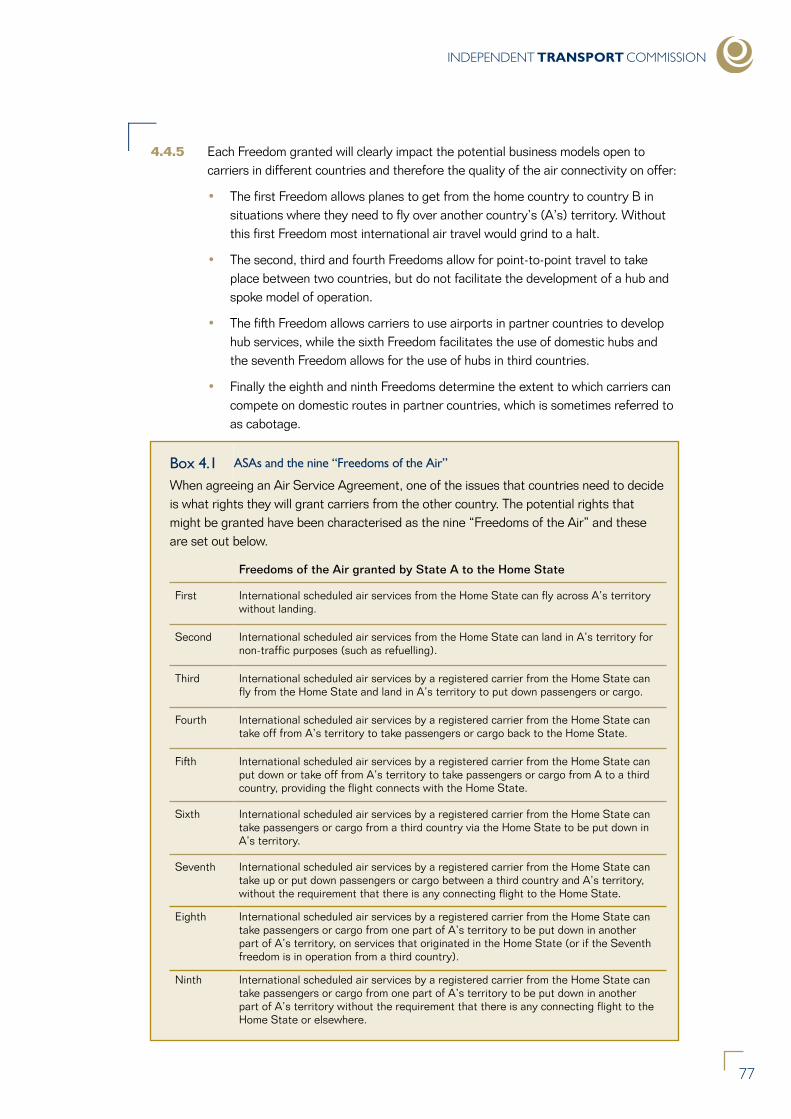
INDEPENDENT TRANSPORT COMMISSION
77
4.4.5 Each Freedom granted will clearly impact the potential business models open to carriers in different countries and therefore the quality of the air connectivity on offer:
• The first Freedom allows planes to get from the home country to country B in situations where they need to fly over another country’s (A’s) territory. Without this first Freedom most international air travel would grind to a halt.
• The second, third and fourth Freedoms allow for point-to-point travel to take place between two countries, but do not facilitate the development of a hub and spoke model of operation.
• The fifth Freedom allows carriers to use airports in partner countries to develop hub services, while the sixth Freedom facilitates the use of domestic hubs and the seventh Freedom allows for the use of hubs in third countries.
• Finally the eighth and ninth Freedoms determine the extent to which carriers can compete on domestic routes in partner countries, which is sometimes referred to as cabotage.
Box 4.1 ASAs and the nine “Freedoms of the Air”
When agreeing an Air Service Agreement, one of the issues that countries need to decide is what rights they will grant carriers from the other country. The potential rights that might be granted have been characterised as the nine “Freedoms of the Air” and these are set out below.
Freedoms of the Air granted by State A to the Home State
First International scheduled air services from the Home State can fly across A’s territory without landing.
Second International scheduled air services from the Home State can land in A’s territory for non-traffic purposes (such as refuelling).
Third International scheduled air services by a registered carrier from the Home State can fly from the Home State and land in A’s territory to put down passengers or cargo.
Fourth International scheduled air services by a registered carrier from the Home State can take off from A’s territory to take passengers or cargo back to the Home State.
Fifth International scheduled air services by a registered carrier from the Home State can put down or take off from A’s territory to take passengers or cargo from A to a third country, providing the flight connects with the Home State.
Sixth International scheduled air services by a registered carrier from the Home State can take passengers or cargo from a third country via the Home State to be put down in A’s territory.
Seventh International scheduled air services by a registered carrier from the Home State can take up or put down passengers or cargo between a third country and A’s territory, without the requirement that there is any connecting flight to the Home State.
Eighth International scheduled air services by a registered carrier from the Home State can take passengers or cargo from one part of A’s territory to be put down in another part of A’s territory, on services that originated in the Home State (or if the Seventh freedom is in operation from a third country).
Ninth International scheduled air services by a registered carrier from the Home State can take passengers or cargo from one part of A’s territory to be put down in another part of A’s territory without the requirement that there is any connecting flight to the Home State or elsewhere.
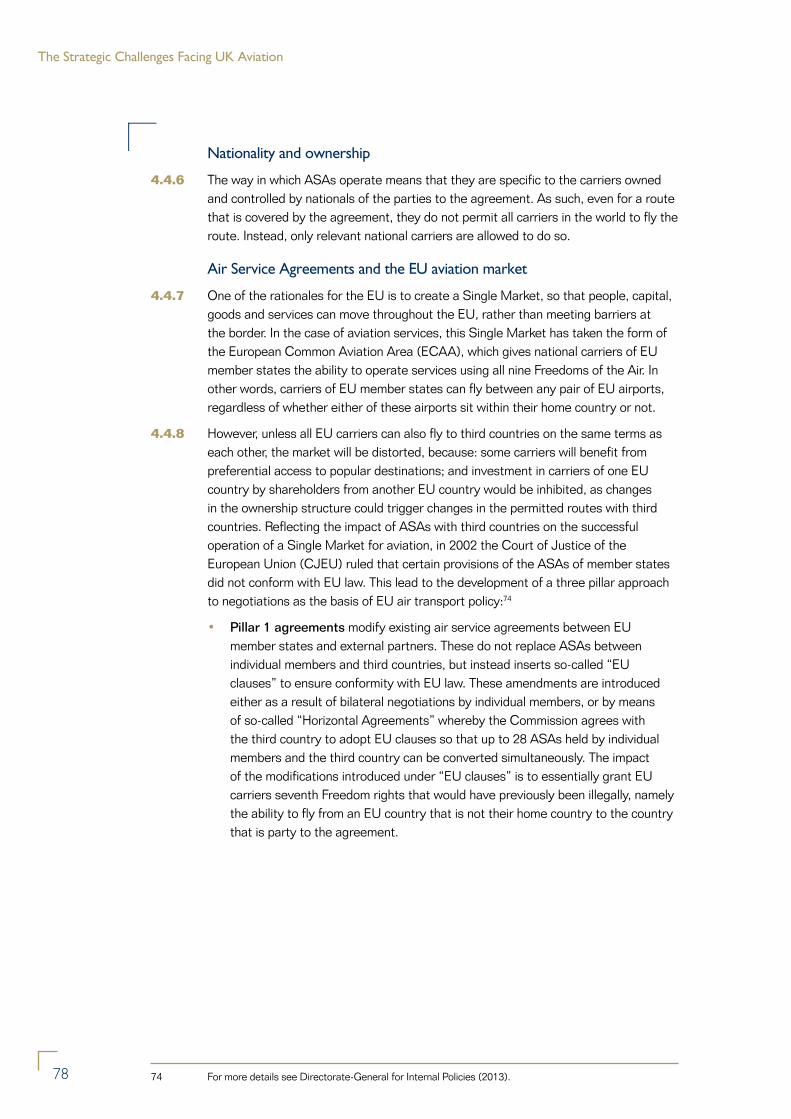
The Strategic Challenges Facing UK Aviation
78
Nationality and ownership
4.4.6 The way in which ASAs operate means that they are specific to the carriers owned and controlled by nationals of the parties to the agreement. As such, even for a route that is covered by the agreement, they do not permit all carriers in the world to fly the route. Instead, only relevant national carriers are allowed to do so.
Air Service Agreements and the EU aviation market
4.4.7 One of the rationales for the EU is to create a Single Market, so that people, capital, goods and services can move throughout the EU, rather than meeting barriers at the border. In the case of aviation services, this Single Market has taken the form of the European Common Aviation Area (ECAA), which gives national carriers of EU member states the ability to operate services using all nine Freedoms of the Air. In other words, carriers of EU member states can fly between any pair of EU airports, regardless of whether either of these airports sit within their home country or not.
4.4.8 However, unless all EU carriers can also fly to third countries on the same terms as each other, the market will be distorted, because: some carriers will benefit from preferential access to popular destinations; and investment in carriers of one EU country by shareholders from another EU country would be inhibited, as changes in the ownership structure could trigger changes in the permitted routes with third countries. Reflecting the impact of ASAs with third countries on the successful operation of a Single Market for aviation, in 2002 the Court of Justice of the European Union (CJEU) ruled that certain provisions of the ASAs of member states did not conform with EU law. This lead to the development of a three pillar approach to negotiations as the basis of EU air transport policy:74
• Pillar 1 agreements modify existing air service agreements between EU member states and external partners. These do not replace ASAs between individual members and third countries, but instead inserts so-called “EU clauses” to ensure conformity with EU law. These amendments are introduced either as a result of bilateral negotiations by individual members, or by means of so-called “Horizontal Agreements” whereby the Commission agrees with the third country to adopt EU clauses so that up to 28 ASAs held by individual members and the third country can be converted simultaneously. The impact of the modifications introduced under “EU clauses” is to essentially grant EU carriers seventh Freedom rights that would have previously been illegally, namely the ability to fly from an EU country that is not their home country to the country that is party to the agreement.
74 For more details see Directorate-General for Internal Policies (2013).
INDEPENDENT TRANSPORT COMMISSION
79
• Pillar 2 agreements establish a comprehensive aviation relationship at EU-level with states that are geographically in or border on continental Europe, but are not (yet) members of the EU. This approach is the basis of the European Common Aviation Area (ECAA) established in 2007 covering the EU, together with Albania, Bosnia and Herzegovina, the former Yugoslav Republic of Macedonia, Montenegro, Serbia, Kosovo under UNSCR 1244, Norway and Iceland. In return for the full application of the European Community’s aviation law (the Community acquis), airlines from ECAA countries have full access to the enlarged European Single Market in aviation. Pillar 2 agreements therefore extend EU standards and suspend or effectively replace the provisions of ASAs between EU member states and relevant third countries. Any issues that arise under this type of agreement are dealt with at EU level rather than between a member state’s aeronautical authority and the third country. Pillar 2 agreements can only be negotiated with an individual mandate from the Council of the European Union.
• Pillar 3 agreements establish a comprehensive relationship at EU-level with countries beyond the so-called European Neighbourhood. These agreements with third parties do not require them to adopt EU law (the acquis). Regulatory convergence is therefore achieved through harmonising rules on market access and public interest quality controls. Pillar 3 agreements can only be negotiated with an individual mandate from the Council of the European Union.
The intra-EU aviation market and the use of Freedoms of the Air in practice
4.4.9 The extent to which different carriers make use of the options available to them in practice often depends partly on history and partly on the business model they have adopted. A good example of this is the approach that different European carriers have adopted in serving the intra-EU market, see Figure 34:
4.4.10 For (former) national airlines, the so-called flag carriers, offering a full service across the globe, operating a hub and spoke model for global services makes sense, because it allows them to consolidate traffic in order to serve a wider market. This can even be facilitated by the terms specified in old-style ASAs, which can give them preferential access compared to newer carriers. Therefore, given the importance of domestic hub airports for their business model, their approach to serving the EU market has been dominated by the use of point-to-point travel between their home base and other EU countries, together with services on domestic routes within their home country.
4.4.11 In contrast the low cost carrier market that has sprung up to serve the intra-EU market is less concerned about achieving economies of scale on long-haul routes and this has given them greater freedom to take advantage of different route options within Europe, including flying between and within EU countries that are not their home base.
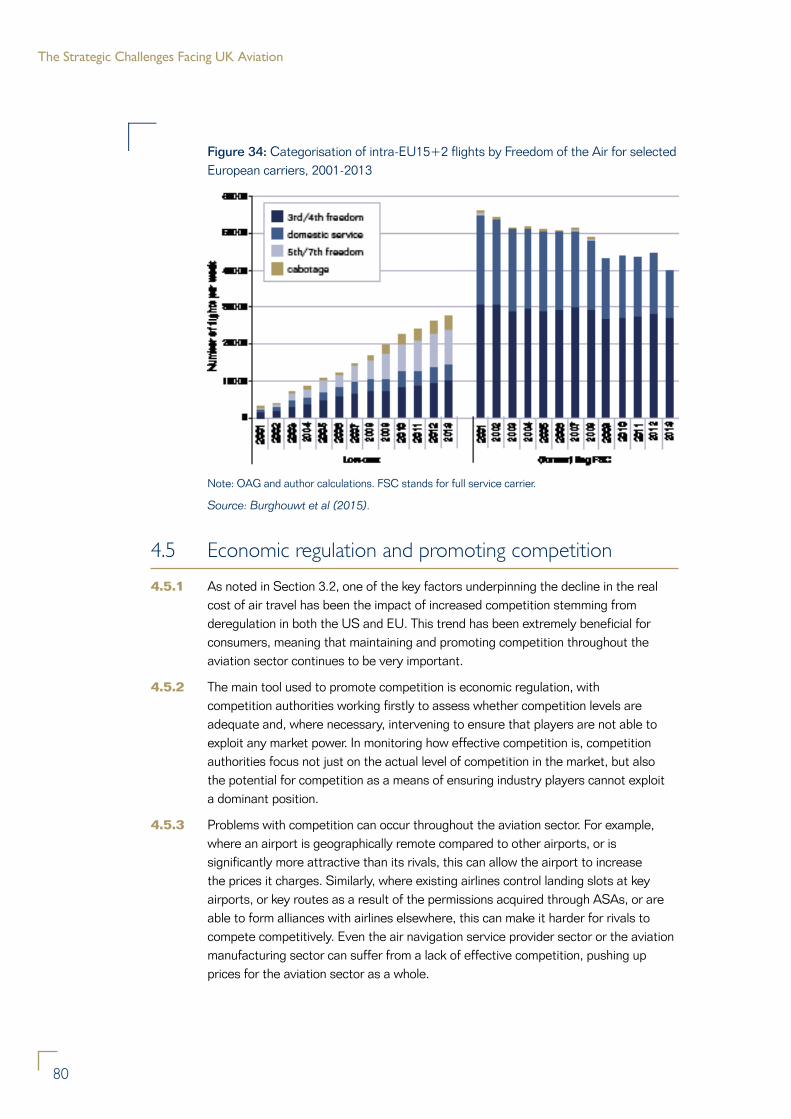
The Strategic Challenges Facing UK Aviation
80
Figure 34: Categorisation of intra-EU15+2 flights by Freedom of the Air for selected European carriers, 2001-2013
Note: OAG and author calculations. FSC stands for full service carrier.
Source: Burghouwt et al (2015).
4.5 Economic regulation and promoting competition
4.5.1 As noted in Section 3.2, one of the key factors underpinning the decline in the real cost of air travel has been the impact of increased competition stemming from deregulation in both the US and EU. This trend has been extremely beneficial for consumers, meaning that maintaining and promoting competition throughout the aviation sector continues to be very important.
4.5.2 The main tool used to promote competition is economic regulation, with competition authorities working firstly to assess whether competition levels are adequate and, where necessary, intervening to ensure that players are not able to exploit any market power. In monitoring how effective competition is, competition authorities focus not just on the actual level of competition in the market, but also the potential for competition as a means of ensuring industry players cannot exploit a dominant position.
4.5.3 Problems with competition can occur throughout the aviation sector. For example, where an airport is geographically remote compared to other airports, or is significantly more attractive than its rivals, this can allow the airport to increase the prices it charges. Similarly, where existing airlines control landing slots at key airports, or key routes as a result of the permissions acquired through ASAs, or are able to form alliances with airlines elsewhere, this can make it harder for rivals to compete competitively. Even the air navigation service provider sector or the aviation manufacturing sector can suffer from a lack of effective competition, pushing up prices for the aviation sector as a whole.
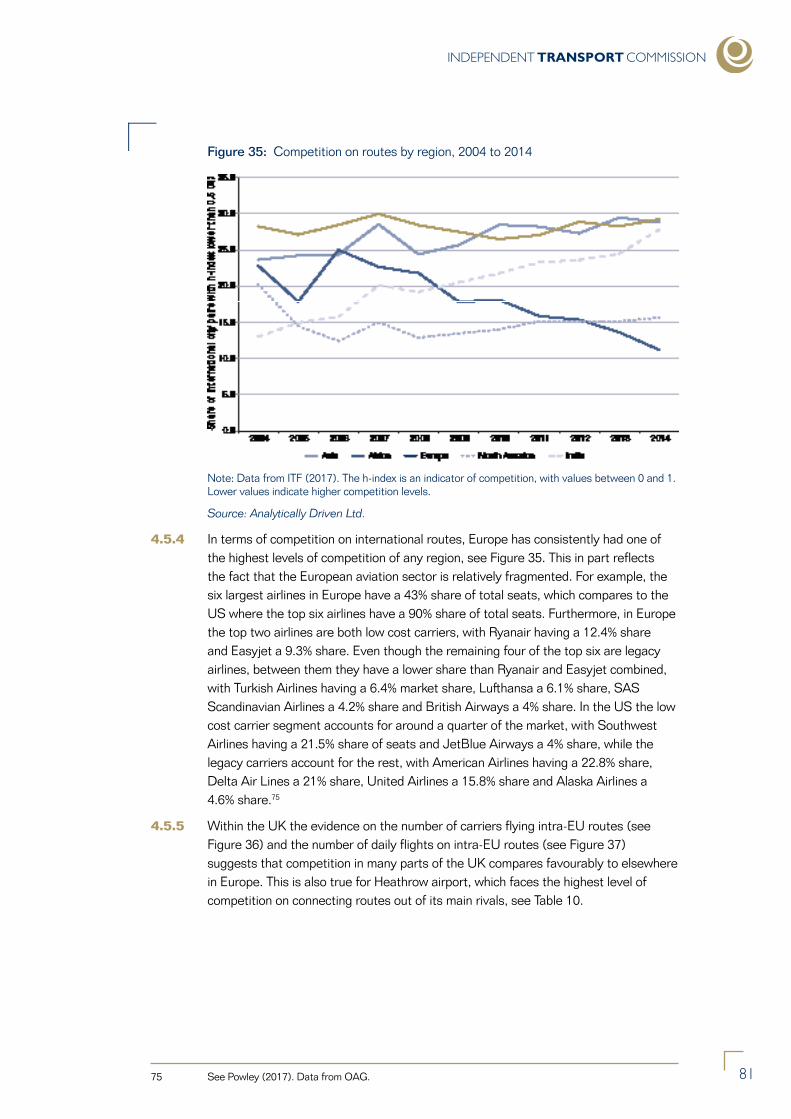
INDEPENDENT TRANSPORT COMMISSION
81
Figure 35: Competition on routes by region, 2004 to 2014
Note: Data from ITF (2017). The h-index is an indicator of competition, with values between 0 and 1. Lower values indicate higher competition levels.
Source: Analytically Driven Ltd.
4.5.4 In terms of competition on international routes, Europe has consistently had one of the highest levels of competition of any region, see Figure 35. This in part reflects the fact that the European aviation sector is relatively fragmented. For example, the six largest airlines in Europe have a 43% share of total seats, which compares to the US where the top six airlines have a 90% share of total seats. Furthermore, in Europe the top two airlines are both low cost carriers, with Ryanair having a 12.4% share and Easyjet a 9.3% share. Even though the remaining four of the top six are legacy airlines, between them they have a lower share than Ryanair and Easyjet combined, with Turkish Airlines having a 6.4% market share, Lufthansa a 6.1% share, SAS Scandinavian Airlines a 4.2% share and British Airways a 4% share. In the US the low cost carrier segment accounts for around a quarter of the market, with Southwest Airlines having a 21.5% share of seats and JetBlue Airways a 4% share, while the legacy carriers account for the rest, with American Airlines having a 22.8% share, Delta Air Lines a 21% share, United Airlines a 15.8% share and Alaska Airlines a 4.6% share.75
4.5.5 Within the UK the evidence on the number of carriers flying intra-EU routes (see Figure 36) and the number of daily flights on intra-EU routes (see Figure 37) suggests that competition in many parts of the UK compares favourably to elsewhere in Europe. This is also true for Heathrow airport, which faces the highest level of competition on connecting routes out of its main rivals, see Table 10.
75 See Powley (2017). Data from OAG.
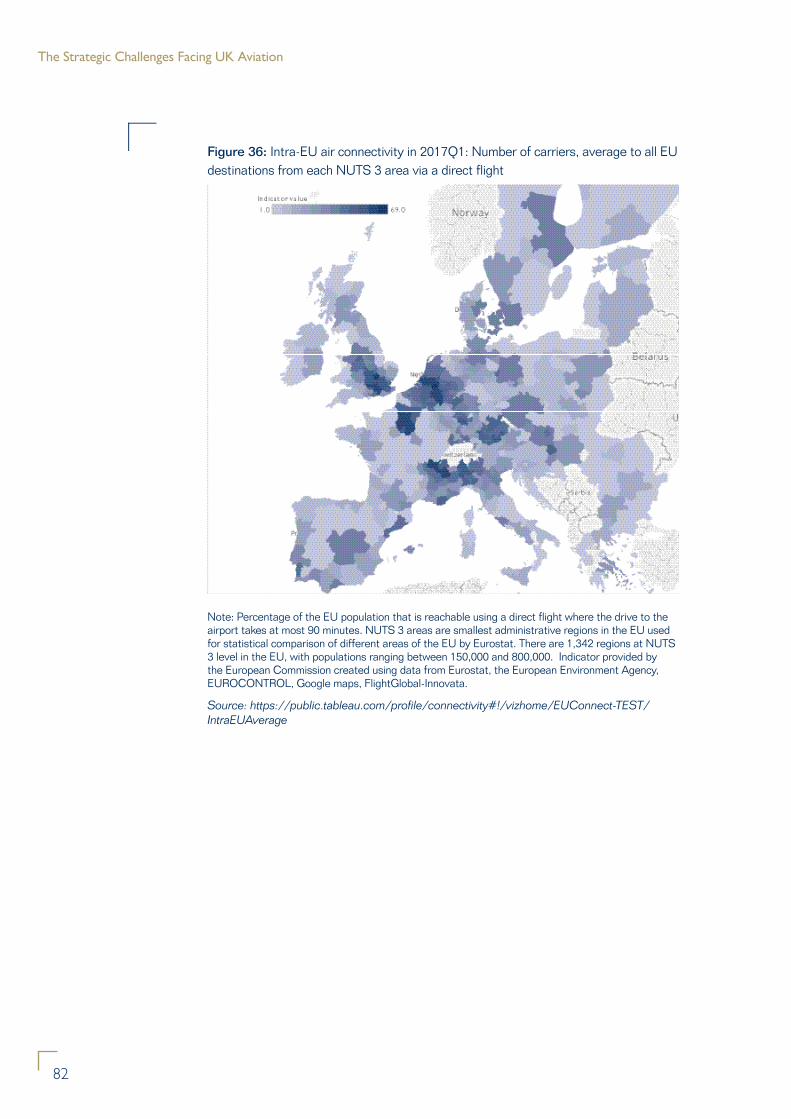
The Strategic Challenges Facing UK Aviation
82
Figure 36: Intra-EU air connectivity in 2017Q1: Number of carriers, average to all EU destinations from each NUTS 3 area via a direct flight
Note: Percentage of the EU population that is reachable using a direct flight where the drive to the airport takes at most 90 minutes. NUTS 3 areas are smallest administrative regions in the EU used for statistical comparison of different areas of the EU by Eurostat. There are 1,342 regions at NUTS 3 level in the EU, with populations ranging between 150,000 and 800,000. Indicator provided by the European Commission created using data from Eurostat, the European Environment Agency, EUROCONTROL, Google maps, FlightGlobal-Innovata.
Source: https://public.tableau.com/profile/connectivity#!/vizhome/EUConnect-TEST/IntraEUAverage
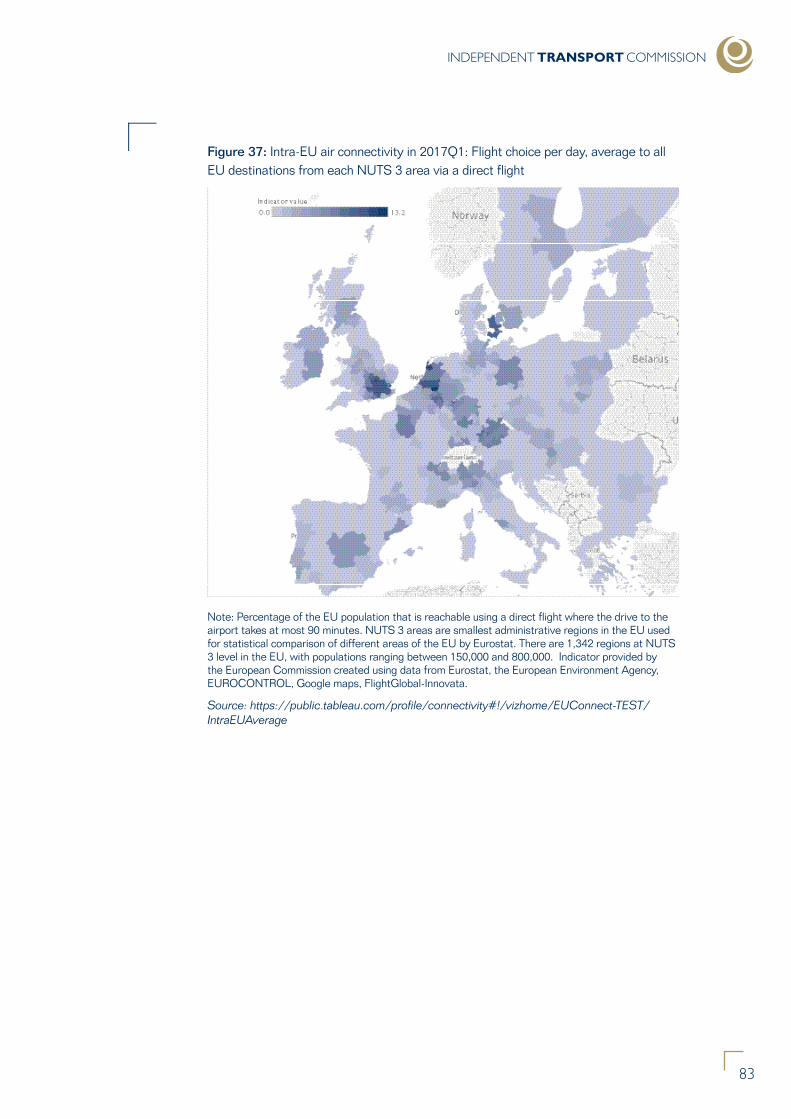
INDEPENDENT TRANSPORT COMMISSION
83
Figure 37: Intra-EU air connectivity in 2017Q1: Flight choice per day, average to all EU destinations from each NUTS 3 area via a direct flight
Note: Percentage of the EU population that is reachable using a direct flight where the drive to the airport takes at most 90 minutes. NUTS 3 areas are smallest administrative regions in the EU used for statistical comparison of different areas of the EU by Eurostat. There are 1,342 regions at NUTS 3 level in the EU, with populations ranging between 150,000 and 800,000. Indicator provided by the European Commission created using data from Eurostat, the European Environment Agency, EUROCONTROL, Google maps, FlightGlobal-Innovata.
Source: https://public.tableau.com/profile/connectivity#!/vizhome/EUConnect-TEST/IntraEUAverage
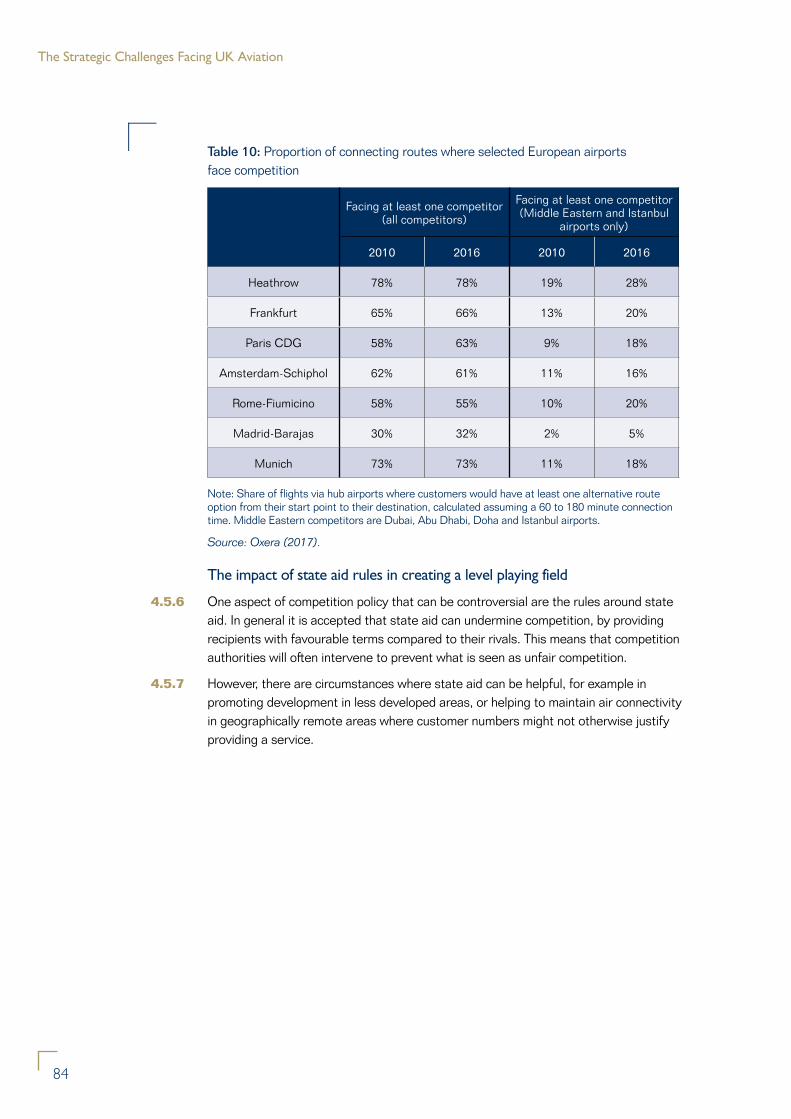
The Strategic Challenges Facing UK Aviation
84
Table 10: Proportion of connecting routes where selected European airports face competition
Facing at least one competitor (all competitors)
Facing at least one competitor (Middle Eastern and Istanbul
airports only)
2010 2016 2010 2016
Heathrow 78% 78% 19% 28%
Frankfurt 65% 66% 13% 20%
Paris CDG 58% 63% 9% 18%
Amsterdam-Schiphol 62% 61% 11% 16%
Rome-Fiumicino 58% 55% 10% 20%
Madrid-Barajas 30% 32% 2% 5%
Munich 73% 73% 11% 18%
Note: Share of flights via hub airports where customers would have at least one alternative route option from their start point to their destination, calculated assuming a 60 to 180 minute connection time. Middle Eastern competitors are Dubai, Abu Dhabi, Doha and Istanbul airports.
Source: Oxera (2017).
The impact of state aid rules in creating a level playing field
4.5.6 One aspect of competition policy that can be controversial are the rules around state aid. In general it is accepted that state aid can undermine competition, by providing recipients with favourable terms compared to their rivals. This means that competition authorities will often intervene to prevent what is seen as unfair competition.
4.5.7 However, there are circumstances where state aid can be helpful, for example in promoting development in less developed areas, or helping to maintain air connectivity in geographically remote areas where customer numbers might not otherwise justify providing a service.
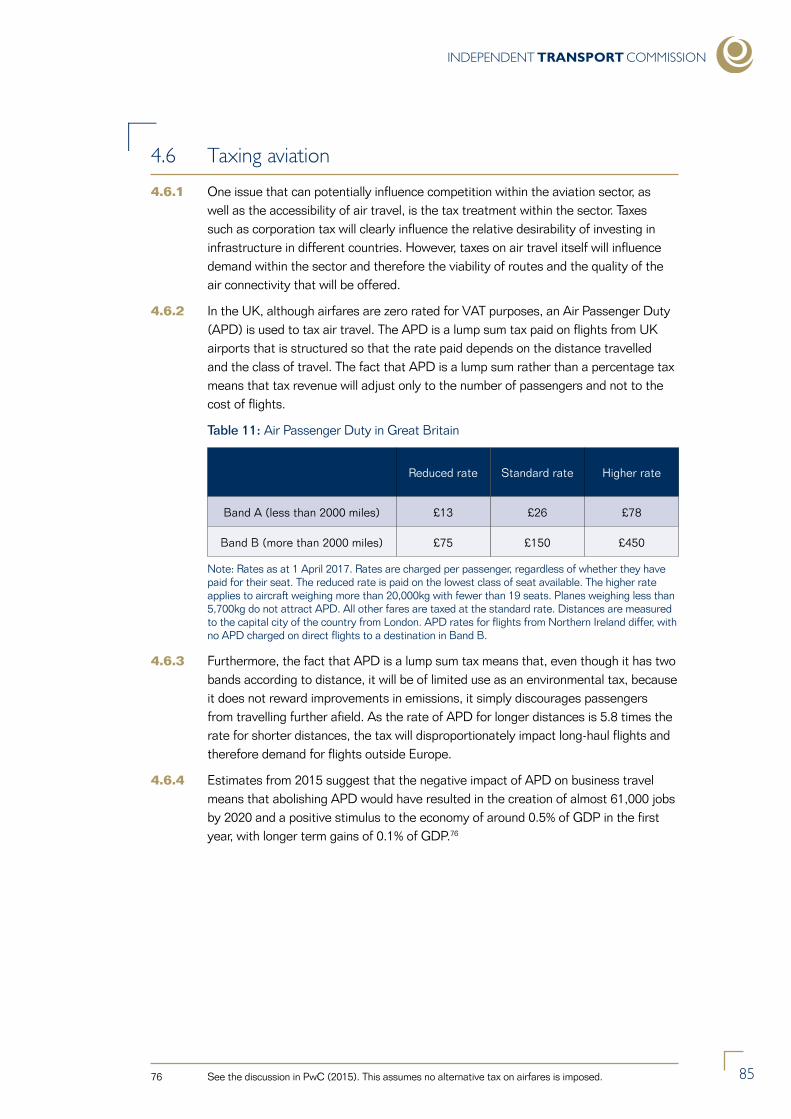
INDEPENDENT TRANSPORT COMMISSION
85
4.6 Taxing aviation
4.6.1 One issue that can potentially influence competition within the aviation sector, as well as the accessibility of air travel, is the tax treatment within the sector. Taxes such as corporation tax will clearly influence the relative desirability of investing in infrastructure in different countries. However, taxes on air travel itself will influence demand within the sector and therefore the viability of routes and the quality of the air connectivity that will be offered.
4.6.2 In the UK, although airfares are zero rated for VAT purposes, an Air Passenger Duty (APD) is used to tax air travel. The APD is a lump sum tax paid on flights from UK airports that is structured so that the rate paid depends on the distance travelled and the class of travel. The fact that APD is a lump sum rather than a percentage tax means that tax revenue will adjust only to the number of passengers and not to the cost of flights.
Table 11: Air Passenger Duty in Great Britain
Reduced rate Standard rate Higher rate
Band A (less than 2000 miles) £13 £26 £78
Band B (more than 2000 miles) £75 £150 £450
Note: Rates as at 1 April 2017. Rates are charged per passenger, regardless of whether they have paid for their seat. The reduced rate is paid on the lowest class of seat available. The higher rate applies to aircraft weighing more than 20,000kg with fewer than 19 seats. Planes weighing less than 5,700kg do not attract APD. All other fares are taxed at the standard rate. Distances are measured to the capital city of the country from London. APD rates for flights from Northern Ireland differ, with no APD charged on direct flights to a destination in Band B.
4.6.3 Furthermore, the fact that APD is a lump sum tax means that, even though it has two bands according to distance, it will be of limited use as an environmental tax, because it does not reward improvements in emissions, it simply discourages passengers from travelling further afield. As the rate of APD for longer distances is 5.8 times the rate for shorter distances, the tax will disproportionately impact long-haul flights and therefore demand for flights outside Europe.
4.6.4 Estimates from 2015 suggest that the negative impact of APD on business travel means that abolishing APD would have resulted in the creation of almost 61,000 jobs by 2020 and a positive stimulus to the economy of around 0.5% of GDP in the first year, with longer term gains of 0.1% of GDP.76
76 See the discussion in PwC (2015). This assumes no alternative tax on airfares is imposed.
86
The Strategic Challenges Facing UK Aviation
5. Consultation feedback on key issues for the sector
5.0.1 A key resource that informed the analysis in this report is the results of the Independent Transport Commission’s recent Call for Evidence on the strategic challenges facing UK aviation. This is a unique source of information that captures feedback on a broad set of issues from industry players from both the public and private sectors. As such, the results of this Call for Evidence are interesting in their own right. This section therefore summarises the main findings, to help inform the wider policy debate.
5.1 Background to the Independent Transport Commission’s Call for Evidence
5.1.1 The Independent Transport Commission (ITC) sent out its Call for Evidence on the strategic challenges facing UK aviation in May 2017. To capture as many views as possible, the questionnaire was sent to a large number of industry participants and observers and was not just confined to ITC members.
5.1.2 In total 17 organisations responded over the period between May and early August 2017. These responses came from a broad spectrum of industry players, including: the CAA and NATS; Transport for London, London First and Transport for the North; five large UK airports; a major aerospace manufacturer; the Board of Airline Representatives (BAR), a major airline group and a major freight company; a major flight comparison service provider; and two industry consultants.
5.1.3 The call for evidence was in the form of a questionnaire involving ten core questions covering: growth of the sector; the strengths and weaknesses of the UK aviation sector; the impact of Brexit on the sector; public perceptions of the sector; meeting customers’ expectations; the UK’s air connectivity and UK airspace; the regions; the effectiveness of ground services and transport links; environmental impacts; and the regulatory regime. The full questionnaire can be found in Appendix 3.
5.1.4 All the questions in the call for evidence were open ended, rather than multiple choice, and included a set of sub-questions that were designed to elicit wide ranging responses. The majority of respondents responded to the entire questionnaire. However, some either responded to a sub-set of the questions, or provided material that they considered relevant, but which was not necessarily structured to respond directly to the questions posed.
5.1.5 The main feedback from these responses is summarised below. As far as possible, this feedback has been anonymised.
INDEPENDENT TRANSPORT COMMISSION
87
INDEPENDENT TRANSPORT COMMISSION
87
5.2 The UK aviation sector’s strengths and weaknesses
5.2.1 In general respondents felt that the UK’s approach to aviation supported a good mix of business models covering: network (hub-based), point-to-point and low cost options. Respondents felt that the UK aviation sector was efficient and competitive, with a low reliance on public finance. As a result, the UK is the 2nd largest aerospace manufacturer in world and has the 3rd largest aviation network.
5.2.2 Lack of capacity to expand was seen as the biggest potential weakness of the sector by respondents. This feedback was not just a reflection of the capacity constraints at London airports, although this remains a major concern. Instead it also reflected concerns about the ability of the management of the UK’s airspace to cope, if measures to modernise the system are not implemented.
5.2.3 Over and above the government’s role in supporting big infrastructure changes, such as airport expansion and airspace management upgrades, respondents felt that the government could help support the sector in a variety of ways, including: by investing in skills; facilitating investment in design capability; and supporting small and medium sized enterprises (SMEs) in supply chains.
5.3 The prospects for growth
5.3.1 Most respondents expected the aviation sector as a whole to continue to enjoy strong positive growth. However, in a UK context the impact of Brexit represented a key risk.
5.3.2 Respondents identified that growth in demand for the output of the UK aviation sector will be influenced by: economic growth; uncertainty; the ability of low cost airlines to create route demand; price; the value of the pound (£) and its impact on the UK sector’s competitiveness, both in terms of the prices it can offer and the impact on key costs such as fuel; and the level of the UK’s Air Passenger Duty (APD).
5.3.3 Potential sources of disruption identified by respondents, which might influence growth patterns or the success of individual companies, included: the impact of aircraft design on possible routes; the ability of technology to disrupt the role of hubs; the likely continued de-packaging of the offer by airlines, to allow customers to pick and choose what type of service they want; changing work patterns, which may reduce the need for business travel; cyber risk; and drones.
The Strategic Challenges Facing UK Aviation
88
5.4 Brexit
5.4.1 It was widely recognised by respondents that Brexit poses some significant challenges for UK aviation.
5.4.2 In particular, in order to preserve the UK’s air connectivity, the UK will need to ensure that there is a timely renegotiation of a significant number of aviation treaties, including with third countries, such as the US, as well as with the EU. Air Service Agreements (ASA) are not covered by WTO rules, meaning the UK cannot rely on WTO rules to facilitate flights, as flights between the UK and third countries can only take place where there is a valid ASA.
5.4.3 In general there was clearly an appetite for the UK to remain part of key EU initiatives in the area of aviation, such as the Single European Sky (SES) programme dealing with air traffic management and the European Aviation Safety Agency (EASA). It was felt that historically the UK had been very influential in shaping these initiatives and it was seen as important that the UK remained influential in future.
5.4.4 The European Common Aviation Area (ECAA) was also seen as having played a key role in promoting competition and choice to the benefit of UK consumers and there was support by respondents for the UK remaining a member of the ECAA. However, continued participation in ECAA will require that the UK adopts EU rules on issues such as safety, security, passenger rights, competition, slot allocation and state aid.
5.4.5 From the point of view of the aviation manufacturing sector, the UK is a signatory of the WTO Agreement on Trade in Civil Aircraft.77 This agreement eliminates tariffs on trade in civil aircraft amongst the 32 signatories and would therefore limit any increase in tariff barriers for this sector. However, if the final trade deal with the EU, or replacement trade deals with third countries, increased tariffs on other products this could impact on demand for the aviation sector more widely, because of its impact on air freight. How the UK approaches promoting export growth will therefore clearly have an important impact on the sector, with initiatives suggested including establishing free trade zones.
5.4.6 One area of uncertainty was around what would replace the EU’s regulatory framework. For example, one major UK airport identified that it was subject to over 150 EU treaties, directives and regulations. The importance of the EU for regulation is not just in the rules around issues such as safety, as the EU currently plays a key role in consumer protection, which is important for how customers perceive the sector.
5.4.7 Another area where Brexit could influence customer perceptions of the sector is its impact on immigration rules, and concern was expressed that passenger arrivals would be less streamlined, leading to delays.
77 This is a WTO plurilateral agreement that entered into force on 1 January 1980. There are 32 signatories: Albania; Canada; Egypt; Georgia; Japan; Macao, China; Montenegro; Norway; Switzerland; Chinese Taipei; the United States; and the European Union, with 20 EU member states also being signatories in their own right, namely Austria; Belgium; Bulgaria; Denmark; Estonia; France; Germany; Greece; Ireland; Italy; Latvia; Lithuania; Luxembourg; Malta; the Netherlands; Portugal; Romania; Spain; Sweden and the United Kingdom. Most WTO agreements are multilateral since they are signed by all WTO members. The Agreement on Trade in Civil Aircraft is one of two plurilateral agreements (with the Agreement on Government Procurement being the second) signed by a smaller number of WTO members. It eliminates import duties on all aircraft, other than military aircraft, as well as on all other products covered by the agreement: civil aircraft engines and their parts and components; all components and sub-assemblies of civil aircraft; and flight simulators and their parts and components.
INDEPENDENT TRANSPORT COMMISSION
89
5.4.8 Another important impact of Brexit could be its impact on the UK workforce, with several respondents highlighting the importance of maintaining access to skills.
5.4.9 In terms of the potential benefits of Brexit, the fact that it could place greater emphasis on trade with countries outside EU was seen as creating the potential for a bigger role for aviation, as in those circumstances air freight will become more important. Another potential benefit mentioned by one respondent was the fact that the role of the EU in economic regulation would be reduced, which might reduce complexity.
5.5 Customer expectations and perceptions of the sector
5.5.1 Competition was seen by respondents as having a positive impact on customer choice and service, and in this area the European Common Aviation Area (ECAA) was seen as having played a key role.
5.5.2 In terms of how competition is achieved in the airport sector, it is harder for UK customers to access a foreign airport directly than in many parts of the EU, where customers can often simply drive across a border to access an airport in a neighbouring country. This means that it is important to promote competition in the UK market itself. However, at the margin, some trucking of freight to continental airports is to be expected and this will have some positive impact on competitive pressures.
5.5.3 The customer experience is likely to be shaped by changes in technology, with respondents expecting to see changes such as more automation of passenger handling and multi-modal ticketing. However, it was recognised that while this might enhance the customer experience or improve efficiency in the sector it did present challenges. This is because jobs are seen as a key local benefit associated with airports and therefore influence how local communities view the relative costs and benefits. If jobs in the aviation sector were to be significantly reduced then this would influence local perceptions of airports.
5.5.4 Delays were seen as a key driver of negative views of the sector, which led to concerns that the customer experience could be negatively impacted by Brexit.
5.5.5 Price was clearly seen as a key factor in customer decisions. There were some concerns that advertising in the airline sector based on the lowest price can create unrealistic expectations that might backfire in the way customers perceived the industry. Once customers had seen a low price advertised, they are then reluctant to accept higher prices than the ones advertised, even though airlines only intended to offer a proportion of seats at that price. A concern was also raised about the implications for customers’ ability to get the best price, if airlines were to try and restrict search platforms’ access to airline data.
The Strategic Challenges Facing UK Aviation
90
5.6 Air connectivity: airspace management and transport links
5.6.1 UK air connectivity was seen by respondents as benefiting from good access to airports, with almost 90% of the population living within two hours of at least two international airports.
5.6.2 Good surface access options were seen as vital for both an airport’s catchment area and customer perceptions. It was felt that more needed to be done to improve surface access and that, for example, through rail service options worked better than spurs. There was a view expressed by some respondents that airports needed to take more responsibility for improving surface access options. However, it was recognised that if airports were solely responsible for surface access options then any proposed solutions might miss the wider strategic considerations, as airports will only focus on their own needs.
5.6.3 There was also a feeling that the sector would benefit from better door-to-door access options and improved access for disabled people. It was also recognised that airport access can conflict with commuter traffic and it was suggested that there might need to be a move towards road charging where congestion is high.
5.6.4 It was felt that it was important to recognise that air connectivity is not just about passengers. The existence of direct air routes, for example, can have an important positive impact on trade with emerging markets. Furthermore, freight plays a key role in global supply chains and the volume of air freight is also important for the profitability of parts of the aviation sector.
5.6.5 The importance of expanding airport capacity in London was recognised by most respondents, and it was noted that Heathrow has a waiting list of 30 airlines, because of its role as a key UK and European hub.
5.6.6 Another area where capacity improvements were seen as being needed was the management of UK airspace. Airspace was viewed as a key part of UK infrastructure. However, the system of airspace management currently in use had been designed around 50 years ago and is becoming a key constraint. It was felt that improvements in this area would help improve the resilience of the system. Managing airspace better, by moving away from ground-based beacons to satellite and by allowing continuous descent, should also help reduce emissions, especially in strong weather conditions. However, it was recognised that these improvements could also both increase and concentrate noise.
INDEPENDENT TRANSPORT COMMISSION
91
5.7 The regions
5.7.1 Air connectivity and regional airports were seen as having an important role in supporting development in different regions in the UK, because of the strong links between investment and business travel. However, for regional airports to maximise the potential of this role, it was recognised that flight frequency, not just the number of destinations, was important.
5.7.2 In terms of the type of air connectivity offered by regional airports it was recognised that the EU represents a key destination. For example, 94% of flights utilised the ECAA at one major UK airport based outside London and the South East.
5.7.3 There was some concern that regional airports were failing to live up to their full potential. For example, Northern regions account for 25% of the UK population, but Northern airports only account for 15% of flights. Similarly, 11% air freight is customs cleared in the North, but only 4% flies from the North. In total it is estimated that Northern airports have the capacity to cater for 60 million additional passengers.78
5.7.4 From the perspective of regional airports, Heathrow’s proposed expansion clearly evoked mixed views. On the one hand there were concerns about the potential impact of expansion at Heathrow on competition, but on the other it was also recognised that the expansion could be beneficial if it helped facilitate better links to the regions.
5.8 Environmental issues
5.8.1 Tackling environmental issues was clearly seen as one of the major challenges facing the sector. However, there were clear examples provided of how the sector had successfully invested to improve its record on the environment. For example, one major UK airport had invested in a series of environmentally friendly initiatives such as energy waste plants. The result was that between 2010 and 2016, despite a 38% increase in passenger numbers, the airport had managed to reduce energy consumption by 47%, water consumption by 24.5% and carbon emissions by 12.5%.
5.8.2 In terms of specific environmental issues, air quality was seen by respondents as an important issue for the sector to address. As air quality around airports is often heavily influenced by surface access, this was seen as another reason why improvements in this area were to be encouraged.
5.8.3 Noise was also widely mentioned as a key issue for the sector. For example, night flights, which are important for freight, were seen as being particularly sensitive. Similarly, there was a recognition that improvements in the management of UK airspace, which could both improve the resilience of the system and reduce CO2 emissions, could also both increase and concentrate noise, thus risking local-level opposition. There was some concern that increased urbanisation was increasing the sensitivities around noise. Sensitivities had certainly heightened recently, but often reflected small, if vocal groups.
78 For further discussion see Transport for the North (2017).
The Strategic Challenges Facing UK Aviation
92
5.8.4 In general it was felt that improvements were needed to promote more trust in the regulatory regime for noise, as well as to provide better community engagement and accountability. It was also recognised that any redistribution of noise impacts, for example associated with changes to the management of UK airspace, needed to be fair.
5.8.5 More generally there was concern that local-level opposition to change can often be very vocal and that this meant that it could be hard to achieve a proper balance between national and local issues for infrastructure improvements. For this reason several respondents felt that it was important that the wider significance of aviation (for example for growth) should be clearly explained, to act as counterweight.
5.9 Regulation and tax
5.9.1 Respondents saw the maintenance of high regulatory standards as important, especially for safety and security. There was also support for the liberalisation of the aviation sector. For example, one major airport felt that the lighter touch regulatory regime introduced by the CAA had helped it to be more responsive.
5.9.2 In general there was a recognition that improvements were needed to help strengthen the UK’s long-run infrastructure management. This is because the time horizons for key projects often extend beyond the life of one government. Furthermore, on planning issues, especially for infrastructure investment, there was a clear feeling that it was important to ensure that there is a balanced approach to regulation that weighs both national as well as local interests. However, it was also seen as important to avoid a one-size-fits-all approach and that at a local level options such as agreements imposed through the planning process can be used to set local conditions (for example for noise and night flights).
5.9.3 The UK government’s Air Passenger Duty (APD) was clearly a significant concern for many respondents, especially regional airports. It was felt that the APD affected the viability of some services and there were proposals that a regime that differentiated between regions, to reduce the tax in more deprived regions, could be used to help boost regional growth. On that front it was noted that the Scottish government plans to halve APD.
5.9.4 Finally several respondents expressed support for the UK government suggestion that it would look at introducing an industrial strategy and several parts of the sector were keen to be included in this.
INDEPENDENT TRANSPORT COMMISSION
93
6. Looking to the future: strategic challenges for UK aviation
6.0.1 Having assessed the evidence on air connectivity, the functioning of the aviation sector itself and the regulatory framework for managing aviation, as well as the results of the Independent Transport Commission’s (ITC) Call for Evidence, what are the implications for the future of UK aviation? The purpose of this section is to inform the policy debate by using this evidence to identify some of the strategic challenges facing the UK aviation sector and air connectivity.
6.0.2 The report identifies four broad policy areas that represent strategic challenges for the sector and are therefore likely to shape the future of UK aviation and air connectivity. These challenges are:
• The impact of Brexit on the regulatory framework governing trade in aviation, including both tariff and non-tariff barriers, as well as the permissions associated with international air service agreements (ASAs). This challenge also raises the question as to whether the global regulatory framework governing trade in aviation, which largely relies on bilateral ASAs, is effective.
• The ability of the current system to address capacity needs within the aviation sector, including whether lessons can be learnt from the experience of the Airports Commission and whether the planning system as a whole could be made more effective. The benefits of air connectivity, which go beyond the output of the aviation sector, as well as low returns on invested capital within the aviation sector, also raise the question of whether relying purely on private sector financing of aviation capacity might create an undersupply
• The interaction between the aviation sector and local areas where it is based. While the aviation sector brings key benefits, in particular connectivity and jobs, these need to be offset against costs such as pollution and noise. Therefore, could the aviation sector do more to influence these trade-offs, for example by working to reduce roadside pollution levels? Similarly, will the Government’s new Independent Commission on Civil Aviation Noise be able to balance competing interests effectively, including the trade-off between noise and emissions, in order to reduce local tensions?
• The incentives to innovate within the aviation sector and whether these are effective. For example, how well placed is the UK aviation manufacturing sector to support innovation? Does UK Air Passenger Duty provide the right incentives both to reduce emissions and to support air connectivity to destinations outside Europe? What are the implications of the sustainability of the business model operated by firms within the aviation sector for issues such as fleet upgrades?
The Strategic Challenges Facing UK Aviation
94
6.0.3 These challenges are clearly interlinked and the list is by no means definitive. However, they represent some of the key themes that emerged in the earlier analysis. Furthermore, while several of the challenges have been triggered by some of the more immediate issues facing the sector, in each case how these issues are addressed will potentially have profound long-term implications for the future of UK aviation and air connectivity.
6.0.4 The remainder of this section therefore sets out each of these challenges in turn. The aim is not to provide definitive answers, but to set out the key questions and, in each case, to explain why the issue represents a strategic challenge for the aviation sector and how success, or failure, will influence air connectivity.
6.1 Challenge 1: Brexit, Air Service Agreements and the aviation sector
6.1.1 Like it or loath it, Brexit will fundamentally change the way in which the UK trades with the rest of the world and the aviation sector will be no different in this respect.79 Changes in both tariff and non-tariff barriers affecting UK trade, including the UK’s position within Global Supply Chains, will have a direct impact on the demand for the services provided by the aviation sector, because of its impact on air freight and travel patterns, including business travel. How the UK approaches promoting export growth will therefore shape demand in all parts of the aviation sector in the future. However, from an aviation perspective, Brexit could also directly impact the way that the sector itself does business in three different ways: through any changes in tariff barriers; through any changes in regulatory barriers, such as safety considerations; and the impact of changes to Air Service Agreements on route choices and competition. In the latter case, in particular, this raises the question as to whether the international framework governing trade in aviation services remains fit for purpose.
Brexit and barriers to trade in the aviation manufacturing sector
6.1.2 From the point of view of the aviation manufacturing sector, the UK is a signatory of the WTO Agreement on Trade in Civil Aircraft, which eliminates tariffs on trade in civil aircraft amongst the 32 signatories (see the discussion in Section 5.4).80 This will limit any increase in tariff barriers that directly affect this sector.
94
79 See, for example, the discussion in Independent Transport Commission (2017) on the impact of Brexit on different parts of the UK’s transport system.
80 This is a WTO plurilateral agreement that entered into force on 1 January 1980. There are 32 signatories: Albania; Canada; Egypt; Georgia; Japan; Macao, China; Montenegro; Norway; Switzerland; Chinese Taipei; the United States; and the European Union, with 20 EU member states also being signatories in their own right, namely Austria; Belgium; Bulgaria; Denmark; Estonia; France; Germany; Greece; Ireland; Italy; Latvia; Lithuania; Luxembourg; Malta; the Netherlands; Portugal; Romania; Spain; Sweden and the United Kingdom. Most WTO agreements are multilateral since they are signed by all WTO members. The Agreement on Trade in Civil Aircraft is one of two plurilateral agreements (with the Agreement on Government Procurement being the second) signed by a smaller number of WTO members. It eliminates import duties on all aircraft, other than military aircraft, as well as on all other products covered by the agreement: civil aircraft engines and their parts and components; all components and sub-assemblies of civil aircraft; and flight simulators and their parts and components.
INDEPENDENT TRANSPORT COMMISSION
95
6.1.3 However, the aviation manufacturing sector will still potentially be affected by non-tariff barriers, such as the need to comply with different border regulations, including Rule of Origin regulations, or the emergence of different regulatory standards. This type of non-tariff barrier could shape demand for the UK’s products.
6.1.4 While the WTO Agreement on Trade in Civil Aircraft also covers trade in parts and sub-components of aviation sector manufacturing between the 32 members, there remains the potential for tariff barriers to increase on inputs from other sectors or from countries that are not covered by the WTO Agreement on Trade in Civil Aircraft. Whether this occurs in practice will depend on the scope of the trade deals the UK negotiates with its partners and the decisions it makes about the terms of access it will offer other members of the WTO under Most Favoured Nation (MFN) rules.
6.1.5 In addition, sectors such as aviation manufacturing have increasingly looked to provide services, such as repair and maintenance, as part of their manufacturing offer. For example, around half of Rolls Royce’s revenues come from their service activities – in particular their monitoring and managing of engines.81 The scope of aviation manufacturing firms to offer services could therefore be influenced by the service sector components of any post-Brexit trade deals, including which sectors are covered and which Modes of services sector trade are allowed.82
Brexit and non-tariff barriers in the aviation services sector
6.1.6 The European framework governing aviation is seen as having had a key role in promoting competition and choice in the European aviation market. In addition, the European aviation market has also been able to achieve one of the best safety records in the world. Both these trends have benefited UK consumers.
6.1.7 As highlighted by the ITC’s Call for Evidence, there is therefore a clear appetite within the sector for the UK to remain part of key EU initiatives in the area of aviation, such as the Single European Sky (SES) programme dealing with air traffic management; the European Aviation Safety Agency (EASA); and the European Common Aviation Area (ECAA). However, continued participation in these schemes will depend on the extent to which the UK government is willing to continue to adopt a common approach with the remainder of the EU. For example, in the case of the ECAA, it would require that the UK adopts EU rules on issues such as safety, security, passenger rights, competition, slot allocation and state aid, and would also potentially provide a role for the CJEU.
6.1.8 Where the UK Government decides not to support continued participation in these schemes, it will be extremely important to ensure effective alternatives are provided. A key input into such decisions will need to be an understanding of the extent to which regulatory differences will act as a barrier to trade.
81 See the discussion in Independent Economists Group (2015).
82 The WTO’s General Agreement on Trade in Services (GATS) identifies four modes of services sector trade: Mode 1 is cross-border supply, which covers services that are supplied across borders, such as international phone calls; Mode 2 is consumption abroad, which covers activities such as tourism; Mode 3 is commercial presence, which covers the ability of firms to set up subsidiaries abroad for the purpose of supplying services; and Mode 4 is presence of the natural person, which covers the ability of employees to cross borders in order to supply services in other countries. See the discussion in Independent Economists Group (2015).
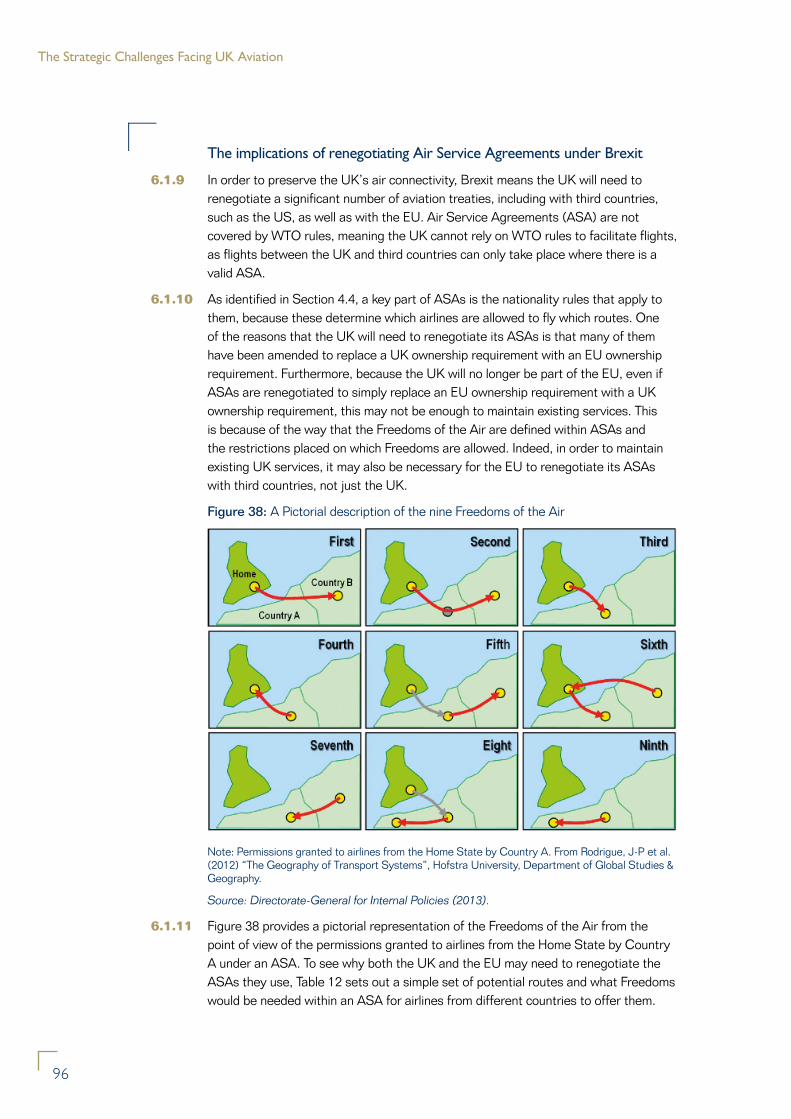
The Strategic Challenges Facing UK Aviation
96
The implications of renegotiating Air Service Agreements under Brexit
6.1.9 In order to preserve the UK’s air connectivity, Brexit means the UK will need to renegotiate a significant number of aviation treaties, including with third countries, such as the US, as well as with the EU. Air Service Agreements (ASA) are not covered by WTO rules, meaning the UK cannot rely on WTO rules to facilitate flights, as flights between the UK and third countries can only take place where there is a valid ASA.
6.1.10 As identified in Section 4.4, a key part of ASAs is the nationality rules that apply to them, because these determine which airlines are allowed to fly which routes. One of the reasons that the UK will need to renegotiate its ASAs is that many of them have been amended to replace a UK ownership requirement with an EU ownership requirement. Furthermore, because the UK will no longer be part of the EU, even if ASAs are renegotiated to simply replace an EU ownership requirement with a UK ownership requirement, this may not be enough to maintain existing services. This is because of the way that the Freedoms of the Air are defined within ASAs and the restrictions placed on which Freedoms are allowed. Indeed, in order to maintain existing UK services, it may also be necessary for the EU to renegotiate its ASAs with third countries, not just the UK.
Figure 38: A Pictorial description of the nine Freedoms of the Air
Note: Permissions granted to airlines from the Home State by Country A. From Rodrigue, J-P et al. (2012) “The Geography of Transport Systems”, Hofstra University, Department of Global Studies & Geography.
Source: Directorate-General for Internal Policies (2013).
6.1.11 Figure 38 provides a pictorial representation of the Freedoms of the Air from the point of view of the permissions granted to airlines from the Home State by Country A under an ASA. To see why both the UK and the EU may need to renegotiate the ASAs they use, Table 12 sets out a simple set of potential routes and what Freedoms would be needed within an ASA for airlines from different countries to offer them.
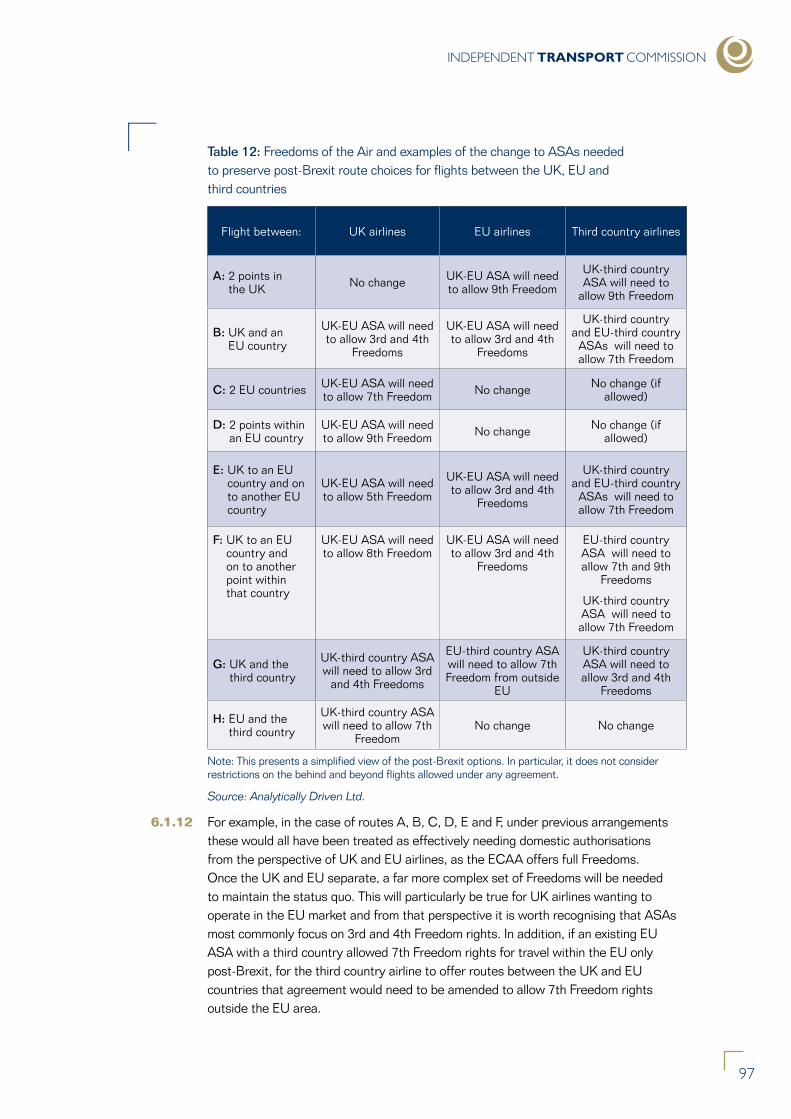
INDEPENDENT TRANSPORT COMMISSION
97
Table 12: Freedoms of the Air and examples of the change to ASAs needed to preserve post-Brexit route choices for flights between the UK, EU and third countries
Flight between: UK airlines EU airlines Third country airlines
A: 2 points in the UK No change UK-EU ASA will need
to allow 9th Freedom
UK-third country ASA will need to
allow 9th Freedom
B: UK and an EU country
UK-EU ASA will need to allow 3rd and 4th
Freedoms
UK-EU ASA will need to allow 3rd and 4th
Freedoms
UK-third country and EU-third country
ASAs will need to allow 7th Freedom
C: 2 EU countries UK-EU ASA will need to allow 7th Freedom No change No change (if
allowed)
D: 2 points within an EU country
UK-EU ASA will need to allow 9th Freedom No change No change (if
allowed)
E: UK to an EU country and on to another EU country
UK-EU ASA will need to allow 5th Freedom
UK-EU ASA will need to allow 3rd and 4th
Freedoms
UK-third country and EU-third country
ASAs will need to allow 7th Freedom
F: UK to an EU country and on to another point within that country
UK-EU ASA will need to allow 8th Freedom
UK-EU ASA will need to allow 3rd and 4th
Freedoms
EU-third country ASA will need to allow 7th and 9th
Freedoms
UK-third country ASA will need to allow 7th Freedom
G: UK and the third country
UK-third country ASA will need to allow 3rd
and 4th Freedoms
EU-third country ASA will need to allow 7th Freedom from outside
EU
UK-third country ASA will need to allow 3rd and 4th
Freedoms
H: EU and the third country
UK-third country ASA will need to allow 7th
FreedomNo change No change
Note: This presents a simplified view of the post-Brexit options. In particular, it does not consider restrictions on the behind and beyond flights allowed under any agreement.
Source: Analytically Driven Ltd.
6.1.12 For example, in the case of routes A, B, C, D, E and F, under previous arrangements these would all have been treated as effectively needing domestic authorisations from the perspective of UK and EU airlines, as the ECAA offers full Freedoms. Once the UK and EU separate, a far more complex set of Freedoms will be needed to maintain the status quo. This will particularly be true for UK airlines wanting to operate in the EU market and from that perspective it is worth recognising that ASAs most commonly focus on 3rd and 4th Freedom rights. In addition, if an existing EU ASA with a third country allowed 7th Freedom rights for travel within the EU only post-Brexit, for the third country airline to offer routes between the UK and EU countries that agreement would need to be amended to allow 7th Freedom rights outside the EU area.
The Strategic Challenges Facing UK Aviation
98
6.1.13 Importantly, however, in the cases involving flights to third countries (G and H), both the UK and EU would need to upgrade their ASAs in order for some flights to be able to take place, as they would now explicitly involve 7th Freedom rights. This may be complicated if the third country is concerned about the precedent set in offering 7th Freedom rights for ASAs with other countries. Furthermore, options involving flights stopping in the EU, UK and the third country would be even more complicated in terms of the Freedoms needed and therefore the willingness of third countries to agree.
6.1.14 The nationality requirements for ASAs could also complicate the situation if the UK needs a transition period after it leaves the EU, while the UK-EU final trade deal and any Air Service Agreement is being negotiated. While the EU may be able to agree to treat the UK as a de facto member of the EU, or at least the EEA, from the perspective of third countries the UK will have left the EU. Therefore the UK would no longer be covered by EU nationality clauses, meaning existing ASAs will technically be invalid. Furthermore, third countries may want to wait to see how the EU intends to approach renegotiating ASAs, including with the UK, before committing to a new deal with the UK. This is because the benefits they will receive from any ASA with the UK (including the ability to replicate existing flight patterns) will be determined not just by what access the UK grants, but also what access the EU grants.
6.1.15 Clearly therefore, changes to the basis on which airlines can currently fly, and particularly any restrictions that are introduced, has the potential to limit the choice of routes. This is important for two reasons. Firstly it has the potential to reduce competition, particularly within the UK market. However, in addition, while most forecasts predict that aviation will continue to grow strongly, a key feature of that growth is the assumption that regulatory barriers to aviation markets will continue to be reduced.83 Therefore the introduction of restrictions to the route network could act to reduce the growth potential of the sector. Both reduced growth and reduced competition could be detrimental to air connectivity in the UK and therefore the UK’s prosperity.
Do all countries need their own airlines?
6.1.16 Brexit means that the UK will need to renegotiate a large number of Air Service Agreements and it is not clear that even once these have been renegotiated the same level of connectivity can be provided. This raises an important question, which is: does the current system of managing international aviation agreements, with its in-built reliance on nationality constraints on the ownership and control of airlines, make sense in the modern world?
83 See the discussion in ITF (2017).
INDEPENDENT TRANSPORT COMMISSION
99
6.1.17 As discussed in Section 3.1, one of the features of the aviation sector that has puzzled commentators is the low returns on invested capital observed. One feature of this puzzle could be the impact of market segmentation on national lines. Even in the case of the EU, which allows full Freedoms within the EU and has encouraged members to introduce EU ownership clauses into external ASAs where possible, ASAs between an EU member and third countries can still be unique to those two countries, or only allow EU airlines to operate on the routes between the EU signatory to the ASA and the third country.
6.1.18 The current system therefore makes it important for all countries to have their own airlines, even if the sector as a whole might benefit from the ability of capital to flow more effectively across borders.
6.1.19 However, would the system operate more effectively if these constraints did not exist? What could replace the system? Would this lead to the development of an international flag of convenience for aviation and what would the impact of this be? What would be the impact on other parts of the aviation value chain? Would it improve air connectivity? Would this be a better way to support prosperity? How would it affect countries ability to protect and enhance the environment? What would the implications be for safety and security?
6.1.20 While the pressures of Brexit and the rise of Trump’s America First agenda might make it a difficult time to institute changes to the rules underpinning aviation, the need to make changes to address Brexit makes now a good time to ask difficult questions. Furthermore, the answers to these questions could help inform the strategic choices that the UK and other governments will need to make.
6.2 Challenge 2: Providing the capacity to support global connectivity
6.2.1 One of the reasons that the ITC commissioned Analytically Driven Ltd to write this report was that progress on Heathrow expansion made it a good time to look beyond the issue of capacity constraints affecting London and the South East. Indeed, since the report was commissioned, further progress has been made, with the UK Government launching a consultation on October 24th 2017 on the Revised Draft Airports National Policy Statement, which aims to deliver the Airports Commission’s unanimous recommendation to provide and a third runway at Heathrow.
6.2.2 However, while progress has been made on enabling Heathrow expansion, as well as on the issue of how to upgrade the UK’s management of its airspace, the question remains as to whether the UK is effective at planning to deal with capacity constraints in aviation. To allow the UK to benefit from a robust transport infrastructure that promotes global connectivity, it is important to address three key questions: will Heathrow expansion resolve capacity constraints affecting UK air connectivity; can the planning system be improved to support infrastructure change; and how should improvements to transport infrastructure be paid for? The benefits of good air connectivity are too important to ignore these questions.
The Strategic Challenges Facing UK Aviation
100
Will Heathrow expansion fix aviation capacity constraints?
6.2.3 As can be seen from Table 13, the introduction of a third runway at Heathrow will significantly increase the volume of passengers that the UK air transport system can support. In 2050, without London Heathrow expansion the London airport system is forecast to support 205 million passengers per annum and the UK air transport system 410 million passengers per annum. In contrast, if the third runway at London Heathrow goes ahead, the London airport system is forecast to support 248 million passengers per annum in 2050 and the UK air transport system 435 million passengers per annum.84
6.2.4 The fact that the impact of introducing a third runway at Heathrow has a bigger impact on passenger numbers for London than it does for the UK air transport system as a whole reflects the fact that demand will shift slightly towards London and away from regional airports. Nonetheless, despite this shift, airports at Birmingham, Bristol and East Midlands are still likely to be at or close to 100% capacity by 2050, and the reason Manchester airport is not at capacity is because the forecasts assume an increase in capacity at Manchester over the course of the forecast period. Furthermore, the ability of London Heathrow to provide additional capacity will be limited by the end of the forecast period and other London airports will be at or close to full capacity.85
6.2.5 This raises a series of questions about what process should be followed to ensure that the UK benefits from the aviation capacity it needs. For example, should the government wait for proposals from the companies owning and running airports, or should it look to identify strategic priorities? Would the UK system benefit from both expansion at Birmingham and East Midlands and if not, how should it choose? Are there ways of more effectively managing aviation infrastructure as a whole, including UK airspace, in order to reduce the impact of potential capacity constraints? Is policy intervention needed to ensure that there are effective links between regional policy and the need to improve air connectivity?
6.2.6 Resolving these issues relies on the UK having an effective planning system at both the national and local level.
84 For further details see Department for Transport (2017c).
85 For further details see Department for Transport (2017c).
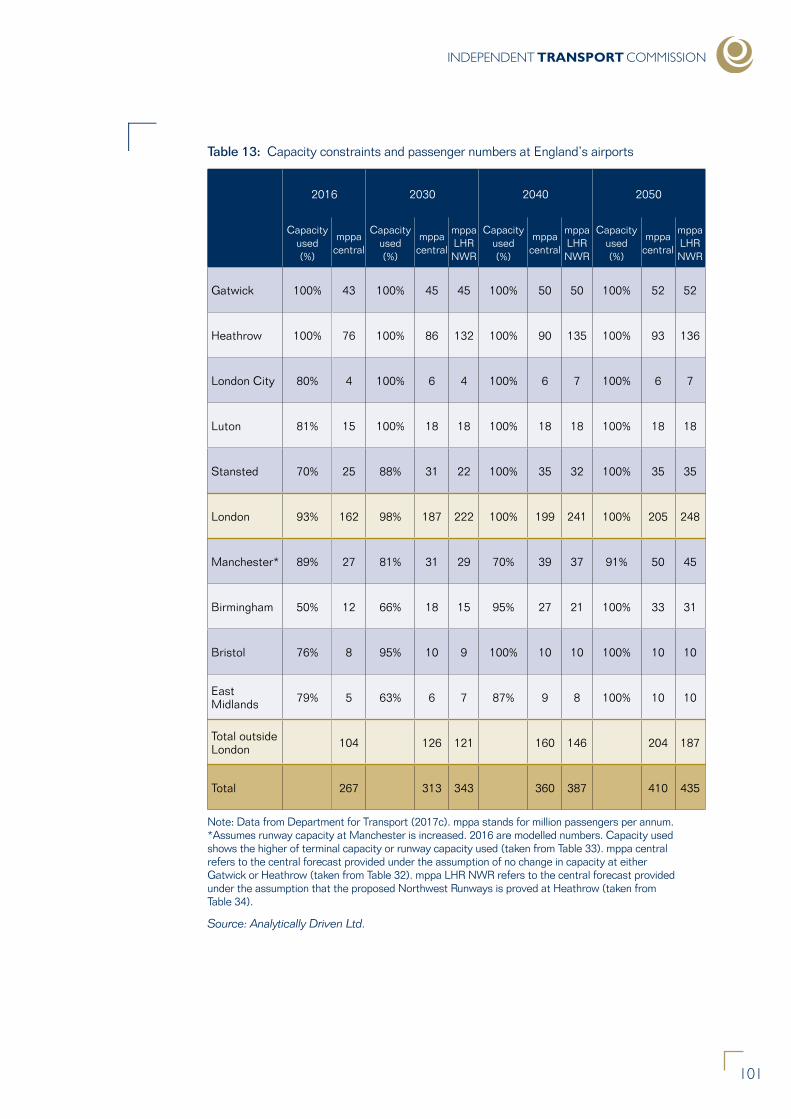
INDEPENDENT TRANSPORT COMMISSION
101
Table 13: Capacity constraints and passenger numbers at England’s airports
2016 2030 2040 2050
Capacity used (%)
mppa central
Capacity used (%)
mppa central
mppa LHR NWR
Capacity used (%)
mppa central
mppa LHR NWR
Capacity used (%)
mppa central
mppa LHR NWR
Gatwick 100% 43 100% 45 45 100% 50 50 100% 52 52
Heathrow 100% 76 100% 86 132 100% 90 135 100% 93 136
London City 80% 4 100% 6 4 100% 6 7 100% 6 7
Luton 81% 15 100% 18 18 100% 18 18 100% 18 18
Stansted 70% 25 88% 31 22 100% 35 32 100% 35 35
London 93% 162 98% 187 222 100% 199 241 100% 205 248
Manchester* 89% 27 81% 31 29 70% 39 37 91% 50 45
Birmingham 50% 12 66% 18 15 95% 27 21 100% 33 31
Bristol 76% 8 95% 10 9 100% 10 10 100% 10 10
East Midlands 79% 5 63% 6 7 87% 9 8 100% 10 10
Total outside London 104 126 121 160 146 204 187
Total 267 313 343 360 387 410 435
Note: Data from Department for Transport (2017c). mppa stands for million passengers per annum. *Assumes runway capacity at Manchester is increased. 2016 are modelled numbers. Capacity used shows the higher of terminal capacity or runway capacity used (taken from Table 33). mppa central refers to the central forecast provided under the assumption of no change in capacity at either Gatwick or Heathrow (taken from Table 32). mppa LHR NWR refers to the central forecast provided under the assumption that the proposed Northwest Runways is proved at Heathrow (taken from Table 34).
Source: Analytically Driven Ltd.
The Strategic Challenges Facing UK Aviation
102
Could the effectiveness of the UK’s planning regime be improved?
6.2.7 On 24 January 2017 the National Infrastructure Commission (NIC) was established as an Executive Agency of HM Treasury. The NIC is responsible for providing a National Infrastructure Assessment once every Parliament; specific studies on infrastructure challenges set by Government; and an annual monitoring report taking stock of the Government’s progress in areas where it has committed to following the recommendations of the NIC. The NIC therefore has the potential to become a mechanism for both identifying and addressing strategic questions facing the UK’s infrastructure, and as such represents a helpful step forward.
6.2.8 However, if it is to maximise the potential benefits from the UK’s infrastructure, it will be important that the NIC is able to take a proactive and joined up approach to assessing infrastructure needs. In the case of infrastructure to support the aviation sector, for example, air connectivity is influenced by how the transport system functions from people’s doorstep to their destination, meaning decisions about the operation of surface transport options can influence the quality of the air connectivity that is possible. This means that to maximise potential benefits there needs to be a joined up approach to thinking about how people travel, including the impact of options on other parts of the transport infrastructure, rather than a silo-based approach that focuses just on one type of transport infrastructure.
6.2.9 Of course, not all proposals to expand or adjust the infrastructure supporting aviation will necessitate a national-level decision process. Furthermore, not all planning decisions affecting airports will be about aviation itself, as where housing is located can impact potential flight paths and surface transport options will influence connectivity in its broadest sense. A key question, therefore, is how effective at delivering infrastructure is the UK’s planning regime as a whole, not just at the national, but also at the local level.
6.2.10 Planning policy exists because of the externalities associated with land use. In other words, planning policy exists because the costs and benefits for private individuals, such as landowners, can differ from the costs and benefits to society as a whole. However, despite a clear rationale for why for planning permission is needed before changes to land use are allowed, planning policy in the UK is often regarded as dysfunctional.
6.2.11 For example, in 2004 Kate Barker was asked by the then Labour Government to undertake a review of how the UK could secure its future housing needs.86 However, despite subsequent reform, including the introduction of the National Planning Policy Framework (NPPF) in March 2012, headlines about the undersupply of housing persist.87 Indeed, planning policy is so slow moving that as at 31 December 2016, 30.6% of Local Planning Authorities (LPAs) had no Local Plan in place governing land use in their area, and a further 27.3% of LPAs were relying on Plans that predated the introduction of the NPPF in 2012.88
86 For the results of the review see Barker (2004).
87 The NPPF was designed to replace the planning framework in place at the time of the Barker Review.
88 Based on analysis of Planning Inspectorate data covering notifications received by 31 December 2016.
INDEPENDENT TRANSPORT COMMISSION
103
6.2.12 While planning policy will often be controversial, one of the problems with aviation infrastructure is that decisions involve weighing up the costs and benefits not just at a local level, but also at a national and even global level. For example, the economic benefits of aviation for both the country as a whole, and local communities near key airports, can be considerable. However, these benefits need to be offset against potential costs, which can be felt both at a local level, including the impact on noise, air quality and congestion, as well as at a global level, given the sector’s impact on carbon emissions and therefore global warming. Similarly where non-aviation planning applications come forward in areas where major parts of the UK’s aviation infrastructure are located, it is important that the interaction between any proposals and both the existing and future needs of the aviation sector are considered as part of the process for weighing up applications.
6.2.13 The potential conflicts between the costs and benefits at a local, national and even global level can undermine the country’s ability to identify and approve key upgrades to the national and regional transport infrastructure, because of the complexities involved in balancing different interests. Therefore a key question for the UK is how can the planning regime be improved to ensure that it is capable of: effectively weighing up the costs and benefits at a global, national and local level; ensuring there is sufficient capacity for the air transport system to be resilient; providing timely decisions; and working better with different parts of the community?
6.2.14 While it is not in the aviation sector’s gift to improve the planning system, it is in its interests to work with Government to highlight key issues and investigate what might be achievable. Furthermore, the sector should be in a strong position to provide important insights into planning processes, including for major infrastructure projects given the recent experience of identifying the preferred option for increasing aviation capacity in the South East. This provides an opportunity to consider what lessons can be learnt, for example, from the setting up the Airports Commission and the process used to decide between alternative options to expand capacity in London, as well as more local planning processes. These insights could help identify the strengths and weaknesses of different parts of the process, and in doing so it could also help improve the process of planning for infrastructure, not just in the aviation sector, but also in other sectors.
How to pay for change?
6.2.15 Where there is an identified need to upgrade the infrastructure supporting the UK’s air transport network, an important question is how should any necessary improvements be funded? It has been noticeable that while most in the sector would support the expansion of Heathrow, airline groups have also tended to worry about what the impact of having to bear part of the costs of this expansion will be on their profitability. Given the poor return on invested capital within the airline sector as a whole, such concerns are potentially justified. Furthermore, to the extent that higher charges lead airlines to cut back on the routes they offer (particularly less popular routes), at least at the margin, charging airlines to fund Heathrow expansion could potentially have the perverse impact of reducing the quality of air connectivity available, even if it increases the quantity.
The Strategic Challenges Facing UK Aviation
104
6.2.16 Furthermore, for the airport sector as a whole, while it performs better than airlines, on average the return on invested capital is also typically lower than the sector’s weighted average cost of capital. Therefore, low profitability in both the airline and airport sectors creates a situation where infrastructure provision could be below the optimal level, given the links between air connectivity and growth.
6.2.17 A key consideration in the UK Government’s assessment of the options for airport expansion in London and the South East was the fact that the projects could be funded by the private sector. This reflects the fact that UK airports are under private sector control and arguably will help prevent the creation of white elephants, as the private sector will only invest where they will make an adequate return. It also makes sense in the context of London air infrastructure, which is not only at or close to full capacity but also has competing schemes being proposed for how to increase capacity. Furthermore, the use of private sector funding simplifies the Government’s ability to meet state aid rules.
6.2.18 However, to the extent that air connectivity provides benefits that are over and above the output and profits enjoyed by the sector itself, this creates the potential for externalities to occur. This means that the private sector could under invest relative to the optimal for the country as a whole, because the firms involved do not obtain the full benefits from the project.
6.2.19 In this situation, how should the Government look to promote and fund infrastructure upgrades and what role, if any, should the public sector play? There are no easy answers. However, part of the answer to this question will clearly depend on the UK Government’s ability to design and implement alternatives to the funding channels currently available through the EU, not just in terms of the subsidies available to less developed regions, but also funding sources such as the European Investment Bank.
6.3 Challenge 3: Aviation as a local business
6.3.1 At any given time the aviation sector will be playing not just an important global role, by creating air connectivity, but also an important local one role. The quality of air connectivity available to different communities will have a clear impact on their economic prosperity, by influencing how easy it is for them to trade. Similarly, as demonstrated by the analysis in Section 3.5, the activities of the aviation sector itself tend to be geographically concentrated. This means the aviation sector provides significant local employment opportunities for some communities and these will typically provide relatively high paid jobs. Indeed, in the case of the area around Heathrow, for example, it provides the 14th largest net local jobs market in the country.89
6.3.2 However, while the economic benefits of aviation for the country as a whole and local communities near key airports can be considerable, these benefits need to be offset against potential costs. At a local level these costs include the impact on noise, air quality and congestion. If these costs could be reduced, this could go a long way to removing local resistance to changes to aviation infrastructure. A key question therefore, is how can the aviation sector become better local partners?
89 The calculation weighs people employed in the MSOA containing Heathrow net of workers living in the local area.
INDEPENDENT TRANSPORT COMMISSION
105
Becoming better local partners
6.3.3 For good or ill, the aviation sector has a significant impact on the local communities where it is located. Given the geographic concentration of the sector, it is therefore particularly important for the sector’s reputation that it can be an effective local partner.
6.3.4 This is clearly not a simple task, given the trade-offs between issues such as reducing carbon emissions and the concentration of aircraft noise. So how could the sector learn to adapt to address local concerns?
6.3.5 Clearly there is no silver bullet, as the issues are too complex and each area will have different concerns. However, as research for the ITC makes clear, the UK aviation sector has made a number of positive changes in order to influence its environmental impacts. For example, the introduction of noise and NOX charges at key UK airports means that 86% of UK departing seats are now covered by this type of charge.90
6.3.6 However, from the perspective of local communities, it is not just passengers that can have an impact on the environmental costs associated with the aviation sector. One issue that was noticeable from the analysis of commuting patterns in Section 4.1 is that not only do workers in and around airports typically commute much longer distances than the average worker, they are also much more likely to drive a car. Therefore, one way that the sector could help improve its local reputation would be to look to address these commuting patterns and their impact on both air quality and congestion. This could include facilitating a switch to electric vehicles amongst workers, providing park and ride options to avoid congestion on key local roads, subsidising the use of public transport, or working with local authorities and surface transport operators to improve public transport in a way that would encourage workers to shift.
Independent Commission on Civil Aviation Noise
6.3.7 Another issue that creates key tensions between the aviation sector and local communities is aircraft noise. In October 2017 the UK Government confirmed that it will set up an Independent Commission on Civil Aviation Noise. This potentially provides a helpful mechanism to ensure that noise issues are properly incorporated into decision processes.
6.3.8 However, it will be important to review how the operation of this body influences the balance between the interests of local communities, the operational needs of the aviation sector and wider environmental considerations. Again finding the optimal balance will not be simple. As research for the ITC highlights, the solutions to noise problems are not always compatible with reducing emissions, see Figure 39.91 Furthermore, air connectivity makes an important contribution to the UK’s national infrastructure, so ensuring that competing interests are balanced effectively will be key to the Independent Commission on Civil Aviation Noise’s success.92
90 See Hind and RDC Aviation Ltd (2016).
91 See also the discussion in Hind and RDC Aviation Ltd (2016).
92 For more details see Department for Transport (2017d).
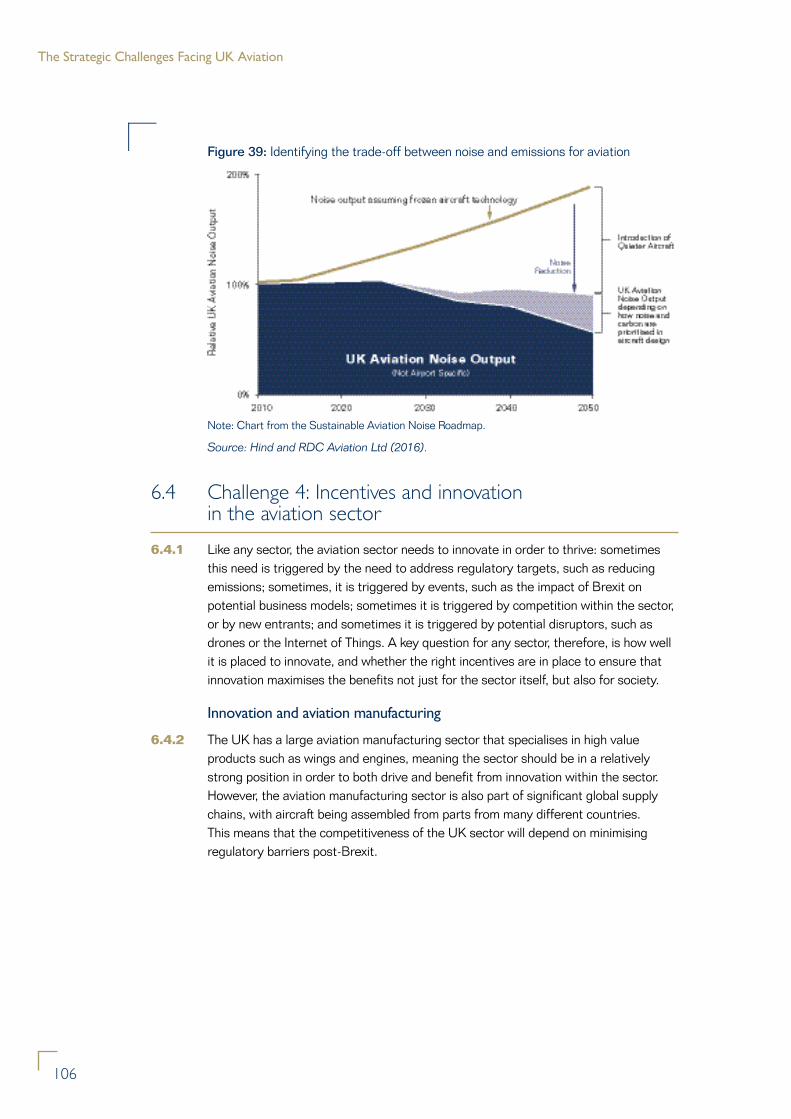
The Strategic Challenges Facing UK Aviation
106
Figure 39: Identifying the trade-off between noise and emissions for aviation
Note: Chart from the Sustainable Aviation Noise Roadmap.
Source: Hind and RDC Aviation Ltd (2016).
6.4 Challenge 4: Incentives and innovation in the aviation sector
6.4.1 Like any sector, the aviation sector needs to innovate in order to thrive: sometimes this need is triggered by the need to address regulatory targets, such as reducing emissions; sometimes, it is triggered by events, such as the impact of Brexit on potential business models; sometimes it is triggered by competition within the sector, or by new entrants; and sometimes it is triggered by potential disruptors, such as drones or the Internet of Things. A key question for any sector, therefore, is how well it is placed to innovate, and whether the right incentives are in place to ensure that innovation maximises the benefits not just for the sector itself, but also for society.
Innovation and aviation manufacturing
6.4.2 The UK has a large aviation manufacturing sector that specialises in high value products such as wings and engines, meaning the sector should be in a relatively strong position in order to both drive and benefit from innovation within the sector. However, the aviation manufacturing sector is also part of significant global supply chains, with aircraft being assembled from parts from many different countries. This means that the competitiveness of the UK sector will depend on minimising regulatory barriers post-Brexit.
INDEPENDENT TRANSPORT COMMISSION
107
6.4.3 Therefore a key question is whether there is anything that the UK Government could do to help support this key sector? For example, are the skills needed to support the aviation manufacturing sector different to skills needed in other sectors and if so, how should this influence both education policy and immigration policy? Similarly, what would an effective UK industrial strategy look like from the perspective of the UK aviation sector? From the perspective of industrial strategy itself, another important question to ask is what role could the aviation services sector play in maximising the success of the economy as a whole and how could this best be achieved?
6.4.4 However, in terms of the incentives to innovate within the aviation manufacturing sector globally, one of the issues that the sector faces is that once it has created new solutions (for example to issues like reducing noise and emissions), how quickly will that translate into demand for new models? As the analysis in Section 4.1 made clear, while new models may be available, the economics of upgrading fleets will not always make sense. This raises the question of whether the tax and incentives available within the UK (and globally) are aligned to the twin goals of protecting the environment while at the same time promoting air connectivity.
Does Air Passenger Duty create the right incentives?
6.4.5 Good air connectivity brings clear economic benefits. However, the aviation sector also raises significant environmental challenges, including in terms of its carbon emissions, noise and the air quality around airports, which can lead to calls for change. Furthermore, the potential for other sectors to shift to cleaner technologies will influence perceptions of the aviation sector, as these trends could potentially make emissions by the aviation sector look even more striking.93 Therefore a key challenge for the sector is how it can innovate in order to balance the two potentially opposing goals of maximising air connectivity and protecting and enhancing the environment.
6.4.6 As has been highlighted in this report, there are significant concerns within the sector that the main tax on aviation, the Air Passenger Duty (APD), potentially undermines UK air connectivity both with the rest of the world and within UK regions. This is because it is significantly higher than similar taxes raised in most other countries.94
6.4.7 Furthermore, if the APD’s role is to manage emissions, not only is it an extremely blunt tool for doing so, but the way in which it does so is likely to be particularly damaging to air connectivity for post-Brexit global Britain. This is because the APD uses a simple cut off to set tax rates, of below or above 2,000 miles, and in the latter case the rates charged are over five times the former. If the UK is going to achieve its vision of becoming a truly global player post-Brexit, having a tax that penalises travel to far-flung locations is likely to be counter-productive. Indeed, as a tax the APD will only manage emissions to the extent that it discourages people from flying. It has no link to the actual emissions associated with journeys, and provides no incentives for airlines to operate cleaner (or indeed quieter) aircraft.
93 See the discussion in Sussams and Leaton (2017) on the factors that are likely to lead to a shift to electric vehicles.
94 See also the discussion in Hind and RDC Aviation Ltd (2016).
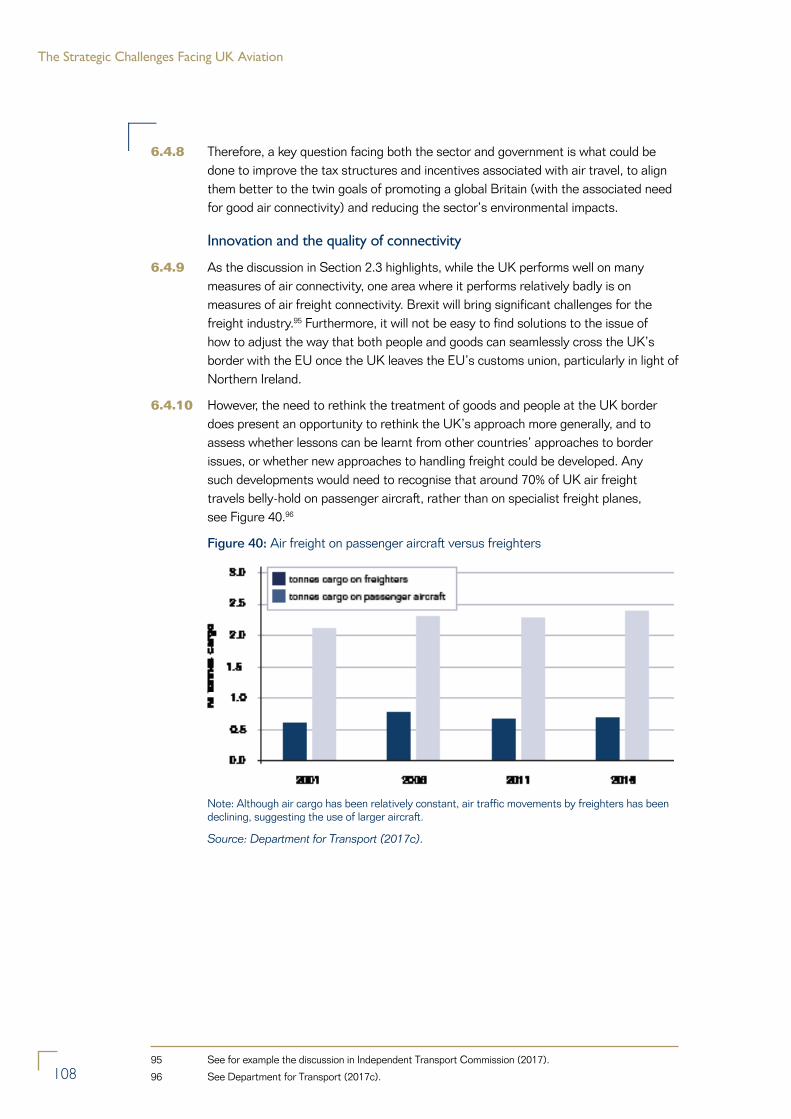
The Strategic Challenges Facing UK Aviation
108
6.4.8 Therefore, a key question facing both the sector and government is what could be done to improve the tax structures and incentives associated with air travel, to align them better to the twin goals of promoting a global Britain (with the associated need for good air connectivity) and reducing the sector’s environmental impacts.
Innovation and the quality of connectivity
6.4.9 As the discussion in Section 2.3 highlights, while the UK performs well on many measures of air connectivity, one area where it performs relatively badly is on measures of air freight connectivity. Brexit will bring significant challenges for the freight industry.95 Furthermore, it will not be easy to find solutions to the issue of how to adjust the way that both people and goods can seamlessly cross the UK’s border with the EU once the UK leaves the EU’s customs union, particularly in light of Northern Ireland.
6.4.10 However, the need to rethink the treatment of goods and people at the UK border does present an opportunity to rethink the UK’s approach more generally, and to assess whether lessons can be learnt from other countries’ approaches to border issues, or whether new approaches to handling freight could be developed. Any such developments would need to recognise that around 70% of UK air freight travels belly-hold on passenger aircraft, rather than on specialist freight planes, see Figure 40.96
Figure 40: Air freight on passenger aircraft versus freighters
Note: Although air cargo has been relatively constant, air traffic movements by freighters has been declining, suggesting the use of larger aircraft.
Source: Department for Transport (2017c).
95 See for example the discussion in Independent Transport Commission (2017).
96 See Department for Transport (2017c).
INDEPENDENT TRANSPORT COMMISSION
109
Competition and the sustainability of the aviation business model
6.4.11 Competition will play a key role in fostering innovation, particularly for questions such as: are there ways that the aviation sector could work more effectively to meet the needs of its customers, or how can the aviation sector adapt to the impact of an ageing population?
6.4.12 In the case of the European aviation market, the evidence suggests that it remains very competitive and that there are relatively few barriers to entry despite the fact that it is relatively capital intensive.97 Clearly from a UK perspective, Brexit could have a significant impact on competition within the UK aviation market, both from the perspective of what routes airlines can compete on, and who is eligible to invest in airlines, or even airports.
6.4.13 However, looking beyond Brexit, as highlighted in Section 3.1, for many commentators one of the puzzles associated with the aviation sector is the low returns on invested capital observed in key parts of the sector, but particularly airlines. For example in the airline sector between 2004 and 2011 average returns on invested capital was just 4%, significantly below the weighted average cost of capital for the sector.98 While this may be a function of a competitive market, it could also reflect the market segmentation that the international regime governing air services creates. This makes it harder to achieve consolidation within the sector across national lines, with alternatives such as alliances being used as a proxy.
6.4.14 As the recent examples of Monarch Airways, Alitalia and Air Berlin have highlighted, while low returns have been a feature of the sector for some time, things can go wrong. This has potentially negative effects on the sector’s reputation, particularly where the result is headlines about the need to repatriate stranded passengers.
6.4.15 In turn this will potentially make it harder for new entrants and smaller companies to compete, as customers seek the safety of well-established brands. In the wake of Monarch Airlines there have been calls for the UK Government to change the system in order to protect taxpayers from the costs associated with repatriation in future. While government intervention to introduce a scheme protecting customers in case of the collapse of scheduled airlines could help improve confidence in the sector, it is not without challenges. For example, depending on how the scheme is configured, as well as its overall cost, it could make UK airlines less competitive than rivals elsewhere (if it only applied to UK airlines) or the use of UK hubs less attractive (if it was applied to all flights from UK airports). This in turn could have a negative impact on UK air connectivity and therefore the UK’s economic prosperity. The challenge for both the sector and the UK Government would therefore be to design a scheme to deal with the risk of airline collapse that will promote confidence in the sector, reduce the risks to UK taxpayers and support competition in the sector, without damaging UK air connectivity.
97 See the discussion in Oxera (2017).
98 See the discussion in Dichter (2017) and Tretheway and Markhvida (2013).
110
The Strategic Challenges Facing UK Aviation
7.0.1 This report was commissioned by the Independent Transport Commission (ITC) to provide a broad-based assessment of the UK aviation sector, aviation policy and air connectivity – one that looked beyond airport expansion in the South East. The purpose of this report is twofold: firstly to help inform the policy debate by providing a wide-ranging analysis of the state of UK air connectivity, the UK aviation sector, and the regulatory challenges raised by aviation; and secondly to use this analysis to help identify both the key strategic challenges facing the sector, as well as any gaps where further research would be beneficial. The decision to focus on both air connectivity and the UK aviation sector reflects the fact that good air connectivity has important benefits that go beyond simply the output, income and employment directly attributable to the aviation sector itself.
7.0.2 As the analysis in the report highlights, improvements in air connectivity such as the introduction of direct flights, an increase in the number of flights offered, or increased competition from low cost airlines can be shown to have measurable impacts on how activity in economies is structured and the benefits that flow from it. These impacts are over and above the aviation sector’s measured share of jobs and output, or even the induced impact of aviation on demand in sectors like tourism. This is because good air connectivity helps foster collaboration between people and firms; makes it easier for firms to operate and trade effectively in multiple locations; and supports global supply chains by managing time sensitivities. In other words, for a given amount of spending on aviation, improvements in the quality of air connectivity will improve the ability of other sectors to operate effectively, even though the amount of aviation spending has not changed.
7.0.3 From a policy perspective, therefore, the quality of air connectivity has key implications for the functioning of the UK economy. In this respect, while the evidence in this report suggests that the air connectivity enjoyed by the UK is typically good, there are some concerns, particularly around the air freight regime and perceptions of the UK’s air transport sector.
7.0.4 As well as being the means to deliver air connectivity, the aviation sector is also a major global industry. Combined with the impact of aviation on tourism demand, in total around 62.7 million people worldwide rely on aviation for they jobs.99 The aviation sector is also a major contributor to the UK economy, including as a source of jobs that typically pay well above the national average. Furthermore, these jobs tend to be concentrated geographically, which is of clear benefit to nearby communities. However, while the aviation sector has some clear economic strengths (even without considering air connectivity), one of the puzzles in the sector is the low returns on capital that are typically observed. In addition, the economic benefits of the sector also need to be weighed against the environmental issues raised by aviation, which range from being global to extremely local in scale.
7. Conclusions
99 See ATAG (2016).
INDEPENDENT TRANSPORT COMMISSION
111
INDEPENDENT TRANSPORT COMMISSION
111
7.0.5 Looking ahead, the report highlights four strategic challenges that will shape UK aviation and UK air connectivity in future, namely: the impact of Brexit on how the UK approaches aviation policy, including Air Service Agreements; how to improve the system of planning for aviation capacity; the implications for the aviation sector of being a local, geographically concentrated business and the sector’s ability to balance costs and benefits at both a local, national and global level; and the need to ensure incentives, such as tax, are effectively aligned to support innovation in the sector, including both to reduce the sector’s environmental impact at the same time as improving its ability to support good air connectivity.
7.0.6 These challenges are clearly interlinked. In addition, the list will not be definitive. However, they represent some of the key themes that emerged in the analysis. Furthermore, while several of the challenges reflect some of the immediate issues facing the sector, in each case how these issues are addressed will potentially have profound long-term implications for the future of UK aviation and air connectivity.
112
The Strategic Challenges Facing UK Aviation
Appendix 1
References
ACI Europe (2017) “Airport Industry connectivity report 2017”, https://www.aci-europe.org/policy/connectivity.html.
Airports Commission (2013) “Airports Commission: Interim Report”, Airports Commission.
Anderson, JE, and van Wincoop, E, (2004) “Trade Costs”, Journal of Economic Literature, Vol 42, 691-751.
ATAG (2016) “Aviation: benefits beyond borders”, Air Transport Action Group, http://www.atag.org/our-publications/latest.html.
Barker, K (2004) “Delivering stability: securing our future housing needs. Final report: recommendations”, HM Treasury (March).
Bel, G and Fageda, X (2008) “Getting there fast: globalization, intercontinental flights and location of headquarters”, Journal of Economic Geography, Vol 8(4), 471-495.
Bernstein, S, Giroud, X, and Townsend, RR (2016) “The impact of venture capital monitoring”, Journal of Finance, Vol 71, 1591-1622.
Bouwer, J, Maxwell D, and Saxon, S (2015) “Gridlock on the ground: how airlines can respond to airport congestion”, McKinsey & Company, August 2015, https://www.mckinsey.com/industries/travel-transport-and-logistics/our-insights/ gridlock-on-the-ground-how-airlines-can-respond-to-airport-congestion.
Burghouwt, G, De Leon, PM, and De Wit, J (2015) “EU air transport liberalisation process, impacts and future considerations”, International Transport Forum, Discussion Paper 2015-04.
Burghouwt, G and Redondi, R (2013) “Connectivity in Air Transport Networks: An Assessment of Models and Applications”, Journal of Transport Economics and Policy, Vol. 47, Part I, January 2013, 35-53.
Catalini C, Fons-Rosen, C, and Gaulé, P (2016) “Cheaper flights and scientific collaboration” VOX, http://voxeu.org/article/cheaper-flights-and-scientific-collaboration.
Department for Transport (2017a) “Upgrading UK Airspace: Strategic Rationale”, https://www.gov.uk/government/uploads/system/uploads/attachment_data/file/586871/upgrading-uk-airspace-strategic-rationale.pdf.
Department for Transport (2017b) “Revised Draft Airports National Policy Statement: new runway capacity and infrastructure at airports in the South East of England: Presented to Parliament pursuant to Section 9(2) of the Planning Act 2008. Moving Britain Ahead”, October 2017, https://www.gov.uk/government/uploads/system/uploads/attachment_data/file/654123/revised-draft-airports-nps-web-version.pdf.
INDEPENDENT TRANSPORT COMMISSION
113
INDEPENDENT TRANSPORT COMMISSION
113
Department for Transport (2017c) “UK Aviation Forecasts”, October 2017, https://www.gov.uk/government/uploads/system/uploads/attachment_data/file/653821/uk-aviation-forecasts-2017.pdf.
Department for Transport (2017d) “Consultation Response on UK Airspace Policy: A framework for balanced decisions on the design and use of airspace”, October 2017, https://www.gov.uk/government/uploads/system/uploads/attachment_data/file/653801/consultation-response-on-uk-airspace-policy-web-version.pdf.
Dichter, A (2017) “Between ROIC and a hard place: the puzzle of airline economics”, McKinsey & Company, February 2017, https://www.mckinsey.com/industries/travel-transport-and-logistics/our-insights/between-roic-and-a-hard-place-the-puzzle-of-airline-economics.
Directorate-General for Internal Policies (2013) “An overview of the Air Services Agreements concluded by the EU”, European Parliament, http://www.europarl.europa.eu/RegData/etudes/note/join/2013/495849/IPOL-TRAN_NT(2013)495849_EN.pdf.
Driver, R (2017) “The provision of rapid charging points in London: the case for government intervention”, Report for Addison Lee, http://www.analytically-driven.com/uploads/2/7/8/1/27818525/electric_vehicle_charging_infrastructure_for_london_-_sept_2017_-_final_v1.pdf.
Driver, R (2015) “Time to act - The economic consequences of failing to expand airport capacity”, Independent Transport Commission, http://www.theitc.org.uk/wp-content/uploads/2015/06/ITC-Economics-airport-inaction- Dr-R-Driver-June-2015.pdf.
Driver, R, (2014) “Analysing the case for EU Membership: How does the economic evidence stack up?”, TheCityUK.
GaWC (2014) “The World according to GaWC 2012”, http://www.lboro.ac.uk/gawc/world2012t.html.
Hind, P (2014) “The optimal size of a UK hub airport”, Independent Transport Commission.
Hind, P and RDC Aviation Ltd (2016) “The sustainability of UK Aviation: Trends in the mitigation of noise and emissions”, Independent Transport Commission.
HM Government (2017) “Beyond the horizon: The future of UK aviation. A call for evidence on a new strategy”, July 2017, https://www.gov.uk/government/ uploads/system/uploads/attachment_data/file/636625/aviation-strategy-call- for-evidence.pdf.
Hummels, D, and Schaur, G (2013) “Time as a trade barrier”, American Economic Review, Vol 103(7), 2935-59.
IATA (2017a) “Fact Sheet: Industry statistics, June 2017”, http://www.iata.org/pressroom/facts_figures/fact_sheets/Documents/fact-sheet-industry-facts.pdf.
IATA (2017b) “Fact Sheet: Single European Sky”, http://www.iata.org/pressroom/facts_figures/fact_sheets/Documents/fact-sheet-ses.pdf.
IATA (2016) “Fact Sheet: Safety”, http://www.iata.org/pressroom/facts_figures/fact_sheets/Documents/fact-sheet-safety.pdf.
The Strategic Challenges Facing UK Aviation
114
ICAO (2017) “Presentation of 2016 Air Transport Statistical Results”, https://www.icao.int/annual-report-2016/Documents/ARC_2016_Air%20Transport%20Statistics.pdf.
Independent Economists Group (2015) “The economics of trade in services”, report by Analytically Driven Ltd for the Independent Economists Group, TheCityUK.
Independent Transport Commission (2017) “How will leaving the EU affect UK transport? Key issues”, ITC Occasional Paper No 10, http://www.theitc.org.uk/wp-content/uploads/2017/07/ITC-OP-10-Brexit-and-Transport-July-2017.pdf.
Industry High Level Group (2017) “Aviation benefits 2017”, http://www.aci.aero/Publications/Full-Publications-Listing/Aviation-Benefits-2017--Industry-High-Level-Group-Report.
ITF (2017) “ITF Transport Outlook 2017”, OECD Publishing, http://dx.doi.org/10.1787/9789282108000-en.
OAG (2017) “OAG 2017 Megahubs International Index: The world’s most connected airports”, https://www.oag.com/free-reports.
Oxera (2017) “The continuing development of airport competition in Europe”, report for ACI Europe, https://www.aci-europe.org/component/downloads/downloads/5189.html.
Powley, T (2017) “European airlines face more cuts and consolidation”, October 8, 2017, Financial Times.
PwC (2015) “The economic impact of Air Passenger Duty: Analytical update”, http://airlinesuk.org/wp-content/uploads/2015/06/The-economic-impact-of-APD-analytical-update-PwC-May-2015.pdf.
Shepherd, B, Shingal, A and Raj, A (2016) “Value of air cargo: Air transport and Global Value Chains, Final Report”, Report for IATA, http://www.iata.org/publications/economic-briefings/value-of-air-cargo-2016-report.pdf.
Sorensen, J (2017) “2016 Top 10 Airline Ancillary Revenue Rankings”, issued 18 July 2017, IdeaWorksCompany.com LLC, http://www.ideaworkscompany.com/wp-content/uploads/2017/07/2016-Top-10-Airline-Ancillary-Revenue-Rankings.pdf.
Sussams, L, and Leaton, J, (2017) “Expect the unexpected: the disruptive power of low-carbon technology”, Carbon Tracker Initiative and the Grantham Institute, Imperial College, London, http://www.imperial.ac.uk/media/imperial-college/grantham-institute/public/publications/collaborative-publications/Expect-the-Unexpected_CTI_Imperial.pdf.
Transport for the North (2017) “Independent International Connectivity Commission report”, http://www.transportforthenorth.com/wp-content/uploads/International-Connectivity-Report_websafe.pdf.
Tretheway, M and Andriulaitis, R (2015) “What do we mean by a Level Playing Field in international aviation?”, International Transport Forum, Discussion Paper 2015-06.
Tretheway, M and Markhvida, K (2013) “Airports in the Aviation Value Chain: Financing, returns, risk and investment”, International Transport Forum, Discussion Paper 2013-15.
Yilmazkuday, D and Yilmazkuday, H (2017) “The role of direct flights on trade costs”, Review of World Economics, Vol 153(2), 249-70.
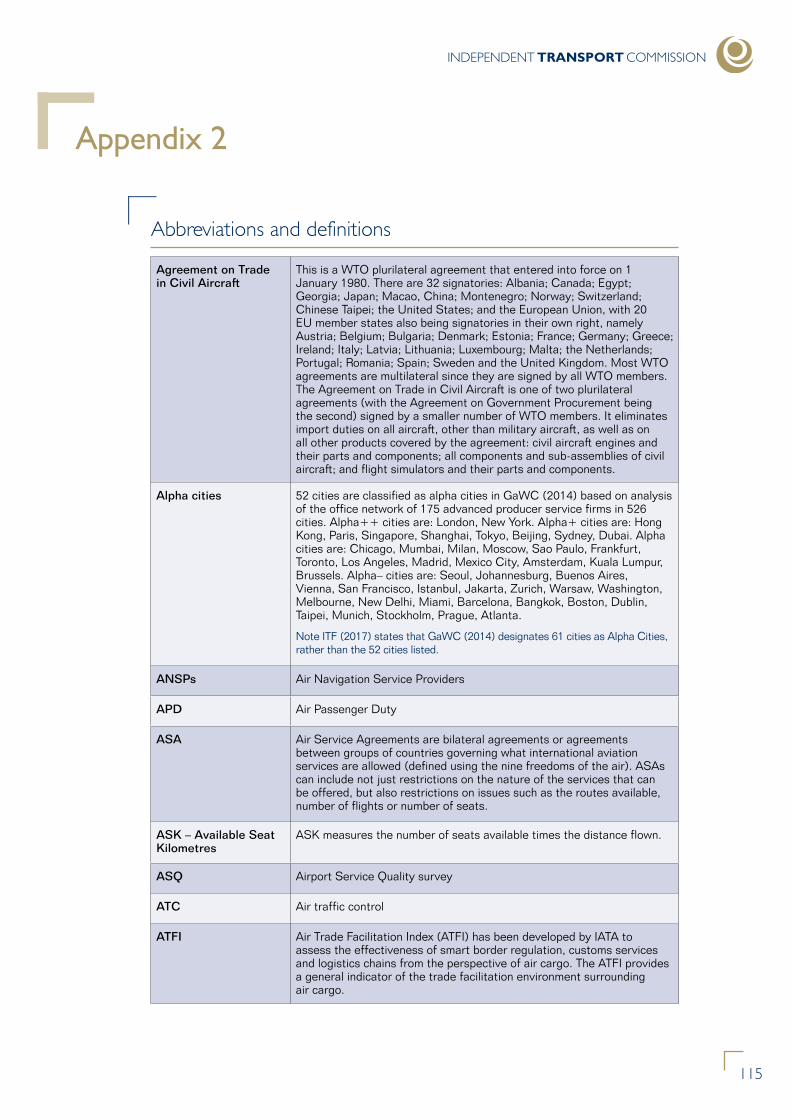
INDEPENDENT TRANSPORT COMMISSION
115
Abbreviations and definitions
Agreement on Trade in Civil Aircraft
This is a WTO plurilateral agreement that entered into force on 1 January 1980. There are 32 signatories: Albania; Canada; Egypt; Georgia; Japan; Macao, China; Montenegro; Norway; Switzerland; Chinese Taipei; the United States; and the European Union, with 20 EU member states also being signatories in their own right, namely Austria; Belgium; Bulgaria; Denmark; Estonia; France; Germany; Greece; Ireland; Italy; Latvia; Lithuania; Luxembourg; Malta; the Netherlands; Portugal; Romania; Spain; Sweden and the United Kingdom. Most WTO agreements are multilateral since they are signed by all WTO members. The Agreement on Trade in Civil Aircraft is one of two plurilateral agreements (with the Agreement on Government Procurement being the second) signed by a smaller number of WTO members. It eliminates import duties on all aircraft, other than military aircraft, as well as on all other products covered by the agreement: civil aircraft engines and their parts and components; all components and sub-assemblies of civil aircraft; and flight simulators and their parts and components.
Alpha cities 52 cities are classified as alpha cities in GaWC (2014) based on analysis of the office network of 175 advanced producer service firms in 526 cities. Alpha++ cities are: London, New York. Alpha+ cities are: Hong Kong, Paris, Singapore, Shanghai, Tokyo, Beijing, Sydney, Dubai. Alpha cities are: Chicago, Mumbai, Milan, Moscow, Sao Paulo, Frankfurt, Toronto, Los Angeles, Madrid, Mexico City, Amsterdam, Kuala Lumpur, Brussels. Alpha– cities are: Seoul, Johannesburg, Buenos Aires, Vienna, San Francisco, Istanbul, Jakarta, Zurich, Warsaw, Washington, Melbourne, New Delhi, Miami, Barcelona, Bangkok, Boston, Dublin, Taipei, Munich, Stockholm, Prague, Atlanta.
Note ITF (2017) states that GaWC (2014) designates 61 cities as Alpha Cities, rather than the 52 cities listed.
ANSPs Air Navigation Service Providers
APD Air Passenger Duty
ASA Air Service Agreements are bilateral agreements or agreements between groups of countries governing what international aviation services are allowed (defined using the nine freedoms of the air). ASAs can include not just restrictions on the nature of the services that can be offered, but also restrictions on issues such as the routes available, number of flights or number of seats.
ASK – Available Seat Kilometres
ASK measures the number of seats available times the distance flown.
ASQ Airport Service Quality survey
ATC Air traffic control
ATFI Air Trade Facilitation Index (ATFI) has been developed by IATA to assess the effectiveness of smart border regulation, customs services and logistics chains from the perspective of air cargo. The ATFI provides a general indicator of the trade facilitation environment surrounding air cargo.
Appendix 2
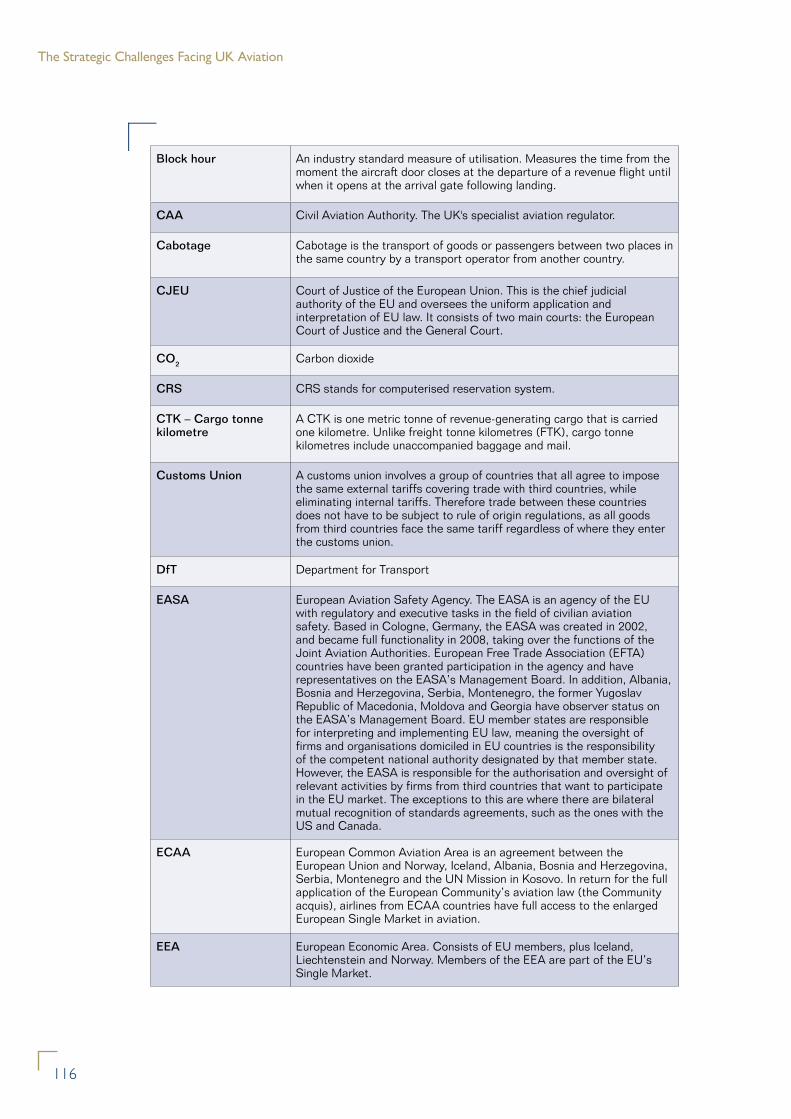
The Strategic Challenges Facing UK Aviation
116
Block hour An industry standard measure of utilisation. Measures the time from the moment the aircraft door closes at the departure of a revenue flight until when it opens at the arrival gate following landing.
CAA Civil Aviation Authority. The UK's specialist aviation regulator.
Cabotage Cabotage is the transport of goods or passengers between two places in the same country by a transport operator from another country.
CJEU Court of Justice of the European Union. This is the chief judicial authority of the EU and oversees the uniform application and interpretation of EU law. It consists of two main courts: the European Court of Justice and the General Court.
CO2 Carbon dioxide
CRS CRS stands for computerised reservation system.
CTK – Cargo tonne kilometre
A CTK is one metric tonne of revenue-generating cargo that is carried one kilometre. Unlike freight tonne kilometres (FTK), cargo tonne kilometres include unaccompanied baggage and mail.
Customs Union A customs union involves a group of countries that all agree to impose the same external tariffs covering trade with third countries, while eliminating internal tariffs. Therefore trade between these countries does not have to be subject to rule of origin regulations, as all goods from third countries face the same tariff regardless of where they enter the customs union.
DfT Department for Transport
EASA European Aviation Safety Agency. The EASA is an agency of the EU with regulatory and executive tasks in the field of civilian aviation safety. Based in Cologne, Germany, the EASA was created in 2002, and became full functionality in 2008, taking over the functions of the Joint Aviation Authorities. European Free Trade Association (EFTA) countries have been granted participation in the agency and have representatives on the EASA’s Management Board. In addition, Albania, Bosnia and Herzegovina, Serbia, Montenegro, the former Yugoslav Republic of Macedonia, Moldova and Georgia have observer status on the EASA’s Management Board. EU member states are responsible for interpreting and implementing EU law, meaning the oversight of firms and organisations domiciled in EU countries is the responsibility of the competent national authority designated by that member state. However, the EASA is responsible for the authorisation and oversight of relevant activities by firms from third countries that want to participate in the EU market. The exceptions to this are where there are bilateral mutual recognition of standards agreements, such as the ones with the US and Canada.
ECAA European Common Aviation Area is an agreement between the European Union and Norway, Iceland, Albania, Bosnia and Herzegovina, Serbia, Montenegro and the UN Mission in Kosovo. In return for the full application of the European Community’s aviation law (the Community acquis), airlines from ECAA countries have full access to the enlarged European Single Market in aviation.
EEA European Economic Area. Consists of EU members, plus Iceland, Liechtenstein and Norway. Members of the EEA are part of the EU’s Single Market.
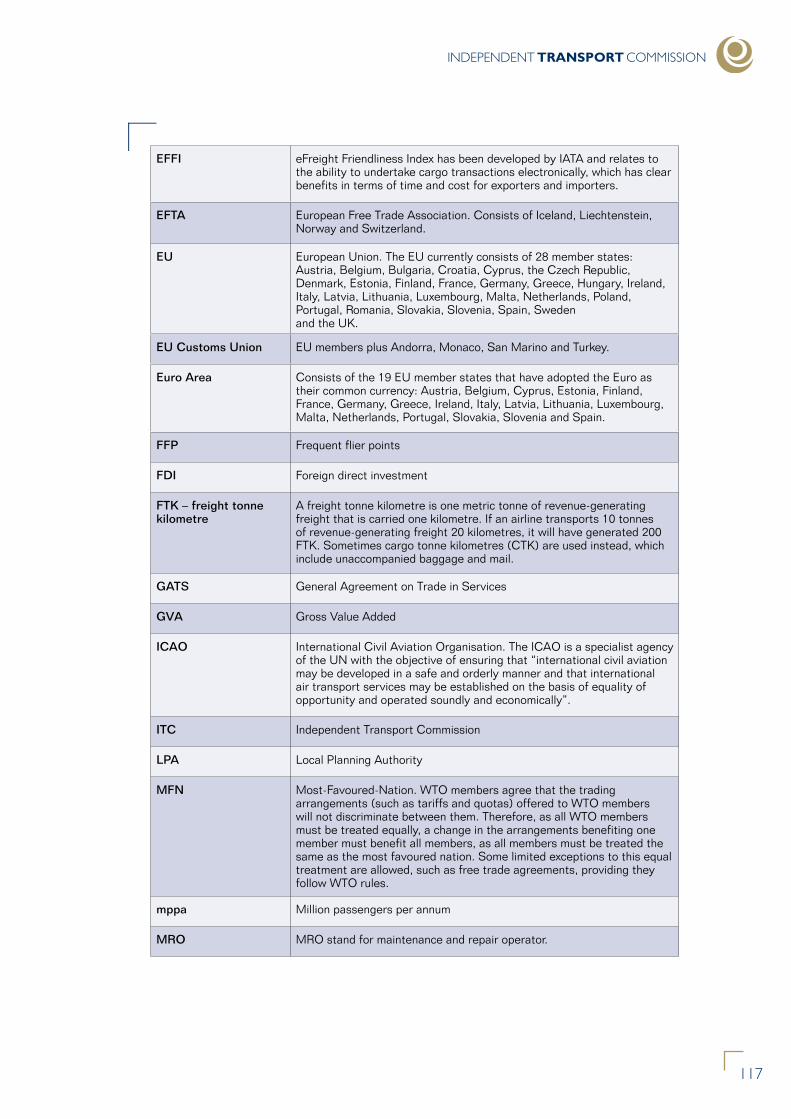
INDEPENDENT TRANSPORT COMMISSION
117
EFFI eFreight Friendliness Index has been developed by IATA and relates to the ability to undertake cargo transactions electronically, which has clear benefits in terms of time and cost for exporters and importers.
EFTA European Free Trade Association. Consists of Iceland, Liechtenstein, Norway and Switzerland.
EU European Union. The EU currently consists of 28 member states: Austria, Belgium, Bulgaria, Croatia, Cyprus, the Czech Republic, Denmark, Estonia, Finland, France, Germany, Greece, Hungary, Ireland, Italy, Latvia, Lithuania, Luxembourg, Malta, Netherlands, Poland, Portugal, Romania, Slovakia, Slovenia, Spain, Sweden and the UK.
EU Customs Union EU members plus Andorra, Monaco, San Marino and Turkey.
Euro Area Consists of the 19 EU member states that have adopted the Euro as their common currency: Austria, Belgium, Cyprus, Estonia, Finland, France, Germany, Greece, Ireland, Italy, Latvia, Lithuania, Luxembourg, Malta, Netherlands, Portugal, Slovakia, Slovenia and Spain.
FFP Frequent flier points
FDI Foreign direct investment
FTK – freight tonne kilometre
A freight tonne kilometre is one metric tonne of revenue-generating freight that is carried one kilometre. If an airline transports 10 tonnes of revenue-generating freight 20 kilometres, it will have generated 200 FTK. Sometimes cargo tonne kilometres (CTK) are used instead, which include unaccompanied baggage and mail.
GATS General Agreement on Trade in Services
GVA Gross Value Added
ICAO International Civil Aviation Organisation. The ICAO is a specialist agency of the UN with the objective of ensuring that “international civil aviation may be developed in a safe and orderly manner and that international air transport services may be established on the basis of equality of opportunity and operated soundly and economically”.
ITC Independent Transport Commission
LPA Local Planning Authority
MFN Most-Favoured-Nation. WTO members agree that the trading arrangements (such as tariffs and quotas) offered to WTO members will not discriminate between them. Therefore, as all WTO members must be treated equally, a change in the arrangements benefiting one member must benefit all members, as all members must be treated the same as the most favoured nation. Some limited exceptions to this equal treatment are allowed, such as free trade agreements, providing they follow WTO rules.
mppa Million passengers per annum
MRO MRO stand for maintenance and repair operator.
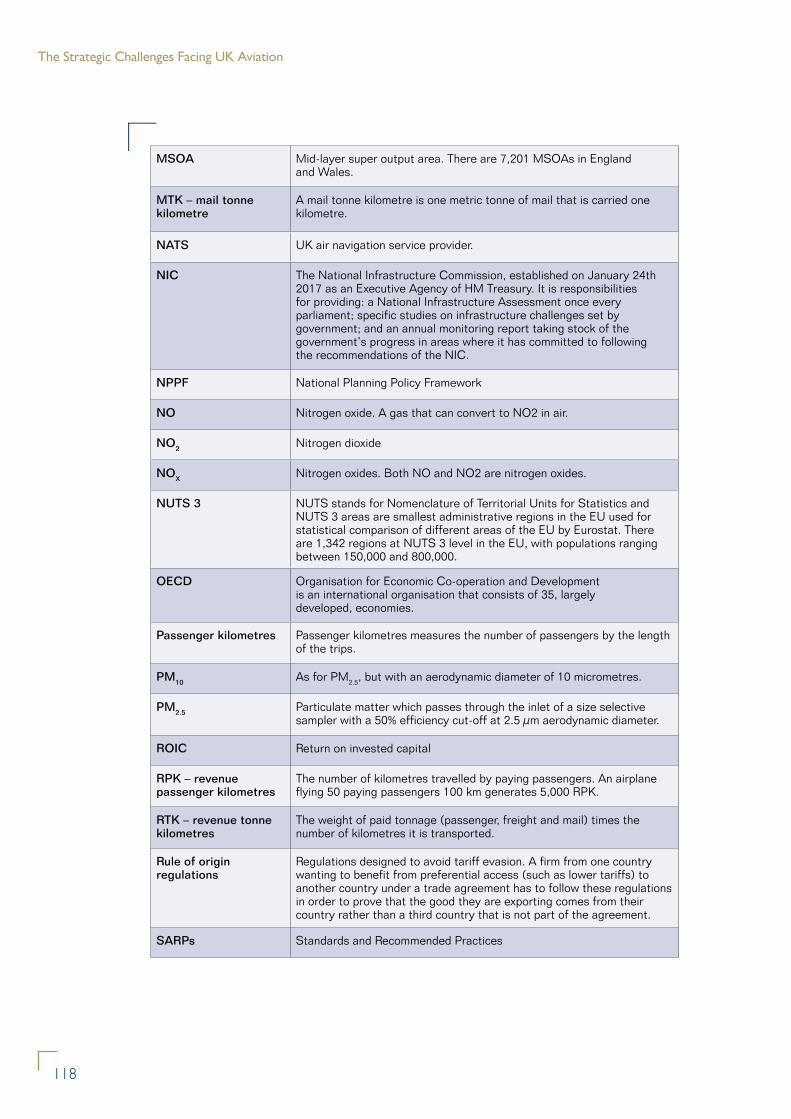
The Strategic Challenges Facing UK Aviation
118
MSOA Mid-layer super output area. There are 7,201 MSOAs in England and Wales.
MTK – mail tonne kilometre
A mail tonne kilometre is one metric tonne of mail that is carried one kilometre.
NATS UK air navigation service provider.
NIC The National Infrastructure Commission, established on January 24th 2017 as an Executive Agency of HM Treasury. It is responsibilities for providing: a National Infrastructure Assessment once every parliament; specific studies on infrastructure challenges set by government; and an annual monitoring report taking stock of the government’s progress in areas where it has committed to following the recommendations of the NIC.
NPPF National Planning Policy Framework
NO Nitrogen oxide. A gas that can convert to NO2 in air.
NO2 Nitrogen dioxide
NOX Nitrogen oxides. Both NO and NO2 are nitrogen oxides.
NUTS 3 NUTS stands for Nomenclature of Territorial Units for Statistics and NUTS 3 areas are smallest administrative regions in the EU used for statistical comparison of different areas of the EU by Eurostat. There are 1,342 regions at NUTS 3 level in the EU, with populations ranging between 150,000 and 800,000.
OECD Organisation for Economic Co-operation and Development is an international organisation that consists of 35, largely developed, economies.
Passenger kilometres Passenger kilometres measures the number of passengers by the length of the trips.
PM10 As for PM2.5, but with an aerodynamic diameter of 10 micrometres.
PM2.5 Particulate matter which passes through the inlet of a size selective sampler with a 50% efficiency cut-off at 2.5 µm aerodynamic diameter.
ROIC Return on invested capital
RPK – revenue passenger kilometres
The number of kilometres travelled by paying passengers. An airplane flying 50 paying passengers 100 km generates 5,000 RPK.
RTK – revenue tonne kilometres
The weight of paid tonnage (passenger, freight and mail) times the number of kilometres it is transported.
Rule of origin regulations
Regulations designed to avoid tariff evasion. A firm from one country wanting to benefit from preferential access (such as lower tariffs) to another country under a trade agreement has to follow these regulations in order to prove that the good they are exporting comes from their country rather than a third country that is not part of the agreement.
SARPs Standards and Recommended Practices
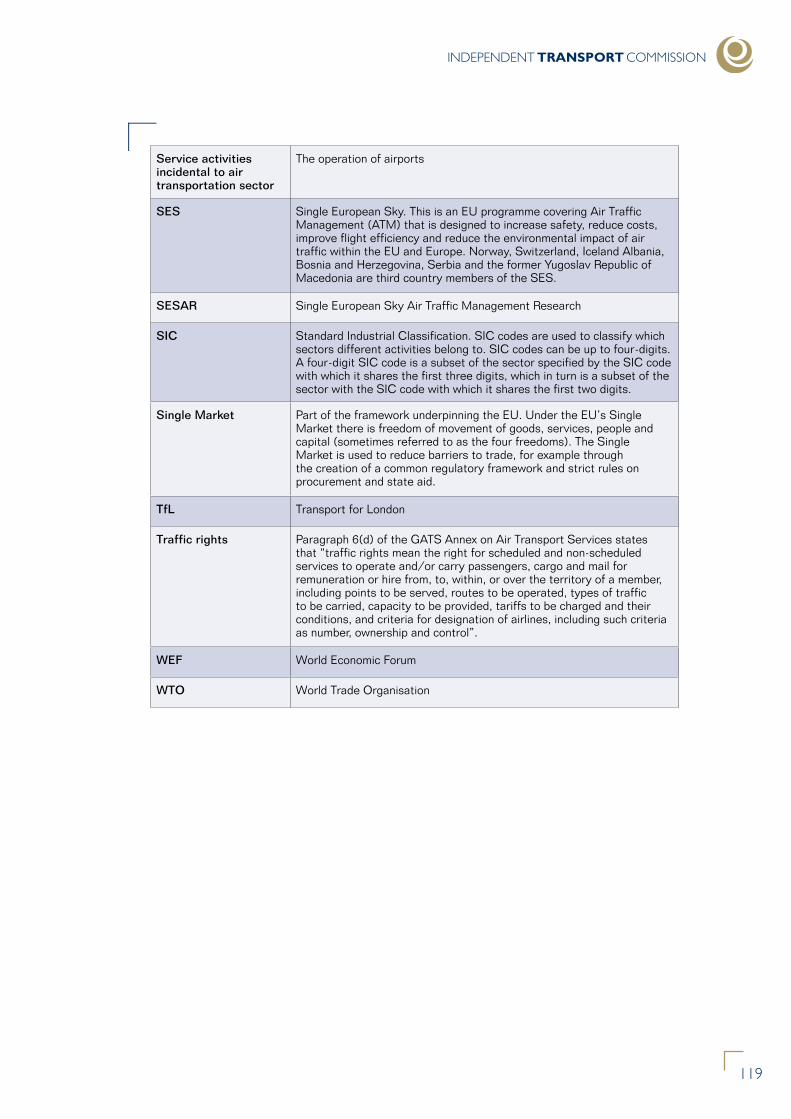
INDEPENDENT TRANSPORT COMMISSION
119
Service activities incidental to air transportation sector
The operation of airports
SES Single European Sky. This is an EU programme covering Air Traffic Management (ATM) that is designed to increase safety, reduce costs, improve flight efficiency and reduce the environmental impact of air traffic within the EU and Europe. Norway, Switzerland, Iceland Albania, Bosnia and Herzegovina, Serbia and the former Yugoslav Republic of Macedonia are third country members of the SES.
SESAR Single European Sky Air Traffic Management Research
SIC Standard Industrial Classification. SIC codes are used to classify which sectors different activities belong to. SIC codes can be up to four-digits. A four-digit SIC code is a subset of the sector specified by the SIC code with which it shares the first three digits, which in turn is a subset of the sector with the SIC code with which it shares the first two digits.
Single Market Part of the framework underpinning the EU. Under the EU’s Single Market there is freedom of movement of goods, services, people and capital (sometimes referred to as the four freedoms). The Single Market is used to reduce barriers to trade, for example through the creation of a common regulatory framework and strict rules on procurement and state aid.
TfL Transport for London
Traffic rights Paragraph 6(d) of the GATS Annex on Air Transport Services states that “traffic rights mean the right for scheduled and non-scheduled services to operate and/or carry passengers, cargo and mail for remuneration or hire from, to, within, or over the territory of a member, including points to be served, routes to be operated, types of traffic to be carried, capacity to be provided, tariffs to be charged and their conditions, and criteria for designation of airlines, including such criteria as number, ownership and control”.
WEF World Economic Forum
WTO World Trade Organisation
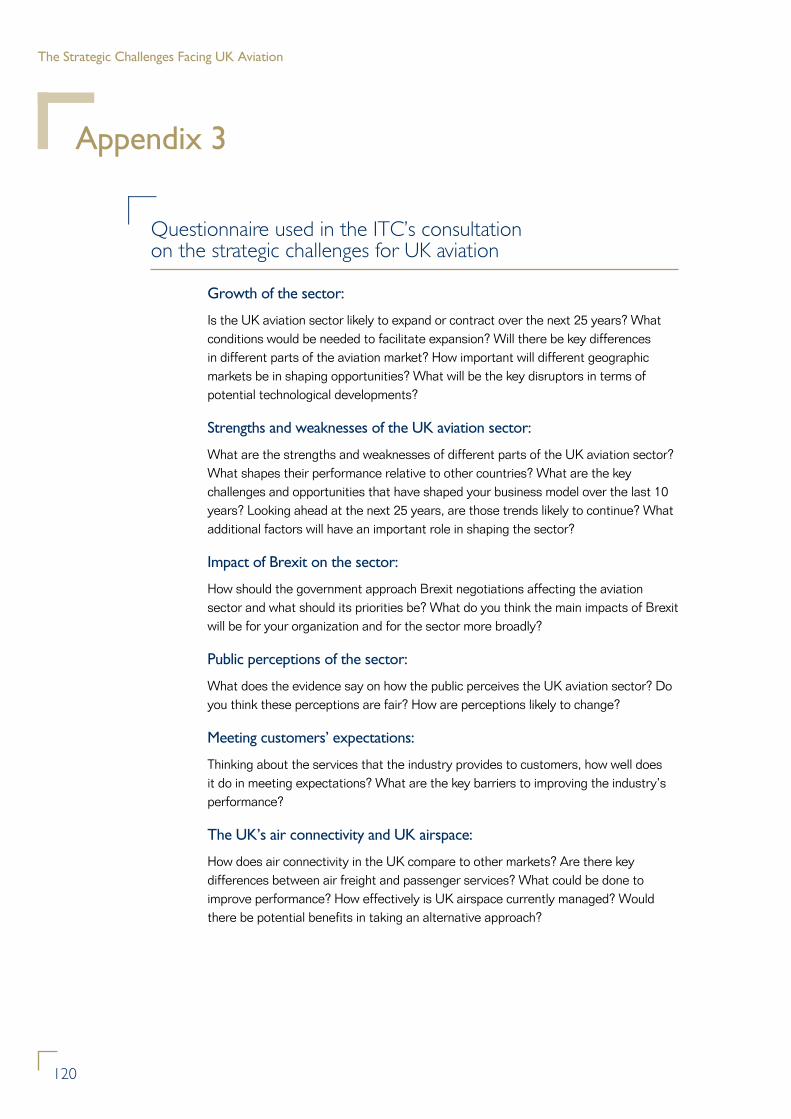
120
The Strategic Challenges Facing UK Aviation
Appendix 3
Questionnaire used in the ITC’s consultation on the strategic challenges for UK aviation
Growth of the sector:
Is the UK aviation sector likely to expand or contract over the next 25 years? What conditions would be needed to facilitate expansion? Will there be key differences in different parts of the aviation market? How important will different geographic markets be in shaping opportunities? What will be the key disruptors in terms of potential technological developments?
Strengths and weaknesses of the UK aviation sector:
What are the strengths and weaknesses of different parts of the UK aviation sector? What shapes their performance relative to other countries? What are the key challenges and opportunities that have shaped your business model over the last 10 years? Looking ahead at the next 25 years, are those trends likely to continue? What additional factors will have an important role in shaping the sector?
Impact of Brexit on the sector:
How should the government approach Brexit negotiations affecting the aviation sector and what should its priorities be? What do you think the main impacts of Brexit will be for your organization and for the sector more broadly?
Public perceptions of the sector:
What does the evidence say on how the public perceives the UK aviation sector? Do you think these perceptions are fair? How are perceptions likely to change?
Meeting customers’ expectations:
Thinking about the services that the industry provides to customers, how well does it do in meeting expectations? What are the key barriers to improving the industry’s performance?
The UK’s air connectivity and UK airspace:
How does air connectivity in the UK compare to other markets? Are there key differences between air freight and passenger services? What could be done to improve performance? How effectively is UK airspace currently managed? Would there be potential benefits in taking an alternative approach?
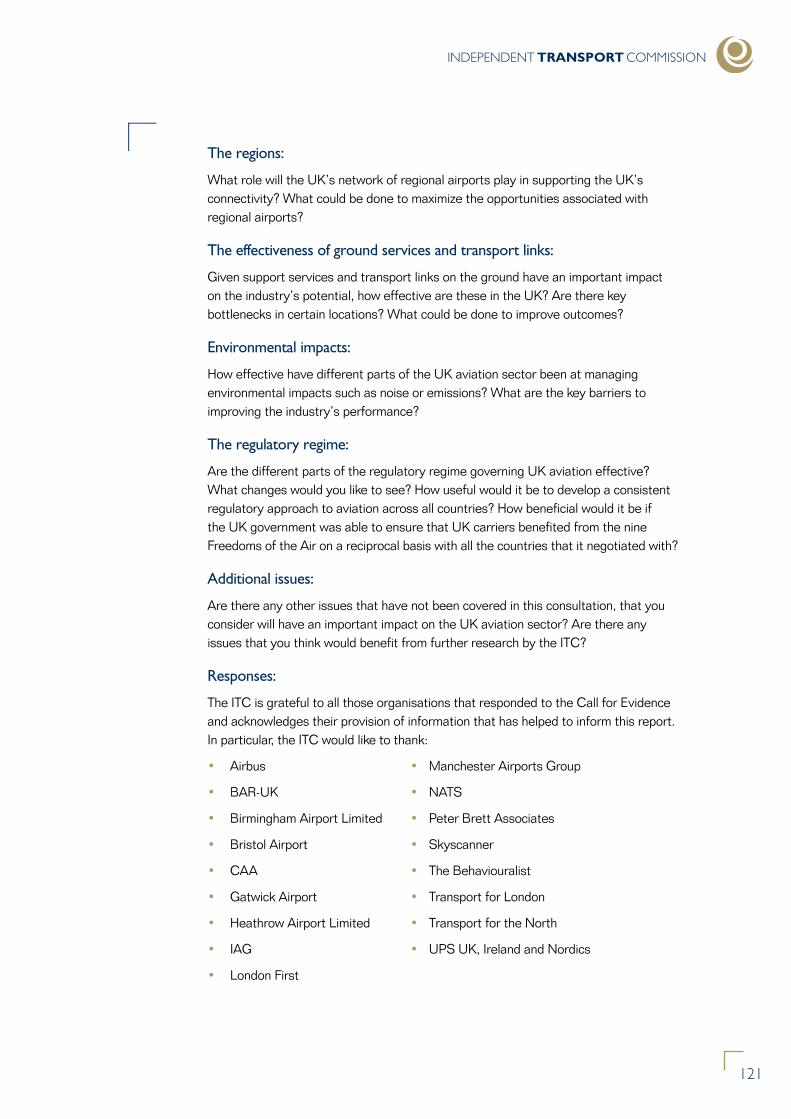
INDEPENDENT TRANSPORT COMMISSION
121
The regions:
What role will the UK’s network of regional airports play in supporting the UK’s connectivity? What could be done to maximize the opportunities associated with regional airports?
The effectiveness of ground services and transport links:
Given support services and transport links on the ground have an important impact on the industry’s potential, how effective are these in the UK? Are there key bottlenecks in certain locations? What could be done to improve outcomes?
Environmental impacts:
How effective have different parts of the UK aviation sector been at managing environmental impacts such as noise or emissions? What are the key barriers to improving the industry’s performance?
The regulatory regime:
Are the different parts of the regulatory regime governing UK aviation effective? What changes would you like to see? How useful would it be to develop a consistent regulatory approach to aviation across all countries? How beneficial would it be if the UK government was able to ensure that UK carriers benefited from the nine Freedoms of the Air on a reciprocal basis with all the countries that it negotiated with?
Additional issues:
Are there any other issues that have not been covered in this consultation, that you consider will have an important impact on the UK aviation sector? Are there any issues that you think would benefit from further research by the ITC?
Responses:
The ITC is grateful to all those organisations that responded to the Call for Evidence and acknowledges their provision of information that has helped to inform this report. In particular, the ITC would like to thank:
• Airbus • Manchester Airports Group
• BAR-UK • NATS
• Birmingham Airport Limited • Peter Brett Associates
• Bristol Airport • Skyscanner
• CAA • The Behaviouralist
• Gatwick Airport • Transport for London
• Heathrow Airport Limited • Transport for the North
• IAG • UPS UK, Ireland and Nordics
• London First
122
The Strategic Challenges Facing UK Aviation
Author Profile
Analytically Driven Ltd is a bespoke research consultancy that specialises in research and analysis to enable clients to address key policy issues. We believe in evidence-driven policy making and we have considerable expertise in using both economic and statistical analysis to answer policy questions.
Dr Rebecca Driver is director of the research consultancy Analytically Driven Ltd. She has over 25 years of experience as a researcher and an economist working on policy issues and has published extensively. Before starting Analytically Driven Ltd, Dr Driver spent six years as Director of Research and Chief Economist at the Association of British Insurers. During that time she was also Secretary to the Insurance Industry Working Group, which was co-chaired by the Chancellor of the Exchequer, Alistair Darling, and Andrew Moss, Group CEO, Aviva. She has also been a Board Member of ORIC (Operational Risk Insurance Consortium); a member of the Secretary of State’s Panel for Monitoring the Economy at the Department for Business, Innovation and Skills; and a Council Member of the Society of Business Economists. Dr Driver joined the Association of British Insurers from the Bank of England where she worked for nearly eight years, latterly as Research Adviser to the External Members of the Monetary Policy Committee. Dr Driver has worked as a Research Fellow in the Department of Economics at the University of Exeter and the University of Strathclyde and as an economist and freelance writer for the Economist Intelligence Unit. She holds a PhD from the University of Exeter.
Disclaimer
Analytically Driven Ltd is registered in England No. 8719788. The registered office is Great Love Farm, Love Lane, Headcorn, Kent TN27 9HL.
This report has been provided to help inform the public policy debate, and should only be used in that context. Whilst every effort has been made to ensure the accuracy of the material in this report, Analytically Driven Ltd shall not have any liability for any loss or damage arising in connection with the publication or use of this paper or the information in it. Analytically Driven Ltd is not authorised for the conduct of business investment (as defined in the Financial Services and Market Act 2000) and this paper is not intended as, and shall not constitute, investment advice.
Analytically Driven Ltd 2017. All rights reserved.
For more information, contact:
Analytically Driven Ltd
Tel: 01622 809596
www.analytically-driven.com
Commissioned and published by the
Independent Transport Commission
November 2017
For further information and electronic copies please visit:
www.theitc.org.uk
or write to:
The Independent Transport Commission
70 Cowcross Street
London
EC1M 6EJ
Published by the Independent Transport Commission
The Independent Transport Commission (ITC) is one of Britain’s leading research charities with a mission to explore all aspects of transport and land use policy. Through our independent research work and educational events we aim to improve and better inform public policy making. For more information on our current research and activities please see our website: www.theitc.org.uk
reac
hmar
ketin
g.co
.uk
314
69 1
1/17
Independent Transport Commission 70 Cowcross Street London EC1M 6EJ
Tel No: 0207 253 5510 www.theitc.org.uk
Registered Charity No. 1080134 November 2017 © Copyright Independent Transport Commission
www.analytically-driven.com