Embed Size (px)
Citation preview
The Steinway & Sons Solar 2E
Absorption Cooling and Low Pressure
Steam System
ASES Solar Cooling Forum
Denver, CO
May 16, 2012
Thomas Henkel, Ph.D
Henkel Solar Corporation

Project Team
Owner: Steinway & Sons. Bill Rigos, Project Manager
Administration of NYSERDA Grant: ERS, Inc.
Solar Energy Consultant & System Design: Henkel Solar
Corporation
Solar Collector Field Vendor: Abengoa-IST
Absorption Chiller Vendor: Broad USA
Solar Collector Field Installation: Sunshine Plus Solar
Mechanical Contractor: Schuyler Engineering Controls Contractor: GCF, Inc.
2E Absorption Cooling and Low Pressure Steam Solar Project
Steinway & Sons 2010
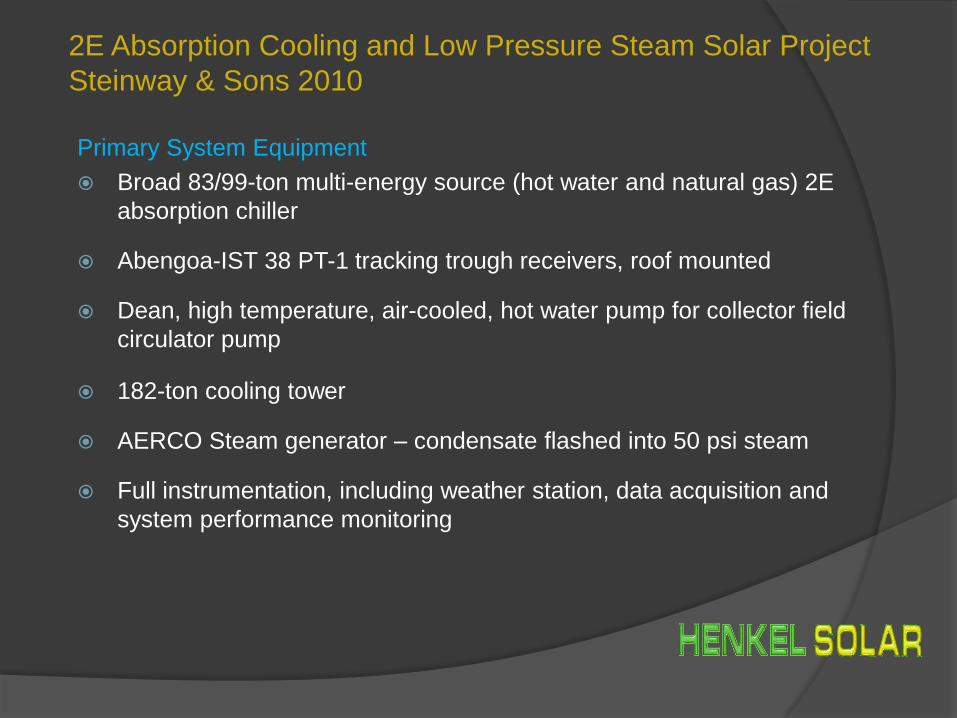
Primary System Equipment
Broad 83/99-ton multi-energy source (hot water and natural gas) 2E
absorption chiller
Abengoa-IST 38 PT-1 tracking trough receivers, roof mounted
Dean, high temperature, air-cooled, hot water pump for collector field
circulator pump
182-ton cooling tower
AERCO Steam generator – condensate flashed into 50 psi steam
Full instrumentation, including weather station, data acquisition and
system performance monitoring

Solar Cooling and Steam System Diagram

Collector Field Site Plan

Roof Mounted Trough Receivers

Multi-Energy Source, Double Effect Absorption Chiller

Multi-Energy Source Absorption Chiller-Heater
Absorption chiller can be fired by natural gas, LPG, fuel
oil, hot water, steam, or hot thermal oil
Steinway & Sons unit can run on hot water only, natural
gas only, or hot water and natural gas simultaneously
Newest units provide 1800F hot water for heating.
Eliminates the need for separate backup energy source
for solar absorption HVAC system
Lower capital costs and higher system efficiency
Concept fully tested in 50-ton Yazaki 2E chiller in 2002
Patent issued in 2006.
Broad Air Conditioning Co. and Thermax are now
manufacturing multi-energy source 2E absorption chillers.

Steam Generator
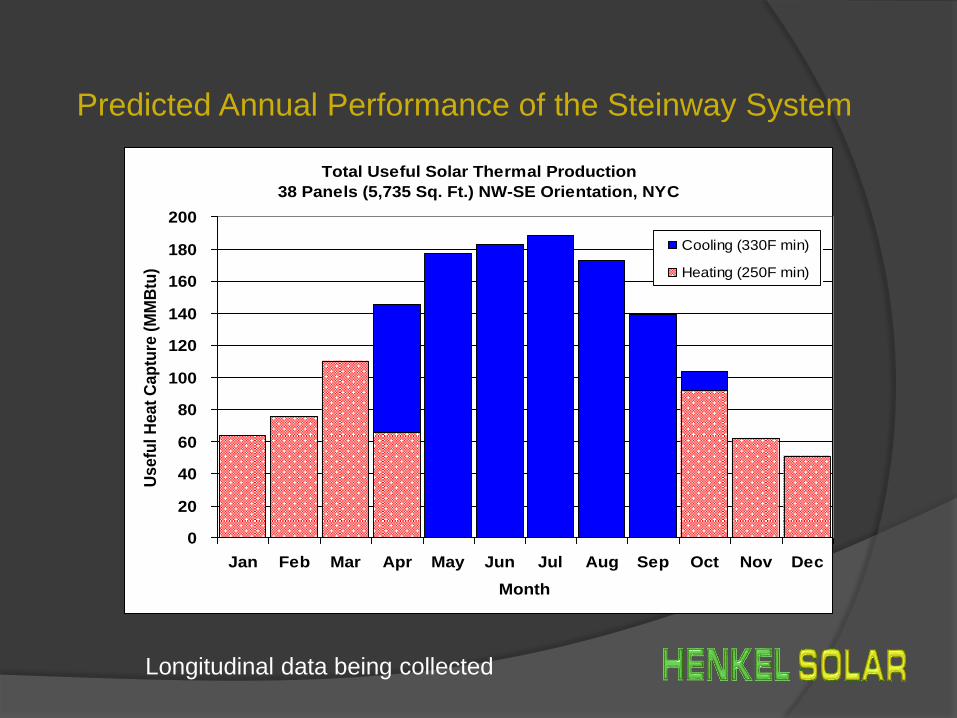
Predicted Annual Performance of the Steinway System
Total Useful Solar Thermal Production
38 Panels (5,735 Sq. Ft.) NW-SE Orientation, NYC
0
20
40
60
80
100
120
140
160
180
200
Jan Feb Mar Apr May Jun Jul Aug Sep Oct Nov Dec
Month
Us
efu
l H
eat
Ca
ptu
re (
MM
Btu
)
Cooling (330F min)
Heating (250F min)
Longitudinal data being collected

Projected Building Thermal Loads
Hourly Cooling Load, May-Sep Weekdays
0
20
40
60
80
100
1 2 3 4 5 6 7 8 9 10 11 12 13 14 15 16 17 18 19 20 21 22 23 24
Hour of Day
Lo
ad
(T
on
s)
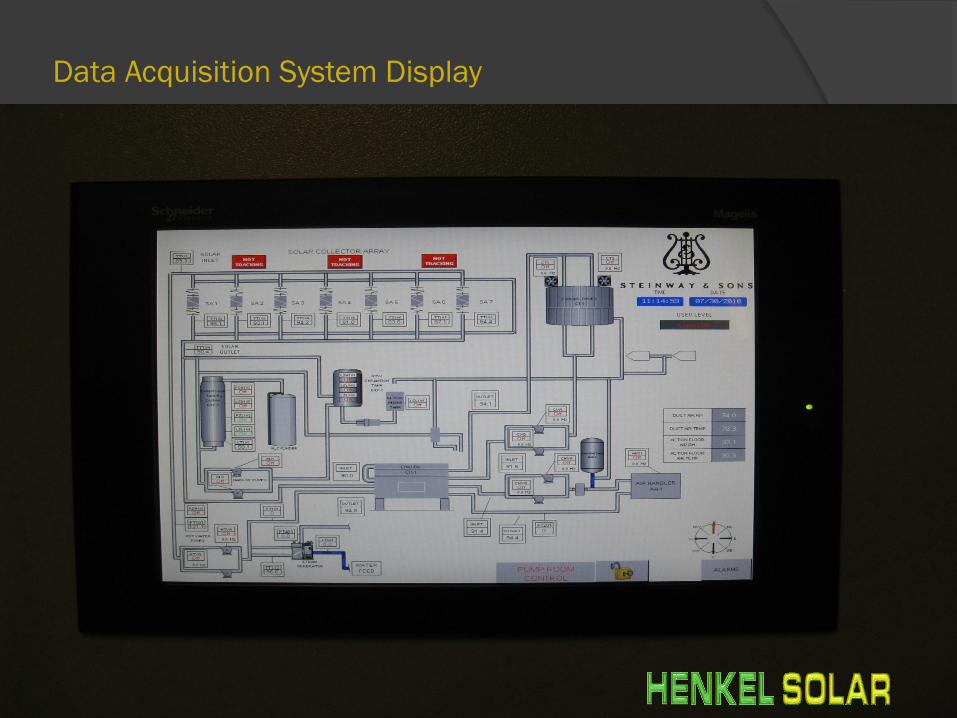
Data Acquisition System Display
Comments on System Operations and Performance
The trough collector field commissioning was delayed until August, 2010 due to unforeseen difficulties.
The Broad dual energy source chiller was delivered without the capability to run on solar energy and its gas burner simultaneously. Therefore, field repairs delayed partial commissioning until late September, 2010. Full commissioning was delayed until April, 2011. The chiller produced solar cooling throughout 2011.
The steam generator is working as designed, and the system has been producing low pressure steam since September, 2010.
All system controls are working properly. The data acquisition system has been partially commissioned.

Data Summary for Selected Dates
Pump On Solar Solar to Solar Average Total Solar Solar to Solar Other
Date Insolation Collected Chiller Cooling Solar Cooling Fraction Steam Warm-up Losses
kWh kWh kWh kWh COP kWh % kWh kWh kWh
7/1/11 3716 1438 793 884 1.10 1122 78.8% 243 116 287
7/9/11 3902 2006 423 508 1.14 539 94.2% 1142 128 313
1/20/12 1336 916 0 0 NA NA NA 483 253 180
2/4/12 1241 346 0 0 NA NA NA 113 206 27
4/7/12 3246 1504 0 0 NA NA NA 1269 118 117
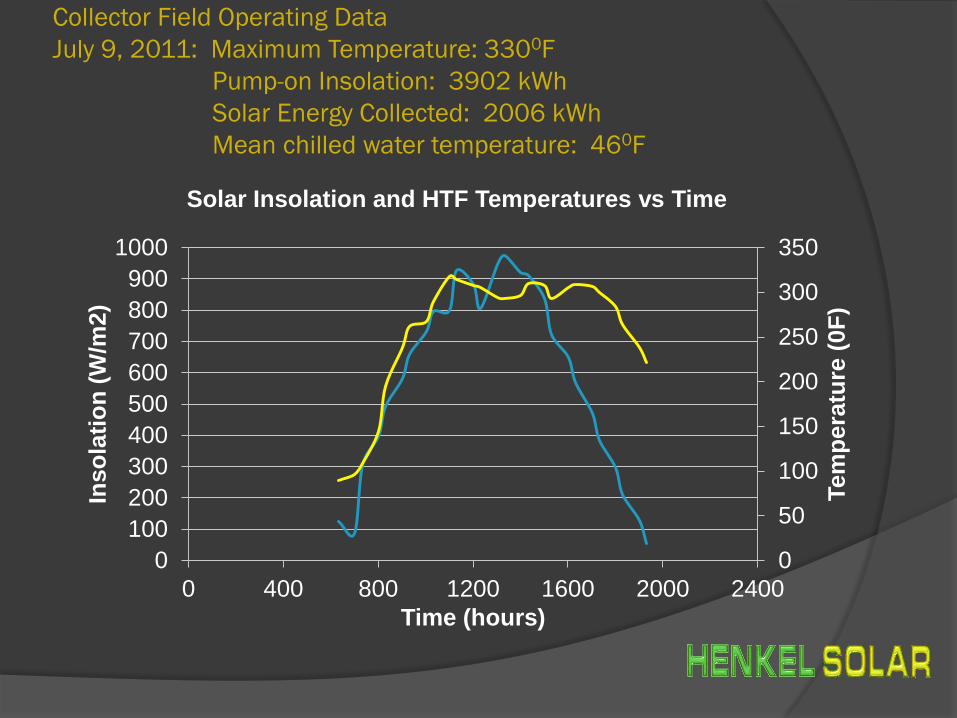
Collector Field Operating Data
July 9, 2011: Maximum Temperature: 3300F
Pump-on Insolation: 3902 kWh
Solar Energy Collected: 2006 kWh
Mean chilled water temperature: 460F
0
50
100
150
200
250
300
350
0
100
200
300
400
500
600
700
800
900
1000
0 400 800 1200 1600 2000 2400
Tem
pera
ture
(0F
)
Inso
lati
on
(W
/m2)
Time (hours)
Solar Insolation and HTF Temperatures vs Time

Collector Field Operating Data
April 7,2012: Maximum Temperature: 3200F
Pump-on Insolation: 3246 kWh
Solar Energy Collected: 1504 kWh
0
50
100
150
200
250
300
350
0
100
200
300
400
500
600
700
800
900
0 400 800 1200 1600 2000 2400
Tem
pera
ture
(0F
)
Inso
lati
on
(W
/m2)
Time (hours)
Solar Insolation and HTF Temperatures vs Time

Comparison of Solar-Driven Absorption Chillers
SINGLE-EFFECT
0.7 DESIGN COP* * Cooling Output/ Heat Input
1900F-2100F HOT WATER OR LP STEAM FIRED
COLLECTOR ARRAY NEEDS 185 FT2 HORIZONTAL AREA PER TON
SEPARATE BACKUP FUEL- FIRED HEATER
INSTALLED COST 40-ton: ~$22,000 PER TON
INSTALLED COST 500-ton: ~$14,000 PER TON
DOUBLE-EFFECT
1.38 DESIGN COP
3300F-3500F HEATED FLUID OR FUEL-FIRED (HOT WATER, STEAM, THERMAL OIL, NATURAL GAS, FUEL OIL, BIOFUEL, EXHAUST GAS)
COLLECTOR ARRAY NEEDS 100 FT2 HORIZONTAL AREA PER TON
DUAL-FUEL OPTION W/O SEPARATE BACKUP HEATER
INSTALLED COST 1320-TON, UTILITY-GRADE TROUGH SYSTEM: ~$4600 PER TON.
INSTALLED COST 83-TON, SMALL TROUGH SYSTEM: ~$7500 PER TON.

Solar 2E Absorption vs. Electric Chillers
Accounting for the electrical grid energy losses, the adjusted full fuel cycle (FFC) COP for electric A/C units varies from 0.83 to 1.93, with an average of 0.98.
A hybrid solar/fuel 2E absorption chiller system can produce an average cooling season solar fraction of at least 60%, so that the net FFC COP is 3.0. (NG COP 1.2/0.4 = 3.0)
Solar/fuel 2E absorption chiller systems will consume one-third the average primary source energy used for electric A/C in the US.
Solar to cooling conversion efficiency: collector efficiency x design COP. Latest large system design: 72% x 1.35 = 97%
Solar PV and centrifugal chiller conversion efficiency: PV AC efficiency x design COP: 12% x 5.6 = 67%
Solar thermal ORC engine-generator and centrifugal chiller conversion efficiency: collector efficiency (3000F) x engine-generator cycle efficiency x chiller design COP: 73% x 14% x 5.6 = 57%
Acknowledgements
The author would like to thank NYSERDA for the
funding to implement the project. It could not have
happened otherwise. Thanks in particular go to
Greg Pedrick for his positive support throughout
the process. Credit is also due to ASES and to the
citizens and political leaders that have advocated
for renewable energy tax and other incentives.
Field Operation of a Solar Driven Liquid-
Desiccant Air Conditioner
Jeffrey Miller
Andrew Lowenstein
World Renewable Energy Forum
Denver, CO
May 16, 2012
www.ailr.com
AIL Research

Acknowledgments.
The work presented here was funded out of the U.S. Department of Defense’s ESTCP Program and performed under contract to National Renewable
Energy Laboratory (NREL).

3
Low-flow Liquid Desiccant Technology
Desiccants have a high affinity for water
vapor
Can dry air without first cooling below dew-
point
Thermally activated. Sustainable sources of
thermal energy are available from solar and
cogeneration
New generation of liquid-desiccant
conditioners and regenerators can meet the
needs of HVAC applications

4
New generation of liquid-desiccant components
meet the needs of HVAC applications
Contact surfaces are no longer adiabatic
Desiccant flooding rates have been reduced by a factor of 20
Low-flow Liquid Desiccant Air Conditioner (LDAC) advantages Much lower pressure drops
More compact
Greater cooling effect (e.g. cfm/ton)
More deeply dry process air
Higher regeneration COP
Zero desiccant carryover

5
Conditioner
Regenerator
Economizer
hot, humid outdoor air
humidity exhausted
to atmosphere
Simple Process
Three Main Components
All Plastic
Construction
cool, dry ventilation delivered to building
Low-Flow LDAC

6
Advanced liquid desiccant technology will
accelerate solar cooling
Better COP at lower heat-source temperatures
Lower cost for energy storage
concentrated desiccant
uninsulated plastic storage tank
Solves humidity problems (wet climates)
Augments evaporative cooling (dry climates)
Easier installation than adsorption or
absorption chillers
7
0.000
0.002
0.004
0.006
0.008
0.010
0.012
0.014
0.016
0.018
0.020
0.022
0.024
0.026
0.028
0.030
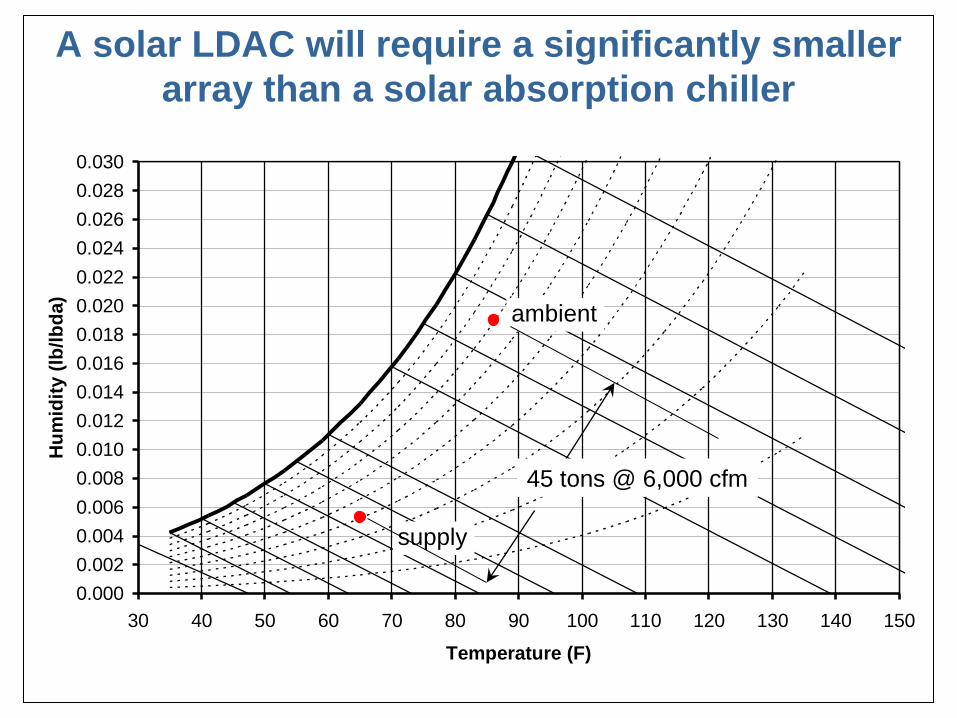
30 40 50 60 70 80 90 100 110 120 130 140 150
Temperature (F)
Hu
mid
ity (
lb/l
bd
a)
ambient
supply
45 tons @ 6,000 cfm
A solar LDAC will require a significantly smaller
array than a solar absorption chiller

8
0.000
0.002
0.004
0.006
0.008
0.010
0.012
0.014
0.016
0.018
0.020
0.022
0.024
0.026
0.028
0.030
30 40 50 60 70 80 90 100 110 120 130 140 150
Temperature (F)
Hu
mid
ity (
lb/l
bd
a)
ambient
supply
45 tons
13 tons
A chiller must overcool and reheat if it is to
supply air at less than 100% rh

9
0.000
0.002
0.004
0.006
0.008
0.010
0.012
0.014
0.016
0.018
0.020
0.022
0.024
0.026
0.028
0.030
30 40 50 60 70 80 90 100 110 120 130 140 150
Temperature (F)
Hu
mid
ity (
lb/l
bd
a)
ambient
supply
31 tons
A LDAC can simultaneously cool and dry the air

10
3,000 cfm Solar LDAC, Tyndall AFB, FL

11
3,000 cfm Solar LDAC, Tyndall AFB, FL
Regenerator Unit
Solar Array

12
3,000 cfm Solar LDAC, Tyndall AFB, FL
Tyndall AFB
Panama City, FL
Conditioner Unit
Ductwork from LDAC
Desiccant Storage

13
3,000 cfm Solar LDAC, Tyndall AFB, FL

16
LDAC Outlet Conditions
20% 20% 20%20%
20%20%
20%20%
20%
20%
20%
20%
20%
20%
20%
40%40%
40%40%
40%
40%
40%
40%
40%
40%
40%
40%
40%
40%
40%
0
0.002
0.004
0.006
0.008
0.01
0.012
0.014
0.016
0.018
0.02
0.022
0.024
30 40 50 60 70 80 90 100
Hu
mid
ity R
atio
(lb
Wa
ter/
lb D
ry A
ir)
Dry-Bulb Temperature (ºF)
Tyndall Lab - Summer 2011 (April 16 - Sept. 30)
ASHRAE Winter Comfort Zone
ASHRAE Summer Comfort Zone
Weather Outdoor
Measured Outlet Conditioner
70ºF
60ºF
50ºF
40ºF
70ºF
60ºF
50ºF
40ºF
Re
lative
Hu
mid
ity
17
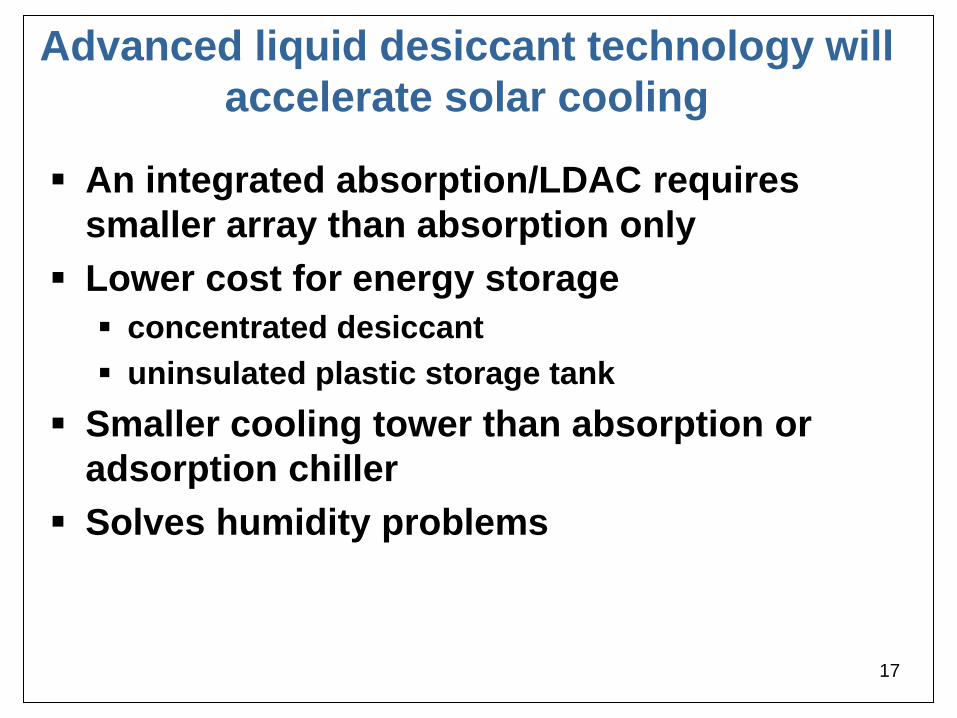
Advanced liquid desiccant technology will
accelerate solar cooling
An integrated absorption/LDAC requires
smaller array than absorption only
Lower cost for energy storage
concentrated desiccant
uninsulated plastic storage tank
Smaller cooling tower than absorption or
adsorption chiller
Solves humidity problems

18
Recent Progress
6 LDACs installed and operating
5 LDACs on supermarkets in CA and HI
Solar LDAC at Tyndall AFB FL
3 additional LDACs running this spring
Solar driven LDAC on a supermarket in HI
LDAC for pool dehumidification in NJ
LDAC with advanced wicking-fin regenerator in NJ
Direct-fired, double effect regenerator testing
this summer
Munters Corp. has acquired thermally-driven,
low-flow, liquid desiccant technology


![Solar Cooling...Solar powered cooling •Connect solar electric panels to an air conditioner •Solar heating panels can also power air conditioning!ElectricityThe importance of [solar]](https://img.pdfslide.us/doc/110x75/60bf8a7d6ecb68280108d4a8/solar-cooling-solar-powered-cooling-aconnect-solar-electric-panels-to-an-air.jpg)