Embed Size (px)
Citation preview
Steam System Tool Suite Introduction Guide
Alternate Text Narratives and
Graphic Descriptions
October 6, 2009
Table of Contents
Welcome......................................................................................................................................................3
Navigational Tutorial .............................................................................................................................6
Modules
Steam System Scoping Tool (SSST) ........................................................................................8
Steam System Assessment Tool (SSAT) ............................................................................ 51
3EPlus Insulation Tool (3EPlus)........................................................................................... 98
Quizzes
SSST Quiz ...................................................................................................................................... 141
SSAT Quiz ..................................................................................................................................... 145
3EPlus Quiz ................................................................................................................................. 149
Conclusion ........................................................................................................................................... 155
ii
Welcome Module
9/30/2009
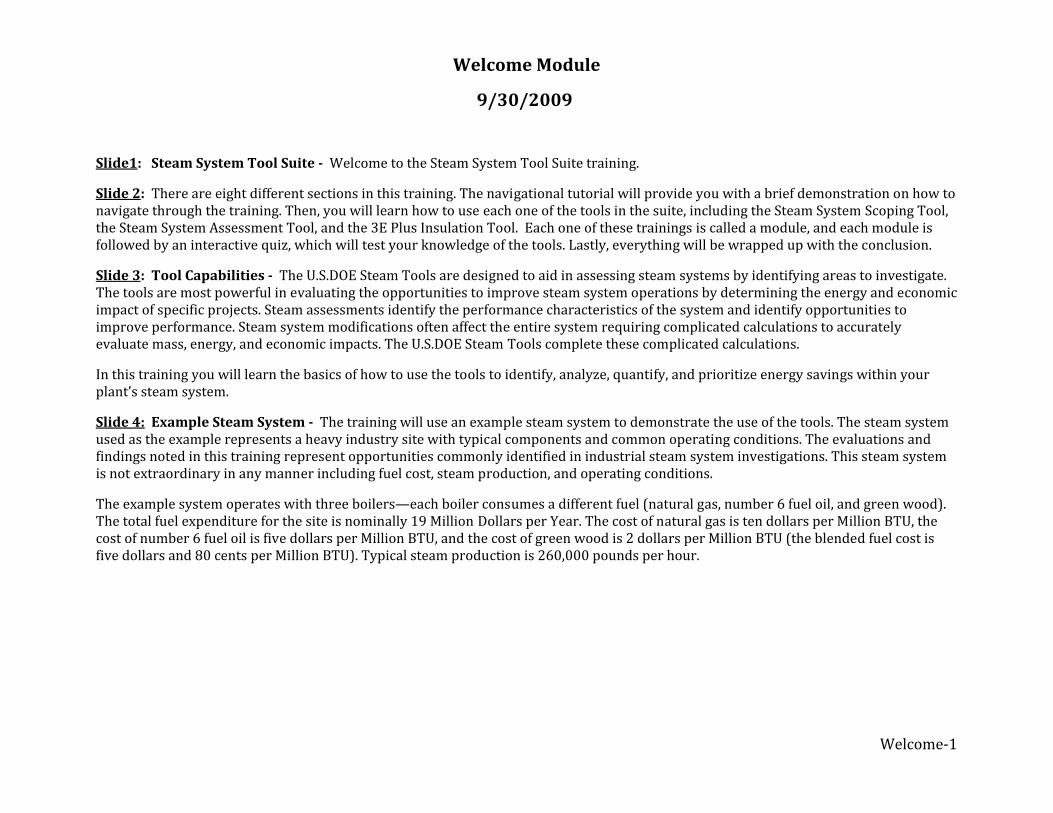
Slide1: Welcome to the Steam System Tool Suite training. Steam System Tool Suite
Slide 2: There are eight different sections in this training. The navigational tutorial will provide you with a brief demonstration on how to navigate through the training. Then, you will learn how to use each one of the tools in the suite, including the Steam System Scoping Tool, the Steam System Assessment Tool, and the 3E Plus Insulation Tool. Each one of these trainings is called a module, and each module is followed by an interactive quiz, which will test your knowledge of the tools. Lastly, everything will be wrapped up with the conclusion.
Slide 3: Tool Capabilities The U.S.DOE Steam Tools are designed to aid in assessing steam systems by identifying areas to investigate. The tools are most powerful in evaluating the opportunities to improve steam system operations by determining the energy and economic impact of specific projects. Steam assessments identify the performance characteristics of the system and identify opportunities to improve performance. Steam system modifications often affect the entire system requiring complicated calculations to accurately evaluate mass, energy, and economic impacts. The U.S.DOE Steam Tools complete these complicated calculations.
In this training you will learn the basics of how to use the tools to identify, analyze, quantify, and prioritize energy savings within your plant’s steam system.
Slide 4: Example Steam System The training will use an example steam system to demonstrate the use of the tools. The steam system used as the example represents a heavy industry site with typical components and common operating conditions. The evaluations and findings noted in this training represent opportunities commonly identified in industrial steam system investigations. This steam system is not extraordinary in any manner including fuel cost, steam production, and operating conditions.
The example system operates with three boilers—each boiler consumes a different fuel (natural gas, number 6 fuel oil, and green wood). The total fuel expenditure for the site is nominally 19 Million Dollars per Year. The cost of natural gas is ten dollars per Million BTU, the cost of number 6 fuel oil is five dollars per Million BTU, and the cost of green wood is 2 dollars per Million BTU (the blended fuel cost is five dollars and 80 cents per Million BTU). Typical steam production is 260,000 pounds per hour.
Welcome‐1
Welcome‐2
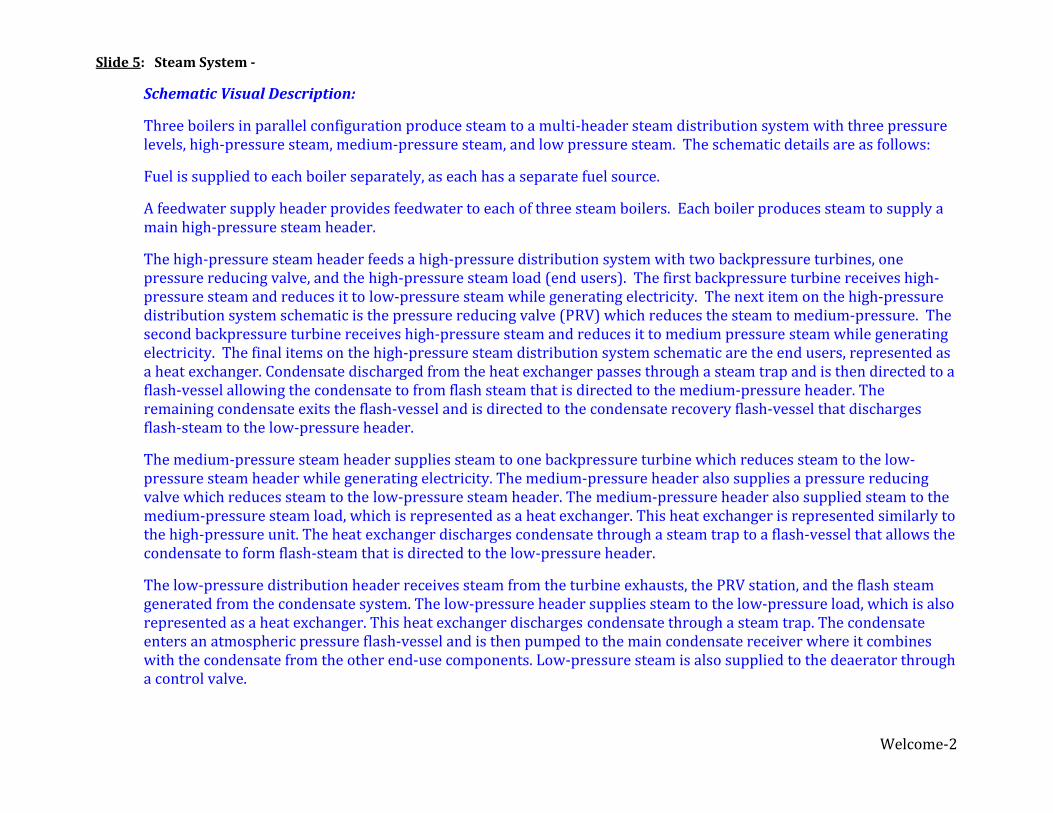
Slide 5: Steam System
Schematic Visual Description:
Three boilers in parallel configuration produce steam to a multi‐header steam distribution system with three pressure levels, high‐pressure steam, medium‐pressure steam, and low pressure steam. The schematic details are as follows:
Fuel is supplied to each boiler separately, as each has a separate fuel source.
A feedwater supply header provides feedwater to each of three steam boilers. Each boiler produces steam to supply a main high‐pressure steam header.
The high‐pressure steam header feeds a high‐pressure distribution system with two backpressure turbines, one pressure reducing valve, and the high‐pressure steam load (end users). The first backpressure turbine receives high‐pressure steam and reduces it to low‐pressure steam while generating electricity. The next item on the high‐pressure distribution system schematic is the pressure reducing valve (PRV) which reduces the steam to medium‐pressure. The second backpressure turbine receives high‐pressure steam and reduces it to medium pressure steam while generating electricity. The final items on the high‐pressure steam distribution system schematic are the end users, represented as a heat exchanger. Condensate discharged from the heat exchanger passes through a steam trap and is then directed to a flash‐vessel allowing the condensate to from flash steam that is directed to the medium‐pressure header. The remaining condensate exits the flash‐vessel and is directed to the condensate recovery flash‐vessel that discharges flash‐steam to the low‐pressure header.
The medium‐pressure steam header supplies steam to one backpressure turbine which reduces steam to the low‐pressure steam header while generating electricity. The medium‐pressure header also supplies a pressure reducing valve which reduces steam to the low‐pressure steam header. The medium‐pressure header also supplied steam to the medium‐pressure steam load, which is represented as a heat exchanger. This heat exchanger is represented similarly to the high‐pressure unit. The heat exchanger discharges condensate through a steam trap to a flash‐vessel that allows the condensate to form flash‐steam that is directed to the low‐pressure header.
The low‐pressure distribution header receives steam from the turbine exhausts, the PRV station, and the flash steam generated from the condensate system. The low‐pressure header supplies steam to the low‐pressure load, which is also represented as a heat exchanger. This heat exchanger discharges condensate through a steam trap. The condensate enters an atmospheric pressure flash‐vessel and is then pumped to the main condensate receiver where it combines with the condensate from the other end‐use components. Low‐pressure steam is also supplied to the deaerator through a control valve.
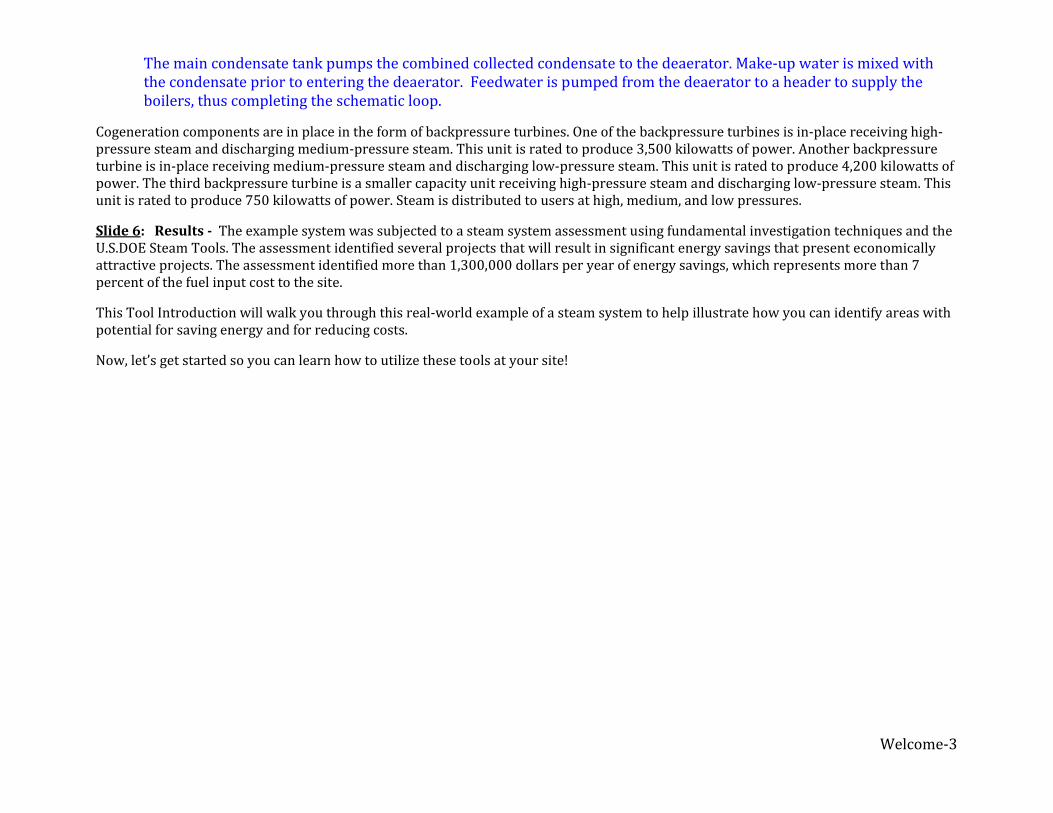
The main condensate tank pumps the combined collected condensate to the deaerator. Make‐up water is mixed with the condensate prior to entering the deaerator. Feedwater is pumped from the deaerator to a header to supply the boilers, thus completing the schematic loop.
Cogeneration components are in place in the form of backpressure turbines. One of the backpressure turbines is in‐place receiving high‐pressure steam and discharging medium‐pressure steam. This unit is rated to produce 3,500 kilowatts of power. Another backpressure turbine is in‐place receiving medium‐pressure steam and discharging low‐pressure steam. This unit is rated to produce 4,200 kilowatts of power. The third backpressure turbine is a smaller capacity unit receiving high‐pressure steam and discharging low‐pressure steam. This unit is rated to produce 750 kilowatts of power. Steam is distributed to users at high, medium, and low pressures.
Slide 6: Results The example system was subjected to a steam system assessment using fundamental investigation techniques and the U.S.DOE Steam Tools. The assessment identified several projects that will result in significant energy savings that present economically attractive projects. The assessment identified more than 1,300,000 dollars per year of energy savings, which represents more than 7 percent of the fuel input cost to the site.
This Tool Introduction will walk you through this real‐world example of a steam system to help illustrate how you can identify areas with potential for saving energy and for reducing costs.
Now, let’s get started so you can learn how to utilize these tools at your site!
Welcome‐3
Navigational Tutorial
9/30/2009
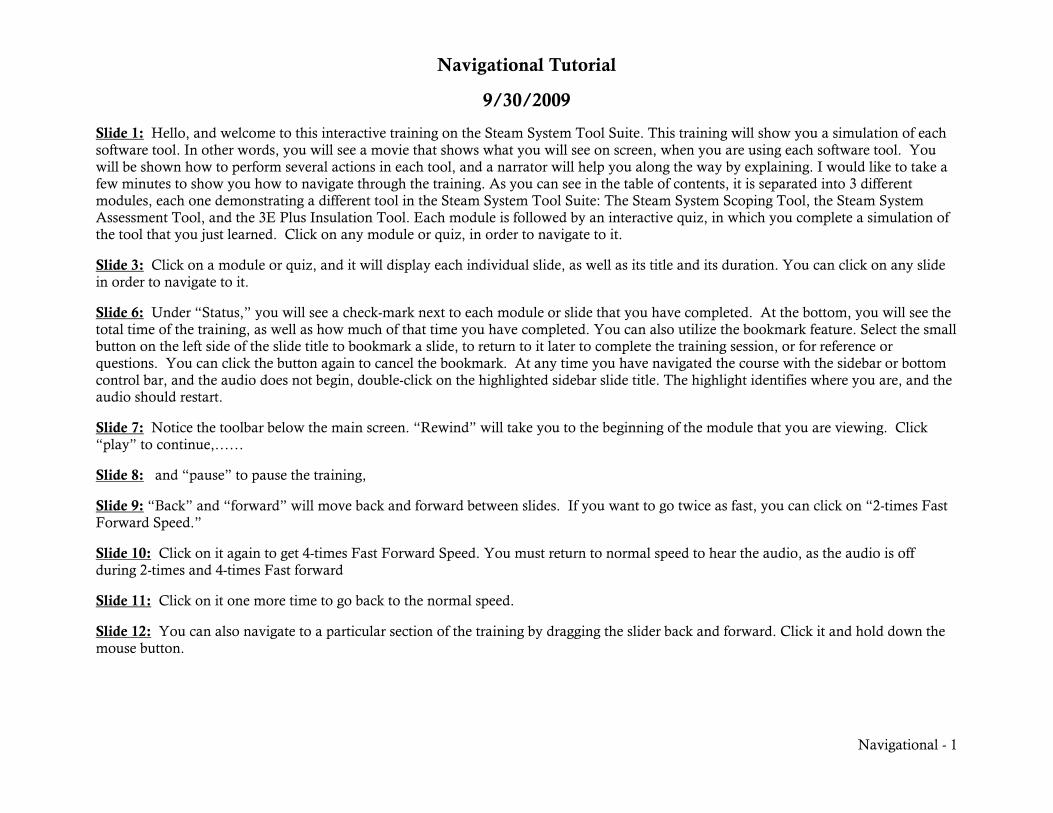
Slide 1: Hello, and welcome to this interactive training on the Steam System Tool Suite. This training will show you a simulation of each software tool. In other words, you will see a movie that shows what you will see on screen, when you are using each software tool. You will be shown how to perform several actions in each tool, and a narrator will help you along the way by explaining. I would like to take a few minutes to show you how to navigate through the training. As you can see in the table of contents, it is separated into 3 different modules, each one demonstrating a different tool in the Steam System Tool Suite: The Steam System Scoping Tool, the Steam System Assessment Tool, and the 3E Plus Insulation Tool. Each module is followed by an interactive quiz, in which you complete a simulation of the tool that you just learned. Click on any module or quiz, in order to navigate to it.
Slide 3: Click on a module or quiz, and it will display each individual slide, as well as its title and its duration. You can click on any slide in order to navigate to it.
Slide 6: Under “Status,” you will see a check-mark next to each module or slide that you have completed. At the bottom, you will see the total time of the training, as well as how much of that time you have completed. You can also utilize the bookmark feature. Select the small button on the left side of the slide title to bookmark a slide, to return to it later to complete the training session, or for reference or questions. You can click the button again to cancel the bookmark. At any time you have navigated the course with the sidebar or bottom control bar, and the audio does not begin, double-click on the highlighted sidebar slide title. The highlight identifies where you are, and the audio should restart.
Slide 7: Notice the toolbar below the main screen. “Rewind” will take you to the beginning of the module that you are viewing. Click “play” to continue,……
Slide 8: and “pause” to pause the training,
Slide 9: “Back” and “forward” will move back and forward between slides. If you want to go twice as fast, you can click on “2-times Fast Forward Speed.”
Slide 10: Click on it again to get 4-times Fast Forward Speed. You must return to normal speed to hear the audio, as the audio is off during 2-times and 4-times Fast forward
Slide 11: Click on it one more time to go back to the normal speed.
Slide 12: You can also navigate to a particular section of the training by dragging the slider back and forward. Click it and hold down the mouse button.
Navigational - 1
Navigational - 2
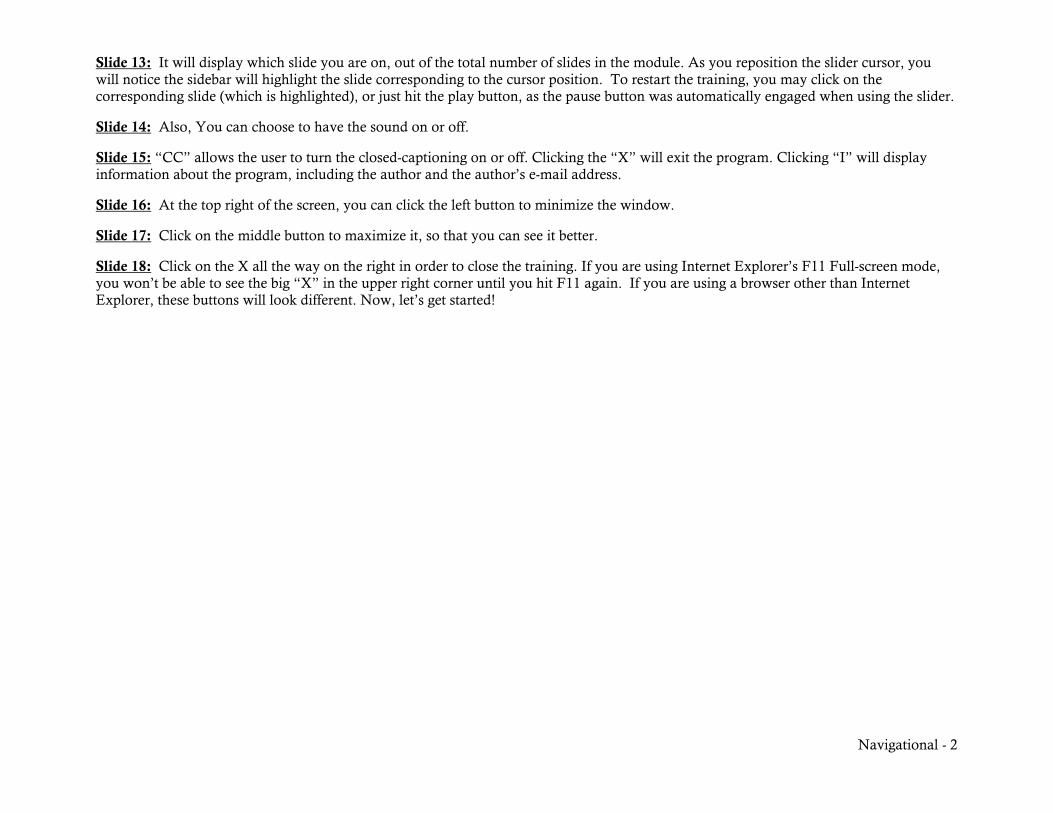
Slide 13: It will display which slide you are on, out of the total number of slides in the module. As you reposition the slider cursor, you will notice the sidebar will highlight the slide corresponding to the cursor position. To restart the training, you may click on the corresponding slide (which is highlighted), or just hit the play button, as the pause button was automatically engaged when using the slider.
Slide 14: Also, You can choose to have the sound on or off.
Slide 15: “CC” allows the user to turn the closed-captioning on or off. Clicking the “X” will exit the program. Clicking “I” will display information about the program, including the author and the author’s e-mail address.
Slide 16: At the top right of the screen, you can click the left button to minimize the window.
Slide 17: Click on the middle button to maximize it, so that you can see it better.
Slide 18: Click on the X all the way on the right in order to close the training. If you are using Internet Explorer’s F11 Full-screen mode, you won’t be able to see the big “X” in the upper right corner until you hit F11 again. If you are using a browser other than Internet Explorer, these buttons will look different. Now, let’s get started!
SSST Module
9/30/2009
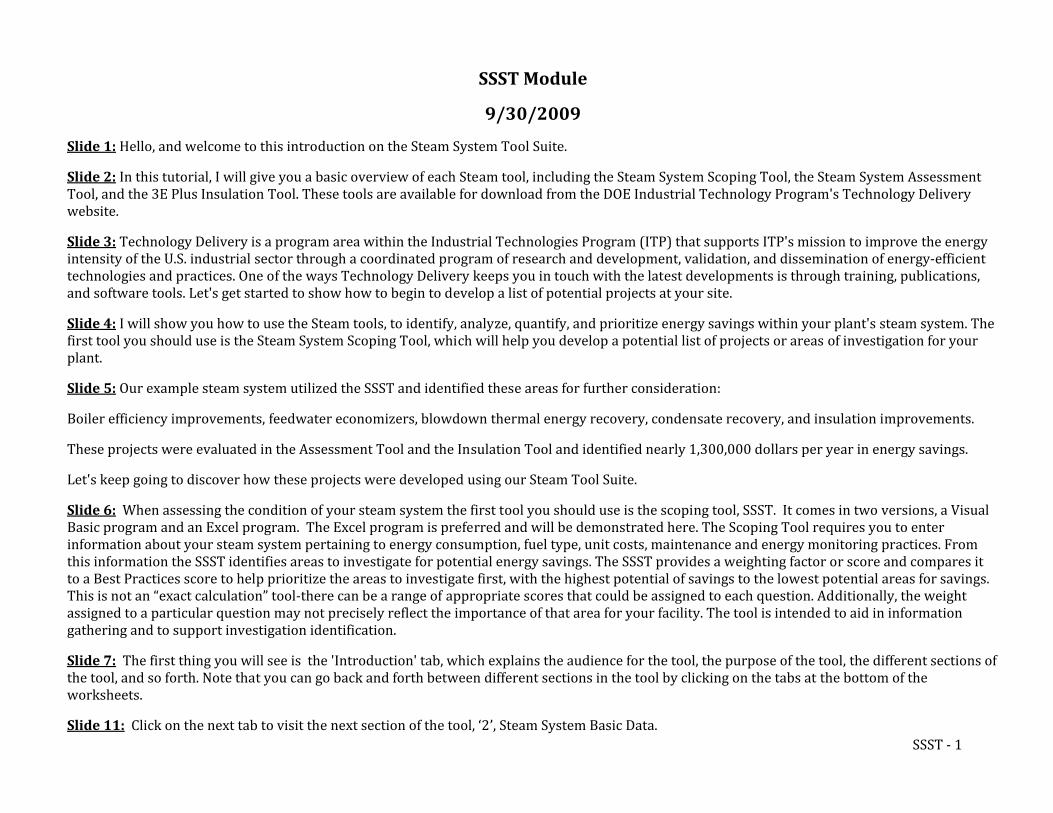
Slide 1: Hello, and welcome to this introduction on the Steam System Tool Suite.
Slide 2: In this tutorial, I will give you a basic overview of each Steam tool, including the Steam System Scoping Tool, the Steam System Assessment Tool, and the 3E Plus Insulation Tool. These tools are available for download from the DOE Industrial Technology Program's Technology Delivery website.
Slide 3: Technology Delivery is a program area within the Industrial Technologies Program (ITP) that supports ITP's mission to improve the energy intensity of the U.S. industrial sector through a coordinated program of research and development, validation, and dissemination of energy‐efficient technologies and practices. One of the ways Technology Delivery keeps you in touch with the latest developments is through training, publications, and software tools. Let's get started to show how to begin to develop a list of potential projects at your site.
Slide 4: I will show you how to use the Steam tools, to identify, analyze, quantify, and prioritize energy savings within your plant's steam system. The first tool you should use is the Steam System Scoping Tool, which will help you develop a potential list of projects or areas of investigation for your plant.
Slide 5: Our example steam system utilized the SSST and identified these areas for further consideration:
Boiler efficiency improvements, feedwater economizers, blowdown thermal energy recovery, condensate recovery, and insulation improvements.
These projects were evaluated in the Assessment Tool and the Insulation Tool and identified nearly 1,300,000 dollars per year in energy savings.
Let's keep going to discover how these projects were developed using our Steam Tool Suite.
Slide 6: When assessing the condition of your steam system the first tool you should use is the scoping tool, SSST. It comes in two versions, a Visual Basic program and an Excel program. The Excel program is preferred and will be demonstrated here. The Scoping Tool requires you to enter information about your steam system pertaining to energy consumption, fuel type, unit costs, maintenance and energy monitoring practices. From this information the SSST identifies areas to investigate for potential energy savings. The SSST provides a weighting factor or score and compares it to a Best Practices score to help prioritize the areas to investigate first, with the highest potential of savings to the lowest potential areas for savings. This is not an “exact calculation” tool‐there can be a range of appropriate scores that could be assigned to each question. Additionally, the weight assigned to a particular question may not precisely reflect the importance of that area for your facility. The tool is intended to aid in information gathering and to support investigation identification.
Slide 7: The first thing you will see is the 'Introduction' tab, which explains the audience for the tool, the purpose of the tool, the different sections of the tool, and so forth. Note that you can go back and forth between different sections in the tool by clicking on the tabs at the bottom of the worksheets.
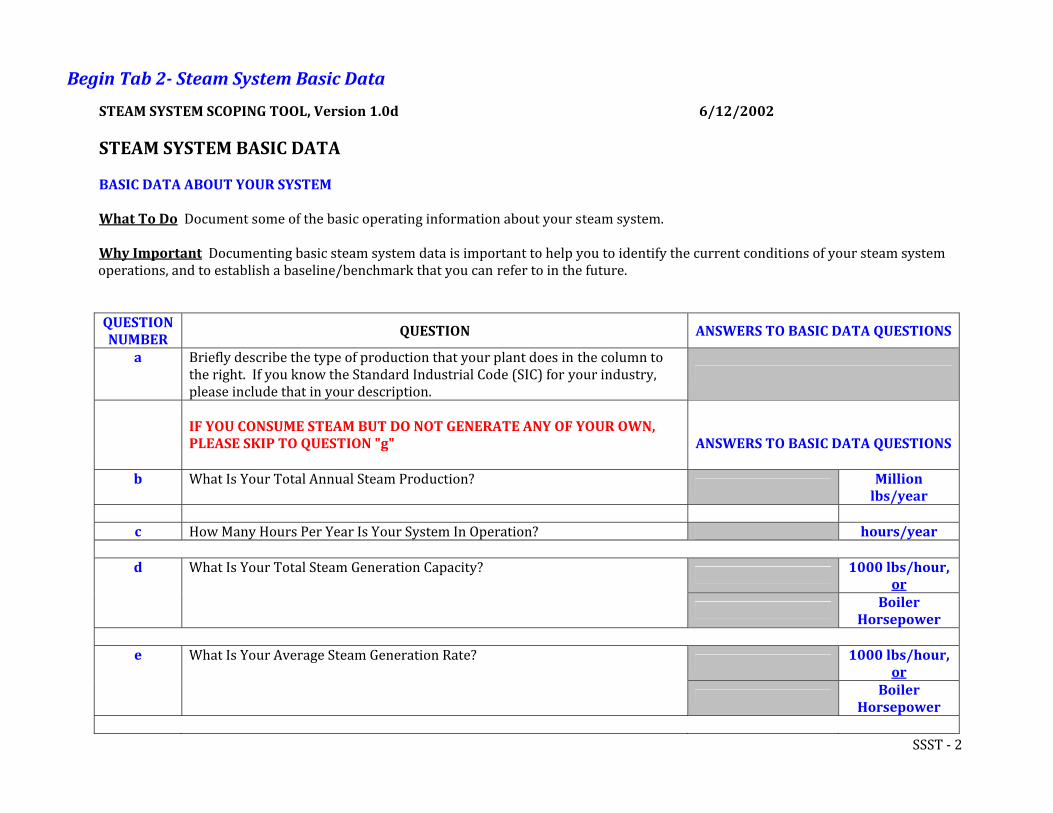
Slide 11: Click on the next tab to visit the next section of the tool, ‘2’, Steam System Basic Data. SSST ‐ 1
SSST ‐ 2
Begin Tab 2 Steam System Basic Data
STEAM SYSTEM SCOPING TOOL, Version 1.0d 6/12/2002 STEAM SYSTEM BASIC DATA BASIC DATA ABOUT YOUR SYSTEM What To Do Document some of the basic operating information about your steam system. Why Important Documenting basic steam system data is important to help you to identify the current conditions of your steam system operations, and to establish a baseline/benchmark that you can refer to in the future. QUESTION NUMBER
QUESTION ANSWERS TO BASIC DATA QUESTIONS
a Briefly describe the type of production that your plant does in the column to the right. If you know the Standard Industrial Code (SIC) for your industry, please include that in your description.
IF YOU CONSUME STEAM BUT DO NOT GENERATE ANY OF YOUR OWN,
PLEASE SKIP TO QUESTION "g"
ANSWERS TO BASIC DATA QUESTIONS
b What Is Your Total Annual Steam Production?
Million lbs/year
c How Many Hours Per Year Is Your System In Operation? hours/year
1000 lbs/hour,
ord What Is Your Total Steam Generation Capacity?
Boiler
Horsepower
1000 lbs/hour,
ore What Is Your Average Steam Generation Rate?
Boiler
Horsepower
SSST ‐ 3
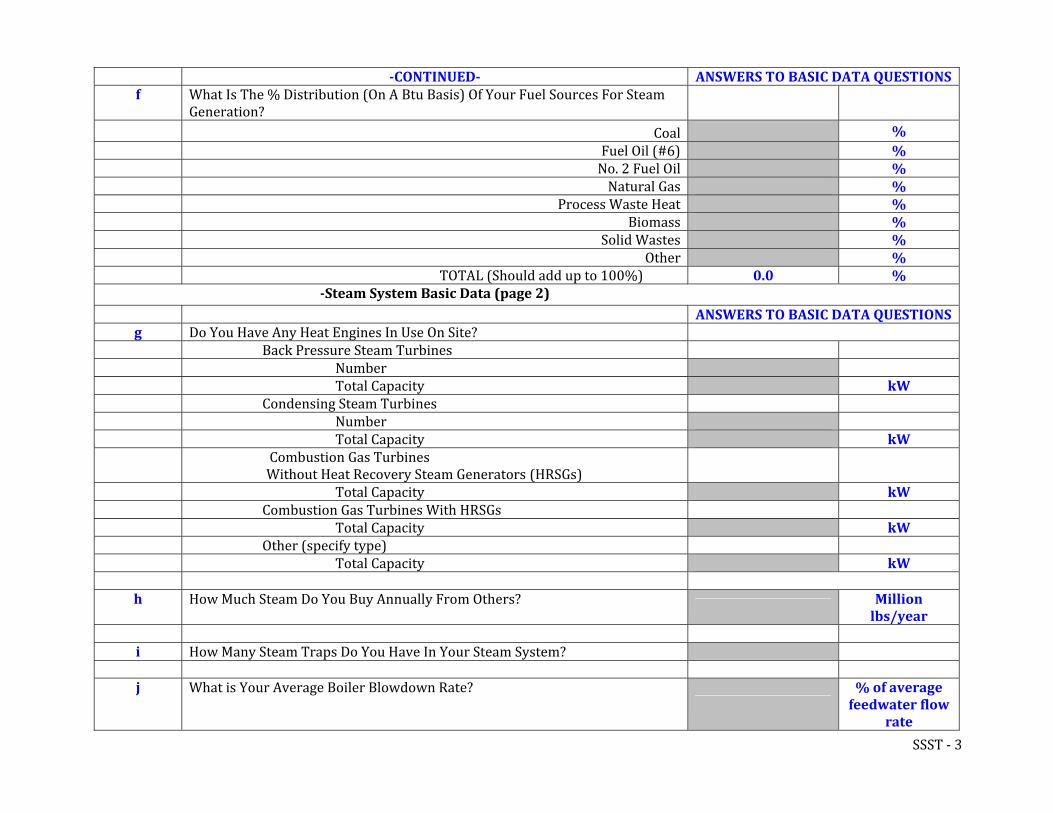
CONTINUED ANSWERS TO BASIC DATA ONS QUESTIf What Is The % Distribution (On A Btu Basis) Of Your Fuel Sources For Steam
Generation?
Coal % Fuel Oil (#6) % No. 2 Fuel Oil % Natural Gas % Process Waste Heat % Biomass % Solid Wastes % Other % TOTAL (Should add up to 100%) 0.0 % Steam System Basic Data (page 2) ANSWERS TO BASIC DATA QUESTIONSg Do You Have Any Heat Engines In Use On Site? Back Pressure Steam Turbines Number Total Capacity kW Condensing Steam Turbines Number Total Capacity kW Combustion Gas Turbines
Without Heat Recovery Steam Generators (HRSGs)
Total Capacity kW Combustion Gas Turbines With HRSGs Total Capacity kW Other (specify type) Total Capacity kW h How Much Steam Do You Buy Annually From Others?
Million lbs/year
i How Many Steam Traps Do You Have In Your Steam System? j What is Your Average Boiler Blowdown Rate?
% of average feedwater flow
rate
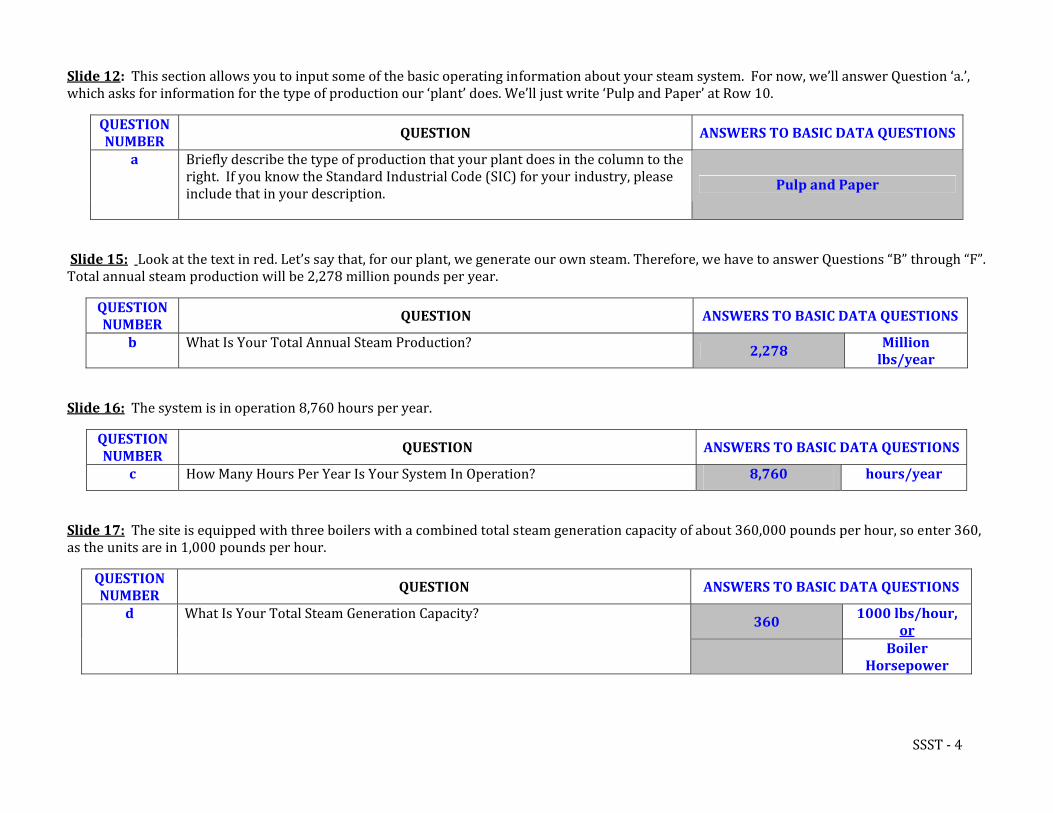
Slide 12: This section allows you to input some of the basic operating information about your steam system. For now, we’ll answer Question ‘a.’, which asks for information for the type of production our ‘plant’ does. We’ll just write ‘Pulp and Paper’ at Row 10.
QUESTION NUMBER QUESTION ANSWERS TO BASIC DATA QUESTIONS
Briefly describe the type of production that your plant does in the column to the right. If you know the Standard Industrial Code (SIC) for your industry, please include that in your description.
a
Pulp and Paper
Slide 15: Look at the text in red. Let’s say that, for our plant, we generate our own steam. Therefore, we have to answer Questions “B” through “F”. Total annual steam production will be 2,278 million pounds per year.
QUESTION NUMBER
QUESTION ANSWERS TO BASIC DATA QUESTIONS
What Is Your Total Annual Steam Production? b Million lbs/year 2,278
Slide 16: The system is in operation 8,760 hours per year.
QUESTION NUMBER
QUESTION ANSWERS TO BASIC DATA QUESTIONS
How Many Hours Per Year Is Your System In Operation?
c 8,760 hours/year
Slide 17: The site is equipped with three boilers with a combined total steam generation capacity of about 360,000 pounds per hour, so enter 360, as the units are in 1,000 pounds per hour.
QUESTION NUMBER
QUESTION ANSWERS TO BASIC DATA QUESTIONS
360 1000 lbs/hour,
orWhat Is Your Total Steam Generation Capacity? d
Boiler Horsepower
SSST ‐ 4
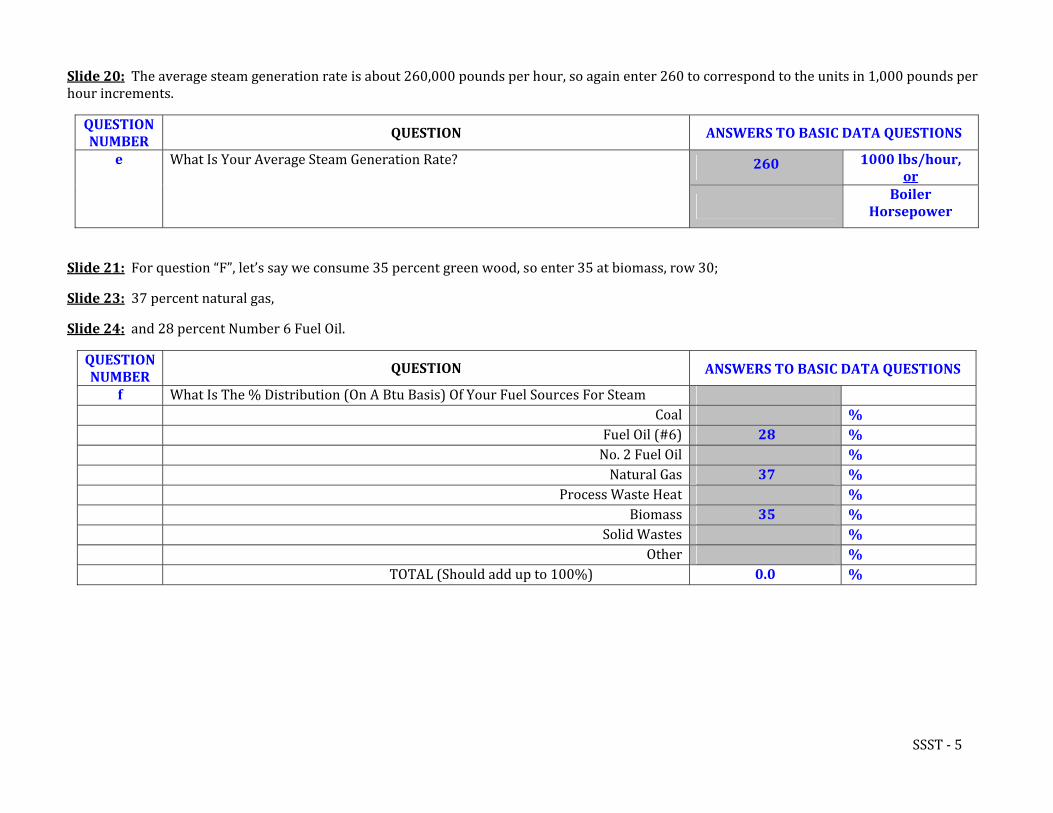
Slide 20: The average steam generation rate is about 260,000 pounds per hour, so again enter 260 to correspond to the units in 1,000 pounds per hour increments.
QUESTION NUMBER QUESTION ANSWERS TO BASIC DATA QUESTIONS
260 1000 lbs/hour, or
What Is Your Average Steam Generation Rate? e
Boiler Horsepower
Slide 21: For question “F”, let’s say we consume 35 percent green wood, so enter 35 at biomass, row 30;
Slide 23: 37 percent natural gas,
Slide 24: and 28 percent Number 6 Fuel Oil.
ANSWERS TO BASIC DATA QUESTIONS QUESTION NUMBER
QUESTION
What Is The % Distribution (On A Btu Basis) Of Your Fuel Sources For Steam f Coal %
Fuel Oil (#6) 28 % No. 2 Fuel Oil % Natural Gas 37 %
Process Waste Heat % Biomass 35 %
Solid Wastes % Other %
TOTAL (Should add up to 100%) 0.0 %
SSST ‐ 5
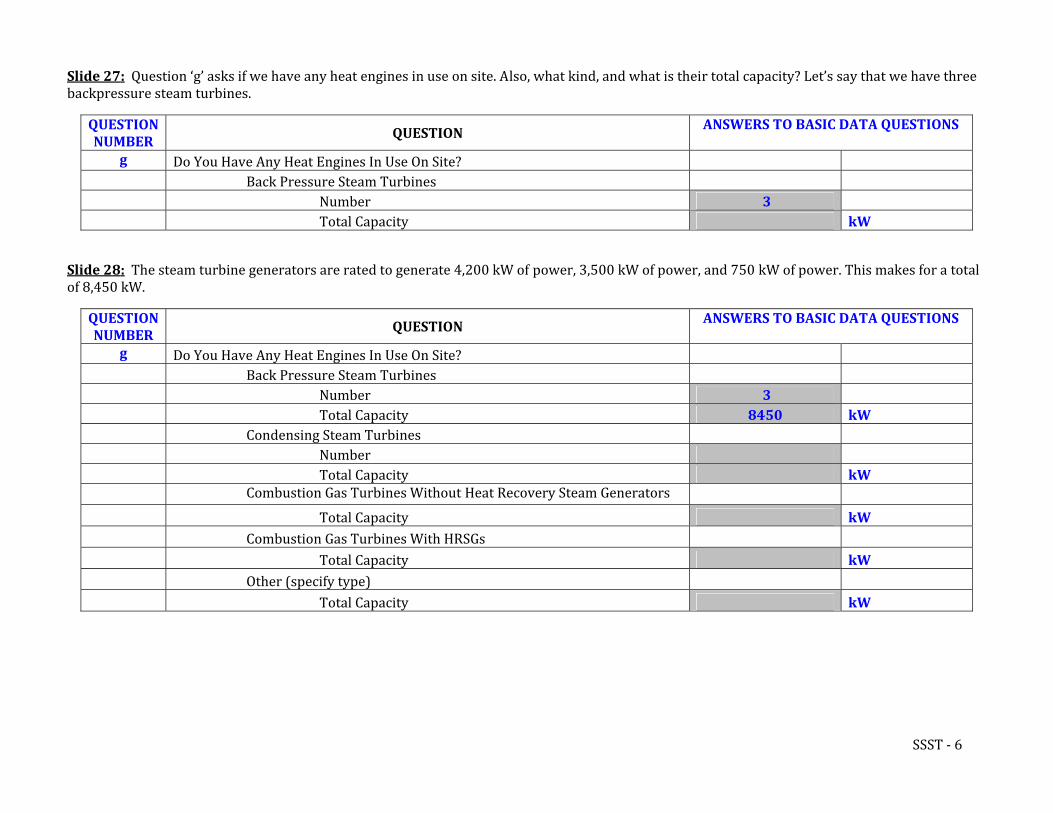
Slide 27: Question ‘g’ asks if we have any heat engines in use on site. Also, what kind, and what is their total capacity? Let’s say that we have three backpressure steam turbines.
ANSWERS TO BASIC DATA QUESTIONS QUESTION NUMBER QUESTION
g Do You Have Any Heat Engines In Use On Site? Back Pressure Steam Turbines
Number 3 Total Capacity
kW
Slide 28: The steam turbine generators are rated to generate 4,200 kW of power, 3,500 kW of power, and 750 kW of power. This makes for a total of 8,450 kW.
QUESTION NUMBER
ANSWERS TO BASIC DATA QUESTIONS QUESTION
g Do You Have Any Heat Engines In Use On Site? Back Pressure Steam Turbines
Number 3 Total Capacity 8450 kW
Condensing Steam Turbines Number Total Capacity kW
Combustion Gas Turbines Without Heat Recovery Steam Generators Total Capacity kW
Combustion Gas Turbines With HRSGs Total Capacity kW
Other (specify type) Total Capacity
kW
SSST ‐ 6
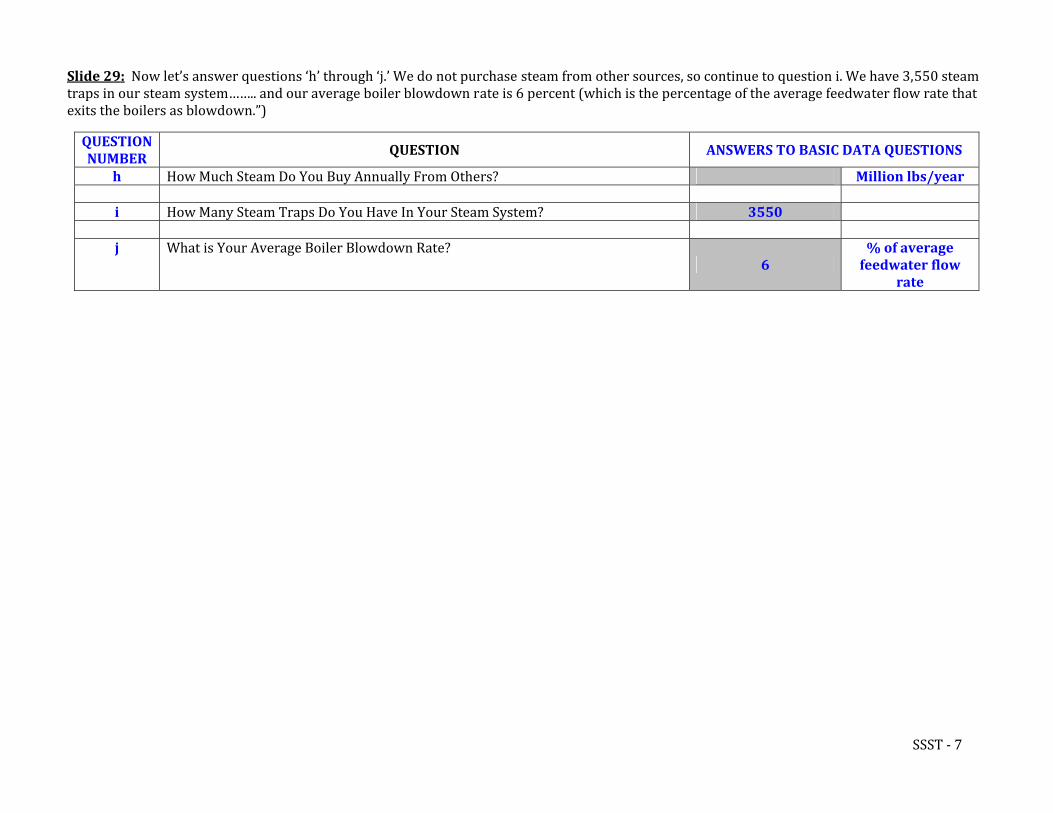
Slide 29: Now let’s answer questions ‘h’ through ‘j.’ We do not purchase steam from other sources, so continue to question i. We have 3,550 steam traps in our steam system…….. and our average boiler blowdown rate is 6 percent (which is the percentage of the average feedwater flow rate that exits the boilers as blowdown.”)
QUESTION NUMBER
QUESTION ANSWERS TO BASIC DATA QUESTIONS
How Much Steam Do You Buy Annually From Others? h Million lbs/year How Many Steam Traps Do You Have In Your Steam System? i 3550 What is Your Average Boiler Blowdown Rate? % of average
feedwater flow rate
j 6
SSST ‐ 7
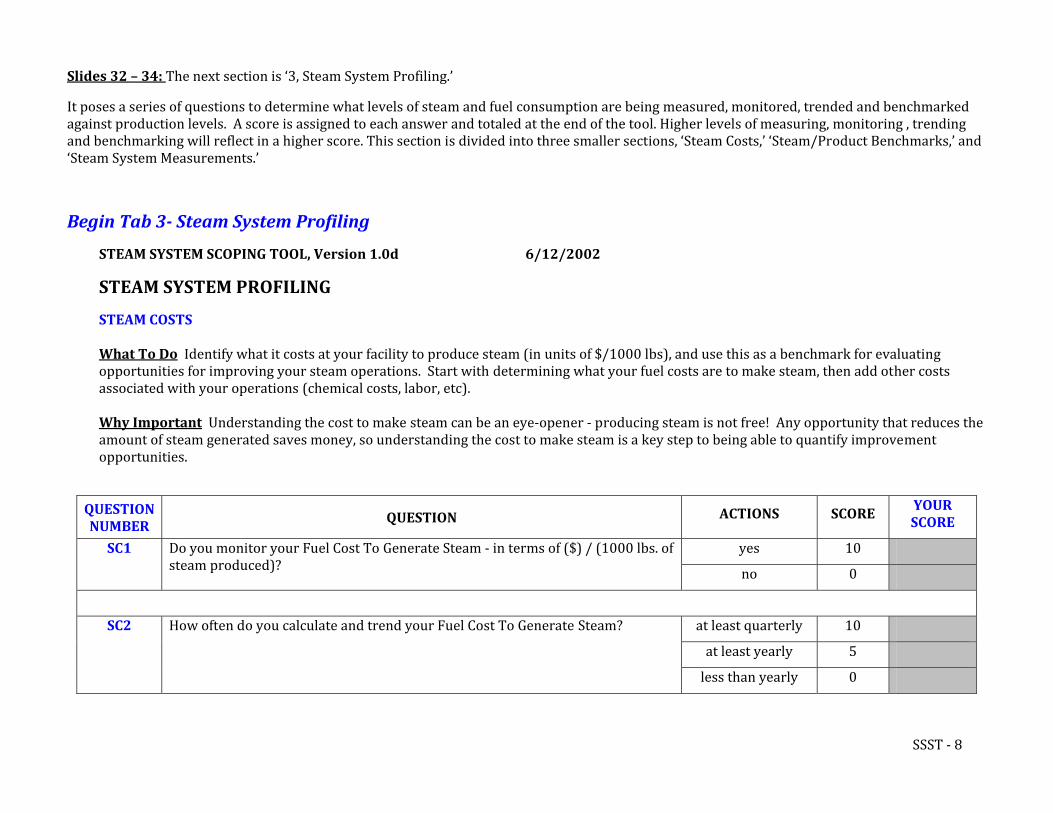
Slides 32 – 34: The next section is ‘3, Steam System Profiling.’
It poses a series of questions to determine what levels of steam and fuel consumption are being measured, monitored, trended and benchmarked against production levels. A score is assigned to each answer and totaled at the end of the tool. Higher levels of measuring, monitoring , trending and benchmarking will reflect in a higher score. This section is divided into three smaller sections, ‘Steam Costs,’ ‘Steam/Product Benchmarks,’ and ‘Steam System Measurements.’
Begin Tab 3 Steam System Profiling
STEAM SYSTEM SCOPING TOOL, Ve sion 1.0d 6/12/2002 r
STEAM SYSTEM PROFILING
STEAM COSTS What To Do Identify what it costs at your facility to produce steam (in units of $/1000 lbs), and use this as a benchmark for evaluating opportunities for improving your steam operations. Start with determining what your fuel costs are to make steam, then add other costs associated with your operations (chemical costs, labor, etc). Why Important Understanding the cost to make steam can be an eye‐opener ‐ producing steam is not free! Any opportunity that reduces the amount of steam generated saves money, so understanding the cost to make steam is a key step to being able to quantify improvement opportunities.
YOUR SCORE
QUESTION NUMBER
ACTIONS SCORE QUESTION
yes 10 Do you monitor your Fuel Cost To Generate Steam ‐ in terms of ($) / (1000 lbs. of steam produced)? no 0
SC1
at least quarterly 10
at least yearly 5
How often do you calculate and trend your Fuel Cost To Generate Steam? SC2
less than yearly 0
SSST ‐ 8
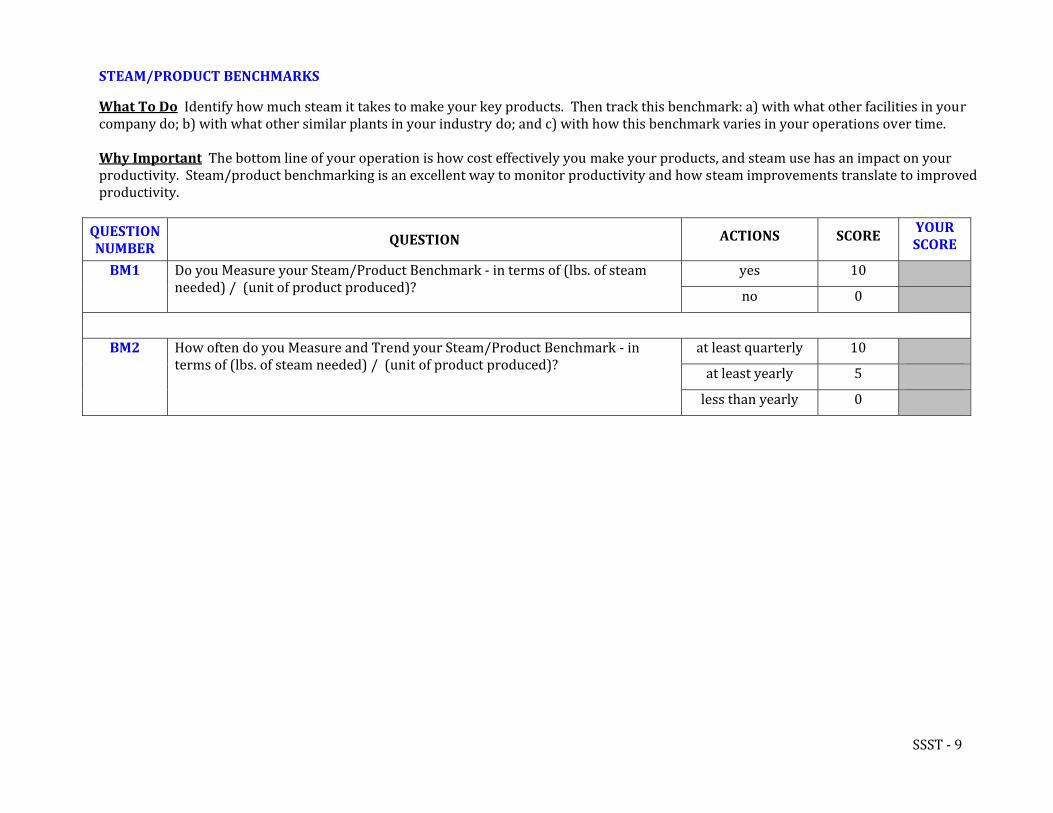
STEAM/PRODUCT BENCHMARKS
What To Do Identify how much steam it takes to make your key products. Then track this benchmark: a) with what other facilities in your company do; b) with what other similar plants in your industry do; and c) with how this benchmark varies in your operations over time. Why Important The bottom line of your operation is how cost effectively you make your products, and steam use has an impact on your productivity. Steam/product benchmarking is an excellent way to monitor productivity and how steam improvements translate to improved productivity.
YOUR SCORE
QUESTION NUMBER
ACTIONS SCORE QUESTION
yes 10 Do you Measure your Steam/Product Benchmark ‐ in terms of (lbs. of steam needed) / (unit of product produced)? no 0
BM1
at least quarterly 10
at least yearly 5
How often do you Measure and Trend your Steam/Product Benchmark ‐ in terms of (lbs. of steam needed) / (unit of product produced)?
BM2
less than yearly 0
SSST ‐ 9
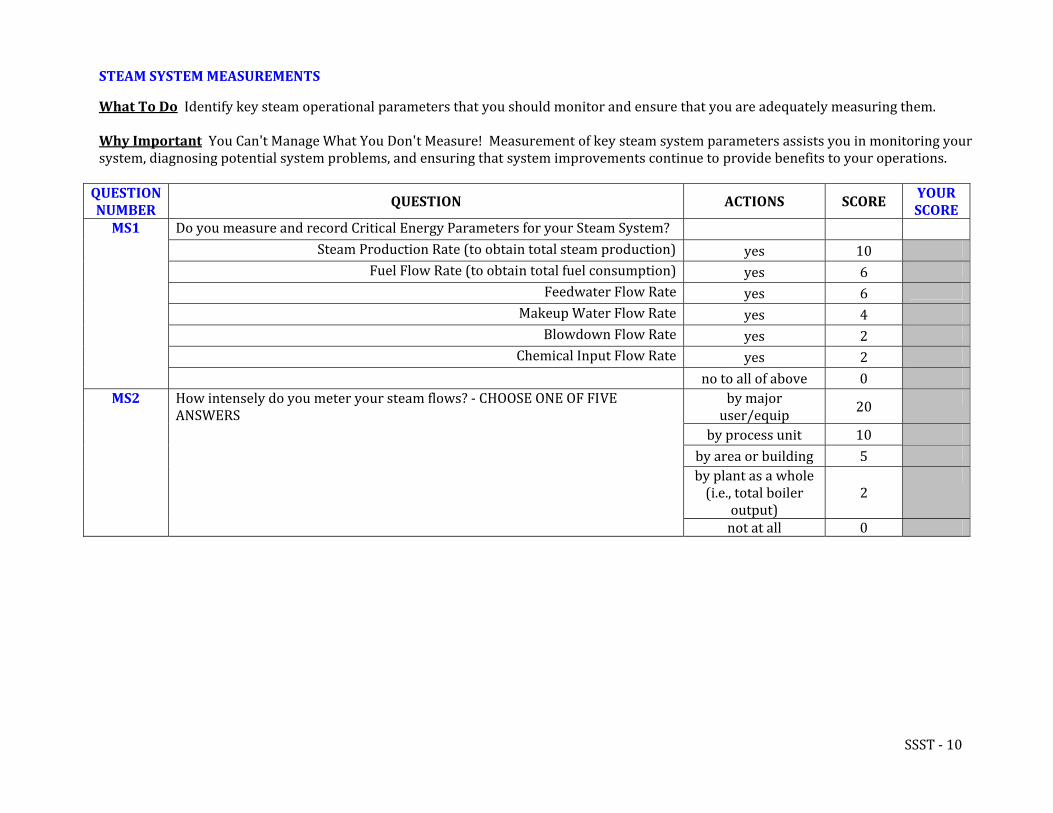
STEAM SYS TEM MEASUREMENTS
What To Do Identify key steam operational parameters that you should monitor and ensure that you are adequately measuring them. Why Important You Can't Manage What You Don't Measure! Measurement of key steam system parameters assists you in monitoring your system, diagnosing potential system problems, and ensuring that system improvements continue to provide benefits to your operations. QUESTION NUMBER
YOUR
QUESTION ACTIONS SCORE SCORE
Do you measure and record Critical Energy Parameters for your Steam System? Steam Production Rate (to obtain total steam production) yes 10
MS1
Fuel Flow Rate (to obtain total fuel consumption) yes 6 Feedwater Flow Rate yes 6
Makeup Water Flow Rate yes 4 Blowdown Flow Rate yes 2
Chemical Input Flow Rate yes 2 no to all of above 0
by major user/equip 20
by process unit 10
by area or building 5
How intensely do you meter your steam flows? ‐ CHOOSE ONE OF FIVE ANSWERS
MS2
by plant as a whole (i.e., total boiler
output) 2
not at all 0
SSST ‐ 10
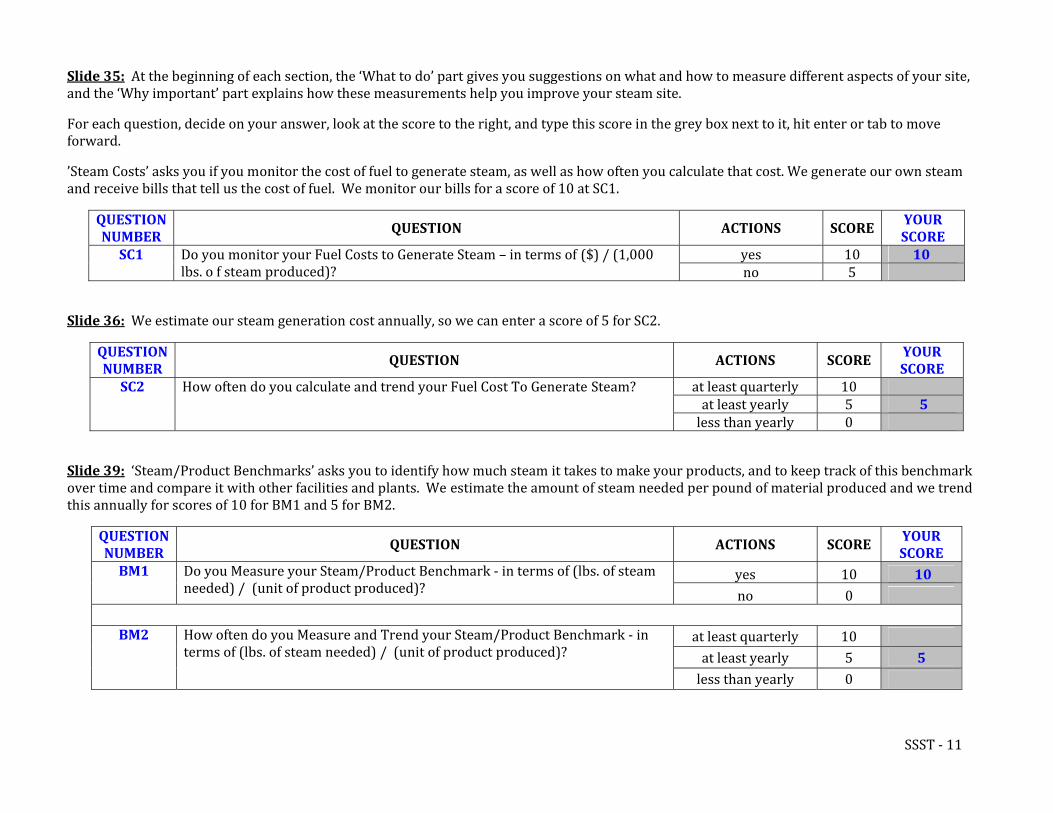
Slide 35: At the beginning of each section, the ‘What to do’ part gives you suggestions on what and how to measure different aspects of your site, and the ‘Why important’ part explains how these measurements help you improve your steam site.
For each question, decide on your answer, look at the score to the right, and type this score in the grey box next to it, hit enter or tab to move forward.
’Steam Costs’ asks you if you monitor the cost of fuel to generate steam, as well as how often you calculate that cost. We generate our own steam and receive bills that tell us the cost of fuel. We monitor our bills for a score of 10 at SC1.
QUESTION NUMBER
YOUR SCORE
QUESTION AC NS TIO SCORE
yes 10 10 Do you monitor your Fuel Costs to Generate Steam – in terms of ($) / (1,000 lbs. o f steam produced)? no 5
SC1
Slide 36: We estimate our steam generation cost annually, so we can enter a score of 5 for SC2.
QUESTION NUMBER
YOUR SCORE
QUESTION ACTIONS SCORE
at least quarterly 10 at least yearly 5 5
How often do you calculate and trend your Fuel Cost To Generate Steam? SC2
less than yearly 0
Slide 39: ‘Steam/Product Benchmarks’ asks you to identify how much steam it takes to make your products, and to keep track of this benchmark over time and compare it with other facilities and plants. We estimate the amount of steam needed per pound of material produced and we trend this annually for scores of 10 for BM1 and 5 for BM2.
QUESTION NUMBER
YOUR SCORE
QUESTION AC NS TIO SCORE
yes 10 10 Do you Measure your Steam/Product Benchmark ‐ in terms of (lbs. of steam needed) / (unit of product produced)? no 0
BM1
at least quarterly 10 at least yearly 5 5
How often do you Measure and Trend your Steam/Product Benchmark ‐ in terms of (lbs. of steam needed) / (unit of product produced)?
BM2
less than yearly 0
SSST ‐ 11
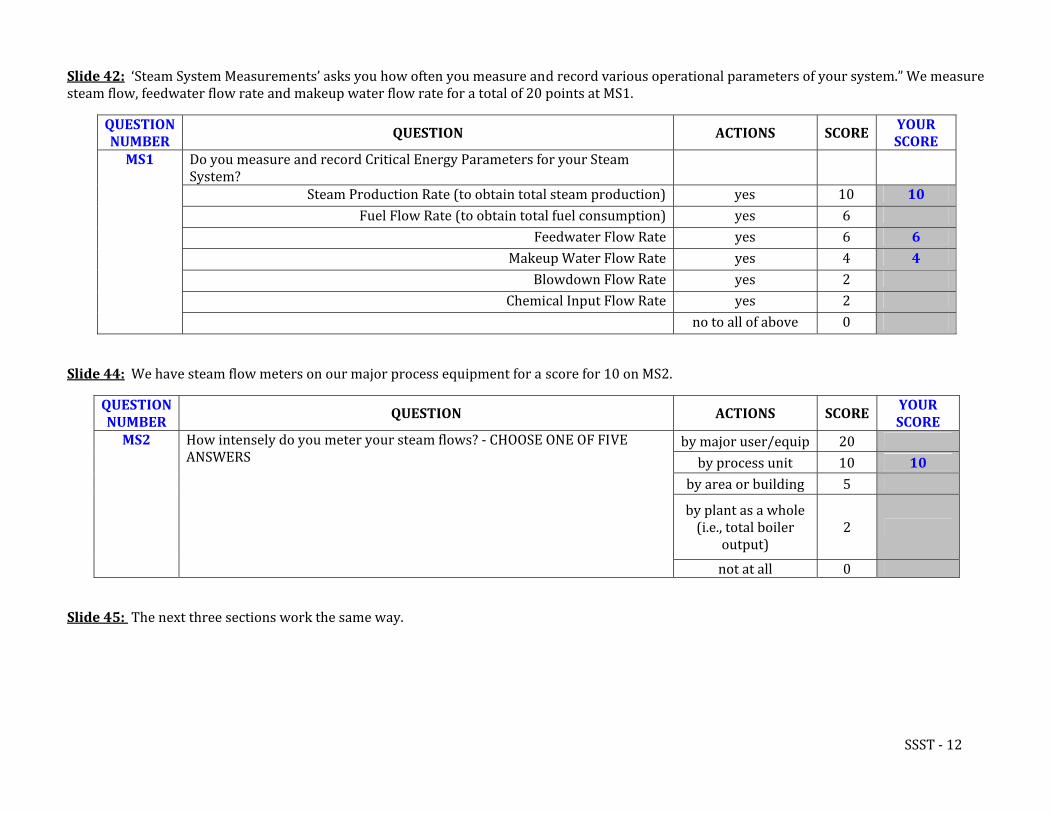
Slide 42: ‘Steam System Measurements’ asks you how often you measure and record various operational parameters of your system.” We measure steam flow, feedwater flow rate and makeup water flow rate for a total of 20 points at MS1.
QUESTION NUMBER
YOUR QUESTION ACTIONS SCORE
SCOREDo you measure and record Critical Energy Parameters for your Steam System?
MS1
Steam Production Rate (to obtain total steam production) yes 10 10 Fuel Flow Rate (to obtain total fuel consumption) yes 6
Feedwater Flow Rate yes 6 6 Makeup Water Flow Rate yes 4 4
Blowdown Flow Rate yes 2 Chemical Input Flow Rate yes 2
no to all of above 0
Slide 44: We have steam flow meters on our major process equipment for a score for 10 on MS2.
YOUR SCORE
QUESTION NUMBER
QUESTION ACTIONS SCORE
by major user/equip 20 by process unit 10 10
by area or building 5
by plant as a whole (i.e., total boiler
output) 2
How intensely do you meter your steam flows? ‐ CHOOSE ONE OF FIVE ANSWERS
MS2
not at all 0
Slide 45: The next three sections work the same way.
SSST ‐ 12
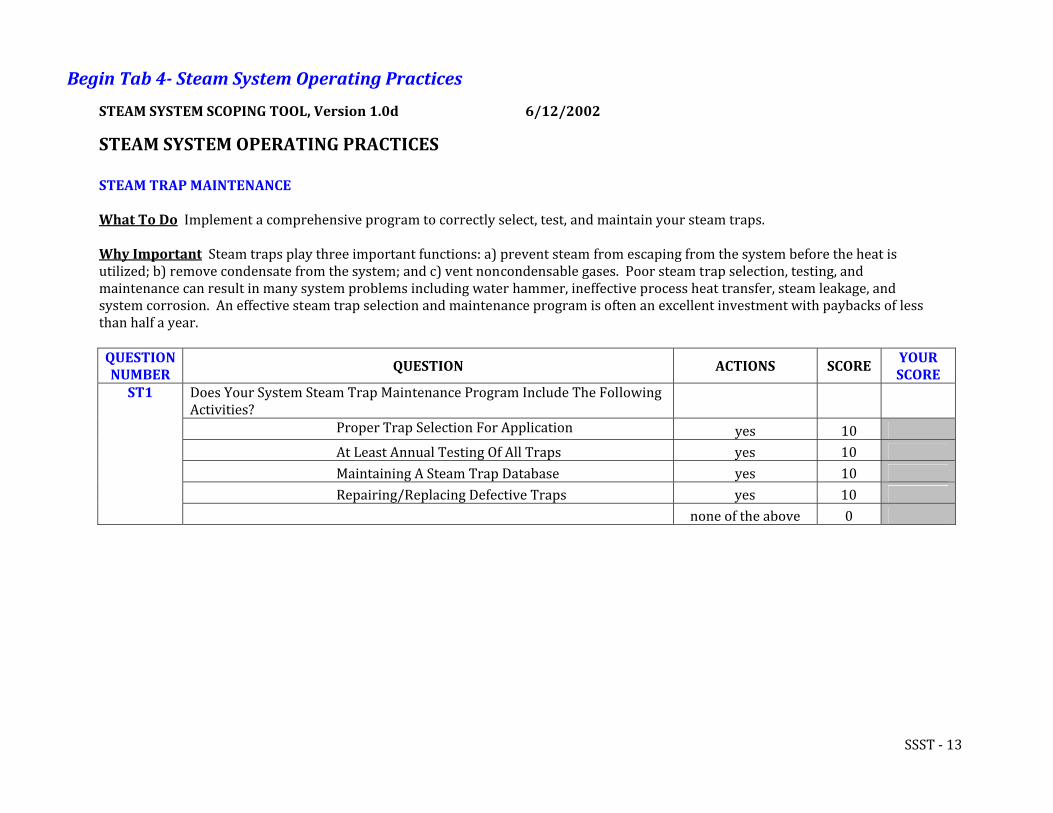
Begin Tab 4 Steam System Operating Practices
STEAM SYSTEM SCOPING TOOL, Version 1.0d 6/12/2002
STEAM SYSTEM OPERATING PRACTICES STEAM TRAP MAINTENANCE What To Do Implement a comprehensive program to correctly select, test, and maintain your steam traps. Why Important Steam traps play three important functions: a) prevent steam from escaping from the system before the heat is utilized; b) remove condensate from the system; and c) vent noncondensable gases. Poor steam trap selection, testing, and maintenance can result in many system problems including water hammer, ineffective process heat transfer, steam leakage, and system corrosion. An effective steam trap selection and maintenance program is often an excellent investment with paybacks of less than half a year.
QUESTION NUMBER
YOUR SCORE
QUESTION ACTIONS SCORE
Does Your System Steam Trap Maintenance Program Include The Following Activities?
ST1
Proper Trap Selection For Application yes 10 At Least Annual Testing Of All Traps yes 10 Maintaining A Steam Trap Database yes 10 Repairing/Replacing Defective Traps yes 10 none of the above 0
SSST ‐ 13
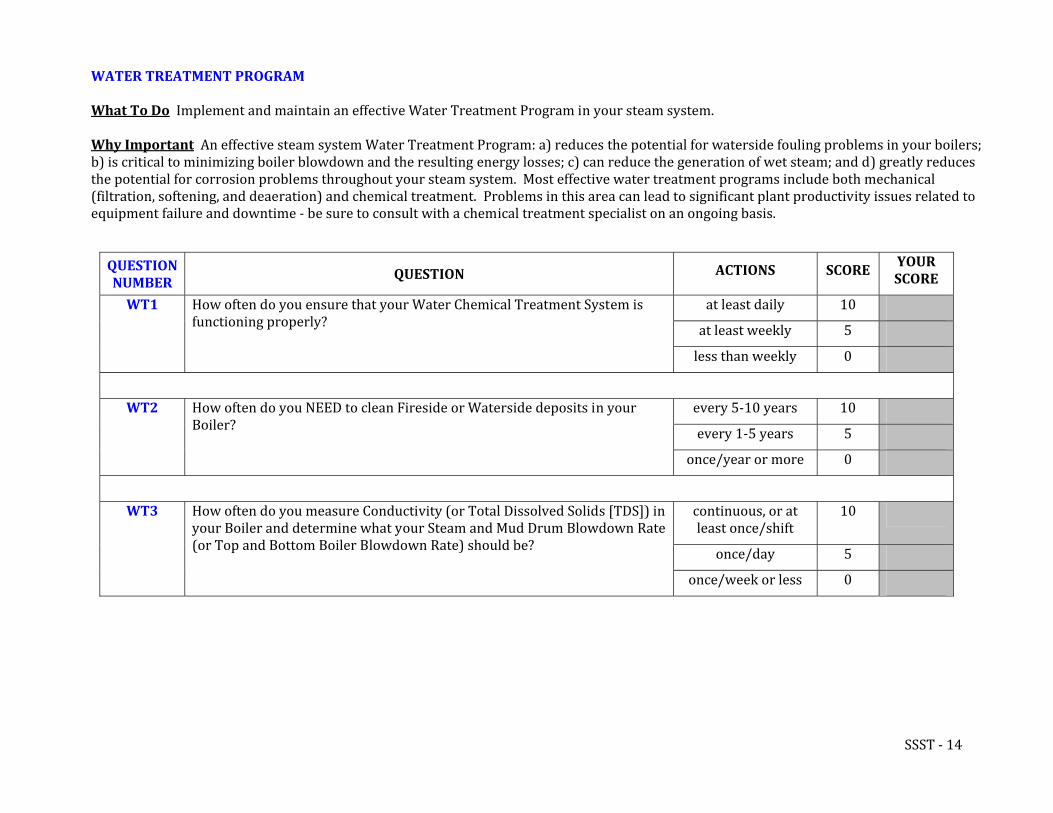
WATER TREATMENT PROGRAM What To Do Implement and maintain an effective Water Treatment Program in your steam system. Why Important An effective steam system Water Treatment Program: a) reduces the potential for waterside fouling problems in your boilers; b) is critical to minimizing boiler blowdown and the resulting energy losses; c) can reduce the generation of wet steam; and d) greatly reduces the potential for corrosion problems throughout your steam system. Most effective water treatment programs include both mechanical (filtration, softening, and deaeration) and chemical treatment. Problems in this area can lead to significant plant productivity issues related to equipment failure and downtime ‐ be sure to consult with a chemical treatment specialist on an ongoing basis.
YOUR SCORE
QUESTION NUMBER
ACTIONS SCORE QUESTION
at least daily 10
at least weekly 5
How often do you ensure that your Water Chemical Treatment System is functioning properly?
WT1
less than weekly 0
every 5‐10 years 10
every 1‐5 years 5
How often do you NEED to clean Fireside or Waterside deposits in your Boiler?
WT2
once/year or more 0
continuous, or at least once/shift
10
once/day 5
How often do you measure Conductivity (or Total Dissolved Solids [TDS]) in your Boiler and determine what your Steam and Mud Drum Blowdown Rate (or Top and Bottom Boiler Blowdown Rate) should be?
WT3
once/week or less 0
SSST ‐ 14
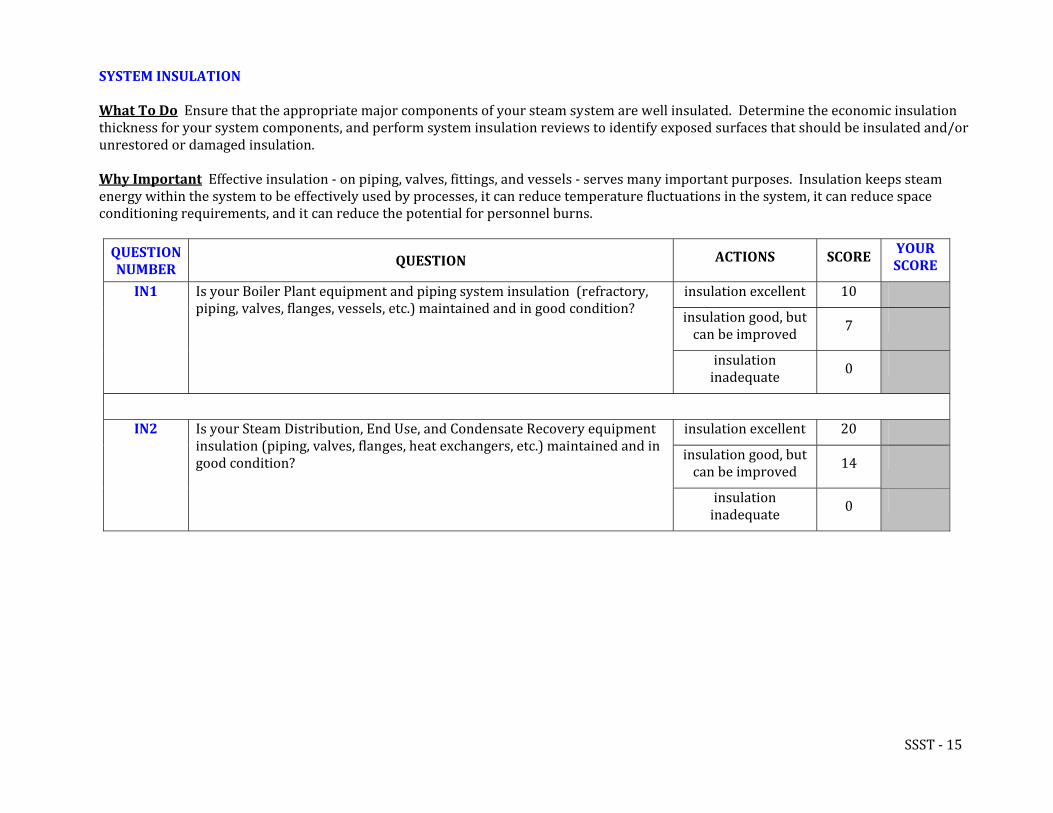
SYSTEM INSULATION What To Do Ensure that the appropriate major components of your steam system are well insulated. Determine the economic insulation thickness for your system components, and perform system insulation reviews to identify exposed surfaces that should be insulated and/or unrestored or damaged insulation. Why Important Effective insulation ‐ on piping, valves, fittings, and vessels ‐ serves many important purposes. Insulation keeps steam energy within the system to be effectively used by processes, it can reduce temperature fluctuations in the system, it can reduce space conditioning requirements, and it can reduce the potential for personnel burns.
YOUR SCORE
QUESTION NUMBER
ACTIONS SCORE QUESTION
insulation excellent 10
insulation good, but can be improved 7
Is your Boiler Plant equipment and piping system insulation (refractory, piping, valves, flanges, vessels, etc.) maintained and in good condition?
IN1
insulation inadequate 0
insulation excellent 20
insulation good, but can be improved 14
Is your Steam Distribution, End Use, and Condensate Recovery equipment insulation (piping, valves, flanges, heat exchangers, etc.) maintained and in good condition?
IN2
insulation inadequate 0
SSST ‐ 15
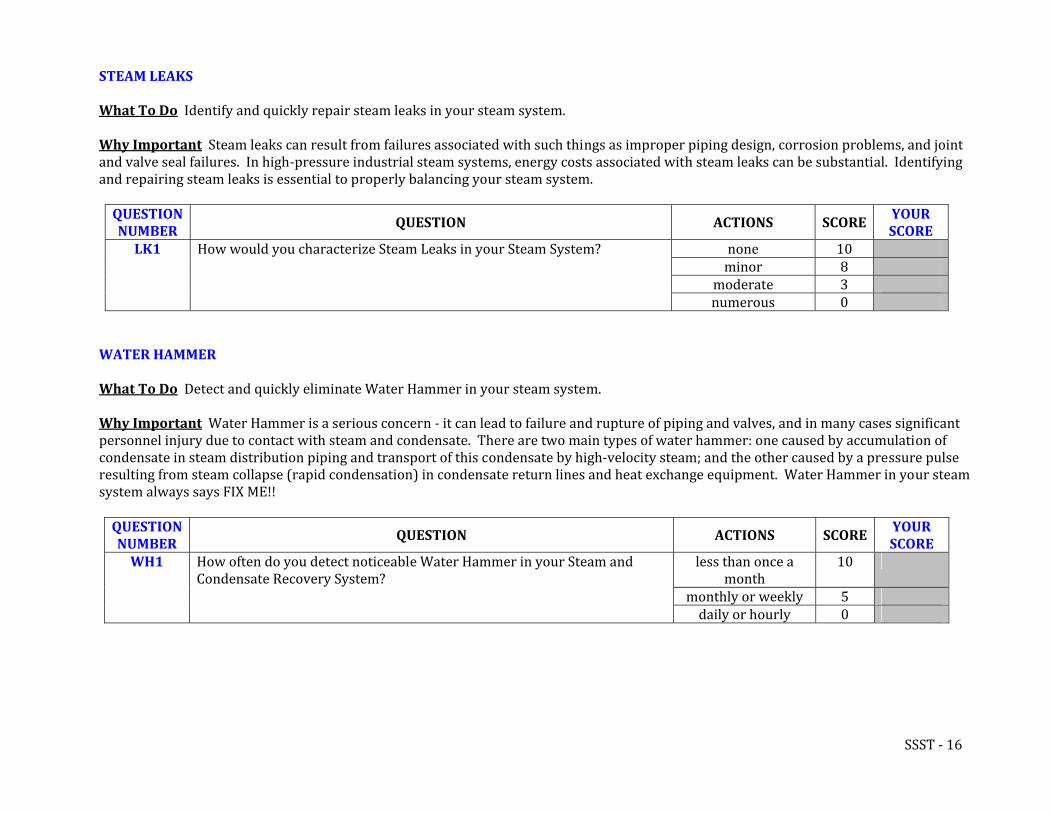
STEAM LEAKS What To Do Identify and quickly repair steam leaks in your steam system. Why Important Steam leaks can result from failures associated with such things as improper piping design, corrosion problems, and joint and valve seal failures. In high‐pressure industrial steam systems, energy costs associated with steam leaks can be substantial. Identifying and repairing steam leaks is essential to properly balancing your steam system.
YOUR SCORE
QUESTION NUMBER
QUESTION AC S TION SCORE
none 10 minor 8
moderate 3
How would you characterize Steam Leaks in your Steam System? LK1
numerous 0
WATER HAMMER What To Do Detect and quickly eliminate Water Hammer in your steam system. Why Important Water Hammer is a serious concern ‐ it can lead to failure and rupture of piping and valves, and in many cases significant personnel injury due to contact with steam and condensate. There are two main types of water hammer: one caused by accumulation of condensate in steam distribution piping and transport of this condensate by high‐velocity steam; and the other caused by a pressure pulse resulting from steam collapse (rapid condensation) in condensate return lines and heat exchange equipment. Water Hammer in your steam system always says FIX ME!!
YOUR SCORE
QUESTION NUMBER
QUESTION ACTIONS SCORE
less than once a month
10
monthly or weekly 5
How often do you detect noticeable Water Hammer in your Steam and Condensate Recovery System?
WH1
daily or hourly 0
SSST ‐ 16
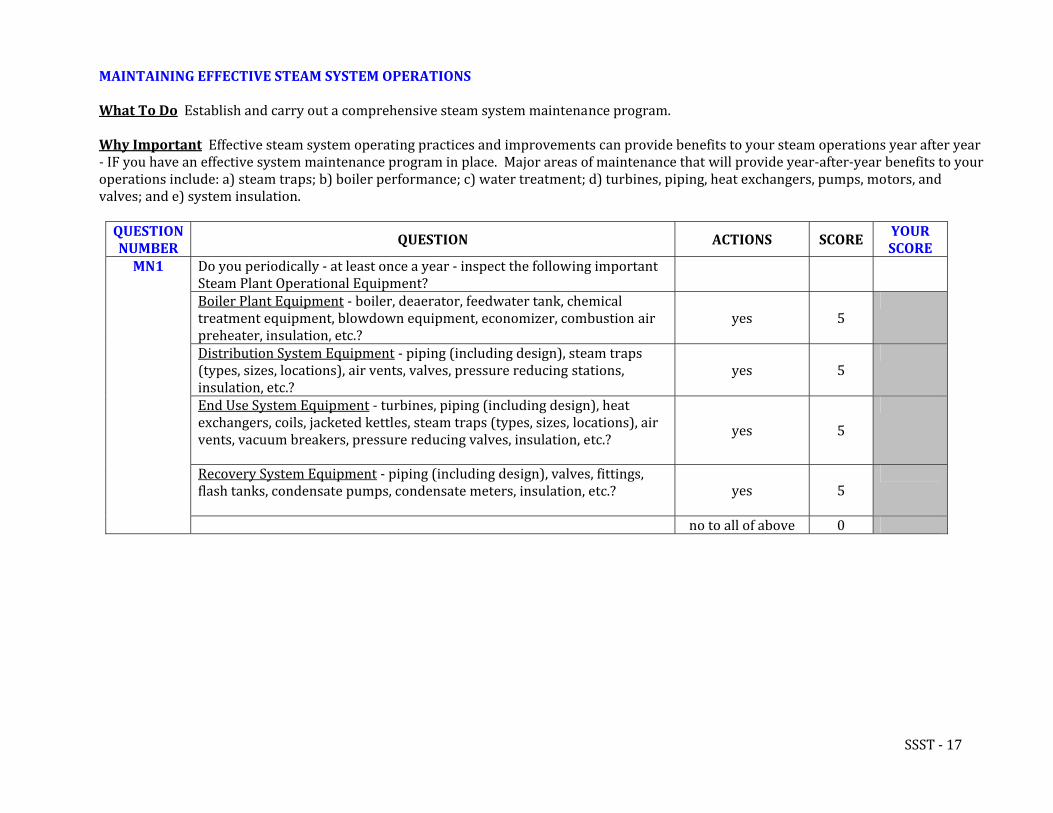
MAINTAINING EFFECTIVE STEAM SYSTEM OPERATIONS What To Do Establish and carry out a comprehensive steam system maintenance program. Why Important Effective steam system operating practices and improvements can provide benefits to your steam operations year after year ‐ IF you have an effective system maintenance program in place. Major areas of maintenance that will provide year‐after‐year benefits to your operations include: a) steam traps; b) boiler performance; c) water treatment; d) turbines, piping, heat exchangers, pumps, motors, and valves; and e) system insulation. QUESTION NUMBER
YOUR SCORE
QUESTION ACTIONS SCORE
Do you periodically ‐ at least once a year ‐ inspect the following important Steam Plant Operational Equipment?
MN1
Boiler Plant Equipment ‐ boiler, deaerator, feedwater tank, chemical treatment equipment, blowdown equipment, economizer, combustion air preheater, insulation, etc.?
yes 5
Distribution System Equipment ‐ piping (including design), steam traps (types, sizes, locations), air vents, valves, pressure reducing stations, insulation, etc.?
yes 5
End Use System Equipment ‐ turbines, piping (including design), heat exchangers, coils, jacketed kettles, steam traps (types, sizes, locations), air vents, vacuum breakers, pressure reducing valves, insulation, etc.? yes 5
Recovery System Equipment ‐ piping (including design), valves, fittings, flash tanks, condensate pumps, condensate meters, insulation, etc.? yes 5
no to all of above 0
SSST ‐ 17
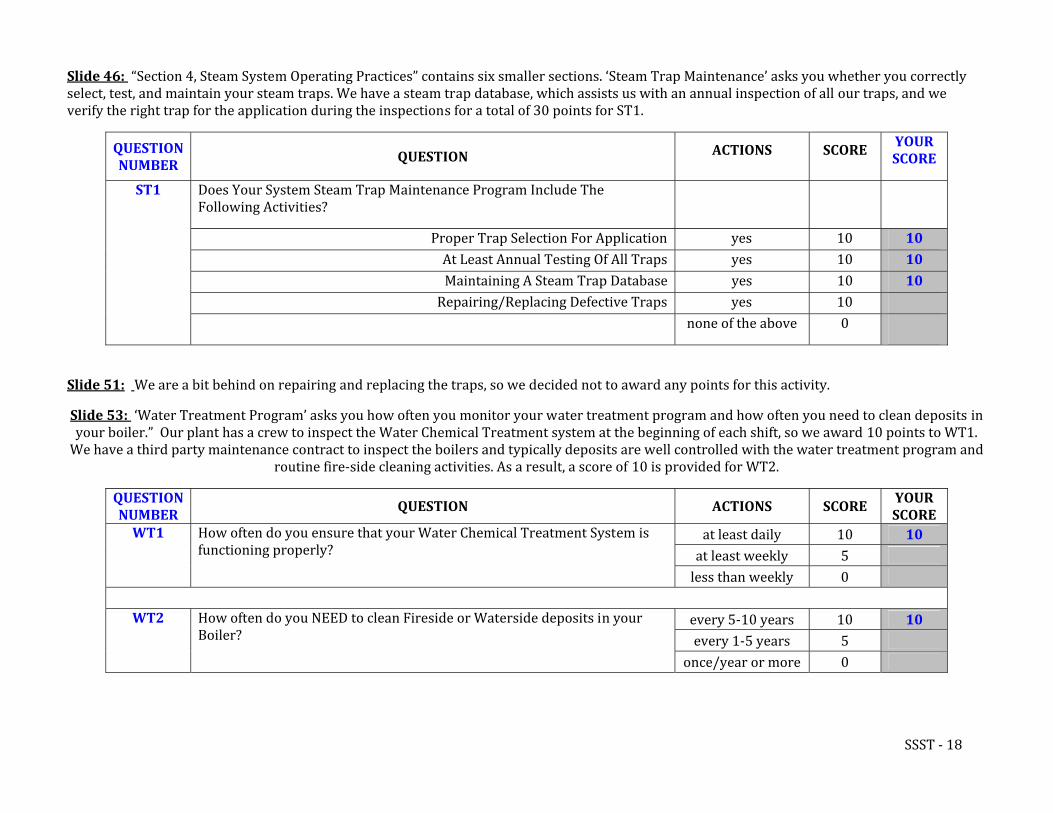
Slide 46: “Section 4, Steam System Operating Practices” contains six smaller sections. ‘Steam Trap Maintenance’ asks you whether you correctly select, test, and maintain your steam traps. We have a steam trap database, which assists us with an annual inspection of all our traps, and we verify the right trap for the application during the inspections for a total of 30 points for ST1.
YOUR SCORE
QUESTION NUMBER
ACTIONS SCORE QUESTION
Does Your System Steam Trap Maintenance Program Include The Following Activities?
ST1
Proper Trap Selection For Application yes 10 10 At Least Annual Testing Of All Traps yes 10 10 Maintaining A Steam Trap Database yes 10 10 Repairing/Replacing Defective Traps yes 10
none of the above 0
Slide 51: We are a bit behind on repairing and replacing the traps, so we decided not to award any points for this activity.
Slide 53: ‘Water Treatment Program’ asks you how often you monitor your water treatment program and how often you need to clean deposits in your boiler.” Our plant has a crew to inspect the Water Chemical Treatment system at the beginning of each shift, so we award 10 points to WT1. We have a third party maintenance contract to inspect the boilers and typically deposits are well controlled with the water treatment program and
routine fire‐side cleaning activities. As a result, a score of 10 is provided for WT2.
QUESTION NUMBER
YOUR SCORE
QUESTION ACTIONS SCORE
at least daily 10 10 at least weekly 5
How often do you ensure that your Water Chemical Treatment System is functioning properly?
WT1
less than weekly 0
every 5‐10 years 10 10 every 1‐5 years 5
How often do you NEED to clean Fireside or Waterside deposits in your Boiler?
WT2
once/year or more 0
SSST ‐ 18
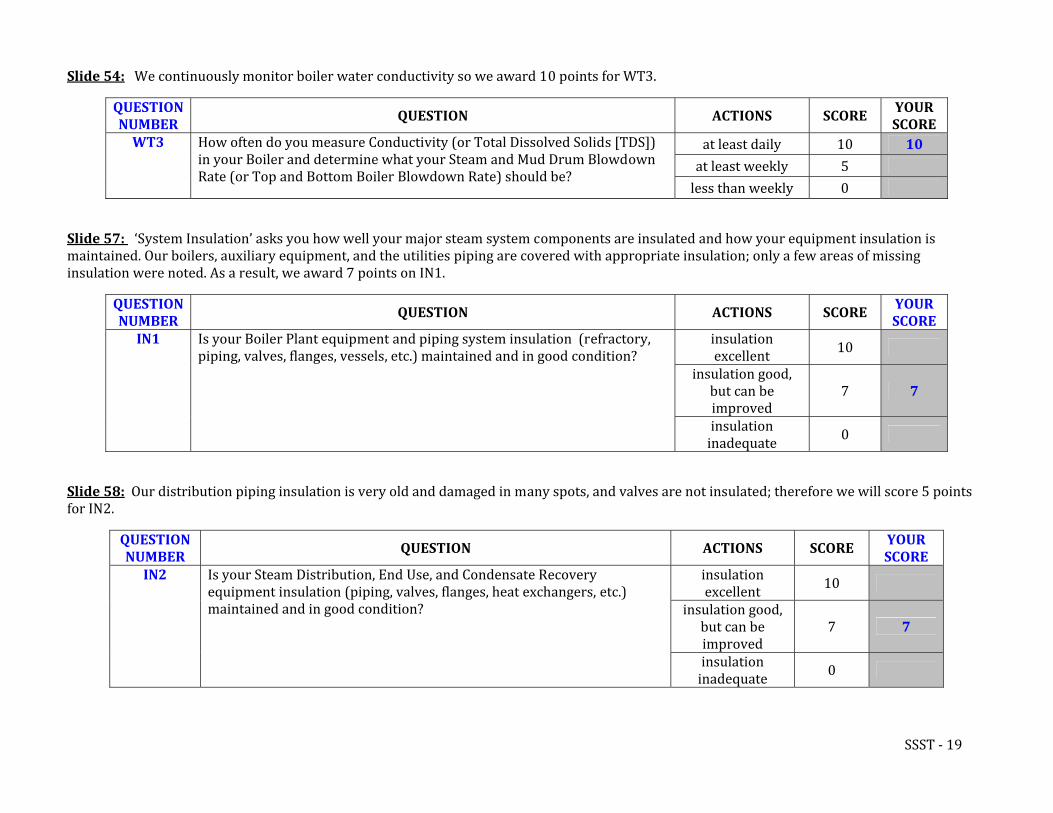
Slide 54: We continuously monitor boiler water conductivity so we award 10 points for WT3.
QUESTION NUMBER
YOUR SCORE
QUESTION ACTIONS SCORE
at least daily 10 10
at least weekly 5
How often do you measure Conductivity (or Total Dissolved Solids [TDS]) in your Boiler and determine what your Steam and Mud Drum Blowdown Rate (or Top and Bottom Boiler Blowdown Rate) should be?
WT3
less than weekly 0
Slide 57: ‘System Insulation’ asks you how well your major steam system components are insulated and how your equipment insulation is maintained. Our boilers, auxiliary equipment, and the utilities piping are covered with appropriate insulation; only a few areas of missing insulation were noted. As a result, we award 7 points on IN1.
QUESTION NUMBER
YOUR SCORE
QUESTION ACTIONS SCORE
insulation excellent 10
insulation good, but can be improved
7 7
Is your Boiler Plant equipment and piping system insulation (refractory, piping, valves, flanges, vessels, etc.) maintained and in good condition?
IN1
insulation inadequate 0
Slide 58: Our distribution piping insulation is very old and damaged in many spots, and valves are not insulated; therefore we will score 5 points for IN2.
QUESTION NUMBER
YOUR SCORE
QUESTION ACTIONS SCORE
insulation excellent 10
insulation good, but can be improved
7 7
Is your Steam Distribution, End Use, and Condensate Recovery equipment insulation (piping, valves, flanges, heat exchangers, etc.) maintained and in good condition?
IN2
insulation inadequate 0
SSST ‐ 19
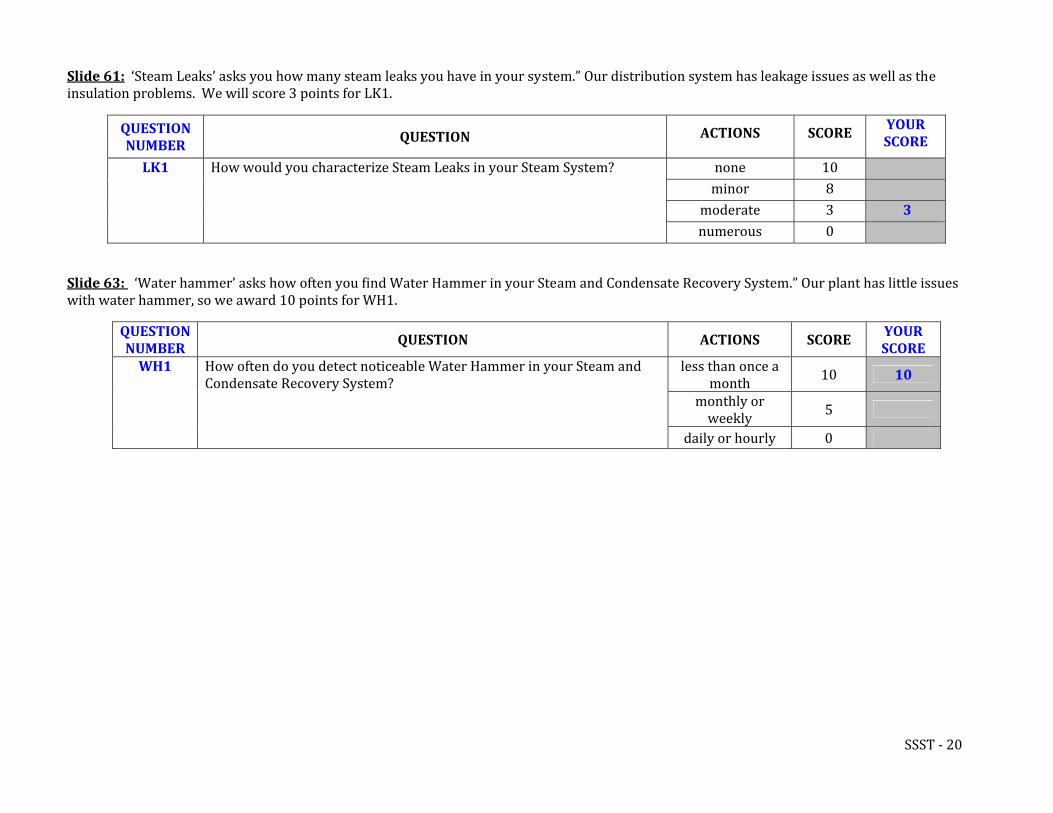
Slide 61: ‘Steam Leaks’ asks you how many steam leaks you have in your system.” Our distribution system has leakage issues as well as the insulation problems. We will score 3 points for LK1.
YOUR SCORE
QUESTION NUMBER
ACTIONS SCORE
Slide 63: ‘Water hammer’ asks how often you find Water Hammer in your Steam and Condensate as little issues with water hammer, so we award 10 points for WH1.
Recovery System.” Our plant h
QUESTION NUMBER
QUESTION ACTIONS SCORE YOUR SCORE
less than once a month 10 10
monthly or weekly 5
WH1 How often do you detect noticeable Water Hammer in your Steam and Condensate Recovery System?
daily or hourly 0
QUESTION
none 10 minor 8
moderate 3 3
How would you characterize Steam Leaks in your Steam System? LK1
numerous 0
SSST ‐ 20
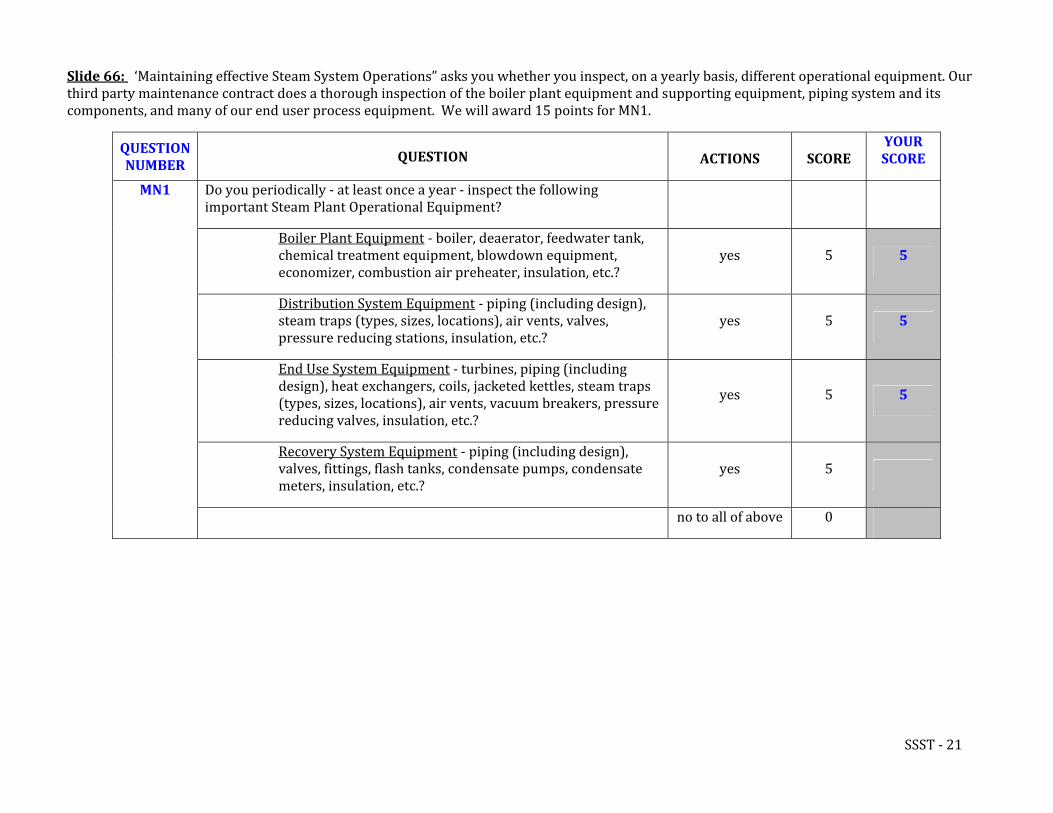
Slide 66: ‘Maintaining effective Steam System Operations” asks you whether you inspect, on a yearly basis, different operational equipment. Our third party maintenance contract does a thorough inspection of the boiler plant equipment and supporting equipment, piping system and its components, and many of our end user process equipment. We will award 15 points for MN1.
YOUR SCORE
QUESTION NUMBER
QUESTION ACTIONS SCORE
Do you periodically ‐ at least once a year ‐ inspect the following important Steam Plant Operational Equipment? MN1
Boiler Plant Equipment ‐ boiler, deaerator, feedwater tank, chemical treatment equipment, blowdown equipment, economizer, combustion air preheater, insulation, etc.?
yes 5 5
Distribution System Equipment ‐ piping (including design), steam traps (types, sizes, locations), air vents, valves, pressure reducing stations, insulation, etc.?
yes 5 5
End Use System Equipment ‐ turbines, piping (including design), heat exchangers, coils, jacketed kettles, steam traps (types, sizes, locations), air vents, vacuum breakers, pressure reducing valves, insulation, etc.?
yes 5 5
Recovery System Equipment ‐ piping (including design), valves, fittings, flash tanks, condensate pumps, condensate meters, insulation, etc.?
yes 5
no to all of above 0
SSST ‐ 21
Begin Tab 5 – Boiler Plant Operating Practices
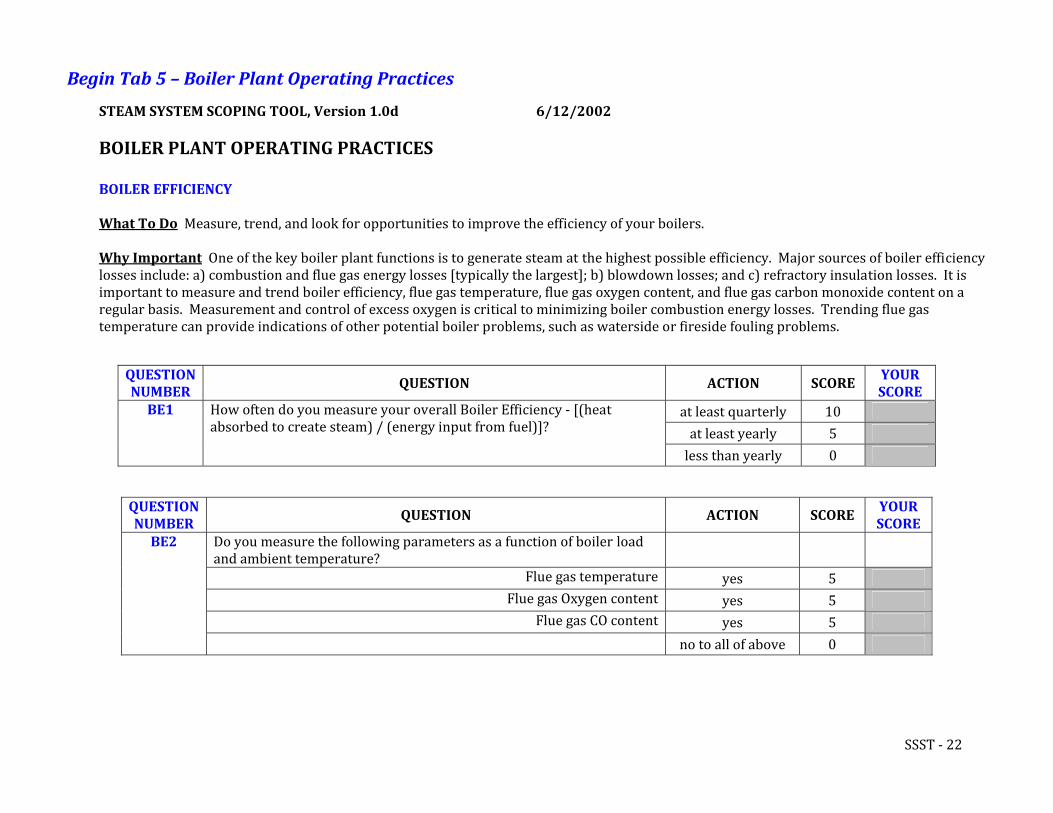
STEAM SYSTEM SCOPING TOOL, Version 1.0d 6/12/2002 BOILER PLANT OPERATING PRACTICES BOILER EFFICIENCY What To Do Measure, trend, and look for opportunities to improve the efficiency of your boilers. Why Important One of the key boiler plant functions is to generate steam at the highest possible efficiency. Major sources of boiler efficiency losses include: a) combustion and flue gas energy losses [typically the largest]; b) blowdown losses; and c) refractory insulation losses. It is important to measure and trend boiler efficiency, flue gas temperature, flue gas oxygen content, and flue gas carbon monoxide content on a regular basis. Measurement and control of excess oxygen is critical to minimizing boiler combustion energy losses. Trending flue gas temperature can provide indications of other potential boiler problems, such as waterside or fireside fouling problems.
QUESTION NUMBER
YOUR SCORE
QUESTION ACTION SCORE
at least quarterly 10
at least yearly 5
How often do you measure your overall Boiler Efficiency ‐ [(heat absorbed to create steam) / (energy input from fuel)]?
BE1
less than yearly 0
QUESTION NUMBER
YOUR
QUESTION ACTION SCORE SCORE
Do you measure the following parameters as a function of boiler load and ambient temperature?
BE2
Flue gas temperature yes 5 Flue gas Oxygen content yes 5
Flue gas CO content yes 5 no to all of above 0
SSST ‐ 22
QUESTION NUMBER
YOUR SCORE
QUESTION ACTION SCORE
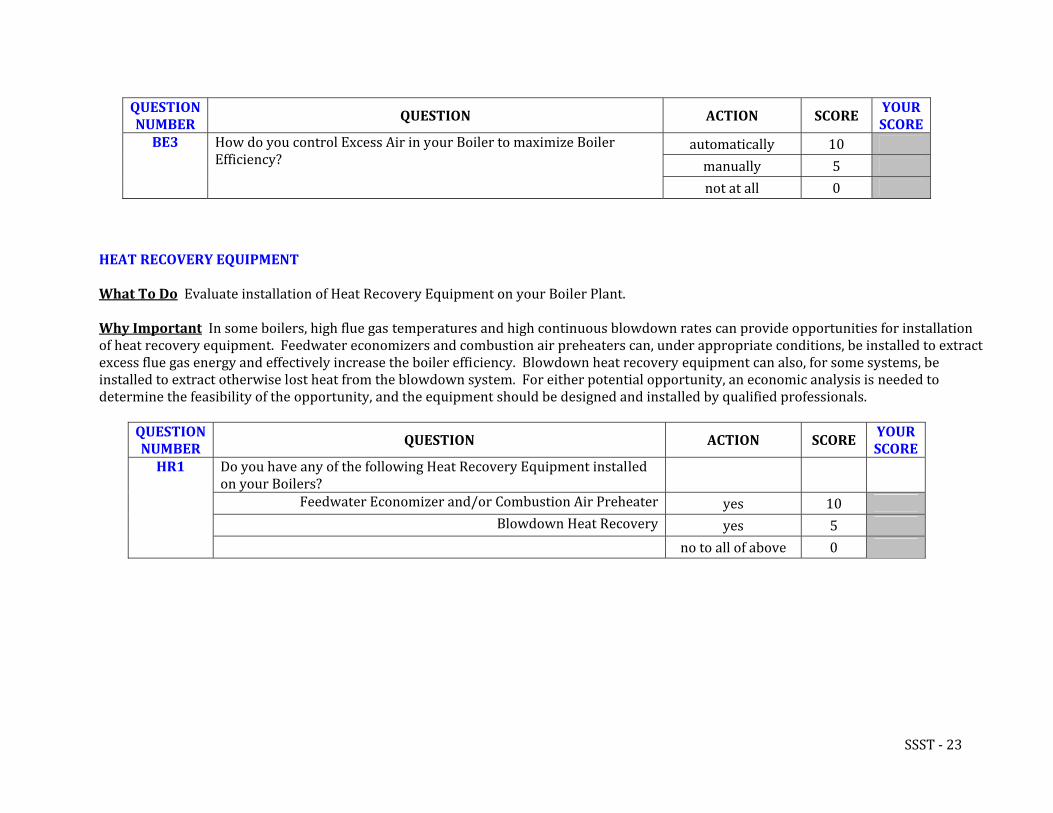
automatically 10
manually 5
How do you control Excess Air in your Boiler to maximize Boiler Efficiency?
BE3
not at all 0
HEAT RECOVERY EQUIPMENT What To Do Evaluate installation of Heat Recovery Equipment on your Boiler Plant. Why Important In some boilers, high flue gas temperatures and high continuous blowdown rates can provide opportunities for installation of heat recovery equipment. Feedwater economizers and combustion air preheaters can, under appropriate conditions, be installed to extract excess flue gas energy and effectively increase the boiler efficiency. Blowdown heat recovery equipment can also, for some systems, be installed to extract otherwise lost heat from the blowdown system. For either potential opportunity, an economic analysis is needed to determine the feasibility of the opportunity, and the equipment should be designed and installed by qualified professionals.
QUESTION NUMBER
YOUR SCORE
QUESTION ACTION SCORE
Do you have any of the following Heat Recovery Equipment installed on your Boilers?
HR1
Feedwater Economizer and/or Combustion Air Preheater yes 10 Blowdown Heat Recovery yes 5
no to all of above 0
SSST ‐ 23
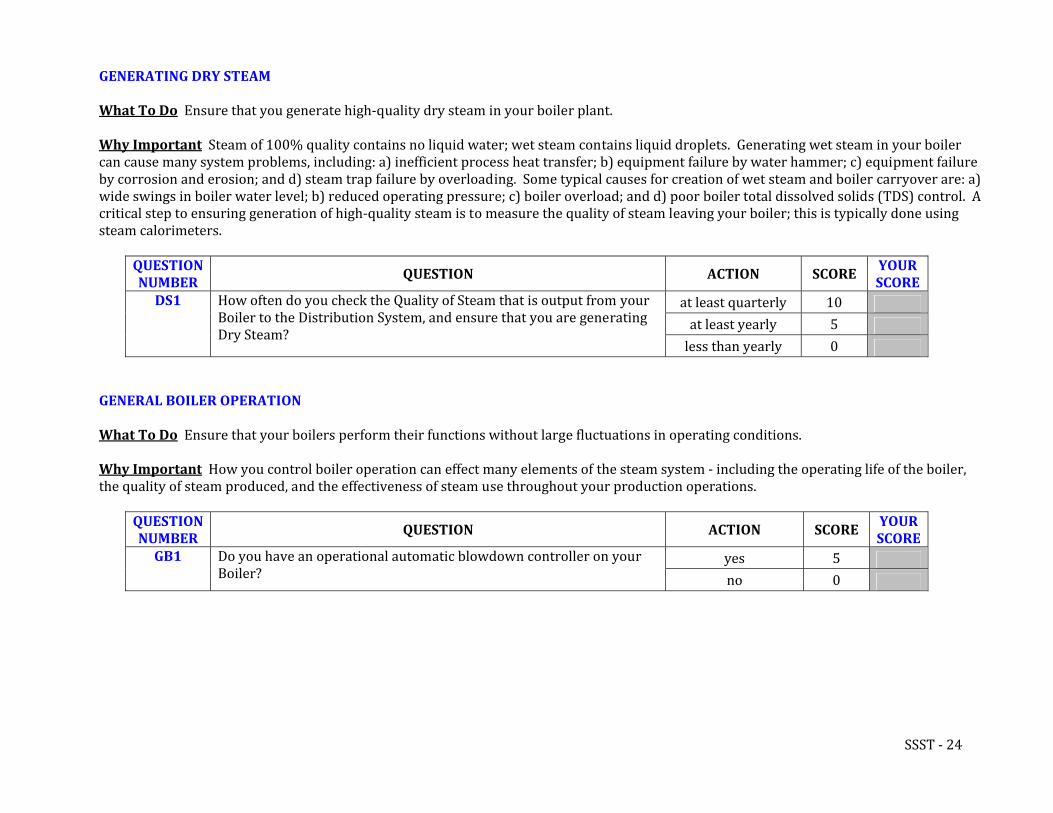
GENERATING DRY STEAM What To Do Ensure that you generate high‐quality dry steam in your boiler plant. Why Important Steam of 100% quality contains no liquid water; wet steam contains liquid droplets. Generating wet steam in your boiler can cause many system problems, including: a) inefficient process heat transfer; b) equipment failure by water hammer; c) equipment failure by corrosion and erosion; and d) steam trap failure by overloading. Some typical causes for creation of wet steam and boiler carryover are: a) wide swings in boiler water level; b) reduced operating pressure; c) boiler overload; and d) poor boiler total dissolved solids (TDS) control. A critical step to ensuring generation of high‐quality steam is to measure the quality of steam leaving your boiler; this is typically done using steam calorimeters.
QUESTION NUMBER
YOUR SCORE
QUESTION ACTION SCORE
at least quarterly 10 at least yearly 5
How often do you check the Quality of Steam that is output from your Boiler to the Distribution System, and ensure that you are generating Dry Steam?
DS1
less than yearly 0
GENERAL BOILER OPERATION What To Do Ensure that your boilers perform their functions without large fluctuations in operating conditions. Why Important How you control boiler operation can effect many elements of the steam system ‐ including the operating life of the boiler, the quality of steam produced, and the effectiveness of steam use throughout your production operations.
QUESTION NUMBER
YOUR SCORE
QUESTION AC N TIO SCORE
yes 5 Do you have an operational automatic blowdown controller on your Boiler? no 0
GB1
SSST ‐ 24
QUESTION NUMBER
YOUR SCORE
QUESTION ACTION SCORE
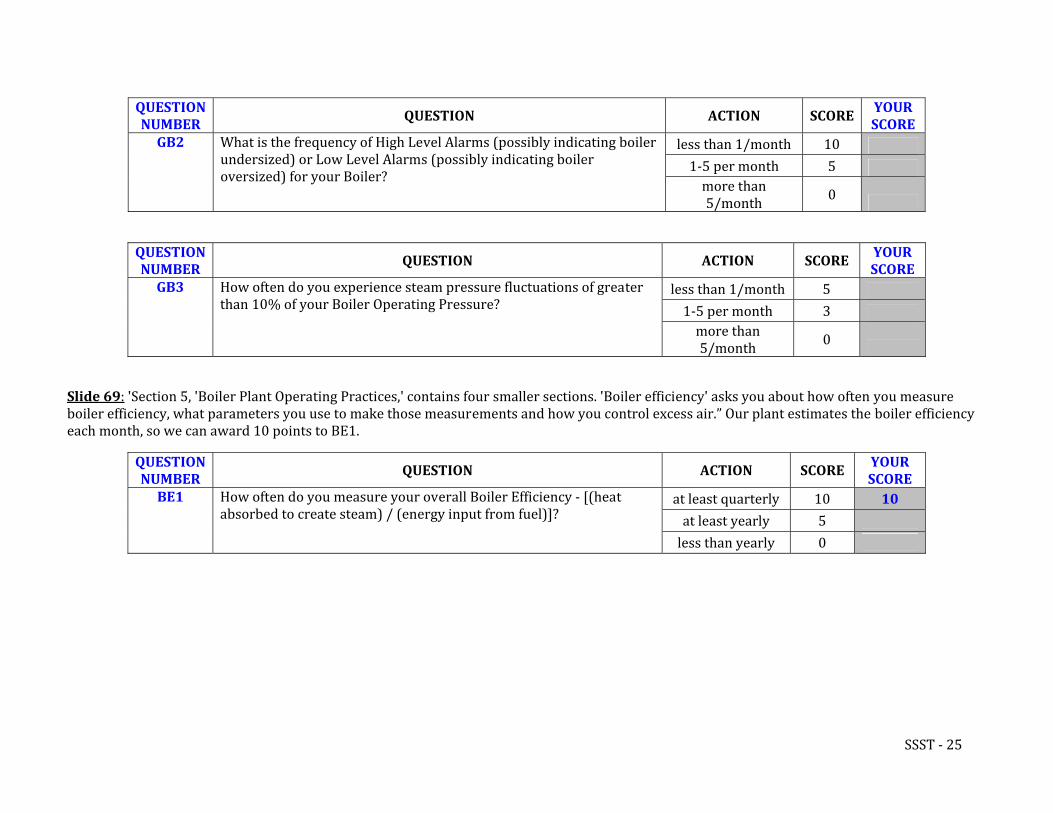
less than 1/month 10 1‐5 per month 5
What is the frequency of High Level Alarms (possibly indicating boiler undersized) or Low Level Alarms (possibly indicating boiler oversized) for your Boiler?
GB2
more than 5/month 0
QUESTION NUMBER
YOUR SCORE
QUESTION ACTION SCORE
less than 1/month 5 1‐5 per month 3
How often do you experience steam pressure fluctuations of greater than 10% of your Boiler Operating Pressure?
GB3
more than 5/month 0
Slide 69: 'Section 5, 'Boiler Plant Operating Practices,' contains four smaller sections. 'Boiler efficiency' asks you about how often you measure boiler efficiency, what parameters you use to make those measurements and how you control excess air.” Our plant estimates the boiler efficiency each month, so we can award 10 points to BE1.
QUESTION NUMBER
YOUR SCORE
QUESTION ACTION SCORE
at least quarterly 10 10
at least yearly 5
How often do you measure your overall Boiler Efficiency ‐ [(heat absorbed to create steam) / (energy input from fuel)]?
BE1
less than yearly 0
SSST ‐ 25
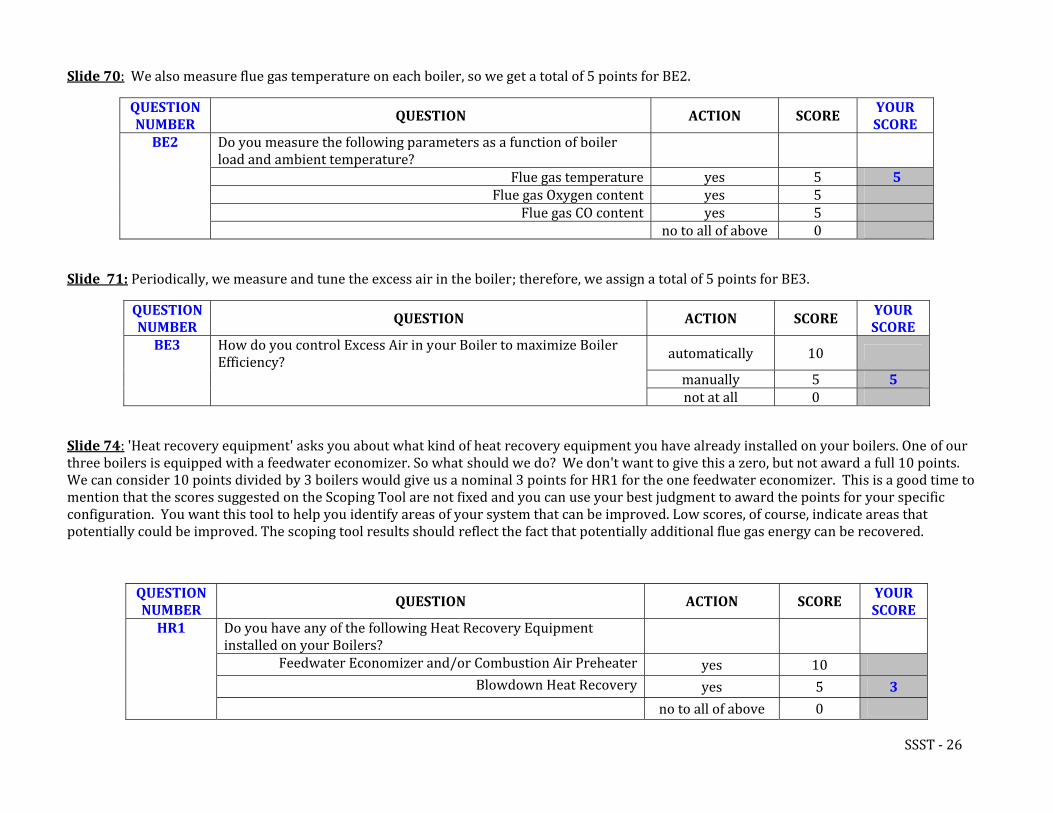
Slide 70: We also measure flue gas temperature on each boiler, so we get a total of 5 points for BE2.
QUESTION NUMBER
YOUR
QUESTION ACTION SCORE SCORE
Do you measure the following parameters as a function of boiler load and ambient temperature?
BE2
Flue gas temperature yes 5 5 Flue gas Oxygen content yes 5
Flue gas CO content yes 5 no to all of above 0
Slide 71: Periodically, we measure and tune the excess air in the boiler; therefore, we assign a total of 5 points for BE3.
QUESTION NUMBER
YOUR SCORE
QUESTION ACTION SCORE
automatically 10
manually 5 5
How do you control Excess Air in your Boiler to maximize Boiler Efficiency?
BE3
not at all 0
Slide 74: 'Heat recovery equipment' asks you about what kind of heat recovery equipment you have already installed on your boilers. One of our three boilers is equipped with a feedwater economizer. So what should we do? We don't want to give this a zero, but not award a full 10 points. We can consider 10 points divided by 3 boilers would give us a nominal 3 points for HR1 for the one feedwater economizer. This is a good time to mention that the scores suggested on the Scoping Tool are not fixed and you can use your best judgment to award the points for your specific configuration. You want this tool to help you identify areas of your system that can be improved. Low scores, of course, indicate areas that potentially could be improved. The scoping tool results should reflect the fact that potentially additional flue gas energy can be recovered.
QUESTION NUMBER
YOUR SCORE
QUESTION ACTION SCORE
Do you have any of the following Heat Recovery Equipment installed on your Boilers?
HR1
Feedwater Economizer and/or Combustion Air Preheater yes 10 Blowdown Heat Recovery yes 5 3
no to all of above 0
SSST ‐ 26
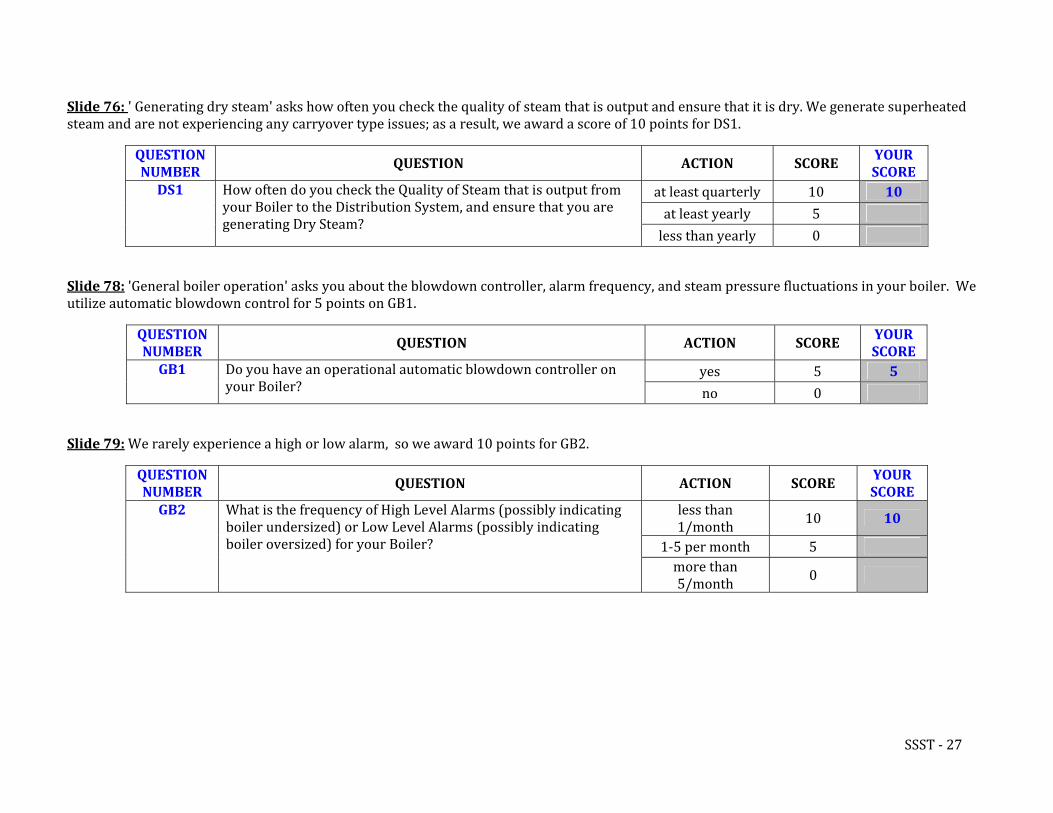
Slide 76: ' Generating dry steam' asks how often you check the quality of steam that is output and ensure that it is dry. We generate superheated steam and are not experiencing any carryover type issues; as a result, we award a score of 10 points for DS1.
QUESTION NUMBER
YOUR SCORE
QUESTION ACTION SCORE
at least quarterly 10 10
at least yearly 5
How often do you check the Quality of Steam that is output from your Boiler to the Distribution System, and ensure that you are generating Dry Steam?
DS1
less than yearly 0
Slide 78: 'General boiler operation' asks you about the blowdown controller, alarm frequency, and steam pressure fluctuations in your boiler. We utilize automatic blowdown control for 5 points on GB1.
QUESTION NUMBER
YOUR SCORE
QUESTION AC N TIO SCORE
yes 5 5 Do you have an operational automatic blowdown controller on your Boiler? no 0
GB1
Slide 79: We rarely experience a high or low alarm, so we award 10 points for GB2.
QUESTION NUMBER
YOUR SCORE QUESTION ACTION SCORE
less than 1/month 10 10
1‐5 per month 5
What is the frequency of High Level Alarms (possibly indicating boiler undersized) or Low Level Alarms (possibly indicating boiler oversized) for your Boiler?
GB2
more than 5/month 0
SSST ‐ 27
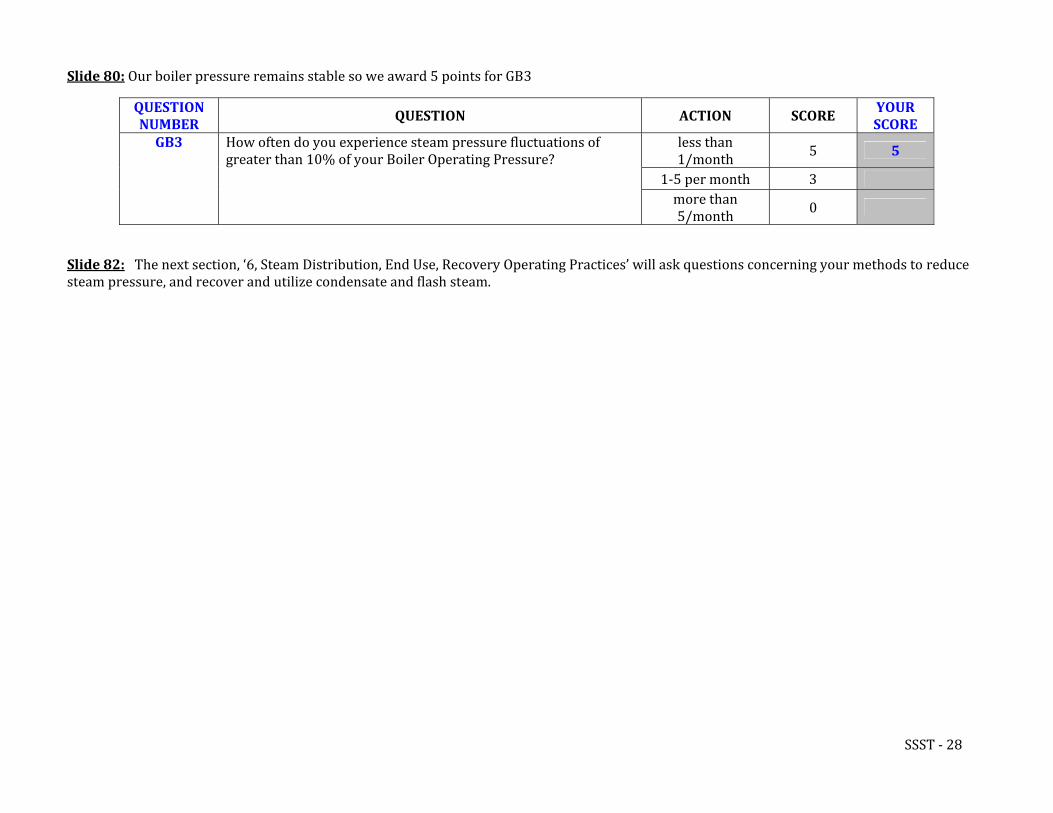
Slide 80: Our boiler pressure remains stable so we award 5 points for GB3
QUESTION NUMBER
YOUR SCORE
QUESTION ACTION SCORE
less than 1/month 5 5
1‐5 per month 3
How often do you experience steam pressure fluctuations of greater than 10% of your Boiler Operating Pressure?
GB3
more than 5/month 0
Slide 82: The next section, ‘6, Steam Distribution, End Use, Recovery Operating Practices’ will ask questions concerning your methods to reduce steam pressure, and recover and utilize condensate and flash steam.
SSST ‐ 28
Begin Tab 6 – Steam Distribution, End Use, Recovery, Operating Practices
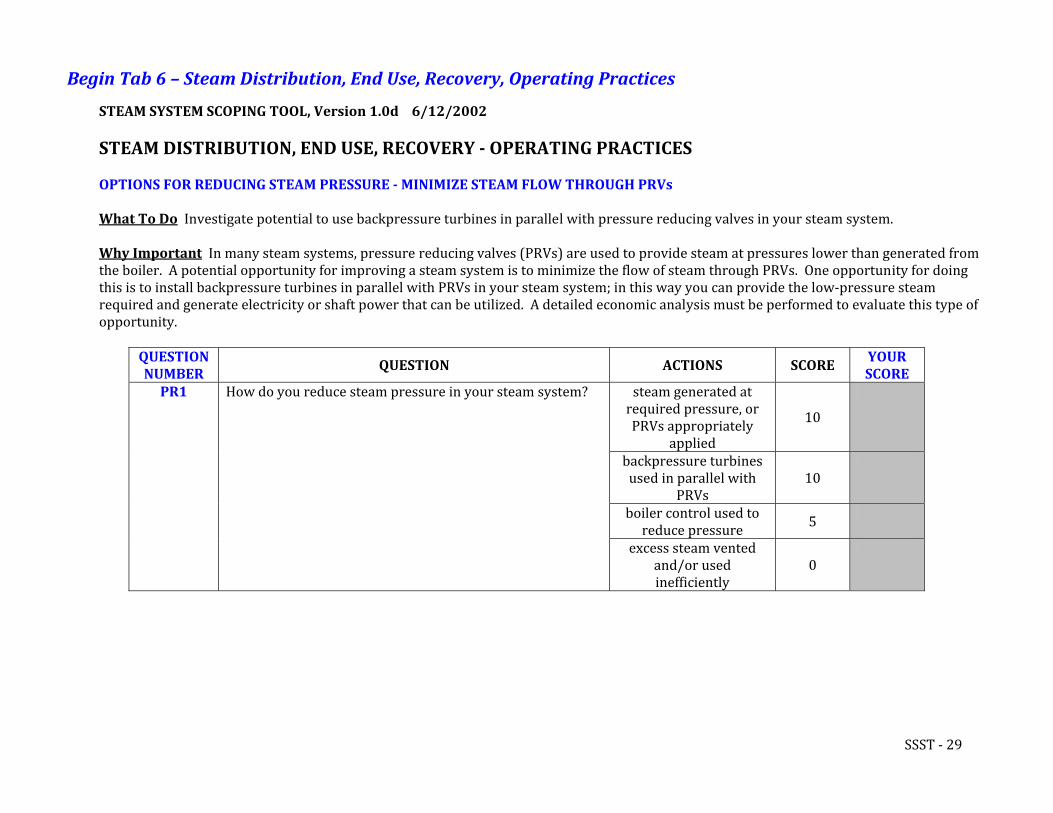
STEAM SYSTEM SCOPING TOOL, Version 1.0d 6/12/2002 STEAM DISTRIBUTION, END USE, RECOVERY OPERATING PRACTICES OPTIONS FOR REDUCING STEAM PRESSURE MINIMIZE STEAM FLOW THROUGH PRVs What To Do Investigate potential to use backpressure turbines in parallel with pressure reducing valves in your steam system. Why Important In many steam systems, pressure reducing valves (PRVs) are used to provide steam at pressures lower than generated from the boiler. A potential opportunity for improving a steam system is to minimize the flow of steam through PRVs. One opportunity for doing this is to install backpressure turbines in parallel with PRVs in your steam system; in this way you can provide the low‐pressure steam required and generate electricity or shaft power that can be utilized. A detailed economic analysis must be performed to evaluate this type of opportunity.
QUESTION NUMBER
YOUR SCORE
QUESTION ACTIONS SCORE
steam generated at required pressure, or PRVs appropriately
applied
10
How do you reduce steam pressure in your steam system? PR1
backpressure turbines used in parallel with
PRVs 10
boiler control used to reduce pressure 5
excess steam vented and/or used inefficiently
0
SSST ‐ 29
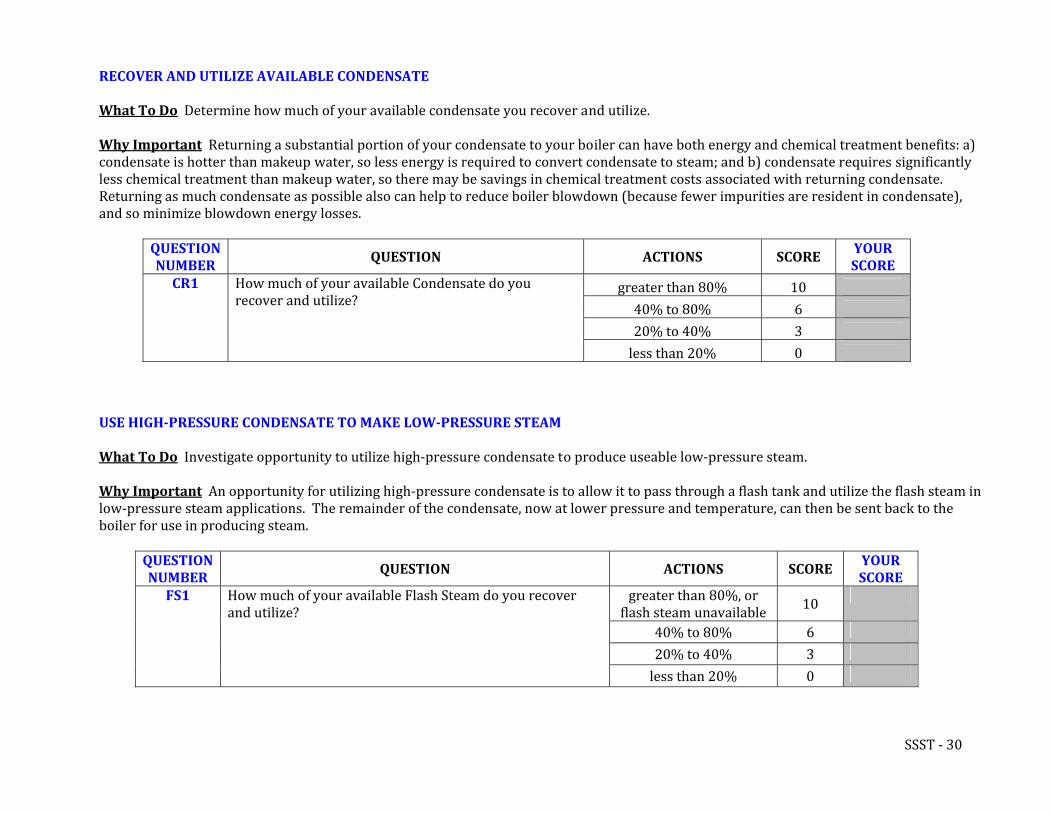
RECOVER AND UTILIZE AVAILABLE CONDENSATE What To Do Determine how much of your available condensate you recover and utilize. Why Important Returning a substantial portion of your condensate to your boiler can have both energy and chemical treatment benefits: a) condensate is hotter than makeup water, so less energy is required to convert condensate to steam; and b) condensate requires significantly less chemical treatment than makeup water, so there may be savings in chemical treatment costs associated with returning condensate. Returning as much condensate as possible also can help to reduce boiler blowdown (because fewer impurities are resident in condensate), and so minimize blowdown energy losses.
QUESTION NUMBER
YOUR SCORE
USE HIGHPRESSURE CONDENSATE TO MAKE LOWPRESSURE STEAM What To Do Investigate opportunity to utilize high‐pressure condensate to produce useable low‐pressure steam. Why Important An opportunity for utilizing high‐pressure condensate is to allow it to pass through a flash tank and utilize the flash steam in low‐pressure steam applications. The remainder of the condensate, now at lower pressure and temperature, can then be sent back to the boiler for use in producing steam.
QUESTION NUMBER
QUESTION ACTIONS SCORE YOUR SCORE
greater than 80%, or flash steam unavailable 10
40% to 80% 6
20% to 40% 3
FS1 How much of your available Flash Steam do you recover and utilize?
less than 20% 0
QUESTION ACTIONS SCORE
greater than 80% 10
40% to 80% 6
20% to 40% 3
How much of your available Condensate do you recover and utilize?
CR1
less than 20% 0
SSST ‐ 30
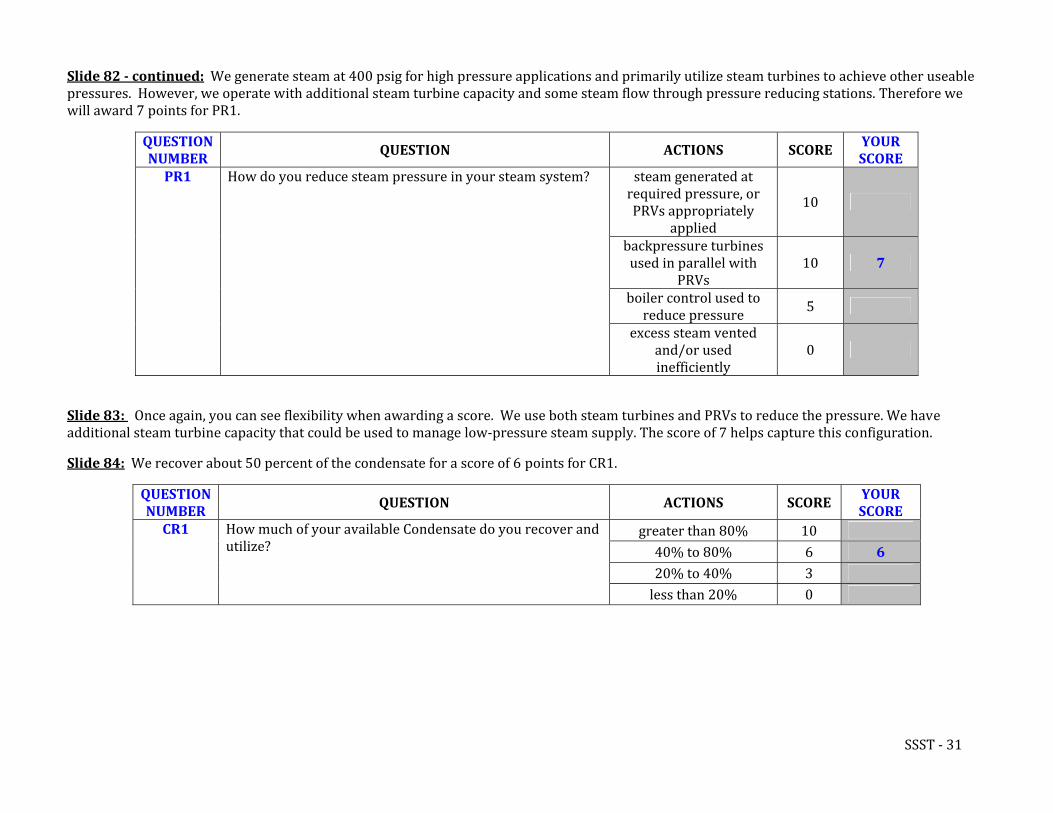
Slide 82 continued: We generate steam at 400 psig for high pressure applications and primarily utilize steam turbines to achieve other useable pressures. However, we operate with additional steam turbine capacity and some steam flow through pressure reducing stations. Therefore we will award 7 points for PR1.
QUESTION NUMBER
YOUR SCORE
QUESTION ACTIONS SCORE
steam generated at required pressure, or PRVs appropriately
applied
10
How do you reduce steam pressure in your steam system? PR1
backpressure turbines used in parallel with
PRVs 10 7
boiler control used to reduce pressure 5
excess steam vented and/or used inefficiently
0
Slide 83: Once again, you can see flexibility when awarding a score. We use both steam turbines and PRVs to reduce the pressure. We have additional steam turbine capacity that could be used to manage low‐pressure steam supply. The score of 7 helps capture this configuration.
Slide 84: We recover about 50 percent of the condensate for a score of 6 points for CR1.
QUESTION NUMBER
YOUR SCORE
QUESTION ACTIONS SCORE
greater than 80% 10 40% to 80% 6 6 20% to 40% 3
How much of your available Condensate do you recover and utilize?
CR1
less than 20% 0
SSST ‐ 31

Slide 85: We recover about 50 percent of our flash steam, so we score 6 points for FS1.
YOUR SCORE
QUESTION NUMBER
ACTIONS SCORE QUESTION
greater than 80%, or flash steam unavailable 10
40% to 80% 6 6
How much of your available Flash Steam do you recover and utilize?
FS1
20% to 40% 3 less than 20% 0
Begin Tab 7 – Summary Results
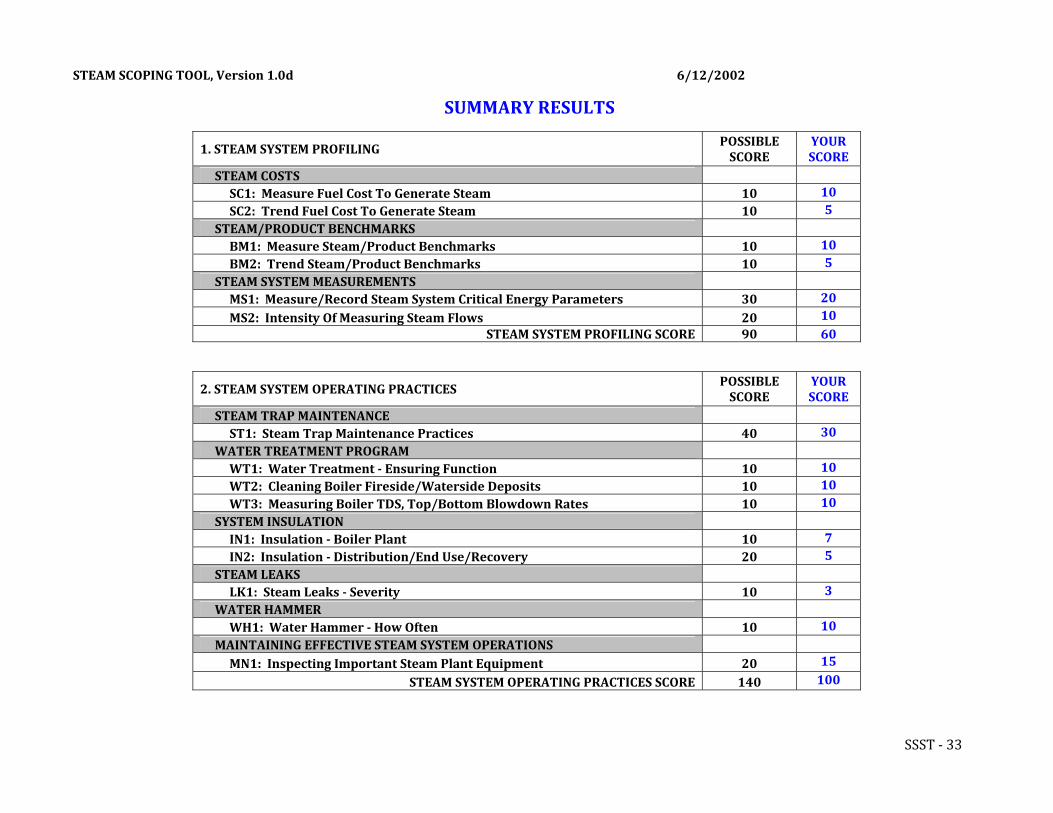
Slide 88: The ‘Summary Results’ section, ‘7.,’ shows your total section score out of a possible maximum BestPractices score for each section of the scoping tool. Again, the more you measure, monitor, trend and benchmark, the higher your score. Your score is reported for each question, then summarized by area, from the profiling and operating practices sections. From the comparison, you can see which area or areas could be improved upon. Enter the date you completed this SSST so it can be compared to future evaluations of the system.
SSST ‐ 32
STEAM SCOPING TOOL, Version 1.0d 6/12/2002
SUMMARY RESULTS
POSSIBLE SCORE
YOUR SCORE
1. STEAM SYSTEM PROFILING
STEAM COSTS 10 SC1: Measure Fuel Cost To Generate Steam 10 5 SC2: Trend Fuel Cost To Generate Steam 10
STEAM/PRODUCT BENCHMARKS 10 BM1: Measure Steam/Product Benchmarks 10 5 BM2: Trend Steam/Product Benchmarks 10
STEAM SYSTEM MEASUREMENTS 20 MS1: Measure/Record Steam System Critical Energy Parameters 30 10 MS2: Intensity Of Measuring Steam Flows 20
STEAM SYSTEM PROFILING SCORE 90 60
POSSIBLE SCORE
YOUR SCORE 2. STEAM SYSTEM OPERATING PRACTICES
STEAM TRAP MAINTENANCE 30 ST1: Steam Trap Maintenance Practices 40
WATER TREATMENT PROGRAM 10 WT1: Water Treatment Ensuring Function 10 10 WT2: Cleaning Boiler Fireside/Waterside Deposits 10 10 WT3: Measuring Boiler TDS, Top/Bottom Blowdown Rates 10
SYSTEM INSULATION 7 IN1: Insulation Boiler Plant 10 5 IN2: Insulation Distribution/End Use/Recovery 20 STEAM LEAKS 3 LK1: Steam Leaks Severity 10
WATER HAMMER 10 WH1: Water Hammer How Often 10
MAINTAINING EFFECTIVE STEAM SYSTEM OPERATIONS 15 MN1: Inspecting Important Steam Plant Equipment 20 100 STEAM SYSTEM OPERATING PRACTICES SCORE 140
SSST ‐ 33
POSSIBLE SCORE
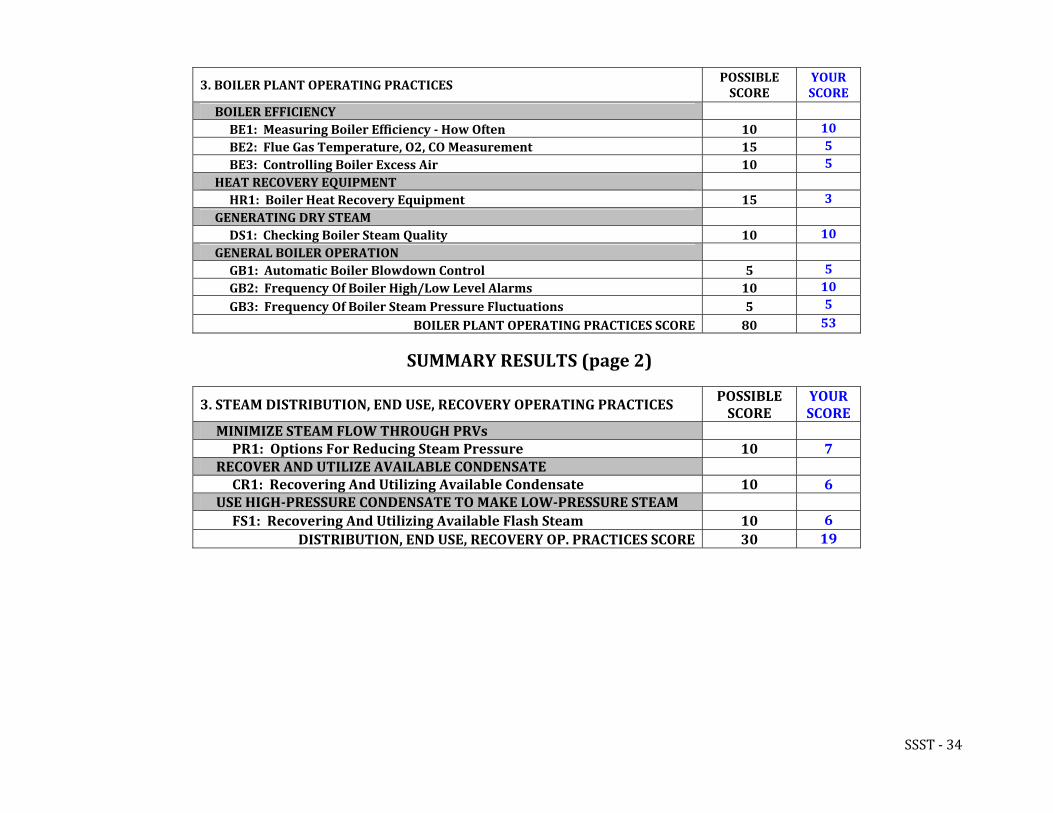
YOUR SCORE 3. BOILER PLANT OPERATING PRACTICES
BOILER EFFICIENCY 10 BE1: Measuring Boiler Efficiency How Often 10 5 BE2: Flue Gas Temperature, O2, CO Measurement 15 5 BE3: Controlling Boiler Excess Air 10
HEAT RECOVERY EQUIPMENT 3 HR1: Boiler Heat Recovery Equipment 15
GENERATING DRY STEAM 10 DS1: Checking Boiler Steam Quality 10
GENERAL BOILER OPERATION 5 GB1: Automatic Boiler Blowdown Control 5 10 GB2: Frequency Of Boiler High/Low Level Alarms 10 5 GB3: Frequency Of Boiler Steam Pressure Fluctuations 5 53 BOILER PLANT OPERATING PRACTICES SCORE 80
SUMMARY RESULTS (page 2)
POSSIBLE SCORE
YOUR SCORE
3. STEAM DISTRIBUTION, END USE, RECOVERY OPERATING PRACTICES
MINIMIZE STEAM FLOW THROUGH PRVs PR1: Options For Reducing Steam Pressure 10 7 RECOVER AND UTILIZE AVAILABLE CONDENSATE CR1: Recovering And Utilizing Available Condensate 10 6 USE HIGHPRESSURE CONDENSATE TO MAKE LOWPRESSURE STEAM
6 FS1: Recovering And Utilizing Available Flash Steam 10 19 DISTRIBUTION, END USE, RECOVERY OP. PRACTICES SCORE 30
SSST ‐ 34
POSSIBLE SCORE
YOUR SCORE SCOPING TOOL RESULTS
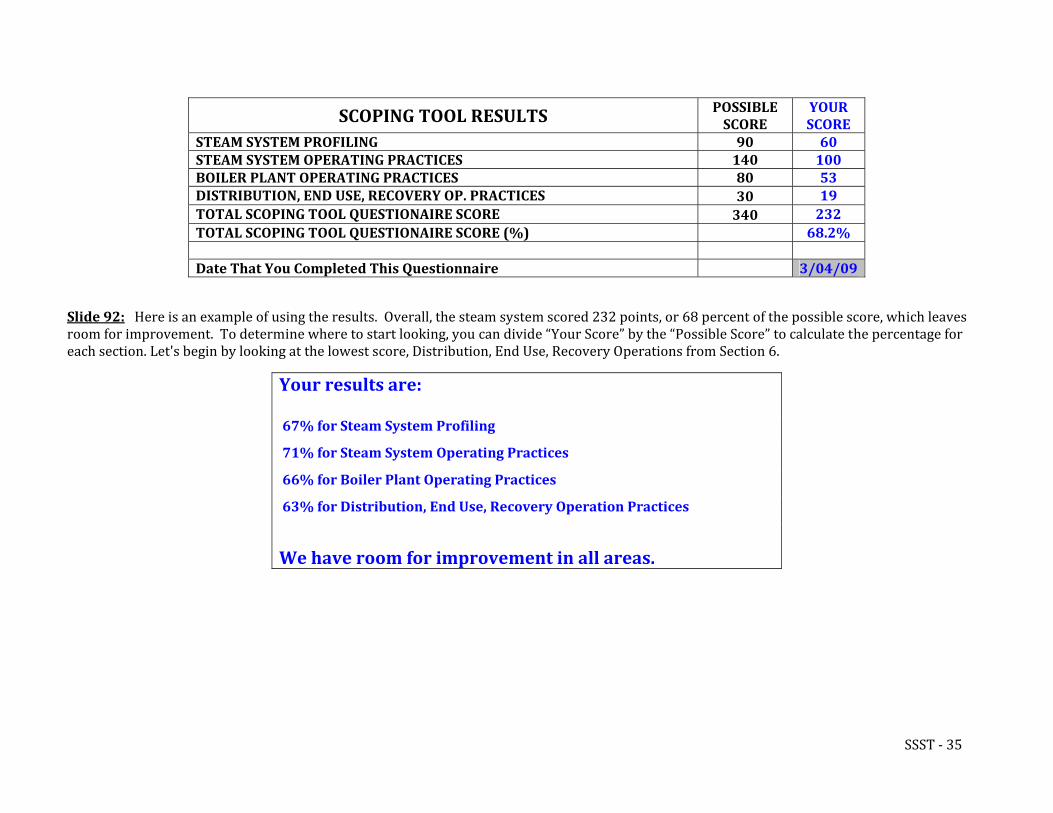
STEAM SYSTEM PROFILING 90 60 STEAM SYSTEM OPERATING PRACTICES 140 100 BOILER PLANT OPERATING PRACTICES 80 53 DISTRIBUTION, END USE, RECOVERY OP. PRACTICES 19 30 TOTAL SCOPING TOOL QUESTIONAIRE SCORE 232 340 TOTAL SCOPING TOOL QUESTIONAIRE SCORE (%) 68.2% Date That You Completed This Questionnaire 3/04/09
Slide 92: Here is an example of using the results. Overall, the steam system scored 232 points, or 68 percent of the possible score, which leaves room for improvement. To determine where to start looking, you can divide “Your Score” by the “Possible Score” to calculate the percentage for each section. Let's begin by looking at the lowest score, Distribution, End Use, Recovery Operations from Section 6.
Your results are: 67% for Steam System Profiling
71% for Steam System Operating Practices
66% for Boiler Plant Operating Practices
63% for Distribution, End Use, Recovery Operation Practices
We have room for improvement in all areas.
SSST ‐ 35

Slide 95: Where did you score less than the maximum score for a question? You utilize a combination of turbines and PRV, but perhaps additional turbine capacity could be incorporated to minimize the steam flow through pressure reducing valves.
QUESTION NUMBER
YOUR SCORE
QUESTION ACTIONS SCORE
steam generated at required pressure, or PRVs appropriately applied
10 How do you reduce steam pressure in your steam system? PR1
backpressure turbines used in parallel with PRVs 10 7
boiler control used to reduce pressure 5
excess steam vented and/or used inefficiently 0
Slide 97: You could attempt to recover the remaining condensate and/or utilize more flash steam recovery for 8 more points for CR1 and FS1, respectively.
Additional turbine capacity for improvement!
QUESTION NUMBER
YOUR SCORE
QUESTION ACTIONS SCORE
greater than 80% 10 40% to 80% 6 6 20% to 40% 3
How much of your available Condensate do you recover and utilize?
CR1
less than 20% 0
YOUR SCORE
QUESTION NUMBER
ACTIONS SCORE QUESTION
greater than 80%, or flash 10 40% to 80% 6 6 20% to 40% 3
How much of your available Flash Steam do you recover and utilize?
FS1
less than 20% 0
SSST ‐ 36
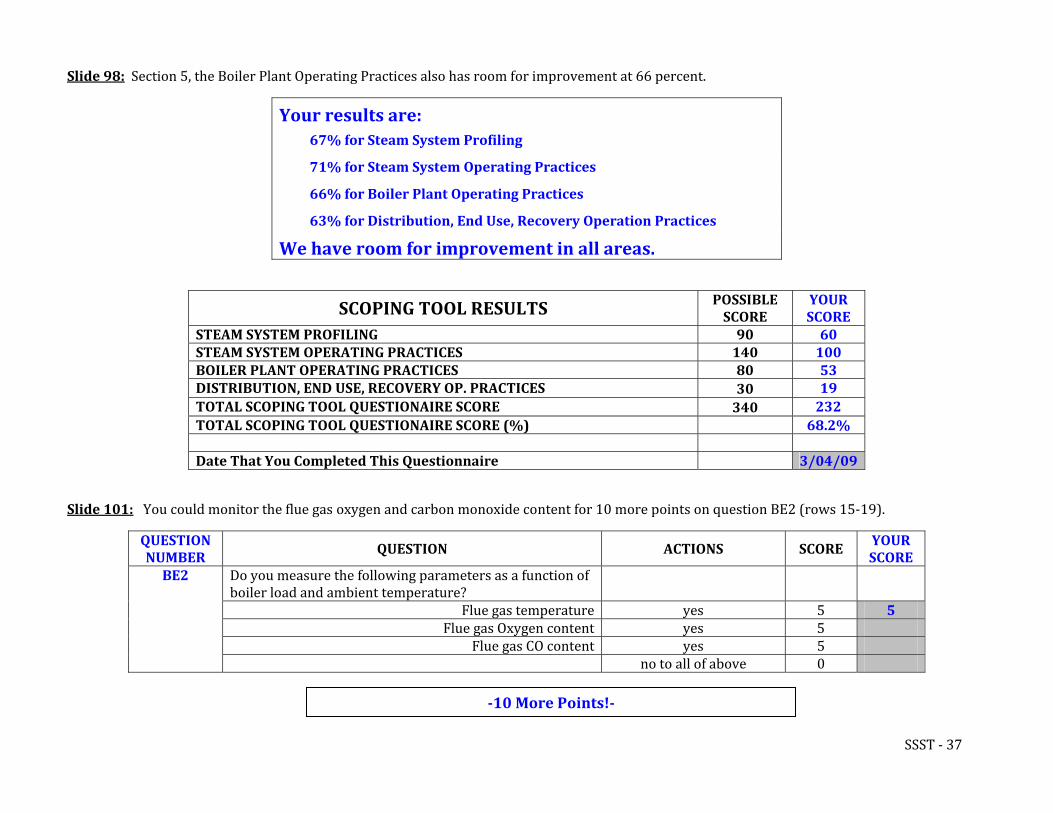
Slide 98: Section 5, the Boiler Plant Operating Practices also has room for improvement at 66 percent.
Your results are: 67% for Steam System Profiling
71% for Steam System Operating Practices
66% for Boiler Plant Operating Practices
63% for Distribution, End Use, Recovery Operation Practices
We have room for improvement in all areas.
POSSIBLE SCORE
YOUR SCORE SCOPING TOOL RESULTS
STEAM SYSTEM PROFILING 90 60 STEAM SYSTEM OPERATING PRACTICES 140 100 BOILER PLANT OPERATING PRACTICES 80 53 DISTRIBUTION, END USE, RECOVERY OP. PRACTICES 19 30 TOTAL SCOPING TOOL QUESTIONAIRE SCORE 232 340 TOTAL SCOPING TOOL QUESTIONAIRE SCORE (%) 68.2%
Date That You Completed This Questionnaire 3/04/09
Slide 101: You could monitor the flue gas oxygen and carbon monoxide content for 10 more points on question BE2 (rows 15‐19).
QUESTION NUMBER
YOUR SCORE
QUESTION ACTIONS SCORE
Do you measure the following parameters as a function of boiler load and ambient temperature?
BE2
Flue gas temperature yes 5 5 Flue gas Oxygen content yes 5
Flue gas CO content yes 5 no to all of above 0
10 More Points!
SSST ‐ 37
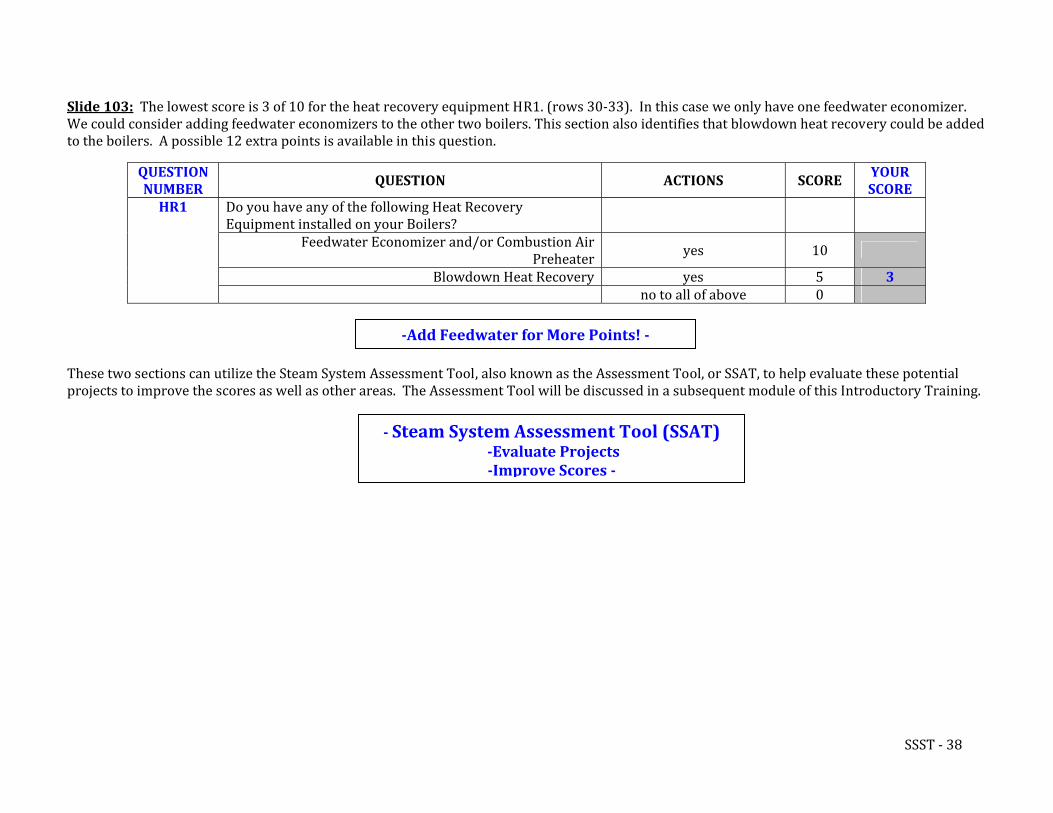
Slide 103: The lowest score is 3 of 10 for the heat recovery equipment HR1. (rows 30‐33). In this case we only have one feedwater economizer. We could consider adding feedwater economizers to the other two boilers. This section also identifies that blowdown heat recovery could be added to the boilers. A possible 12 extra points is available in this question.
QUESTION NUMBER
YOUR SCORE
QUESTION ACTIONS SCORE
Do you have any of the following Heat Recovery Equipment installed on your Boilers?
HR1
Feedwater Economizer and/or Combustion Air Preheater yes 10
Blowdown Heat Recovery yes 5 3 no to all of above 0
These two sections can utilize the Steam System Assessment Tool, also known as the Assessment Tool, or SSAT, to help evaluate these potential projects to improve the scores as well as other areas. The Assessment Tool will be discussed in a subsequent module of this Introductory Training.
Add Feedwater for More Points!
Steam System Assessment Tool (SSAT)
Evaluate Projects Improve Scores
SSST ‐ 38
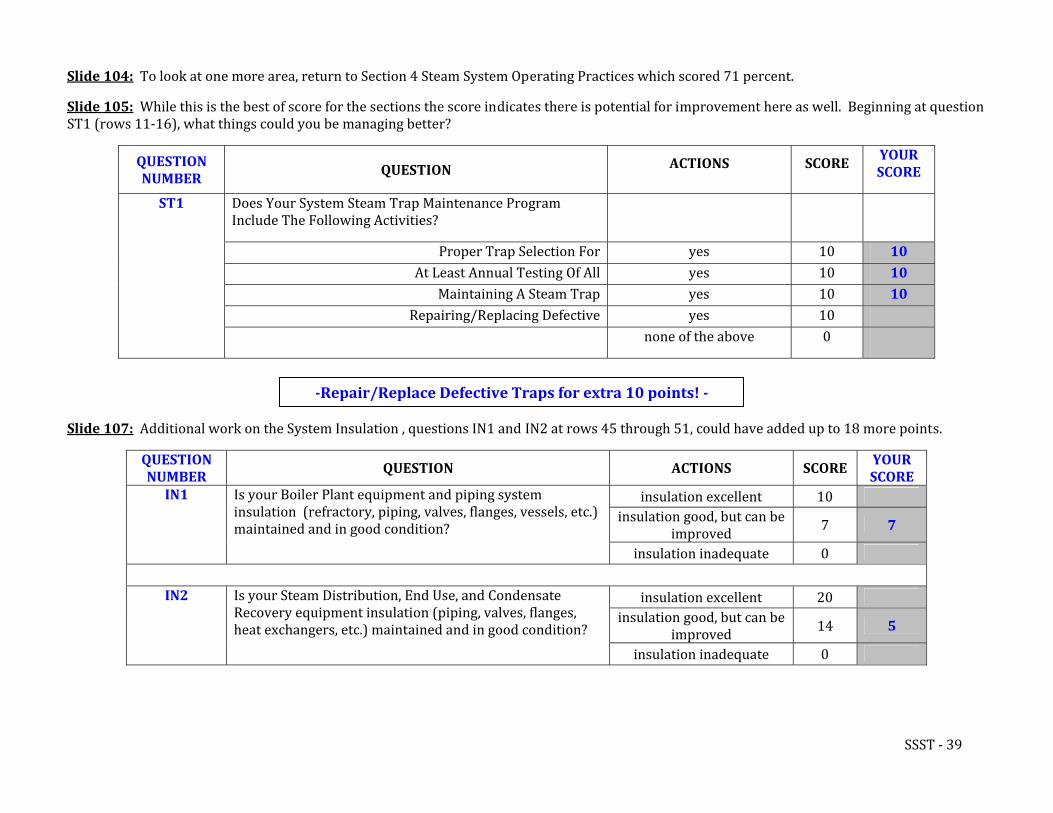
Slide 104: To look at one more area, return to Section 4 Steam System Operating Practices which scored 71 percent.
Slide 105: While this is the best of score for the sections the score indicates there is potential for improvement here as well. Beginning at question ST1 (rows 11‐16), what things could you be managing better?
YOUR SCORE
QUESTION NUMBER
ACTIONS SCORE QUESTION
Does Your System Steam Trap Maintenance Program Include The Following Activities?
ST1
Proper Trap Selection For yes 10 10 At Least Annual Testing Of All yes 10 10
Maintaining A Steam Trap yes 10 10 Repairing/Replacing Defective yes 10
none of the above 0
Slide 107: Additional work on the System Insulation , questions IN1 and IN2 at rows 45 through 51, could have added up to 18 more points.
Repair/Replace Defective Traps for extra 10 points!
QUESTION NUMBER
YOUR SCORE
QUESTION ACTIONS SCORE
insulation excellent 10 insulation good, but can be
improved 7 7
Is your Boiler Plant equipment and piping system insulation (refractory, piping, valves, flanges, vessels, etc.) maintained and in good condition?
IN1
insulation inadequate 0
insulation excellent 20
insulation good, but can be improved 14 5
Is your Steam Distribution, End Use, and Condensate Recovery equipment insulation (piping, valves, flanges, heat exchangers, etc.) maintained and in good condition?
IN2
insulation inadequate 0
SSST ‐ 39
The 3EPlus Insulation Thickness Computer Program, also called the Insulation Tool, or 3EPlus can be used to help evaluate the energy and cost savings from various insulation projects, as well as the cost to implement those projects. This software tool will be discussed in a subsequent module of this Introductory Training.
Slide 110: The last section, 8, ‘Next Steps’, provides you with some resources to help you improve your steam system. It gives you links to downloads for a guide, a sourcebook, and the other 2 Steam tools that we will discuss later in this training.
3EPlus Insulation Tool (SSAT) Cost savings of projects
Cost to Implement those projects
Begin Tab 8 – Next Steps
STEAM SCOPING TOOL, Version 1.0d 6/12/2002
NEXT STEPS Additional DOE BestPractices Steam Resources WHAT'S YOUR NEXT STEP? Your steam system self‐assessment using this Tool may have identified some potential steam system improvement projects. BestPractices Steam has developed additional tools and resources to help you to go the next step in improving your steam system. These tools are identified below.
START AT THE BESTPRACTICES WEB SITE! This web site includes links to all of the major tools and publications developed by BestPractices Steam. The web site address is .http://www1.eere.energy.gov/industry/bestpractices/about_bestpractices.html
STEAM SYSTEM SURVEY GUIDE: This guide is a reference document developed for plant energy managers and steam system operations personnel. It provides a technical basis for identifying and assessing many potential steam system improvement opportunities. It is complementary to the Steam System Scoping Tool, and provides quantitative descriptions of how to quantify major steam system improvement opportunities. It is available from the BestPractices web site.
STEAM TIP SHEETS
SSST ‐ 40
. BestPractices Steam has developed 26 energy tip sheets that provide concise descriptions of common steam system improvement opportunities. The tips are available for download from the BestPractices web site. The topics for these tip sheets are listed below, by major topic groups:
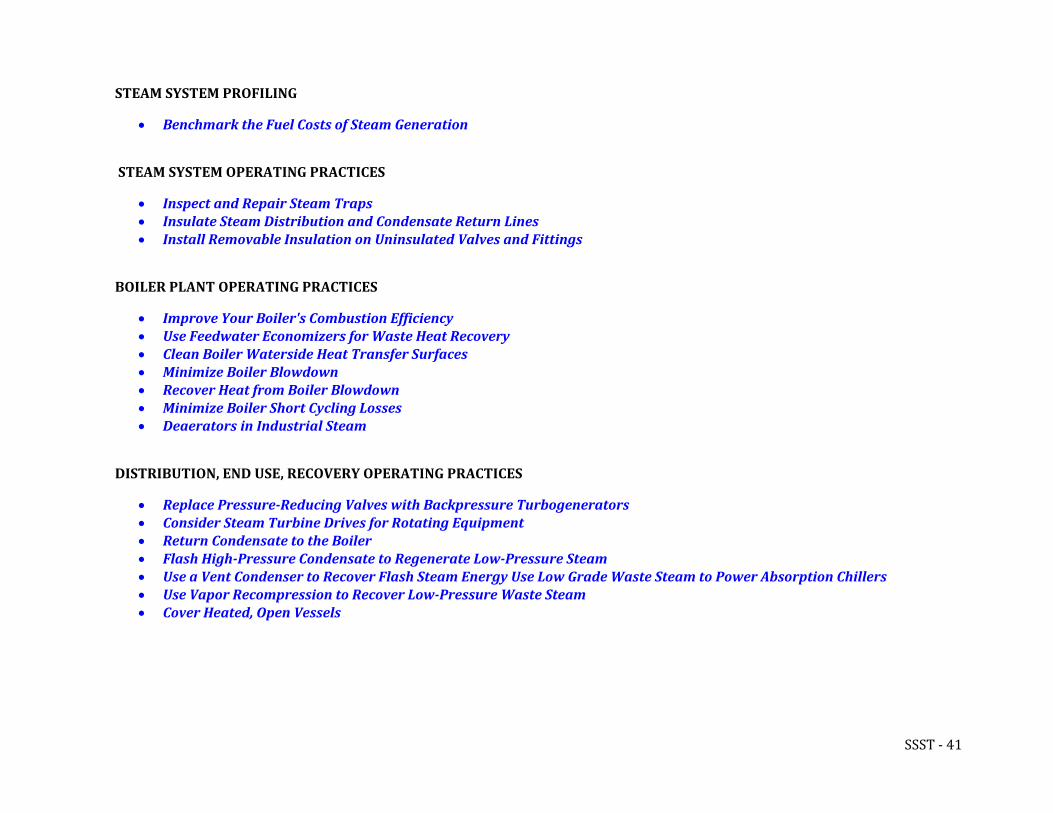
STEAM SYSTEM PROFILING
• Benchmark the Fuel Costs of Steam Generation
STEAM SYSTEM OPERATING PRACTICES
• Inspect and Repair Steam Traps • Insulate Steam Distribution and Condensate Return Lines
• Install Removable Insulation on Uninsulated Valves and Fittings
BOILER PLANT OPERATING PRACTICES
• Improve Your Boiler's Combustion Efficiency • Use Feedwater Economizers for Waste Heat Recovery • Clean Boiler Waterside Heat Transfer Surfaces • Minimize Boiler Blowdown • Recover Heat from Boiler Blowdown • Minimize Boiler Short Cycling Losses
• Deaerators in Industrial Steam
DISTRIBUTION, END USE, RECOVERY OPERATING PRACTICES
• Replace PressureReducing Valves with Backpressure Turbogenerators • Consider Steam Turbine Drives for Rotating Equipment • Return Condensate to the Boiler • Flash HighPressure Condensate to Regenerate Low ressure Steam P• Use a Vent Condenser to Recover Flash Steam Energy Use Low Grade Waste Steam to Power Absorption Chillers • Use Vapor Recompression to Recover LowPressure Waste Steam
• Cover Heated, Open Vessels
SSST ‐ 41
NEXT STEPS Additional DOE BestPractices Steam Resources (cont.)
IMPROVING STEAM SYSTEM PERFORMANCE: A Sourcebook for Industry. BestPractices Steam has developed a Sourcebook that is designed to provide steam system users with a reference that describes basic industrial steam system components, outlines opportunities for energy and performance improvements, and provides a comprehensive list of steam system contacts, resources, tools, software, videos, and training courses and technical services. This Sourcebook should be available on the BestPractices web site in June 2002.
3EPLUS INSULATION APPRAISAL SOFTWARE. 3E‐Plus was developed by the North American Insulation Manufacturer's Association (NAIMA) to increase awareness among steam system operations and management personnel of the benefits of insulation, and to allow these personnel to assess insulation improvement opportunities. The present version of 3E‐Plus can be downloaded from the BestPractices web site.
STEAMING AHEAD WEB SITE. The Alliance to Save Energy "Steaming Ahead" web site publicizes the activities and information products developed by the DOE BestPractices Steam effort. This web site is also the source for a "Steaming Ahead" bi‐monthly e‐mail newsletter. This newsletter promotes best‐in‐class practices and technology applications in steam system design and management. The "Steam Digest" ‐ a yearly compilation of articles and papers on steam efficiency measures ‐ is also available from the Steaming Ahead web site. The web site address is www.steamingahead.org.
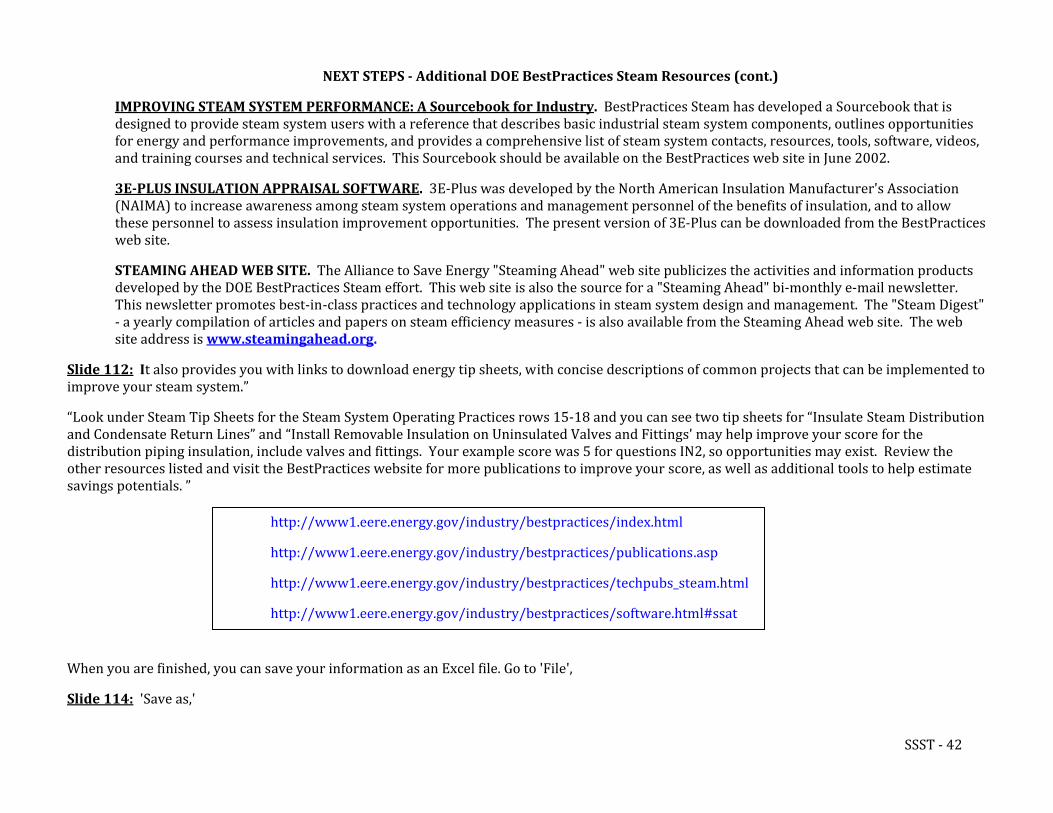
Slide 112: It also provides you with links to download energy tip sheets, with concise descriptions of common projects that can be implemented to improve your steam system.”
“Look under Steam Tip Sheets for the Steam System Operating Practices rows 15‐18 and you can see two tip sheets for “Insulate Steam Distribution and Condensate Return Lines” and “Install Removable Insulation on Uninsulated Valves and Fittings' may help improve your score for the distribution piping insulation, include valves and fittings. Your example score was 5 for questions IN2, so opportunities may exist. Review the other resources listed and visit the BestPractices website for more publications to improve your score, as well as additional tools to help estimate savings potentials. ”
When you are finished, you can save your information as an Excel file. Go to 'File',
http://www1.eere.energy.gov/industry/bestpractices/index.html
http://www1.eere.energy.gov/industry/bestpractices/publications.asp
http://www1.eere.energy.gov/industry/bestpractices/techpubs_steam.html
http://www1.eere.energy.gov/industry/bestpractices/software.html#ssat
Slide 114: 'Save as,'
SSST ‐ 42
Slide 116: choose a name for your file, then click 'save.'
Slide 118: Your filename will be whatever you chose, followed by 'dot XLS'.
Slide 119: You can also print out individual sections. Just navigate to (or group) whatever section(s) you want to print out, go to the file menu,
Slide 121: click print,
Slide 123: select 'active sheet or sheets, and click 'OK'.
Slide 125: You can also print the entire workbook by selecting ……
Slide 126: entire workbook' then clicking 'OK'.'
Slide 129: The Steam System Scoping Tool can be considered a score card for your steam system performance. The scoping tool is a good first order look at your steam system, utilizing a minimum amount of information without the need for actual data collection, to determine where to begin looking for areas of improvement, so you can develop a potential project list.
Slide 130: By knowing where areas of improvement are, we can use the other tools to determine the impact of making changes to our system in order to select the best projects, or combination of projects, to consider for implementation. Insulation improvements are best evaluated with the 3E Plus Insulation Thickness Program. Steam System improvements are best evaluated with the Steam System Assessment Tool. Both of these tools can be used to make estimates of energy and cost savings.
Slide 131: To begin a further look into potential projects for feasibility, let's look at the Steam System Assessment Tool, or simply the Assessment Tool, or its acronym, SSAT. The Assessment Tool can help you further your investigation by modeling your system with site‐specific details and then looking at selected projects for their impact on system efficiency, energy savings and cost savings.
SSST ‐ 43
SSAT Module
9/30/2009
Slide 1: Hello, and welcome to this introduction to the Steam System Assessment Tool.
Slide 2: Technology Delivery is a program area within the Industrial Techthe energy intensity of the U.S. industrial sector through a coordinated
nologies Program (ITP) that supports ITP's mission to improved development, validation, andprogram of research an
dissemination of energy‐efficient technologies and practices. One of the ways Technology Delivery keeps you in touch with the latestdevelopments is through training, publications, and software tools. This tool, the Steam System Assessment Tool, also known as ‘theAssessment Tool’, or its acronym, SSAT, is one of the software tools to help you identify energy saving opportunities to achieve yourenergy reduction goals.
Slide 3: Now, we will show you the Steam System Assessment Tool. This is an Excel‐based software tool designed to model the entiresteam system. It allows you to do project investigations, by doing a before‐and‐after analysis of different real‐life steam projects.
Using steam system investigation techniques and the U.S. DOE Steam tools, system improvements, or projects, are identified. TheAssessment Tool will be used to calculate the energy and economic impacts for these projects. These projects include boiler feedwatereconomizer installation, blowdown thermal energy recovery, condensate recovery, and insulation.
The initial investigation of our example system identified several areas where modifications could reduce energy consumption. We willuse the SSAT to evaluate the impact of potential projects in some of these areas. We will see that sustainable real‐world projects have the
al to reduce fuel cost more than 7 percent. It should be noted that the site fuel cost is 19,000,000 per year; therefore, the savingspotentipotential is 1,300,000 dollars per year.
SSAT Module ‐ 1
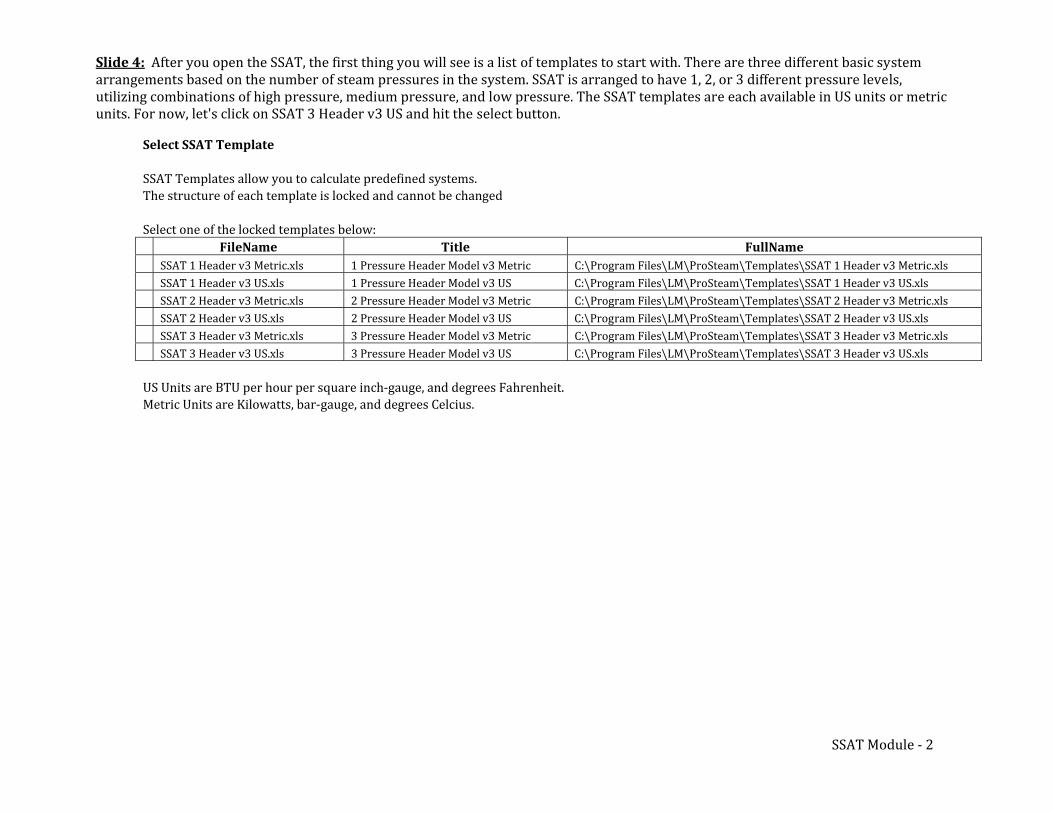
Slide 4: After you open the SSAT, the first thing you will see is a list of templates to start with. There are three different basic system arrangements based on the number of steam pressures in the system. SSAT is arranged to have 1, 2, or 3 different pressure levels, utilizing combinations of high pressure, medium pressure, and low pressure. The SSAT templates are each available in US units or metric units. For now, let's click on SSAT 3 Header v3 US and hit the select button.
Select SSAT Template
SSAT Templates allow you to calculate predefined systems. The structure of each template is locked and cannot be changed
Select one of the locked templates below:
:\Program Fi es\LM\ProSteam\Templates\SSAT 3 Header v3 US.xls
FileName Title FullNameSSAT 1 Header v3 Metric.xls 1 Pressure Header Model v3 Metric esC:\Program Fil \LM\ProSteam\Templates\SSAT 1 Header v3 Metric.xls
C:\Program Files\LM\ProSteam\Templates\SSAT 1 Header v3 US.xls SSAT 1 Header v3 US.xls 1 Pressure Header Model v3 US SSAT 2 Header v3 Metric.xls 2 Pressure Header Model v3 Metric esC:\Program Fil \LM\ProSteam\Templates\SSAT 2 Header v3 Metric.xls
:\Program Files\LM\ProSteam\Templates\SSAT 2 Header v3 US.xls SSAT 2 Header v3 US.xls 2 Pressure Header Model v3 US CSSAT 3 Header v3 Metric.xls 3 Pressure Header Model v3 Metric esC:\Program Fil \LM\ProSteam\Templates\SSAT 3 Header v3 Metric.xls
lSSAT 3 Header v3 US.xls 3 Pressure Header Model v3 US C
US Units are BTU per hour per square inch‐gauge, and degrees Fahrenheit. Metric Units are Kilowatts, bar‐gauge, and degrees Celcius.
SSAT Module ‐ 2
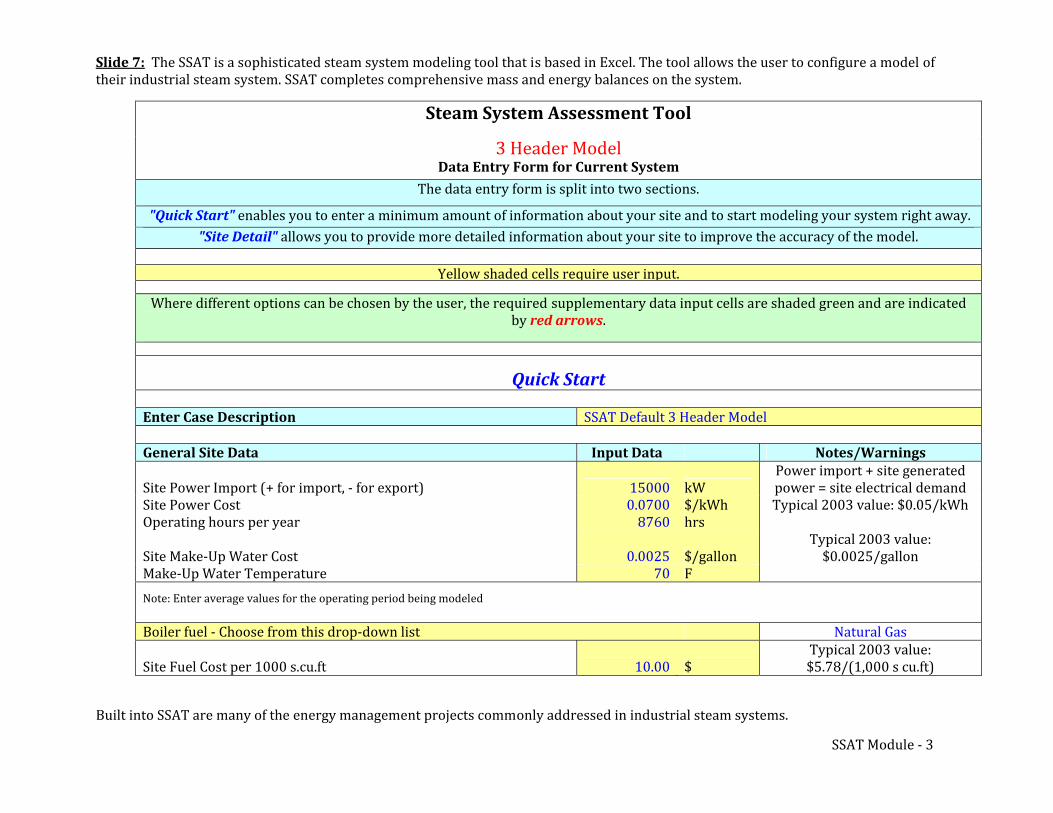
Slide 7: The SSAT is a sophisticated steam system modeling tool that is based in Excel. The tool allows the user to configure a model oftheir industrial steam system. SSAT completes comprehensive mass and energy balances on the system.
Steam System Assessment Tool
3 Header Model Data Entry Form for Current System
The data ent lit into two sections.ry form is sp
"Quick Start" enables you to enter a minimum amount of information about your site and to start modeling your system right away."Site Detail" allows you to provide more detailed information about your site to improve the accuracy of the model.
Yellow shaded cells require user input.
Where different options can e chosen by the user, the required supplementary data input cells are shaded green and are indicateby red arrows.
b d
Quick Start SSAT Default 3 Header ModelEnter Case Description
General Site Data Input Data Notes/Warnings
er Import (+ for import, ‐ for export)Site PowSite Power CostOperating hours per year
Site Make‐Up Water CostMake‐Up Water Temperature
15000 kW0.0700 $/kWh8760 hrs
0.0025 $/gallon70 F
Power import + site generatedpower = site electrical demandTypical 2003 value: $0.05/kWh
Typical 2003 value:$0.0025/gallon
Note: Enter average values for the operating period being modeled
Natural Gas
000 s.cu.ft
Boiler fuel ‐ Choose from this drop‐down list
10.00 $ 00Typical 2003 value:
Site Fuel Cost per 1 $5.78/(1,0 s cu.ft)
Built into SSAT are many of the energy management projects commonly addressed in industrial steam systems.
SSAT Module ‐ 3
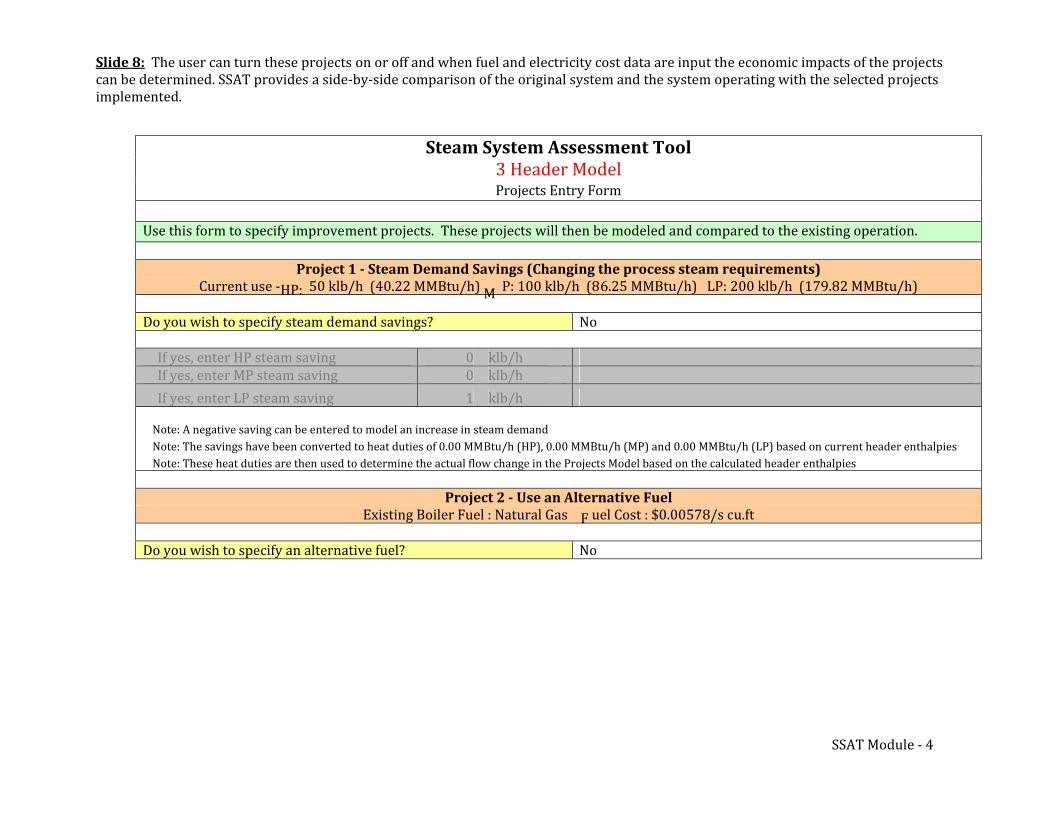
Slide 8: The user can turn these projects on or off and when fuel and electricity cost data are input the economic impacts of the projectscan be determined. SSAT provides a side‐by‐side comparison of the original system and the system operating with the selected projectsimplemented.
Steam System Assessment Tool3 Header ModelProjects Entry Form
Use this form to specify improvement projects. These projects will then be modeled and compared to the existing operation.
Project 1 Steam Demand Savings (Changing the process steam requirements)Current use ‐HP: 50 klb/h (40.22 MMBtu/h) M P: 100 klb/h (86.25 MMBtu/h) LP: 200 klb/h (179.82 MMBtu/h)
Do you wish to specify steam demand savings? No
If yes, enter HP steam saving 0 klb/hIf yes, enter MP steam saving 0 klb/hIf yes, enter LP steam saving 1 klb/h
Note: A negative saving can be entered to model an increase in steam demandNote: The savings have been converted to heat duties of 0.00 MMBtu/h (HP), 0.00 MMBtu/h (MP) and 0.00 MMBtu/h (LP) based on current header enthalpiesNote: These heat duties are then used to determine the actual flow change in the Projects Model based on the calculated header enthalpies
Project 2 Use an Alternative FuelExisting Boiler Fuel : Natural Gas F uel Cost : $0.00578/s cu.ft
Do you wish to specify an alternative fuel? No
SSAT Module ‐ 4
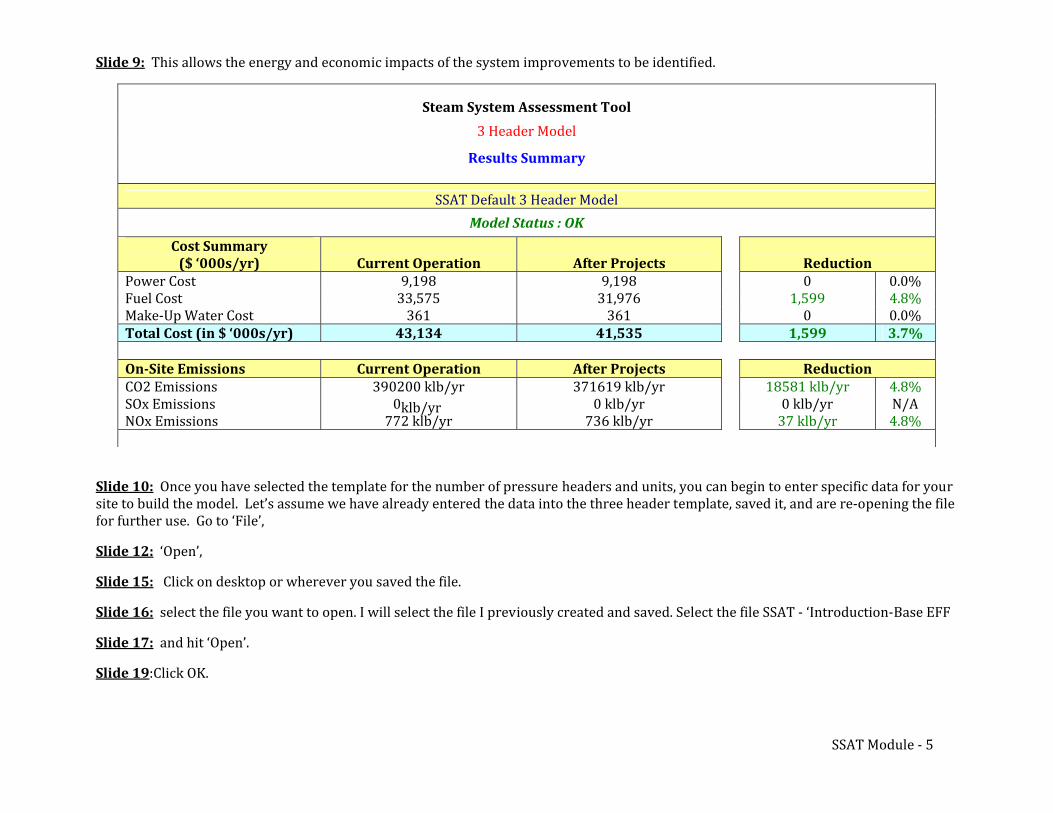
Slide 9: This allows the energy and economic impacts of the system improvements to be identified.
Steam System Assessment Tool
3 Header Model
Results Summary
Model Status : OK
Cost Summary
($ ‘000s/yr) Current Operation After Projects ReductionPower Cost 9,198 9,198 0 0.0%Fuel Cost 33,575 31,976 1,599 4.8%Make‐Up Water Cost 361 361 0 0.0% Total Cost (in $ ‘000s/yr) 43,134 41,535 1,599 3.7%
OnSite Emissions Current Operation After Projects ReductionCO2 Emissions 390200 klb/yr 371619 klb/yr 4.8%SOx Emissions 0 klb/yr 0 klb/yr N/ANOx Emissions 772 klb/yr 736 klb/yr 4.8%
SSAT Default 3 Header Model
18581 klb/yr0 klb/yr37 klb/yr
Slide 10: Once you have selected the template for the number of pressure headers and units, you can begin to enter specific data for your
site to build the model. Let’s assume we have already entered the data into the three header template, saved it, and are re‐opening the file
for further use. Go to ‘File’,
Slide 12: ‘Open’,
Slide 15: Click on desktop or wherever you saved the file.
Slide 16: select the file you want to open. I will select the file I previously created and saved. Select the file SSAT ‐ ‘Introduction‐Base EFF
Slide 17: and hit ‘Open’.
Slide 19:Click OK.
SSAT Module ‐ 5
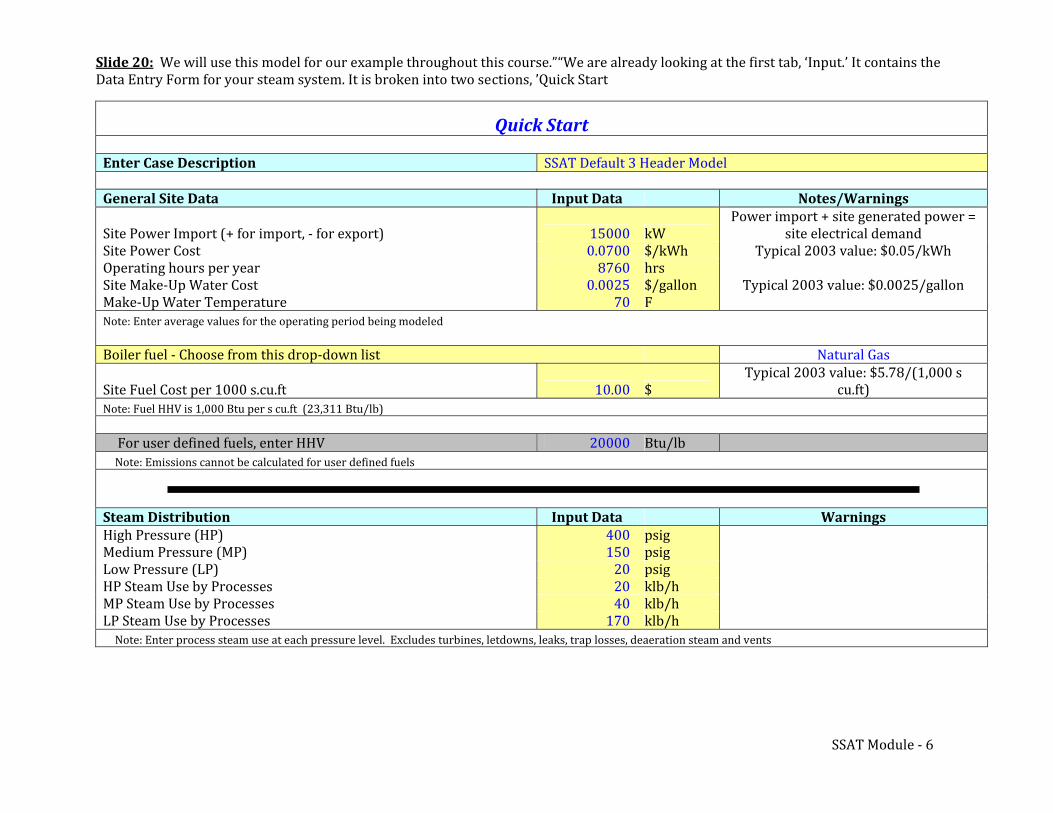
psig
Slide 20: We will use this model for our example throughout this course.”“We are already looking at the first tab, ‘Input.’ It contains theData Entry Form for your steam system. It is broken into two sections, ’Quick Start
Note: Enter process steam use at each pressure level. Excludes turbines, letdowns, leaks, trap losses, deaera
Enter Case Description
General Site Data
er Import (+ for import, ‐ for export)Site PowSite Power CostOperating hours per yearSite Make‐Up Water CostMake‐Up Water TemperatureNote: Enter average values for the operating period being modeled
Boiler fuel ‐ Choose from this drop‐down list
Site Fuel Cost per 1000 s.cu.ftNote: Fuel HHV is 1,000 Btu per s cu.ft (23,311 Btu/lb)
For user defined fuels, enter HHVNote: Emissions cannot be calculated for user defined fuels
Steam DistributionHigh Pressure (HP)Medium Pressure (MP)Low Pressure (LP)HP Steam Use b esMP Steam Use b esLP Steam Use b
y Processy Processy Processes
Quick Start
SSAT Default 3 Header Model
Input Data Notes/Warnings
15000 kW Power import + site generated power =
site electrical demand0.0700 $/kWh Typical 2003 value: $0.05/kWh8760 hrs0.0025 $/gallon Typical 2003 value: $0.0025/gallon70 F
Natural Gas
10.00 $ Typical 2003 value: $5
cu.ft) .78/(1,000 s
20000 Btu/lb
Input Data Warnings401500 psigpsig
202040170
klb/hklb/hklb/htion steam and vents
SSAT Module ‐ 6
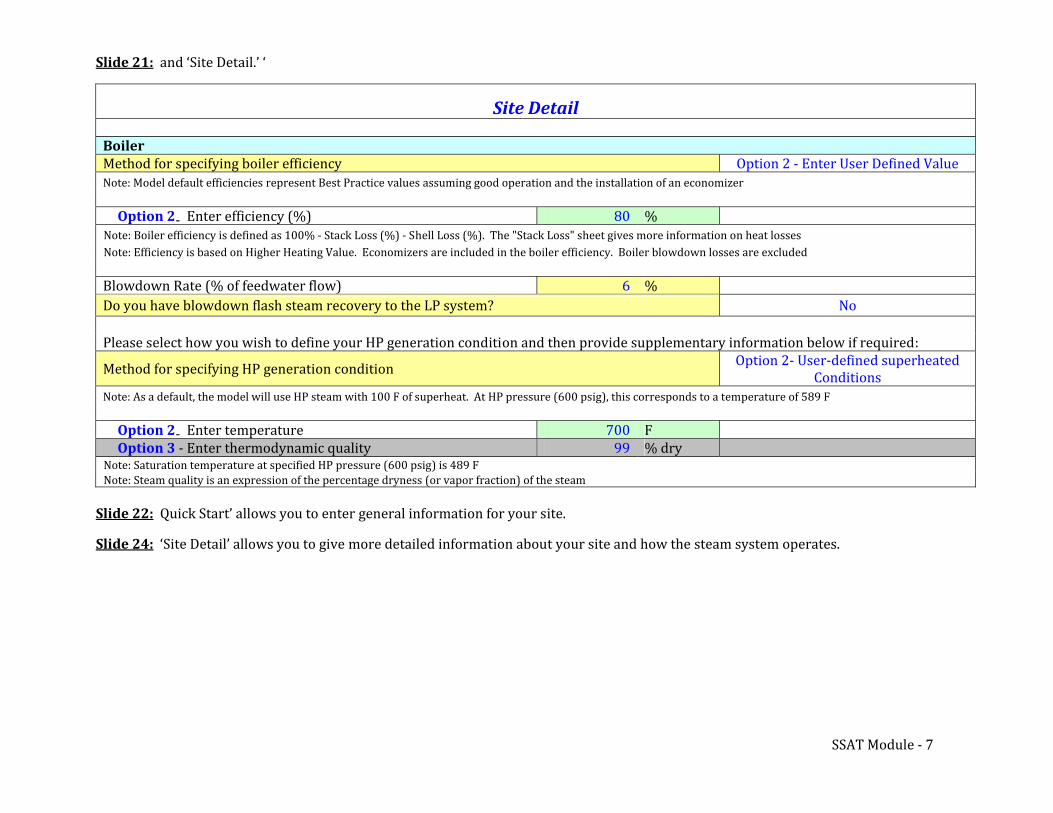
Slide 21: and ‘Site Detail.’ ‘
Site Detail
BoilerMethod for specifying boiler efficiency Option 2 ‐ Enter User Defined Value
Note: Model default efficiencies represent Best Practice values assuming good operation and the installation of an economizer
‐ Enter efficiency (%) 80 %Option 2Note: Boiler efficiency is defined as 100% ‐ Stack Loss (%) ‐ ShNote: Efficiency is based on Higher Heating Value. Economizers are included in the boiler efficiency. Boiler blowdown losses are excluded
Blowdown Rate (% of feedwater flow) 6 %
ell Loss (%). The "Stack Loss" sheet gives more information on heat losses
Do you have blowdown Noflash steam recovery to the LP system?
Please select how you wish to define your HP generation condition and then provide supplementary information below if required:Option 2‐ User‐defined superheatedMethod for specifying HP generation condition
Note: As a default, the model will use HP steam with 100 F of superheat. At HP pressure (600 psig), this corresponds to a temperature of 589 F Conditions
‐ E 700 FOption 2 ‐nter temperature
Enter thermodynamic quality 99 % dryOption 3Note: Saturation temperature at specified HP pressure (600 psig) is 489 F
tNote: Steam quality is an expression of the percentage dryness (or vapor frac ion) of the steam
Slide 22: Quick Start’ allows you to enter general information for your site.
Slide 24: ‘Site Detail’ allows you to give more detailed information about your site and how the steam system operates.
SSAT Module ‐ 7
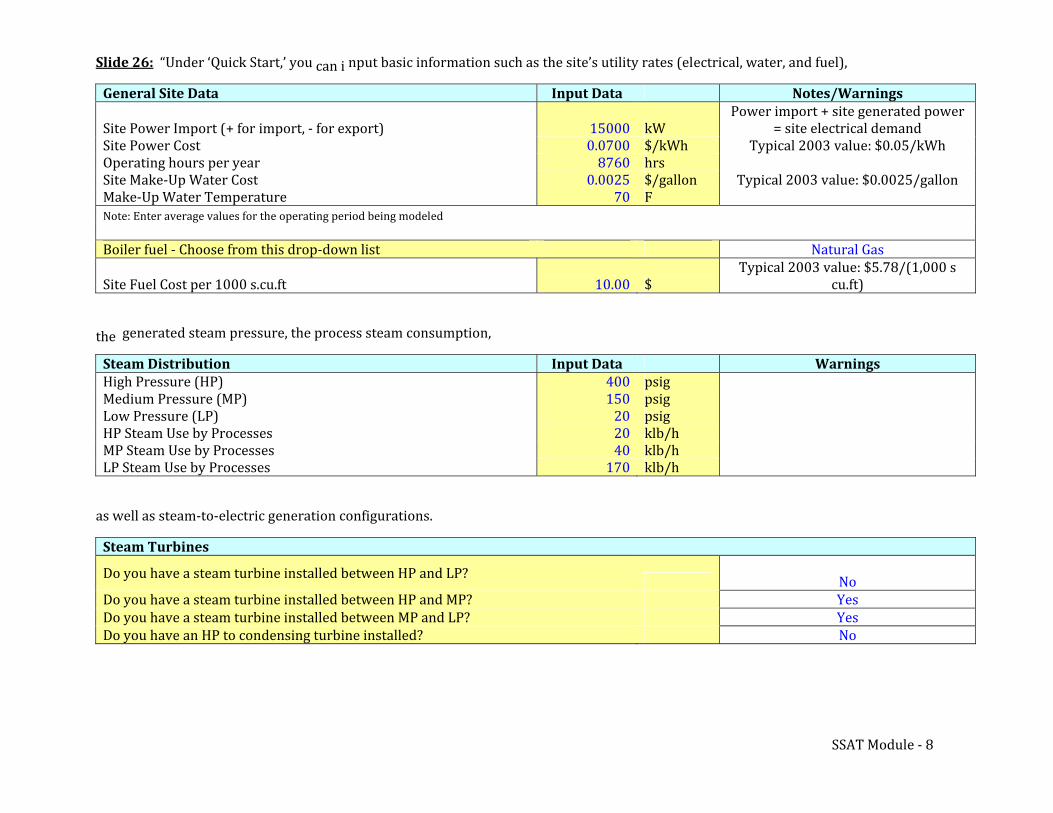
psig
y
Slide 26: “Under ‘Quick Start,’ you can i nput basic information such as the site’s utility rates (electrical, water, and fuel),
cu.ft) .78/(1,000 s
General Site Data Input Data Notes/WarningsPower import + site generated power
er Import (+ for import, ‐ for export)Site PowSite Power CostOperating hours per yearSite Make‐Up Water CostMake‐Up Water TemperatureNote: Enter average values for the operating period being modeled
15000 kW0.0700 $/kWh8760 hrs0.0025 $/gallon70 F
= site electrical demandTypical 2003 value: $0.05/kWh
Typical 2003 value: $0.0025/gallon
Boiler fuel ‐ Choose from this drop‐down list Natural GasTypical 2003 value: $
000 s.cu.ft 10.00 $ 5
Site Fuel Cost per 1
the generated steam pressure, the process steam consumption,
Steam DistributionHigh Pressure (HP)
Input Data40
Warnings
Medium Pressure (MP)Low Pressure (LP)HP Steam Use b esMP Steam Use b esLP Steam Use b
y Processy Processy Processes
1500202040170
psigpsig
klb/hklb/hklb/h
as well as steam‐to‐electric generation configurations.
Steam Turbines
Do you have a steam turbine installed between HP and LP?
Do ou have a steam turbine installed between HP and MP?Do you have a steam turbine installed between MP and LP?
Do you have an HP to condensing turbine installed?
NoYesYesNo
SSAT Module ‐ 8
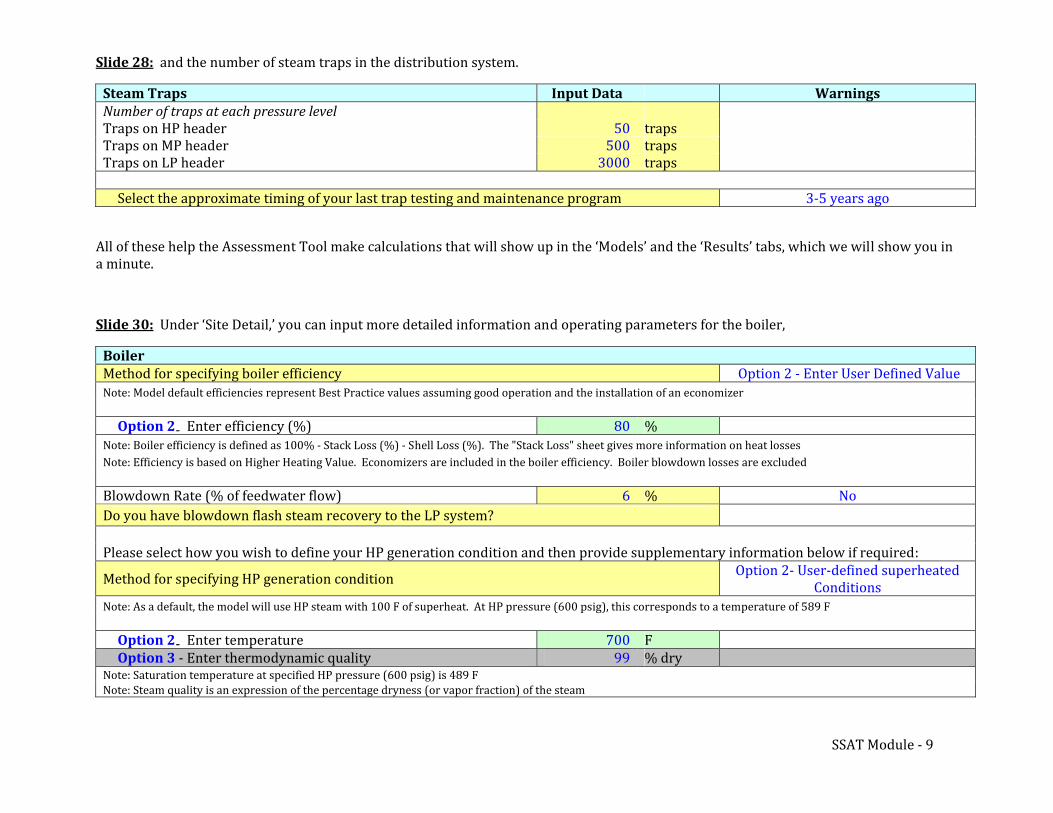
Steam Traps Input Data Warnings
Number of traps at each pressure leveln HP headern MP header
Traps oTraps oTraps on LP header
505003000
trapstrapstraps
tf
Slide 28: and the number of steam traps in the distribution system.
Select the approximate timing o your last trap testing and main enance program 3‐5 years ago
All of these help the Assessment Tool make calculations that will show up in the ‘Models’ and the ‘Results’ tabs, which we will show you ina minute.
Slide 30: Under ‘Site Detail,’ you can input more detailed information and operating parameters for the boiler,
BoilerMethod for specifying boiler efficiency Option 2 ‐ Enter User Defined ValueNote: Model default efficiencies represent Best Practice values assuming good operation and the installation of an economizer
‐ Enter efficiency (%) 80 %Option 2Note: Boiler efficiency is defined as 100% ‐ Stack Loss (%) ‐ ShNote: Efficiency is based on Higher Heating Value. Economizers are included in the boiler efficiency. Boiler blowdown losses are excluded
Blowdown Rate (% of feedwater flow) 6 % No
ell Loss (%). The "Stack Loss" sheet gives more information on heat losses
Do you have blowdown flash steam recovery to the LP system?
Please select how you wish to define your HP generation condition and then provide supplementary information below if required:Option 2‐ User‐defined superheatedMethod for specifying HP generation condition
Note: As a default, the model will use HP steam with 100 F of superheat. At HP pressure (600 psig), this corresponds to a temperature of 589 FConditions
‐ E 700 FOption 2 ‐nter temperatureEnter thermodynamic quality 99 % dryOption 3
Note: Saturation temperature at specified HP pressure (600 psig) is 489 FNote: Steam quality is an expression of the percentage dryness (or vapor fraction) of the steam
SSAT Module ‐ 9
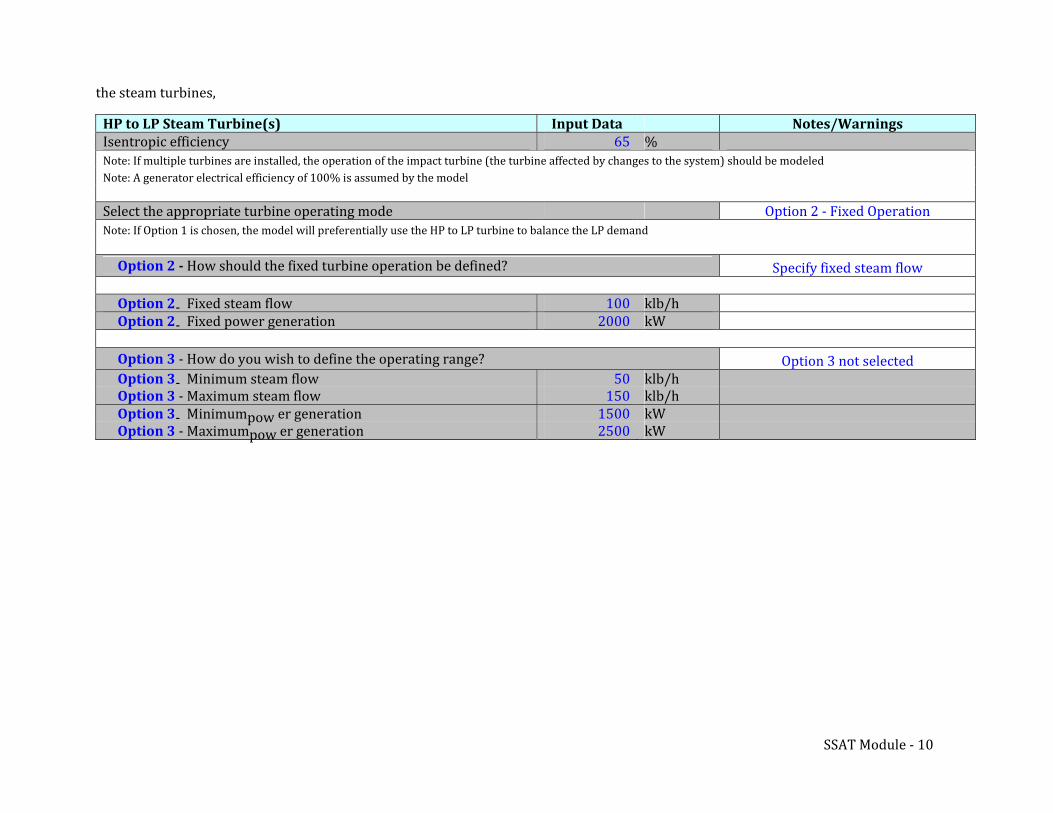
klb/h
the steam turbines,
MMaximum
powpower generer generation
HP to LP Steam Turbine(s)Isentropic efficiency
Input Data65 %
Notes/Warnings
Note: A generator electrical efficiency of 100% is assumed by the model
Select the appropriate turbine operating mode Option 2 ‐ Fixed Operation
Note: If multiple turbines are installed, the operation of the impact turbine (the turbine affected by changes to the system) should be modeled
Note: If Option 1 is chosen, the model will preferentially use the HP to LP turbine to balance the LP demand
Option 2 How should the fixed turbine operation be defined? Specify fixed steam flow
‐ Fixed steam fl 100 klb/hFixed power generation 2000 kW
Option 2 ow‐Option 2
Option 3 ‐ How do you w‐ inimum steam flow 50
ish to define the operating range? Option 3 not selected Option 3Option 3 ‐
MMaximum steam flow‐ inimum ation
150 klb/h
15Option 3Option 3 ‐ 25
0000
kWkW
SSAT Module ‐ 10
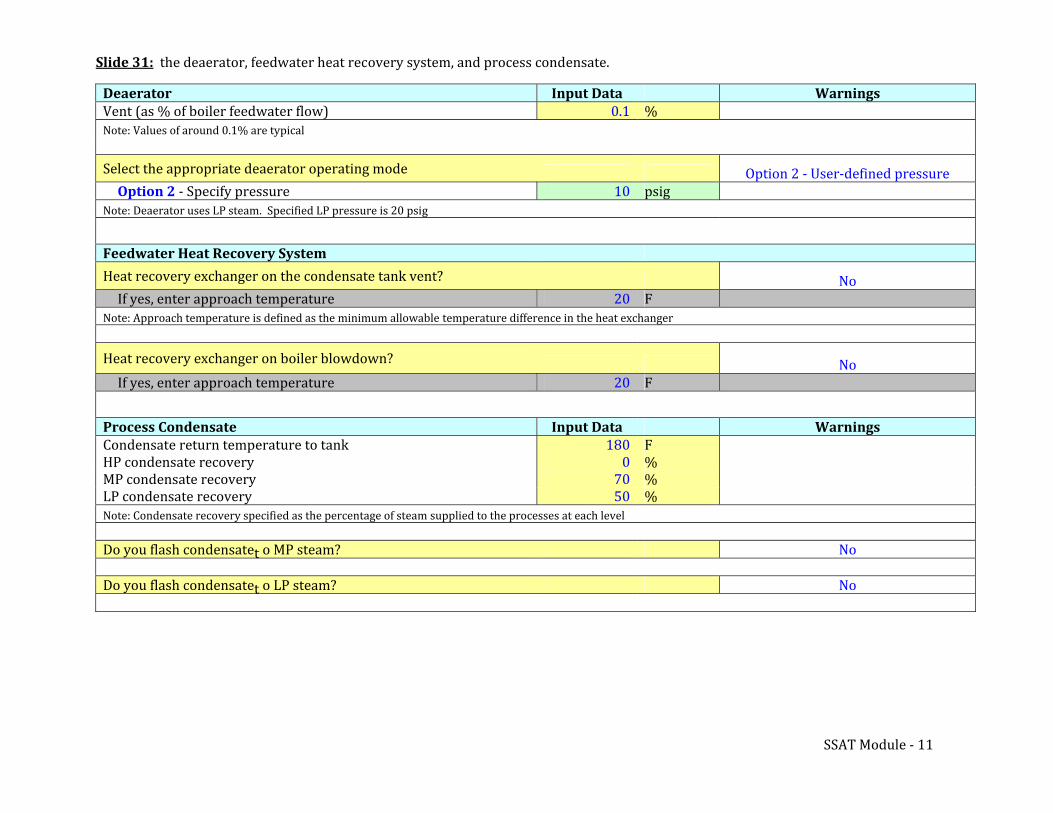
Slide 31: the deaerator, feedwater heat recovery system, and process condensate.
Deaerator Input Data0.1 %
Warnings
Note: Values of around 0.1% are typicalVent (as % of boiler feedwater flow)
Select the appropriate deaerator operating mode Option 2 ‐ Specify pressure 10 psig
Option 2 ‐ User‐defined pressure
Note: Deaerator uses LP steam. Specified LP pressure is 20 psig
Feedwater Heat Recovery System
20 FHeat recovery exchanger on the condensate tank vent?If yes, enter approach temperature
No
Note: Approach temperature is defined as the minimum allowable temperature difference in the heat exchanger
20 FHeat recovery exchanger on boiler blowdown?If yes, enter approach temperature
No
Process CondensateCondensate
Input Data18 F
Warningsreturn temperature to tank
HP condensate recovMP condensate recovLP condensate recov
eryeryery
007050
%%%
l
t
Note: Condensate recovery specified as the percentage of steam supplied to the processes at each leve
Do you flash condensate o MP steam? No
tDo you flash condensate o LP steam? No
SSAT Module ‐ 11
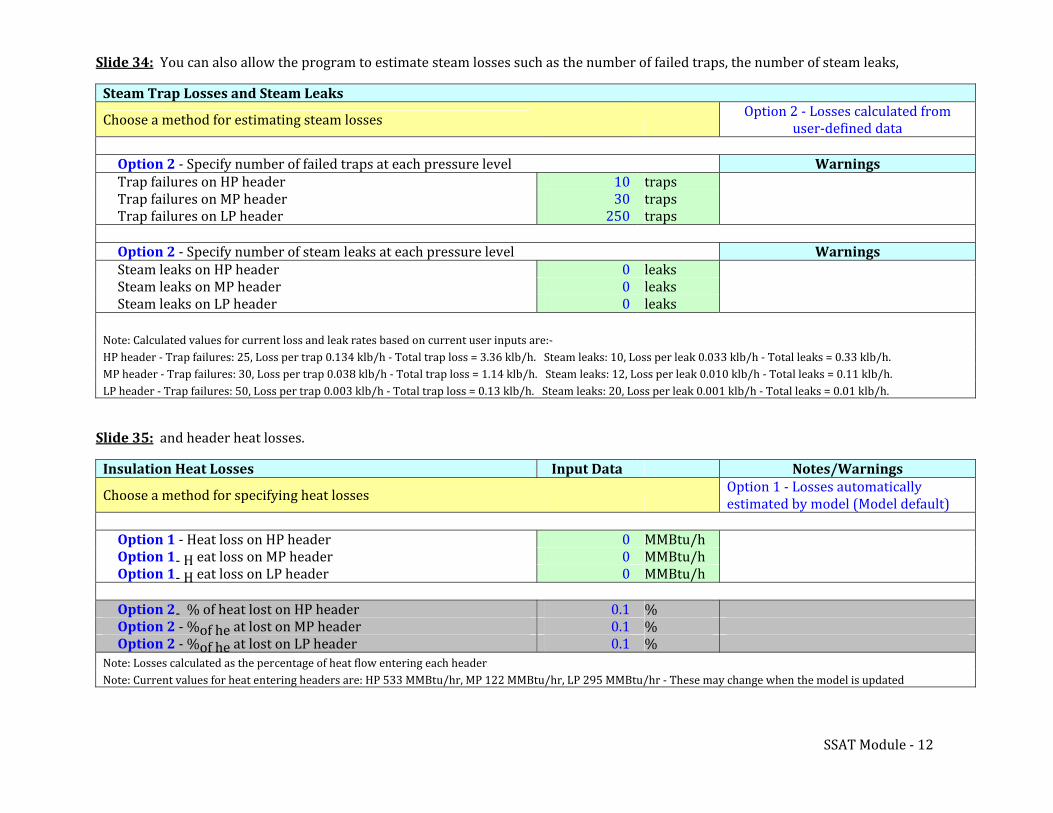
Slide 34: You can also allow the program to estimate steam losses such as the number of failed traps, the number of steam leaks,
Steam Trap Losses and Steam LeaksOption 2 ‐ Losses calculated fromChoose a method for estimating steam losses user‐defined data
Option 2 ‐ Specify num rber of failed traps at each p essure levelf es on HP header 10
Warnings
es on MP headerTrapTrapTrap
ff
ailurailurailures on LP header
30250
trapstrapstraps
tOption 2 ‐ Specify number of steam leaks a each pressure levelSteam leaks on HP header
Warnings
Steam leaks on MP headerSteam leaks on LP header
000
leaksleaksleaks
Note: Calculated values for current loss and leak rates based on current user inputs are:‐HP header ‐ Trap failures: 25, Loss per trap 0.134 klb/h ‐ Total trap loss = 3.36 klb/h. Steam leaks: 10, Loss per leak 0.033 klb/h ‐ Total leaks = 0.33 klb/h.MP header ‐ Trap failures: 30, Loss per trap 0.038 klb/h ‐ Total trap loss = 1.14 klb/h. Steam leaks: 12, Loss per leak 0.010 klb/h ‐ Total leaks = 0.11 klb/h.LP header ‐ Trap failures: 50, Loss per trap 0.003 klb/h ‐ Total trap loss = 0.13 klb/h. Steam leaks: 20, Loss per leak 0.001 klb/h ‐ Total leaks = 0.01 klb/h.
Slide 35: and header heat losses.
Insulation Heat Losses Input Data Notes/WarningsOption 1 ‐ Losses automaticallyChoose a method for specifying heat losses estimated by model (Model default)
on HOption 1
Option 1 on MP header
Option 1
‐ H‐ H‐ H
eat losseat losseat loss on LP header
P header 000
MMBtu/hMMBtu/hMMBtu/h
‐ t on HP headOption 2 er
Option 2 ‐ t on MP header
Option 2 ‐
%%%
of heof heof he
at losat losat lost on LP header
Note: Losses calculated as the percentage of heat flow entering each header
0.10.10.1
%%%
Note: Current values for heat entering headers are: HP 533 MMBtu/hr, MP 122 MMBtu/hr, LP 295 MMBtu/hr ‐ These may change when the model is updated
SSAT Module ‐ 12
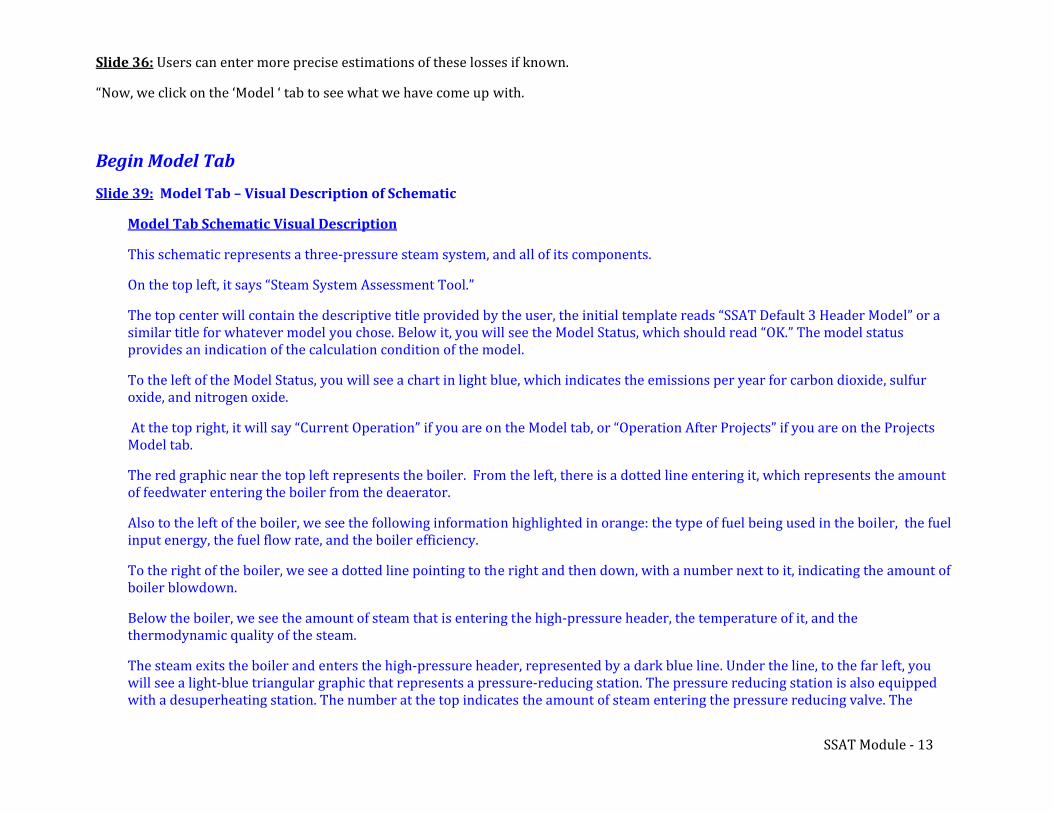
Slide 36: Users can enter more precise estimations of these losses if known.
“Now, we click on the ‘Model ‘ tab to see what we have come up with.
Begin Model Tab
Slide 39: Model Tab – Visual Description of Schematic
Model Tab Schematic Visual Description
This schematic represents a three‐pressure steam system, and all of its components.
On the top left, it says “Steam System Assessment Tool.”
The top center will contain the descriptive title provided by the user, the initial template reads “SSAT Default 3 Header Model” or a similar title for whatever model you chose. Below it, you will see the Model Status, which should read “OK.” The model statusprovides an indication of the calculation condition of the model.
To the left of the Model Status, you will see a chart in light blue, which indicates the emissions per year for carbon dioxide, sulfur oxide, and nitrogen oxide.
At the top right, it will say “Current Operation” if you are on the Model tab, or “Operation After Projects” if you are on the Projects Model tab.
The red graphic near the top left represents the boiler. From the left, there is a dotted line entering it, which represents the amount
of feedwater entering the boiler from the deaerator.
Also to the left of the boiler, we see the following information highlighted in orange: the type of fuel being used in the boiler, the fuelinput energy, the fuel flow rate, and the boiler efficiency.
To the right of the boiler, we see a dotted line pointing to the right and then down, with a number next to it, indicating the amount of
boiler blowdown.
Below the boiler, we see the amount of steam that is entering the high‐pressure header, the temperature of it, and the
thermodynamic quality of the steam. The steam exits the boiler and enters the high‐pressure header, represented by a dark blue line. Under the line, to the far left, youwill see a light‐blue triangular graphic that represents a pressure‐reducing station. The pressure reducing station is also equipped with a desuperheating station. The number at the top indicates the amount of steam entering the pressure reducing valve. The
SSAT Module ‐ 13

number at the center‐left of the valve indicates the amount of desuperheating water entering the unit. The number below indicates the amount of desuperheated steam entering the medium‐pressure header; as well as the temperature of the steam.
To the right of the pressure‐reducing station, you will see light blue, cone‐shaped graphics, that represent the steam turbines. The one nearest to the left is a high‐pressure to condensing turbine. This turbine discharges to the condenser represented by the blue circle below the turbine. The turbine exhaust pressure is noted as the condenser pressure. The turbine in the middle receives hpressure steam and exhausts low‐pressure steam. The one to the right receives high‐pressure steam and exhausts medium‐pressure
igh‐
steam. Above each turbine is an indication of the amount of steam coming into the turbine from the header. To the right, in dark blue, you see the power generation of the turbine.
In the center of the medium‐pressure and low‐pressure headers, we see an arrow pointing downward, which indicates the amount offlash entering the header from the condensate collection flash vessels that are located at the far‐right of the schematic.
Above the header, to the right, the amount of heat loss is expressed in orange. Below, there is a yellow box that indicates the pressure, temperature, and thermodynamic quality of the steam.
The arrow to the right of the header points to a dark blue circle with a line through it, indicating the steam end‐use components.Below this symbol is an indication of the thermal energy supplied to the end‐use components from the steam. The end‐use components discharge condensate through a steam trap, represented by a blue circle with a “T” in it. Schematically, condensate passes to the right through the trap. Failed steam traps that are blowing steam to the atmosphere are represented with the red arrowexiting the top of the trap symbol. The condensate appropriately passing through traps, again represented as exiting to the right of the trap, can be recovered or lost. Lost condensate is represented as the unrecovered condensate discharging down from the traps and recovered condensate enters the condensate collection system further to the right.
The green figures to the far‐right of the schematic represent condensate flash‐vessels. The top flash‐vessel receives condensate from the high‐pressure end‐users. Flash‐steam is formed because the flash vessel operates at medium‐pressure but it receives saturated liquid condensate at high‐pressure. As equilibrium is reached flash‐steam is formed. This flash‐steam exits the vessel through the topand is directed to the medium‐pressure steam header, which is shown in the center of the diagram. Condensate exits the flash vessel and enters the medium‐pressure condensate collection system. The medium‐pressure condensate system is equipped with similar
equipment as the high‐pressure system.
All of the collected condensate enters the main condensate receiver located in the lower‐center of the schematic. Process condensateis mixed with turbine condensate and makeup water prior to entering the deaerator.
The steam system deaerator is represented at the lower‐left of the schematic. The deaerator receives low‐pressure steam to preheat the collected condensate and makeup water represented as entering from the bottom of the vessel. Boiler feedwater discharges from the deaerator to the left and up to the boiler. The line pointing out from the top of the deaerator and leading to the right shows the amount of steam escaping from the vent.
Below the condensate receiver are the makeup water system and the blowdown system. The blowdown system is the green vessel shown on the schematic. This unit receives the boiler blowdown and allows flash‐steam to be generated. The flash‐steam can be
SSAT Module ‐ 14
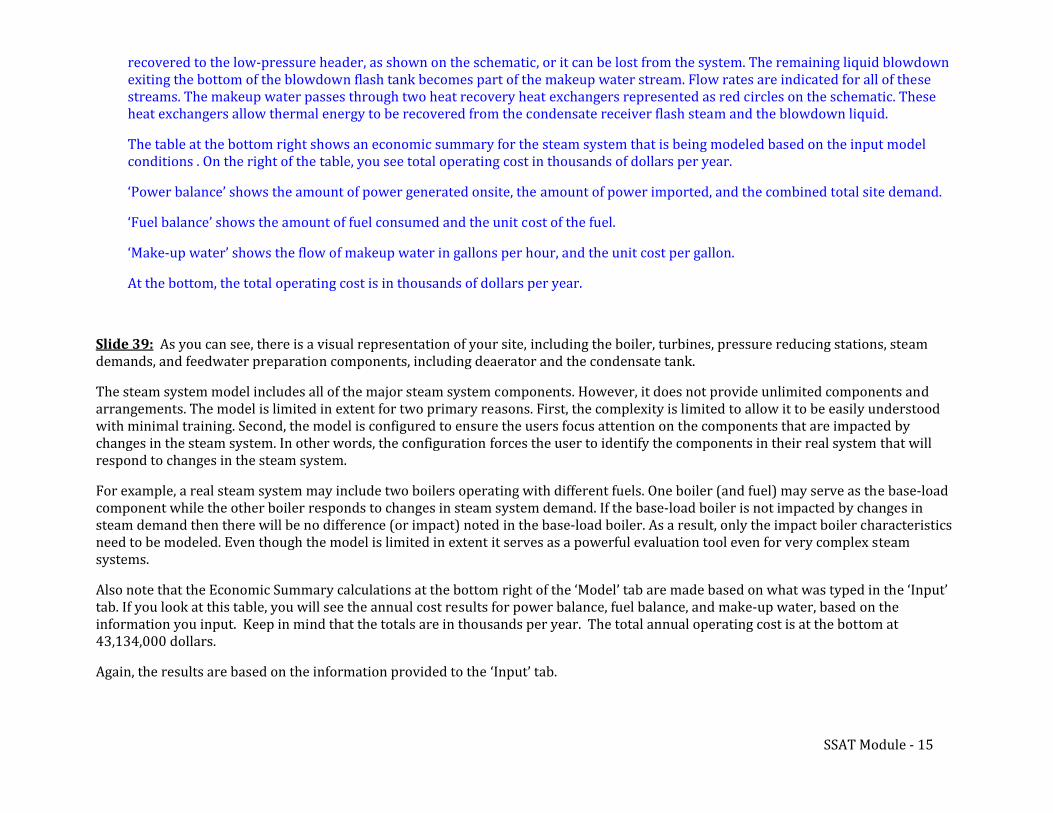
recovered to the low‐pressure header, as shown on the schematic, or it can be lost from the system. The remaining liquid blowdownexiting the bottom of the blowdown flash tank becomes part of the makeup water stream. Flow rates are indicated for all of these streams. The makeup water passes through two heat recovery heat exchangers represented as red circles on the schematic. These heat exchangers allow thermal energy to be recovered from the condensate receiver flash steam and the blowdown liquid.
The table at the bottom right shows an economic summary for the steam system that is being modeled based on the input modelconditions . On the right of the table, you see total operating cost in thousands of dollars per year.
‘Power balance’ shows the amount of power generated onsite, the amount of power imported, and the combined total site demand.
‘Fuel balance’ shows the amount of fuel consumed and the unit cost of the fuel.
‘Make‐up water’ shows the flow of makeup water in gallons per hour, and the unit cost per gallon.
At the bottom, the total operating cost is in thousands of dollars per year.
Slide 39: As you can see, there is a visual representation of your site, including the boiler, turbines, pressure reducing stations, steam
demands, and feedwater preparation components, including deaerator and the condensate tank.
The steam system model includes all of the major steam system components. However, it does not provide unlimited components andarrangements. The model is limited in extent for two primary reasons. First, the complexity is limited to allow it to be easily understood with minimal training. Second, the model is configured to ensure the users focus attention on the components that are impacted by
respond to che steam system. In other words, the configuration forces the user to identify the components in their real system that will changes in thanges in the steam system.
For example, a real steam system may include two boilers operating with different fuels. One boiler (and fuel) may serve as the base‐loadcomponent while the other boiler responds to changes in steam system demand. If the base‐load boiler is not impacted by changes in steam demand then there will be no difference (or impact) noted in the base‐load boiler. As a result, only the impact boiler characteristics need to be modeled. Even though the model is limited in extent it serves as a powerful evaluation tool even for very complex steam systems.
Also note that the Economic Summary calculations at the bottom right of the ‘Model’ tab are made based on what was typed in the ‘Input’tab. If you look at this table, you will see the annual cost results for power balance, fuel balance, and make‐up water, based on the
information you input. Keep in mind that the totals are in thousands per year. The total annual operating cost is at the bottom at
43,134,000 dollars.
Again, the results are based on the information provided to the ‘Input’ tab.
SSAT Module ‐ 15
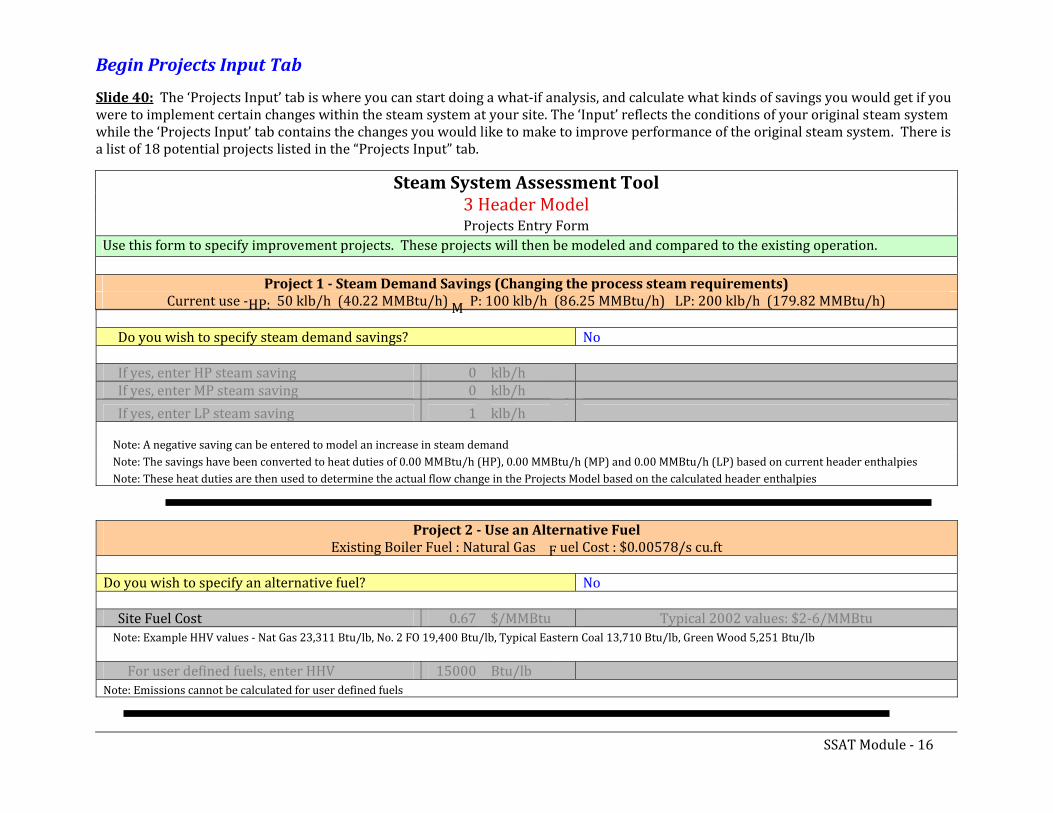
klb/h
Begin Projects Input Tab
Slide 40: The ‘Projects Input’ tab is where you can start doing a what‐if analysis, and calculate what kinds of savings you would get if youwere to implement certain changes within the steam system at your site. The ‘Input’ reflects the conditions of your original steam systemwhile the ‘Projects Input’ tab contains the changes you would like to make to improve performance of the original steam system. There isa list of 18 potential projects listed in the “Projects Input” tab.
Do you wish to specify steam demand savings? No
If yes, enter HP steam saving 0If yes, enter MP steam saving 0If yes, enter LP steam saving 1
klb/hklb/h
Note: A negative saving can be entered to model an increase in steam demandNote: The savings have been converted to heat duties of 0.00 MMBtu/h (HP), 0.00 MMBtu/h (MP) and 0.00 MMBtu/h (LP) based on current header enthalpiesNote: These heat duties are then used to determine the actual flow change in the Projects Model based on the calculated header enthalpies
Project 2 Use an Alternative FuelExisting Boiler Fuel : Natural Gas F uel Cost : $0.00578/s cu.ft
Do you wish to specify an alternative fuel? No
Site Fuel Cost 0.67 $/MMBtu Typical 2002 values: $2‐6/MMBtuNote: Example HHV values ‐ Nat Gas 23,311 Btu/lb, No. 2 FO 19,400 Btu/lb, Typical Eastern Coal 13,710 Btu/lb, Green Wood 5,251 Btu/lb
For user defined fuels, enter HHV 15000 Btu/lbNote: Emissions cannot be calculated for user defined fuels
Steam System Assessment Tool3 Header ModelProjects Entry Form
Use this form to specify improvement projects. These projects will then be modeled and compared to the existing operation.
Project 1 Steam Demand Savings (Changing the process steam requirements)Current use ‐HP: 50 klb/h (40.22 MMBtu/h) M P: 100 klb/h (86.25 MMBtu/h) LP: 200 klb/h (179.82 MMBtu/h)
SSAT Module ‐ 16
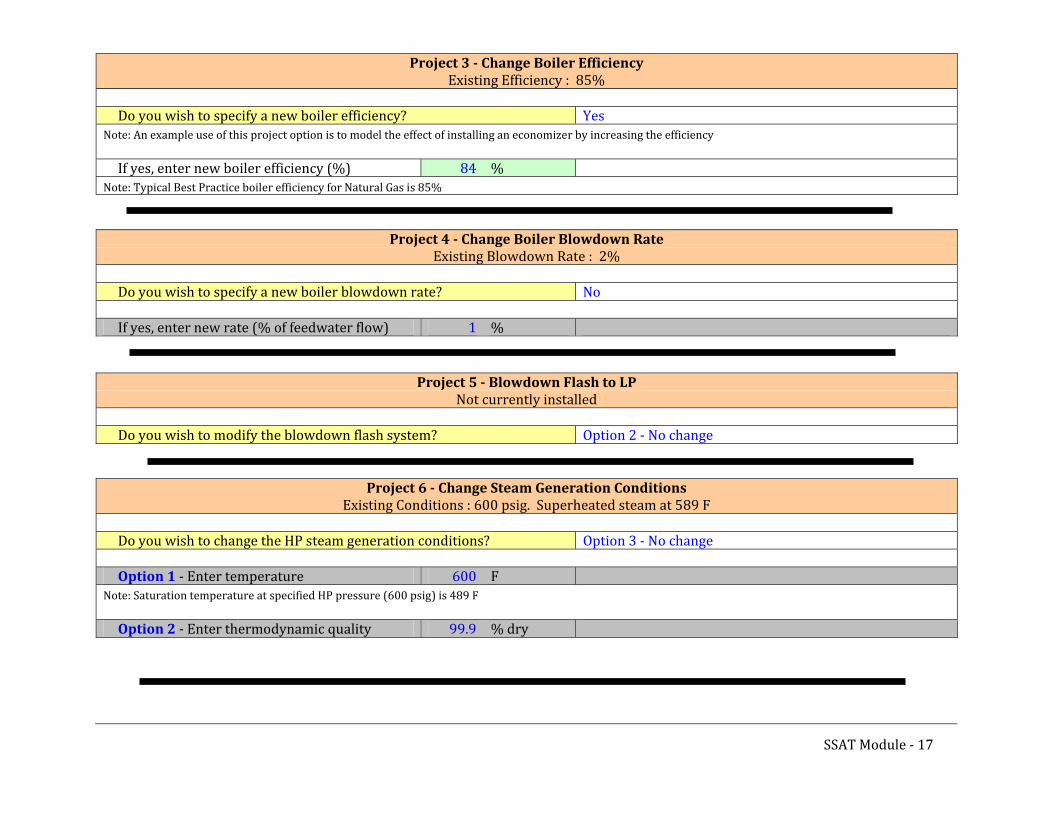
Project 3 Change Boiler EfficiencyExisting Efficiency : 85%
Do you wish to specify a new boiler efficiency? YesNote: An example use of this project option is to model the effect of installing an economizer by increasing the efficiency
If yes, enter new boiler efficiency (%) 84 %Note: Typical Best Practice boiler efficiency for Natural Gas is 85%
Project 4 Change Boiler Blowdown RateExisting Blowdown Rate : 2%
Do you wish to specify a new boiler blowdown rate? No
If yes, enter new rate (% of feedwater flow) 1 %
Project 5 Blowdown Flash to LPNot currently installed
Do you wish to modify the blowdown flash system? Option 2 ‐ No change
Project 6 Change Steam Generation ConditionsExisting Conditions : 600 psig. Superheated steam at 589 F
Do you wish to change the HP steam generation conditions? Option 3 ‐ No change
Option 1 ‐ Enter temperature 600 FNote: Saturation temperature at specified HP pressure (600 psig) is 489 F
Option 2 ‐ Enter thermodynamic quality 99.9 % dry
SSAT Module ‐ 17

klb/h
SSAT Module ‐ 18
Efficiency : 65%Project 7 HP to LP Steam Turbine(s)
Operation : Balances LP Header
Do you wish to modify the HP to LP turbine operation? No
If yes, select the appropriate turbine operating mode Option 1 – Balances LP headerNote: If Option 1 is chosen, the model will preferentially use the HP to LP turbine to balance the LP demand
Specify a new isentropic efficiency (%) 70 %Note: A generator electrical efficiency of 100% is assumed by the modelNote: Isentropic efficiency of existing turbine is 65%
Option 2 ‐ How do wish to define the fixed turbine operation? Option 2 Not Selected
Option 2 ‐ Fixed steam flow 100 klb/hOption 2 ‐ Fixed power generation 2000 kW
Option 3 ‐ How do wish to define the operating range? Option 3 Not Selected
Option 3 ‐ inimum steam flow 50
Option 3 ‐MMaximum steam flow 150
klb/h
Option 3 ‐ inimum ation 15
Option 3 ‐MMaximum
powpower generer generation 25
0000
kWkW
Efficiency : 65%Project 8 HP to MP Steam Turbine(s)
Operation : Balances MP Header
Do you wish to modify the HP to MP turbine operation? No
If yes, select the appropriate turbine operating mode Option 1 ‐ Balances LP header
Specify a new isentropic efficiency (%) 70 %Note: A generator electrical efficiency of 100% is assumed by the modelNote: Isentropic efficiency of existing turbine is 65%
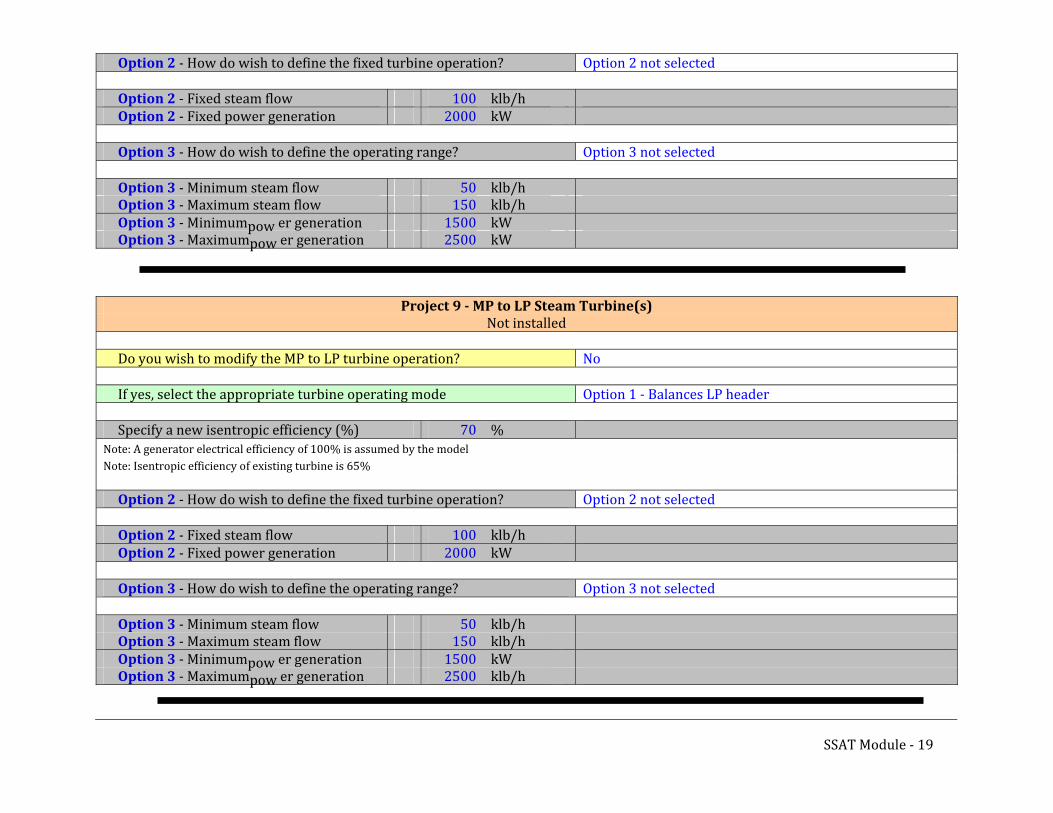
klb/h
klb/h
ixed turbine operation? Option 2 not selected
Option 2 ‐ Fixed steam flow 100 klb/hOption 2 ‐ Fixed power generation 2000 kW
Option 3 ‐ How do wish to define the operating range?
Option 3 ‐ inimum steam flow 50
Option 3 ‐MMaximum steam flow 150
klb/h
Option 3 ‐ inimum ation 15
Option 3 ‐MMaximum
powpower generer generation 25
0000
kWkW
Option 3 not selected
Project 9 MP to LP Steam Turbine(s)Not installed
Do you wish to modify the MP to LP turbine operation? No
If yes, select the appropriate turbine operating mode Option 1 ‐ Balances LP header
Specify a new isentropic efficiency (%) 70 %Note: A generator electrical efficiency of 100% is assumed by the modelNote: Isentropic efficiency of existing turbine is 65%
Option 2 ‐ How do wish to define the fixed turbine operation? Option 2 not selected
Option 2 ‐ Fixed steam flow 100 klb/hOption 2 ‐ Fixed power generation 2000 kW
Option 3 ‐ How do wish to define the operating range? Option 3 not selected
Option 3 ‐ inimum steam flow 50
Option 3 ‐MMaximum steam flow 150
klb/h
Option 3 ‐ inimum ation 15 kW Option 3 ‐
MMaximum
powpow er generer gener
ation 250000 klb/h
Option 2 ‐ How do wish to define the f
SSAT Module ‐ 19
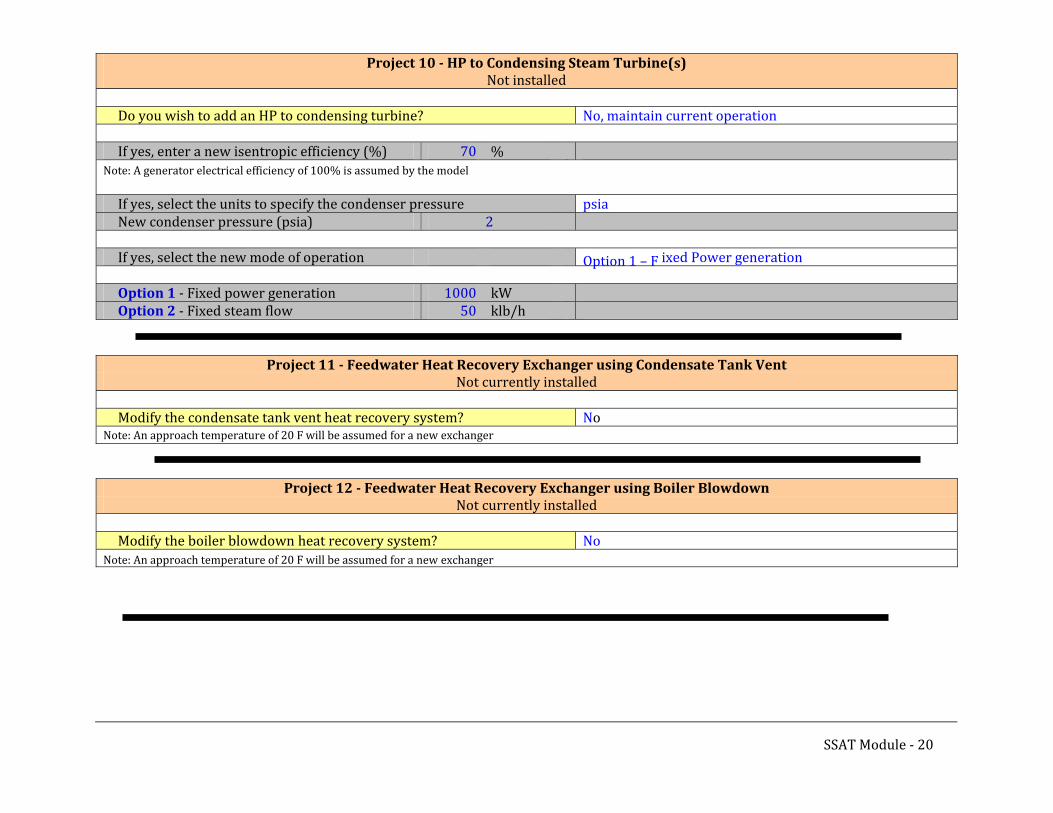
Project 10 HP to Condensing Steam Turbine(s)Not installed
Do you wish to add an HP to condensing turbine? No, maintain current operation
If yes, enter a new isentropic efficiency (%) 70 %Note: A generator electrical efficiency of 100% is assumed by the model
If yes, select the units to specify the condenser pressure psiaNew condenser pressure (psia) 2
If yes, select the new mode of operation Option 1 – F ixed Power generation
Option 1 ‐ Fixed power generation 1000 kW Option 2 ‐ Fixed steam flow 50 klb/h
Project 11 Feedwater Heat Recovery Exchanger using Condensate Tank VentNot currently installed
Modify the condensate tank vent heat recovery system? NoNote: An approach temperature of 20 F will be assumed for a new exchanger
Project 12 Feedwater Heat Recovery Exchanger using Boiler BlowdownNot currently installed
Modify the boiler blowdown heat recovery system? NoNote: An approach temperature of 20 F will be assumed for a new exchanger
SSAT Module ‐ 20
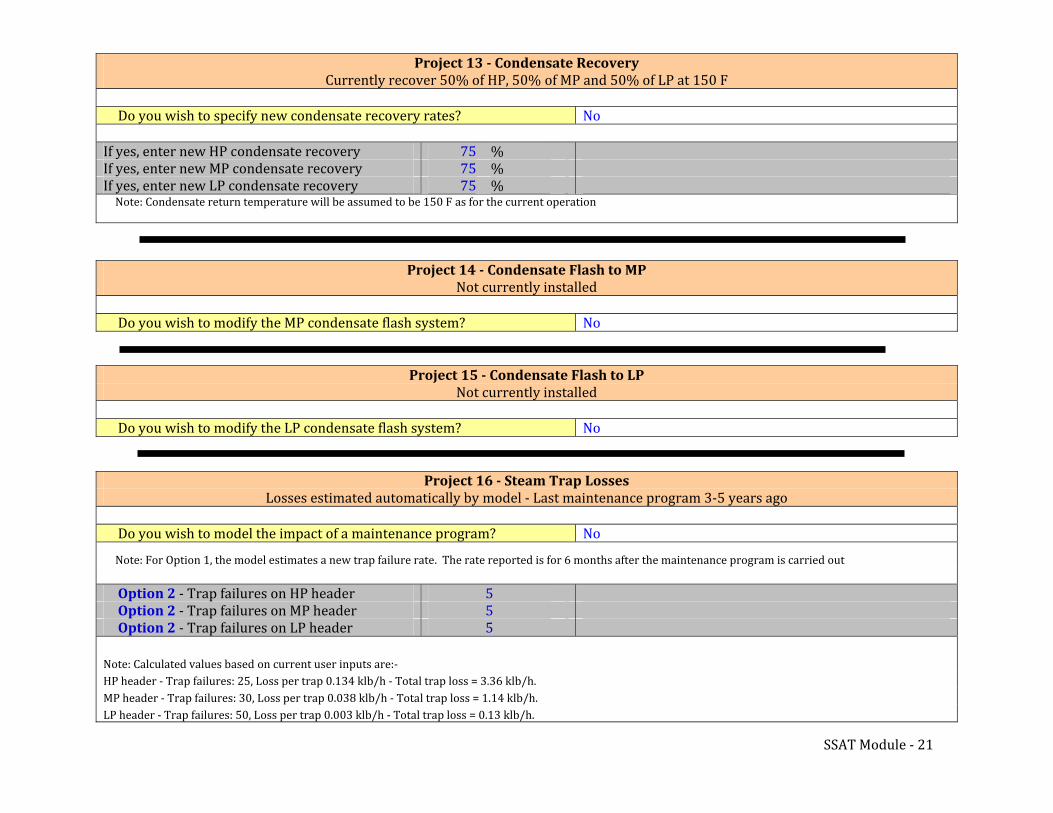
SSAT Module ‐ 21
LP header ‐ Trap failures: 50, Loss per trap 0.003 klb/h ‐ Total trap loss = 0.13 klb/h.
Project 13 Condensate RecoveryCurrently recover 50% of HP, 50% of MP and 50% of LP at 150 F
Do you wish to specify new condensate recovery rates? No
If yes, enter new HP condensate recovery 75 %If yes, enter new MP condensate recovery 75 %If yes, enter new LP condensate recovery 75 %Note: Condensate return temperature will be assumed to be 150 F as for the current operation
Project 14 Condensate Flash to MPNot currently installed
Do you wish to modify the MP condensate flash system? No
Project 15 Condensate Flash to LPNot currently installed
Do you wish to modify the LP condensate flash system? No
Project 16 Steam Trap LossesLosses estimated automatically by model ‐ Last maintenance program 3‐5 years ago
Do you wish to model the impact of a maintenance program? No
Note: For Option 1, the model estimates a new trap failure rate. The rate reported is for 6 months after the maintenance program is carried out
Option 2 ‐ T on HP header 5 Option 2 ‐ on MP header
Option 2 ‐TT
rap failuresrap failuresrap failures on LP header
55
Note: Calculated values based on current user inputs are:‐HP header ‐ Trap failures: 25, Loss per trap 0.134 klb/h ‐ Total trap loss = 3.36 klb/h.MP header ‐ Trap failures: 30, Loss per trap 0.038 klb/h ‐ Total trap loss = 1.14 klb/h.
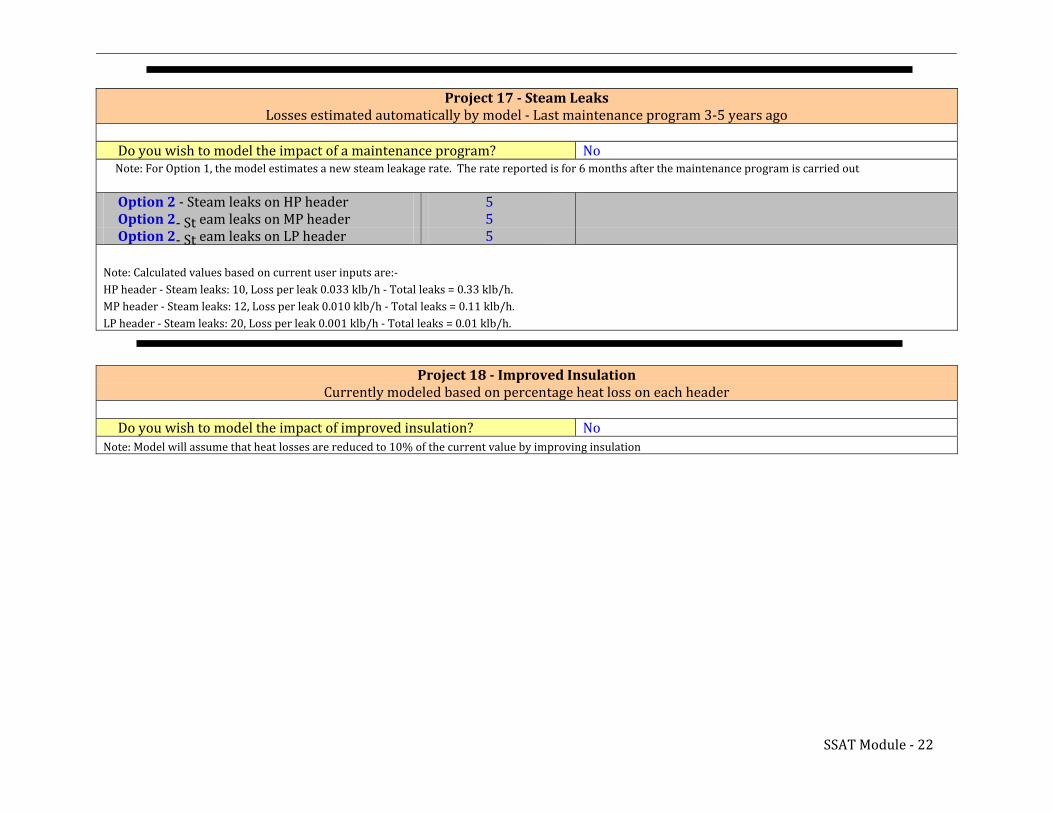
Project 17 Steam LeaksLosses estimated automatically by model ‐ Last maintenance program 3‐5 years ago
Do you wish to model the impact of a maintenance program? NoNote: For Option 1, the model estimates a new steam leakage rate. The rate reported is for 6 months after the maintenance program is carried out
Option 2 eam a HP header
Option 2 eam a MP header
Option 2
‐ St le ks on 5‐ St le ks on 5‐ St eam leaks on LP header 5
Note: Calculated values based on current user inputs are:‐HP header ‐ Steam leaks: 10, Lo 33 klb/h ‐ Total leaks = 0.33 klb/h.
MP header ‐ Steam leaks: 12, Lo 10 klb/h ‐ Total leaks = 0.11 klb/h.
LP header ‐ Steam leaks: 20, Lo
ss per leak 0.0ss per leak 0.0ss per leak 0.001 klb/h ‐ Total leaks = 0.01 klb/h.
Project 18 Improved InsulationtCurrently modeled based on percen age heat loss on each header
Do you wish to model the impact of improved insulation? NoNote: Model will assume that heat losses are reduced to 10% of the current value by improving insulation
SSAT Module ‐ 22
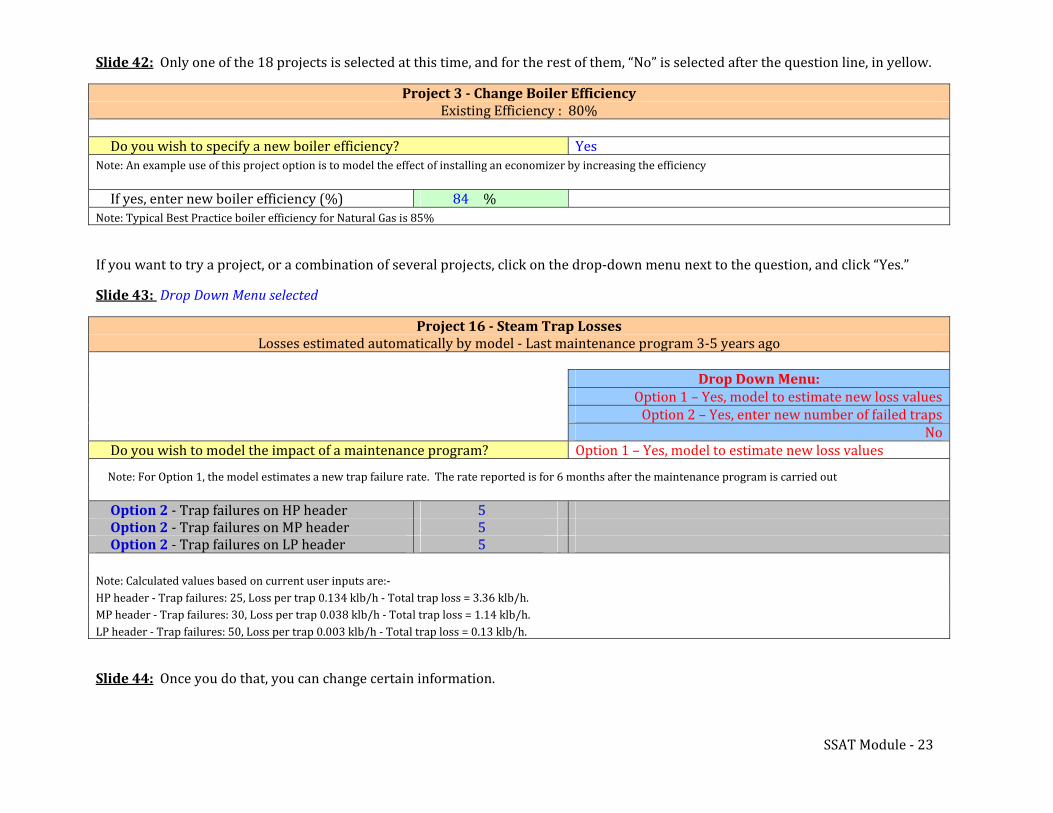
Yes
Slide 42: Only one of the 18 projects is selected at this time, and for the rest of them, “No” is selected after the question line, in yellow.
Project 3 Change Boiler EfficiencyExisting Efficiency : 80%
Do you wish to specify a new boiler efficiency?Note: An example use of this project option is to model the effect of installing an economizer by increasing the efficiency
If yes, enter new boiler efficiency (%)Note: Typical Best Practice boiler efficiency for Natural Gas is 85%
84 %
If you want to try a project, or a combination of several projects, click on the drop‐down menu next to the question, and click “Yes.”
Slide 43: Drop Down Menu selected
Project 16 Steam Trap LossesLosses estimated automatically by model ‐ Last maintenance program 3‐5 years ago
Drop Down Menu:Option 1 – Yes, model to estimate new loss valuesOption 2 – Yes, enter new number of failed traps
NoDo you wish to model the impact of a maintenance program? Option 1 – Yes, model to estimate new loss values
Note: For Option 1, the model estimates a new trap failure rate. The rate reported is for 6 months after the maintenance program is carried out
Option 2 ‐ on HP header
Option 2 ‐ on MP header
Option 2 ‐
TTT
rap failuresrap failuresrap failures on LP header
555
Note: Calculated values based on current user inputs are:‐HP header ‐ Trap failures: 25, Loss per trap 0.134 klb/h ‐ Total trap loss = 3.36 klb/h.MP header ‐ Trap failures: 30, Loss per trap 0.038 klb/h ‐ Total trap loss = 1.14 klb/h.LP header ‐ Trap failures: 50, Loss per trap 0.003 klb/h ‐ Total trap loss = 0.13 klb/h.
Slide 44: Once you do that, you can change certain information.
SSAT Module ‐ 23
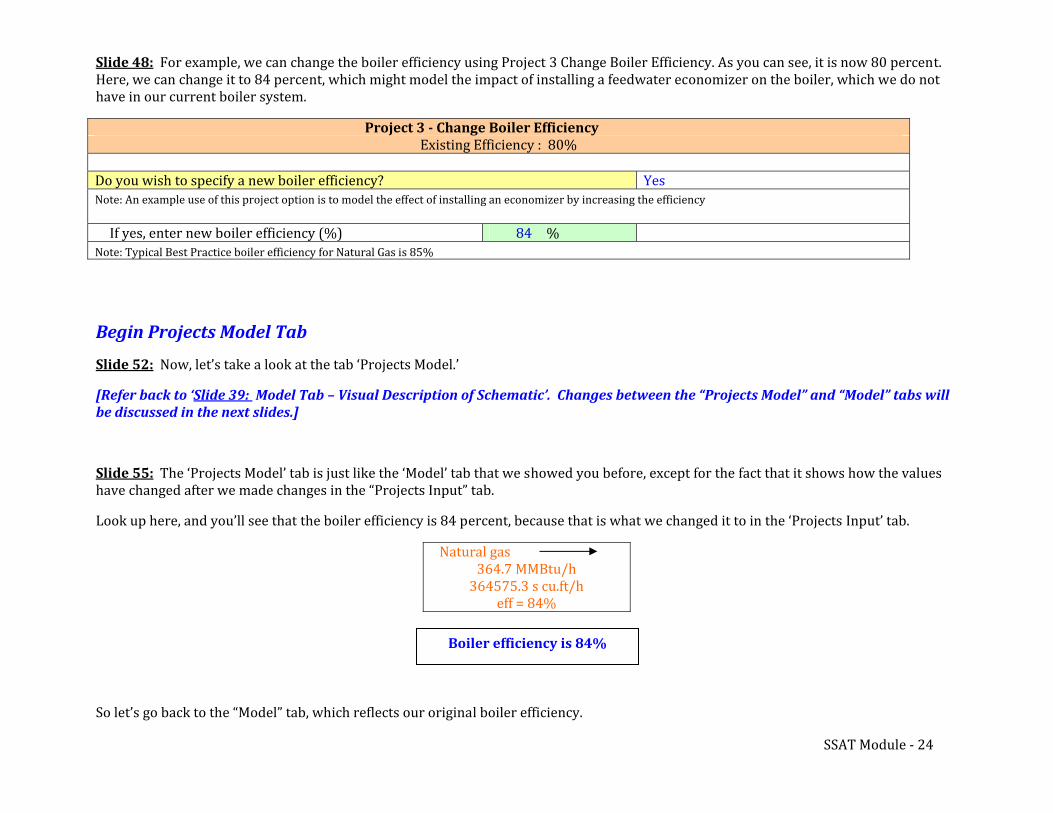
Slide 48: For example, we can change the boiler efficiency using Project 3 Change Boiler Efficiency. As you can see, it is now 80 percent. Here, we can change it to 84 percent, which might model the impact of installing a feedwater economizer on the boiler, which we do nothave in our current boiler system.
Project 3 Change Boiler EfficiencyExisting Efficiency : 80%
Do you wish to specify a new boiler efficiency? YesNote: An example use of this project option is to model the effect of installing an economizer by increasing the efficiency
If yes, enter new boiler efficiency (%) 84 %Note: Typical Best Practice boiler efficiency for Natural Gas is 85%
Begin Projects Model Tab
Slide 52: Now, let’s take a look at the tab ‘Projects Model.’
[Refer back to ‘Slide 39: Model Tab – Visual Description of Schematic’. Changes between the “Projects Model” and “Model” tabs will
be discussed in the next slides.]
Slide 55: The ‘Projects Model’ tab is just like the ‘Model’ tab that we showed you before, except for the fact that it shows how the values have changed after we made changes in the “Projects Input” tab.
Look up here, and you’ll see that the boiler efficiency is 84 percent, because that is what we changed it to in the ‘Projects Input’ tab.
Natural gas364.7 MMBtu/h 364575.3 s cu.ft/h eff = 84%
Boiler efficiency is 84%
So let’s go back to the “Model” tab, which reflects our original boiler efficiency.
SSAT Module ‐ 24
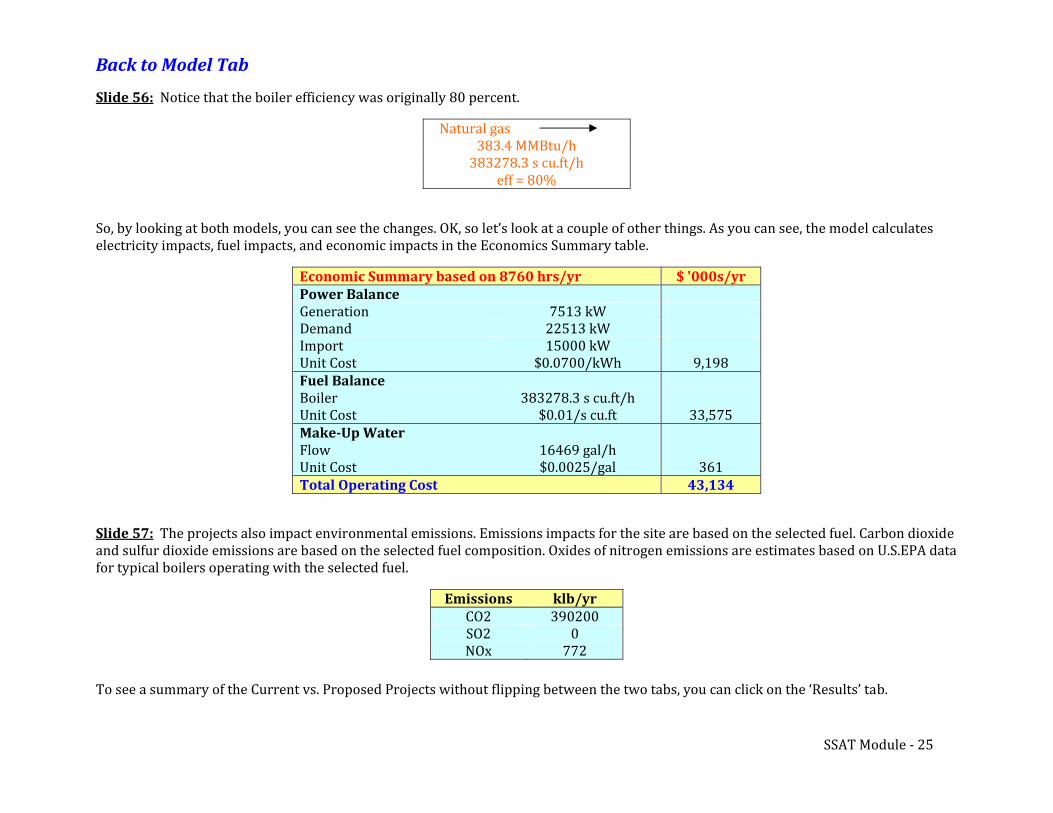
Back to Model Tab
Slide 56: Notice that the boiler efficiency was originally 80 percent.
Natural gas383.4 MMBtu/h
383278.3 s cu.ft/h
eff = 80%
So, by looking at both models, you can see the changes. OK, so let’s look at a couple of other things. As you can see, the model calculates electricity impacts, fuel impacts, and economic impacts in the Economics Summary table.
Economic Summary based on 8760 hrs/yr $ '000s/yr Power BalanceGenerationDemandImportUnit Cost
7513 kW 22513 kW 15000 kW $0.0700/kWh 9,198
Fuel BalanceBoilerUnit Cost
383278.3 s cu.ft/h $0.01/s cu.ft 33,575
MakeUp Water
FlowUnit Cost
16469 gal/h$0.0025/gal 361
Total Operating Cost 43,134
Slide 57: The projects also impact environmental emissions. Emissions impacts for the site are based on the selected fuel. Carbon dioxide and sulfur dioxide emissions are based on the selected fuel composition. Oxides of nitrogen emissions are estimates based on U.S.EPA data for typical boilers operating with the selected fuel.
SO2 0NOx 772
Emissions klb/yr
CO2 390200
To see a summary of the Current vs. Proposed Projects without flipping between the two tabs, you can click on the ‘Results’ tab.
SSAT Module ‐ 25
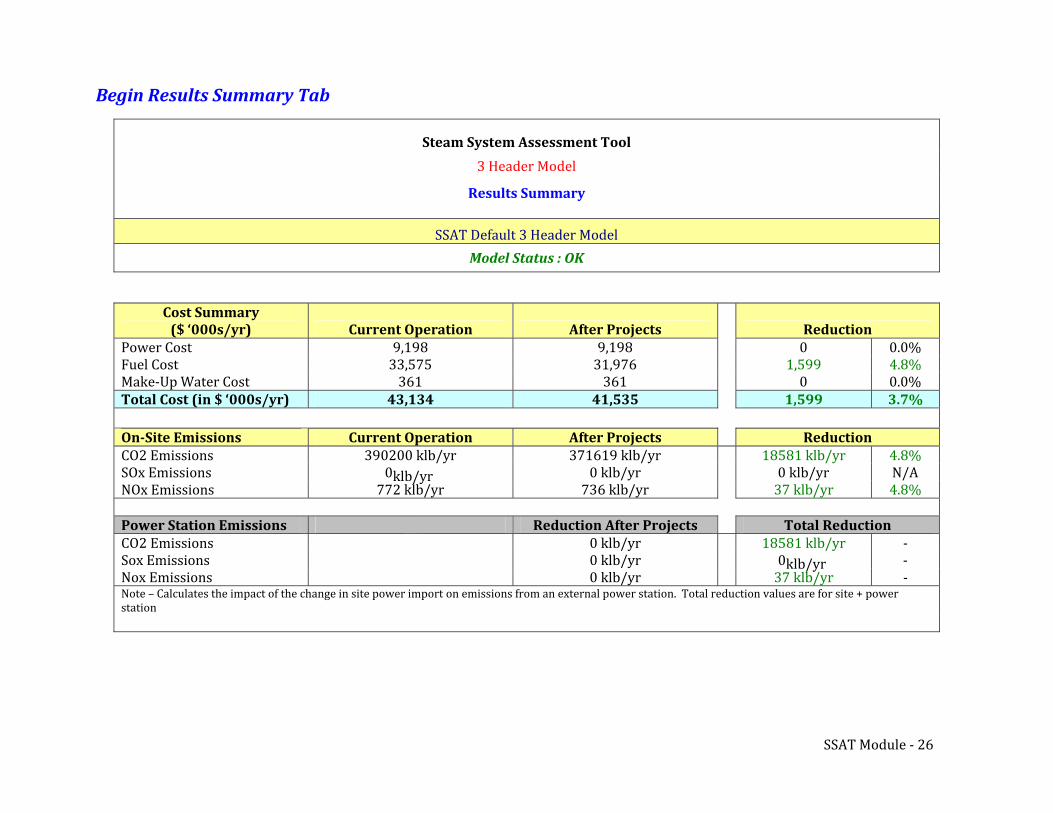
.8% 4r 5818
klb/yr
Begin Results Summary Tab
Steam System Assessment Tool
3 Header Model
Results Summary
SSAT Default 3 Header Model Model Status : OK
Cost Summary
($ ‘000s/yr) Current Operation After ProjectsPower Cost 9,198 9,198Fuel Cost 33,575 31,976Make‐Up Water Cost 361 361 Total Cost (in $ ‘000s/yr) 43,134 41,535
Reduction0 0.0%1,599 4.8%0 0.0%
1,599 3.7%
OnSite Emissions Current Operation After Projects ReductionCO2 Emissions 390200 klb/yr 371619 klb/yr 1 klb/ySOx Emissions 0 klb/yr 0 klb/yr 0 klb/yr N/ANOx Emissions 772 klb/yr 736 klb/yr 37 klb/yr 4.8%
0 klb/yrSox Emissions 0 klb/yr 0 klb/yr ‐Nox Emissions 0 klb/yr 37 ‐Note – Calculates the impact of the change in site power import on emissions from an external power station. Total reduction values are for site + powerstation
Power Station Emissions Reduction After Projects Total ReductionCO2 Emissions 18581 klb/yr ‐
SSAT Module ‐ 26
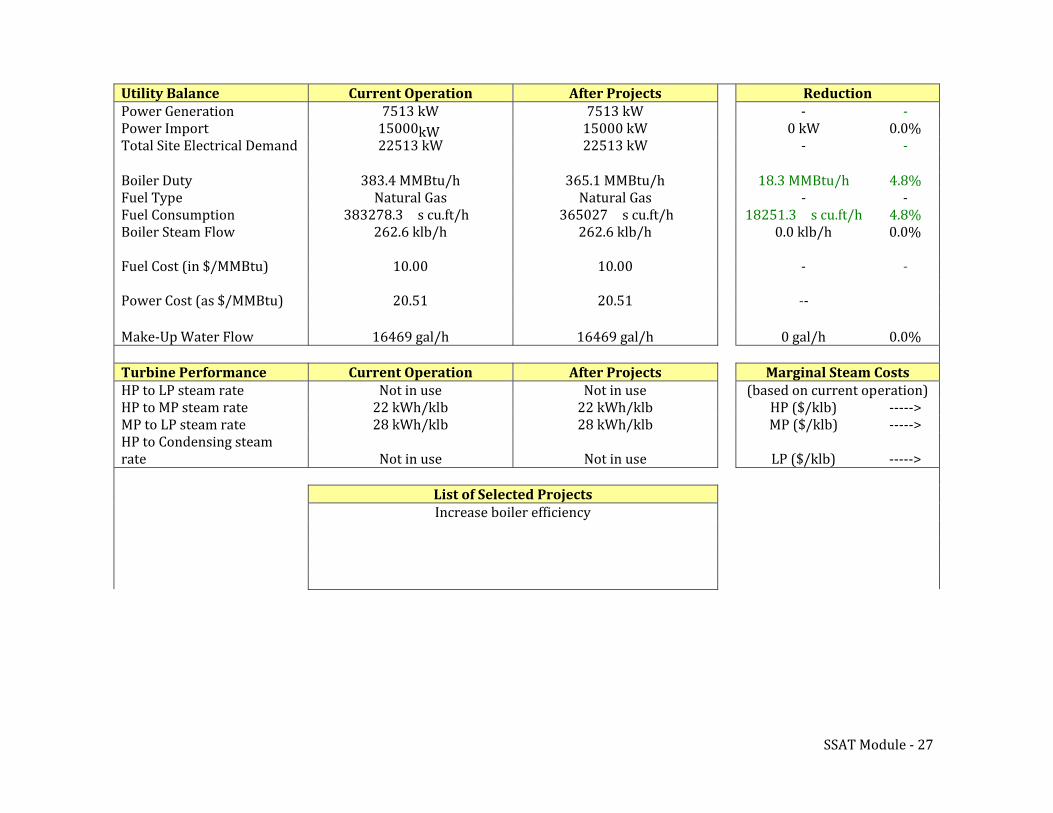
Utility Balance Current Operation After Projects ReductionPower Generation 7513 kW 7513 kW ‐ ‐Power Import 15000 kW 15000 kW 0 kW 0.0%Total Site Electrical Demand 22513 kW 22513 kW ‐ ‐
Boiler Duty 383.4 MMBtu/h 365.1 MMBtu/h 18.3 MMBtu/h 4.8%Fuel Type Natural Gas Natural Gas ‐ ‐Fuel Consumption 383278.3 s cu.ft/h 365027 s cu.ft/h 18251.3 s cu.ft/h 4.8%Boiler Steam Flow 262.6 klb/h 262.6 klb/h 0.0 klb/h 0.0%
Fuel Cost (in $/MMBtu) 10.00 10.00 ‐ ‐
Power Cost (as $/MMBtu) 20.51 20.51 ‐‐
Make‐Up Water Flow 16469 gal/h 16469 gal/h 0 gal/h 0.0%
Turbine Performance Current Operation After Projects Marginal Steam CostsHP to LP steam rate Not in use Not in use (based on current operation)HP to MP steam rate 22 kWh/klb 22 kWh/klb HP ($/klb) ‐‐‐‐‐>MP to LP steam rate 28 kWh/klb 28 kWh/klb MP ($/klb) ‐‐‐‐‐>HP to Condensing steamrate Not in use Not in use LP ($/klb) ‐‐‐‐‐>
List of Selected ProjectsIncrease boiler efficiency
SSAT Module ‐ 27
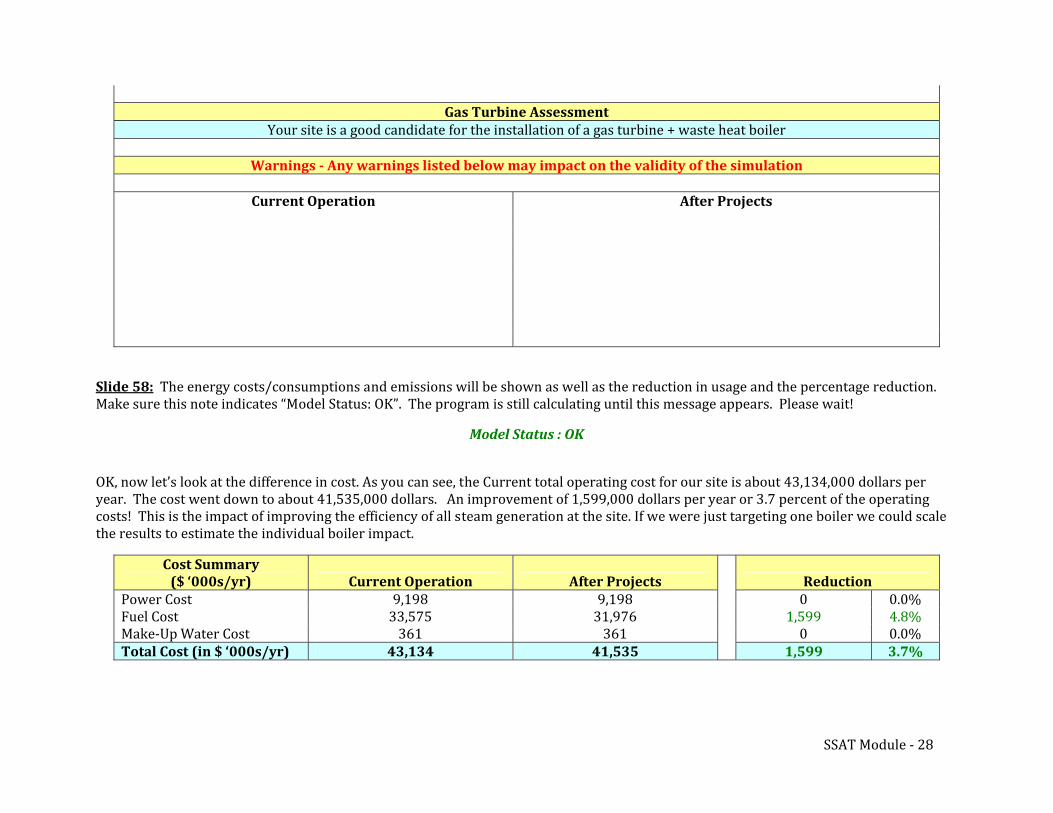
Gas Turbine AssessmentYour site is a good candidate for the installation of a gas turbine + waste heat boiler
Warnings Any warnings listed below may impact on the validity of the simulation
Current Operation After Projects
Slide 58: The energy costs/consumptions and emissions will be shown as well as the reduction in usage and the percentage reduction. Make sure this note indicates “Model Status: OK”. The program is still calculating until this message appears. Please wait!
Model Status : OK OK, now let’s look at the difference in cost. As you can see, the Current total operating cost for our site is about 43,134,000 dollars peryear. The cost went down to about 41,535,000 dollars. An improvement of 1,599,000 dollars per year or 3.7 percent of the operating costs! This is the impact of improving the efficiency of all steam generation at the site. If we were just targeting one boiler we could scale
the results to estimate the individual boiler impact.
Cost Summary
($ ‘000s/yr)
Power Cost Current Operation
9 8
After Projects
9 8
Reduction0 0.0%
Fuel Cost Make‐Up Water Cost
,1933,575 361
,1931,976 361
1,5990
4.8%0.0%
Total Cost (in $ ‘000s/yr) 43,134 41,535 1,599 3.7%
SSAT Module ‐ 28
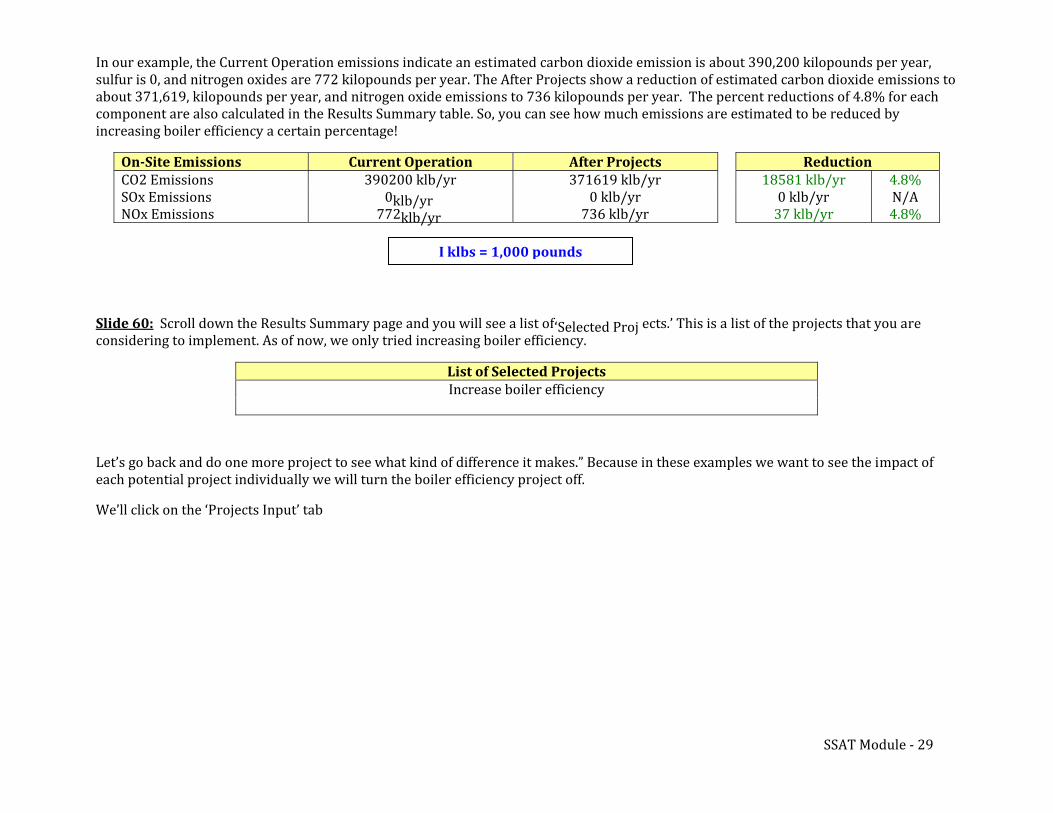
In our example, the Current Operation emissions indicate an estimated carbon dioxide emission is about 390,200 kilopounds per year,sulfur is 0, and nitrogen oxides are 772 kilopounds per year. The After Projects show a reduction of estimated carbon dioxide emissions toabout 371,619, kilopounds per year, and nitrogen oxide emissions to 736 kilopounds per year. The percent reductions of 4.8% fcomponent are also calculated in the Results Summary table. So, you can see how much emissions are estimated to be reduced by
or each
increasing boiler efficiency a certain percentage!
OnSite Emissions Current Operation After Projects ReductionCO2 Emissions 390200 klb/yr 371619 klb/yr 18581 klb/yr 4.8%SOx Emissions 0 klb/yr 0 klb/yr N/ANOx Emissions 77
02klb/yrklb/yr 736 klb/yr 37 klb/yr 4.8%
I klbs = 1,000 pounds
Slide 60: Scroll down the Results Summary page and you will see a list ofconsidering to implement. As of now, we only tried increasing boiler efficiency.
‘Selected Proj ects.’ This is a list of the projects that you are
List of Selected ProjectsIncrease boiler efficiency
Let’s go back and do one more project to see what kind of difference it makes.” Because in these examples we want to see the impact ofeach potential project individually we will turn the boiler efficiency project off.
We’ll click on the ‘Projects Input’ tab
SSAT Module ‐ 29
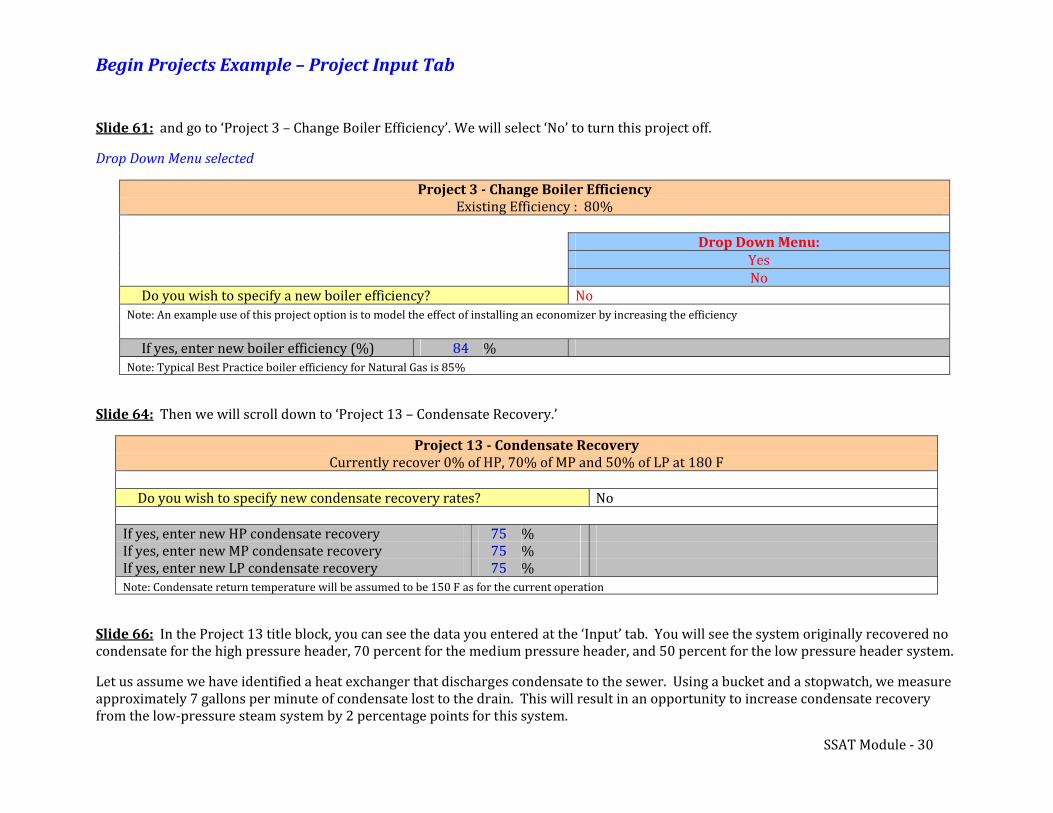
ondensate recovery
Project 13 Condensate RecoveryCurrently recover 0% of HP, 70% of MP and 50% of LP at
Do you wish to specify new condensate recovery rates? No
nter new HP cnter new MP c
ondensate recoveryIfIfIf
yyy
es, ees, ees, enter new LP condensate recovery
757575
%%%
180 F
Begin Projects Example – Project Input Tab
Slide 61: and go to ‘Project 3 – Change Boiler Efficiency’. We will select ‘No’ to turn this project off.
Drop Down Menu selected
Project 3 Change Boiler EfficiencyExisting Efficiency : 80%
Drop Down Menu:YesNo
Do you wish to specify a new boiler efficiency? NoNote: An example use of this project option is to model the effect of installing an economizer by increasing the efficiency
If yes, enter new boiler efficiency (%)Note: Typical Best Practice boiler efficiency for Natural Gas i
84s 85%
%
’Slide 64: Then we will scroll down to ‘Project 13 – Condensate Recovery.
Note: Condensate return temperature will be assumed to be 150 F as for the current operation
Slide 66: In the Project 13 title block, you can see the data you entered at the ‘Input’ tab. You will see the system originally recovered nocondensate for the high pressure header, 70 percent for the medium pressure header, and 50 percent for the low pressure header system.
Let us assume we have identified a heat exchanger that discharges condensate to the sewer. Using a bucket and a stopwatch, we measureapproximately 7 gallons per minute of condensate lost to the drain. This will result in an opportunity to increase condensate recoveryfrom the low‐pressure steam system by 2 percentage points for this system.
SSAT Module ‐ 30
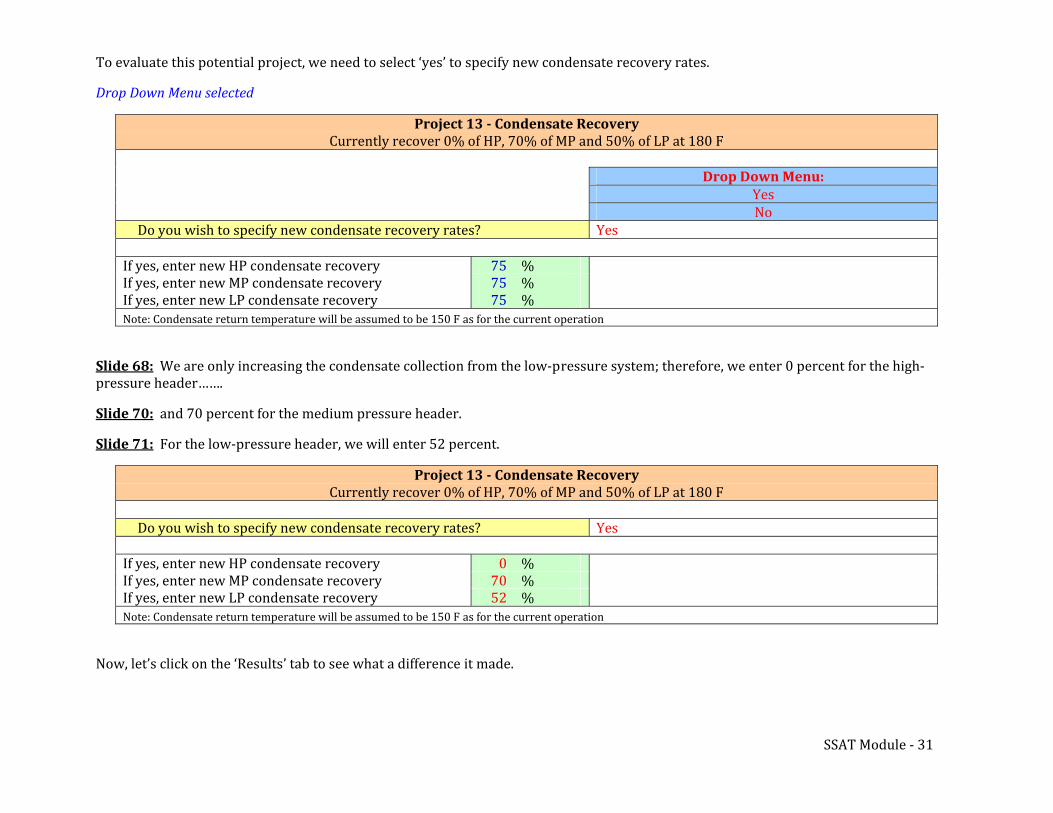
Project 13 Condensate RecoveryCurrently recover 0% of HP, 70% of MP and 50% of LP at 180 F
tDo you wish to specify new condensa e recovery rates? Yes
nter new HP cyy nter new MP c
ondensate recoveryondensate recovery
IfIfIf y
es, ees, ees, enter new LP condensate recovery
7052
%%%
0
To evaluate this potential project, we need to select ‘yes’ to specify new condensate recovery rates.
Drop Down Menu selected
Project 13 Condensate RecoveryCurrently recover 0% of HP, 70% of MP and 50% of LP at 180 F
Drop Down Menu:YesNo
Do you wish to specify new condensate recovery rates? Yes
nter new HP cnter new MP c
If yes, e ondensate recovery 75 %If yes, e ondensate recovery 75 %If yes, enter new LP condensate recovery 75 %Note: Condensate return temperature will be assumed to be 150 F as for the current operation
Slide 68: We are only increasing the condensate collection from the low‐pressure system; therefore, we enter 0 percent for the high‐pressure header…….
Slide 70: and 70 percent for the medium pressure header.
Slide 71: For the low‐pressure header, we will enter 52 percent.
Note: Condensate return temperature will be assumed to be 150 F as for the current operation
Now, let’s click on the ‘Results’ tab to see what a difference it made.
SSAT Module ‐ 31
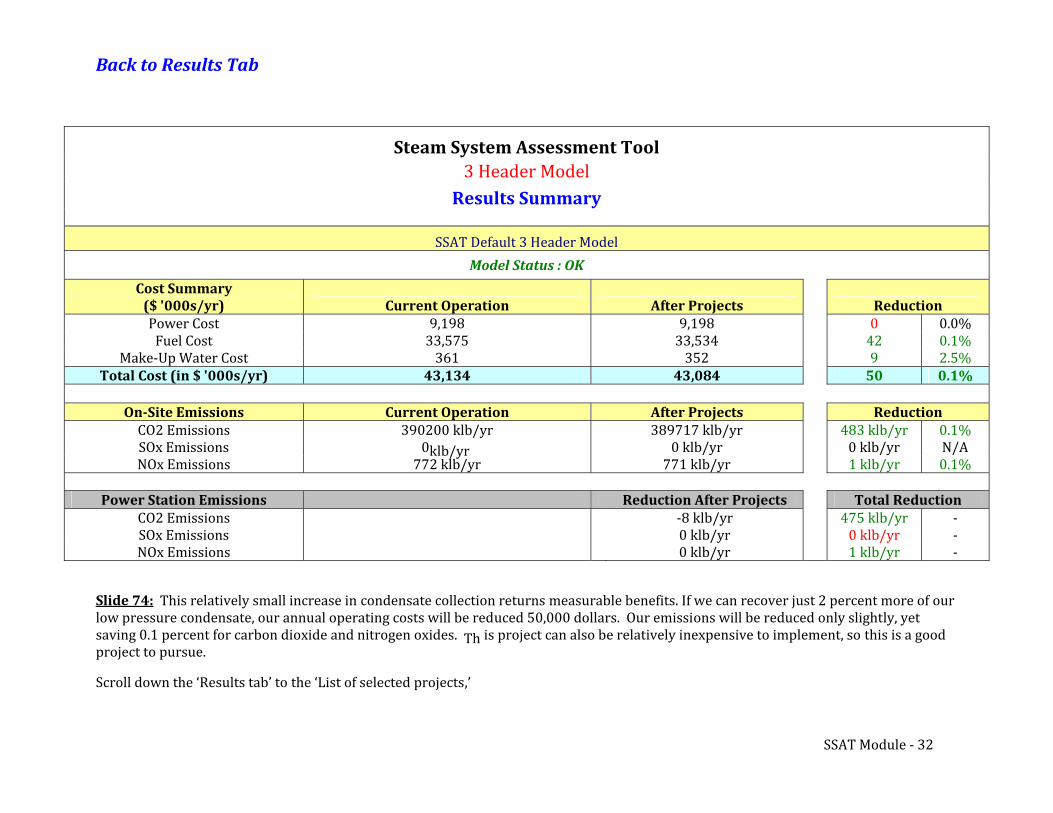
Back to Results Tab
Steam System Assessment Tool3 Header Model Results Summary
SSAT Default 3 Header Model Model Status : OK
Cost Summary
($ '000s/yr) Current Operation After Projects ReductionPower Cost 9,198 9,198 0 0.0%Fuel Cost 33,575 33,534 42 0.1%
Make‐Up Water Cost 361 352 9 2.5% Total Cost (in $ '000s/yr) 43,134 43,084 50 0.1%
OnSite Emissions Current Operation After Projects ReductionCO2 Emissions 390200 klb/yr 389717 klb/yr 483 klb/yr 0.1%SOx Emissions 0 klb/yr 0 klb/yr 0 klb/yr N/ANOx Emissions 772 klb/yr 771 klb/yr 1 klb/yr 0.1%
Power Station Emissions Reduction After Projects Total ReductionCO2 Emissions ‐8 klb/yr 475 klb/yr ‐SOx Emissions 0 klb/yr 0 klb/yr ‐NOx Emissions 0 klb/yr 1 klb/yr ‐
Slide 74: This relatively small increase in condensate collection returns measurable benefits. If we can recover just 2 percent more of ourlow pressure condensate, our annual operating costs will be reduced 50,000 dollars. Our emissions will be reduced only slightly, yetsaving 0.1 percent for carbon dioxide and nitrogen oxides. Th is project can also be relatively inexpensive to implement, so this is a goodproject to pursue.
Scroll down the ‘Results tab’ to the ‘List of selected projects,’
SSAT Module ‐ 32
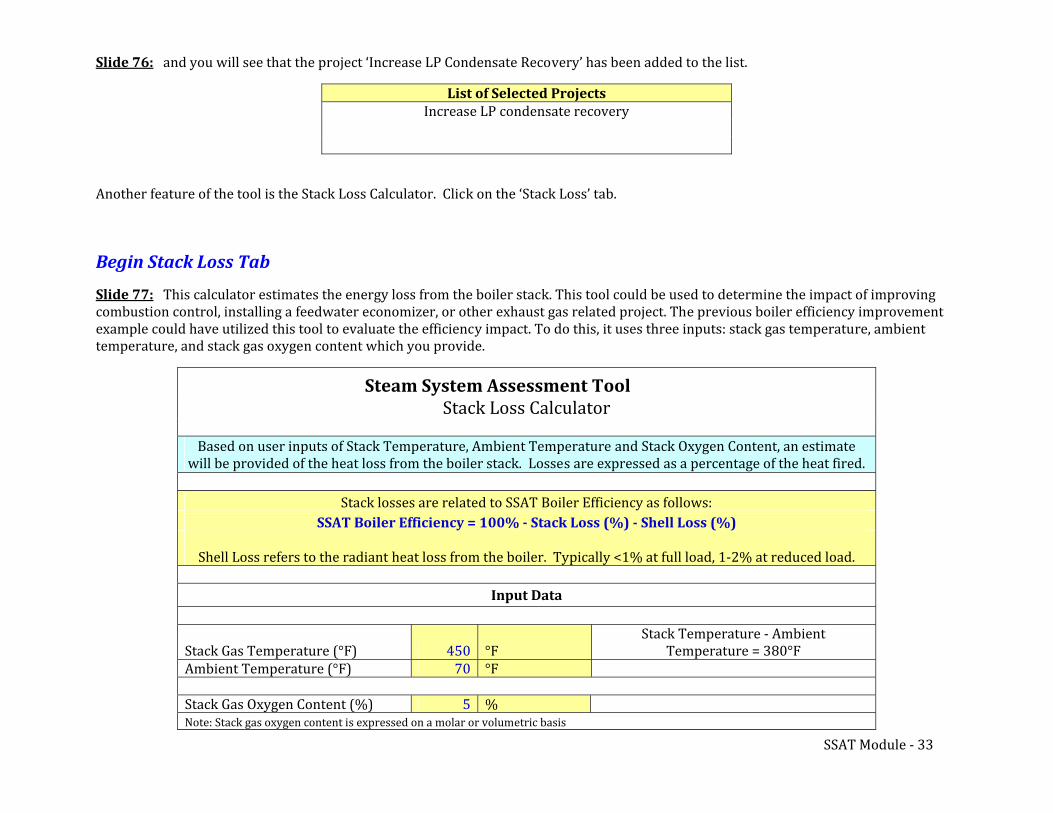
Steam System Assessment ToolStack Loss Calculator
bBased on user inputs of Stack Temperature, Amf the heat fired. will be provided of the heat loss from the boiler stack.
ient Temperature and Stack Oxygen Content, an estimate Losses are expressed as a percentage o
Stack losses are related to SSAT Boiler Efficiency as follows: SSAT Boiler Efficiency = 100% Stack Loss (%) Shell Loss (%)
Shell Loss refers to the radiant heat loss from the boiler. Typically <1% at full load, 1‐2% at reduced load.
Input Data
entStack Gas Temperature (°F) Ambient Temperature (°F)
45070
°F°F
r380°F
Stack Tempe ature ‐ AmbiTemperature =
Stack Gas Oxygen Content (%) Note: S i
5 %t
Slide 76: and you will see that the project ‘Increase LP Condensate Recovery’ has been added to the list.
List of Selected ProjectsIncrease LP condensate recovery
Another feature of the tool is the Stack Loss Calculator. Click on the ‘Stack Loss’ tab.
Begin Stack Loss Tab
Slide 77: This calculator estimates the energy loss from the boiler stack. This tool could be used to determine the impact of improving
combustion control, installing a feedwater economizer, or other exhaust gas related project. The previous boiler efficiency improvement example could have utilized this tool to evaluate the efficiency impact. To do this, it uses three inputs: stack gas temperature, ambient temperature, and stack gas oxygen content which you provide.
ack gas oxygen content s expressed on a molar or volumetric basis
SSAT Module ‐ 33
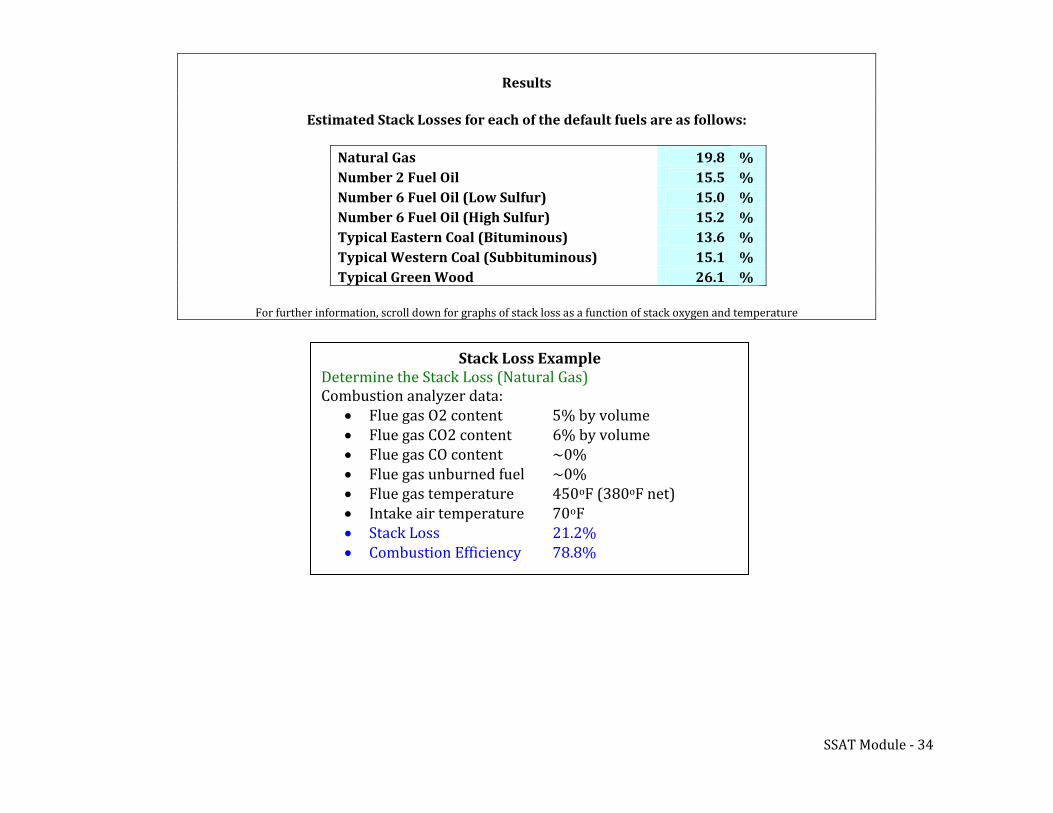
Results
Estimated Stack Losses for each of the default fuels are as follows:
Natural Gas
Number 2 Fuel Oil
Number 6 Fuel Oil (Low Sulfur)
Number 6 Fuel Oil (High Sulfur)
Typical Eastern Coal (Bituminous)
Typical Western Coal (Subbituminous)
Typical Green Wood
For further information, scroll d
19.8 %
15.5 %
15.0 %
15.2 %
13.6 %
15.1 % 26.1 %
own for graphs of stack loss as a function of stack oxygen and temperature
Stack Loss Example
Determine the Stack Loss (Natural Gas)Combustion analyzer data: • Flue gas O2 content 5% by volume• Flue gas CO2 content 6% by volume• Flue gas CO content ~0% • Flue gas unburned fuel ~0% • Flue gas temperature 450oF (380oF net)
o• Intake air temperature 70 F • Stack Loss 21.2% • Combustion Efficiency 78.8%
SSAT Module ‐ 34
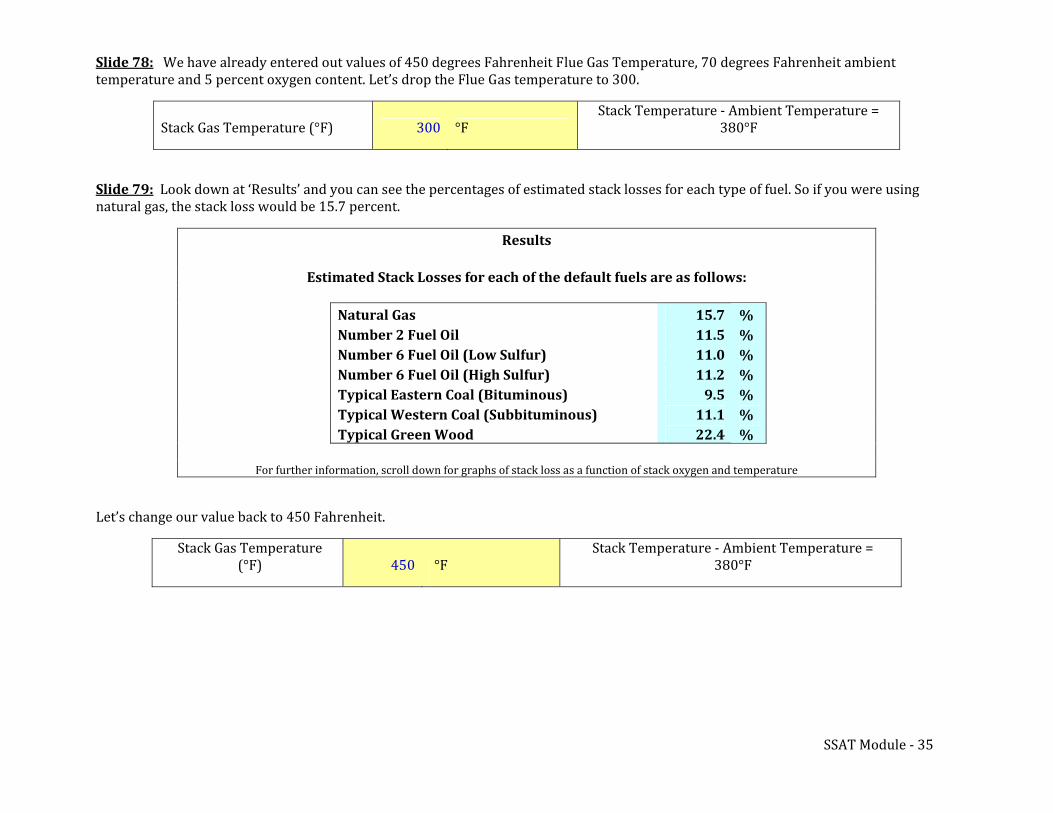
Slide 78:
Stack Gas Temperature (°F) 300 °F Stack Temperature ‐ Ambient Temperature =
380°F
We have already entered out values of 450 degrees Fahrenheit Flue Gas Temperature, 70 degrees Fahrenheit ambienttemperature and 5 percent oxygen content. Let’s drop the Flue Gas temperature to 300.
Slide 79: Look down at ‘Results’ and you can see the percentages of estimated stack losses for each type of fuel. So if you were using natural gas, the stack loss would be 15.7 percent.
Results
Estimated Stack Losses for each of the default fuels are as follows: Natural Gas
Number 2 Fuel Oil
Number 6 Fuel Oil (Low Sulfur)
Number 6 Fuel Oil (High Sulfur)
Typical Eastern Coal (Bituminous)
Typical Western Coal (Subbituminous) Typical Green Wood
For further information, scroll d
Let’s change our value back to 450 Fahrenheit.
15.7 %
11.5 %
11.0 %
11.2 %
9.5 %
11.1 %
22.4 %
own for graphs of stack loss as a function of stack oxygen and temperature
Stack Gas Temperature(°F) 450 °F
Stack Temperature ‐ Ambient Temperature = 380°F
SSAT Module ‐ 35
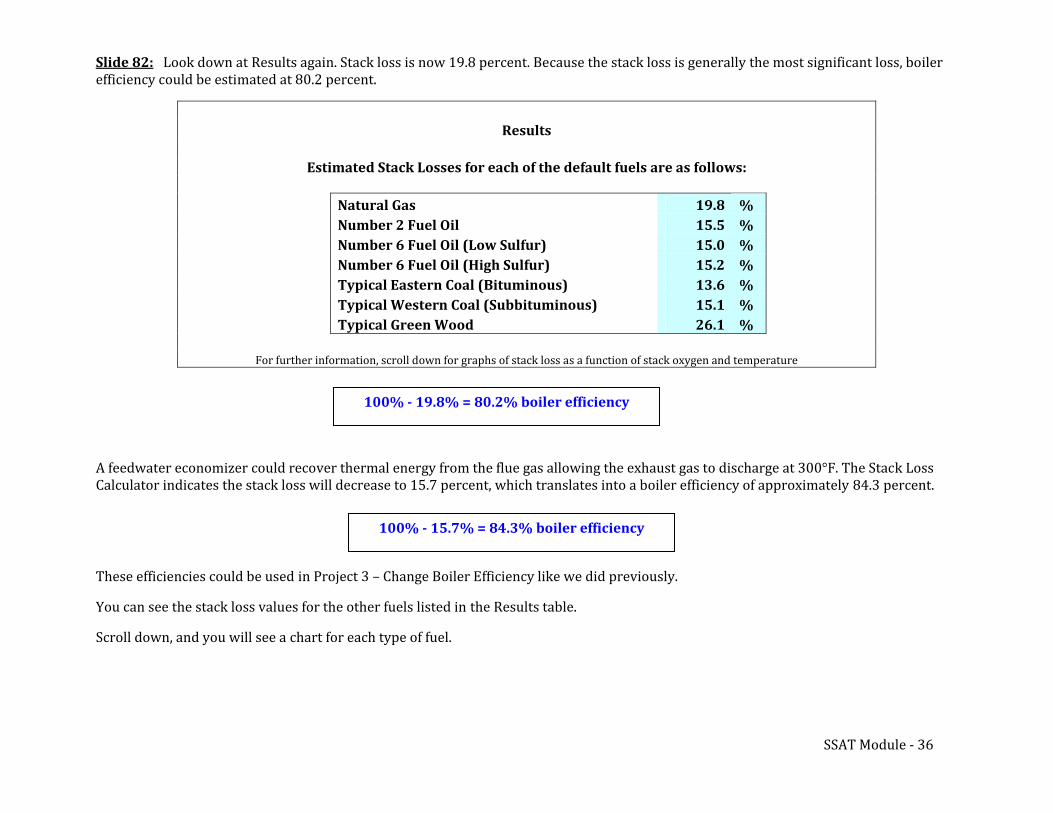
Slide 82: Look down at Results again. Stack loss is now 19.8 percent. Because the stack loss is generally the most significant loss, boiler efficiency could be estimated at 80.2 percent.
Results
Estimated Stack Losses for each of the default fuels are as follows:
Natural Gas
Number 2 Fuel Oil
Number 6 Fuel Oil (Low Sulfur)
Number 6 Fuel Oil (High Sulfur)
Typical Eastern Coal (Bituminous)
Typical Western Coal (Subbituminous)
Typical Green Wood
For further information, scroll d
19.8 %
15.5 %
15.0 %
15.2 % 13.6 % 15.1 %
26.1 %
own for graphs of stack loss as a function of stack oxygen and temperature
100% 19.8% = 80.2% boiler efficiency
A feedwater economizer could recover thermal energy from the flue gas allowing the exhaust gas to discharge at 3mately 84.3 percent. Calculator indicates the stack loss will decrease to 15.7 percent, which translates into a boiler efficiency of approx i00°F. The Stack Loss
100% 15.7% = 84.3% boiler efficiency
These efficiencies could be used in Project 3 – Change Boiler Efficiency like we did previously.
You can see the stack loss values for the other fuels listed in the Results table.
Scroll down, and you will see a chart for each type of fuel.
SSAT Module ‐ 36
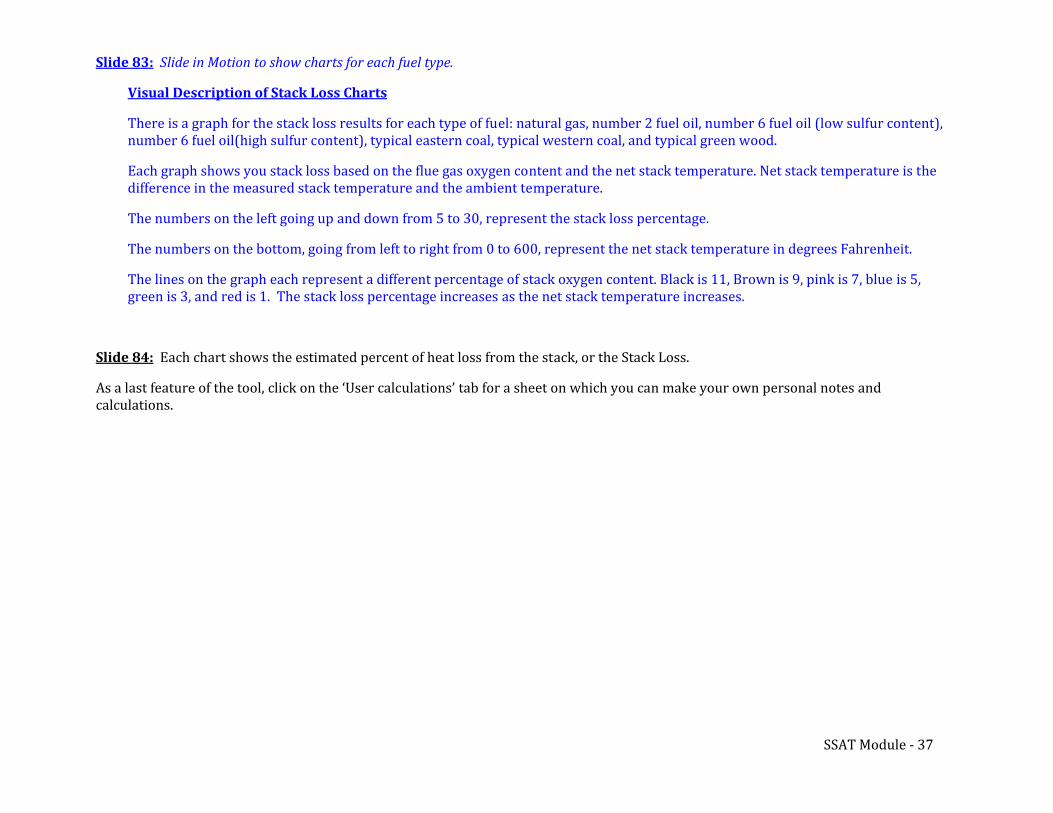
Slide 83: Slide in Motion to show charts for each fuel type.
Visual Description of Stack Loss Charts
There is a graph for the stack loss results for each type onumber 6 fuel oil(high sulfur content), typical eastern coa
f fuel: natural gas, number 2 fuel oil, number 6 fuel oil (low sulfur content), l, typical western coal, and typical green wood.
Each graph shows you stack loss based on the flue gas oxygen content and the net stack temperature. Net stack temperature is thedifference in the measured stack temperature and the ambient temperature.
The numbers on the left going up and down from 5 to 30, represent the stack loss percentage.
The numbers on the bottom, going from left to right from 0 to 600, represent the net stack temperature in degrees Fahrenheit.
The lines on the graph each represent a different percentage of stack oxygen content. Black is 11, Brown is 9, pink is 7, blue is 5,
green is 3, and red is 1. The stack loss percentage increases as the net stack temperature increases.
Slide 84: Each chart shows the estimated percent of heat loss from the stack, or the Stack Loss.
As a last feature of the tool, click on the ‘User calculations’ tab for a sheet on which you can make your own personal notes and
calculations.
SSAT Module ‐ 37
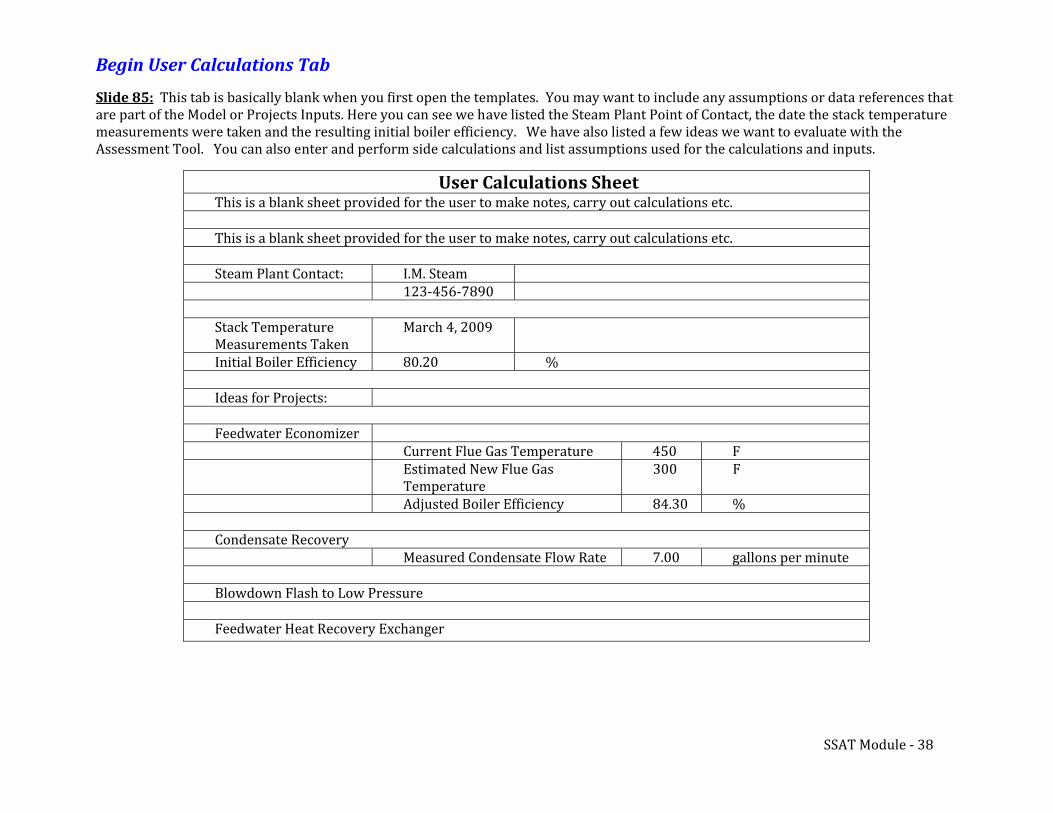
Begin User Calculations Tab
Slide 85: This tab is basically blank when you first open the templates. You may want to include any assumptions or data references thatare part of the Model or Projects Inputs. Here you can see we have listed the Steam Plant Point of Contact, the date the stack temperature measurements were taken and the resulting initial boiler efficiency. We have also listed a few ideas we want to evaluate with theAssessment Tool. You can also enter and perform side calculations and list assumptions used for the calculations and inputs.
Feedwater Heat Recovery Exchanger
User Calculations SheetThis is a blank sheet provided for the user to make notes, carry out calculations etc.
This is a blank sheet provided for the user to make notes, carry out calculations etc.
23‐456‐7890.M. SteamSteam Plant Contact: I1
March 4Measurements Taken Stack Temperature
Initial Boiler Efficiency
,
80.20
2009
%
ects:Ideas for Proj
Feedwater Economizer 450300
FF
Current Flue Gas Temperature Estimated New Flue GasTemperature Adjusted Boiler Efficiency 84.30 %
.00Condensate Recovery
Measured Condensate Flow Rate 7 gallons per minute
Blowdown Flash to Low Pressure
SSAT Module ‐ 38
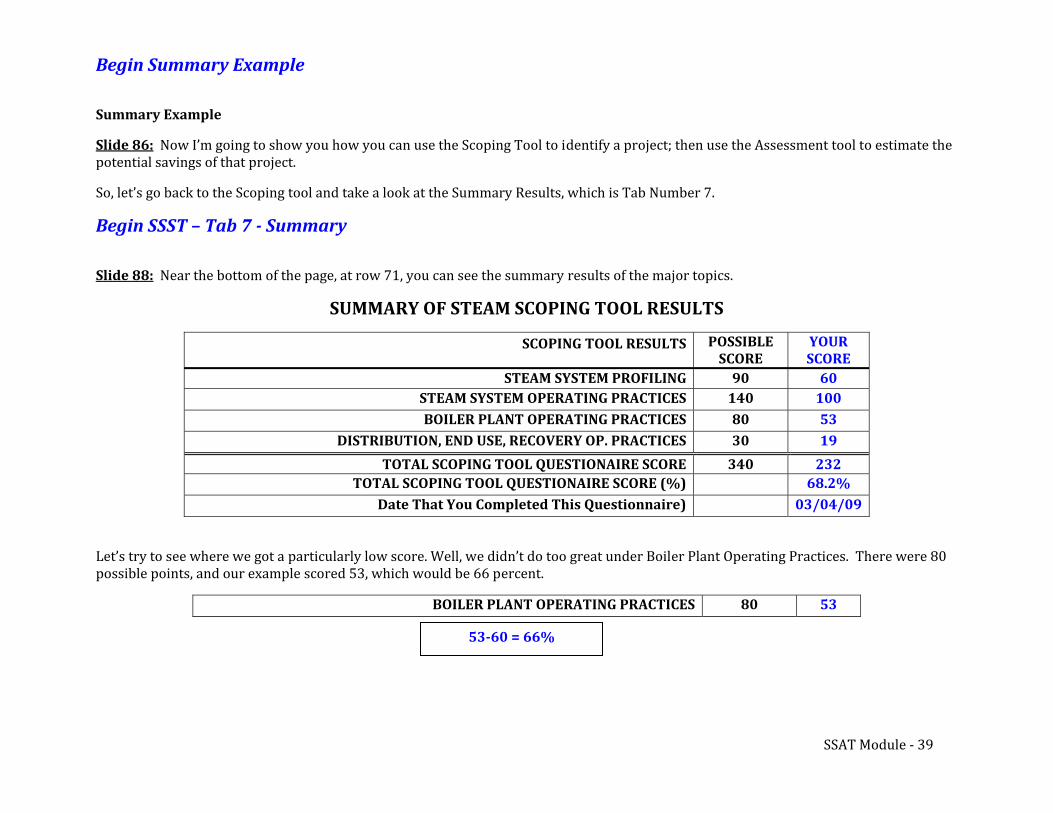
Begin Summary Example
Summary Example
Slide 86: Now I’m going to show you how you can use the Scoping Tool to identify a project; then use the Assessment tool to estimate the
potential savings of that project.
So, let’s go back to the Scoping tool and take a look at the Summary Results, which is Tab Number 7.
Begin SSST – Tab 7 Summary
Slide 88: Near the bottom of the page, at row 71, you can see the summary results of the major topics.
SUMMARY OF STEAM SCOPING TOOL RESULTS SCOPING TOOL RESULTS POSSIBLE
SCORE
YOUR
SCORE
STEAM SYSTEM PROFILING 90 60
STEAM SYSTEM OPERATING PRACTICES 140 100
BOILER PLANT OPERATING PRACTICES 80 53
DISTRIBUTION, END USE, RECOVERY OP. PRACTICES 30 19
TOTAL SCOPING TOOL QUESTIONAIRE SCORE 340 232
TOTAL SCOPING TOOL QUESTIONAIRE SCORE (%) 68.2%
Date That You Completed This Questionnaire) 03/04/09
Let’s try to see where we got a particularly low score. Well, we didn’t do too great under Boiler Plant Operating Practices. There were 80possible points, and our example scored 53, which would be 66 percent.
BOILER PLANT OPERATING PRACTICES 80 53
5360 = 66%
SSAT Module ‐ 39
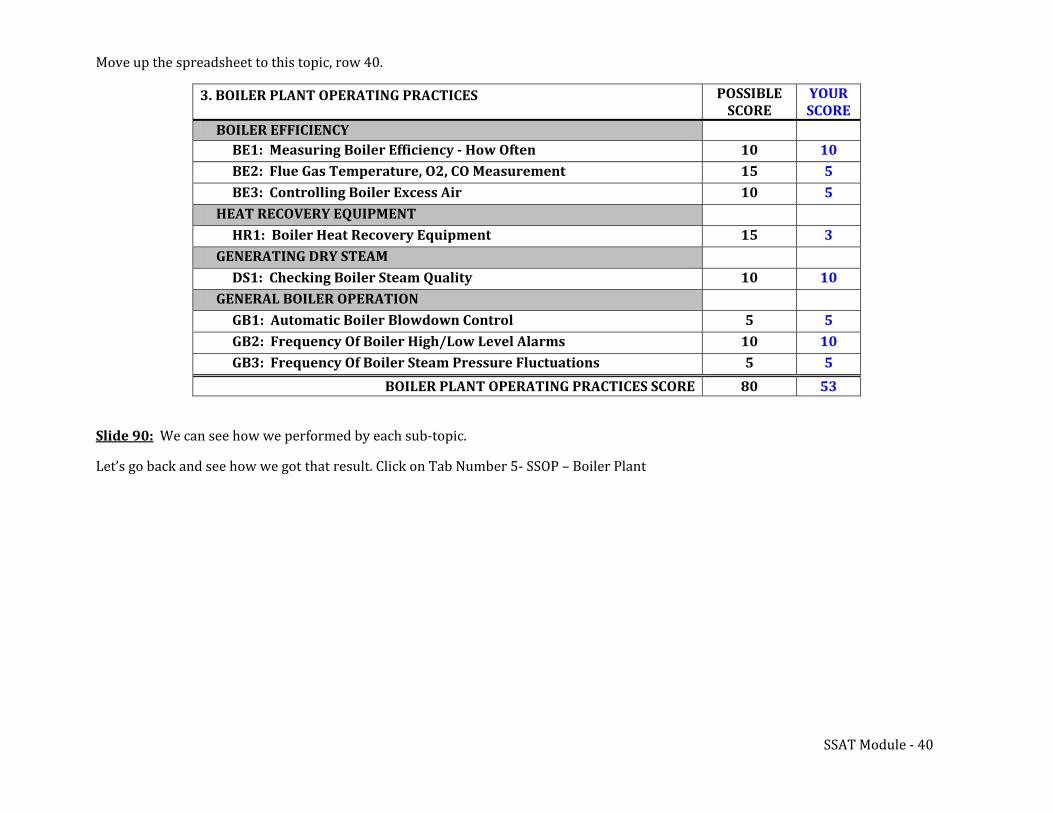
Move up the spreadsheet to this topic, row 40.
3. BOILER PLANT OPERATING PRACTICES POSSIBLE
SCORE
YOUR
SCORE
BOILER EFFICIENCY
BE1: Measuring Boiler Efficiency How Often 10 10
BE2: Flue Gas Temperature, O2, CO Measurement 15 5
BE3: Controlling Boiler Excess Air 10 5 HEAT RECOVERY EQUIPMENT
HR1: Boiler Heat Recovery Equipment 15 3
GENERATING DRY STEAM
DS1: Checking Boiler Steam Quality 10 10
GENERAL BOILER OPERATION
GB1: Automatic Boiler Blowdown Control 5 5
GB2: Frequency Of Boiler High/Low Level Alarms 10 10
GB3: Frequency Of Boiler Steam Pressure Fluctuations 5 5
BOILER PLANT OPERATING PRACTICES SCORE 80 53
Slide 90: We can see how we performed by each sub‐topic.
Let’s go back and see how we got that result. Click on Tab Number 5‐ SSOP – Boiler Plant
SSAT Module ‐ 40
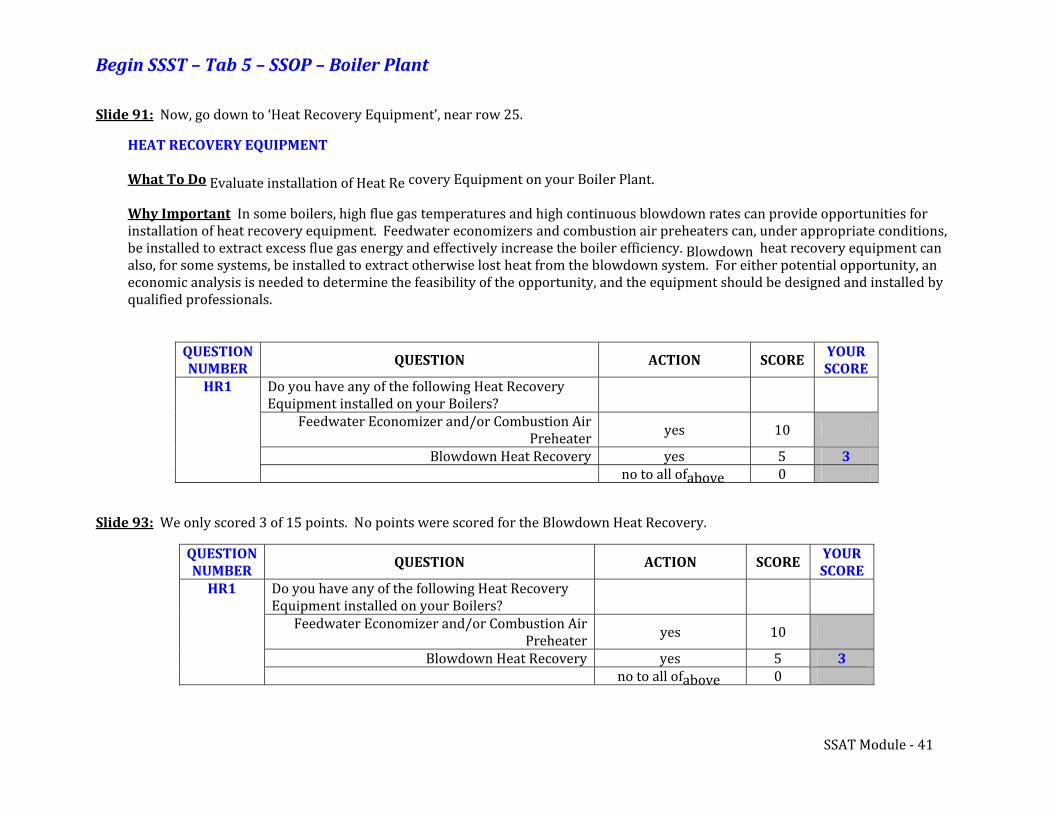
Begin SSST – Tab 5 – SSOP – Boiler Plant
Slide 91: Now, go down to ‘Heat Recovery Equipment’, near row 25.
HEAT RECOVERY EQUIPMENT
What To Do Evaluate installation of Heat Re covery Equipment on your Boiler Plant.
Why Important In some boilers, high flue gas temperatures and high continuous blowdown rates can provide opportunities forinstallation of heat recovery equipment. Feedwater economizers and combustion air preheaters can, under appropriate conditions,be installed to extract excess flue gas energy and effectively increase the boiler efficiency. Blowdown heat recovery equipment canalso, for some systems, be installed to extract otherwise lost heat from the blowdown system. For either potential opportunity, aneconomic analysis is needed to determine the feasibility of the opportunity, and the equipment should be designed and installed byqualified professionals.
QUESTION
NUMBER
QUESTION ACTION SCORE
YOUR
SCORE
HR1 Do you have any of the following Heat RecoveryEquipment installed on your Boilers?
Feedwater Economizer and/or Combustion AirPreheater
Blowdown Heat Recovery above
10
5
yes
yesf 0
3no to all o
Slide 93: We only scored 3 of 15 points. No points were scored for the Blowdown Heat Recovery.
QUESTION
NUMBER
QUESTION ACTION SCORE
YOUR
SCORE
HR1 Do you have any of the following Heat RecoveryEquipment installed on your Boilers?Feedwater Economizer and/or Combustion Air
PreheaterBlowdown Heat Recovery
above
10
5
yes
yesf 0
3no to all o
SSAT Module ‐ 41
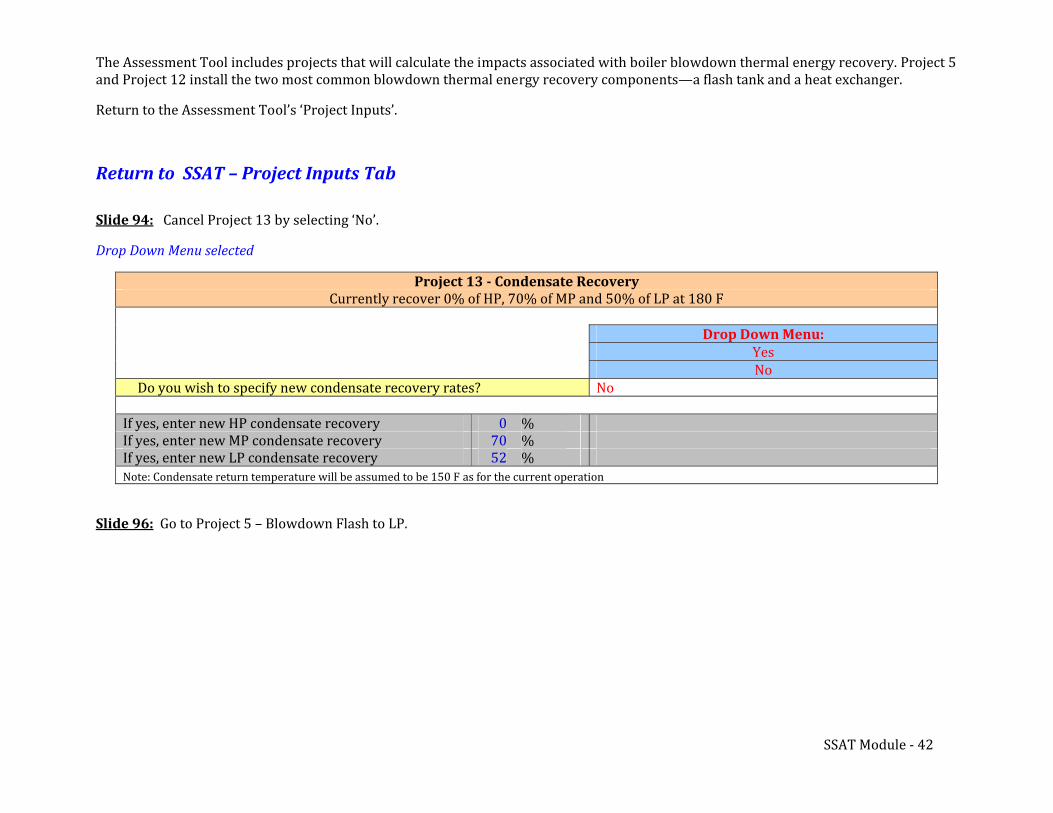
The Assessment Tool includes projects that will calculate the impacts associated with boiler blowdown thermal energy recovery. Project 5and Project 12 install the two most common blowdown thermal energy recovery components—a flash tank and a heat exchanger.
Return to the Assessment Tool’s ‘Project Inputs’.
Return to SSAT – Project Inputs Tab
Slide 94: Cancel Project 13 by selecting ‘No’.
Drop Down Menu selected
Project 13 Condensate RecoveryCurrently recover 0% of HP, 70% of MP and 50% of LP at 180 F
Drop Down Menu:Yes
Do you wish to specify new condensate recovery rates? No
nter new HP c 0nter new MP c
No
If yes, e ondensate recovery %If yes, e ondensate recovery 70 %If yes, enter new LP condensate recovery 52 %Note: Condensate return temperature will be assumed to be 150 F as for the current operation
Slide 96: Go to Project 5 – Blowdown Flash to LP.
SSAT Module ‐ 42
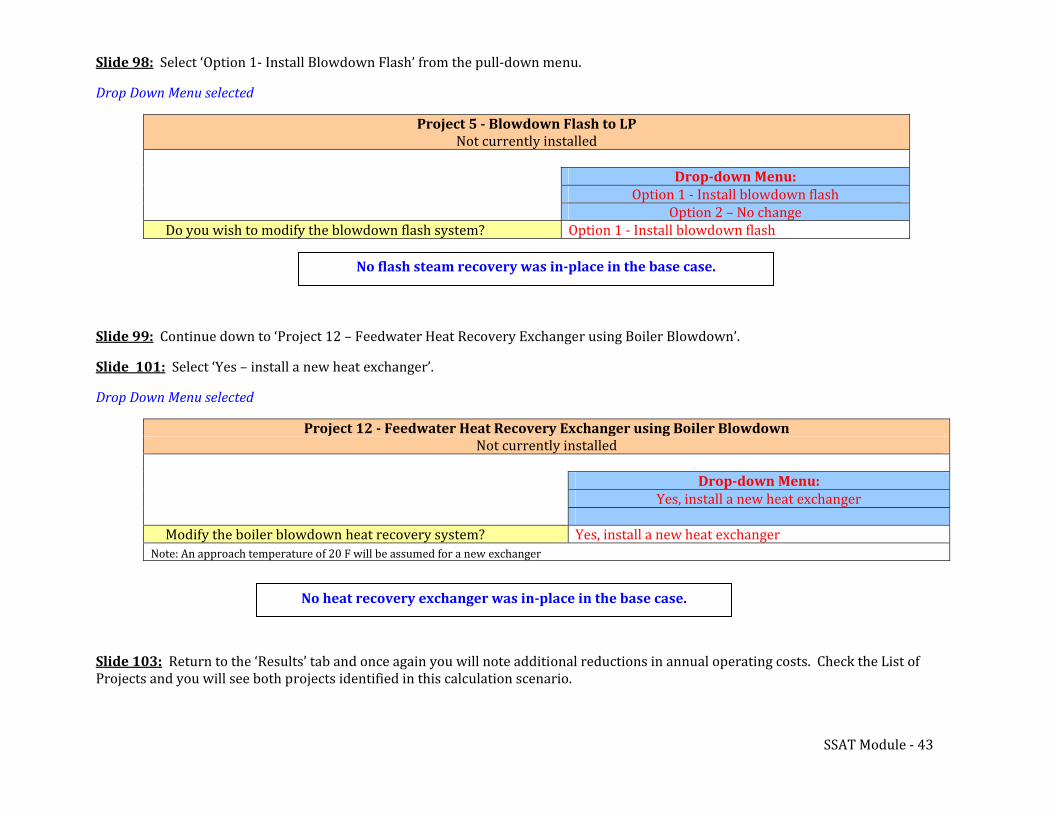
Slide 98: Select ‘Option 1‐ Install Blowdown Flash’ from the pull‐down menu.
Drop Down Menu selected
Project 5 Blowdown Flash to LPNot currently installed
Dropdown Menu:Option 1 ‐ Install blowdown flash
Option 2 – No changeDo you wish to modify the blowdown flash system? Option 1 ‐ Install blowdown flash
No flash steam recovery was inplace in the base case. Slide 99: Continue down to ‘Project 12 – Feedwater Heat Recovery Exchanger using Boiler Blowdown’.
Slide 101: Select ‘Yes – install a new heat exchanger’.
Drop Down Menu selected
Project 12 Feedwater Heat Recovery Exchanger using Boiler BlowdownNot currently installed
Dropdown Menu:Yes, install a new heat exchanger
NoModify the boiler blowdown heat recovery system? Yes, install a new heat exchanger
Note: An approach temperature of 20 F will be assumed for a new exchanger
No heat recovery exchanger was inplace in the base case.
Slide 103: Return to the ‘Results’ tab and once again you will note additional reductions in annual operating costs. Check the List of Projects and you will see both projects identified in this calculation scenario.
SSAT Module ‐ 43
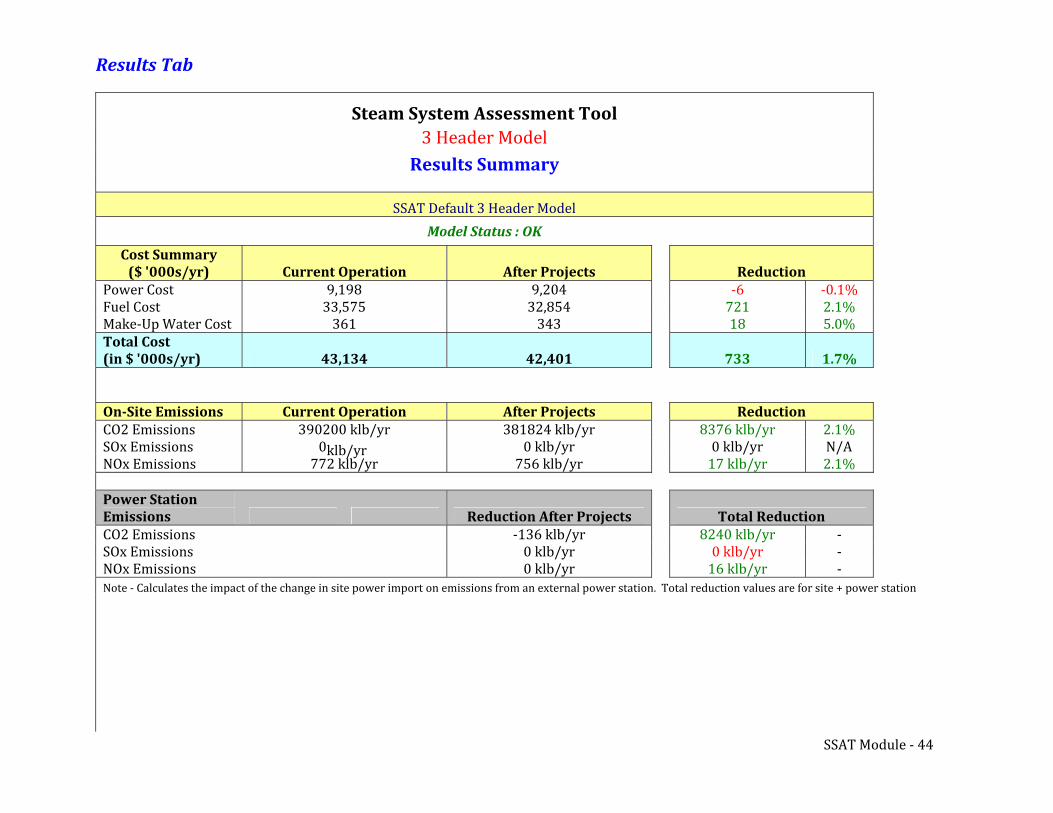
Results Tab
SSAT Module ‐ 44
Steam System Assessment Tool3 Header Model
Results Summary
SSAT Default 3 Header Model
Model Status : OK
Cost Summary
($ '000s/yr) Current Operation After Projects ReductionPower Cost 9,198 9,204 ‐6 ‐0.1%Fuel Cost 33,575 32,854 721 2.1%Make‐Up Water Cost 361 343 18 5.0% Total Cost
(in $ '000s/yr) 43,134 42,401 733 1.7%
OnSite Emissions Current Operation After Projects ReductionCO2 Emissions 390200 klb/yr 381824 klb/yr 8376 klb/yr 2.1%SOx Emissions 0 klb/yr 0 klb/yr 0 klb/yr N/ANOx Emissions 772 klb/yr 756 klb/yr 17 klb/yr 2.1%
Power Station
Emissions Reduction After Projects Total ReductionCO2 Emissions ‐136 klb/yr 8240 klb/yr ‐SOx Emissions 0 klb/yr 0 klb/yr ‐NOx Emissions 0 klb/yr 16 klb/yr ‐Note ‐ Calculates the impact of the change in site power import on emissions from an external power station. Total reduction values are for site + power station
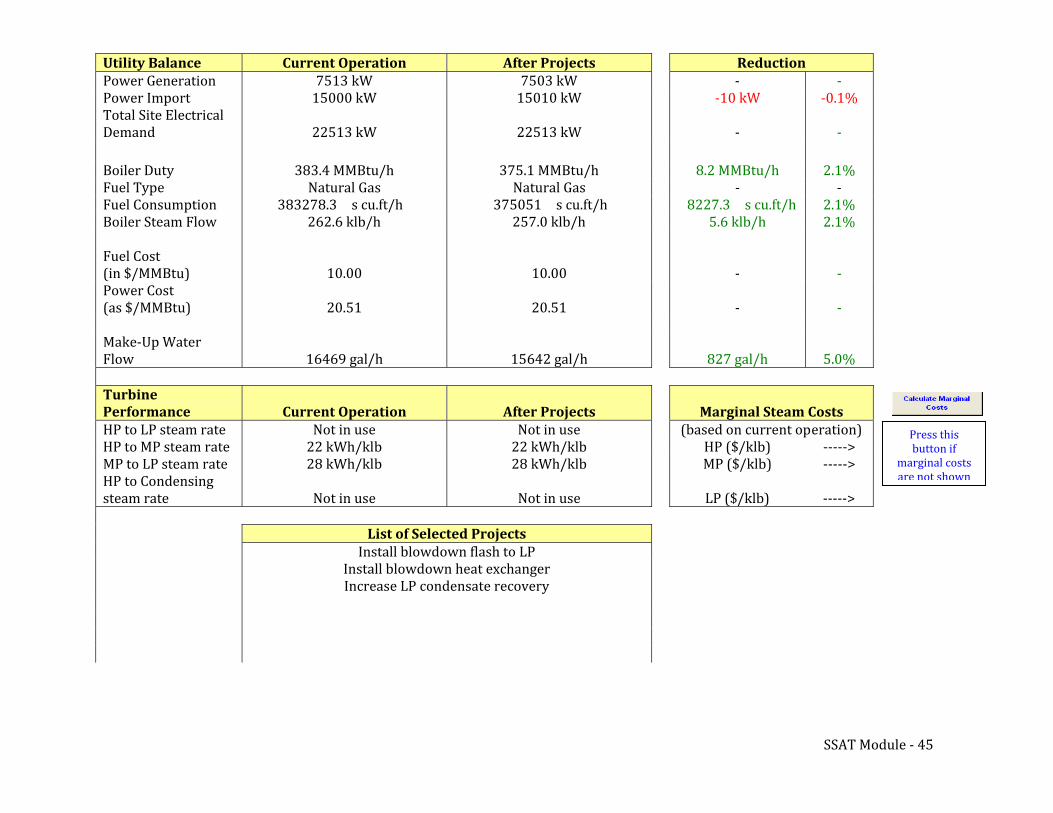
Utility BalancePower Generation
Current Operation7513 kW
After Projects7503 kW
Power ImportTotal Site ElectricalDemand
Boiler DutyFuel TypeFuel ConsumptionBoiler Steam Flow
Fuel Cost(in $/MMBtu)Power Cost(as $/MMBtu)
Make‐Up WaterFlow
15000 kW
22513 kW
383.4 MMBtu/hNatural Gas
383278.3 s cu.ft/h262.6 klb/h
10.00
20.51
16469 gal/h
15010 kW
22513 kW
375.1 MMBtu/hNatural Gas
375051 s cu.ft/h257.0 klb/h
10.00
20.51
15642 gal/h
Turbine
PerformanceHP to LP steam rate
Current OperationNot in use
After ProjectsNot in use
HP to MP steam rateMP to LP steam rateHP to Condensingsteam rate
22 kWh/kl28 kWh/kl
bb
Not in use
22 kWh/klb28 kWh/klb
Not in use
List of Selected ProjectsInstall blowdown flash to LP
Install blowdown heat exchangerIncrease LP condensate recovery
Reduction‐
‐10 kW
‐
8.2 MMBtu/h‐
8227.3 s cu.ft/h5.6 klb/h
‐
‐
827 gal/h
‐‐0.1%
‐
2.1%‐2.1%2.1%
‐
‐
5.0%
Press thisbutton if
marginal costsare not shown
Marginal Steam Costs(based on current operation)H ‐‐‐‐‐>MP ($/klb)P ($/klb) ‐‐‐‐‐>
LP ($/klb) ‐‐‐‐‐>
SSAT Module ‐ 45
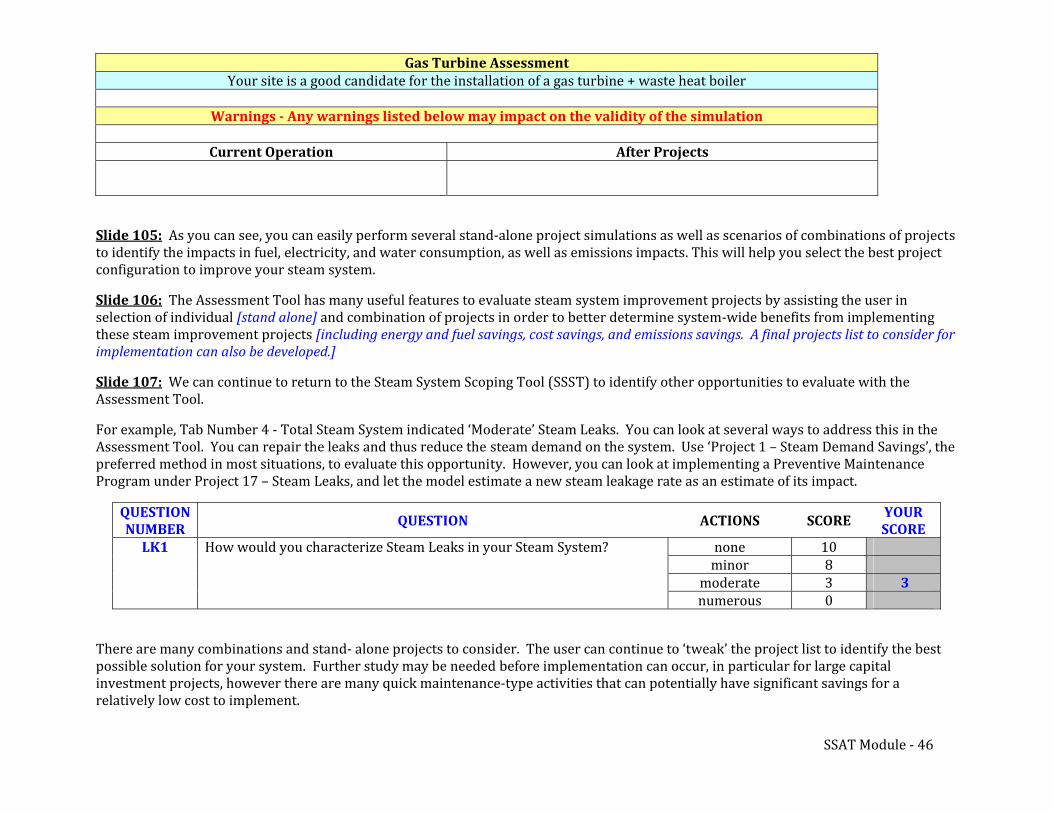
Gas Turbine AssessmentYour site is a good candidate for the installation of a gas turbine + waste heat boiler
Warnings Any warnings listed below may impact on the validity of the simulation
Current Operation After Projects
Slide 105: As you can see, you can easily perform several stand‐alone project simulations as well as scenarios of combinations of projectsto identify the impacts in fuel, electricity, and water consumption, as well as emissions impacts. This will help you select the best projectconfiguration to improve your steam system.
Slide 106: The Assessment Tool has many useful features to evaluate steam system improvement projects by assisting the user in selection of individual [stand alone] and combination of projects in order to better determine system‐wide benefits from implementing these steam improvement projects [including energy and fuel savings, cost savings, and emissions savings. A final projects list to consider for
implementation can also be developed.]
Slide 107: We can continue to return to the Steam System Scoping Tool (SSST) to identify other opportunities to evaluate with the Assessment Tool.
For example, Tab Number 4 ‐ Total Steam System indicated ‘Moderate’ Steam Leaks. You can look at several ways to address this in the
Assessment Tool. You can repair the leaks and thus reduce the steam demand on the system. Use ‘Project 1 – Steam Demand Savings’, thepreferred method in most situations, to evaluate this opportunity. However, you can look at implementing a Preventive Maintenance
Program under Project 17 – Steam Leaks, and let the model estimate a new steam leakage rate as an estimate of its impact.
QUESTION
NUMBER
QUESTION
How would you characterize Steam Leaks in your Steam System?
ACTIONS SCORE
10
YOUR
SCORE
LK1 noneminormoderate
830
3numerous
There are many combinations and stand‐ alone projects to consider. The user can continue to ‘tweak’ the project list to identify the best possible solution for your system. Further study may be needed before implementation can occur, in particular for large capital investment projects, however there are many quick maintenance‐type activities that can potentially have significant savings for a relatively low cost to implement.
SSAT Module ‐ 46
You can also use your scorecard (the Scoping Tool) to track your progress in improving the management of your steam system and tocontinue your focus on areas that need improvement. For example, if you remember insulation was an area of the Scoping Tool that that did not receive excellent marks.
Slide 108: To begin a further look into potential projects for feasibility, let’s look at the 3EPlus Insulation Thickness Computer Tool, or simply the Insulation Tool, or its acronym, 3EPlus. The Insulation Tool can help you further your investigation by evaluating insulationprojects, from the standpoint of energy savings, cost savings, and economic feasibility.
SSAT Module ‐ 47
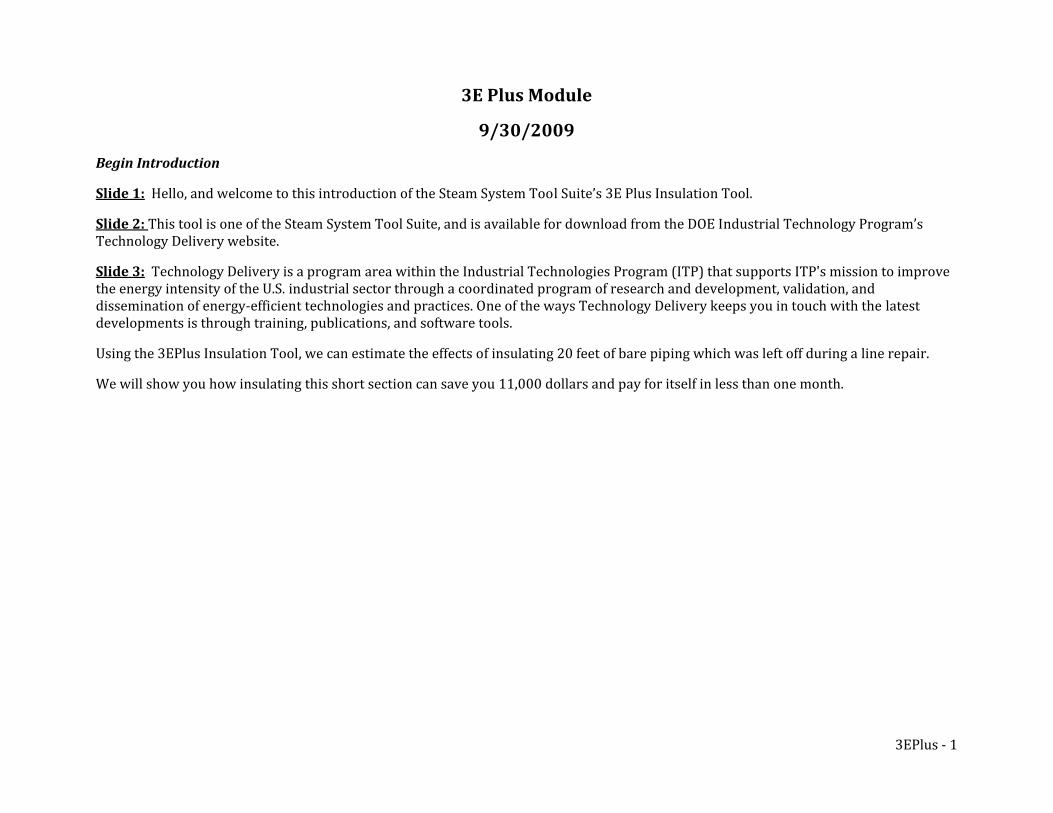
3E Plus Module
9/30/2009
Begin Introduction
Slide 1: Hello, and welcome to this introduction of the Steam System Tool Suite’s 3E Plus Insulation Tool.
Slide 2: This tool is one of the Steam System Tool Suite, and is available for download from the DOE Industrial Technology Program’s Technology Delivery website.
Slide 3: Technology Delivery is a program area within the Industrial Technologies Program (ITP) that supports ITP's mission to improve the energy intensity of the U.S. industrial sector through a coordinated program of research and development, validation, and dissemination of energy‐efficient technologies and practices. One of the ways Technology Delivery keeps you in touch with the latest developments is through training, publications, and software tools.
Using the 3EPlus Insulation Tool, we can estimate the effects of insulating 20 feet of bare piping which was left off during a line repair.
We will show you how insulating this short section can save you 11,000 dollars and pay for itself in less than one month.
3EPlus ‐ 1
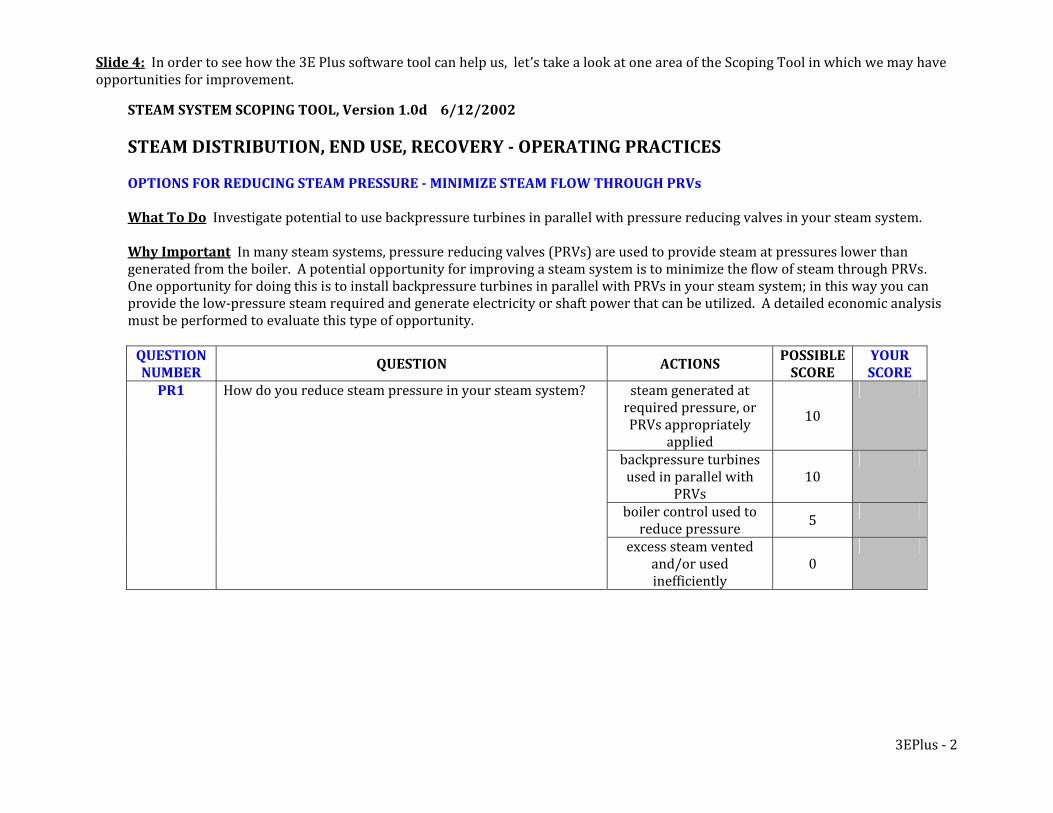
Slide 4: In order to see how the 3E Plus software tool can help us, let’s take a look at one area of the Scoping Tool in which we may have opportunities for improvement.
STEAM SYSTEM SCOPING TOOL, Version 1.0d 6/12/2002 STEAM DISTRIBUTION, END USE, RECOVERY OPERATING PRACTICES OPTIONS FOR REDUCING STEAM PRESSURE MINIMIZE STEAM FLOW THROUGH PRVs What To Do Investigate potential to use backpressure turbines in parallel with pressure reducing valves in your steam system. Why Important In many steam systems, pressure reducing valves (PRVs) are used to provide steam at pressures lower than generated from the boiler. A potential opportunity for improving a steam system is to minimize the flow of steam through PRVs. One opportunity for doing this is to install backpressure turbines in parallel with PRVs in your steam system; in this way you can provide the low‐pressure steam required and generate electricity or shaft power that can be utilized. A detailed economic analysis must be performed to evaluate this type of opportunity. QUESTION NUMBER
QUESTION ACTIONS POSSIBLE SCORE
YOUR SCORE
steam generated at required pressure, or PRVs appropriately
applied
10
backpressure turbines used in parallel with
PRVs 10
boiler control used to reduce pressure 5
PR1 How do you reduce steam pressure in your steam system?
excess steam vented and/or used inefficiently
0
3EPlus ‐ 2
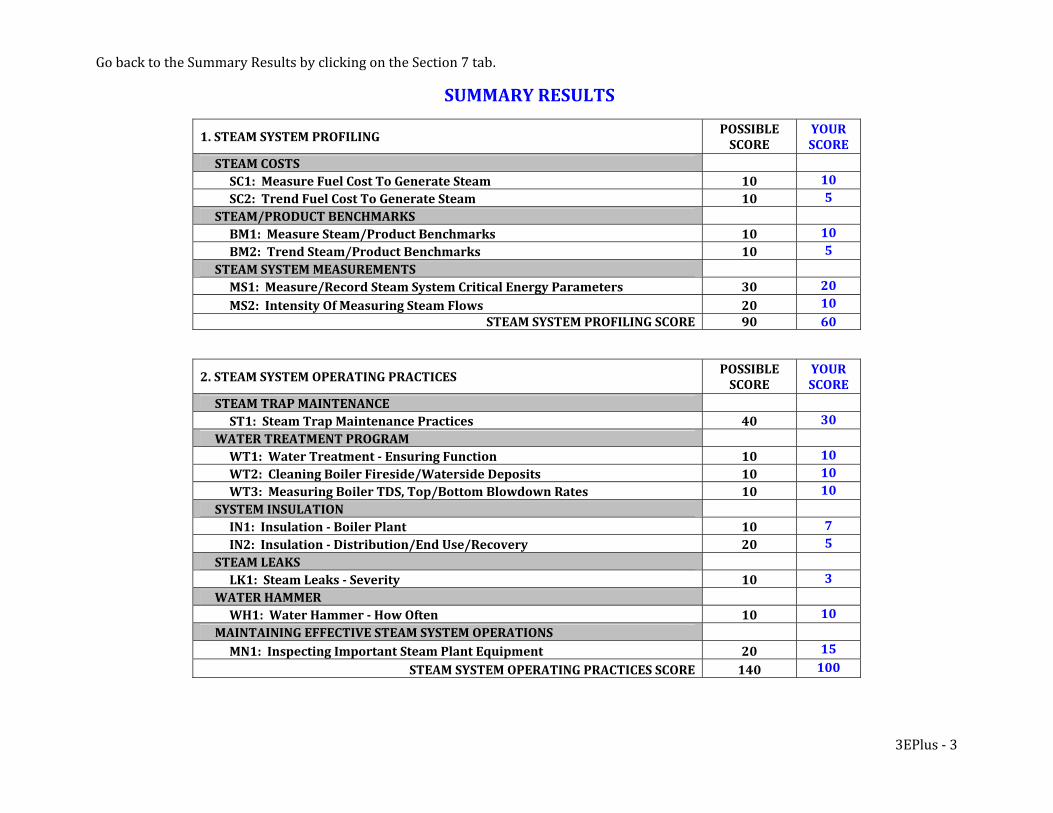
Go back to the Summary Results by clicking on the Section 7 tab.
SUMMARY RESULTS
1. STEAM SYSTEM PROFILING POSSIBLE SCORE
YOUR SCORE
STEAM COSTS SC1: Measure Fuel Cost To Generate Steam 10 10 SC2: Trend Fuel Cost To Generate Steam 10 5 STEAM/PRODUCT BENCHMARKS BM1: Measure Steam/Product Benchmarks 10 10 BM2: Trend Steam/Product Benchmarks 10 5 STEAM SYSTEM MEASUREMENTS MS1: Measure/Record Steam System Critical Energy Parameters 30 20
MS2: Intensity Of Measuring Steam Flows 20 10 STEAM SYSTEM PROFILING SCORE 90 60
2. STEAM SYSTEM OPERATING PRACTICES POSSIBLE SCORE
YOUR SCORE
STEAM TRAP MAINTENANCE ST1: Steam Trap Maintenance Practices 40 30 WATER TREATMENT PROGRAM WT1: Water Treatment Ensuring Function 10 10 WT2: Cleaning Boiler Fireside/Waterside Deposits 10 10 WT3: Measuring Boiler TDS, Top/Bottom Blowdown Rates 10 10 SYSTEM INSULATION IN1: Insulation Boiler Plant 10 7 IN2: Insulation Distribution/End Use/Recovery 20 5 STEAM LEAKS LK1: Steam Leaks Severity 10 3 WATER HAMMER WH1: Water Hammer How Often 10 10 MAINTAINING EFFECTIVE STEAM SYSTEM OPERATIONS
MN1: Inspecting Important Steam Plant Equipment 20 15
STEAM SYSTEM OPERATING PRACTICES SCORE 140 100
3EPlus ‐ 3
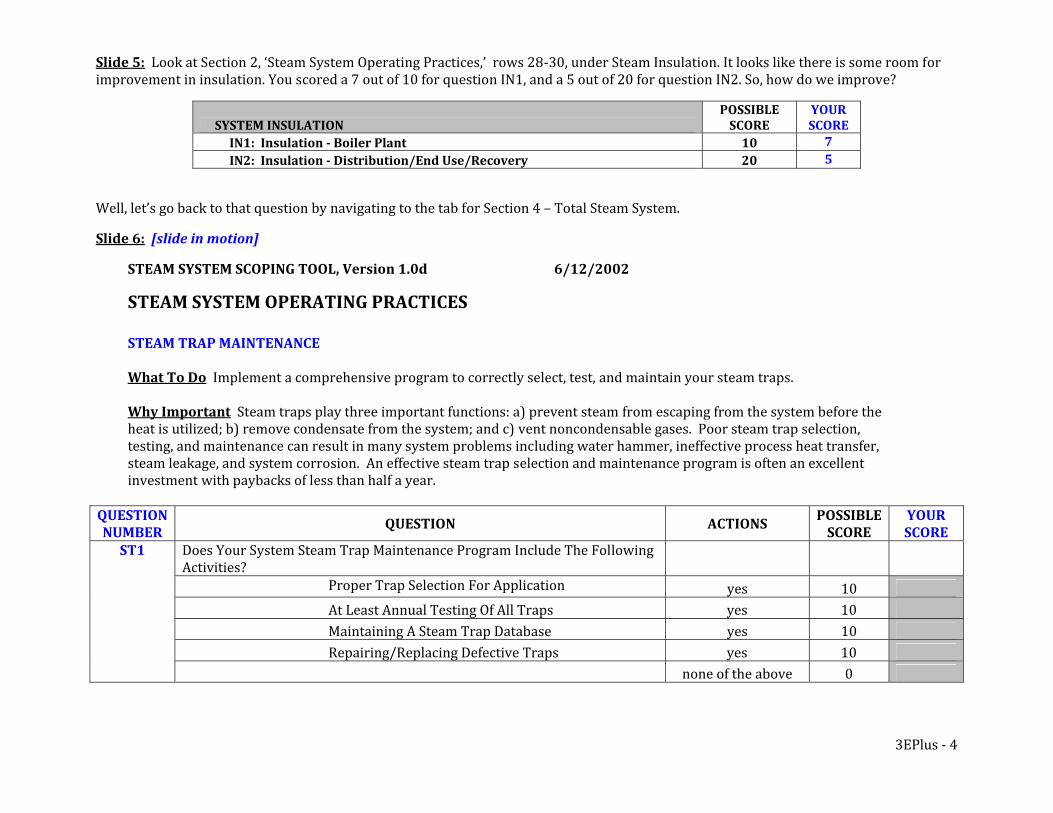
Slide 5: Look at Section 2, ‘Steam System Operating Practices,’ rows 28‐30, under Steam Insulation. It looks like there is some room for improvement in insulation. You scored a 7 out of 10 for question IN1, and a 5 out of 20 for question IN2. So, how do we improve?
SYSTEM INSULATION POSSIBLE SCORE
YOUR SCORE
IN1: Insulation Boiler Plant 10 7 IN2: Insulation Distribution/End Use/Recovery 20 5
Well, let’s go back to that question by navigating to the tab for Section 4 – Total Steam System.
Slide 6: [slide in motion]
STEAM SYSTEM SCOPING TOOL, Version 1.0d 6/12/2002
STEAM SYSTEM OPERATING PRACTICES STEAM TRAP MAINTENANCE What To Do Implement a comprehensive program to correctly select, test, and maintain your steam traps. Why Important Steam traps play three important functions: a) prevent steam from escaping from the system before the heat is utilized; b) remove condensate from the system; and c) vent noncondensable gases. Poor steam trap selection, testing, and maintenance can result in many system problems including water hammer, ineffective process heat transfer, steam leakage, and system corrosion. An effective steam trap selection and maintenance program is often an excellent investment with paybacks of less than half a year.
QUESTION NUMBER
QUESTION ACTIONS POSSIBLE SCORE
YOUR SCORE
Does Your System Steam Trap Maintenance Program Include The Following Activities?
Proper Trap Selection For Application yes 10 At Least Annual Testing Of All Traps yes 10 Maintaining A Steam Trap Database yes 10 Repairing/Replacing Defective Traps yes 10
ST1
none of the above 0
3EPlus ‐ 4
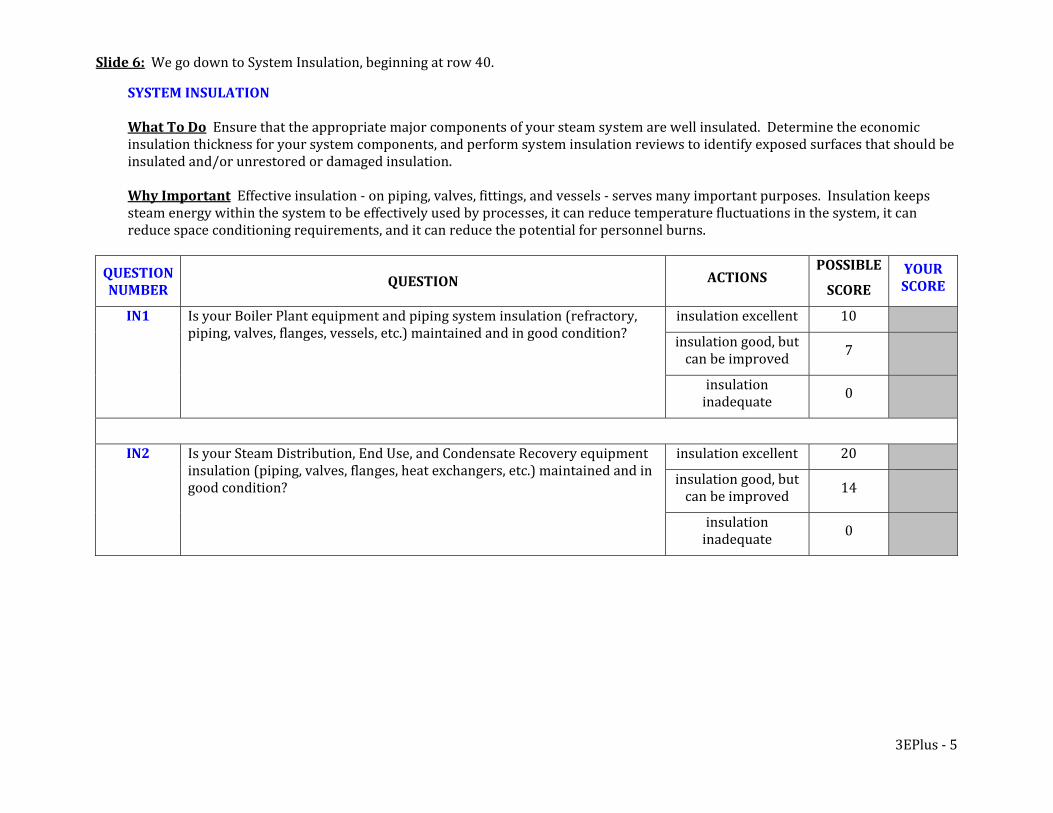
Slide 6: We go down to System Insulation, beginning at row 40.
SYSTEM INSULATION What To Do Ensure that the appropriate major components of your steam system are well insulated. Determine the economic insulation thickness for your system components, and perform system insulation reviews to identify exposed surfaces that should be insulated and/or unrestored or damaged insulation. Why Important Effective insulation ‐ on piping, valves, fittings, and vessels ‐ serves many important purposes. Insulation keeps steam energy within the system to be effectively used by processes, it can reduce temperature fluctuations in the system, it can reduce space conditioning requirements, and it can reduce the potential for personnel burns.
QUESTION NUMBER
QUESTION ACTIONS POSSIBLE
SCORE YOUR SCORE
insulation excellent 10
insulation good, but can be improved 7
IN1 Is your Boiler Plant equipment and piping system insulation (refractory, piping, valves, flanges, vessels, etc.) maintained and in good condition?
insulation inadequate 0
insulation excellent 20
insulation good, but can be improved 14
IN2 Is your Steam Distribution, End Use, and Condensate Recovery equipment insulation (piping, valves, flanges, heat exchangers, etc.) maintained and in good condition?
insulation inadequate 0
3EPlus ‐ 5
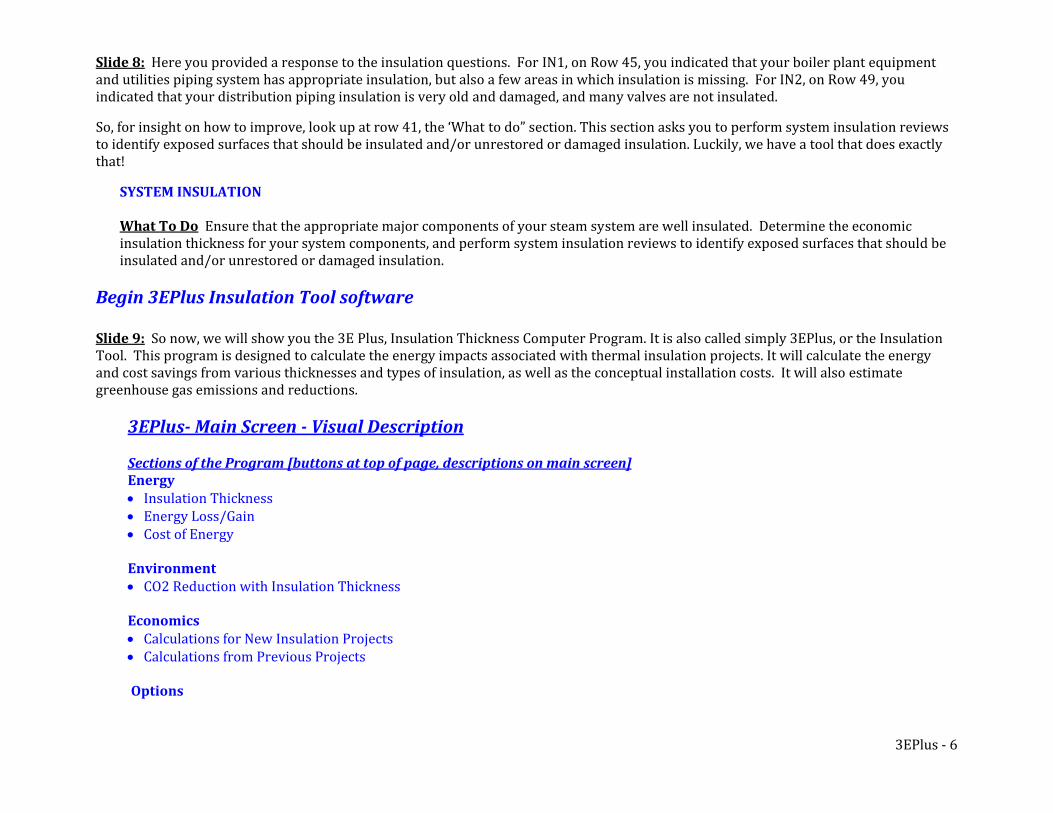
Slide 8: Here you provided a response to the insulation questions. For IN1, on Row 45, you indicated that your boiler plant equipment and utilities piping system has appropriate insulation, but also a few areas in which insulation is missing. For IN2, on Row 49, you indicated that your distribution piping insulation is very old and damaged, and many valves are not insulated.
So, for insight on how to improve, look up at row 41, the ‘What to do” section. This section asks you to perform system insulation reviews to identify exposed surfaces that should be insulated and/or unrestored or damaged insulation. Luckily, we have a tool that does exactly that!
SYSTEM INSULATION What To Do Ensure that the appropriate major components of your steam system are well insulated. Determine the economic insulation thickness for your system components, and perform system insulation reviews to identify exposed surfaces that should be insulated and/or unrestored or damaged insulation.
Begin 3EPlus Insulation Tool software Slide 9: So now, we will show you the 3E Plus, Insulation Thickness Computer Program. It is also called simply 3EPlus, or the Insulation Tool. This program is designed to calculate the energy impacts associated with thermal insulation projects. It will calculate the energy and cost savings from various thicknesses and types of insulation, as well as the conceptual installation costs. It will also estimate greenhouse gas emissions and reductions.
3EPlus Main Screen Visual Description Sections of the Program [buttons at top of page, descriptions on main screen] Energy • Insulation Thickness • Energy Loss/Gain Cost of Energy • Environment CO2 Reduction with Insulation Thickness • Economics • Calculations for New Insulation Projects Calculations from Previous Projects • Options
3EPlus ‐ 6
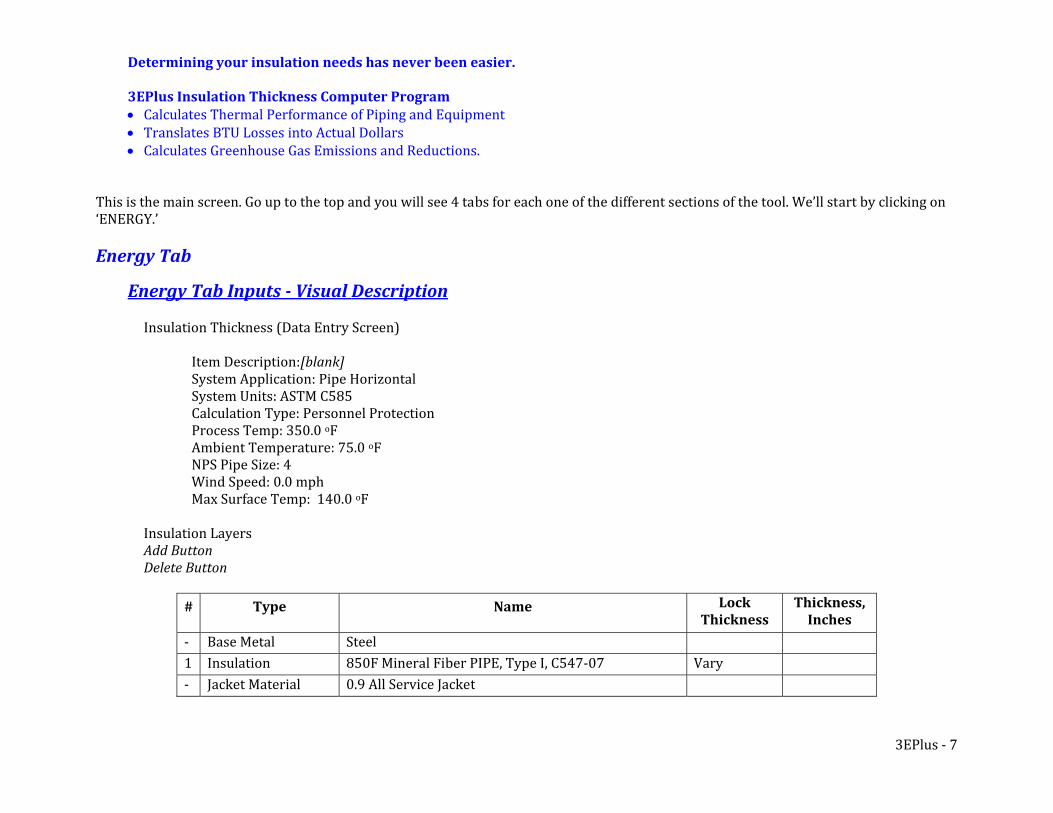
Determining your insulation needs has never been easier. 3EPlus Insulation Thickness Computer Program • Calculates Thermal Performance of Piping and Equipment • Translates BTU Losses into Actual Dollars • Calculates Greenhouse Gas Emissions and Reductions.
This is the main screen. Go up to the top and you will see 4 tabs for each one of the different sections of the tool. We’ll start by clicking on ‘ENERGY.’ Energy Tab
Energy Tab Inputs Visual Description
Insulation Thickness (Data Entry Screen)
Item Description:[blank] System Application: Pipe Horizontal System Units: ASTM C585 Calculation Type: Personnel Protection Process Temp: 350.0 oF Ambient Temperature: 75.0 oF NPS Pipe Size: 4 Wind Speed: 0.0 mph Max Surface Temp: 140.0 oF
Insulation Layers Add Button Delete B utton
# Type Name Lock
Thickness Thickness, Inches
‐ Base Metal Steel1 Insulation 850F Mineral Fiber PIPE, Type I, C547‐07 Vary‐ Jacket Material 0.9 All Service Jacket
3EPlus ‐ 7
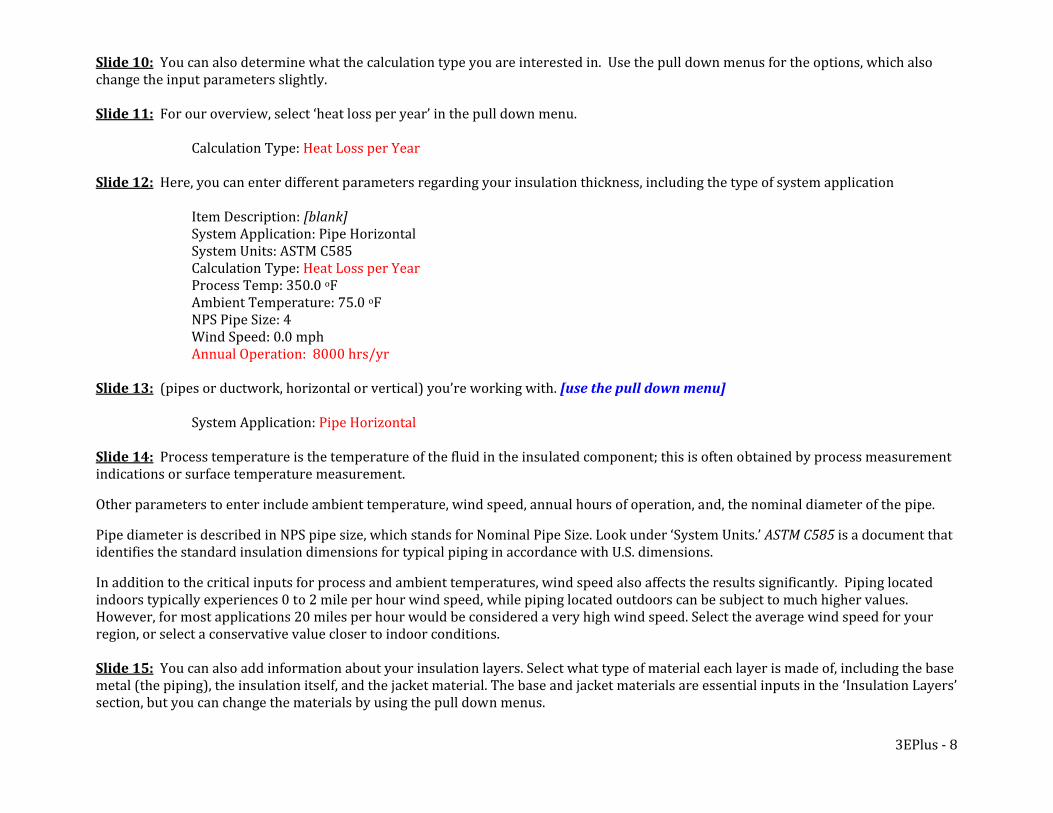
3EPlus ‐ 8
Slide 10: You can also determine what the calculation type you are interested in. Use the pull down menus for the options, which also change the input parameters slightly. Slide 11: For our overview, select ‘heat loss per year’ in the pull down menu.
Calculation Type: Heat Loss per Year
Slide 12: Here, you can enter different parameters regarding your insulation thickness, including the type of system application Item Description: [blank] System Application: Pipe Horizontal System Units: ASTM C585 Calculation Type: Heat Loss per Year Process Temp: 350.0 oF Ambient Temperature: 75.0 oF NPS Pipe Size: 4 Wind Speed: 0.0 mph Annual Operation: 8000 hrs/yr
Slide 1 :3 (pipes or ductwork, horizontal or vertical) you’re working with. [use the pull down menu]
System Application: Pipe Horizontal
Slide 14: Process temperature is the temperature of the fluid in the insulated component; this is often obtained by process measurement indications or surface temperature measurement.
Other parameters to enter include ambient temperature, wind speed, annual hours of operation, and, the nominal diameter of the pipe.
Pipe diameter is described in NPS pipe size, which stands for Nominal Pipe Size. Look under ‘System Units.’ ASTM C585 is a document that identifies the standard insulation dimensions for typical piping in accordance with U.S. dimensions.
In addition to the critical inputs for process and ambient temperatures, wind speed also affects the results significantly. Piping located indoors typically experiences 0 to 2 mile per hour wind speed, while piping located outdoors can be subject to much higher values. However, for most applications 20 miles per hour would be considered a very high wind speed. Select the average wind speed for your region, or select a conservative value closer to indoor conditions. Slide 15: You can also add information about your insulation layers. Select what type of material each layer is made of, including the base metal (the piping), the insulation itself, and the jacket material. The base and jacket materials are essential inputs in the ‘Insulation Layers’ section, but you can change the materials by using the pull down menus.
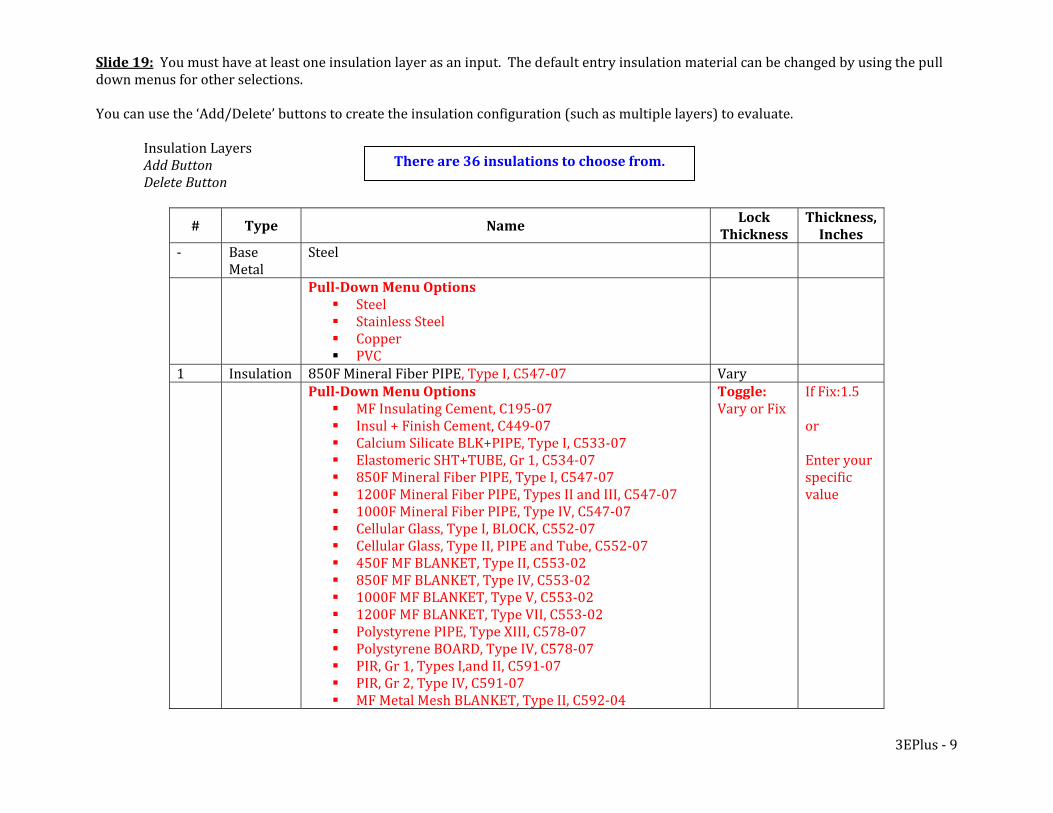
Slide 19: You must have at least one insulation layer as an input. The default entry insulation material can be changed by using the pull down menus for other selections. You can use the ‘Add/Delete’ buttons to create the insulation configuration (such as multiple layers) to evaluate.
Insulation Layers Add Button Delete Button
# Type Name Lock
Thickness Thickness, Inches
‐
Base Metal
Steel
PullDo Menu Options wn Steel Stainless Steel Copper PVC
1 Insulation 850F Mineral Fiber PIPE, Type I, C547‐07 V y ar
PullDown Menu Options MF Insulating Cement, C195‐07 Insul + Finish Cement, C449‐07 Calcium Silicate BLK+PIPE, Type I, C533‐07 Elastomeric SHT+TUBE, Gr 1, C534‐07 850F Mineral Fiber PIPE, Type I, C547‐07 1200F Mineral Fiber PIPE, Types II and III, C547‐07 1000F Mineral Fiber PIPE, Type IV, C547‐07 Cellular Glass, Type I, BLOCK, C552‐07 Cellular Glass, Type II, PIPE and Tube, C552‐07 450F MF BLANKET, Type II, C553‐02 850F MF BLANKET, Type IV, C553‐02 1000F MF BLANKET, Type V, C553‐02 1200F MF BLANKET, Type VII, C553‐02 Polystyrene PIPE, Type XIII, C578‐07 Polystyrene BOARD, Type IV, C578‐07 PIR, Gr 1, Types I,and II, C591‐07 PIR, Gr 2, Type IV, C591‐07 MF Metal Mesh BLANKET, Type II, C592‐04
Toggle: Vary or Fix
If Fix:1.5 or Enter your specific value
There are 36 insulations to choose from.
3EPlus ‐ 9
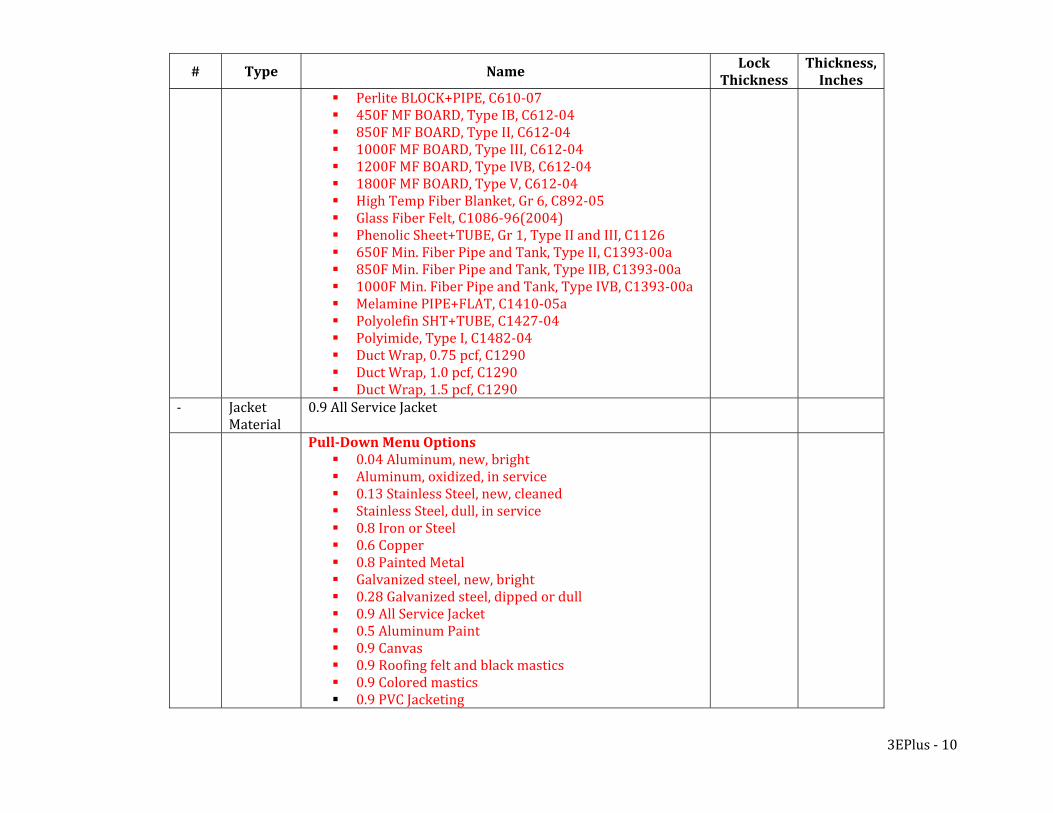
# Type Lock
Thickness Thickness, Inches
Name
Perlite BLOCK+PIPE, C610‐07 450F MF BOARD, Type IB, C612‐04 850F MF BOARD, Type II, C612‐04 1000F MF BOARD, Type III, C612‐04 1200F MF BOARD, Type IVB, C612‐04 1800F MF BOARD, Type V, C612‐04 High Temp Fiber Blanket, Gr 6, C892‐05 Glass Fiber Felt, C1086‐96(2004) Phenolic Sheet+TUBE, Gr 1, Type II and III, C1126 650F Min. Fiber Pipe and Tank, Type II, C1393‐00a 850F Min. Fiber Pipe and Tank, Type IIB, C1393‐00a 1000F Min. Fiber Pipe and Tank, Type IVB, C1393‐00a Melamine PIPE+FLAT, C1410‐05a Polyolefin SHT+TUBE, C1427‐04 Polyimide, Type I, C1482‐04 Duct Wrap, 0.75 pcf, C1290 Duct Wrap, 1.0 pcf, C1290 Duct Wrap, 1.5 pcf, C1290
‐ Jacket Material
0.9 All Service Jacket
PullDown Menu Options 0.04 Aluminum, new, bright Aluminum, oxidized, in service 0.13 Stainless Steel, new, cleaned Stainless Steel, dull, in service 0.8 Iron or Steel 0.6 Copper 0.8 Painted Metal Galvanized steel, new, bright 0.28 Galvanized steel, dipped or dull 0.9 All Service Jacket 0.5 Aluminum Paint 0.9 Canvas 0.9 Roofing felt and black mastics 0.9 Colored mastics 0.9 PVC Jacketing
3EPlus ‐ 10
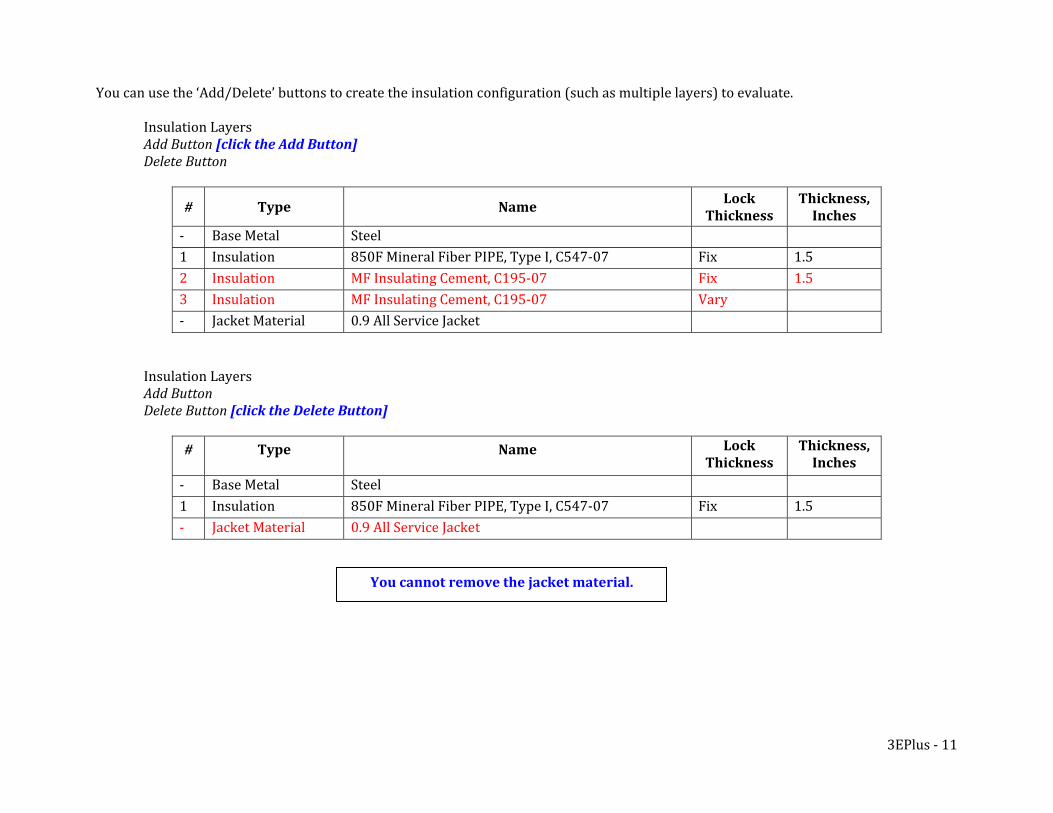
You can use the ‘Add/Delete’ buttons to create the insulation configuration (such as multiple layers) to evaluate. Insulation Layers Add Button [c the A Button] lick ddDelete Button
# Type Name Lock
Thickness Thickness, Inches
‐ Base Metal Steel 1 Insulation 850F Mineral Fiber PIPE, Type I, C547‐07 Fix 1.52 Insulation MF Insulating Cement, C195‐07 Fix 1.5 3 Insulation MF Insulating Cement, C195‐07 Vary ‐ Jacket Material 0.9 All Service Jacket
Insulation Layers Add Button Delete Button [click the Delete Button]
# Type Name Lock Thickness
Thickness, Inches
‐ Base Metal Steel1 Insulation 850F Mineral Fiber PIPE, Type I, C547‐07 Fix 1.5‐ Jacket Material 0.9 All Service Jacket
You cannot remove the jacket material.
3EPlus ‐ 11
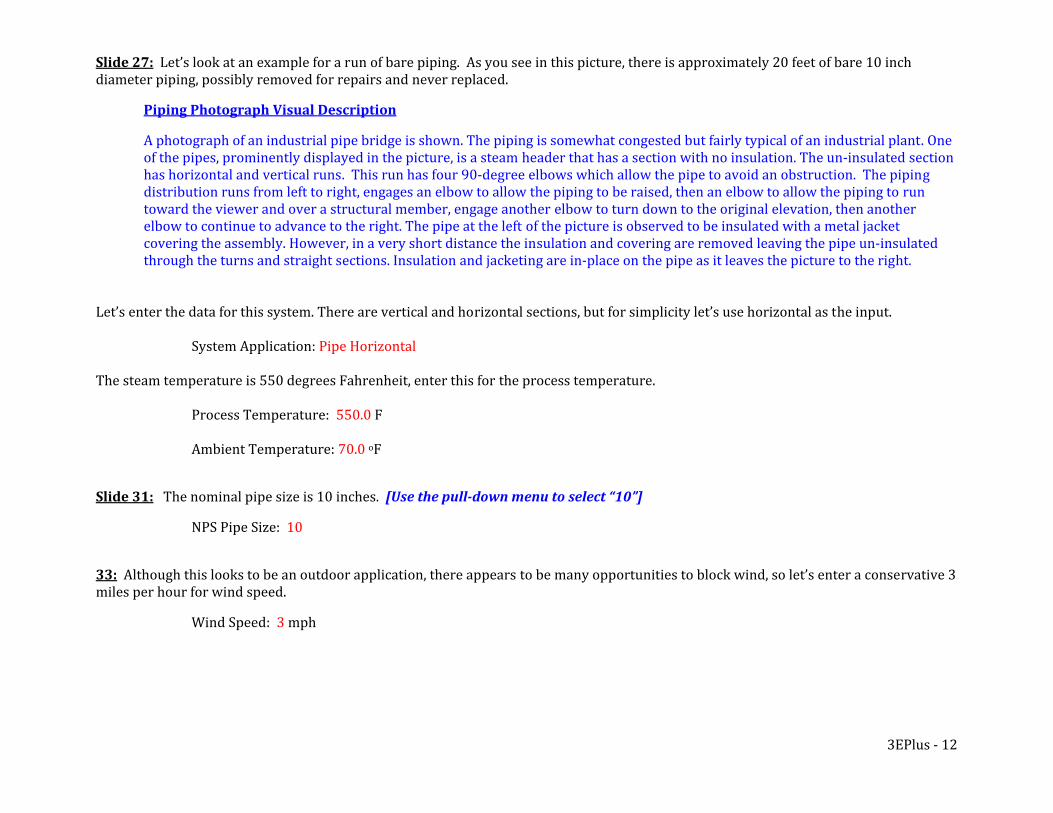
Slide 27: Let’s look at an example for a run of bare piping. As you see in this picture, there is approximately 20 feet of bare 10 inch diameter piping, possibly removed for repairs and never replaced.
Piping Photograph Visual Description
A photograph of an industrial pipe bridge is shown. The piping is somewhat congested but fairly typical of an industrial plant. One of the pipes, prominently displayed in the picture, is a steam header that has a section with no insulation. The un‐insulated section has horizontal and vertical runs. This run has four 90‐degree elbows which allow the pipe to avoid an obstruction. The piping distribution runs from left to right, engages an elbow to allow the piping to be raised, then an elbow to allow the piping to run toward the viewer and over a structural member, engage another elbow to turn down to the original elevation, then another elbow to continue to advance to the right. The pipe at the left of the picture is observed to be insulated with a metal jacket covering the assembly. However, in a very short distance the insulation and covering are removed leaving the pipe un‐insulated through the turns and straight sections. Insulation and jacketing are in‐place on the pipe as it leaves the picture to the right.
Let’s enter the data for this system. There are vertical and horizontal sections, but for simplicity let’s use horizontal as the input.
System Application: Pipe Horizontal
The steam temperature is 550 degrees Fahrenheit, enter this for the process temperature. Process Temperature: 550.0 F Ambient Temperature: 70.0 oF
Slide 31: The nominal pipe size is 10 inches. [Use the pulldown menu to select “10”]
NPS Pipe Size: 10
33: Although this looks to be an outdoor application, there appears to be many opportunities to block wind, so let’s enter a conservative 3 miles per hour for wind speed.
Wind Speed: 3 mph
3EPlus ‐ 12
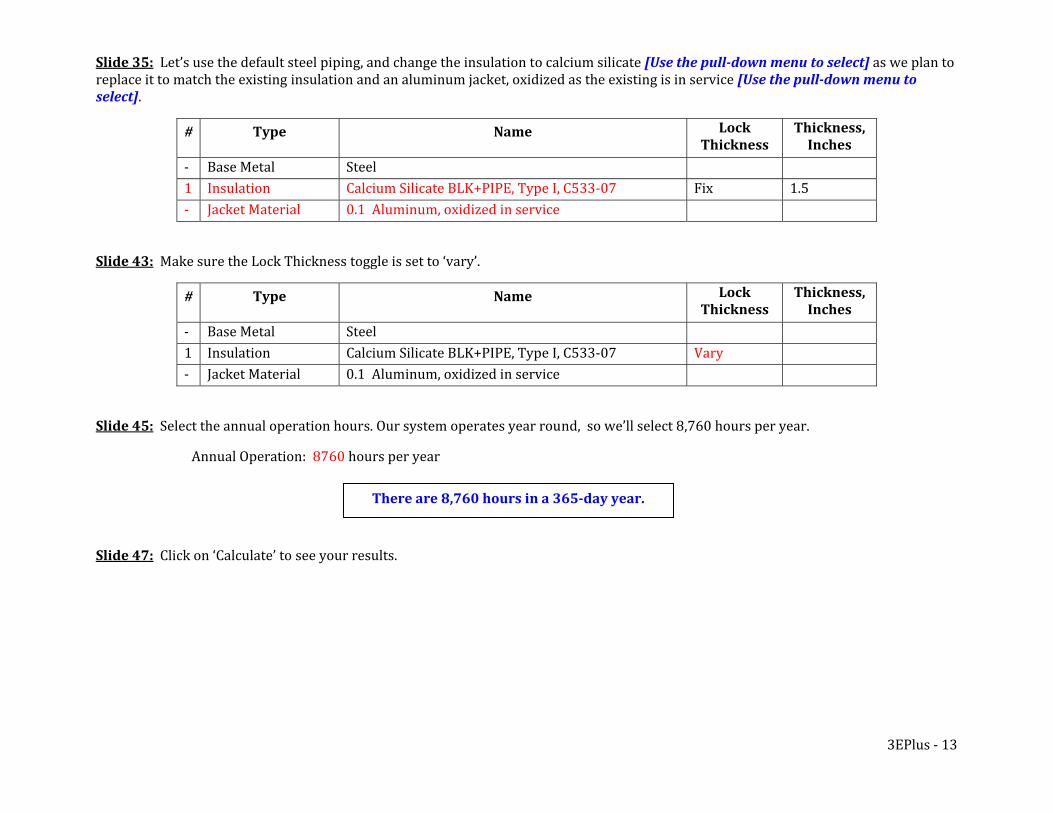
Slide 35: Let’s use the default steel piping, and change the insulation to calcium silicate [Use the pulldown menu to select] as we plan to replace it to match the existing insulation and an aluminum jacket, oxidized as the existing is in service [Use the pulldown menu to select].
# Type Name Lock Thickness
Thickness, Inches
‐ Base Metal Steel1 Insulation Calcium Silicate BLK+PIPE, Type I, C533‐07 Fix 1.5‐ Jacket Material 0.1 Aluminum, oxidized in service
Slide 43: Make sure the Lock Thickness toggle is set to ‘vary’.
# Type Name Lock Thickness
Thickness, Inches
‐ Base Metal Steel1 Insulation Calcium Silicate BLK+PIPE, Type I, C533‐07 Vary‐ Jacket Material 0.1 Aluminum, oxidized in service
Slide 45: Select the annual operation hours. Our system operates year round, so we’ll select 8,760 hours per year.
Annual Operation: 8760 hours per year
Slide 47: Click on ‘Calculate’ to see your results.
There are 8,760 hours in a 365day year.
3EPlus ‐ 13
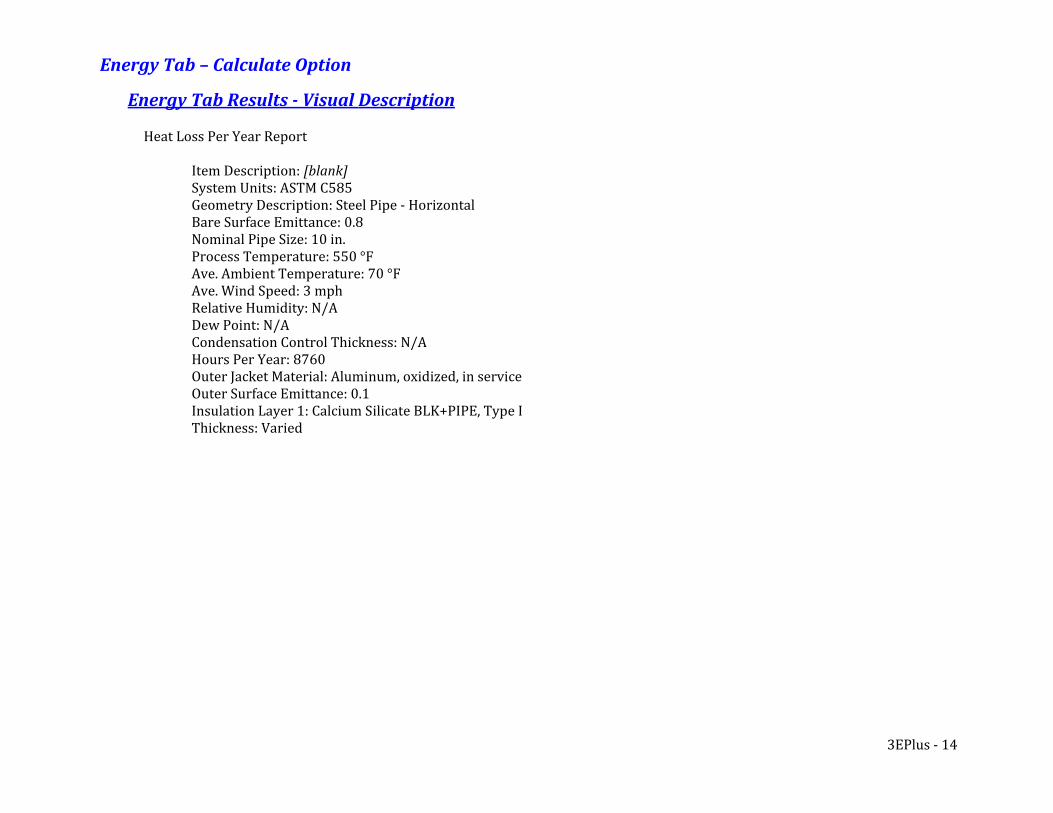
Energy Tab – Calculate Option
Energy Tab Results Visual Description Heat Loss Per Year Report
Item Description: [blank] System Units: ASTM C585 Geometry Description: Steel Pipe ‐ Horizontal Bare Surface Emittance: 0.8 Nominal Pipe Size: 10 in. Process Temperature: 550 °F Ave. Ambient Temperature: 70 °F Ave. Wind Speed: 3 mph Relative Humidity: N/A Dew Point: N/A Condensation Control Thickness: N/A Hours Per Year: 8760 Outer Jacket Material: Aluminum, oxidized, in service Outer Surface Emittance: 0.1 Insulation Layer 1: Calcium Silicate BLK+PIPE, Type I Thickness: Varied
3EPlus ‐ 14
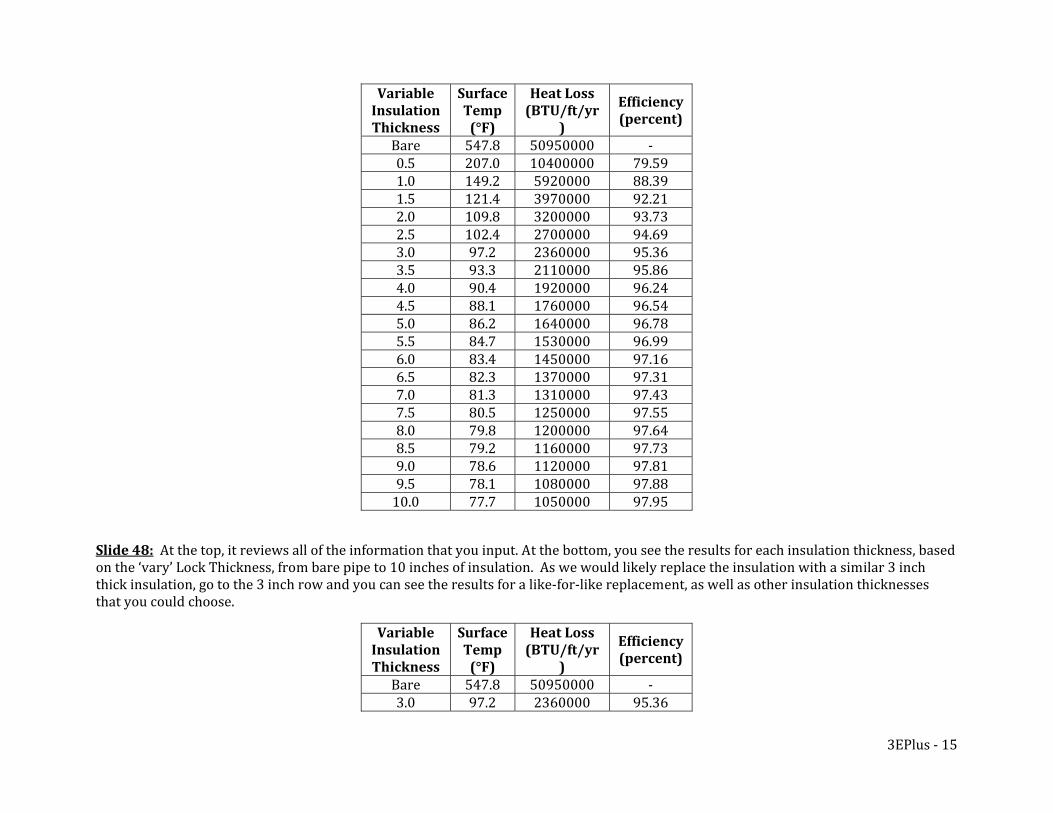
Variable Insulation
Thickness
Surface Temp (°F)
Heat Loss (BTU/ft/yr
)
Efficiency (percent)
Bare 547.8 50950000 ‐ 0.5 207.0 10400000 79.59 1.0 149.2 5920000 88.39 1.5 121.4 3970000 92.21 2.0 109.8 3200000 93.73 2.5 102.4 2700000 94.69 3.0 97.2 2360000 95.36 3.5 93.3 2110000 95.86 4.0 90.4 1920000 96.24 4.5 88.1 1760000 96.54 5.0 86.2 1640000 96.78 5.5 84.7 1530000 96.99 6.0 83.4 1450000 97.16 6.5 82.3 1370000 97.31 7.0 81.3 1310000 97.43 7.5 80.5 1250000 97.55 8.0 79.8 1200000 97.64 8.5 79.2 1160000 97.73 9.0 78.6 1120000 97.81 9.5 78.1 1080000 97.88 10.0 77.7 1050000 97.95
Slide 48: At the top, it reviews all of the information that you input. At the bottom, you see the results for each insulation thickness, based on the ‘vary’ Lock Thickness, from bare pipe to 10 inches of insulation. As we would likely replace the insulation with a similar 3 inch thick insulation, go to the 3 inch row and you can see the results for a like‐for‐like replacement, as well as other insulation thicknesses that you could choose.
Heat Loss Variable Insulation
Thickness
Surface Temp (°F)
(BTU/ft/yr)
Efficiency (percent)
Bare 547.8 50950000 ‐ 3.0 97.2 2360000 95.36
3EPlus ‐ 15
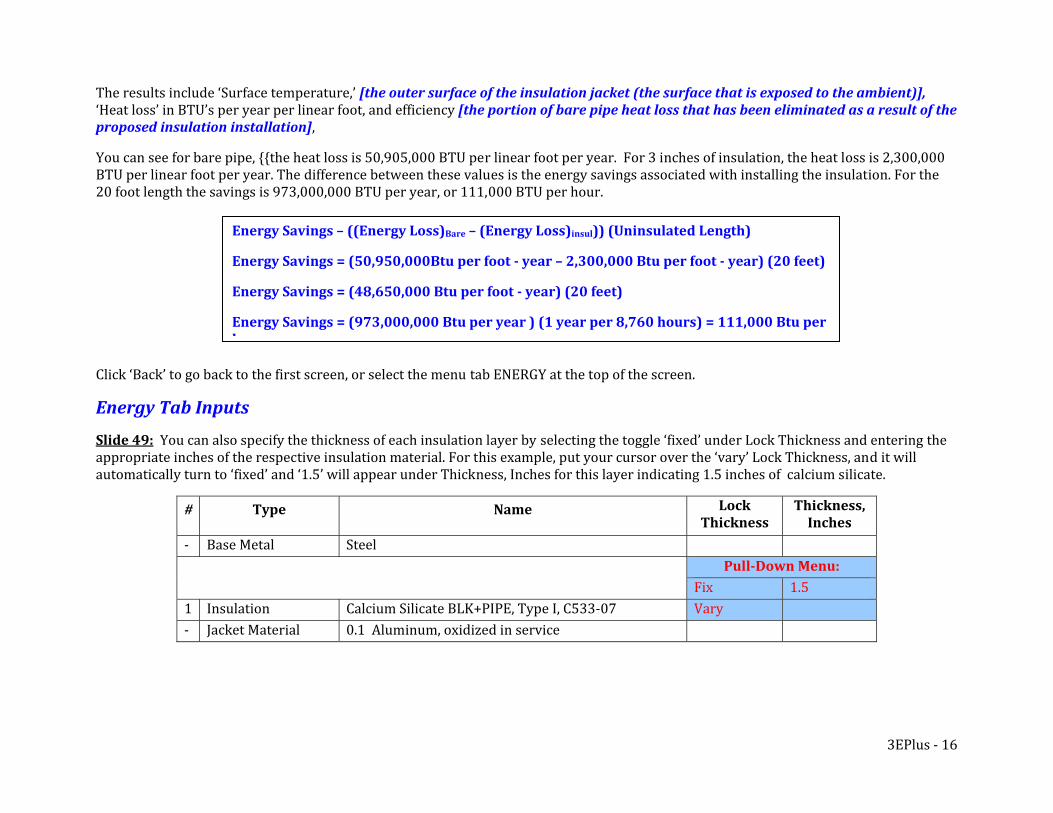
The results include ‘Surface temperature,’ [the outer surface of the insulation jacket (the surface that is exposed to the ambient)], ‘Heat loss’ in BTU’s per year per linear foot, and efficiency [the portion of bare pipe heat loss that has been eliminated as a result of the
, proposed insulation installation]
You can see for bare pipe, {{the heat loss is 50,905,000 BTU per linear foot per year. For 3 inches of insulation, the heat loss is 2,300,000 BTU per linear foot per year. The difference between these values is the energy savings associated with installing the insulation. For the 20 foot length the savings is 973,000,000 BTU per year, or 111,000 BTU per hour.
Click ‘Back’ to go back to the first screen, or select the menu tab ENERGY at the top of the screen.
Energy Savings – ((Energy Loss)Bare – (Energy Loss)insul)) (Uninsulated Length)
Energy Savings = (50,950,000Btu per foot year – 2,300,000 Btu per foot year) (20 feet)
Energy Savings = (48,650,000 Btu per foot year) (20 feet)
Energy Savings = (973,000,000 Btu per year ) (1 year per 8,760 hours) = 111,000 Btu per h
Energy Tab Inputs
Slide 49: You can also specify the thickness of each insulation layer by selecting the toggle ‘fixed’ under Lock Thickness and entering the appropriate inches of the respective insulation material. For this example, put your cursor over the ‘vary’ Lock Thickness, and it will automatically turn to ‘fixed’ and ‘1.5’ will appear under Thickness, Inches for this layer indicating 1.5 inches of calcium silicate.
# Type Name Lock Thickness
Thickness, Inches
‐ Base Metal Steel PullDown Menu: Fix 1.51 Insulation Calcium Silicate BLK+PIPE, Type I, C533‐07 Vary‐ Jacket Material 0.1 Aluminum, oxidized in service
3EPlus ‐ 16
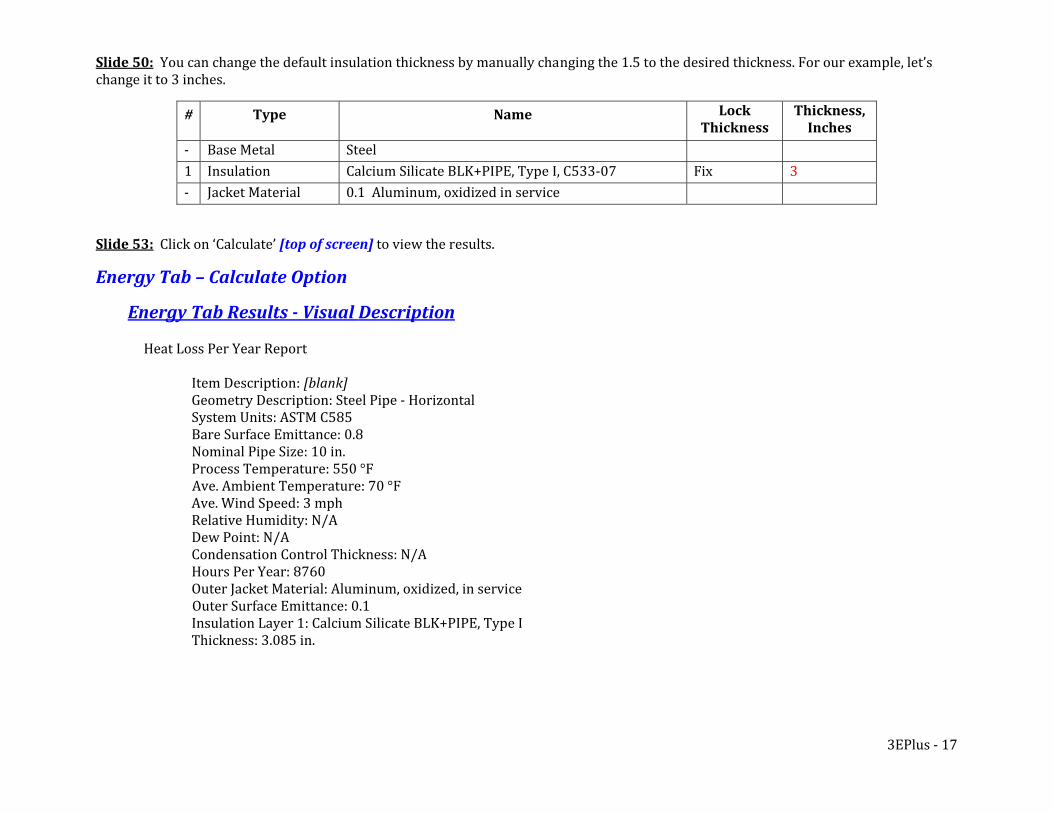
Slide 50: You can change the default insulation thickness by manually changing the 1.5 to the desired thickness. For our example, let’s change it to 3 inches.
# Type Name Lock Thickness
Thickness, Inches
‐ Base Metal Steel1 Insulation Calcium Silicate BLK+PIPE, Type I, C533‐07 Fix 3‐ Jacket Material 0.1 Aluminum, oxidized in service
Slide 53: Click on ‘Calculate’ [top of screen] to view the results.
Energy Tab – Calculate Option
Energy Tab Results Visual Description
Heat Loss Per Year Report
Item Description: [blank] Geometry Description: Steel Pipe ‐ Horizontal
System Units: ASTM C585 Bare Surface Emittance: 0.8
Nominal Pipe Size: 10 in. Process Temperature: 550 °F Ave. Ambient Temperature: 70 °F
Ave. Wind Speed: 3 mph Relative Humidity: N/A Dew Point: N/A Condensation Control Thickness: N/A Hours Per Year: 8760 Outer Jacket Material: Aluminum, oxidized, in service Outer Surface Emittance: 0.1
Insulation Layer 1: Calcium Silicate BLK+PIPE, Type I Thickness: 3.085 in.
3EPlus ‐ 17
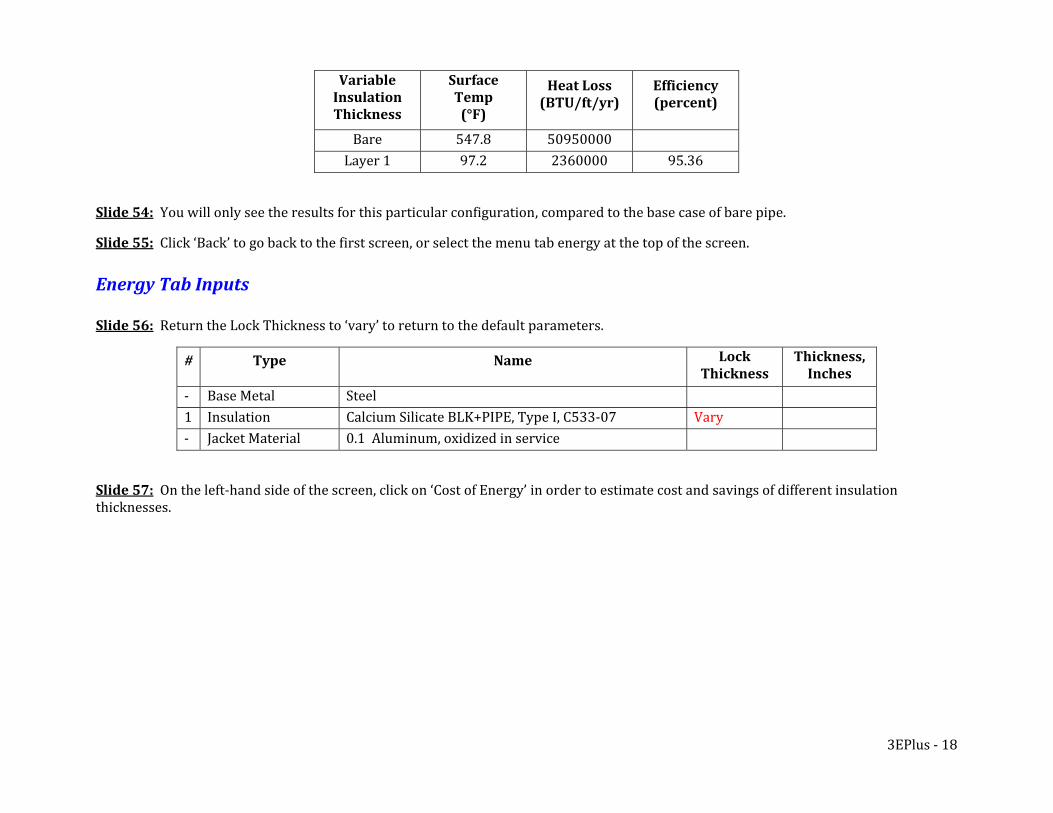
Variable Insulation
Thickness
Surface Temp (°F)
Heat Loss (BTU/ft/yr)
Efficiency (percent)
Bare 547.8 50950000 Layer 1 97.2 2360000 95.36
Slide 54: You will only see the results for this particular configuration, compared to the base case of bare pipe.
Slide 55: Click ‘Back’ to go back to the first screen, or select the menu tab energy at the top of the screen. Energy Tab Inputs Slide 56: Return the Lock Thickness to ‘vary’ to return to the default parameters.
# Type Name Lock Thickness
Thickness, Inches
‐ Base Metal Steel1 Insulation Calcium Silicate BLK+PIPE, Type I, C533‐07 Vary‐ Jacket Material 0.1 Aluminum, oxidized in service
Slide 57: On the left‐hand side of the screen, click on ‘Cost of Energy’ in order to estimate cost and savings of different insulation thicknesses.
3EPlus ‐ 18
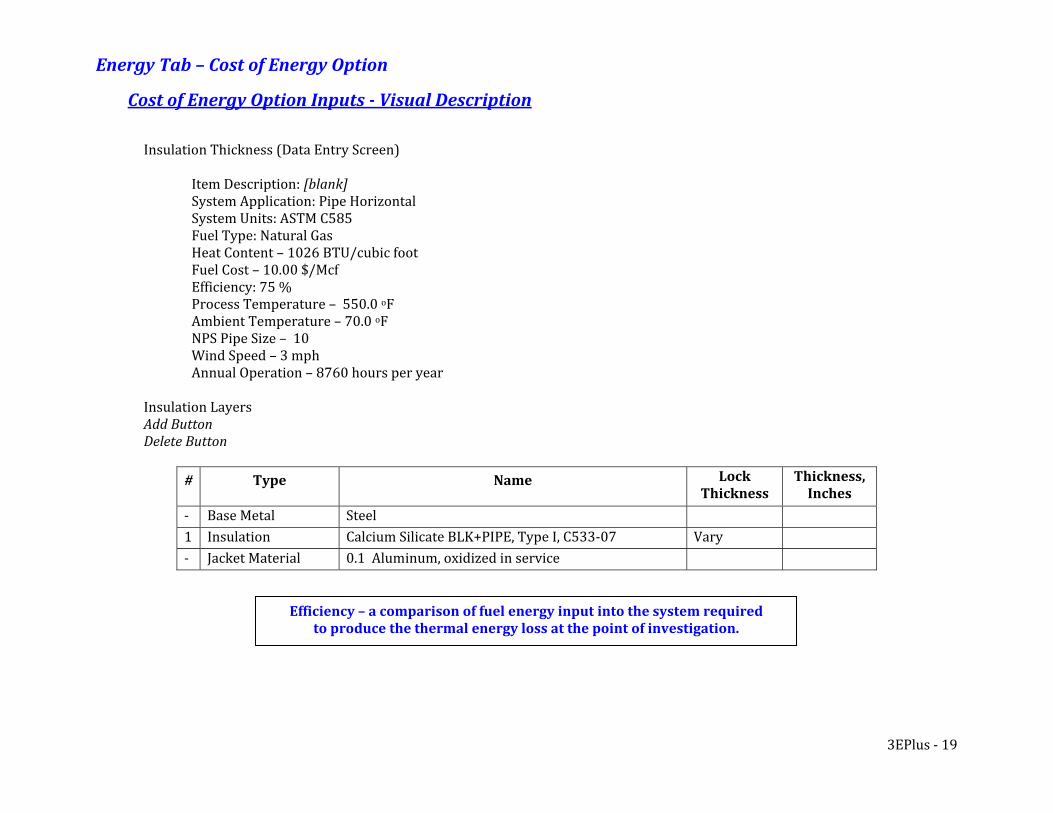
Energy Tab – Cost of Energy Option
Cost of Energy Option Inputs Visual Description
Insulation Thickness (Data Entry Screen)
Item Description: [blank]System Application: Pipe Horizontal System Units: ASTM C585 Fuel Type: Natural Gas Heat Content – 1026 BTU/cubic foot Fuel Cost – 10.00 $/Mcf Efficiency: 75 % Process Temperature – 550.0 oF Ambient Temperature – 70.0 oF NPS Pipe Size – 10 Wind Speed – 3 mph Annual Operation – 8760 hours per year
Insulation Layers Add Button Delete Button
# Type Name Lock Thickness
Thickness, Inches
‐ Base Metal Steel1 Insulation Calcium Silicate BLK+PIPE, Type I, C533‐07 Vary‐ Jacket Material 0.1 Aluminum, oxidized in service
Efficiency – a comparison of fuel energy input into the system required to produce the thermal energy loss at the point of investigation.
3EPlus ‐ 19
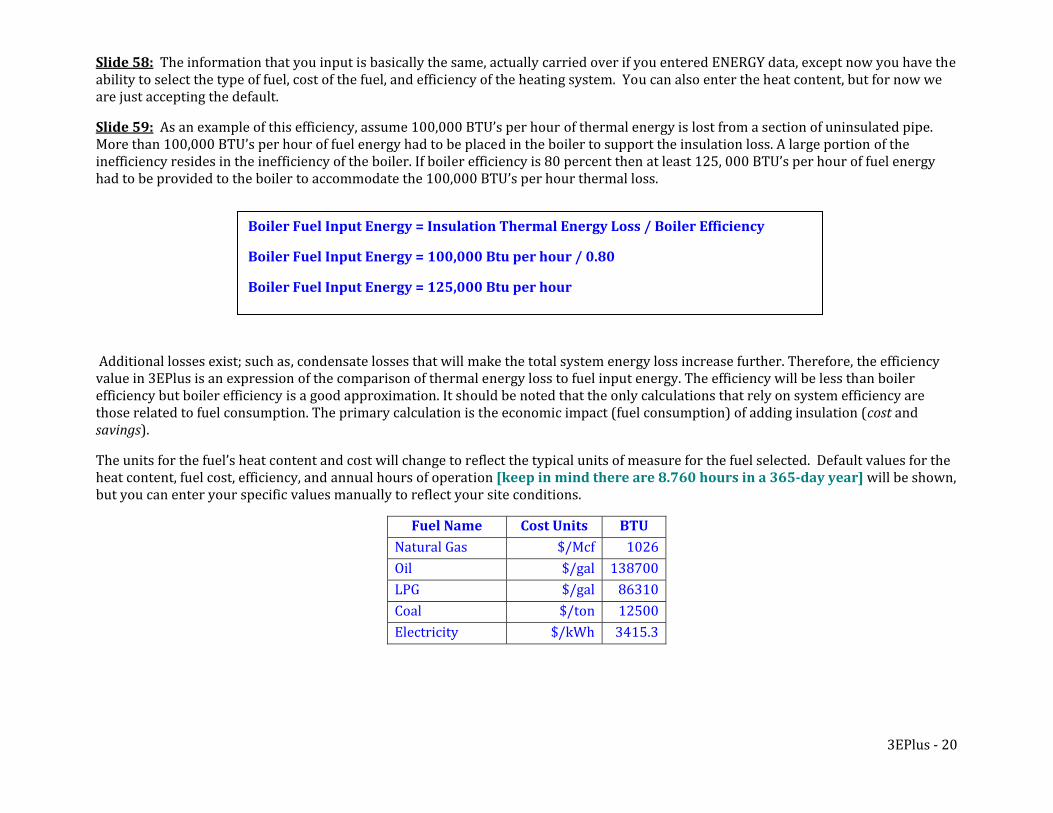
Slide 58: The information that you input is basically the same, actually carried over if you entered ENERGY data, except now you have the ability to select the type of fuel, cost of the fuel, and efficiency of the heating system. You can also enter the heat content, but for now we are just accepting the default.
Slide 59: As an example of this efficiency, assume 100,000 BTU’s per hour of thermal energy is lost from a section of uninsulated pipe. More than 100,000 BTU’s per hour of fuel energy had to be placed in the boiler to support the insulation loss. A large portion of the inefficiency resides in the inefficiency of the boiler. If boiler efficiency is 80 percent then at least 125, 000 BTU’s per hour of fuel energy had to be provided to the boiler to accommodate the 100,000 BTU’s per hour thermal loss.
Boiler Fuel Input Energy = Insulation Thermal Energy Loss / Boiler Efficiency
Boiler Fuel Input Energy = 100,000 Btu per hour / 0.80
Boiler Fuel Input Energy = 125,000 Btu per hour
Additional losses exist; such as, condensate losses that will make the total system energy loss increase further. Therefore, the efficiency value in 3EPlus is an expression of the comparison of thermal energy loss to fuel input energy. The efficiency will be less than boiler efficiency but boiler efficiency is a good approximation. It should be noted that the only calculations that rely on system efficiency are those related to fuel consumption. The primary calculation is the economic impact (fuel consumption) of adding insulation (cost and
). savings
The units for the fuel’s heat content and cost will change to reflect the typical units of measure for the fuel selected. Default values for the heat content, fuel cost, efficiency, and annual hours of operation [keep in mind there are 8.760 hours in a 365day year] will be shown, but you can enter your specific values manually to reflect your site conditions.
Fuel Name Cost Units BTU Natural Gas $/Mcf 1026Oil $/gal 138700LPG $/gal 86310Coal $/ton 12500Electricity $/kWh 3415.3
3EPlus ‐ 20
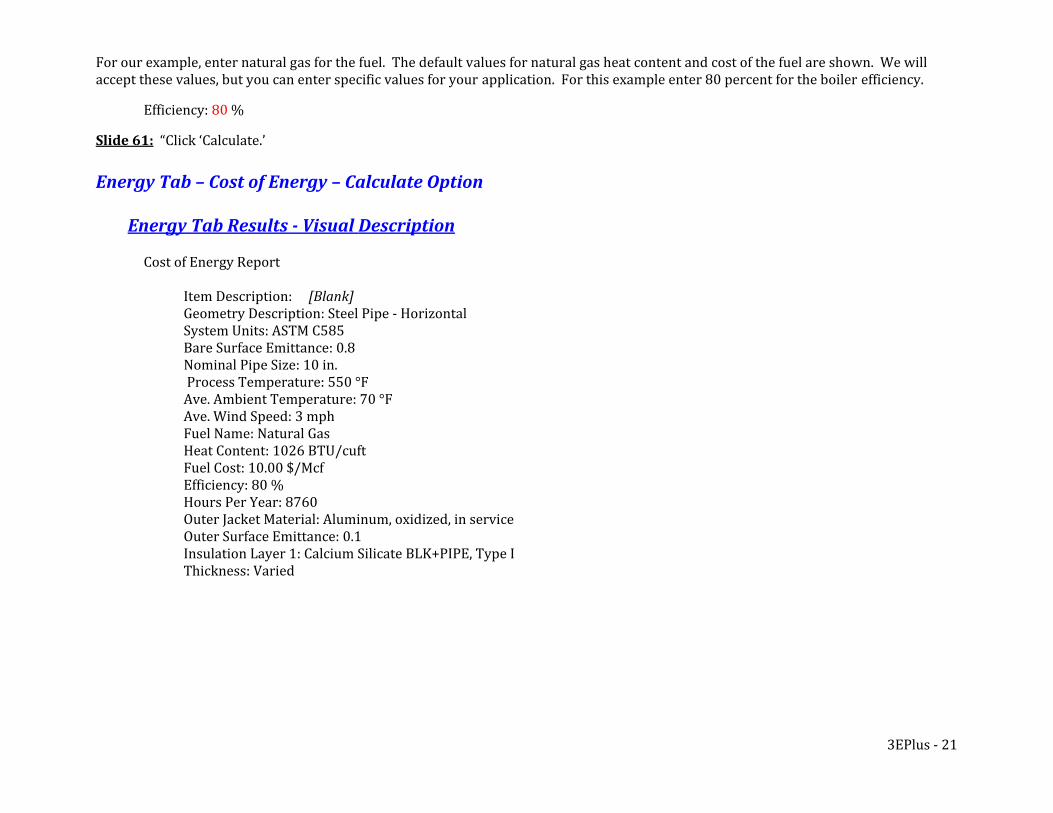
For our example, enter natural gas for the fuel. The default values for natural gas heat content and cost of the fuel are shown. We will accept these values, but you can enter specific values for your application. For this example enter 80 percent for the boiler efficiency.
Efficiency: 80 %
Slide 61: “Click ‘Calculate.’ Energy Tab – Cost of Energy – Calculate Option
Energy Tab Results Visual Description
Cost of Energy Report Item Description: [Blank] Geometry Description: Steel Pipe ‐ Horizontal
System Units: ASTM C585 Bare Surface Emittance: 0.8
Nominal Pipe Size: 10 in. Process Temperature: 550 °F Ave. Ambient Temperature: 70 °F
Ave. Wind Speed: 3 mph Fuel Name: Natural Gas Heat Content: 1026 BTU/cuft Fuel Cost: 10.00 $/Mcf Efficiency: 80 % Hours Per Year: 8760 Outer Jacket Material: Aluminum, oxidized, in service Outer Surface Emittance: 0.1 Insulation Layer 1: Calcium Silicate BLK+PIPE, Type I Thickness: Varied
3EPlus ‐ 21
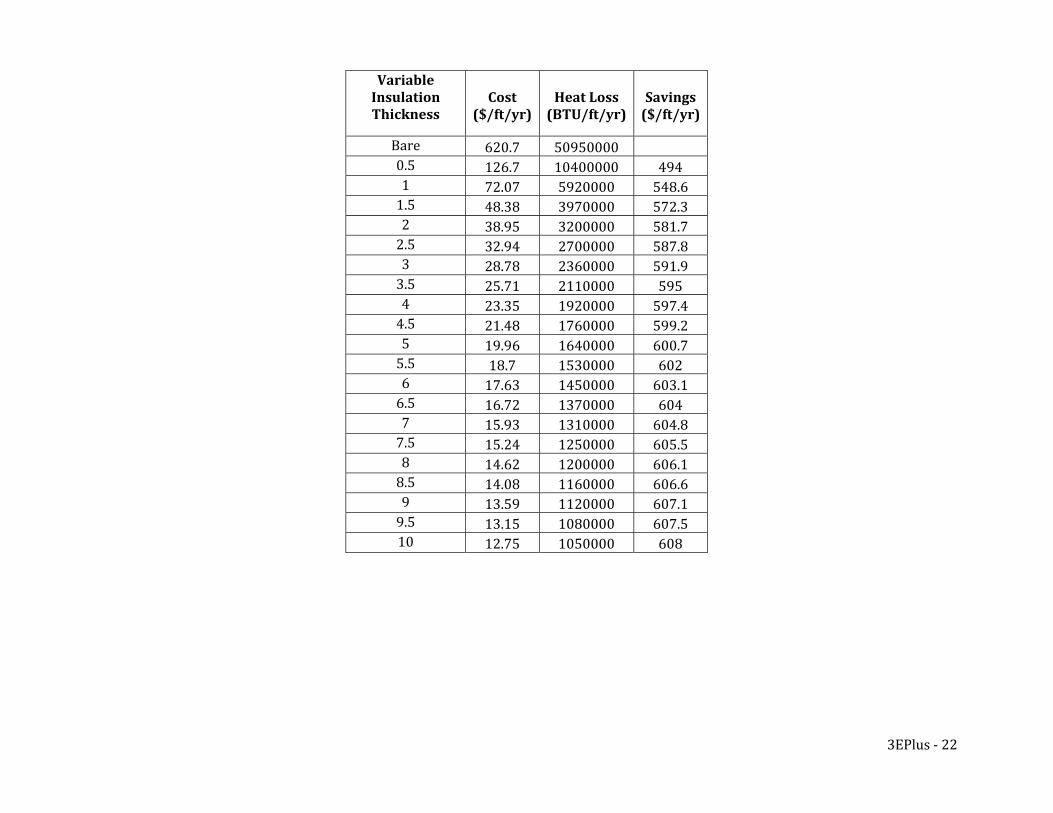
Variable Insulation Thickness
Cost ($/ft/yr)
Heat Loss (BTU/ft/yr)
Savings ($/ft/yr)
Bare 620.7 50950000 0.5 126.7 10400000 494 1 72.07 5920000 548.6 1.5 48.38 3970000 572.3 2 38.95 3200000 581.7 2.5 32.94 2700000 587.8 3 28.78 2360000 591.9 3.5 25.71 2110000 595 4 23.35 1920000 597.4 4.5 21.48 1760000 599.2 5 19.96 1640000 600.7 5.5 18.7 1530000 602 6 17.63 1450000 603.1 6.5 16.72 1370000 604 7 15.93 1310000 604.8 7.5 15.24 1250000 605.5 8 14.62 1200000 606.1 8.5 14.08 1160000 606.6 9 13.59 1120000 607.1 9.5 13.15 1080000 607.5 10 12.75 1050000 608
3EPlus ‐ 22
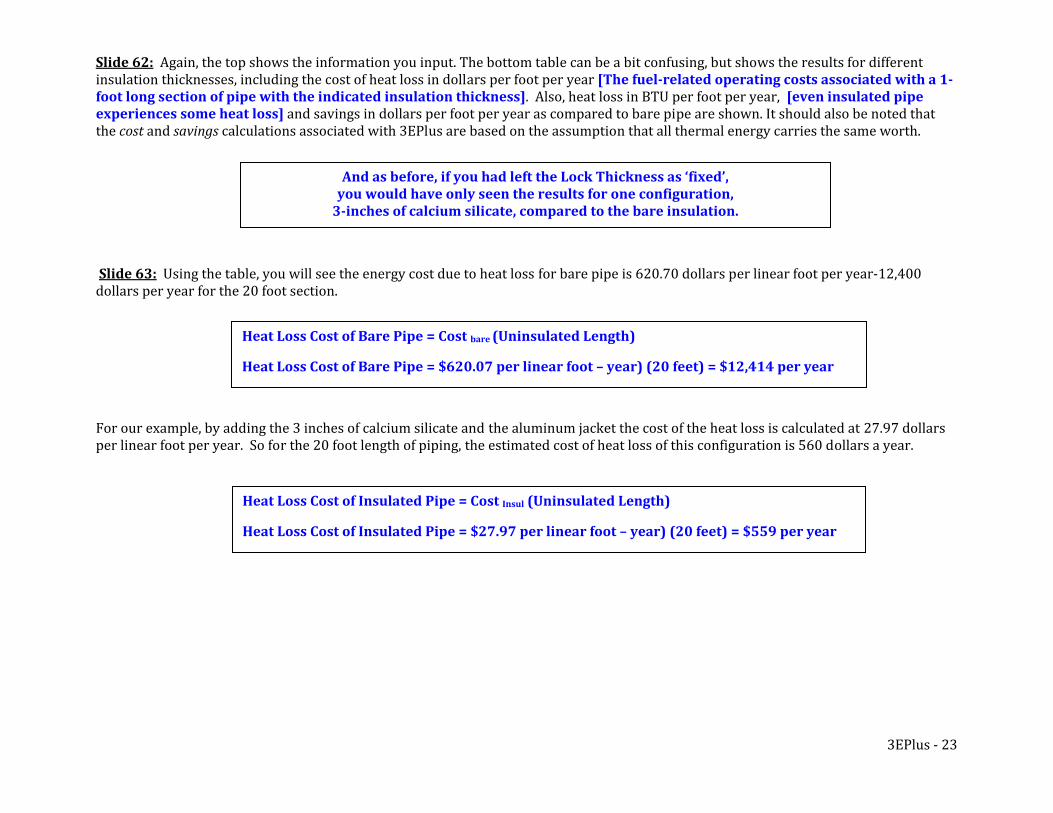
Slide 62: Again, the top shows the information you input. The bottom table can be a bit confusing, but shows the results for different insulation thicknesses, including the cost of heat loss in dollars per foot per year [The fuelrelated operating costs associated with a 1foot long section of pipe with the indicated insulation thickness]. Also, heat loss in BTU per foot per year, [even insulated pipe experiences some heat loss] and savings in dollars per foot per year as compared to bare pipe are shown. It should also be noted that the cost and savings calculations associated with 3EPlus are based on the assumption that all thermal energy carries the same worth. And as before, if you had left the Lock Thickness as ‘fixed’,
you would have only seen the results for one configuration, 3inches of calcium silicate, compared to the bare insulation.
Slide 63: Using the table, you will see the energy cost due to heat loss for bare pipe is 620.70 dollars per linear foot per year‐12,400 dollars per year for the 20 foot section. For our example, by adding the 3 inches of calcium silicate and the aluminum jacket the cost of the heat loss is calculated at 27.97 dollars per linear foot per year. So for the 20 foot length of piping, the estimated cost of heat loss of this configuration is 560 dollars a year.
Heat Loss Cost of Bare Pipe = Cost bare (Uninsulated Length)
Heat Loss Cost of Bare Pipe = $620.07 per linear foot – year) (20 feet) = $12,414 per year
Heat Loss Cost of Insulated Pipe = Cost Insul (Uninsulated Length)
Heat Loss Cost of Insulated Pipe = $27.97 per linear foot – year) (20 feet) = $559 per year
3EPlus ‐ 23
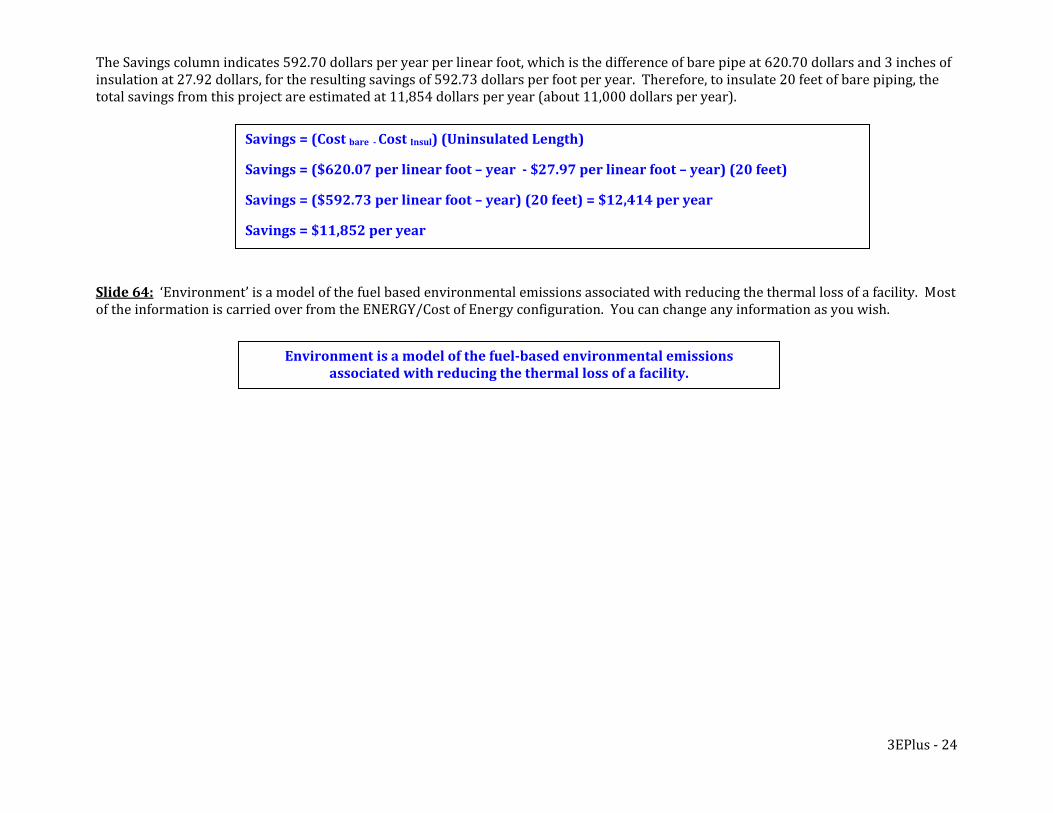
The Savings column indicates 592.70 dollars per year per linear foot, which is the difference of bare pipe at 620.70 dollars and 3 inches of insulation at 27.92 dollars, for the resulting savings of 592.73 dollars per foot per year. Therefore, to insulate 20 feet of bare piping, the total savings from this project are estimated at 11,854 dollars per year (about 11,000 dollars per year). Savings = (Cost bare Cost Insul) (Uninsulated Length)
Savings = ($620.07 per linear foot – year $27.97 per linear foot – year) (20 feet)
Savings = ($592.73 per linear foot – year) (20 feet) = $12,414 per year
Savings = $11,852 per year
Slide 64: ‘Environment’ is a model of the fuel based environmental emissions associated with reducing the thermal loss of a facility. Most of the information is carried over from the ENERGY/Cost of Energy configuration. You can change any information as you wish.
Environment is a model of the fuelbased environmental emissions
associated with reducing the thermal loss of a facility.
3EPlus ‐ 24
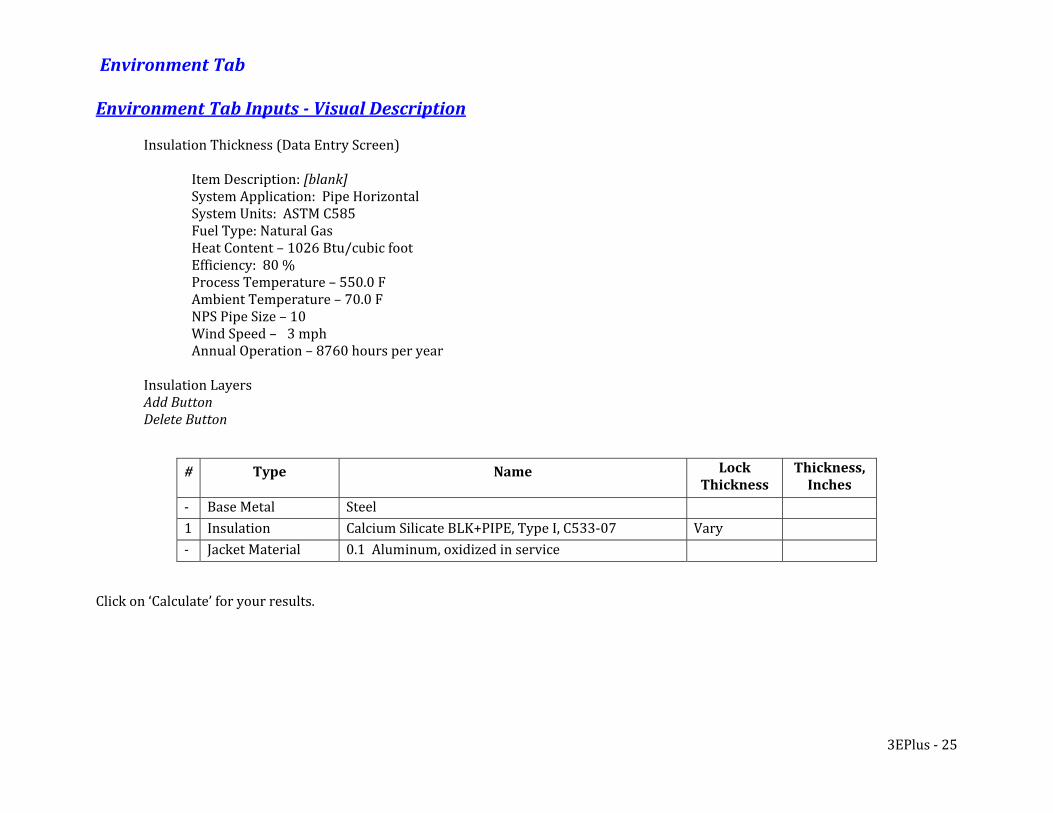
Environment Tab Envir nment Tab Inputs Visual o
Description
Insulation Thickness (Data Entry Screen)
Item Description: [blank] System Application: Pipe Horizontal System Units: ASTM C585 Fuel Type: Natural Gas Heat Content – 1026 Btu/cubic foot Efficiency: 80 % Process Temperature – 550.0 F Ambient Temperature – 70.0 F NPS Pipe Size – 10 Wind Speed – 3 mph Annual Operation – 8760 hours per year
Insulation Layers Add Button Delete Button
# Type Name Lock Thickness
Thickness, Inches
‐ Base Metal Steel1 Insulation Calcium Silicate BLK+PIPE, Type I, C533‐07 Vary‐ Jacket Material 0.1 Aluminum, oxidized in service
Click on ‘Calculate’ for your results.
3EPlus ‐ 25
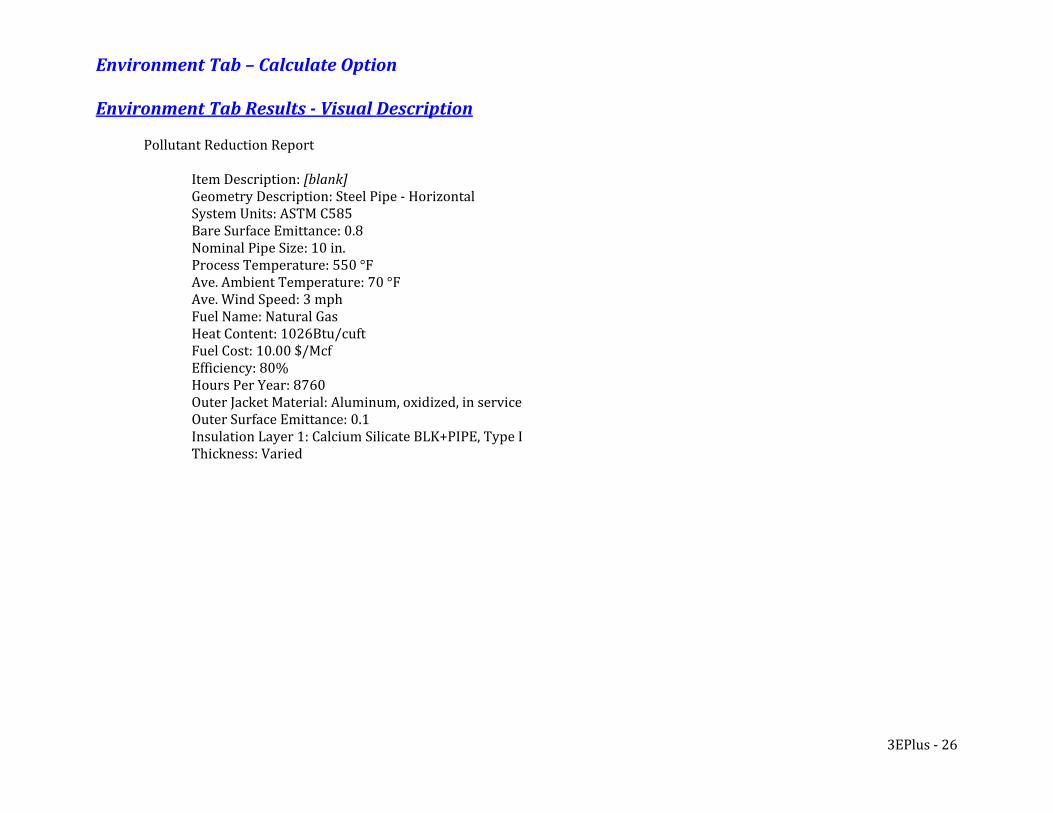
Environment Tab – Calculate Option Environment Tab Results Visual Description
Pollutant Reduction Report
Item Description: [blank]
Geometry Description: Steel Pipe ‐ Horizontal System Units: ASTM C585 Bare Surface Emittance: 0.8 Nominal Pipe Size: 10 in. Process Temperature: 550 °F Ave. Ambient Temperature: 70 °F Ave. Wind Speed: 3 mph Fuel Name: Natural Gas Heat Content: 1026Btu/cuft Fuel Cost: 10.00 $/Mcf Efficiency: 80% Hours Per Year: 8760 Outer Jacket Material: Aluminum, oxidized, in service Outer Surface Emittance: 0.1 Insulation Layer 1: Calcium Silicate BLK+PIPE, Type I
Thickness: Varied
3EPlus ‐ 26
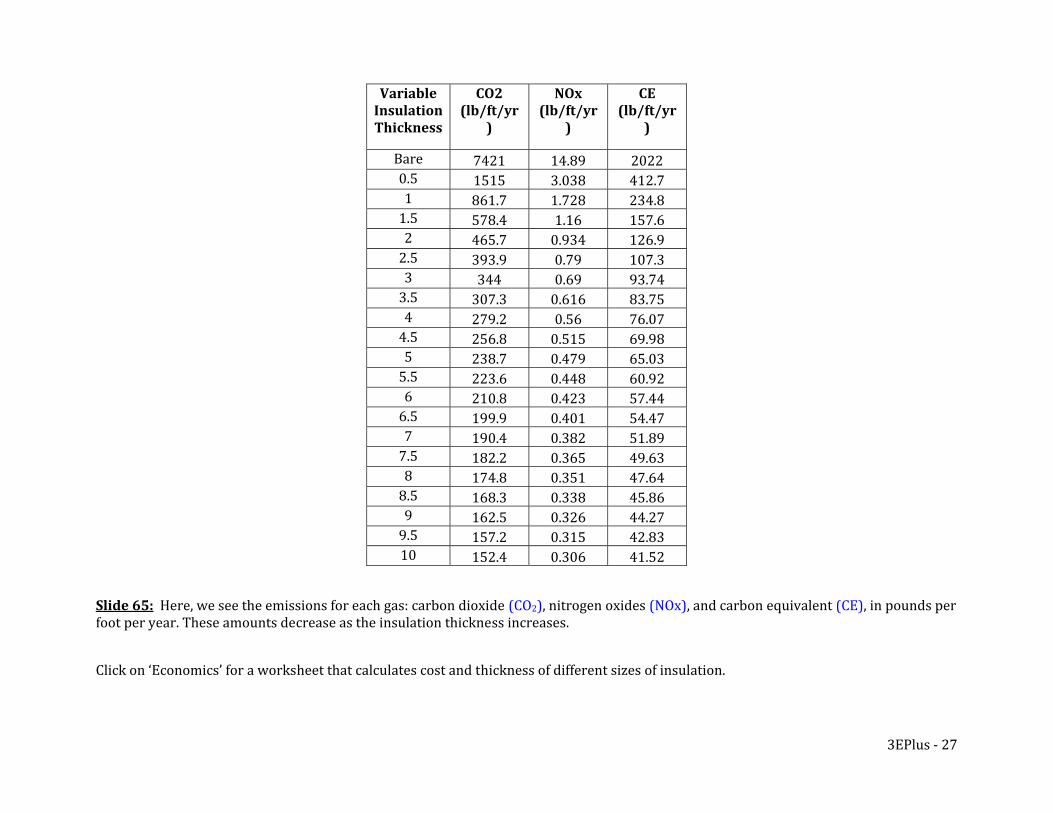
Variable Insulation Thickness
CO2 NOx CE (lb/ft/yr
) (lb/ft/yr
) (lb/ft/yr
)
Bare 7421 14.89 2022 0.5 1515 3.038 412.7 1 861.7 1.728 234.8 1.5 578.4 1.16 157.6 2 465.7 0.934 126.9 2.5 393.9 0.79 107.3 3 344 0.69 93.74 3.5 307.3 0.616 83.75 4 279.2 0.56 76.07 4.5 256.8 0.515 69.98 5 238.7 0.479 65.03 5.5 223.6 0.448 60.92 6 210.8 0.423 57.44 6.5 199.9 0.401 54.47 7 190.4 0.382 51.89 7.5 182.2 0.365 49.63 8 174.8 0.351 47.64 8.5 168.3 0.338 45.86 9 162.5 0.326 44.27 9.5 157.2 0.315 42.83 10 152.4 0.306 41.52
Slide 65: Here, we see the emissions for each gas: carbon dioxide (CO2), nitrogen oxides (NOx), and carbon equivalent (CE), in pounds per foot per year. These amounts decrease as the insulation thickness increases.
Click on ‘Economics’ for a worksheet that calculates cost and thickness of different sizes of insulation.
3EPlus ‐ 27
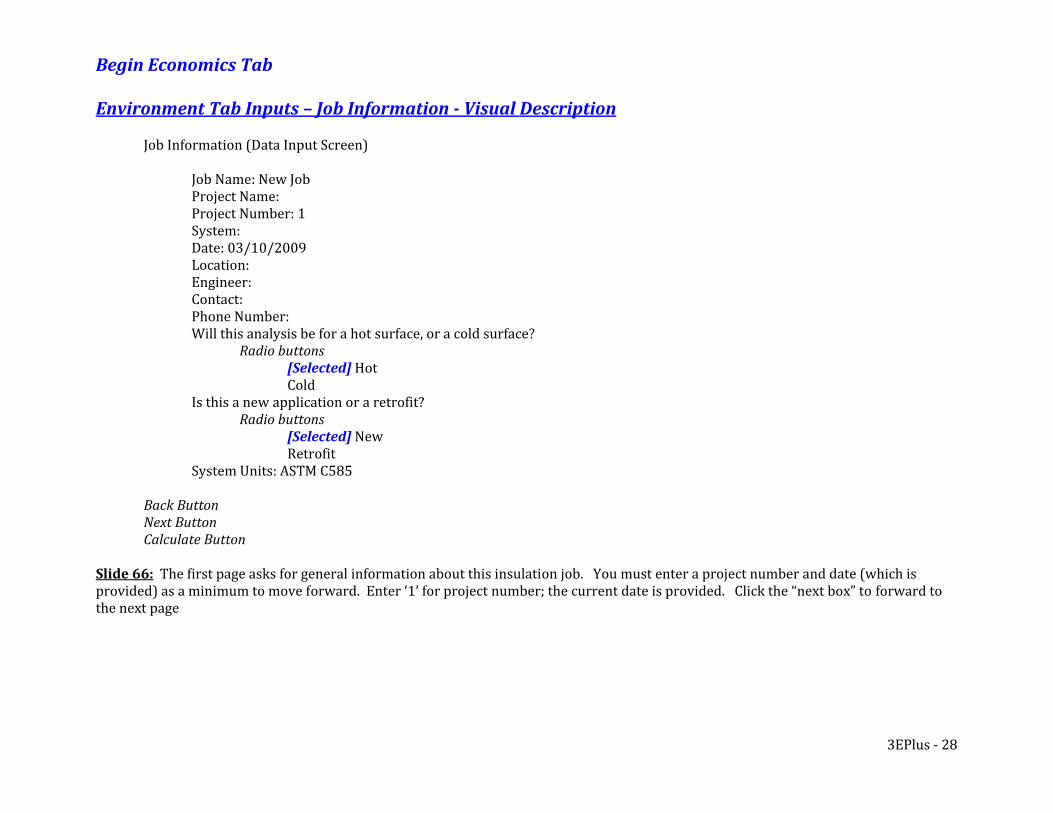
Begin Economics Tab Environment Tab Inputs – Job Information Visual Description
Job Information (Data Input Screen)
Job Name: New Job Project Name: Project Number: 1 System: Date: 03/10/2009 Location: Engineer: Contact: Phone Number: Will this analysis be for a hot surface, or a cold surface? ttons Radio bu Hot [Selected] Cold Is this a new application or a retrofit? Radio buttons
[Selected] Retrofit
New
System Units: ASTM C585
Back Button Next Button Calculate Button
Slide 66: The first page asks for general information about this insulation job. You must enter a project number and date (which is provided) as a minimum to move forward. Enter ‘1’ for project number; the current date is provided. Click the “next box” to forward to the next page
3EPlus ‐ 28
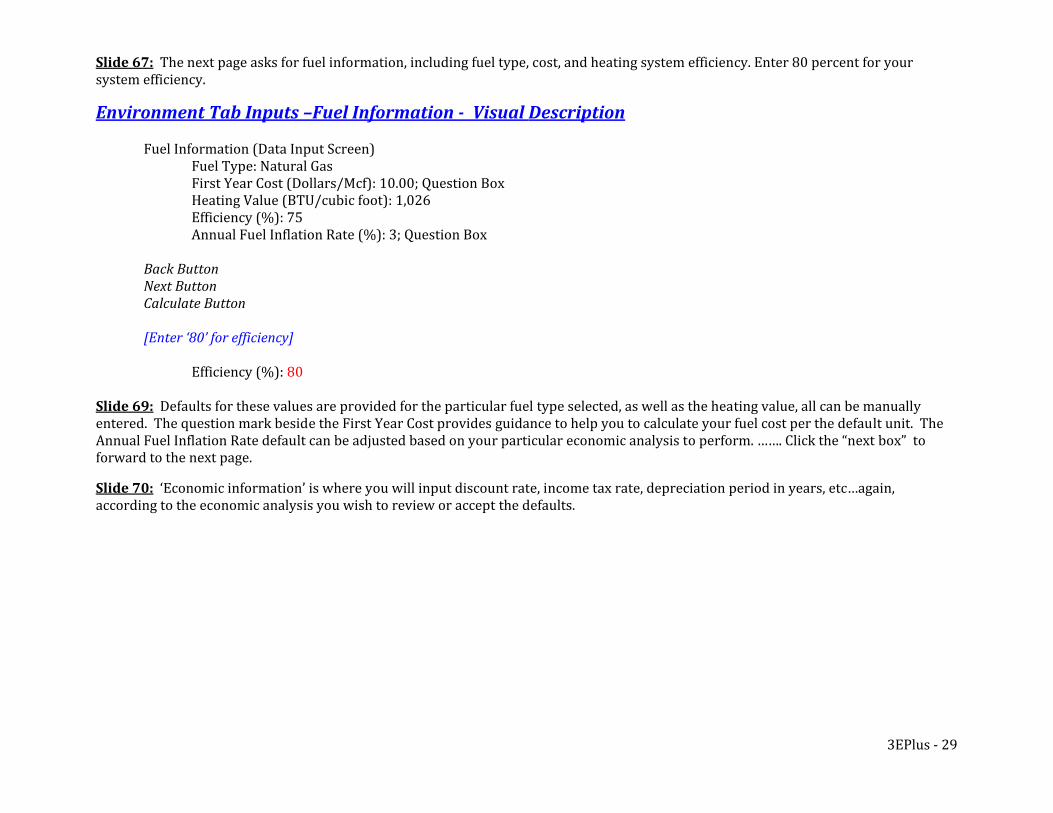
Slide 67: The next page asks for fuel information, including fuel type, cost, and heating system efficiency. Enter 80 percent for your system efficiency.
Envir nment Tab Inputs –Fuel Information Visual o
Description
Fuel Information (Data Input Screen) Fuel Type: Natural Gas First Year Cost (Dollars/Mcf): 10.00; Question Box Heating Value (BTU/cubic foot): 1,026 Efficiency (%): 75 Annual Fuel Inflation Rate (%): 3; Question Box
Back Button Next Button C alculate Button
[Enter ‘80’ for efficiency] Efficiency (%): 80
Slide 69: Defaults for these values are provided for the particular fuel type selected, as well as the heating value, all can be manually entered. The question mark beside the First Year Cost provides guidance to help you to calculate your fuel cost per the default unit. The Annual Fuel Inflation Rate default can be adjusted based on your particular economic analysis to perform. ……. Click the “next box” to forward to the next page.
Slide 70: ‘Economic information’ is where you will input discount rate, income tax rate, depreciation period in years, etc…again, according to the economic analysis you wish to review or accept the defaults.
3EPlus ‐ 29
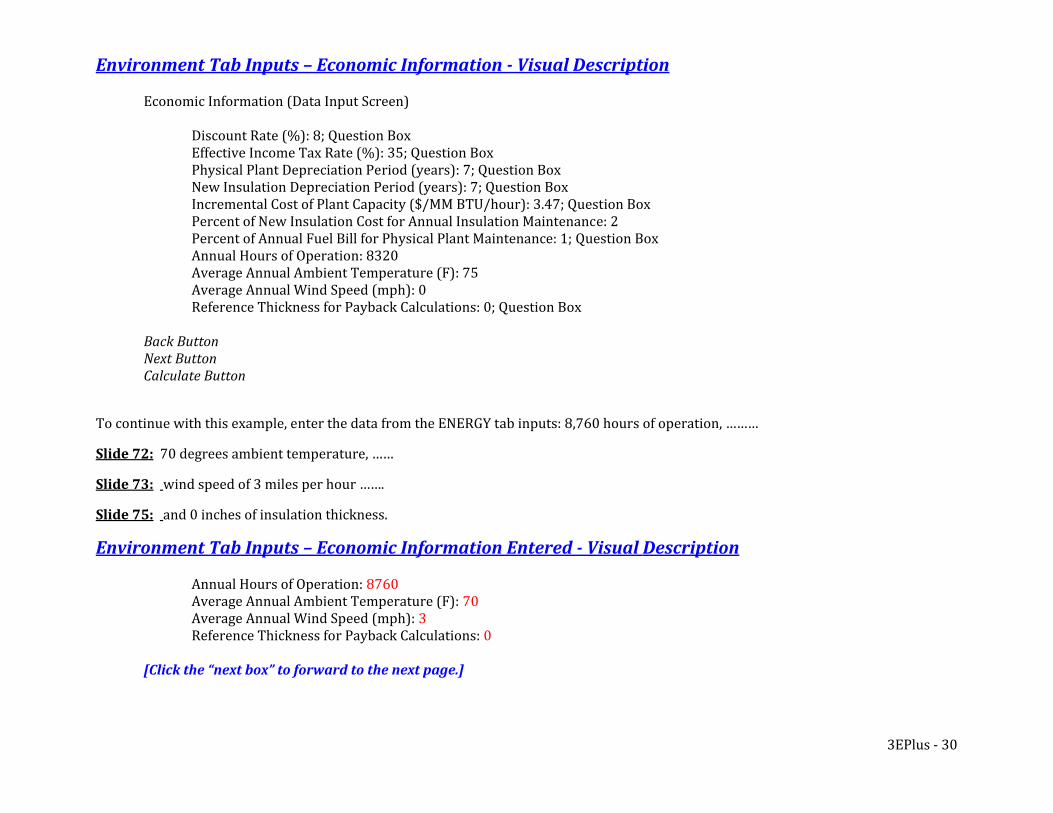
Envir nment Tab Inputs – Economic Information Visual o
Description
Economic Information (Data Input Screen)
Discount Rate (%): 8; Question Box Effective Income Tax Rate (%): 35; Question Box Physical Plant Depreciation Period (years): 7; Question Box New Insulation Depreciation Period (years): 7; Question Box Incremental Cost of Plant Capacity ($/MM BTU/hour): 3.47; Question Box Percent of New Insulation Cost for Annual Insulation Maintenance: 2 Percent of Annual Fuel Bill for Physical Plant Maintenance: 1; Question Box Annual Hours of Operation: 8320 Average Annual Ambient Temperature (F): 75 Average Annual Wind Speed (mph): 0 Reference Thickness for Payback Calculations: 0; Question Box
Back Button Next Button C alculate Button
To continue with this example, enter the data from the ENERGY tab inputs: 8,760 hours of operation, ………
Slide 72: 70 degrees ambient temperature, ……
Slide 73: wind speed of 3 miles per hour …….
Slide 75: and 0 inches of insulation thickness.
Envir nment Tab Inputs – Economic Information Entered Visual o
Description
Annual Hours of Operation: 8760 Average Annual Ambient Temperature (F): 70 Average Annual Wind Speed (mph): 3 Reference Thickness for Payback Calculations: 0
[
Click the “next box” to forward to the next page.]
3EPlus ‐ 30
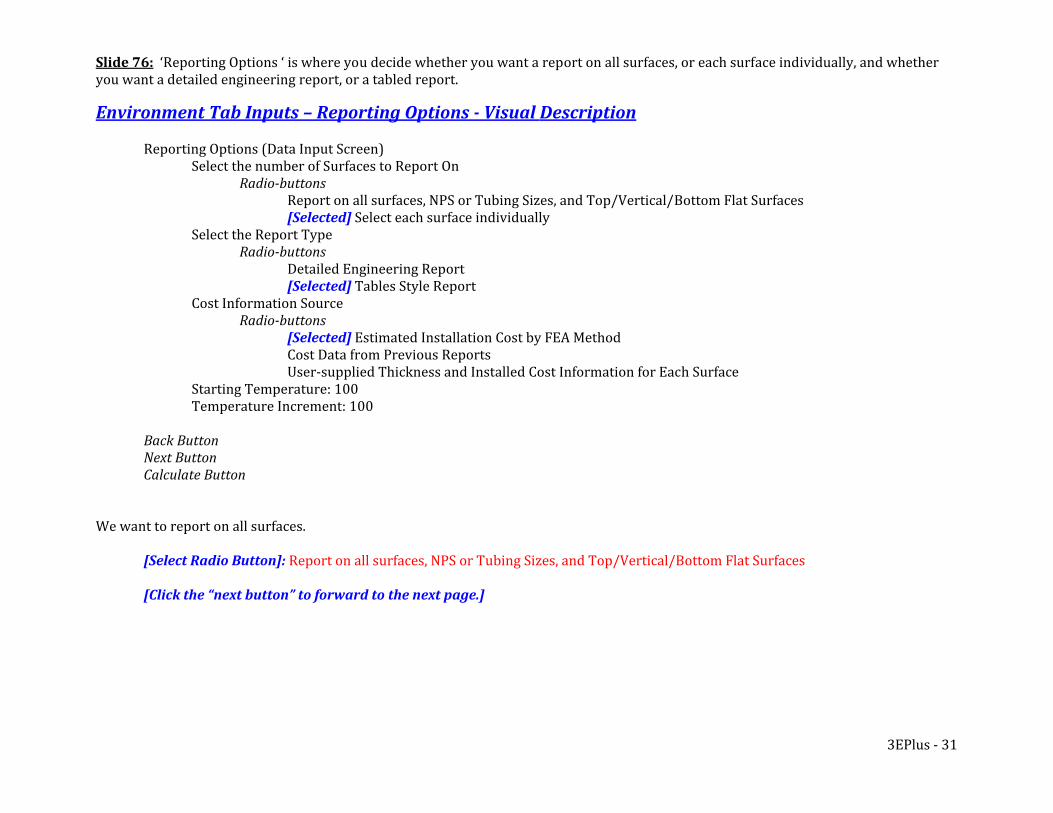
Slide 76: ‘Reporting Options ‘ is where you decide whether you want a report on all surfaces, or each surface individually, and whether you want a detailed engineering report, or a tabled report.
Envir nment Tab Inputs – Reporting Options Visual o
Description
Reporting Options (Data Input Screen) Select the number of Surfaces to Report On Radiobuttons
Report on all surfaces, NPS or Tubing Sizes, and Top/Vertical/Bottom Flat Surfaces d] Select each surface individually [Selecte
Select the Report Type Radiobuttons
Detailed Engineering Report ] Tables Style Report [SelectedCost Information Source Radiobuttons
[Selected] Cost Data from Previous Reports
Estimated Installation Cost by FEA Method
User‐supplied Thickness and Installed Cost Information for Each Surface Starting Temperature: 100 Temperature Increment: 100
Back Button Next Button Calculate Button
We want to report on all surfaces.
[Select Radio Button]: Report on all surfaces, NPS or Tubing Sizes, and Top/Vertical/Bottom Flat Surfaces
[Click the “next button” to forward to the next page.]
3EPlus ‐ 31
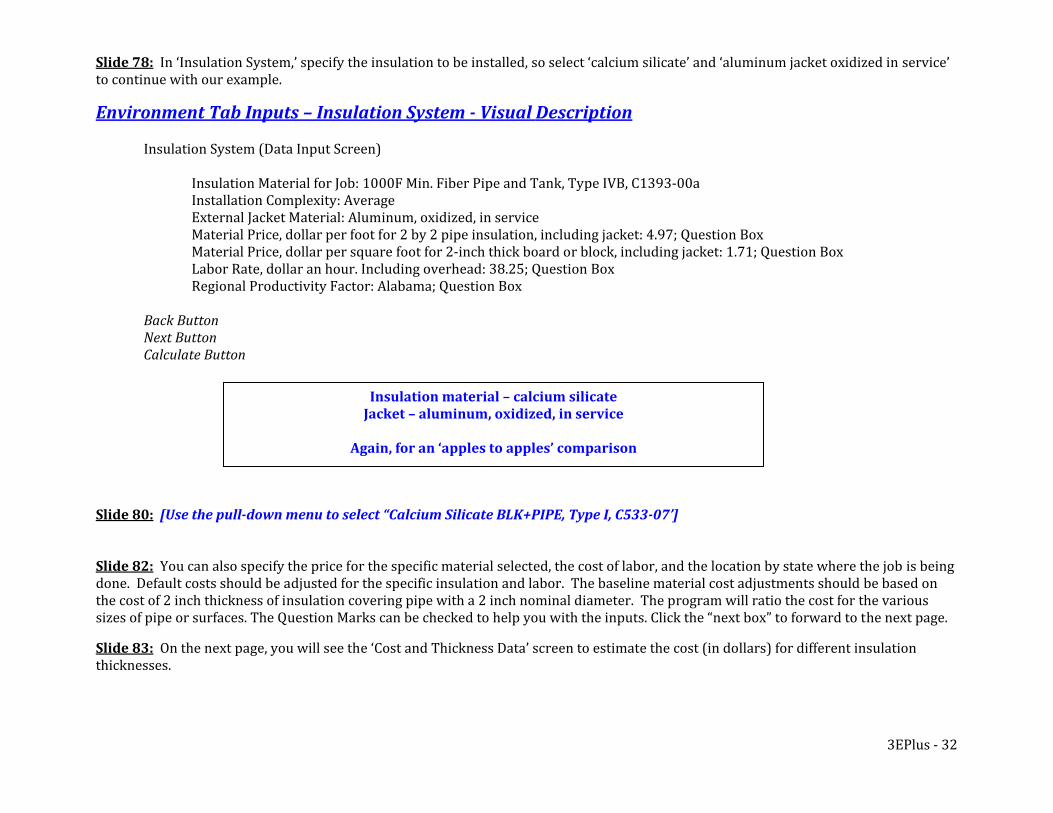
Slide 78: In ‘Insulation System,’ specify the insulation to be installed, so select ‘calcium silicate’ and ‘aluminum jacket oxidized in service’ to continue with our example.
Envir nment Tab Inputs – Insulation System Visual o
Description
Insulation System (Data Input Screen)
Insulation Material for Job: 1000F Min. Fiber Pipe and Tank, Type IVB, C1393‐00a Installation Complexity: Average External Jacket Material: Aluminum, oxidized, in service Material Price, dollar per foot for 2 by 2 pipe insulation, including jacket: 4.97; Question Box Material Price, dollar per square foot for 2‐inch thick board or block, including jacket: 1.71; Question Box Labor Rate, dollar an hour. Including overhead: 38.25; Question Box Regional Productivity Factor: Alabama; Question Box
Back Button Next Button Calculate Button
Insulation material – calcium silicate
Jacket – aluminum, oxidized, in service
Again, for an ‘apples to apples’ comparison
Slide 80: [Use the pulldown menu to select “Calcium Silicate BLK+PIPE, Type I, C53307’] Slide 82: You can also specify the price for the specific material selected, the cost of labor, and the location by state where the job is being done. Default costs should be adjusted for the specific insulation and labor. The baseline material cost adjustments should be based on the cost of 2 inch thickness of insulation covering pipe with a 2 inch nominal diameter. The program will ratio the cost for the various sizes of pipe or surfaces. The Question Marks can be checked to help you with the inputs. Click the “next box” to forward to the next page.
3EPlus ‐ 32
Slide 83: On the next page, you will see the ‘Cost and Thickness Data’ screen to estimate the cost (in dollars) for different insulation thicknesses.
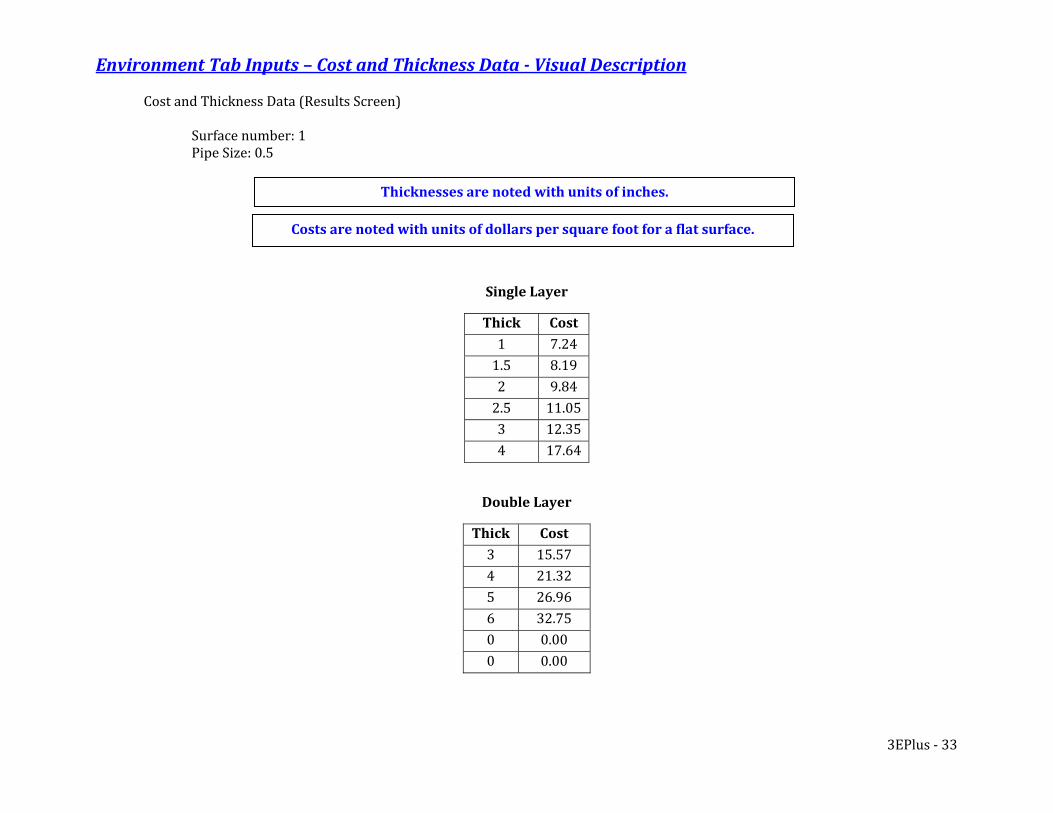
Envir nment Tab Inputs – Cost and Thickness Data Visual o
Description
Cost and Thickness Data (Results Screen)
Surface number: 1 Pipe Size: 0.5
Thicknesses are noted with units of inches.
Costs are noted with units of dollars per square foot for a flat surface.
Single Layer
Thick Cost 1 .2471.5 8.192 .8492.5 11.053 12.354 17.64
Double Layer
Thick Cost 3 15.574 21.325 26.966 32.750 000.0 000.
3EPlus ‐ 33
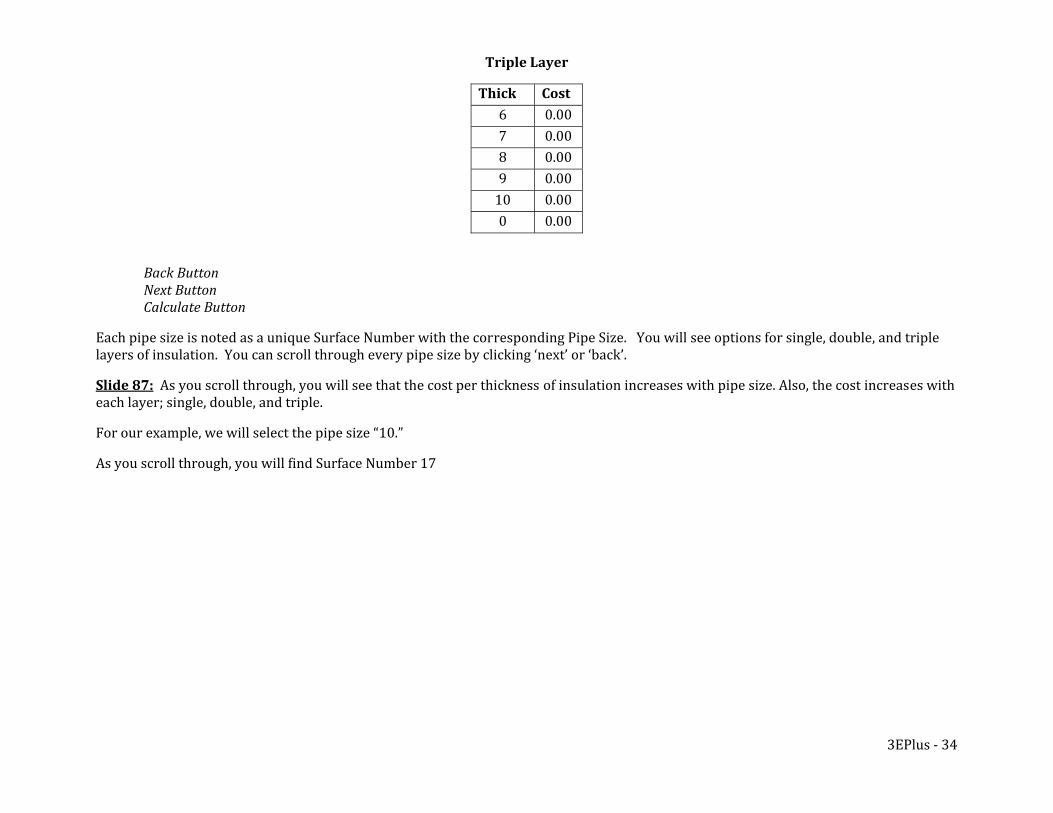
Triple Layer
Thick Cost 6 000.7 0.008 000.9 000.10 0.000 000.
Back Button Next Button Calculate Button
Each pipe size is noted as a unique Surface Number with the corresponding Pipe Size. You will see options for single, double, and triple layers of insulation. You can scroll through every pipe size by clicking ‘next’ or ‘back’.
Slide 87: As you scroll through, you will see that the cost per thickness of insulation increases with pipe size. Also, the cost increases with each layer; single, double, and triple.
For our example, we will select the pipe size “10.”
As you scroll through, you will find Surface Number 17
3EPlus ‐ 34
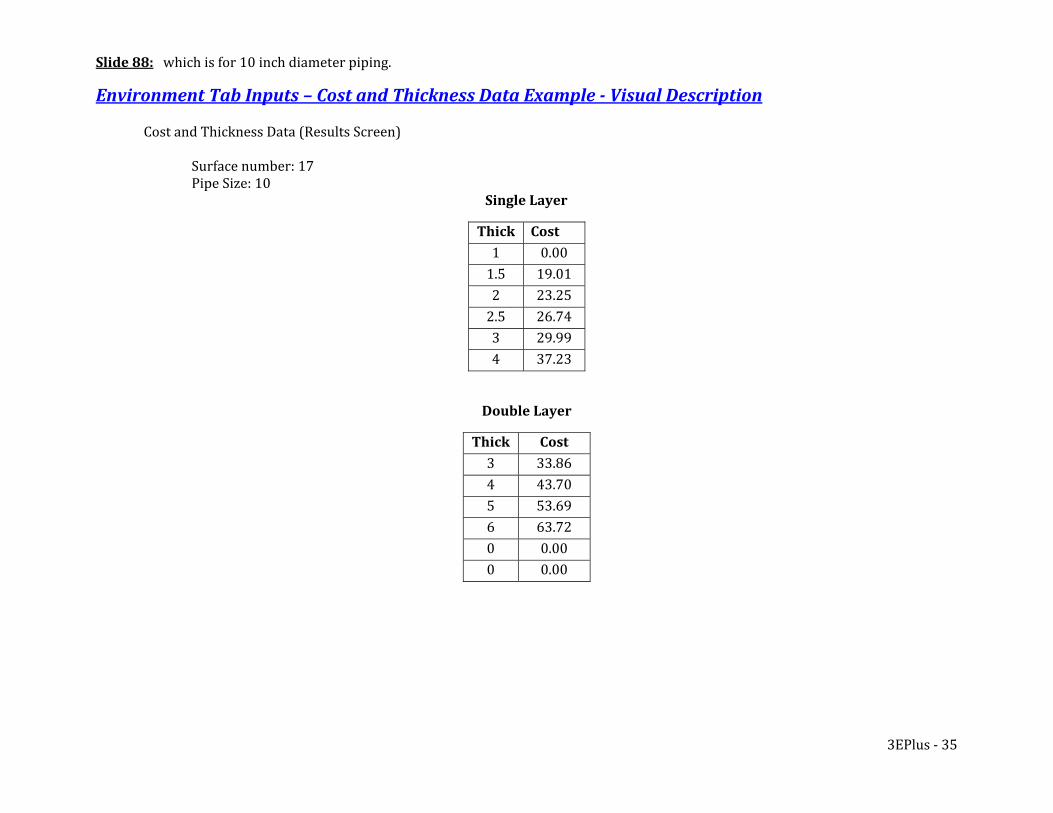
Slide 88: which is for 10 inch diameter piping.
Envir nment Tab Inputs – Cost and Thickness Data Example Visual o
Description
Cost and Thickness Data (Results Screen)
Surface number: 17 Pipe Size: 10
Single Layer
Thick Cost 1 000.1.5 19.012 23.252.5 26.743 29.994 37.23
Double Layer
Thick Cost 3 33.864 43.705 53.696 63.720 000.0 000.
3EPlus ‐ 35
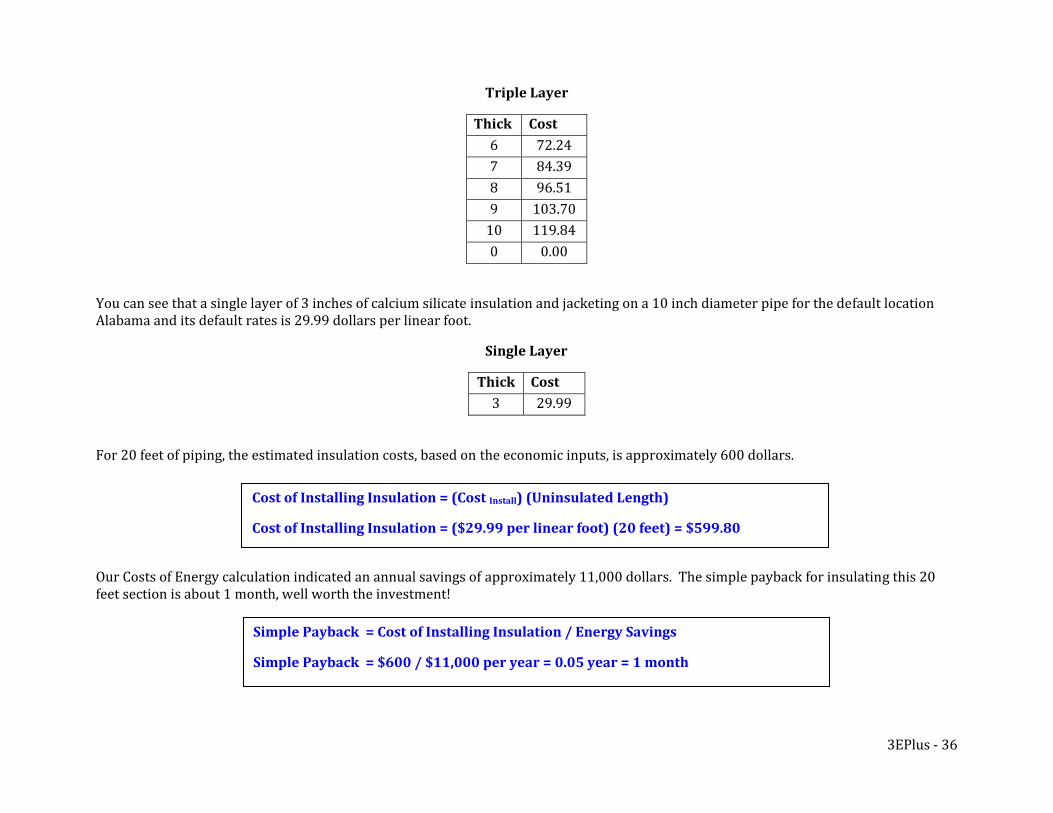
Triple Layer
Thick Cost 6 72.247 84.398 96.519 70103.10 119.840 00.0
You can see that a single layer of 3 inches of calcium silicate insulation and jacketing on a 10 inch diameter pipe for the default location Alabama and its default rates is 29.99 dollars per linear foot.
Single Layer
Thick Cost 3 29.99
For 20 feet of piping, the estimated insulation costs, based on the economic inputs, is approximately 600 dollars.
Our Costs of Energy calculation indicated an annual savings of approximately 11,000 dollars. The simple payback for insulating this 20 feet section is about 1 month, well worth the investment!
Cost of Installing Insulation = (Cost Install) (Uninsulated Length)
Cost of Installing Insulation = ($29.99 per linear foot) (20 feet) = $599.80
Simple Payback = Cost of Installing Insulation / Energy Savings
Simple Payback = $600 / $11,000 per year = 0.05 year = 1 month
3EPlus ‐ 36
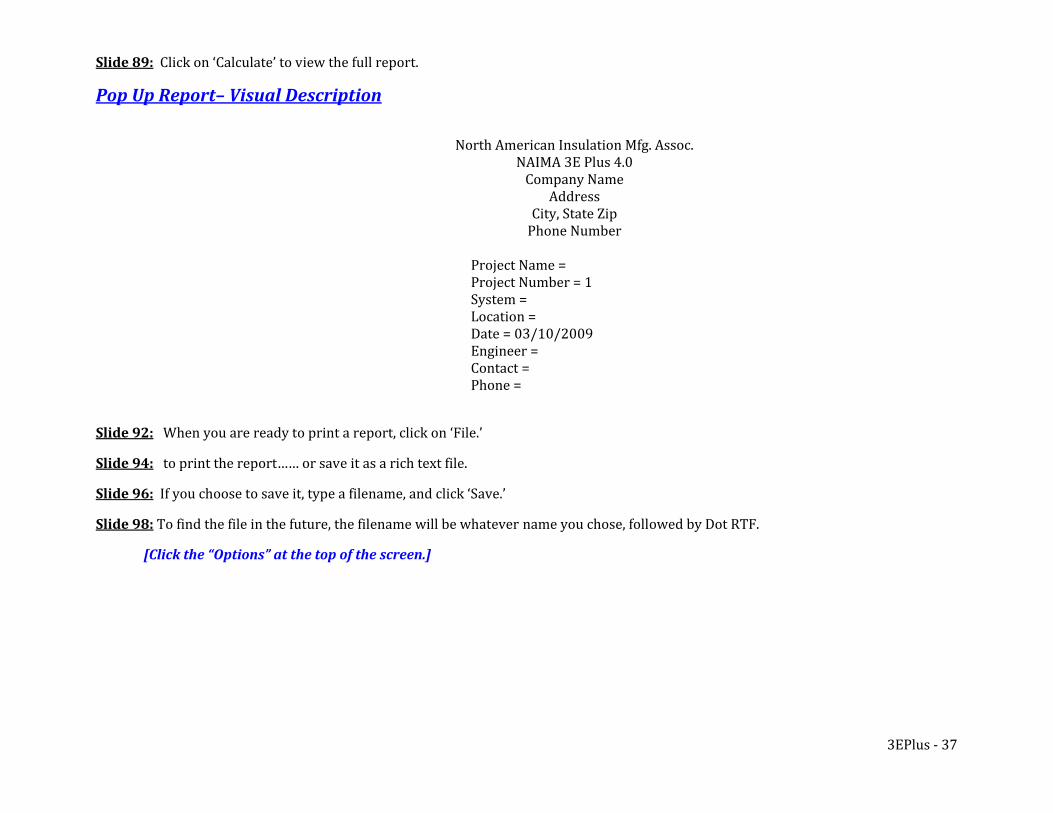
Slide 89: Click on ‘Calculate’ to view the full report.
Pop Up Report– Visual Description
North American Insulation Mfg. Assoc. NAIMA 3E Plus 4.0 Company Name
Address City, State Zip Phone Number
Project Name = Project Number = 1 System = Location = Date = 03/10/2009 Engineer = Contact = Phone =
Slide 92: When you are ready to print a report, click on ‘File.’
Slide 94: to print the report…… or save it as a rich text file.
Slide 96:
Slide 98:
If you choose to save it, type a filename, and click ‘Save.’
To find the file in the future, the filename will be whatever name you chose, followed by Dot RTF.
[Click the “Options” at the top of the screen.]
3EPlus ‐ 37
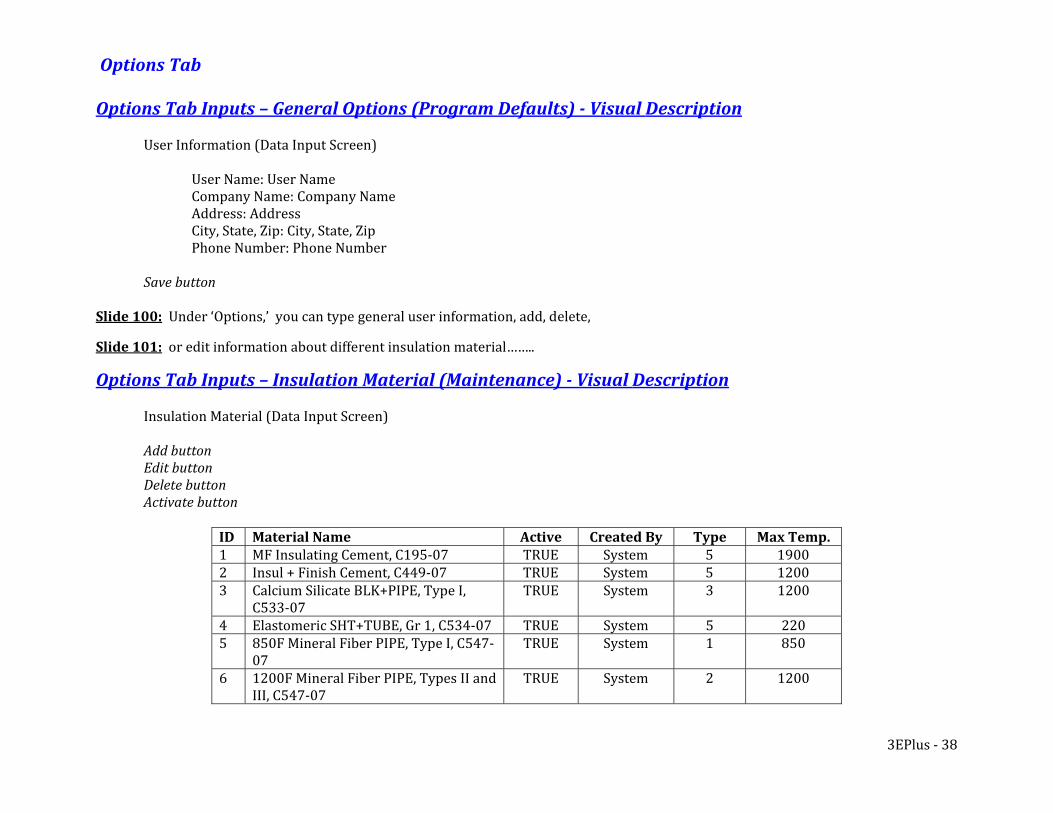
Options Tab Options Tab Inputs – General Options (Program Defaults) Visual Description
User Information (Data Input Screen)
User Name: User Name Company Name: Company Name Address: Address City, State, Zip: City, State, Zip Phone Number: Phone Number
Save button
Slide 100: Under ‘Options,’ you can type general user information, add, delete,
Slide 101: or edit information about different insulation material……..
Optio s Tab Inputs – Insulation Material (Maintenance) Visual n
Description
Insulation Material (Data Input Screen)
Add button Edit button Delete button Activate button
ID Material Name Active Cr y eated B Type Ma p. x Tem1 MF Insulating Cement, C195‐07 TRUE System 5 1900 2 Insul + Finish Cement, C449‐07 TRUE System 5 1200 3 Calcium Silicate BLK+PIPE, Type I,
C533‐07 TRUE System 3 1200
4 Elastomeric SHT+TUBE, Gr 1, C534‐07 TRUE System 5 220 5 850F Mineral Fiber PIPE, Type I, C547‐
07 TRUE System 1 850
6 1200F Mineral Fiber PIPE, Types II and III, C547‐07
TRUE System 2 1200
3EPlus ‐ 38
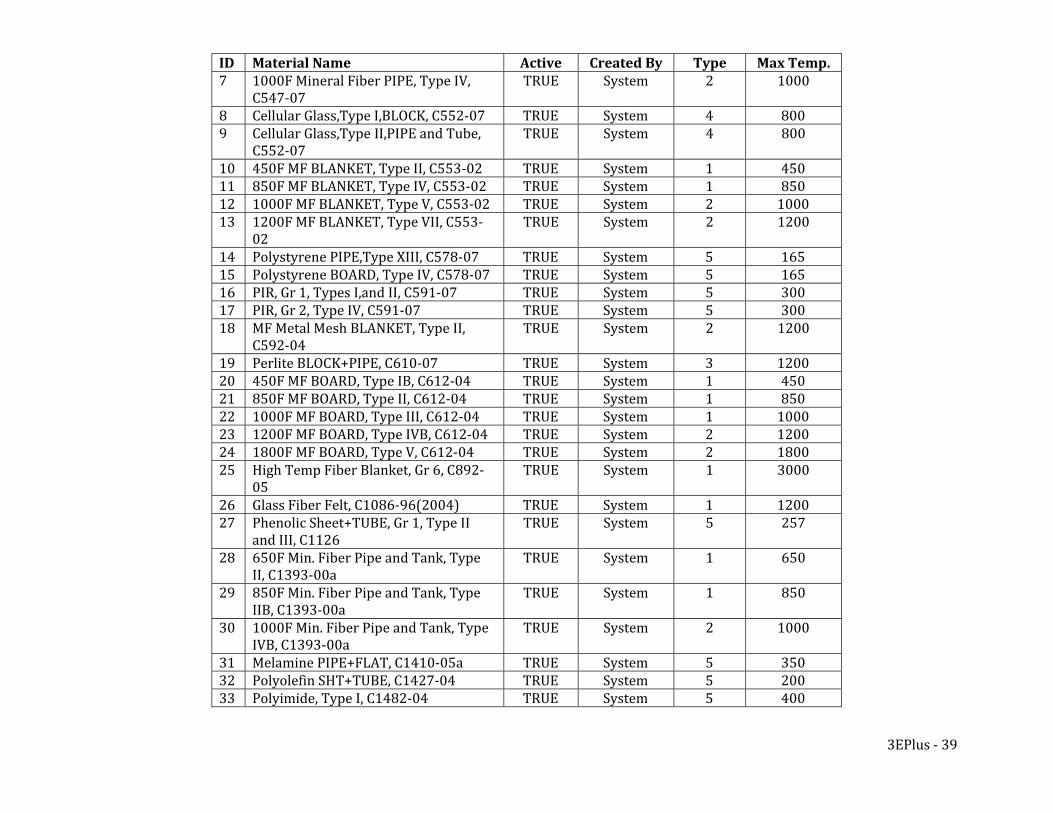
ID Cr y Ma p. Material Name Active eated B Type x Tem7 1000F Mineral Fiber PIPE, Type IV,
C547‐07 TRUE System 2 1000
8 Cellular Glass,Type I,BLOCK, C552‐07 TRUE System 4 800 9 Cellular Glass,Type II,PIPE and Tube,
C552‐07 TRUE System 4 800
10 450F MF BLANKET, Type II, C553‐02 TRUE System 1 450 11 850F MF BLANKET, Type IV, C553‐02 TRUE System 1 850 12 1000F MF BLANKET, Type V, C553‐02 TRUE System 2 1000 13 1200F MF BLANKET, Type VII, C553‐
02 TRUE System 2 1200
14 Polystyrene PIPE,Type XIII, C578‐07 TRUE System 5 165 15 Polystyrene BOARD, Type IV, C578‐07 TRUE System 5 165 16 PIR, Gr 1, Types I,and II, C591‐07 TRUE System 5 300 17 PIR, Gr 2, Type IV, C591‐07 TRUE System 5 300 18 MF Metal Mesh BLANKET, Type II,
C592‐04 TRUE System 2 1200
19 Perlite BLOCK+PIPE, C610‐07 TRUE System 3 1200 20 450F MF BOARD, Type IB, C612‐04 TRUE System 1 450 21 850F MF BOARD, Type II, C612‐04 TRUE System 1 850 22 1000F MF BOARD, Type III, C612‐04 TRUE System 1 1000 23 1200F MF BOARD, Type IVB, C612‐04 TRUE System 2 1200 24 1800F MF BOARD, Type V, C612‐04 TRUE System 2 1800 25 High Temp Fiber Blanket, Gr 6, C892‐
05 TRUE System 1 3000
26 Glass Fiber Felt, C1086‐96(2004) TRUE System 1 1200 27 Phenolic Sheet+TUBE, Gr 1, Type II
and III, C1126 TRUE System 5 257
28 650F Min. Fiber Pipe and Tank, Type II, C1393‐00a
TRUE System 1 650
29 850F Min. Fiber Pipe and Tank, Type IIB, C1393‐00a
TRUE System 1 850
30 1000F Min. Fiber Pipe and Tank, Type IVB, C1393‐00a
TRUE System 2 1000
31 Melamine PIPE+FLAT, C1410‐05a TRUE System 5 350 32 Polyolefin SHT+TUBE, C1427‐04 TRUE System 5 200 33 Polyimide, Type I, C1482‐04 TRUE System 5 400
3EPlus ‐ 39
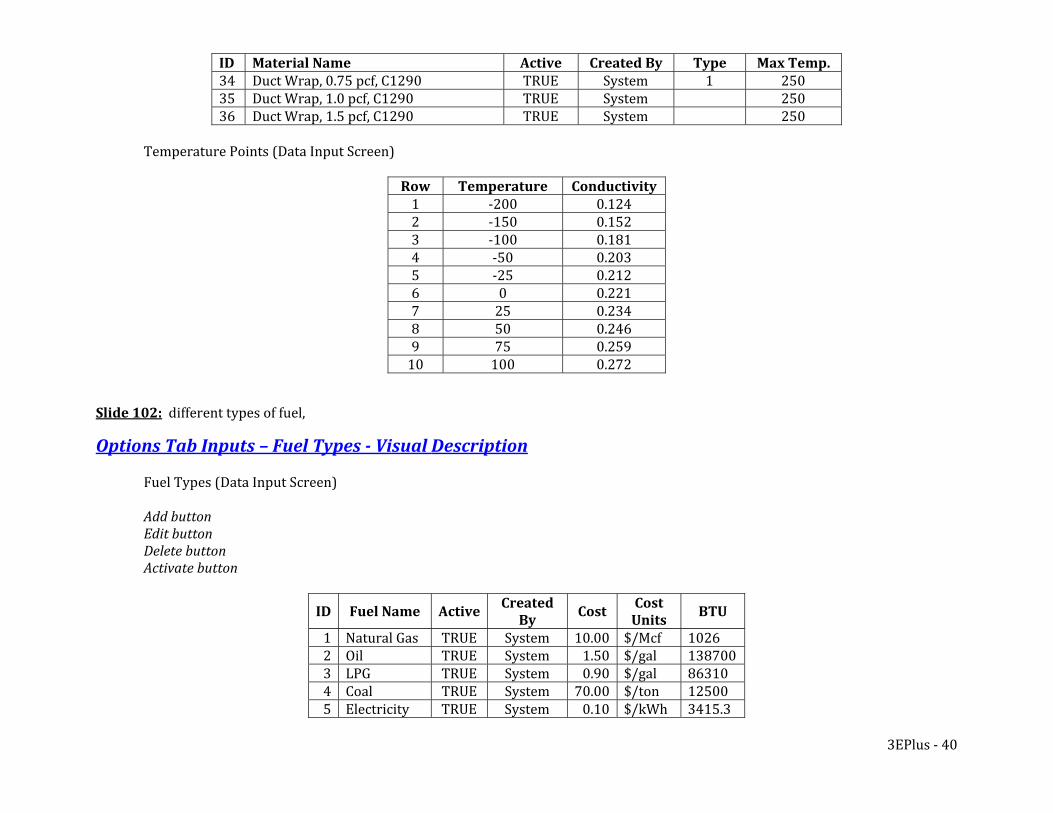
ID Material Name Active Cr y Ma mp. eated B Type x Te34 Duct Wrap, 0.75 pcf, C1290 TRUE System 1 250 35 Duct Wrap, 1.0 pcf, C1290 TRUE System 250 36 Duct Wrap, 1.5 pcf, C1290 TRUE System 250
Temperature Points (Data Input Screen)
Row Temperature Conductivity 1 ‐200 0.124 2 ‐150 0.152 3 ‐100 0.181 4 ‐50 0.203 5 ‐25 0.212 6 0 0.221 7 25 0.234 8 50 0.246 9 75 0.259 10 100 0.272
Slide 102: different types of fuel,
Optio s Tab Inputs – Fuel Types Visual n
Description
Fuel Types (Data Input Screen)
Add button Edit button Delete button Activate button
ID Fuel Name Active Created By
Cost Cost
UnitsBTU
1 Natural Gas TRUE System 10.00 $/Mcf 1026 2 Oil TRUE System 1.50 $/gal 1387003 LPG TRUE System 0.90 $/gal 86310 4 Coal TRUE System 70.00 $/ton 12500 5 Electricity TRUE System 0.10 $/kWh 3415.3
3EPlus ‐ 40
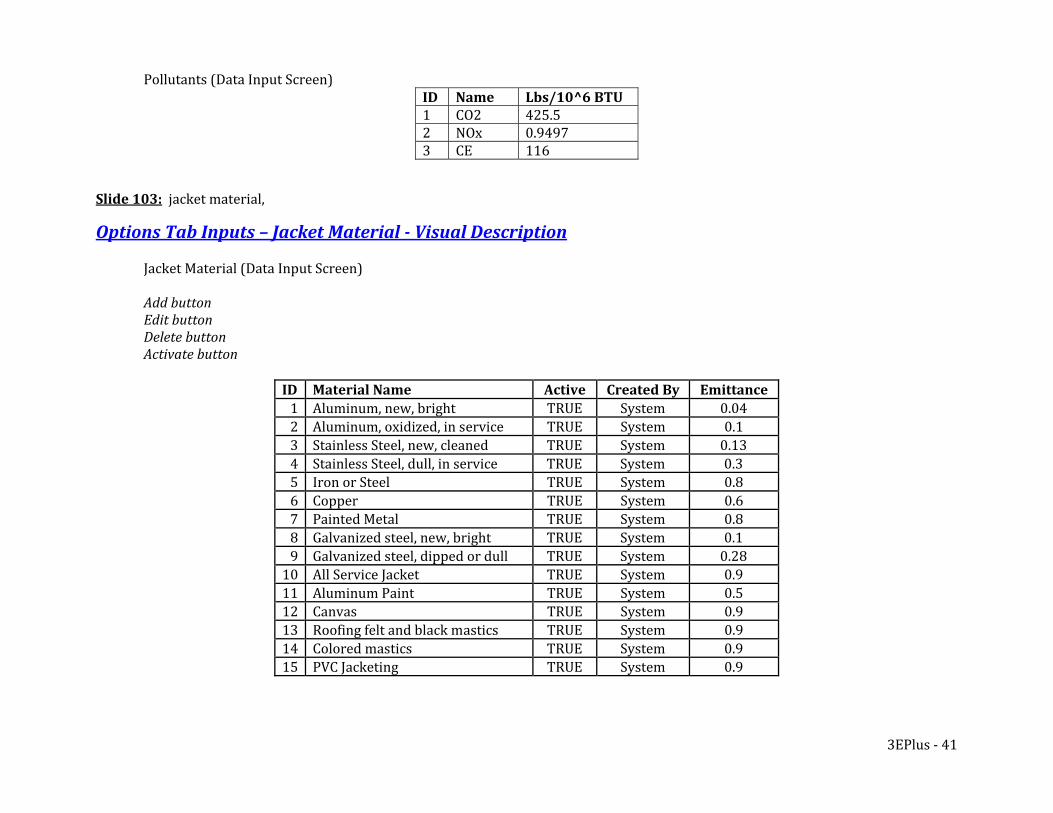
Pollutants (Data Input Screen)
ID Name Lbs/10^6 BTU 1 CO2 425.5 2 NOx 0.9497 3 CE 116
Slide 103: jacket material,
Optio s Tab Inputs – Jacket Material Visual n
Description
Jacket Material (Data Input Screen)
Add button Edit button Delete button Activate button
ID Material Name Active Cr y eated B Emittance 1 Aluminum, new, bright TRUE System 0.04 2 Aluminum, oxidized, in service TRUE System 0.1 3 Stainless Steel, new, cleaned TRUE System 0.13 4 Stainless Steel, dull, in service TRUE System 0.3 5 Iron or Steel TRUE System 0.8 6 Copper TRUE System 0.6 7 Painted Metal TRUE System 0.8 8 Galvanized steel, new, bright TRUE System 0.1 9 Galvanized steel, dipped or dull TRUE System 0.28 10 All Service Jacket TRUE System 0.9 11 Aluminum Paint TRUE System 0.5 12 Canvas TRUE System 0.9 13 Roofing felt and black mastics TRUE System 0.9 14 Colored mastics TRUE System 0.9 15 PVC Jacketing TRUE System 0.9
3EPlus ‐ 41
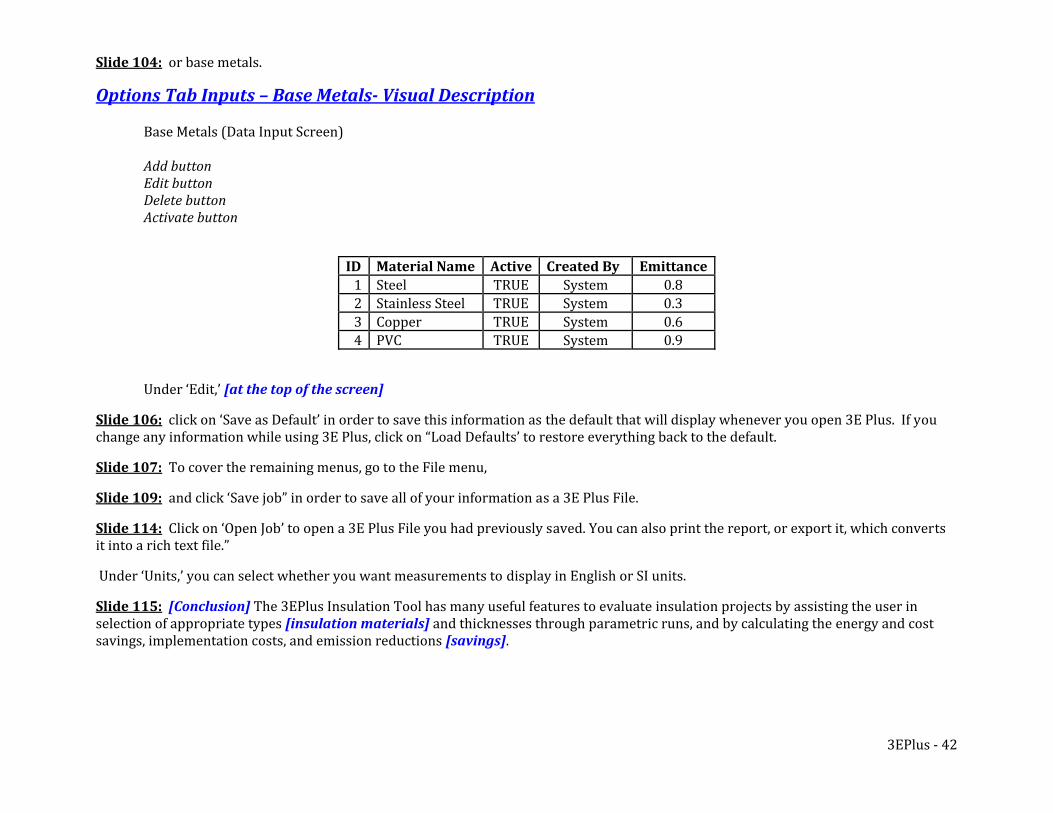
Slide 104: or base metals.
Optio s Tab Inputs – Base Metals Visual n
Description
Base Metals (Data Input Screen)
Add button Edit button Delete button
Activate button
ID Material Name Active Cr y eated B Emittance 1 Steel TRUE System 0.8 2 Stainless Steel TRUE System 0.3 3 Copper TRUE System 0.6 4 PVC TRUE System 0.9
Under ‘Edit,’ [at the top of the screen]
Slide 106: click on ‘Save as Default’ in order to save this information as the default that will display whenever you open 3E Plus. If you change any information while using 3E Plus, click on “Load Defaults’ to restore everything back to the default.
Slide 107: To cover the remaining menus, go to the File menu,
Slide 109: and click ‘Save job” in order to save all of your information as a 3E Plus File.
Slide 114: Click on ‘Open Job’ to open a 3E Plus File you had previously saved. You can also print the report, or export it, which converts it into a rich text file.”
Under ‘Units,’ you can select whether you want measurements to display in English or SI units.
Slide 115: [Conclusion] The 3EPlus Insulation Tool has many useful features to evaluate insulation projects by assisting the user in selection of appropriate types [insulation materials] and thicknesses through parametric runs, and by calculating the energy and cost savings, implementation costs, and emission reductions [savings].
3EPlus ‐ 42

Slide 116: [energy and cost savings]
You can also return to the Steam System Scoping Tool (SSST) to revise your scorecard results for insulation to determine a projected new score pre‐implementation or for a final score post‐installation of the projects.
We now know the potential projects and their energy and economic impacts from using 3EPlus.
We can use this information for stand‐alone projects as well as incorporate the data into the [Next Steps]Steam System Assessment Tool (SSAT) for modeling the current configuration, in order to better determine system‐wide benefits [system interactions] from implementing these insulation improvement projects[resulting in a Final Projects List with estimates of energy and cost savings].
3EPlus ‐ 43
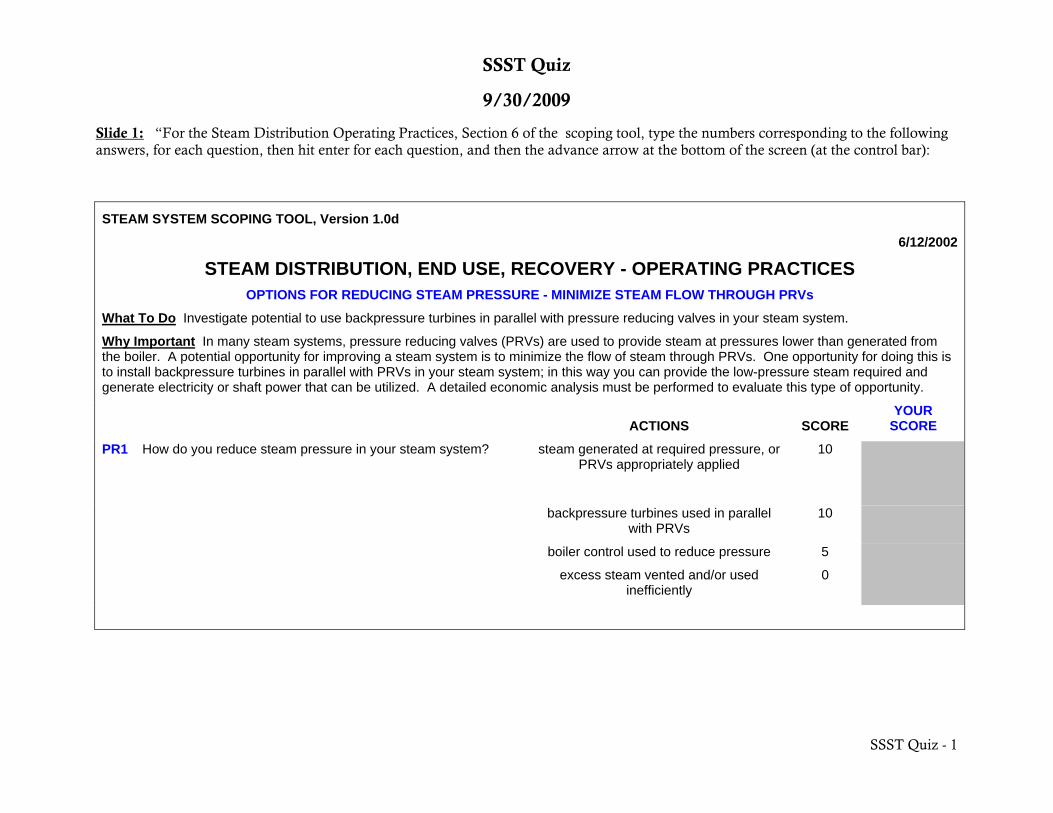
SSST Quiz
9/30/2009
Slide 1: “For the Steam Distribution Operating Practices, Section 6 of the scoping tool, type the numbers corresponding to the following answers, for each question, then hit enter for each question, and then the advance arrow at the bottom of the screen (at the control bar):
STEAM SYSTEM SCOPING TOOL, Version 1.0d
6/12/2002
STEAM DISTRIBUTION, END USE, RECOVERY - OPERATING PRACTICES OPTIONS FOR REDUCING STEAM PRESSURE - MINIMIZE STEAM FLOW THROUGH PRVs
What To Do Investigate potential to use backpressure turbines in parallel with pressure reducing valves in your steam system.
Why Important In many steam systems, pressure reducing valves (PRVs) are used to provide steam at pressures lower than generated from the boiler. A potential opportunity for improving a steam system is to minimize the flow of steam through PRVs. One opportunity for doing this is to install backpressure turbines in parallel with PRVs in your steam system; in this way you can provide the low-pressure steam required and generate electricity or shaft power that can be utilized. A detailed economic analysis must be performed to evaluate this type of opportunity.
ACTIONS SCORE YOUR
SCORE
PR1 steam generated at required pressure, or PRVs appropriately applied
10
backpressure turbines used in parallel
with PRVs 10
boiler control used to reduce pressure 5
How do you reduce steam pressure in your steam system?
excess steam vented and/or used inefficiently
0
SSST Quiz - 1
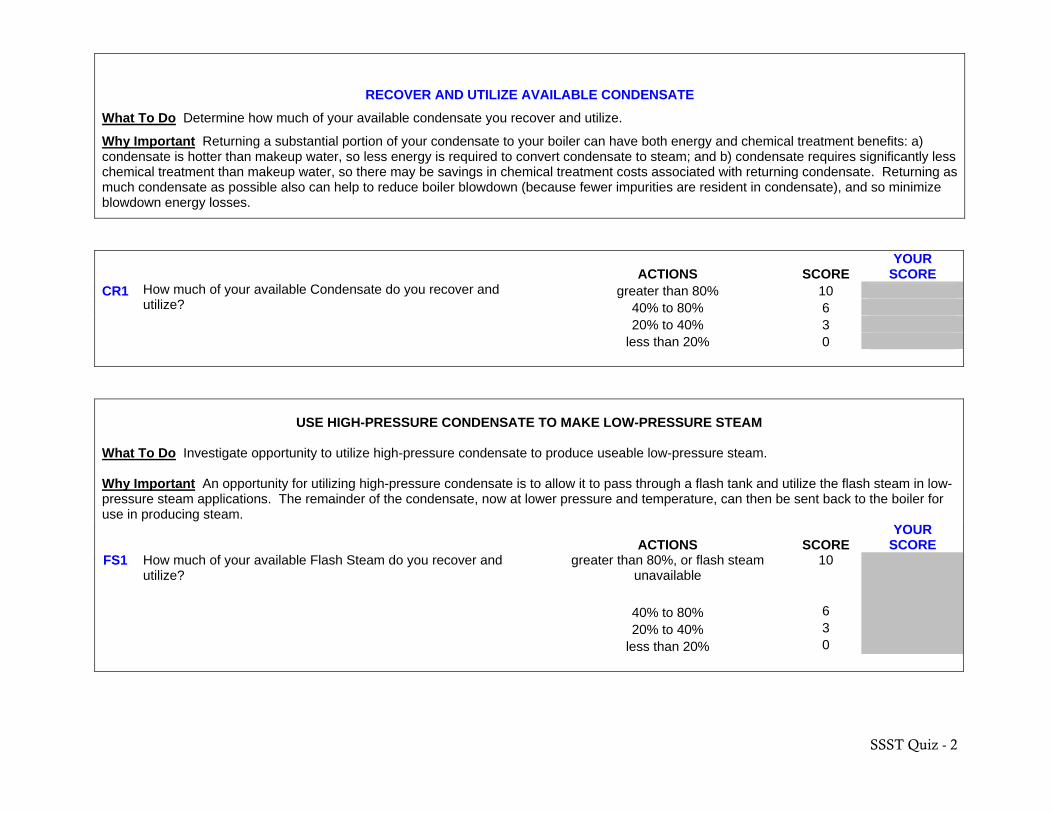
RECOVER AND UTILIZE AVAILABLE CONDENSATE
What To Do Determine how much of your available condensate you recover and utilize.
Why Important Returning a substantial portion of your condensate to your boiler can have both energy and chemical treatment benefits: a) condensate is hotter than makeup water, so less energy is required to convert condensate to steam; and b) condensate requires significantly less chemical treatment than makeup water, so there may be savings in chemical treatment costs associated with returning condensate. Returning as much condensate as possible also can help to reduce boiler blowdown (because fewer impurities are resident in condensate), and so minimize blowdown energy losses.
ACTIONS SCORE YOUR
SCORE CR1 greater than 80% 10 40% to 80% 6 20% to 40% 3
How much of your available Condensate do you recover and utilize?
less than 20% 0
USE HIGH-PRESSURE CONDENSATE TO MAKE LOW-PRESSURE STEAM
What To Do Investigate opportunity to utilize high-pressure condensate to produce useable low-pressure steam. Why Important An opportunity for utilizing high-pressure condensate is to allow it to pass through a flash tank and utilize the flash steam in low-pressure steam applications. The remainder of the condensate, now at lower pressure and temperature, can then be sent back to the boiler for use in producing steam.
ACTIONS SCORE YOUR
SCORE FS1 greater than 80%, or flash steam
unavailable 10
40% to 80% 6 20% to 40% 3
How much of your available Flash Steam do you recover and utilize?
less than 20% 0
SSST Quiz - 2
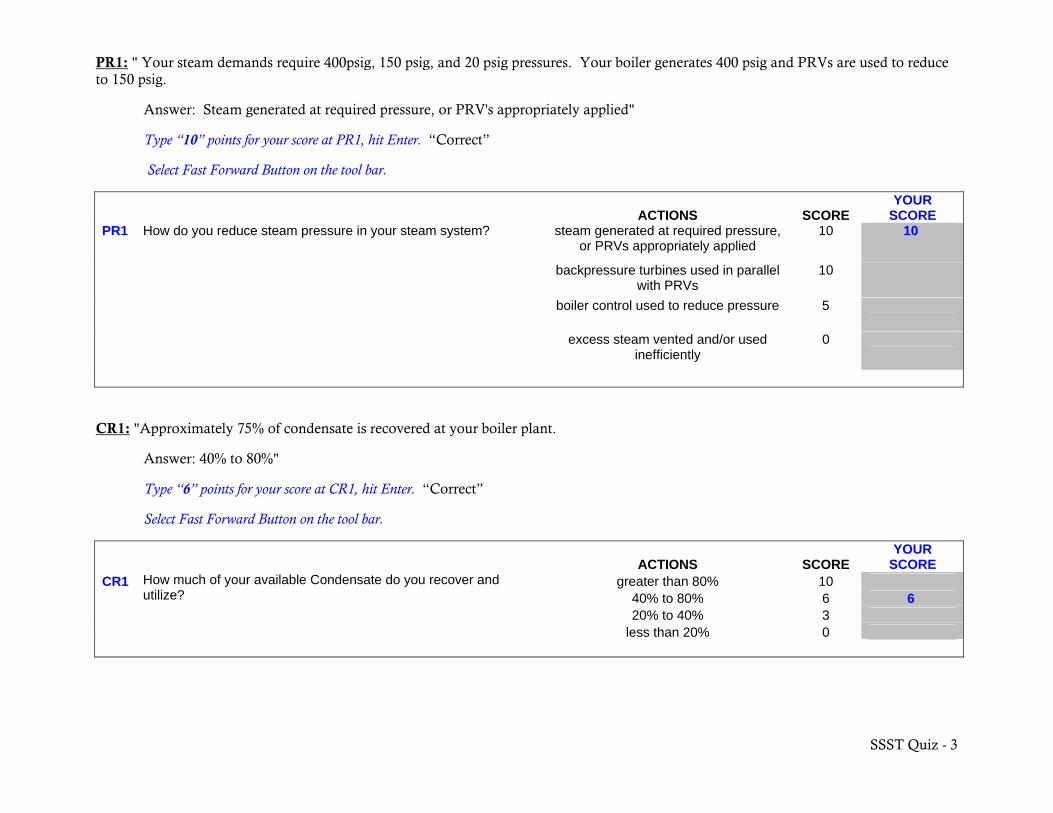
PR1: " Your steam demands require 400psig, 150 psig, and 20 psig pressures. Your boiler generates 400 psig and PRVs are used to reduce to 150 psig.
Answer: Steam generated at required pressure, or PRV's appropriately applied"
Type “10” points for your score at PR1, hit Enter. “Correct”
Select Fast Forward Button on the tool bar.
ACTIONS SCORE YOUR
SCORE PR1 steam generated at required pressure,
or PRVs appropriately applied 10 10
backpressure turbines used in parallel
with PRVs 10
boiler control used to reduce pressure 5
How do you reduce steam pressure in your steam system?
excess steam vented and/or used inefficiently
0
CR1: "Approximately 75% of condensate is recovered at your boiler plant.
Answer: 40% to 80%"
Type “6” points for your score at CR1, hit Enter. “Correct”
Select Fast Forward Button on the tool bar.
ACTIONS SCORE YOUR
SCORE CR1 greater than 80% 10 40% to 80% 6 6 20% to 40% 3
How much of your available Condensate do you recover and utilize?
less than 20% 0
SSST Quiz - 3
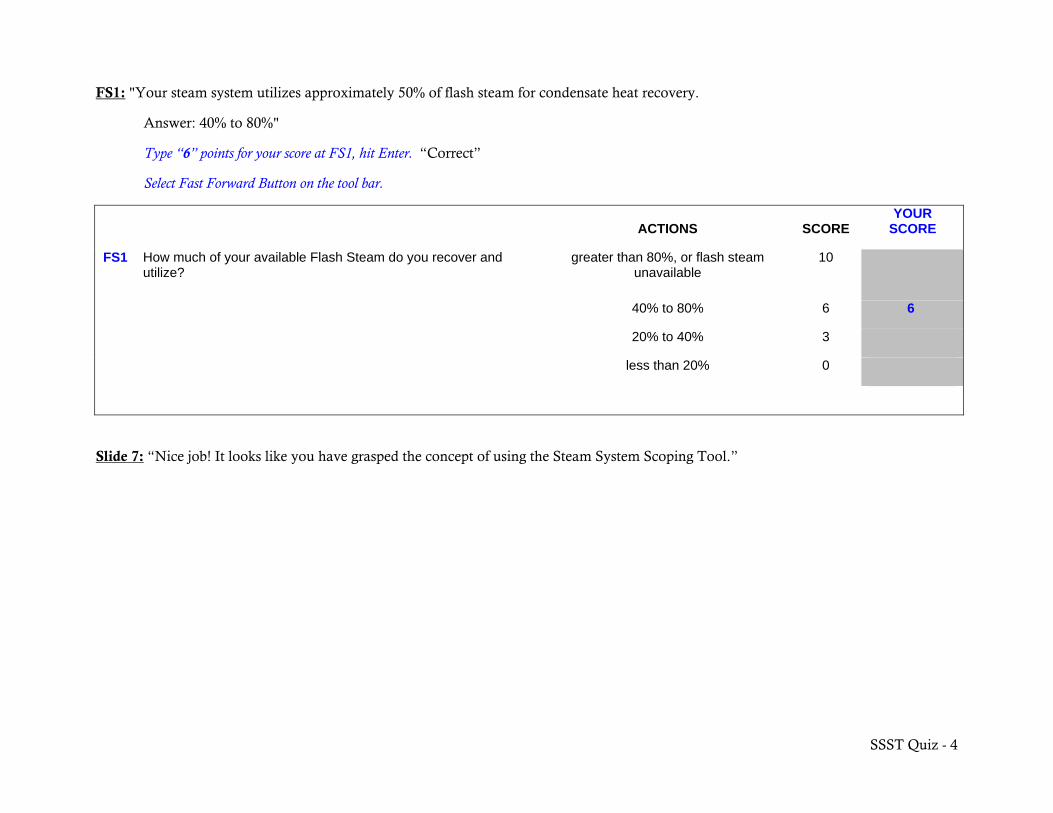
SSST Quiz - 4
FS1: "Your steam system utilizes approximately 50% of flash steam for condensate heat recovery.
Answer: 40% to 80%"
Type “6” points for your score at FS1, hit Enter. “Correct”
Select Fast Forward Button on the tool bar.
ACTIONS SCORE YOUR
SCORE
FS1 greater than 80%, or flash steam unavailable
10
40% to 80% 6 6
20% to 40% 3
How much of your available Flash Steam do you recover and utilize?
less than 20% 0
Slide 7: “Nice job! It looks like you have grasped the concept of using the Steam System Scoping Tool.”
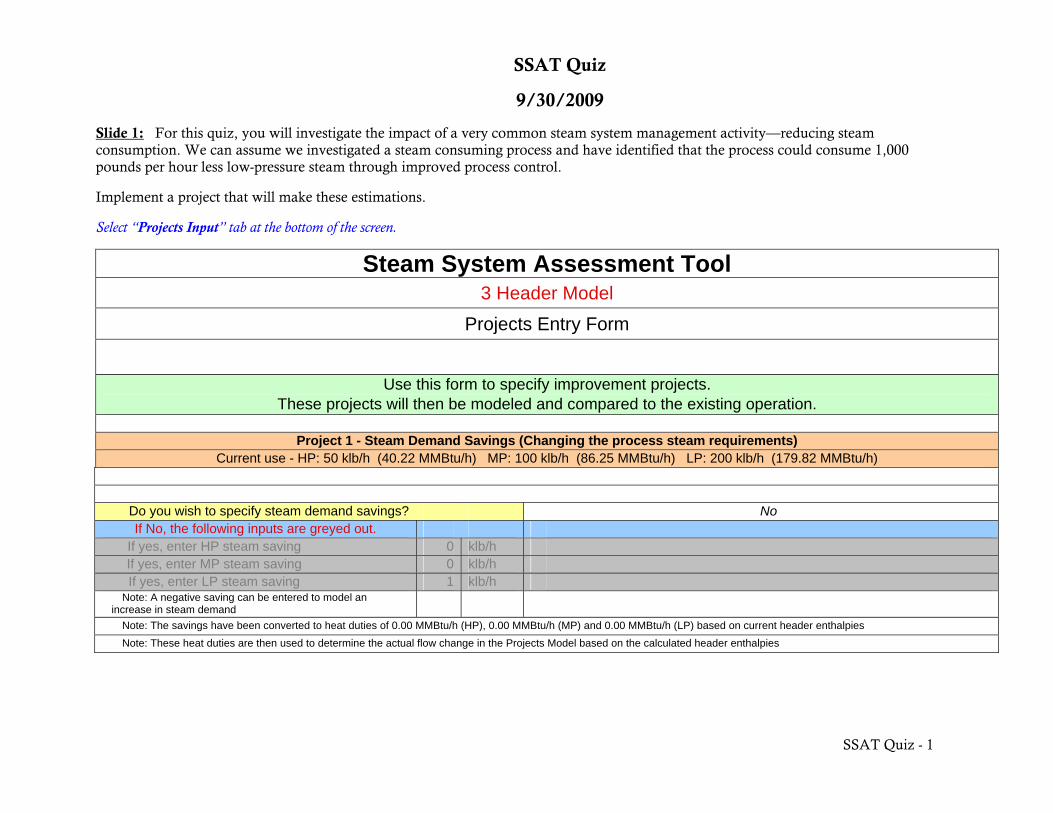
SSAT Quiz
9/30/2009
Slide 1: For this quiz, you will investigate the impact of a very common steam system management activity—reducing steam consumption. We can assume we investigated a steam consuming process and have identified that the process could consume 1,000 pounds per hour less low-pressure steam through improved process control.
Implement a project that will make these estimations.
Select “Projects Input” tab at the bottom of the screen.
Steam System Assessment Tool 3 Header Model
Projects Entry Form
Use this form to specify improvement projects. These projects will then be modeled and compared to the existing operation.
Project 1 - Steam Demand Savings (Changing the process steam requirements)
Current use - HP: 50 klb/h (40.22 MMBtu/h) MP: 100 klb/h (86.25 MMBtu/h) LP: 200 klb/h (179.82 MMBtu/h)
Do you wish to specify steam demand savings? No If No, the following inputs are greyed out.
If yes, enter HP steam saving 0 klb/h If yes, enter MP steam saving 0 klb/h If yes, enter LP steam saving 1 klb/h
Note: A negative saving can be entered to model an increase in steam demand
Note: The savings have been converted to heat duties of 0.00 MMBtu/h (HP), 0.00 MMBtu/h (MP) and 0.00 MMBtu/h (LP) based on current header enthalpies Note: These heat duties are then used to determine the actual flow change in the Projects Model based on the calculated header enthalpies
SSAT Quiz - 1
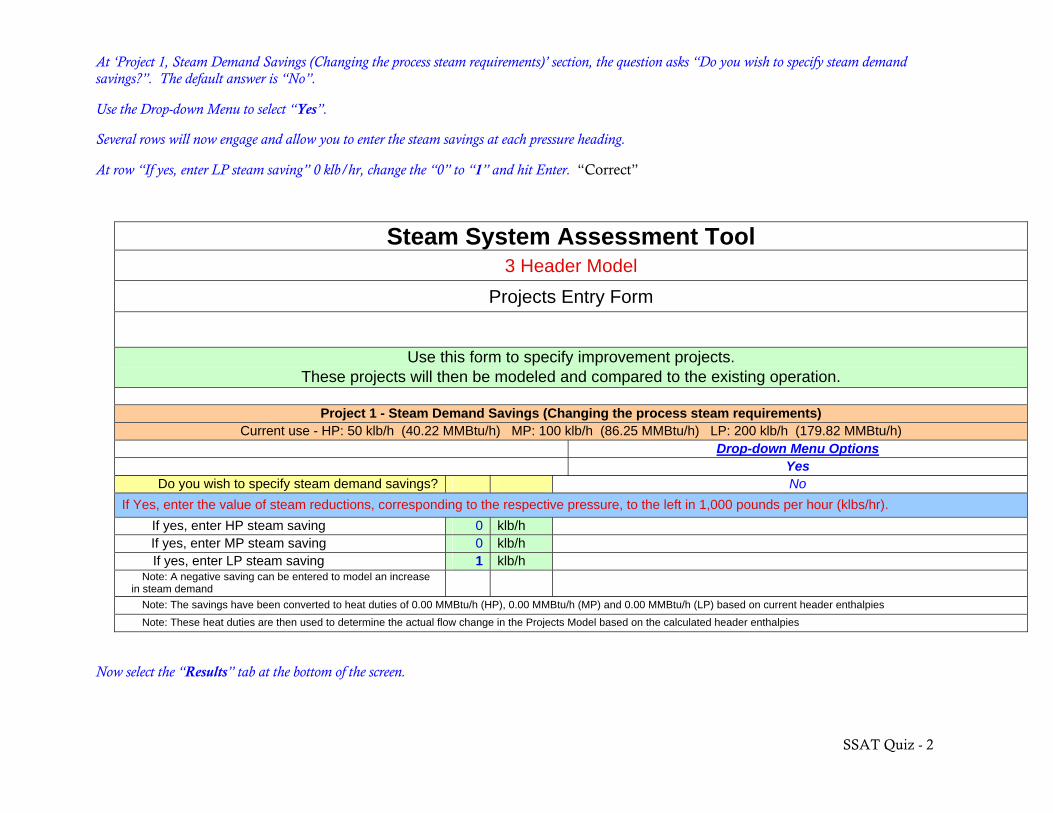
At ‘Project 1, Steam Demand Savings (Changing the process steam requirements)’ section, the question asks “Do you wish to specify steam demand savings?”. The default answer is “No”.
Use the Drop-down Menu to select “Yes”.
Several rows will now engage and allow you to enter the steam savings at each pressure heading.
At row “If yes, enter LP steam saving” 0 klb/hr, change the “0” to “1” and hit Enter. “Correct”
Steam System Assessment Tool 3 Header Model
Projects Entry Form
Use this form to specify improvement projects. These projects will then be modeled and compared to the existing operation.
Project 1 - Steam Demand Savings (Changing the process steam requirements)
Current use - HP: 50 klb/h (40.22 MMBtu/h) MP: 100 klb/h (86.25 MMBtu/h) LP: 200 klb/h (179.82 MMBtu/h) Drop-down Menu Options Yes
Do you wish to specify steam demand savings? No If Yes, enter the value of steam reductions, corresponding to the respective pressure, to the left in 1,000 pounds per hour (klbs/hr).
If yes, enter HP steam saving 0 klb/h If yes, enter MP steam saving 0 klb/h If yes, enter LP steam saving 1 klb/h
Note: A negative saving can be entered to model an increase in steam demand
Note: The savings have been converted to heat duties of 0.00 MMBtu/h (HP), 0.00 MMBtu/h (MP) and 0.00 MMBtu/h (LP) based on current header enthalpies Note: These heat duties are then used to determine the actual flow change in the Projects Model based on the calculated header enthalpies
Now select the “Results” tab at the bottom of the screen.
SSAT Quiz - 2
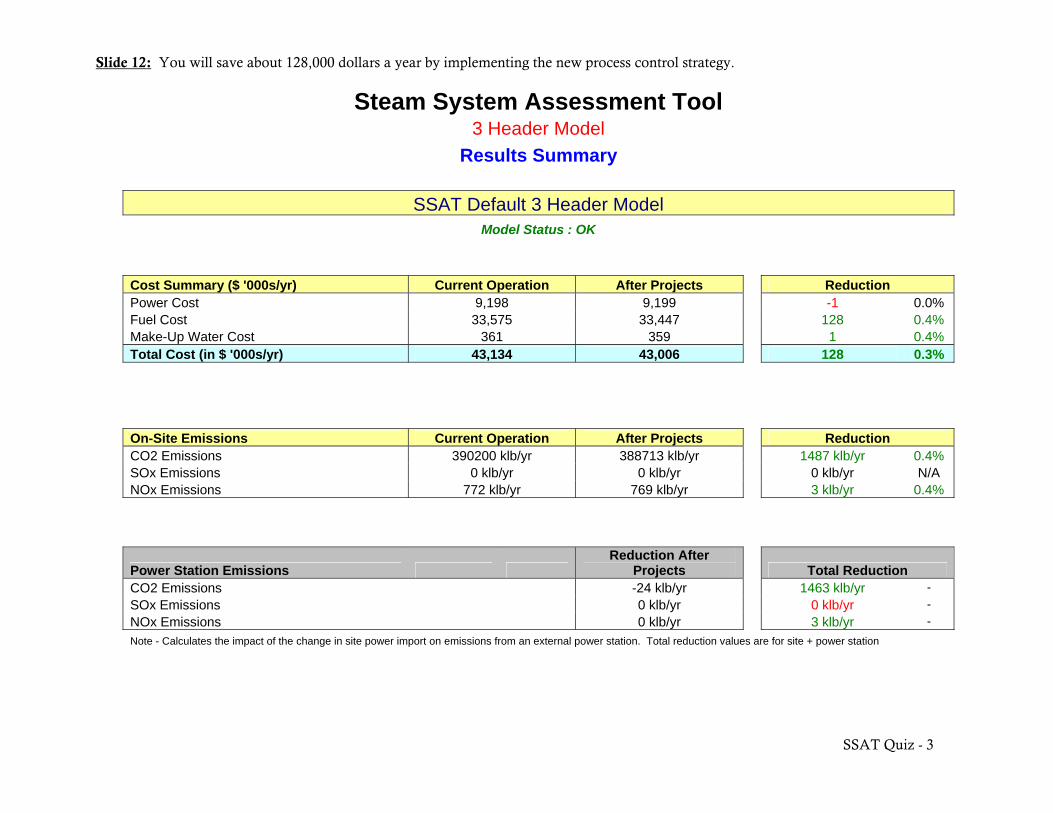
Slide 12: You will save about 128,000 dollars a year by implementing the new process control strategy.
Steam System Assessment Tool 3 Header Model Results Summary SSAT Default 3 Header Model Model Status : OK
Cost Summary ($ '000s/yr) Current Operation After Projects Reduction Power Cost 9,198 9,199 -1 0.0% Fuel Cost 33,575 33,447 128 0.4% Make-Up Water Cost 361 359 1 0.4% Total Cost (in $ '000s/yr) 43,134 43,006 128 0.3%
On-Site Emissions Current Operation After Projects Reduction CO2 Emissions 390200 klb/yr 388713 klb/yr 1487 klb/yr 0.4% SOx Emissions 0 klb/yr 0 klb/yr 0 klb/yr N/A NOx Emissions 772 klb/yr 769 klb/yr 3 klb/yr 0.4%
Power Station Emissions Reduction After
Projects Total Reduction CO2 Emissions -24 klb/yr 1463 klb/yr - SOx Emissions 0 klb/yr 0 klb/yr - NOx Emissions 0 klb/yr 3 klb/yr - Note - Calculates the impact of the change in site power import on emissions from an external power station. Total reduction values are for site + power station
SSAT Quiz - 3
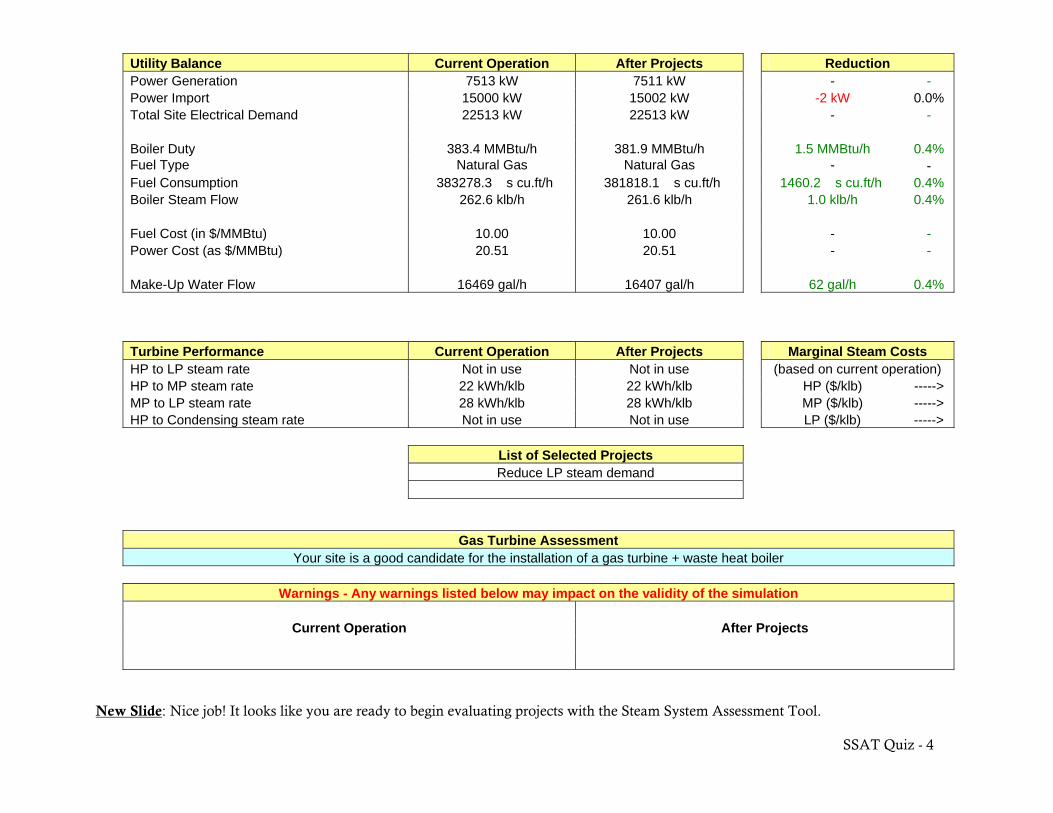
SSAT Quiz - 4
Utility Balance Current Operation After Projects Reduction Power Generation 7513 kW 7511 kW - - Power Import 15000 kW 15002 kW -2 kW 0.0% Total Site Electrical Demand 22513 kW 22513 kW - - Boiler Duty 383.4 MMBtu/h 381.9 MMBtu/h 1.5 MMBtu/h 0.4% Fuel Type Natural Gas Natural Gas - - Fuel Consumption 383278.3 s cu.ft/h 381818.1 s cu.ft/h 1460.2 s cu.ft/h 0.4% Boiler Steam Flow 262.6 klb/h 261.6 klb/h 1.0 klb/h 0.4% Fuel Cost (in $/MMBtu) 10.00 10.00 - - Power Cost (as $/MMBtu) 20.51 20.51 - - Make-Up Water Flow 16469 gal/h 16407 gal/h 62 gal/h 0.4%
Turbine Performance Current Operation After Projects Marginal Steam Costs HP to LP steam rate Not in use Not in use (based on current operation) HP to MP steam rate 22 kWh/klb 22 kWh/klb HP ($/klb) -----> MP to LP steam rate 28 kWh/klb 28 kWh/klb MP ($/klb) -----> HP to Condensing steam rate Not in use Not in use LP ($/klb) -----> List of Selected Projects Reduce LP steam demand
Gas Turbine Assessment Your site is a good candidate for the installation of a gas turbine + waste heat boiler Warnings - Any warnings listed below may impact on the validity of the simulation Current Operation After Projects
New Slide: Nice job! It looks like you are ready to begin evaluating projects with the Steam System Assessment Tool.

3EPlus QUIZ
9/30/2009
Slide 1: For this quiz, go to the Energy tab, and calculate the Insulation Thickness for Insulation with the parameter below. Hit enter after each input, to advance the screen. Use “Heat Loss per Year’ calculation type.
Parameters: 1.) a Process temperature of 450 F 2.) an Ambient temperature of 70 F 3.) a Nominal Pipe Size of 8 inches and length of 10 feet
Select “Energy” Tab at the top of the first screen. Screen will change to these parameters: Energy Tab
Insulation Thickness (Data Entry Screen)
Item Description [blank] System Application: Pipe Horizontal System Units: ASTM C585 Calculation Type: Personnel Protection
Use the Drop-down Menu to select “Heat Loss per Year” option. Process Temp: 350.0 oF
Type” 450” in the space. Hit “Enter” Ambient Temperature: 75.0 oF
Type” 75” in the space. Hit “Enter” NPS Pipe Size: 4
Use the Drop-down Menu to select ” 8”. Hit “Enter” Wind Speed: 0.0 mph Max Surface Temp: 140.0 oF
3EPlus Quiz - 1
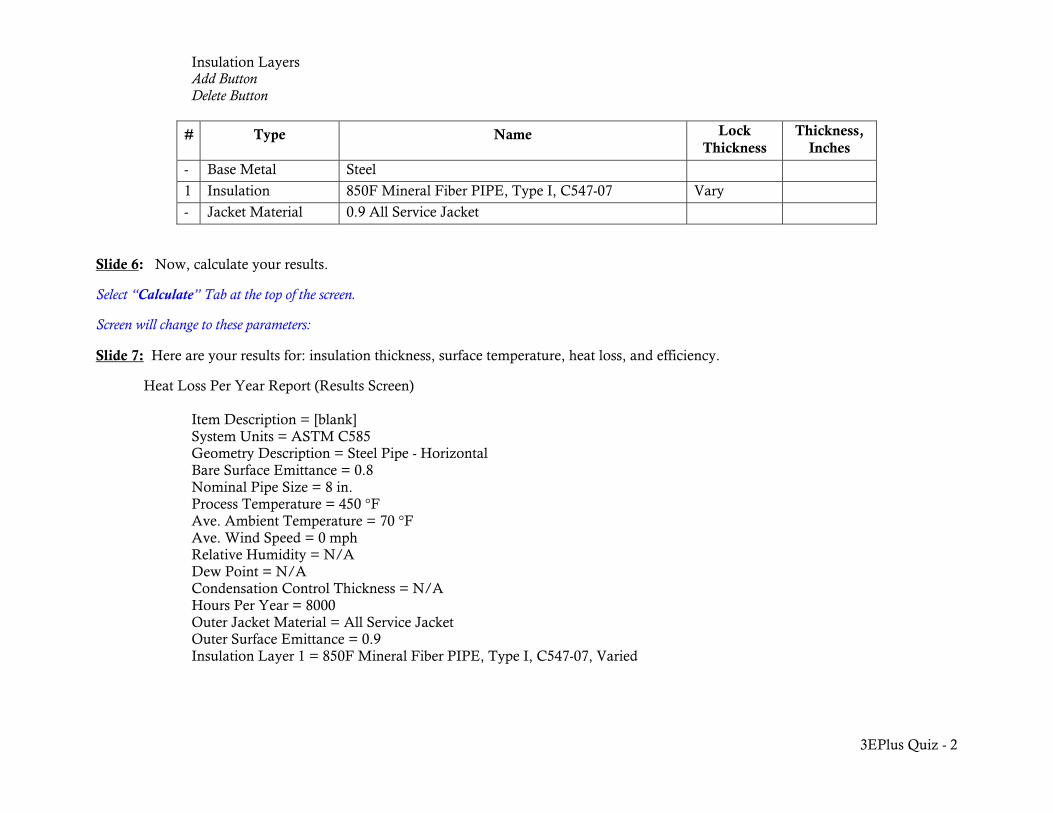
Insulation Layers Add Button Delete Button
# Type Name Lock Thickness
Thickness, Inches
- Base Metal Steel
1 Insulation 850F Mineral Fiber PIPE, Type I, C547-07 Vary
- Jacket Material 0.9 All Service Jacket
Slide 6: Now, calculate your results.
Select “Calculate” Tab at the top of the screen.
Screen will change to these parameters:
Slide 7: Here are your results for: insulation thickness, surface temperature, heat loss, and efficiency.
Heat Loss Per Year Report (Results Screen)
Item Description = [blank] System Units = ASTM C585 Geometry Description = Steel Pipe - Horizontal Bare Surface Emittance = 0.8 Nominal Pipe Size = 8 in. Process Temperature = 450 °F Ave. Ambient Temperature = 70 °F Ave. Wind Speed = 0 mph Relative Humidity = N/A Dew Point = N/A Condensation Control Thickness = N/A Hours Per Year = 8000 Outer Jacket Material = All Service Jacket Outer Surface Emittance = 0.9 Insulation Layer 1 = 850F Mineral Fiber PIPE, Type I, C547-07, Varied
3EPlus Quiz - 2
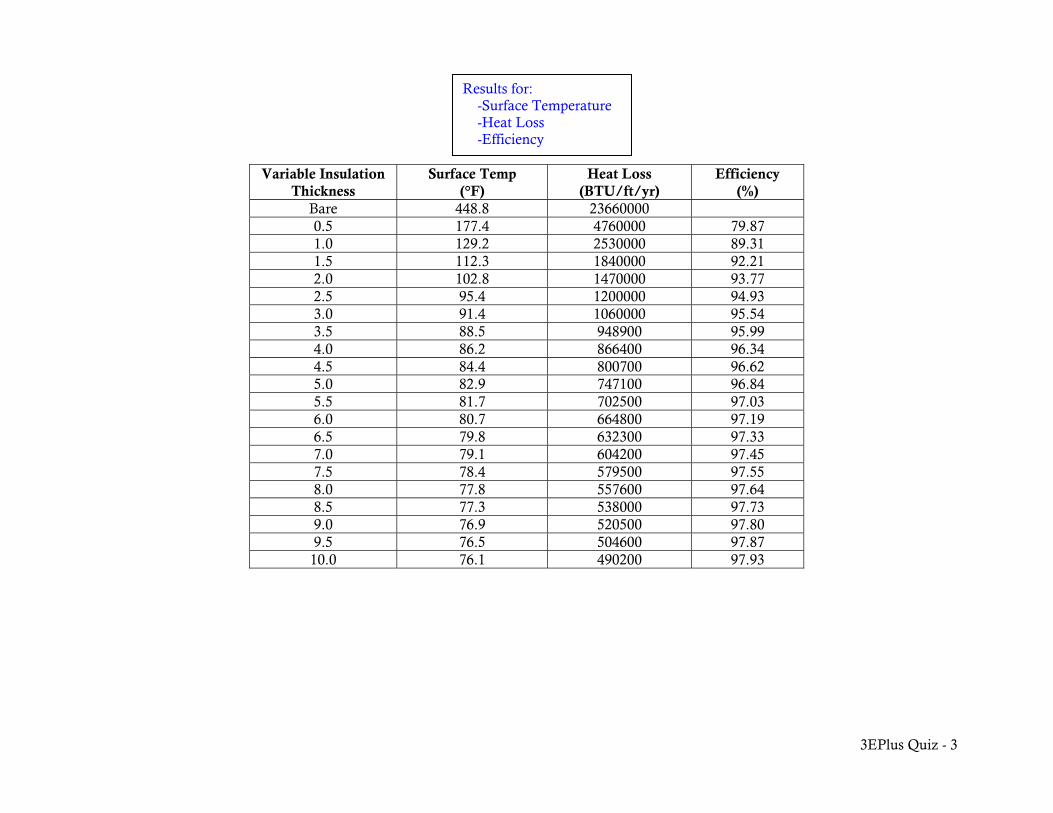
Variable Insulation Thickness
Surface Temp (°F)
Heat Loss (BTU/ft/yr)
Efficiency (%)
Bare 448.8 23660000 0.5 177.4 4760000 79.87 1.0 129.2 2530000 89.31 1.5 112.3 1840000 92.21 2.0 102.8 1470000 93.77 2.5 95.4 1200000 94.93 3.0 91.4 1060000 95.54 3.5 88.5 948900 95.99 4.0 86.2 866400 96.34 4.5 84.4 800700 96.62 5.0 82.9 747100 96.84 5.5 81.7 702500 97.03 6.0 80.7 664800 97.19 6.5 79.8 632300 97.33 7.0 79.1 604200 97.45 7.5 78.4 579500 97.55 8.0 77.8 557600 97.64 8.5 77.3 538000 97.73 9.0 76.9 520500 97.80 9.5 76.5 504600 97.87
10.0 76.1 490200 97.93
Results for: -Surface Temperature -Heat Loss -Efficiency
3EPlus Quiz - 3
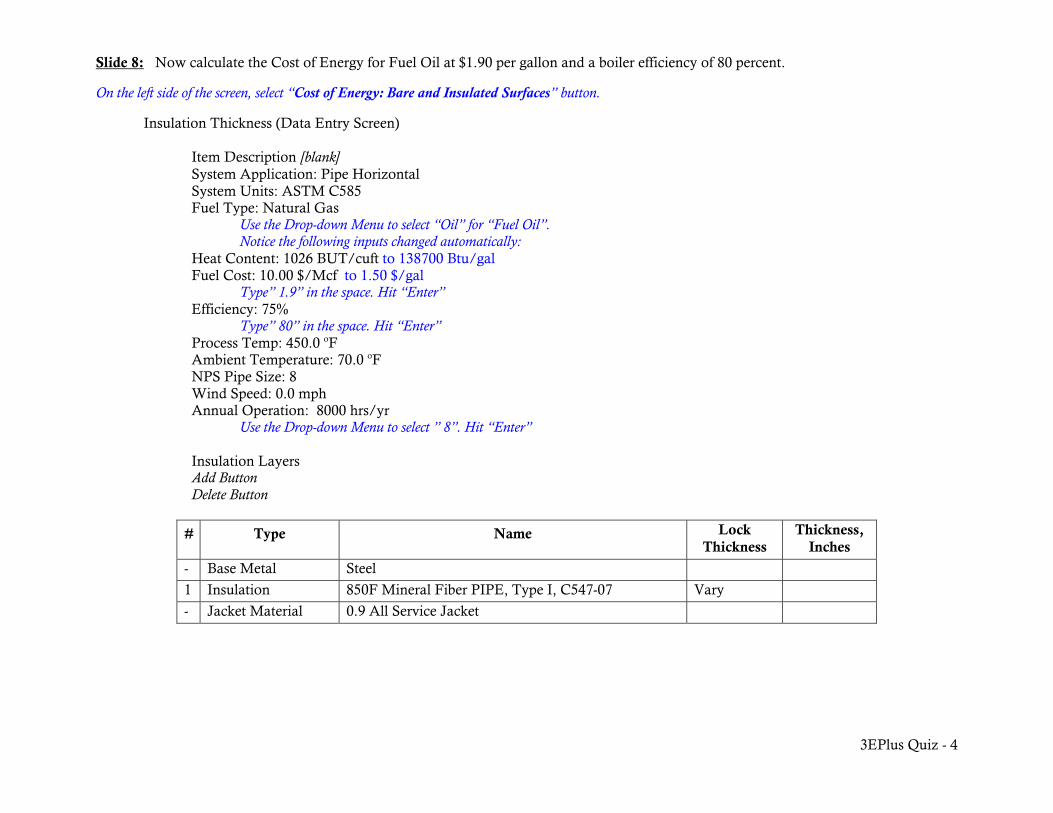
Slide 8: Now calculate the Cost of Energy for Fuel Oil at $1.90 per gallon and a boiler efficiency of 80 percent.
On the left side of the screen, select “Cost of Energy: Bare and Insulated Surfaces” button.
Insulation Thickness (Data Entry Screen)
Item Description [blank] System Application: Pipe Horizontal System Units: ASTM C585 Fuel Type: Natural Gas
Use the Drop-down Menu to select “Oil” for “Fuel Oil”. Notice the following inputs changed automatically:
Heat Content: 1026 BUT/cuft to 138700 Btu/gal Fuel Cost: 10.00 $/Mcf to 1.50 $/gal
Type” 1.9” in the space. Hit “Enter” Efficiency: 75%
Type” 80” in the space. Hit “Enter” Process Temp: 450.0 oF Ambient Temperature: 70.0 oF NPS Pipe Size: 8 Wind Speed: 0.0 mph Annual Operation: 8000 hrs/yr
Use the Drop-down Menu to select ” 8”. Hit “Enter”
Insulation Layers Add Button Delete Button
# Type Name Lock Thickness
Thickness, Inches
- Base Metal Steel
1 Insulation 850F Mineral Fiber PIPE, Type I, C547-07 Vary
- Jacket Material 0.9 All Service Jacket
3EPlus Quiz - 4
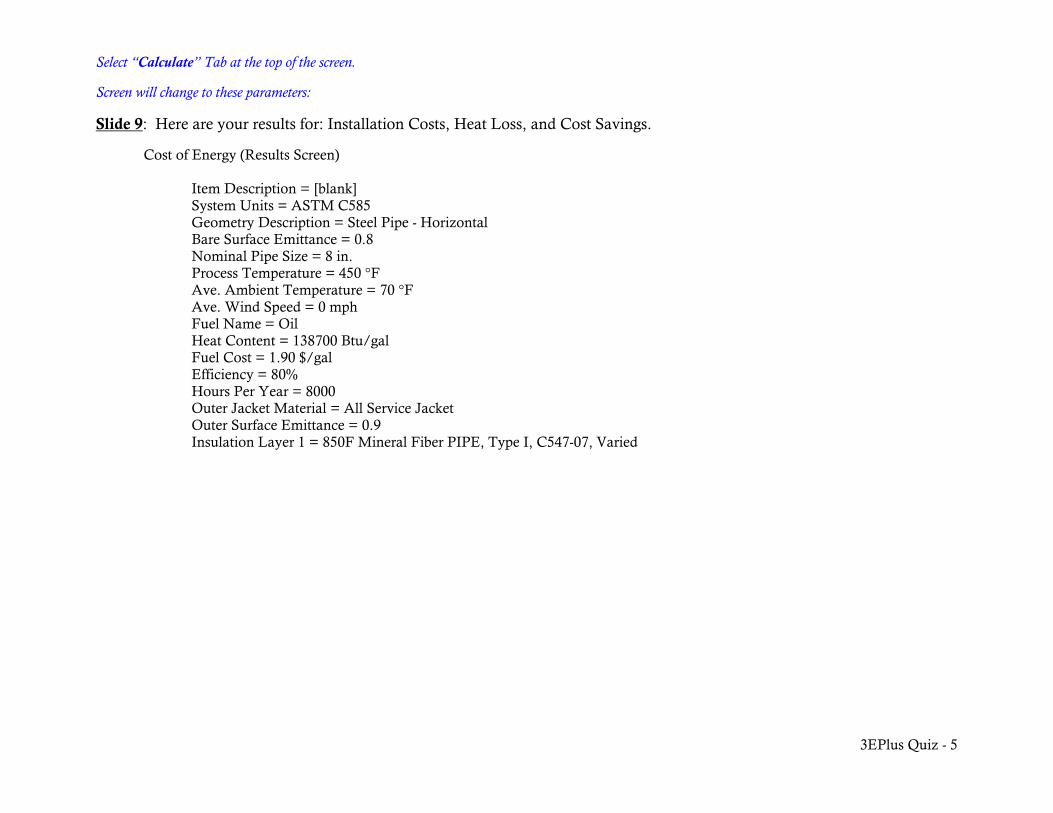
Select “Calculate” Tab at the top of the screen.
Screen will change to these parameters:
Slide 9: Here are your results for: Installation Costs, Heat Loss, and Cost Savings.
Cost of Energy (Results Screen)
Item Description = [blank] System Units = ASTM C585 Geometry Description = Steel Pipe - Horizontal Bare Surface Emittance = 0.8 Nominal Pipe Size = 8 in. Process Temperature = 450 °F Ave. Ambient Temperature = 70 °F Ave. Wind Speed = 0 mph Fuel Name = Oil Heat Content = 138700 Btu/gal Fuel Cost = 1.90 $/gal Efficiency = 80% Hours Per Year = 8000 Outer Jacket Material = All Service Jacket Outer Surface Emittance = 0.9 Insulation Layer 1 = 850F Mineral Fiber PIPE, Type I, C547-07, Varied
3EPlus Quiz - 5
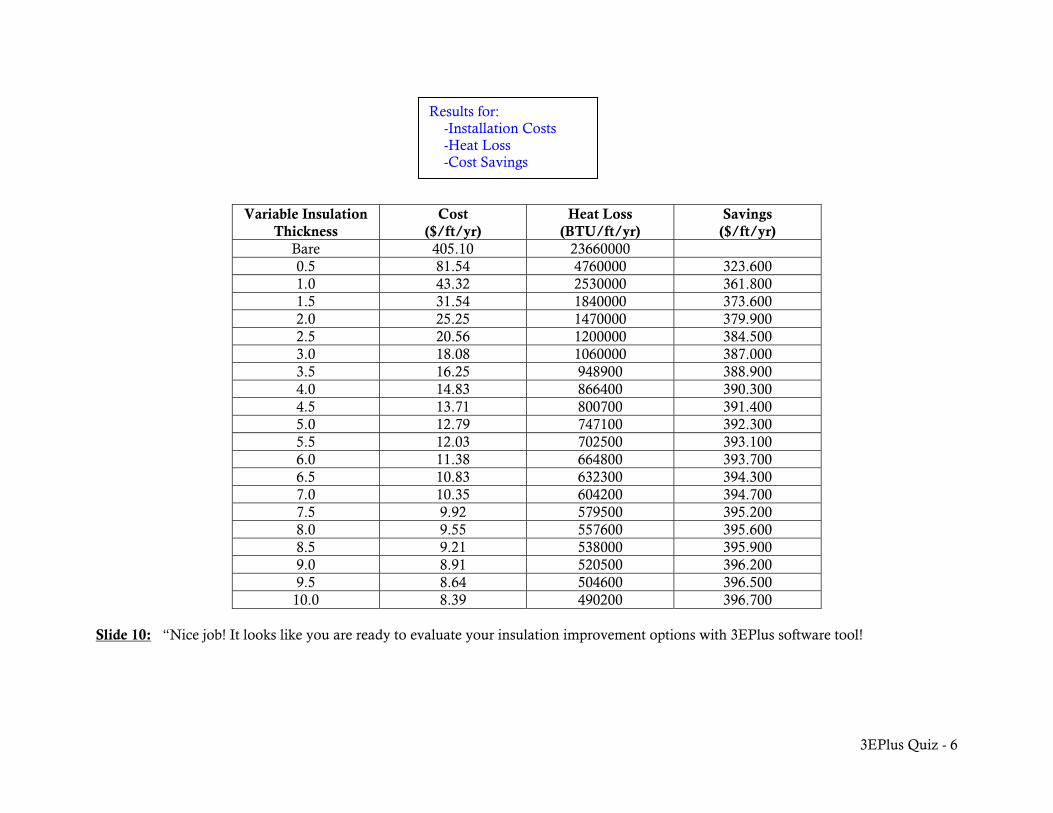
3EPlus Quiz - 6
Variable Insulation Thickness
Cost ($/ft/yr)
Heat Loss (BTU/ft/yr)
Savings ($/ft/yr)
Bare 405.10 23660000 0.5 81.54 4760000 323.600 1.0 43.32 2530000 361.800 1.5 31.54 1840000 373.600 2.0 25.25 1470000 379.900 2.5 20.56 1200000 384.500 3.0 18.08 1060000 387.000 3.5 16.25 948900 388.900 4.0 14.83 866400 390.300 4.5 13.71 800700 391.400 5.0 12.79 747100 392.300 5.5 12.03 702500 393.100 6.0 11.38 664800 393.700 6.5 10.83 632300 394.300 7.0 10.35 604200 394.700 7.5 9.92 579500 395.200 8.0 9.55 557600 395.600 8.5 9.21 538000 395.900 9.0 8.91 520500 396.200 9.5 8.64 504600 396.500
10.0 8.39 490200 396.700
Slide 10: “Nice job! It looks like you are ready to evaluate your insulation improvement options with 3EPlus software tool!
Results for: -Installation Costs -Heat Loss -Cost Savings

Conclusion Module
9/30/2009
Slide 1: Thank you for participating in the Steam System Tool Suite Introduction. We hope you have learned some of the capabilities of the Tool Suite and how to use them to identify and evaluate projects for your Steam System. Please continue to check back with the BestPractices Technology Delivery website for additional resources, and other training opportunities. We wish you good luck as you work toward reducing your energy consumption and improving your system performance.
Conclusion - 1