Embed Size (px)
Citation preview
America’s hunger rate is back up.
Some states are trying to help.
Hungry Again
THE STATES AND LOCALITIES March 2014
GOV03_Cover.indd 2 2/18/14 11:46 AM

© 2014 Thomson Reuters L-389217A/2-14
Thomson Reuters and the Kinesis logo are trademarks of Thomson Reuters.
Reason #1 to use new PeopleMap on WestlawNext:
GAIN GREATER
CONFIDENCE
WITH FEWER STEPS
Other public records research tools require you to go to multiple links to fi nd what
you’re looking for. Our tools integrate seamlessly with the most advanced legal
search engine available, eliminating the need to go elsewhere. Everything you need
is in one place, saving you time and energy.
Choose PeopleMap on WestlawNext® and make your next public records search
the only one you need. To learn more, visit legalsolutions.com/peoplemap.
100 Blue Ravine RoadFolsom, CA 95630916-932-1300
Page #
__________Designer __________Creative Dir.
__________Editorial __________Prepress
__________Other ____________OK to go
5 25 50 75 95 100 5 25 50 75 95 100 5 25 50 75 95 100 5 25 50 75 95 100
BLACKYELLOW
MAGENTACYAN

March 2014 | GOVERNING 1
VOL. 27, NO. 6
FEATURES28 HUNGRY AGAIN
America’s hunger rate has trended back up in the last few years. States can fi ght it—up to a point.By Zach Patton
36 CHICAGO GRADSThe city is retooling its community colleges to graduate more residents. Some worry the changes aren’t focused on the best kind of jobs. By Chris Kardish
42 DISTRESS SIGNALSBankruptcy grabs the headlines, yet distressed cities are a more widespread problem—one that few states know how to address.By Liz Farmer
48 THE PRICE OF KNOWING311 systems have revolutionized the way cities gather information. But running them can be extremely costly. By Tod Newcombe
52 PENITENCEA hulking prison in Philadelphia was built for introspection. By David Kidd
03.2014
An empty guard
tower at the
abandoned
Eastern State
Penitentiary in
PhiladelphiaPH
OT
O: D
AV
ID K
IDD
CO
VE
R ILLU
ST
RAT
ION
: M
ICH
ELLE
HA
MM
; IM
AG
E: S
HU
TT
ER
ST
OC
K.C
OM
GOV03_01.indd 1 2/14/14 3:00 PM
100 Blue Ravine RoadFolsom, CA 95630916-932-1300
Page #
__________Designer __________Creative Dir.
__________Editorial __________Prepress
__________Other ____________OK to go
5 25 50 75 95 100 5 25 50 75 95 100 5 25 50 75 95 100 5 25 50 75 95 100
BLACKYELLOW
MAGENTACYAN

PROBLEM SOLVER
58 Behind the Numbers There is a demographic divide between who uses public transportation and who drives.
60 Smart Management In its 25 years, the Web has drastically changed how government manages.
61 Better Government There’s a better way to link policy analysis and performance management.
62 Tech Talk Can neighborly competition conserve water?
63 Public Money Confronting social inequality is harder when a city is struggling.
64 Last Look LAX’s new terminal isn’t the fi rst time California travelers have seen the latest in aviation architecture.
DEPARTMENTS
4 Publisher’s Desk
6 Letters
OBSERVER
9 Wages vs. Tax CreditsIn the poverty fi ght, why does
one overshadow the other?
10 Going Hyper-LocalMore city offi cials are focusing
on small parts of their districts.
12 Turning to Temps Looming health mandates have
governments hiring part-timers.
POLITICS + POLICY
14 Assessments There are two kinds of mayors: neighborhood or downtown.
16 Dispatch Are anonymous blogs on media websites helpful or confusing?
18 Potomac Chronicle States and localities must lead in reversing rising inequality.
19 FedWatch Chicago’s mayor wants a fee to help respond to train accidents.
20 Health States shouldn’t rush to switch to managed care programs.
22 Green Government Localities are looking to ban pes- ticides. Can they?
24 Economic Engines Just as seeds need soil to grow, innovation requires nurturing.
25 Urban Notebook Do the poor really lose out when a neighborhood gentrifi es?
60
GOVERNING | March 20142
11111111111111111111144444444444
222
FLIC
KR
/BIL
L D
E B
LA
SIO
FLIC
KR
/NIK
LA
S M
OR
BE
RG
SH
UTTE
RS
TO
CK
.CO
M
GOV03_02.indd 2 2/14/14 3:02 PM
100 Blue Ravine RoadFolsom, CA 95630916-932-1300
Page #
__________Designer __________Creative Dir.
__________Editorial __________Prepress
__________Other ____________OK to go
5 25 50 75 95 100 5 25 50 75 95 100 5 25 50 75 95 100 5 25 50 75 95 100
BLACKYELLOW
MAGENTACYAN

1 As of 12/31/13, 0.00% have 1 star, 3.3% have 2 stars, 40.8% have 3 stars, 38.8% have 4 stars and 17.1% have 5 stars. Morningstar is an independent service that rates mutual funds and variable annuities. The top 10% of accounts in an investment category receive fi ve stars, the next 22.5% receive four stars and the next 35% receive three stars. Morningstar proprietary ratings refl ect historical risk-adjusted performance and can change every month. They are calculated from the account’s three-, fi ve- and ten-year average annual returns in excess of 90-day Treasury bill returns with appropriate fee adjustments, and a risk factor that refl ects mutual fund/subaccount performance below 90-day T-bill returns. The overall star ratings are Morningstar’s published ratings, which are weighted averages of its three-, fi ve- and ten-year ratings for periods ended 12/31/13. 2 94% of TIAA-CREF Mutual Funds have expense ratios that are in the bottom quartile (or 100% below median) of their respective Morningstar category. Source: Morningstar Direct as of 12/31/13. TIAA-CREF Individual & Institutional Services, LLC, and Teachers Personal Investors Services Inc. ©2014 Teachers Insurance and Annuity Association of America – College Retirement Equities Fund (TIAA-CREF), 730 Third Avenue, New York, NY, 10017. C14514B
Consider investment objectives, risks, charges and expenses carefully before investing. Go to tiaa-cref.org for product and fund prospectuses that contain this and other information. Read carefully before investing. TIAA-CREF funds are subject to market and other risk factors.Past performance does not guarantee future results.
NOTHING MAKES YOU FEEL WARM AND FUZZY
LIKE COLD HARD FACTS.Over half of TIAA-CREF’s mutual funds have Morningstar® ratings of 4 or 5 stars.1 It’s unbiased, mathematical evidence of the strength of our funds. Plus, 94% of TIAA-CREF mutual funds have expense ratios among the lowest in their Morningstar category.2 That’s how we deliver Outcomes That Matter.
Everyone can invest in our top-rated, low-cost funds. Visit TIAA.org/hardfactsgov
100 Blue Ravine RoadFolsom, CA 95630916-932-1300
Page #
__________Designer __________Creative Dir.
__________Editorial __________Prepress
__________Other ____________OK to go
5 25 50 75 95 100 5 25 50 75 95 100 5 25 50 75 95 100 5 25 50 75 95 100
BLACKYELLOW
MAGENTACYAN
PUBLISHER’S DESK
Below the Surface
Nearly six years ago, I moved over to Governing from our then-sister publication, Congressional Quarterly. It was a voyage from one journalistic world to another. CQ focused on the issues and policy choices moving
through Congress. If something wasn’t under congressional scrutiny, it didn’t exist as far as the magazine was concerned. The coverage was technical; topics such as health care, education and energy regulation were covered with accuracy and integrity, but there was little attempt to relate the stories to the problems real people were having in their everyday lives.
Governing also covers the same public policy topics, but in an entirely diff erent way. We focus not only on public policy choices but on the ordinary Americans those choices will aff ect. We write
about the subjects under debate in legislatures across the nation, but we also take on issues that legis-latures and elected offi cials are sometimes slow to face.
Our March cover story falls into that last category: It is about hunger, a problem that’s only just now climbing onto most legisla-tures’ formal agendas (see “Hun-gry Again,” page 28). State and local leaders dance around the subject; last fall at the annual meeting of the National Conference of State Legislatures, the issue of worsen-
ing hunger among the poor came up in several sessions. But for whatever reason, many elected offi cials have been reluctant to bring the subject to the public’s attention in their districts.
This feature, by Executive Editor Zach Patton, reports on the relatively few states and localities that are making a sustained eff ort to do something about it. Like all good Governing stories, it is about the people who need help and the obstacles that stand in the way of their receiving it.
Another kind of story we like to do is the one that highlights breakthroughs in technology, and how they create new oppor-tunities for citizens to address everyday concerns. Currently, 311 systems are one of the vehicles used for this purpose. The fed-eral Consumer Financial Protection Bureau is rolling out a new pilot initiative in fi ve cities that uses 311 as a hotline for citizens to report any fi nancial issues facing consumers. Our story takes a deeper look at how governments are using 311 to gather informa-tion and how that information is being deployed.
We address some big topics in our March issue, but are always looking to you to tell us what is going on in your community. Please write me at any time at [email protected] and let me know if there is a topic being missed.
GOVERNING | March 20144
Publisher Erin Waters
Executive Editor Zach PattonManaging Editor Elizabeth DaigneauSenior Editors Alan Ehrenhalt, Tod Newcombe, Jonathan WaltersChief Copy Editor Miriam Jones; Copy Editor Elaine Pittman Staff Writers Liz Farmer, Chris Kardish, J.B. WoganCorrespondents John Buntin, Alan Greenblatt Contributing Editors Penelope Lemov, John MartinColumnists Katherine Barrett & Richard Greene, Mark Funkhouser, Peter A. Harkness, Donald F. Kettl, Justin Marlowe, Alex Marshall, Aaron M. Renn, Frank Shafroth, Steve Towns
News Editor, Governing.com Daniel LuzerSenior Editor, Governing.com Caroline CournoyerData Editor, Governing.com Mike Maciag
Chief Content Offi cer Paul W. Taylor
Chief Design Offi cer Kelly MartinelliDesign Director & Photo Editor David KiddCorporate Creative Director Michelle Hamm Production Director Stephan Widmaier
Chief Marketing Offi cer Margaret MohrMarketing Director Meg Varley-Keller
Founder & Publisher Emeritus Peter A. Harkness
Advertising 202-862-8802Associate Publisher, Finance Erica PyattAssociate Publisher, Health and Human Services Arielle Confi no Associate Publisher, Infrastructure Jennifer GladstoneAssociate Publisher, Technology Mary NoelAccount Managers Elisabeth Frerichs, Alex KaneOffi ce Manager Alina Grant Operations Administrator Kendra KellyMedia Account Coordinators Hillary Leeb, Katie Skinner, Abigail PadillaMarketing/Classifi ed [email protected]
e.Republic Inc.
CEO Dennis McKennaExecutive VP Cathilea RobinettCFO Paul HarneyCAO Lisa Bernard
Reprint Information Reprints of all articles in this issue and past issues are available (500 minimum). Please direct inquiries for reprints and licensing to Wright’s Media: 877-652-5295, [email protected]
Subscription/Circulation Service
Eenie Yang [email protected]/subscribe
Governing (ISSN 0894-3842) is published monthly by e.Republic Inc., with offi ces at 1100 Connecticut Ave. N.W., Suite 1300, Washington, D.C. 20036 and at 100 Blue Ravine Road, Folsom, CA 95630. Telephone: 202-862-8802. Fax: 202-862-0032. Email: [email protected]. Periodical postage paid in Washington, D.C., and at additional mailing offi ces. Copyright 2014 e.Republic Inc. All rights reserved. Repro-duction in whole or in part without written permission of the publisher is prohibited. Governing, Governing.com and City & State are registered trademarks of e.Republic Inc.; unauthorized use is strictly prohibited. U.S. subscription rates: Government employees—free; all others—$19.95 for one year. Back issues $4.50. Foreign subscrip-tions: $74.95 in U.S. funds. Postmaster: Send address changes to Governing, 100 Blue Ravine Road, Folsom, CA, 95630. Subscribers: Enclose mailing label from past issue. Allow six weeks. Member: BPA International. Made in the U.S.A.
Erin Waters, Publisher
GOV03_04.indd 4 2/14/14 3:04 PM
100 Blue Ravine RoadFolsom, CA 95630916-932-1300
Page #
__________Designer __________Creative Dir.
__________Editorial __________Prepress
__________Other ____________OK to go
5 25 50 75 95 100 5 25 50 75 95 100 5 25 50 75 95 100 5 25 50 75 95 100
BLACKYELLOW
MAGENTACYAN

© 2014 AT&T Intellectual Property. All rights reserved. AT&T, the AT&T logo and all other AT&T markscontained herein are trademarks of AT&T Intellectual Property and/or AT&T affi liated companies.
Empowering citizens in a mobilized world.
We live in a world where citizens can access just about anything they need using a mobile phone. So it’s no surprise that DIY app development is such a hot topic these days. That approach may be suitable for some – but you have the responsibility of developing an end-to-end mobile solution to connect citizens with government services anytime, anywhere. That takes experience. That takes scale. That takes a partner who can handle the complexity of government and the sensitivity of citizen data. AT&T has the expertise to mobilize your government services without rip and replace. We’ll pull it all together in a way that makes sense for your systems and your budget.
To learn more, visit att.com/govmobility
100 Blue Ravine RoadFolsom, CA 95630916-932-1300
Page #
__________Designer __________Creative Dir.
__________Editorial __________Prepress
__________Other ____________OK to go
5 25 50 75 95 100 5 25 50 75 95 100 5 25 50 75 95 100 5 25 50 75 95 100
BLACKYELLOW
MAGENTACYAN
LETTERS
School Reform, Round 2It appears to me that [education historian Diane Ravitch] may have the biggest clue [“The Fight Over School Reform,” Janu-ary 2014]. There is a great deal of money being spent in public education that gets focused on neither students, teachers nor facilities, but on change/reform. There is such a thing in business called menu costs—thinking in terms of a restaurant, the cost that it required to update or reprint the menu with every change. This is very costly if it’s done regularly. Those same menu costs occur every time there is a new set of standards/tests/curricu-lums to teach to and the money doesn’t result in improved outcomes (but it does result in generating a great deal of wealth for consultants and change agents in the reform industry). Of course, there will be some costs associated with updating those things that need to be printed—texts, manuals, documents to parents—but those costs don’t equate to the same degree of costs and victims.
—Cedric on Governing.com
To portray [Michelle] Rhee as a heavy-weight is ludicrous. ... There’s not an ounce of support or evidence
that the reforms clustered around [Common Core state standards] are eff ective, valid or useful.
—Peter on Governing.com
Home of the Creative Class
The creative class model has always worked for New Orleans [“A Creative Comeback in the Big Easy” in Assess-ments, January 2014]. This is indicated by New Orleans musicians, who have dominated the top of the national music sales charts from the mid-’50s on. New Orleans may even be the prototype of the creative class entrepreneurial model, as the city has had an indigenous creative class a good century before [Richard] Florida’s term came into being. Unfortu-
nately the descendants of that long pre-existing creative class are being shut out of the booming new entrepreneurship sector and the capital that fuels it, while having to experience soaring poverty rates, rents, underemployment, joblessness and eco-nomic inequality.
—Hoodoonola on Governing.com
I Second Data AnalyticsAll levels of government stand to benefi t from embracing data analytics in 2014 [“The Tech Year Ahead” in Tech Talk, January 2014]. Currently, we produce more data every other day compared to the amount of data produced from the inception of early civilization until the year 2003 combined—and that volume of data today has surpassed most data ana-lytics off erings and available resources. However, if we can embrace data analyt-ics, then we can improve the economic vitality of the country by supplying busi-nesses with the appropriate information so they can create new and improved opportunities, and stimulate job growth. Open data and agile analytics have the potential to bring this principle into every small and large community around the country.
—Chuck D. Brooks on Governing.com
LETTERS
To pwa
woComebydosaOrcrthclFl
natexisthe band
GOVERNING | March 20146
Correction: In the February issue,
Tod Newcombe’s Urban Notebook
column, “After Midnight,” mistakenly
identifi ed the Massachusetts Bay
Transportation Authority as the
Metropolitan Boston Transit Authority.
IN THE MAKING OF THIS ISSUE
DA
VID
KID
D
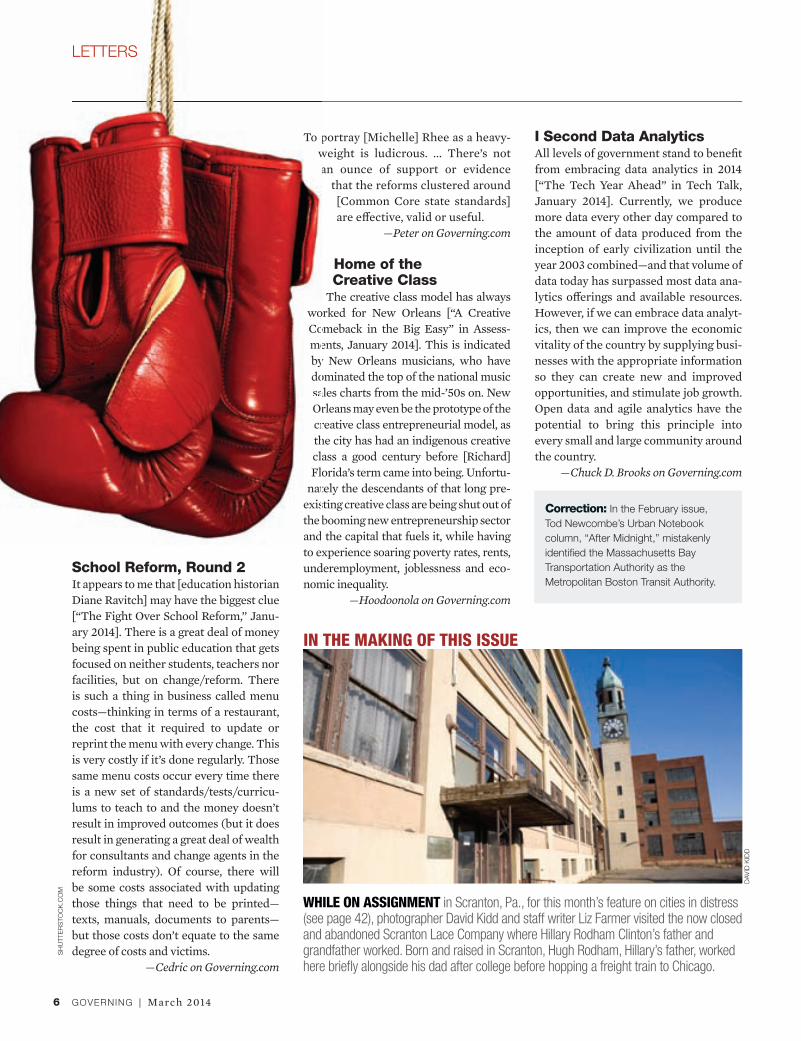
WHILE ON ASSIGNMENT in Scranton, Pa., for this month’s feature on cities in distress (see page 42), photographer David Kidd and staff writer Liz Farmer visited the now closed and abandoned Scranton Lace Company where Hillary Rodham Clinton’s father and grandfather worked. Born and raised in Scranton, Hugh Rodham, Hillary’s father, worked here briefl y alongside his dad after college before hopping a freight train to Chicago.
SH
UTTE
RS
TO
CK
.CO
M
GOV03_06.indd 6 2/14/14 3:05 PM
100 Blue Ravine RoadFolsom, CA 95630916-932-1300
Page #
__________Designer __________Creative Dir.
__________Editorial __________Prepress
__________Other ____________OK to go
5 25 50 75 95 100 5 25 50 75 95 100 5 25 50 75 95 100 5 25 50 75 95 100
BLACKYELLOW
MAGENTACYAN

How our reduce, reuse and recycle program can benefi t your company.
If your company is going greener, Ford can help take you in the right direction. Ford vehicles are 85% recyclable by weight. Plus you’ll fi nd components made of sustainable materials like soybeans, castor oil and wheat straw. These materials can also reduce weight, which helps improve fuel effi ciency. It’s good for the environment. It’s also good business. Learn more at fl eet.ford.com.
100 Blue Ravine RoadFolsom, CA 95630916-932-1300
Page #
__________Designer __________Creative Dir.
__________Editorial __________Prepress
__________Other ____________OK to go
5 25 50 75 95 100 5 25 50 75 95 100 5 25 50 75 95 100 5 25 50 75 95 100
BLACKYELLOW
MAGENTACYAN

Join these regional forums and help tackle the tough issues.
Connect with leadersin key regions.
COLORADO DENVER / JUNE
MICHIGAN LANSING / APRIL
MARYLAND
HYATTSVILLE / APRILGEORGIA
ATLANTA / MAY
TEXAS AUSTIN / AUGUST
CALIFORNIA SACRAMENTO / OCTOBER
To get involved or sponsor visit governing.com/events
2014 LE ADERSHIP FORUMS
Contact: Erin Waters, Publisher, Governing | 202.862.1453 | [email protected]
GOV14 AD Leadership Forums.indd 1 1/31/14 9:57 AM
100 Blue Ravine RoadFolsom, CA 95630916-932-1300
Page #
__________Designer __________Creative Dir.
__________Editorial __________Prepress
__________Other ____________OK to go
5 25 50 75 95 100 5 25 50 75 95 100 5 25 50 75 95 100 5 25 50 75 95 100
BLACKYELLOW
MAGENTACYAN

In Poverty Fight, Should Wages Overshadow Tax Credits?
AP
IMA
GE
S.C
OM
9
provides an annual supplement to workers based on their earnings, marital status and how many children they have. Thanks to policy changes over the years, both the value of the credit and the number of Americans receiving it have more than tripled since the EITC was created. More than 25 million tax fi lers participated in the program in 2011, and as of last year, a married couple making less than $51,567, with three or more children, could receive a credit of $6,044.
Twenty-fi ve states, plus New York City, the District of Columbia and Montgomery County, Md., have doubled down on the program by matching a proportion of the federal credit someone receives. The size of the state per-centage match ranges from Louisiana’s 3.5 percent to Vermont’s 32 percent. Last year at least 16 states considered legislation that would either create, expand or retain a state version of the federal credit, according to the National Conference of State Legislatures.
Lately, expanding the EITC has become a rallying cry among some moderate conserva-tives who say raising the minimum wage will hurt employers and result in layoffs. EITC proponents include U.S. Rep. Paul Ryan of Wisconsin; the American Action Forum, a center-right think tank; and Gregory Mankiw,
a former chairman of the Council of Economic Advisers under President George W. Bush, who says “an expanded EITC would make sense as part of a package that eliminated the minimum wage, rather than raising it.”
Mankiw’s point is precisely the problem, say some antipoverty advocates. “Both are good public policies,” says Amy Hanauer, executive director of Ohio Policy Matters, a think tank that successfully pushed for the creation of a state version of the EITC last year. While the two policies complement each other, people use the benefi ts differently. The minimum wage provides a small income boost each month—well suited for ongoing costs, such as food, utilities and rent. The tax credit, by contrast, comes in an annual lump sum, which works better for paying off debt or a rental deposit.
“The problem you get into is people who say we don’t need both, [that] we should have one or the other,” says Jared Bernstein, a senior fellow at CBPP. “I don’t think there’s a perfect calibration, but I think there’s a bal-ance between the two.”
—J.B. Wogan
FEDERAL POLICYMAKERS remain locked in debate over whether to increase the mini-mum wage, despite (or because of) President Obama’s recent executive order raising minimum pay for government contractors. But among states and localities, wage hikes have become the highest-profi le antipoverty proposals on the table. Wage increases took effect in 13 states on Jan. 1. Some cities and counties, including San Jose, Calif., and Montgomery County, Md., have enacted their own wage raises. And lawmakers in at least 30 states are expected to push for minimum-wage increases this year.
But what about tax credits? Some advo-cates say that boosting programs such as the Earned Income Tax Credit (EITC) would be better for the working poor. Such proposals, however, haven’t garnered the same kind of attention as raising wages. “The minimum wage is a little more intuitive. It’s a little easier to explain,” says Nick Johnson, vice president for state and fi scal policy at the Center on Budget and Policy Priorities (CBPP), a left-leaning think tank. That’s why, he says, the minimum wage has become “the public face of the effort.”
Historically, the EITC has enjoyed biparti-san support. Originated in 1975, the program
Protesters rally
for better wages
in Detroit.
GOV03_09.indd 9 2/14/14 3:10 PM
100 Blue Ravine RoadFolsom, CA 95630916-932-1300
Page #
__________Designer __________Creative Dir.
__________Editorial __________Prepress
__________Other ____________OK to go
5 25 50 75 95 100 5 25 50 75 95 100 5 25 50 75 95 100 5 25 50 75 95 100
BLACKYELLOW
MAGENTACYAN

ALL MAYORS KNOW that they can lose their jobs if they spend too much time and eff ort building up their downtowns and neglecting the neighborhoods. But what happens to city offi cials who go hyper-hyper-local, devoting time and resources to small parts of their districts?
Zack Reed, a member of the Cleveland City Council, has been trying for years to spruce up the area around a single intersection in the Mount Pleasant neighborhood. Where a school has been demolished, he would like to see new or expanded recreation and mental health centers, along with a library, in hopes not just of improving services but attracting private investment.
His decision to attend to one small slice of his ward hasn’t always been popular. “At fi rst, there was some pushback, no ifs, ands or buts about it,” Reed says.
But he’s persevered. And he’s not alone. Atlanta Councilman Kwanza Hall tries through both the city budget and social media to direct more resources to an area called Boulevard, one of the poorest neighborhoods in the entire Southeastern United States. In Boston, the city has been devoting considerable attention to Dudley Square, hoping it can be improved as a hub that would do wonders for all of the city’s Roxbury section.
Government offi cials, like parents, are intensely aware that they must be fair in doling out attention; favoring one part of the city can be a political problem. But they also know that concentrating resources where they’ll do the most good can provide the greatest return on investment.
“There’s not enough money at any one time to fi x everything,” says Joel Ratner, president of Cleveland Neighborhood Progress, a nonprofi t group. “If we don’t make diffi cult strategic decisions, the danger is accomplishing very little over a long period of time.”
Not all neighborhoods need the same kind of help. Some might require gang intervention, while others might be ready to launch as a commercial center, given a well-timed boost. Politicians always have to worry about the “peanut butter” problem—the need to spread out resources equally across their entire jurisdiction. But spending the same amount everywhere means there probably won’t be enough to make a major impact anywhere.
“If we can set aside the politics for a moment, the evidence is when you focus your resources, hard cash or other investments, you can begin to have an eff ect on the wider market and
investment in the community,” says Erika Poethig, director of Urban Policy Initiatives at the Urban Institute, a Washington think tank.
That’s why city offi cials are constantly starting pilot projects, putting money into developments that they believe are worthy and that hold out the promise of being replicated elsewhere. Countless mayors and council members have gotten into trouble for apparently playing favorites with neighborhoods—or have been accused of outright cronyism—so they’re always careful to preach the benefi ts that will spread from the targeted area to the surrounding community.
That’s the argument Zack Reed has been trying to make. Southeastern Cleveland has been practically devoid of investment for decades. Getting one corner of it alive and humming again would have spillover eff ects that would help Mount Pleasant as a whole. “This is going to benefi t everybody in this neck of the woods,” he says.
Reed continues to make the case even though a restructuring of the city council means he no longer represents that particular corner of the city. “Ironically, it’s not even in my ward anymore,” he says.
—Alan Greenblatt
When Local Means Hyper-Local
AP
IMA
GE
S.C
OM
GOVERNING | March 201410
A man walks past an
abandoned building
in Cleveland’s Mount
Pleasant neighborhood.
GOV03_09.indd 10 2/14/14 3:10 PM
100 Blue Ravine RoadFolsom, CA 95630916-932-1300
Page #
__________Designer __________Creative Dir.
__________Editorial __________Prepress
__________Other ____________OK to go
5 25 50 75 95 100 5 25 50 75 95 100 5 25 50 75 95 100 5 25 50 75 95 100
BLACKYELLOW
MAGENTACYAN

11March 2014 | GOVERNING
SO
UR
CE
S:
AS
SO
CIA
TE
D P
RE
SS
, C
BS
NE
WS
; IM
AG
E:
SH
UTTE
RS
TO
CK
.CO
M
Top prize—along with a blue ribbon—in the recently announced marijuana plant competition at the
Denver County Fair this coming August. The offbeat fair, which launched in
2011, already includes quirky events like a bicycle rodeo and a speed-texting contest. County offi cials say the newly
added pot categories (which also include best bong and best marijuana-infused brownies) will be conducted
offsite from the fairgrounds.
>75kPotholes fi lled in January
in Chicago, up from 50,000 the previous January. Offi cials say the colder-than-usual winter wreaked
havoc on Windy City streets.
States that closed prisons last year, a nationwide reduction of 37,000
prison beds and a savings of $97 million, according to a new report from The Sentencing Project, which
advocates corrections reforms including alternatives to incarceration.
THE BREAKDOWN
10States with stand-alone agencies
devoted to child welfare. Arizona could become the 11th under a proposal put forth by Gov. Jan Brewer in her recent State of the State address.
$20
17
BALTIMORE’S HAMPDEN neighborhood,
a gentrifi ed area north of downtown, is
bifurcated by 36th Street. “The Avenue,” as
it’s known among locals, is strung with cof-
fee shops, boutiques and funky restaurants.
It’s a walkable area with lots of foot traffi c.
So when the city transportation depart-
ment in 2012 repaved a main intersection
on The Avenue—and then failed to repaint
the crosswalk for eight months—it became
a traffi c problem. Cars sped through the
intersection, and pedestrian safety became
a concern.
Frustrated by the city’s inaction, a few
Hampden merchants decided to paint the
crosswalk themselves in the middle of
the night. One of those merchants, an art
gallery owner named Deborah Patterson,
called the city the next morning to confess.
“I told them I did it because it was danger-
ous,” Patterson says. “I had almost hit
somebody recently coming home one night.
I had to do something.”
Guerrilla traffi c-calming efforts like
Patterson’s have become a growing issue
in Baltimore and in urban areas across the
country, as fed-up residents attempt to slow
motorists with do-it-yourself measures.
(This past November, in another Baltimore
neighborhood, an artist installed a steel
sculpture in the middle of a traffi c circle to
draw drivers’ attention to the traffi c pat-
tern.) Most of the time, cities will remove or
paint over these efforts by self-appointed
civil engineers. They’re illegal, and offi cials
say they pose liability issues. A few cities,
including Muncie, Ind., in 2008 and Vallejo,
Calif., last year, have arrested people who
painted crosswalks without permission.
But there is another approach, say
people like Mike Lydon, an urban planner
with the Street Plans Collaborative and the
co-author of a handbook called Tactical
Urbanism. Lydon says cities should “look at
the action of citizens as a civic act, as care
and interest in their neighborhood.” Instead
of punishing proactive members of the
community, he says, “cities should use their
resources to help scale those efforts up and
make them permanent.”
Some cities have experimented with
that idea. Last year, after residents in New
Haven, Conn., painted their own crosswalks
at one heavily traffi cked intersection, the city
did scrub the zebra-striped paint job. But it
spurred offi cials to renovate the crossing
with bulbouts, pedestrian-activated lights
and new brick-style crosswalks. And in
Hampden, news coverage of the guerrilla
crosswalk prompted Baltimore offi cials to
install two stop signs and three crosswalks.
“It really did light a fi re,” Patterson says. “You
know, they don’t want to be embarrassed.”
—J.B. Wogan
Fighting Traffi c One Paint Brush At a Time
JE
D W
EE
KS
/BA
LTIM
OR
E B
RE
W
11arch h 20120144 || GOVGOVERNERNINING
along with a blue recently announced competition at the r this coming August.which launched in
cludes quirky events o and a speed-textingffi cials say the newly gories (which also and best marijuana-
s) will be conducted the fairgrounds.
A merchant paints a crosswalk himself in
the Baltimore neighborhood of Hampden.
GOV03_09.indd 11 2/14/14 4:10 PM
100 Blue Ravine RoadFolsom, CA 95630916-932-1300
Page #
__________Designer __________Creative Dir.
__________Editorial __________Prepress
__________Other ____________OK to go
5 25 50 75 95 100 5 25 50 75 95 100 5 25 50 75 95 100 5 25 50 75 95 100
BLACKYELLOW
MAGENTACYAN

THE CITY OF MASON, Ohio, faced a dilemma last year. Looming mandates from the Aff ordable Care Act required employers with at least 50 workers to provide coverage for those working an average of 30 hours per week. About half of Mason’s 400 employees were part-timers not receiving health benefi ts; they would have to be covered under the new mandate. Expanding coverage would cost the city an additional $3.4 million annually, a large sum in a city whose general budget has only been around $24 million in recent years. But by not complying, Mason could be hit with hefty federal fi nes.
In the end, offi cials took a diff erent tack. The city set a cap of 25 hours a week for part-timers, trimming their hours to avoid the mandate.
Other localities and states are making diffi cult decisions of their own to comply before the rule takes eff ect next year. Many agencies, particularly state colleges and universities, are cutting hours for those not currently receiving health benefi ts. In other cases, personnel offi ces are changing workers’ status or reshuffl ing other categories
Facing Health Mandate, Governments May Turn to Temps
to comply. For example, Virginia last spring capped all nonsalaried wage employees at less than 30 hours a week.
The move, which the state says keeps it from spending an additional $110 million a year on health coverage, aff ects some 10,000 state workers, mostly on college campuses but also in agencies such as the Department of Conservation and Recreation and in state-run liquor stores.
In some places, the changes have involved employees who wouldn’t have used the government insurance plans anyway. Many of the aff ected Mason employees, for example, are students or retirees already covered by other plans. “I had a number of them come to me and say, ‘I don’t want health care, I just want a paycheck,’” says Assistant City Manager Jennifer Heft.
Will all these cutbacks and caps lead to more temporary and part-time public workers? Possibly, although it’s too soon to know for sure. Certainly governments will have to fi nd some way to make up the workload. (States and localities employ about 4.7 million part-time employees nationwide,
accounting for a third of their workforce, according to the Census Bureau’s most recent survey estimates.) Heft says that Mason has already hired between 30 and 50 part-timers. In Virginia, state human resources Director Sara Wilson says she expects agencies to respond by either hiring more temporary workers or converting some part-timers to full-time status.
Some states haven’t had to take such drastic measures.
In Delaware, for example, part-time permanent state employees working more than 15 hours per week can already receive health coverage. A much smaller number of seasonal workers—about 600 by state estimates—do work more than 30 hours and don’t receive benefi ts. Brenda Lakeman, Delaware’s director of human resources management and benefi ts, says the state is coordinating with agencies to conduct reviews and limit the number of temp employees they’ll need to cover.
“The key issue we’ve been stressing,” Lakeman says, “is that we’re trying to manage this without cutting any hours.”
—Mike Maciag
—Peggy Grover, the fi rst female member of the Idaho Potato
Commission, who wants women to be allowed to purchase white
potatoes for their families with WIC (the federal nutrition assistance
program for women, infants and children) money again.
SOURCE: GOVERNING.COM; IMAGE: SHUTTERSTOCK.COM
THE WOMEN “POTATOES.”WANT THE
GOVERNING | March 201412
GOV03_09.indd 12 2/14/14 3:11 PM
100 Blue Ravine RoadFolsom, CA 95630916-932-1300
Page #
__________Designer __________Creative Dir.
__________Editorial __________Prepress
__________Other ____________OK to go
5 25 50 75 95 100 5 25 50 75 95 100 5 25 50 75 95 100 5 25 50 75 95 100
BLACKYELLOW
MAGENTACYAN

Restrictions apply. Not available in all areas. Actual speeds vary and are not guaranteed.
Call for details. Comcast ©2014. All rights reserved.
If you’re still using older network
technology, your government IT
initiatives are underperforming. Comcast
Business off ers fi ber-based Ethernet
services for government that will help
enable future growth and support
advanced initiatives like e-government.
It’s built for government.
to 10Gbps, traffi c prioritization and
network capacity.
WITHTECHNOLOGY FROM THE ’80s?
WHY ADDRESS THEISSUES OF 2014
BUSINESS.COMCAST.COM/GOVERNMENT866-429-2241
100 Blue Ravine RoadFolsom, CA 95630916-932-1300
Page #
__________Designer __________Creative Dir.
__________Editorial __________Prepress
__________Other ____________OK to go
5 25 50 75 95 100 5 25 50 75 95 100 5 25 50 75 95 100 5 25 50 75 95 100
BLACKYELLOW
MAGENTACYAN
A few weeks ago, on a walk-the-streets visit to New York, I found myself in the middle of a clump of foreigners getting
a grand introduction to Harlem. As we gazed at the newly pricey brownstones and lively commercial boulevards, an agitated local resident slipped in to give the visitors a lesson in reality. “Don’t be fooled,” the man warned. “This place is still full of guns and drugs. This ain’t heaven up here.”
The fact that he was telling the truth was less interesting to me than that he felt obligated to make his case. But he did have to. On a sunny Saturday at the start of 2014, Harlem looked so improbably good that it was easy for a visitor to place its troubles in a remote intellectual compart-ment. If you were visiting from Denmark, you might be justifi ed in puzzling over why Harlem had a dangerous reputation.
The following day, scanning over some local headlines from the backseat of a cab, I came across one that brought back echoes of the not-too-distant past: “Mug-ging reported in Central Park.” I was fairly sure that 20 years ago, that wouldn’t have been news. Not because muggings didn’t take place in the park, but because they took place all the time. One more mugging wouldn’t have been enough to touch the antennae of tabloid journalism.
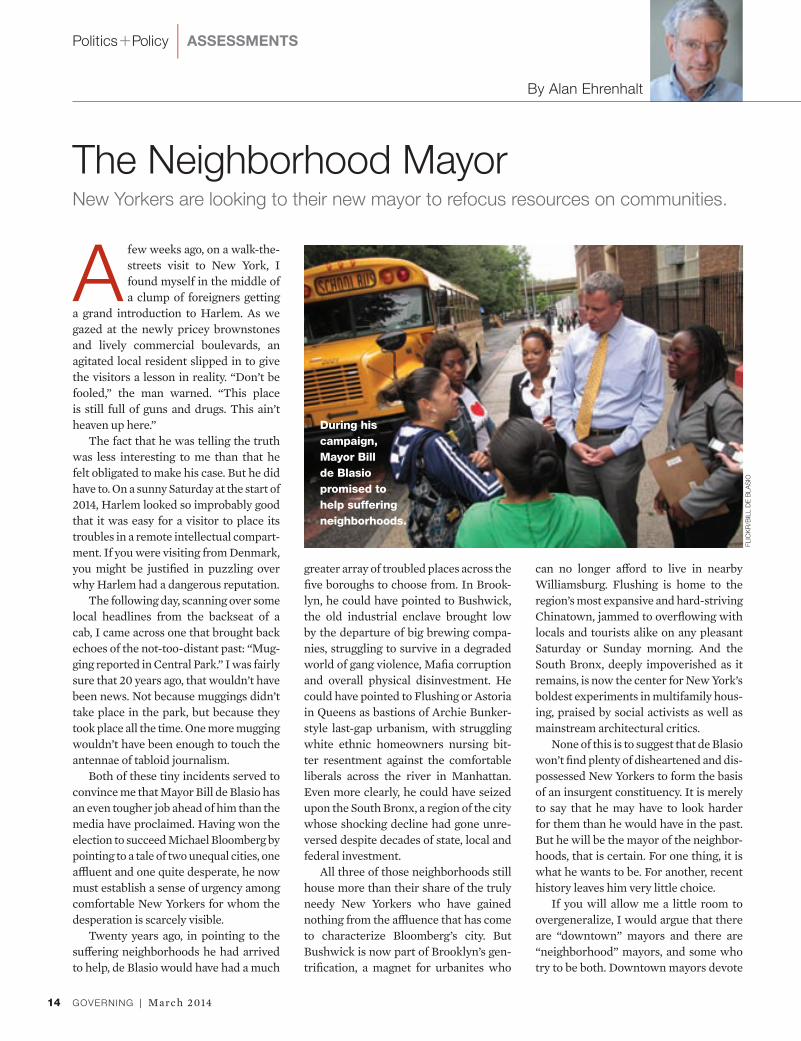
Both of these tiny incidents served to convince me that Mayor Bill de Blasio has an even tougher job ahead of him than the media have proclaimed. Having won the election to succeed Michael Bloomberg by pointing to a tale of two unequal cities, one affl uent and one quite desperate, he now must establish a sense of urgency among comfortable New Yorkers for whom the desperation is scarcely visible.
Twenty years ago, in pointing to the suff ering neighborhoods he had arrived to help, de Blasio would have had a much
greater array of troubled places across the fi ve boroughs to choose from. In Brook-lyn, he could have pointed to Bushwick, the old industrial enclave brought low by the departure of big brewing compa-nies, struggling to survive in a degraded world of gang violence, Mafi a corruption and overall physical disinvestment. He could have pointed to Flushing or Astoria in Queens as bastions of Archie Bunker-style last-gap urbanism, with struggling white ethnic homeowners nursing bit-ter resentment against the comfortable liberals across the river in Manhattan. Even more clearly, he could have seized upon the South Bronx, a region of the city whose shocking decline had gone unre-versed despite decades of state, local and federal investment.
All three of those neighborhoods still house more than their share of the truly needy New Yorkers who have gained nothing from the affl uence that has come to characterize Bloomberg’s city. But Bushwick is now part of Brooklyn’s gen-trifi cation, a magnet for urbanites who
can no longer aff ord to live in nearby Williamsburg. Flushing is home to the region’s most expansive and hard-striving Chinatown, jammed to overfl owing with locals and tourists alike on any pleasant Saturday or Sunday morning. And the South Bronx, deeply impoverished as it remains, is now the center for New York’s boldest experiments in multifamily hous-ing, praised by social activists as well as mainstream architectural critics.
None of this is to suggest that de Blasio won’t fi nd plenty of disheartened and dis-possessed New Yorkers to form the basis of an insurgent constituency. It is merely to say that he may have to look harder for them than he would have in the past. But he will be the mayor of the neighbor-hoods, that is certain. For one thing, it is what he wants to be. For another, recent history leaves him very little choice.
If you will allow me a little room to overgeneralize, I would argue that there are “downtown” mayors and there are “neighborhood” mayors, and some who try to be both. Downtown mayors devote
By Alan Ehrenhalt
Politics+Policy | ASSESSMENTS
The Neighborhood MayorNew Yorkers are looking to their new mayor to refocus resources on communities.
GOVERNING | March 201414
During his
campaign,
Mayor Bill
de Blasio
promised to
help suffering
neighborhoods.
FLIC
KR
/BIL
L D
E B
LA
SIO
GOV03_14.indd 14 2/14/14 3:27 PM
100 Blue Ravine RoadFolsom, CA 95630916-932-1300
Page #
__________Designer __________Creative Dir.
__________Editorial __________Prepress
__________Other ____________OK to go
5 25 50 75 95 100 5 25 50 75 95 100 5 25 50 75 95 100 5 25 50 75 95 100
BLACKYELLOW
MAGENTACYAN

major eff orts to reinforcing or rebuild-ing the commercial infrastructure on the theory that the benefi ts of a strong com-mercial core will naturally radiate out to neighborhoods. Usually this means spending money on downtown shopping malls and public transportation, muse-ums and convention centers, and encour-aging the construction of downtown resi-dential projects aimed at attracting more affl uent residents.
Neighborhood mayors win election by catering to the middle-class and work-ing-class communities on the periphery who perceive themselves as having been left out by an administration with an emphasis on the center; pay attention to the periphery, their thinking goes, and downtown will take care of itself. A neighborhood mayor makes extensive commitments to aff ordable housing, whatever that may happen to mean in his place and time; he also places a high emphasis on making public appearances in rarely visited corners of the metropolis, and establishing formal relationships with community groups whose leaders are given conspicuous access to top members of the city administration.
The distinction between downtown mayors and neighborhood mayors is often as much one of rhetoric and media label-ing as it is of actual policy choices. Bloom-berg was widely viewed as the mayor of Manhattan and affl uent inner Brooklyn, even though his administration actually built more than 150,000 units of subsi-dized housing during its 12 years in offi ce, most of them in outer borough locations Bloomberg was repeatedly accused of ignoring. De Blasio ran much of his cam-paign against Wall Street, but it will be impossible for him to ignore the fact that Manhattan’s fi nancial industry provides the city with about 200,000 jobs and per-haps a quarter of its tax base. Even the most passionate neighborhood mayors want downtowns full of high-paying jobs, although they may prefer to talk about other subjects.
But even if the distinction between downtown and neighborhood mayors is less than clear-cut, it’s still useful to
observe that these two kinds of politi-cal leaders tend to alternate with each other. After a term or two of downtown romance, voters look for an urban popu-list eager to raise the concerns of the frustrated periphery. One way to see this is to look at New York over the past half-century or so.
Much of the gulf between center and periphery traces back to John V. Lindsay, who served from 1966 to 1973. Handsome, urbane and liberal, Lindsay never really escaped the perception that he was indif-ferent to the fate of the workaday neigh-borhoods, that he was an elitist politician focused on two widely disparate and limited constituencies: glamorous Man-hattan and the pockets of poverty that surrounded it. He was viewed skepti-cally by the blue-collar neighborhoods of Brooklyn, Queens and the Bronx—the term “limousine liberal” was invented for Lind-say. By the time he left offi ce, it remained only to be seen who would next play the role of neighborhood sympathizer.
Edward I. Koch played it pretty well for three terms ending in 1989. Riding the subways each morning and stopping outside the entrances to ask “How’m I doing?,” Koch persuaded voters in diverse corners of the city that he showed up and listened to their problems. Rudolph W. Giuliani accomplished much the same thing in a diff erent way, using intrusive police tactics to deal with predatory violence that workaday neighborhoods placed fi rst on their list of concerns.
Bloomberg never really had a chance to be a neighborhood mayor. He adopted most of Giuliani’s crime policies and made sure to be photographed riding the subway to work from his East Side town-house, but as a Wall Street entrepreneur who fl ew to Bermuda on weekends, he had only one public persona open to him: that of the benevolent billionaire willing to spend a sizeable chunk of his fortune and his productive years build-ing a city government as rational and competent as the organization he cre-ated in private life. This image played well enough to keep him in offi ce for three terms, but by last year the voters
were tired of it, even though most of them didn’t bother to vote. In retrospect, it all seems foreordained: Bloomberg’s successor would have to be a neigh-borhood mayor. De Blasio pressed that button, and it got him elected.
Ideally, of course, any big-city mayor would like to be the champion of down-town and the neighborhoods at the same time. But very few manage to do it. The mayor who has come closest in recent years is Boston’s Thomas Menino, who retired at the start of this year after a ten-ure that lasted 20 years—longer than that of any other mayor in the city’s history.
Menino wasn’t good-looking, articu-late or exceptionally clever. He didn’t aspire to any job other than mayor of Boston, and he never seemed to be repre-senting one urban cohort against another. He was a mayor for the whole city.
Menino was fortunate. He didn’t have to do anything dramatic to boost down-town Boston: The health care, fi nance and higher education industries took care of that problem essentially on their own. Menino presided benignly over the good news in the center, while devoting the lion’s share of his personal attention to small-scale commercial development in the neighborhoods. “In the years I’ve been in offi ce,” he boasted one day toward the end of his second term, “we’ve built 12 supermarkets.” Those were the small victories Menino was most deter-mined to take credit for—not stadiums or convention centers or aquariums, but grocery stores.
De Blasio should be so lucky. In New York, the economic gap between the cen-ter and the neighborhoods is an important reality. Some of that is the product of his own campaign for mayor. His primary constituency is looking to him to deliver on the redistribution of resources from center to periphery that he talked about during his campaign. But to accomplish that, he has to deal with downtown elites who wonder why a city whose center looks so sleek and prosperous really has to embark on a social revolution. G
Email [email protected]
15March 2014 | GOVERNING
GOV03_14.indd 15 2/18/14 1:16 PM
100 Blue Ravine RoadFolsom, CA 95630916-932-1300
Page #
__________Designer __________Creative Dir.
__________Editorial __________Prepress
__________Other ____________OK to go
5 25 50 75 95 100 5 25 50 75 95 100 5 25 50 75 95 100 5 25 50 75 95 100
BLACKYELLOW
MAGENTACYAN
GOVERNING | March 201416
The democratization of media is messy. Activists, software entre-preneurs and incumbent media players are locked in a high-
stakes search for the next new thing. Inno-vation has been largely at the edges with novel combinations that have not always gone together, but have an appeal to them.
The secret sauce remains elusive, but there is general agreement on the recipe: Content that connects users together in online communities, often driven by a cause, if only at the neighborhood level. All these alliterative words can also pro-duce confusion.
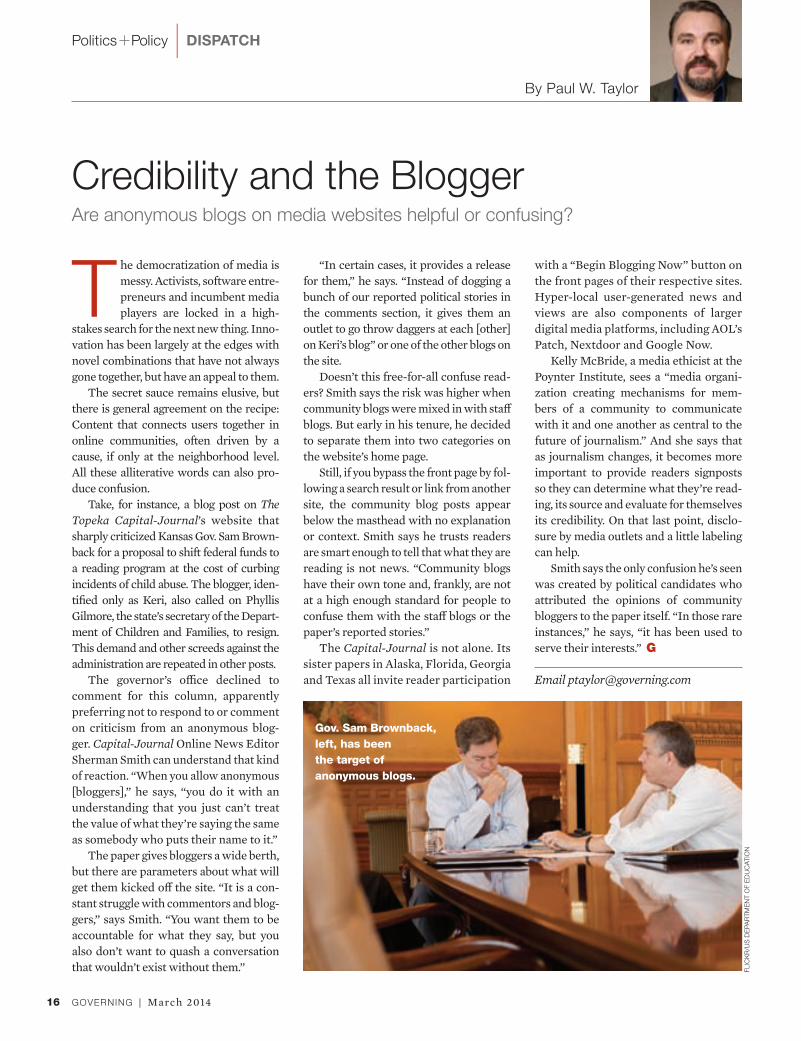
Take, for instance, a blog post on The Topeka Capital-Journal’s website that sharply criticized Kansas Gov. Sam Brown-back for a proposal to shift federal funds to a reading program at the cost of curbing incidents of child abuse. The blogger, iden-tifi ed only as Keri, also called on Phyllis Gilmore, the state’s secretary of the Depart-ment of Children and Families, to resign. This demand and other screeds against the administration are repeated in other posts.
The governor’s offi ce declined to comment for this column, apparently preferring not to respond to or comment on criticism from an anonymous blog-ger. Capital-Journal Online News Editor Sherman Smith can understand that kind of reaction. “When you allow anonymous [bloggers],” he says, “you do it with an understanding that you just can’t treat the value of what they’re saying the same as somebody who puts their name to it.”
The paper gives bloggers a wide berth, but there are parameters about what will get them kicked off the site. “It is a con-stant struggle with commentors and blog-gers,” says Smith. “You want them to be accountable for what they say, but you also don’t want to quash a conversation that wouldn’t exist without them.”
By Paul W. Taylor
Credibility and the BloggerAre anonymous blogs on media websites helpful or confusing?
with a “Begin Blogging Now” button on the front pages of their respective sites. Hyper-local user-generated news and views are also components of larger digital media platforms, including AOL’s Patch, Nextdoor and Google Now.
Kelly McBride, a media ethicist at the Poynter Institute, sees a “media organi-zation creating mechanisms for mem-bers of a community to communicate with it and one another as central to the future of journalism.” And she says that as journalism changes, it becomes more important to provide readers signposts so they can determine what they’re read-ing, its source and evaluate for themselvesits credibility. On that last point, disclo-sure by media outlets and a little labeling can help.
Smith says the only confusion he’s seen was created by political candidates who attributed the opinions of community bloggers to the paper itself. “In those rare instances,” he says, “it has been used to serve their interests.” G
Email [email protected]
“In certain cases, it provides a release for them,” he says. “Instead of dogging a bunch of our reported political stories in the comments section, it gives them an outlet to go throw daggers at each [other] on Keri’s blog” or one of the other blogs on the site.
Doesn’t this free-for-all confuse read-ers? Smith says the risk was higher when community blogs were mixed in with staff blogs. But early in his tenure, he decided to separate them into two categories on the website’s home page.
Still, if you bypass the front page by fol-lowing a search result or link from another site, the community blog posts appear below the masthead with no explanation or context. Smith says he trusts readers are smart enough to tell that what they are reading is not news. “Community blogs have their own tone and, frankly, are not at a high enough standard for people to confuse them with the staff blogs or the paper’s reported stories.”
The Capital-Journal is not alone. Its sister papers in Alaska, Florida, Georgia and Texas all invite reader participation
FLIC
KR
/US
DE
PA
RTM
EN
T O
F E
DU
CA
TIO
N
Politics+Policy | DISPATCH
Gov. Sam Brownback,
left, has been
the target of
anonymous blogs.
GOV03_16.indd 16 2/18/14 11:03 AM
100 Blue Ravine RoadFolsom, CA 95630916-932-1300
Page #
__________Designer __________Creative Dir.
__________Editorial __________Prepress
__________Other ____________OK to go
5 25 50 75 95 100 5 25 50 75 95 100 5 25 50 75 95 100 5 25 50 75 95 100
BLACKYELLOW
MAGENTACYAN
If You Purchased Municipal Derivative Transactions from January 1, 1992 to August 18, 2011
You Could Get a Payment for a Class Action Settlement.A proposed Settlement has been reached with Bank of America, N.A. (“Bank of America”), in a class action lawsuit that alleges price-fixing in the sale of municipal derivatives transactions by Bank of America and other companies. The case, In re Municipal Derivatives Antitrust Litigation, MDL No. 1950, No. 08-02516, is pending in the United States District Court for the Southern District of New York.
Who Is Included in the Settlement?This Settlement includes all state, local and municipal government entities, independent government agencies, quasi-government, non-profit and private entities that purchased:
(1) Municipal derivative transactions through negotiation, competitive bidding or auction, from any Alleged Provider Defendant or Co-Conspirator or brokered by any Alleged Broker Defendant or Co-Conspirator,
(2) Any time from January 1, 1992 through August 18, 2011 in the United States and its territories or for delivery in the United States and its territories.
The Defendants and Co-Conspirators are listed in the detailed notice available on the Settlement website.
What Does the Settlement Provide?Bank of America agreed to a settlement amount of $20 million (plus any funds remaining in the State AG Escrow Fund that, as of the date this Notice is issued, Bank of America has access to pursuant to the terms of the State AG Settlement – this potential additional amount could be between $0 and $1 million) to be paid as follows: $10 million has already been paid into an escrow account and the balance will be paid later. This Settlement is only a partial settlement of the lawsuit because it only affects the claims against Bank of America. The lawsuit is continuing against other Defendants. Morgan Stanley, Wachovia/Wells Fargo, and JPMorgan have already settled. Bank of America will provide reasonable cooperation, including discovery cooperation, to Class Plaintiffs’ Counsel in the litigation that will continue against the other Defendants.
What Do I Do Now?• Remain in the Settlement. To remain in the Settlement
Class and participate in the Settlement, you do not have to do anything now. If the Court approves the Settlement, you give up the right to sue Bank of America for the claims and issues in this case. The Settlement Agreement, specifically Paragraph 1(cc), which is available at www.MunicipalDerivativesSettlement.com, describes in more detail the legal claims that you give up if you stay in the Class. If you remain in the Settlement Class, you still have the right to exclude yourself from any other settlements with other defendants reached in this lawsuit. Claim forms are not available now. Register on
For more information: 1-877-310-0512 www.MunicipalDerivativesSettlement.com
the Settlement website to receive a claim form when it becomes available.
• Exclude yourself from the Settlement. If you do not want to remain in the Settlement Class, you must exclude yourself. You must send a written request for exclusion by first-class mail, postmarked no later than May 6, 2014 to the Settlement Administrator. The detailed notice available on the Settlement website describes the information you are required to include in your request for exclusion. If you exclude yourself, you cannot participate in the Settlement, but you retain your right to sue Bank of America on your own for the claims in this lawsuit.
NOTE: You may receive similar notices regarding proposed settlements with other Defendants (i.e., GE Funding Capital Market Services, Inc., Trinity Funding Co., LLC and Trinity Plus Funding Co., LLC). However, if you wish to exclude yourself from the Bank of America settlement, you must send a separate and specific notice with regard to the Bank of America settlement.
• Object or Comment on the Settlement. If you remain in the Settlement Class and want to object to or comment on the Bank of America Settlement or any part of it, you must file an objection with the Court and deliver a copy to Class Counsel and Bank of America no later than May 6, 2014.
When Will the Court Decide Whether to
Approve the Settlement?The Court has scheduled a hearing on June 6, 2014, at 10 a.m. at the United States District Court for the Southern District of New York, United States Courthouse, 500 Pearl Street, New York, NY 10007, to consider whether to finally approve the Bank of America Settlement as fair, reasonable and adequate, whether to approve Class Counsel’s request for reimbursement of litigation expenses, and to consider any objections.
The Court has appointed the law firms of Hausfeld LLP; Boies, Schiller & Flexner LLP; and Susman Godfrey L.L.P. to serve as Class Counsel and represent all Class Members. If you want to be represented by your own lawyer, you may hire one at your own expense. You or your lawyer may ask to appear and speak at the hearing but are not required to. If you want to be heard by the Court, you must file a written notice of your intention to appear with the Court and deliver a copy to the Class Counsel and Bank of America no later than May 6, 2014. The Court may change the time and date of the hearing. Any change will be posted on the Settlement website.
Get More InformationFor more information on this lawsuit, your rights, or to obtain a list of defendants, call or visit the Settlement website listed below or write to Municipal Derivatives Settlement, c/o Rust Consulting, Inc., P.O. Box 2500, Faribault, MN 55021-9500.
Legal Notice
100 Blue Ravine RoadFolsom, CA 95630916-932-1300
Page #
__________Designer __________Creative Dir.
__________Editorial __________Prepress
__________Other ____________OK to go
5 25 50 75 95 100 5 25 50 75 95 100 5 25 50 75 95 100 5 25 50 75 95 100
BLACKYELLOW
MAGENTACYAN
Rising Inequality, Stagnant MobilityStates and localities must lead in reversing these dangerous trends.
By Peter A. Harkness
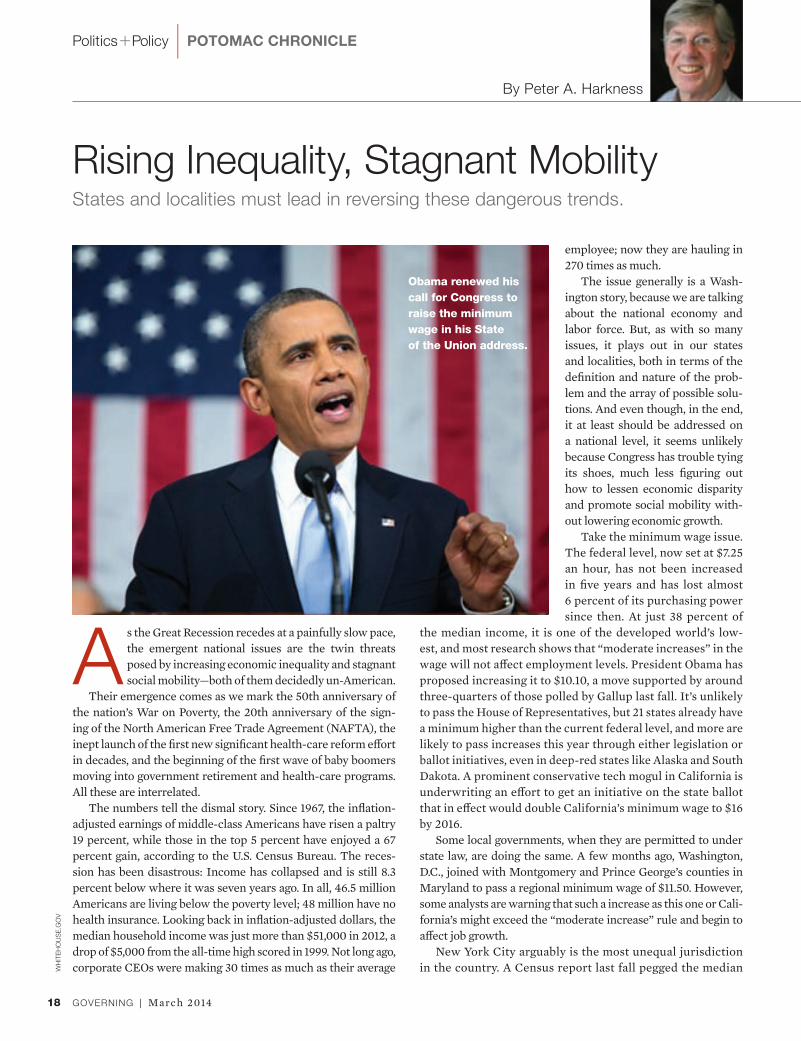
As the Great Recession recedes at a painfully slow pace, the emergent national issues are the twin threats posed by increasing economic inequality and stagnant social mobility—both of them decidedly un-American.
Their emergence comes as we mark the 50th anniversary of the nation’s War on Poverty, the 20th anniversary of the sign-ing of the North American Free Trade Agreement (NAFTA), the inept launch of the fi rst new signifi cant health-care reform eff ort in decades, and the beginning of the fi rst wave of baby boomers moving into government retirement and health-care programs. All these are interrelated.
The numbers tell the dismal story. Since 1967, the infl ation-adjusted earnings of middle-class Americans have risen a paltry 19 percent, while those in the top 5 percent have enjoyed a 67 percent gain, according to the U.S. Census Bureau. The reces-sion has been disastrous: Income has collapsed and is still 8.3 percent below where it was seven years ago. In all, 46.5 million Americans are living below the poverty level; 48 million have no health insurance. Looking back in infl ation-adjusted dollars, the median household income was just more than $51,000 in 2012, a drop of $5,000 from the all-time high scored in 1999. Not long ago, corporate CEOs were making 30 times as much as their average
employee; now they are hauling in 270 times as much.
The issue generally is a Wash-ington story, because we are talking about the national economy and labor force. But, as with so many issues, it plays out in our states and localities, both in terms of the defi nition and nature of the prob-lem and the array of possible solu-tions. And even though, in the end, it at least should be addressed on a national level, it seems unlikely because Congress has trouble tying its shoes, much less fi guring out how to lessen economic disparity and promote social mobility with-out lowering economic growth.
Take the minimum wage issue. The federal level, now set at $7.25 an hour, has not been increased in fi ve years and has lost almost 6 percent of its purchasing power since then. At just 38 percent of
the median income, it is one of the developed world’s low-est, and most research shows that “moderate increases” in the wage will not aff ect employment levels. President Obama has proposed increasing it to $10.10, a move supported by around three-quarters of those polled by Gallup last fall. It’s unlikely to pass the House of Representatives, but 21 states already have a minimum higher than the current federal level, and more are likely to pass increases this year through either legislation or ballot initiatives, even in deep-red states like Alaska and South Dakota. A prominent conservative tech mogul in California is underwriting an eff ort to get an initiative on the state ballot that in eff ect would double California’s minimum wage to $16 by 2016.
Some local governments, when they are permitted to under state law, are doing the same. A few months ago, Washington, D.C., joined with Montgomery and Prince George’s counties in Maryland to pass a regional minimum wage of $11.50. However, some analysts are warning that such a increase as this one or Cali-fornia’s might exceed the “moderate increase” rule and begin to aff ect job growth.
New York City arguably is the most unequal jurisdiction in the country. A Census report last fall pegged the median
Politics+Policy | POTOMAC CHRONICLEW
HIT
EH
OU
SE
.GO
V
GOVERNING | March 201418
Obama renewed his
call for Congress to
raise the minimum
wage in his State
of the Union address.
GOV03_18.indd 18 2/14/14 3:42 PM
100 Blue Ravine RoadFolsom, CA 95630916-932-1300
Page #
__________Designer __________Creative Dir.
__________Editorial __________Prepress
__________Other ____________OK to go
5 25 50 75 95 100 5 25 50 75 95 100 5 25 50 75 95 100 5 25 50 75 95 100
BLACKYELLOW
MAGENTACYAN

By Chris Kardish
Preparing for More Train Wrecks Chicago Mayor Rahm Emanuel calls for a national fee to respond to accidents.
On a warm night outside a small Canadian town in Quebec last July, a 72-car,
unmanned train began to roll down a hill. That train, which was carrying several
tankers of crude oil, ultimately derailed in the heart of downtown Lac-Mégantic,
killing 47 people and leveling 30 downtown buildings.
It was like “Dresden after allied bombing raids in 1945,” said Chicago Mayor
Rahm Emanuel in January at the winter gathering of the U.S. Conference of Mayors.
Emanuel was at the event to, among other things,
propose a national freight fee for hazardous materials
to improve rail safety and help cities respond to the
kind of disasters that destroyed Lac-Mégantic.
As rail transportation surges to meet the demands
of a natural gas boom under way in the U.S., cities
need to take the lead on demanding better oversight,
better safety and more robust ways of responding to
accidents, Emanuel said. He pointed to the derail-
ment of crude oil tankers in Alabama last year and
incidents in North Dakota to illustrate the problem.
According to Emanuel, the federal government
would impose the fee on companies that extract
crude oil and “the industrial consumers of it.” The
fee, in turn, would fund new investments in infrastructure, fi rst responders in the
locations of disasters, and rebuilding efforts. The proposal, which would require
congressional authorization, also calls for broader improvements that include
building safer rail cars, safer railroads and giving local offi cials more information
about the freight entering their cities. “None of us know what’s coming through
our cities,” Emanuel said. “It may be sitting there for days and we may not know.”
The same day Emanuel proposed the fee, the U.S. National Transportation
Safety Board (NTSB) and the Transportation Safety Board of Canada released a
joint statement calling for better route planning that avoids more densely popu-
lated areas. The organizations also recommended stricter rules that correctly clas-
sify hazardous materials before they’re shipped and tougher oversight to ensure
companies have plans for dealing with disasters. (Crude oil shipments by rail have
jumped more than 400 percent since 2005, according to the NTSB.)
It’s not just big-city mayors who should be worried, says Mayor Butch Brown
of Natchez, Miss. Thousands of cars fi lled with crude oil make their way from
Canada each year to Natchez, where they’re transferred to barges headed down
the Mississippi River. “It’s not just critical to the metropolitan areas; it’s very critical
to the smaller areas that have fewer resources to deal with these issues than larger
metropolitan areas do,” he says.
Federal Transportation Secretary Anthony Foxx, who served as mayor of Char-
lotte before his nomination in 2013, says he welcomes all ideas for dealing with
the growing problem, but he adds that broader action is needed on everything
from enforcement to prevention and emergency response. “We’ve got some work
to do convincing our leaders in Congress to give us the resources we need to do
inspections in a much more robust way
and also make sure we have the enforce-
ment mechanisms,” he says.
|
Find out what thefeds are up to at governing.com/fedwatch
FEDWATCH
AP
IMA
GE
S.C
OM
income for the city population’s lowest fi fth at almost $9,000 and for the high-est fi fth at about $225,000. Real estate prices and rents have soared as more of the world’s wealthy pour in. So it’s no surprise that the new mayor, Bill de Blasio, calls himself the mayor “for the 99 percent” (see page 14). He cannot raise the minimum wage because the city doesn’t have that authority, but it’s a good bet he will talk the state legis-lature into allowing it. He has pledged to raise taxes on the wealthy to fund a vastly expanded preschool program and other services. But, as with the minimum wage, he will need to be care-ful since the top 1 percent of taxpayers pay a stunning 43 percent of income taxes. The city’s success economically this past decade will be a key ingredi-ent in solving its inequality problem.
Indeed, the solutions to the inequality and mobility dilemmas touch on myriad issues beyond minimum wages, continu-ing benefi ts for the long-term unemployed or the availability of food stamps. These are safety-net programs designed to ease the pain, which is very real.
To ultimately reverse the trend toward growing inequality and stagnant mobility, our leaders will need to be more aware of the consequences for their own work-force when signing trade agreements, such as NAFTA, which could exacerbate wage disparities.
It will mean that state and local leaders will have to redefi ne what public educa-tion really is—from preschool to the Ph.D. It will involve an expansion in job training and retraining. It will require accepting new technologies, such as massive online learning, to teach more people at a higher level. And it will mean trying to reverse the trend toward one-parent families.
Such massive and far-reaching changes will work best if they do not come from Washington. Sure, the feds must help. But the willingness to experiment, to take risks and achieve signifi cant results must come from businesses, universities, non-profi ts, and states and localities. G
Email [email protected]
19March 2014 | GOVERNING
The train wreck in
Lac-Mégantic last July
GOV03_18.indd 19 2/14/14 3:42 PM
100 Blue Ravine RoadFolsom, CA 95630916-932-1300
Page #
__________Designer __________Creative Dir.
__________Editorial __________Prepress
__________Other ____________OK to go
5 25 50 75 95 100 5 25 50 75 95 100 5 25 50 75 95 100 5 25 50 75 95 100
BLACKYELLOW
MAGENTACYAN
By David Levine
Managed Care MigrainesStates shouldn’t rush to switch from fee-for-service care.
In the never-ending search for ways to deliver quality health care at aff ordable prices, one of the more appealing ideas is moving those on Medicaid or Medicare—or both—into managed care programs. But as several states are learning, it’s not the panacea
they had hoped for.Kentucky, which is expanding Medicaid under the Aff ord-
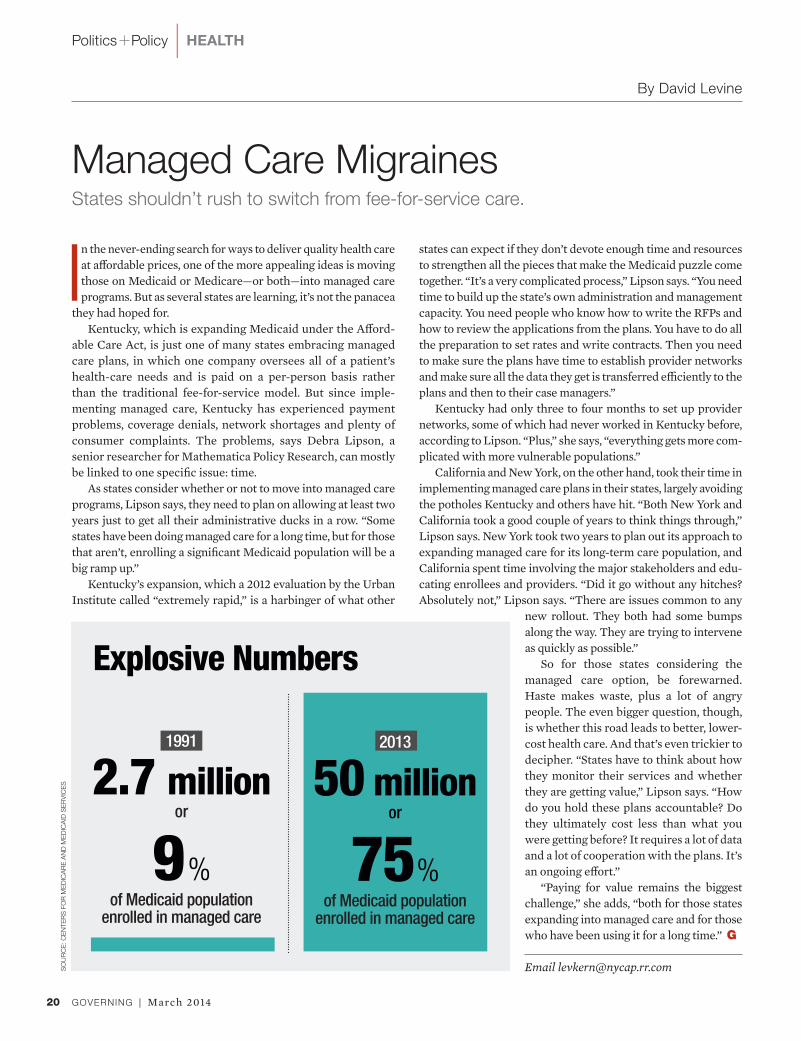
able Care Act, is just one of many states embracing managed care plans, in which one company oversees all of a patient’s health-care needs and is paid on a per-person basis rather than the traditional fee-for-service model. But since imple-menting managed care, Kentucky has experienced payment problems, coverage denials, network shortages and plenty of consumer complaints. The problems, says Debra Lipson, a senior researcher for Mathematica Policy Research, can mostly be linked to one specifi c issue: time.
As states consider whether or not to move into managed care programs, Lipson says, they need to plan on allowing at least two years just to get all their administrative ducks in a row. “Some states have been doing managed care for a long time, but for those that aren’t, enrolling a signifi cant Medicaid population will be a big ramp up.”
Kentucky’s expansion, which a 2012 evaluation by the Urban Institute called “extremely rapid,” is a harbinger of what other
states can expect if they don’t devote enough time and resources to strengthen all the pieces that make the Medicaid puzzle come together. “It’s a very complicated process,” Lipson says. “You need time to build up the state’s own administration and management capacity. You need people who know how to write the RFPs and how to review the applications from the plans. You have to do all the preparation to set rates and write contracts. Then you need to make sure the plans have time to establish provider networks and make sure all the data they get is transferred effi ciently to the plans and then to their case managers.”
Kentucky had only three to four months to set up provider networks, some of which had never worked in Kentucky before, according to Lipson. “Plus,” she says, “everything gets more com-plicated with more vulnerable populations.”
California and New York, on the other hand, took their time in implementing managed care plans in their states, largely avoiding the potholes Kentucky and others have hit. “Both New York and California took a good couple of years to think things through,” Lipson says. New York took two years to plan out its approach to expanding managed care for its long-term care population, and California spent time involving the major stakeholders and edu-cating enrollees and providers. “Did it go without any hitches? Absolutely not,” Lipson says. “There are issues common to any
new rollout. They both had some bumps along the way. They are trying to intervene as quickly as possible.”
So for those states considering the managed care option, be forewarned. Haste makes waste, plus a lot of angry people. The even bigger question, though, is whether this road leads to better, lower-cost health care. And that’s even trickier to decipher. “States have to think about how they monitor their services and whether they are getting value,” Lipson says. “How do you hold these plans accountable? Do they ultimately cost less than what you were getting before? It requires a lot of data and a lot of cooperation with the plans. It’s an ongoing eff ort.”
“Paying for value remains the biggest challenge,” she adds, “both for those states expanding into managed care and for those who have been using it for a long time.” G
Email [email protected]
Politics+Policy | HEALTHS
OU
RC
E:
CE
NTE
RS
FO
R M
ED
ICA
RE
AN
D M
ED
ICA
ID S
ER
VIC
ES
1991
2.7 millionor
9 %
of Medicaid population enrolled in managed care
Explosive Numbers
2013
50 million or
75 % of Medicaid population
enrolled in managed care
GOVERNING | March 201420
GOV03_20.indd 20 2/14/14 4:12 PM
100 Blue Ravine RoadFolsom, CA 95630916-932-1300
Page #
__________Designer __________Creative Dir.
__________Editorial __________Prepress
__________Other ____________OK to go
5 25 50 75 95 100 5 25 50 75 95 100 5 25 50 75 95 100 5 25 50 75 95 100
BLACKYELLOW
MAGENTACYAN
6
You can find more atColonialLife.com/6reasonsgov
1 market expertise We work with 5,000 local governments, 34 state governments and 2,700 educational agencies. So we know the hurdles you face... and how to help you clear them.
2 dedicated service We have teams who work exclusively with government accounts. So we speak your language.
3 benefits that help manage costs We have plans with no direct cost to you. A dream-come-true in the public sector. Or any sector.
4 new ways to save money And lots of them... like reduced enrollment costs, dependent verification, increased employee participation and tax savings.
5 personalized benefits counseling We meet 1-to-1 to help everybody get the benefits that are best for them. Which is also best for you.6 good hard work We believe in the benefits of good hard work. Just like you.
REASONS WHY BENEFIT ADMINISTRATORS IN GOVERNMENT CHOOSE COLONIAL LIFE
For 75 years, Colonial Life has been the gold standard in voluntary benefits.
Source: Colonial Life Proprietary Research 2013 © 2014 Colonial Life & Accident Insurance Company. Colonial Life products are underwritten by Colonial Life & Accident Insurance Company, for which Colonial Life is the marketing brand.
DISABILITY ACCIDENT LIFE CRITICAL ILLNESS CANCER
100 Blue Ravine RoadFolsom, CA 95630916-932-1300
Page #
__________Designer __________Creative Dir.
__________Editorial __________Prepress
__________Other ____________OK to go
5 25 50 75 95 100 5 25 50 75 95 100 5 25 50 75 95 100 5 25 50 75 95 100
BLACKYELLOW
MAGENTACYAN

By Elizabeth Daigneau
Yellow Is the New GreenLocalities are looking to ban pesticides. Should they be allowed to?
Politics+Policy | GREEN GOVERNMENT
GOVERNING | March 201422
In 1962, Rachel Carson published her controversial environmen-tal classic, Silent Spring. In it, Carson, a marine biologist and conservationist, imagined a world compromised by synthetic pesticides, where nature was irreparably harmed and children
sickened. The book inspired a grassroots environmental move-ment that continues today—a movement that’s seen the passing of the Clean Air and Water acts, the establishment of Earth Day and the creation of the Environmental Protection Agency. Now, in many ways, that movement has come full circle.
This past July, a progressive suburb of 17,000 just outside of Washington, D.C., became the fi rst city of its size to restrict pesti-cide use on private lawns and landscapes. More than 50 years after Carson warned of the dangers of pesticides, Takoma Park, Md., has banned 23 cosmetic lawn pesticides known to pose health risks.
“We want yellow in our lawns, with dandelions,” Julie Taddeo testifi ed before the Takoma Park City Council last July, which unanimously passed the new law. She and fellow resident Cathe-rine Cummings collected more than 450 signatures to get it before the city council. The motivating factor: They want to reduce pes-ticide use for the long-term health and safety of their children.
The National Institutes of Health links pesticide use to myriad health risks, especially in children. Of the 30 most commonly used lawn pesticides, for example, 17 are possible or known carcino-gens, 18 have the potential to disrupt the endocrine system and 24 can cause kidney or liver damage, according to the advocacy group Beyond Pesticides. What’s more, pesticides can become pollutants when they’re washed by stormwater into local waterways.
But all pesticides aren’t bad, and the Takoma Park ordinance makes a number of exceptions to the ban, including pesticides
used for public health or safety; control of noxious weeds; and protection of natural resources from invasive species.
Similar restrictions have been in place in most Canadian provinces for years, and several U.S. cities restrict pesticide use on public lands. Late last year, the Kauai and Hawaii County councils in Hawaii passed laws restricting the use of pesticides and genetically modifi ed organisms (GMOs). Hawaii County’s rules ban biotech giants from the island and prohibit the new planting of GMO crops. Kauai’s rules require disclosures from anyone growing GMOs or spraying agricultural pesticides, and create pesticide-free buff er zones near schools, parks, hospitals and homes.
The Takoma Park law, as well as Kauai and Hawaii County’s laws, are possible because Maryland and Hawaii are two of just nine states that do not prohibit the adoption of local pesticide legislation. But that could change: In January, a bill was intro-duced in the Hawaii State House of Representatives that would preempt local governments from restricting the use of hazardous pesticides and GMO crops.
Similar bills have been introduced in Maryland in the past as well. Takoma Park Councilman Timothy Male says he has reached out to state representatives to stress the importance of local control. “What was appealing about [our law] was that com-munity members were asking how much risk they were willing to take,” says Male. “The community came together and said they didn’t want pesticides. I like the idea that a community gets to weigh in on what they will tolerate.” G
Email [email protected]
FLIC
KR
/PE
R J
EN
SE
N
GOV03_22.indd 22 2/14/14 3:44 PM
100 Blue Ravine RoadFolsom, CA 95630916-932-1300
Page #
__________Designer __________Creative Dir.
__________Editorial __________Prepress
__________Other ____________OK to go
5 25 50 75 95 100 5 25 50 75 95 100 5 25 50 75 95 100 5 25 50 75 95 100
BLACKYELLOW
MAGENTACYAN
100 Blue Ravine RoadFolsom, CA 95630916-932-1300
Page #
__________Designer __________Creative Dir.
__________Editorial __________Prepress
__________Other ____________OK to go
5 25 50 75 95 100 5 25 50 75 95 100 5 25 50 75 95 100 5 25 50 75 95 100
BLACKYELLOW
MAGENTACYAN

story. Most of the transportation changes implemented by New York City Mayor Michael Bloomberg and his Department of Transportation Commissioner Janette Sadik-Khan were not original ideas. The real lesson to take away from New York is less the ideas than the implementation strategy. It’s about a mayor who provided
air cover and empowerment to his depart-ment chief. And about a commissioner who used very low-cost pilot projects, often done with little more than cans of paint, to create working demonstration projects without getting bogged down in endless planning studies and red tape.
True, some cities have better ideas than others. But the bigger divide is between can-do and can’t-do cities, or
How to Harvest Good IdeasJust as seeds need soil to grow, innovation requires nurturing too.
In an era of creativity we have come to fetishize the idea. That’s why every inno-vation competition is about coming up with the best new ideas. It’s as though
the idea itself has the power to generate transformation. Yet, if it’s never imple-mented, even the best idea is of no value.
This has been clearly shown in Rhode Island, the birthplace of the Industrial Rev-olution in America. The state has been in economic decline far longer than the Mid-west’s Rust Belt, prompting many a search for a solution. As one local TV reporter noted, proposals have been piling up since the Eisenhower administration, with none of them ever really implemented.
One such plan that still looms large in civic consciousness was the 1983 Green-house Compact. Spearheaded by Ira Mag-aziner (who would later go on to be the architect of Hillarycare), the Greenhouse Compact was a remarkably thorough and prescient 1,000-page analysis of Rhode Island’s economy with a set of compre-hensive solutions proposed to address them. Still, the public overwhelmingly voted it down in 1984.
With no serious turnaround plan ever implemented, the civic trajectory has, unsurprisingly, continued downward; Rhode Island today is among the worst economic performers in the country. Five years after the Great Recession ended, the state still has one of the nation’s high-est unemployment rates at 9.1 percent.
The situation reminds me of the Bible’s parable of the sower; it depicts a farmer scattering seeds. Some of the seeds land in the rocks and are eaten by birds. Others land in the weeds and get choked off . But some land in good soil and fl ourish.
The typical civic mindset conceives of the problem as too few seeds or the wrong kinds of seeds. If only the community hit upon the right kind of seeds or ideas, the thinking goes, it would thrive. But the
reality in most places is that there sim-ply isn’t enough good soil to germinate the seeds. Most communities I visit have great ideas raining down on them every day. The people I meet often blow me away with what they come up with. But most of the good ideas are landing on the rocks or in the weeds.
The challenge in places like Rhode Island is not necessarily coming up with amazing ideas, but rather in coming up with ideas that have cultural resonance such that they appeal to the average person. There must also be a political path to implementation.
Indeed, if you look at the cities that have achieved notice for their accom-plishments, it’s usually as much or more an implementation story than an idea
By Aaron M. Renn
Politics+Policy | ECONOMIC ENGINES
SH
UTTE
RS
TO
CK
.CO
M
GOVERNING | March 201424
GOV03_24.indd 24 2/14/14 4:01 PM
100 Blue Ravine RoadFolsom, CA 95630916-932-1300
Page #
__________Designer __________Creative Dir.
__________Editorial __________Prepress
__________Other ____________OK to go
5 25 50 75 95 100 5 25 50 75 95 100 5 25 50 75 95 100 5 25 50 75 95 100
BLACKYELLOW
MAGENTACYAN
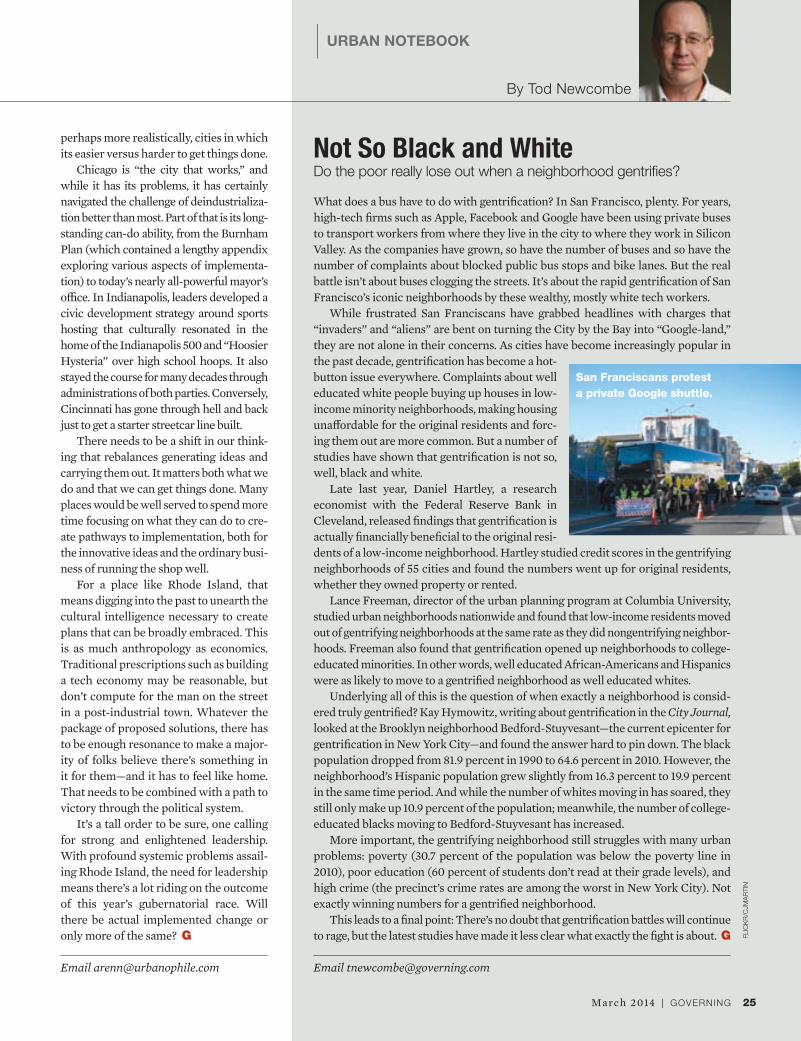
perhaps more realistically, cities in which its easier versus harder to get things done.
Chicago is “the city that works,” and while it has its problems, it has certainly navigated the challenge of deindustrializa-tion better than most. Part of that is its long-standing can-do ability, from the Burnham Plan (which contained a lengthy appendix exploring various aspects of implementa-tion) to today’s nearly all-powerful mayor’s offi ce. In Indianapolis, leaders developed a civic development strategy around sports hosting that culturally resonated in the home of the Indianapolis 500 and “Hoosier Hysteria” over high school hoops. It also stayed the course for many decades through administrations of both parties. Conversely, Cincinnati has gone through hell and back just to get a starter streetcar line built.
There needs to be a shift in our think-ing that rebalances generating ideas and carrying them out. It matters both what we do and that we can get things done. Many places would be well served to spend more time focusing on what they can do to cre-ate pathways to implementation, both for the innovative ideas and the ordinary busi-ness of running the shop well.
For a place like Rhode Island, that means digging into the past to unearth the cultural intelligence necessary to create plans that can be broadly embraced. This is as much anthropology as economics. Traditional prescriptions such as building a tech economy may be reasonable, but don’t compute for the man on the street in a post-industrial town. Whatever the package of proposed solutions, there has to be enough resonance to make a major-ity of folks believe there’s something in it for them—and it has to feel like home. That needs to be combined with a path to victory through the political system.
It’s a tall order to be sure, one calling for strong and enlightened leadership. With profound systemic problems assail-ing Rhode Island, the need for leadership means there’s a lot riding on the outcome of this year’s gubernatorial race. Will there be actual implemented change or only more of the same? G
Email [email protected]
By Tod Newcombe
| URBAN NOTEBOOK
Not So Black and White Do the poor really lose out when a neighborhood gentrifi es?
What does a bus have to do with gentrifi cation? In San Francisco, plenty. For years, high-tech fi rms such as Apple, Facebook and Google have been using private buses to transport workers from where they live in the city to where they work in Silicon Valley. As the companies have grown, so have the number of buses and so have the number of complaints about blocked public bus stops and bike lanes. But the real battle isn’t about buses clogging the streets. It’s about the rapid gentrifi cation of San Francisco’s iconic neighborhoods by these wealthy, mostly white tech workers.
While frustrated San Franciscans have grabbed headlines with charges that “invaders” and “aliens” are bent on turning the City by the Bay into “Google-land,” they are not alone in their concerns. As cities have become increasingly popular in the past decade, gentrifi cation has become a hot-button issue everywhere. Complaints about well educated white people buying up houses in low-income minority neighborhoods, making housing unaff ordable for the original residents and forc-ing them out are more common. But a number of studies have shown that gentrifi cation is not so, well, black and white.
Late last year, Daniel Hartley, a research economist with the Federal Reserve Bank in Cleveland, released fi ndings that gentrifi cation is actually fi nancially benefi cial to the original resi-dents of a low-income neighborhood. Hartley studied credit scores in the gentrifying neighborhoods of 55 cities and found the numbers went up for original residents, whether they owned property or rented.
Lance Freeman, director of the urban planning program at Columbia University, studied urban neighborhoods nationwide and found that low-income residents moved out of gentrifying neighborhoods at the same rate as they did nongentrifying neighbor-hoods. Freeman also found that gentrifi cation opened up neighborhoods to college-educated minorities. In other words, well educated African-Americans and Hispanics were as likely to move to a gentrifi ed neighborhood as well educated whites.
Underlying all of this is the question of when exactly a neighborhood is consid-ered truly gentrifi ed? Kay Hymowitz, writing about gentrifi cation in the City Journal, looked at the Brooklyn neighborhood Bedford-Stuyvesant—the current epicenter for gentrifi cation in New York City—and found the answer hard to pin down. The black population dropped from 81.9 percent in 1990 to 64.6 percent in 2010. However, the neighborhood’s Hispanic population grew slightly from 16.3 percent to 19.9 percent in the same time period. And while the number of whites moving in has soared, they still only make up 10.9 percent of the population; meanwhile, the number of college-educated blacks moving to Bedford-Stuyvesant has increased.
More important, the gentrifying neighborhood still struggles with many urban problems: poverty (30.7 percent of the population was below the poverty line in 2010), poor education (60 percent of students don’t read at their grade levels), and high crime (the precinct’s crime rates are among the worst in New York City). Not exactly winning numbers for a gentrifi ed neighborhood.
This leads to a fi nal point: There’s no doubt that gentrifi cation battles will continue to rage, but the latest studies have made it less clear what exactly the fi ght is about. G
Email [email protected]
25March 2014 | GOVERNING
FLIC
KR
/CJM
AR
TIN
San Franciscans protest
a private Google shuttle.
GOV03_24.indd 25 2/14/14 4:01 PM
100 Blue Ravine RoadFolsom, CA 95630916-932-1300
Page #
__________Designer __________Creative Dir.
__________Editorial __________Prepress
__________Other ____________OK to go
5 25 50 75 95 100 5 25 50 75 95 100 5 25 50 75 95 100 5 25 50 75 95 100
BLACKYELLOW
MAGENTACYAN

FROM SEA TO
MAUI, HI
awards received from more than a dozen
independent competitions and surveys.
federal and state government partners
honored.
of the top 11 Best of the Web awards, including first place for TN.gov.
106 2110
©2014 NIC Inc.
NIC congratulates all of its partnersof providing eGovernment services,
solutions that make life easier
nmf
100 Blue Ravine RoadFolsom, CA 95630916-932-1300
Page #
__________Designer __________Creative Dir.
__________Editorial __________Prepress
__________Other ____________OK to go
5 25 50 75 95 100 5 25 50 75 95 100 5 25 50 75 95 100 5 25 50 75 95 100
BLACKYELLOW
MAGENTACYAN

SHINING SEA
NEWPORT, RI
mmM I S S I S S I P P I ’ S O F F I C I A L S T A T E W E B S I T Eovo
NIC salutes our federal, state, and local government partners for another award-winning year.
For a complete list of honors our partners received last year, visit www.egov.com/awards.
s,r
nationwide for another award-winning yearmobile apps, websites, and paymentfor citizens and businesses.
100 Blue Ravine RoadFolsom, CA 95630916-932-1300
Page #
__________Designer __________Creative Dir.
__________Editorial __________Prepress
__________Other ____________OK to go
5 25 50 75 95 100 5 25 50 75 95 100 5 25 50 75 95 100 5 25 50 75 95 100
BLACKYELLOW
MAGENTACYAN

2828
By Zach Patton
Hungry Again
GOVERNING | March 2014
GOV03_28.indd 28 2/18/14 11:51 AM
100 Blue Ravine RoadFolsom, CA 95630916-932-1300
Page #
__________Designer __________Creative Dir.
__________Editorial __________Prepress
__________Other ____________OK to go
5 25 50 75 95 100 5 25 50 75 95 100 5 25 50 75 95 100 5 25 50 75 95 100
BLACKYELLOW
MAGENTACYAN

29March 2014 | GOVERNING
America’s hunger rate has trended back up in the last few years. States can fi ght it—up to a point.
Amy Blakley was a little worried about the mess.
A fi rst-grade teacher at Davis Elementary in
Shannon Hills, Ark., just southwest of Little
Rock, Blakley was eager to implement a new
“breakfast in the classroom” plan. The school
had long off ered breakfast in the cafeteria for students
from low-income households. But the new program, which
launched at Davis this past fall, uses state and federal funds
to pay for universal free breakfast in the classroom. “I was
really excited,” says Blakley, “but I’m also thinking, ‘How
am I going to get these kids fed and clean up and still do
what I need to do as a teacher?’”
Like educators in classrooms all over the country, Blak-
ley had seen fi rsthand the problems of childhood hunger.
Kids would arrive hungry, complaining of headaches and
having a hard time focusing. Sometimes they’d steal from
other students’ trays at lunch. Blakley says she’d always
been aware of the issue. “But it seemed to escalate over the
past two or three years,” as more and more students arrived
without having had enough to eat.
SH
UTTE
RS
TO
CK
.CO
M
GOV03_28.indd 29 2/18/14 11:51 AM
100 Blue Ravine RoadFolsom, CA 95630916-932-1300
Page #
__________Designer __________Creative Dir.
__________Editorial __________Prepress
__________Other ____________OK to go
5 25 50 75 95 100 5 25 50 75 95 100 5 25 50 75 95 100 5 25 50 75 95 100
BLACKYELLOW
MAGENTACYAN
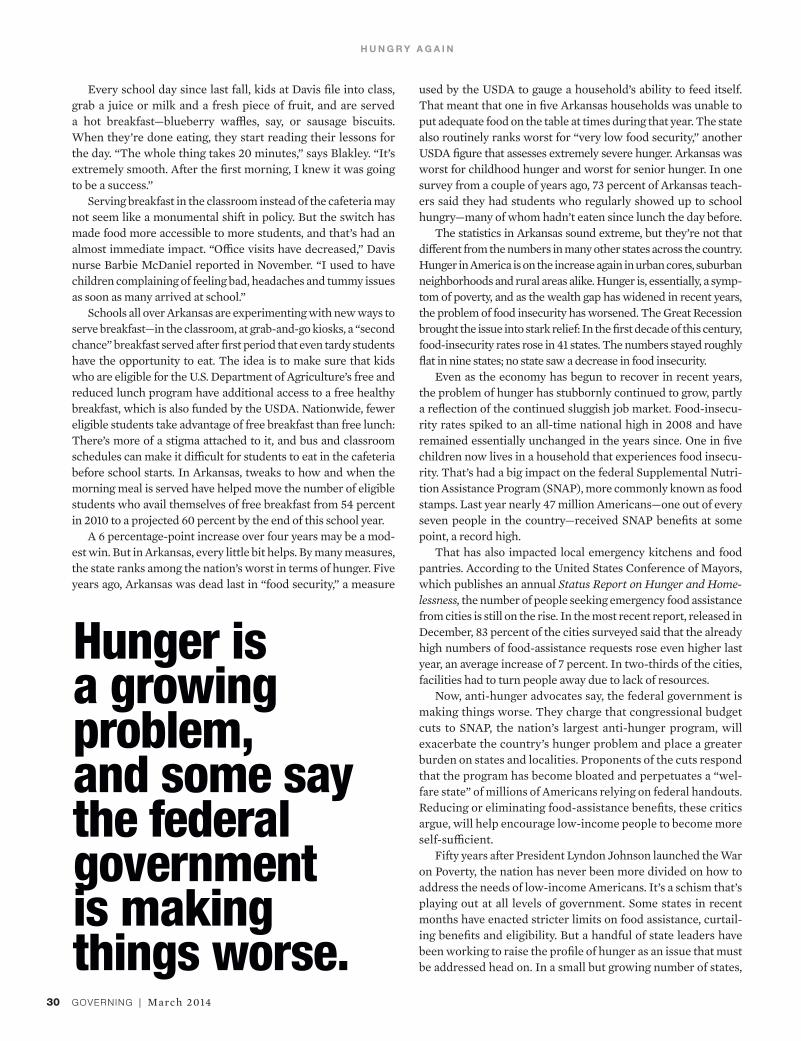
GOVERNING | March 2014
used by the USDA to gauge a household’s ability to feed itself. That meant that one in fi ve Arkansas households was unable to put adequate food on the table at times during that year. The state also routinely ranks worst for “very low food security,” another USDA fi gure that assesses extremely severe hunger. Arkansas was worst for childhood hunger and worst for senior hunger. In one survey from a couple of years ago, 73 percent of Arkansas teach-ers said they had students who regularly showed up to school hungry—many of whom hadn’t eaten since lunch the day before.
The statistics in Arkansas sound extreme, but they’re not that diff erent from the numbers in many other states across the country. Hunger in America is on the increase again in urban cores, suburban neighborhoods and rural areas alike. Hunger is, essentially, a symp-tom of poverty, and as the wealth gap has widened in recent years, the problem of food insecurity has worsened. The Great Recession brought the issue into stark relief: In the fi rst decade of this century, food-insecurity rates rose in 41 states. The numbers stayed roughly fl at in nine states; no state saw a decrease in food insecurity.
Even as the economy has begun to recover in recent years, the problem of hunger has stubbornly continued to grow, partly a refl ection of the continued sluggish job market. Food-insecu-rity rates spiked to an all-time national high in 2008 and have remained essentially unchanged in the years since. One in fi ve children now lives in a household that experiences food insecu-rity. That’s had a big impact on the federal Supplemental Nutri-tion Assistance Program (SNAP), more commonly known as food stamps. Last year nearly 47 million Americans—one out of every seven people in the country—received SNAP benefi ts at some point, a record high.
That has also impacted local emergency kitchens and food pantries. According to the United States Conference of Mayors, which publishes an annual Status Report on Hunger and Home-lessness, the number of people seeking emergency food assistance from cities is still on the rise. In the most recent report, released in December, 83 percent of the cities surveyed said that the already high numbers of food-assistance requests rose even higher last year, an average increase of 7 percent. In two-thirds of the cities, facilities had to turn people away due to lack of resources.
Now, anti-hunger advocates say, the federal government is making things worse. They charge that congressional budget cuts to SNAP, the nation’s largest anti-hunger program, will exacerbate the country’s hunger problem and place a greater burden on states and localities. Proponents of the cuts respond that the program has become bloated and perpetuates a “wel-fare state” of millions of Americans relying on federal handouts. Reducing or eliminating food-assistance benefi ts, these critics argue, will help encourage low-income people to become more self-suffi cient.
Fifty years after President Lyndon Johnson launched the War on Poverty, the nation has never been more divided on how to address the needs of low-income Americans. It’s a schism that’s playing out at all levels of government. Some states in recent months have enacted stricter limits on food assistance, curtail-ing benefi ts and eligibility. But a handful of state leaders have been working to raise the profi le of hunger as an issue that must be addressed head on. In a small but growing number of states,
H U N G R Y A G A I N
30
Every school day since last fall, kids at Davis fi le into class, grab a juice or milk and a fresh piece of fruit, and are served a hot breakfast—blueberry waffl es, say, or sausage biscuits. When they’re done eating, they start reading their lessons for the day. “The whole thing takes 20 minutes,” says Blakley. “It’s extremely smooth. After the fi rst morning, I knew it was going to be a success.”
Serving breakfast in the classroom instead of the cafeteria may not seem like a monumental shift in policy. But the switch has made food more accessible to more students, and that’s had an almost immediate impact. “Offi ce visits have decreased,” Davis nurse Barbie McDaniel reported in November. “I used to have children complaining of feeling bad, headaches and tummy issues as soon as many arrived at school.”
Schools all over Arkansas are experimenting with new ways to serve breakfast—in the classroom, at grab-and-go kiosks, a “second chance” breakfast served after fi rst period that even tardy students have the opportunity to eat. The idea is to make sure that kids who are eligible for the U.S. Department of Agriculture’s free and reduced lunch program have additional access to a free healthy breakfast, which is also funded by the USDA. Nationwide, fewer eligible students take advantage of free breakfast than free lunch: There’s more of a stigma attached to it, and bus and classroom schedules can make it diffi cult for students to eat in the cafeteria before school starts. In Arkansas, tweaks to how and when the morning meal is served have helped move the number of eligible students who avail themselves of free breakfast from 54 percent in 2010 to a projected 60 percent by the end of this school year.
A 6 percentage-point increase over four years may be a mod-est win. But in Arkansas, every little bit helps. By many measures, the state ranks among the nation’s worst in terms of hunger. Five years ago, Arkansas was dead last in “food security,” a measure
Hunger is a growing problem, and some say the federal government is making things worse.
GOV03_28.indd 30 2/18/14 11:01 AM
100 Blue Ravine RoadFolsom, CA 95630916-932-1300
Page #
__________Designer __________Creative Dir.
__________Editorial __________Prepress
__________Other ____________OK to go
5 25 50 75 95 100 5 25 50 75 95 100 5 25 50 75 95 100 5 25 50 75 95 100
BLACKYELLOW
MAGENTACYAN

including Arkansas, governors and legislators have made end-ing hunger—especially among children—a key focus. They’re reorganizing to better coordinate with nonprofi ts and food-assistance groups. They’re directing more resources to school breakfasts and summer meal programs. They’re streamlining state processes to better identify individuals and families that qualify for federal help. Most of all, they’ve brought the issue to the political surface.
When John F. Kennedy took offi ce as presi-dent in 1961, his fi rst executive order called for expanded food distribution; two weeks later he announced the creation of new pilot programs for food stamps. By January 1964, when President Johnson announced his
War on Poverty, the food stamps pilot had expanded to 40 coun-ties and three cities in 22 states, serving 380,000 people. That August, Johnson signed the Food Stamp Act, which set up the permanent national program that exists today.
For a long time, food stamps and the national school lunch pro-gram (which began in 1946) enjoyed bipartisan support. Address-ing poverty and hunger—and expanding federal programs to do it—was a key issue for political leaders on both sides of the aisle. President Nixon called the nation’s hunger problem “embarrass-ing and intolerable,” and in 1969 he convened the fi rst-ever (and still the only) White House conference on hunger and nutrition. In
31March 2014 | GOVERNING
the 1970s, Republican Sen. Bob Dole of Kansas became an ardent anti-hunger advocate, working with Democratic Sen. George McGovern of South Dakota to pass legislation that strengthened the food stamps program and made it more accessible. At the state level, Republican governors such as Tommy Thompson of Wis-consin, John Engler of Michigan and George Pataki of New York eagerly promoted food stamps. President George W. Bush was also an avid SNAP supporter; spending on the program doubled during his time in offi ce.
To be sure, there were fi ghts and cuts along the way. The Rea-gan administration pushed through cutbacks in the early 1980s. In the mid-1990s, congressional Republicans enacted cuts in ben-efi ts and eligibility that they felt dovetailed with President Clin-ton’s promise to “end welfare as we know it.” Some states set up onerous registration processes (such as requiring applicants to register one day and then return the following day to pick up an application) or enrollment strictures (such as fi ngerprinting) that dissuaded some people from signing up for benefi ts.
But by the fi rst decade of this century, after the Clinton-era welfare reforms had ended direct federal assistance for millions of Americans, many government leaders saw food stamps as a vital remaining way to provide help to the working poor. The 2009 federal stimulus added $45 billion to the SNAP program to help off set the recession, temporarily increasing average monthly benefi ts by about 20 percent. Just four years ago, in 2010, a New York Times article declared that the “once stigmatized” program now had gained nationwide acceptance: “After a U-turn in the
Trends in prevalence of food insecurity and very low food security in U.S. households, 1995-2012
1995 1999 2003 2007 2011
16
12
8
4
0
Food insecurity (includes low and very low food security)
Very low food securityPerc
ent o
f hou
seho
lds
Prevalence rates for 1996 and 1997 were adjusted for the estimated effects of differences in data collection screening protocols used in those years.
SO
UR
CE
: U
SD
A E
CO
NO
MIC
RE
SE
AR
CH
SE
RV
ICE
; IM
AG
E:
SH
UT
TE
RS
TO
CK
.CO
M
GOV03_28.indd 31 2/14/14 3:21 PM
100 Blue Ravine RoadFolsom, CA 95630916-932-1300
Page #
__________Designer __________Creative Dir.
__________Editorial __________Prepress
__________Other ____________OK to go
5 25 50 75 95 100 5 25 50 75 95 100 5 25 50 75 95 100 5 25 50 75 95 100
BLACKYELLOW
MAGENTACYAN
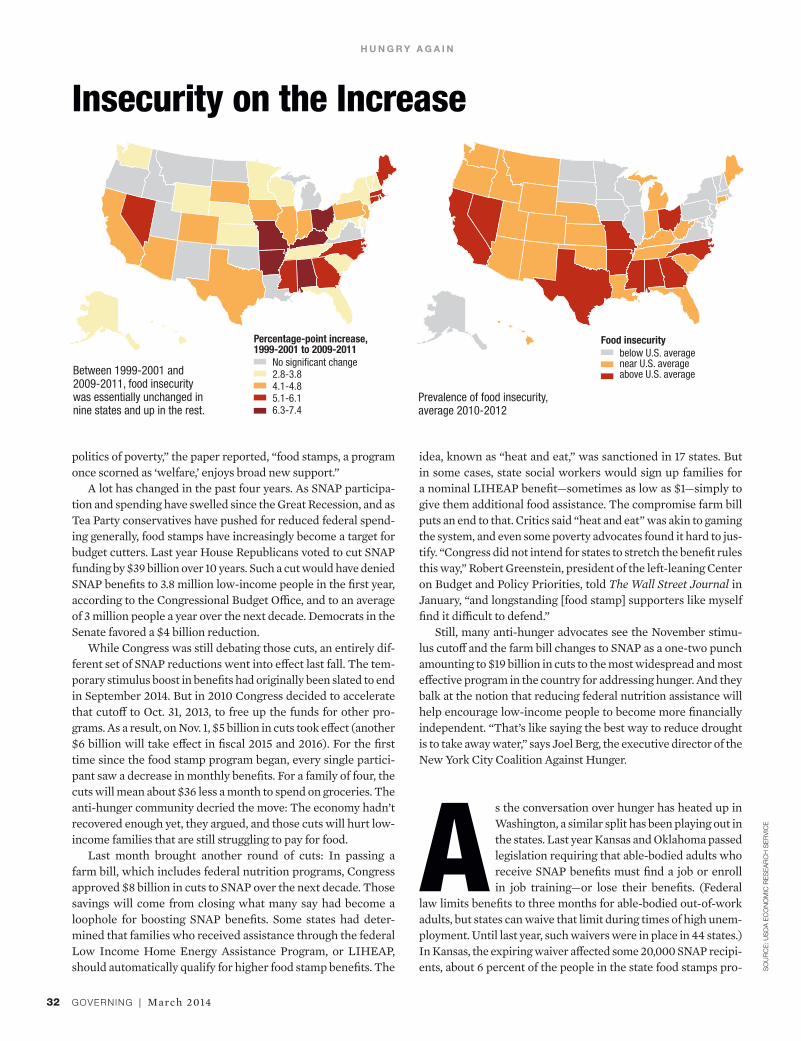
politics of poverty,” the paper reported, “food stamps, a program once scorned as ‘welfare,’ enjoys broad new support.”
A lot has changed in the past four years. As SNAP participa-tion and spending have swelled since the Great Recession, and as Tea Party conservatives have pushed for reduced federal spend-ing generally, food stamps have increasingly become a target for budget cutters. Last year House Republicans voted to cut SNAP funding by $39 billion over 10 years. Such a cut would have denied SNAP benefi ts to 3.8 million low-income people in the fi rst year, according to the Congressional Budget Offi ce, and to an average of 3 million people a year over the next decade. Democrats in the Senate favored a $4 billion reduction.
While Congress was still debating those cuts, an entirely dif-ferent set of SNAP reductions went into eff ect last fall. The tem-porary stimulus boost in benefi ts had originally been slated to end in September 2014. But in 2010 Congress decided to accelerate that cutoff to Oct. 31, 2013, to free up the funds for other pro-grams. As a result, on Nov. 1, $5 billion in cuts took eff ect (another $6 billion will take eff ect in fi scal 2015 and 2016). For the fi rst time since the food stamp program began, every single partici-pant saw a decrease in monthly benefi ts. For a family of four, the cuts will mean about $36 less a month to spend on groceries. The anti-hunger community decried the move: The economy hadn’t recovered enough yet, they argued, and those cuts will hurt low-income families that are still struggling to pay for food.
Last month brought another round of cuts: In passing a farm bill, which includes federal nutrition programs, Congress approved $8 billion in cuts to SNAP over the next decade. Those savings will come from closing what many say had become a loophole for boosting SNAP benefi ts. Some states had deter-mined that families who received assistance through the federal Low Income Home Energy Assistance Program, or LIHEAP, should automatically qualify for higher food stamp benefi ts. The
idea, known as “heat and eat,” was sanctioned in 17 states. But in some cases, state social workers would sign up families for a nominal LIHEAP benefi t—sometimes as low as $1—simply to give them additional food assistance. The compromise farm bill puts an end to that. Critics said “heat and eat” was akin to gaming the system, and even some poverty advocates found it hard to jus-tify. “Congress did not intend for states to stretch the benefi t rules this way,” Robert Greenstein, president of the left-leaning Center on Budget and Policy Priorities, told The Wall Street Journal in January, “and longstanding [food stamp] supporters like myself fi nd it diffi cult to defend.”
Still, many anti-hunger advocates see the November stimu-lus cutoff and the farm bill changes to SNAP as a one-two punch amounting to $19 billion in cuts to the most widespread and most eff ective program in the country for addressing hunger. And they balk at the notion that reducing federal nutrition assistance will help encourage low-income people to become more fi nancially independent. “That’s like saying the best way to reduce drought is to take away water,” says Joel Berg, the executive director of the New York City Coalition Against Hunger.
As the conversation over hunger has heated up in Washington, a similar split has been playing out in the states. Last year Kansas and Oklahoma passed legislation requiring that able-bodied adults who receive SNAP benefi ts must fi nd a job or enroll in job training—or lose their benefi ts. (Federal
law limits benefi ts to three months for able-bodied out-of-work adults, but states can waive that limit during times of high unem-ployment. Until last year, such waivers were in place in 44 states.) In Kansas, the expiring waiver aff ected some 20,000 SNAP recipi-ents, about 6 percent of the people in the state food stamps pro-
H U N G R Y A G A I N
GOVERNING | March 201432
Insecurity on the Increase
Between 1999-2001 and 2009-2011, food insecurity was essentially unchanged in nine states and up in the rest.
Percentage-point increase, 1999-2001 to 2009-2011
No signifi cant change2.8-3.84.1-4.85.1-6.16.3-7.4
SO
UR
CE
: U
SD
A E
CO
NO
MIC
RE
SE
AR
CH
SE
RV
ICE
Prevalence of food insecurity, average 2010-2012
Food insecurity
below U.S. averagenear U.S. averageabove U.S. average
GOV03_28.indd 32 2/14/14 3:23 PM
100 Blue Ravine RoadFolsom, CA 95630916-932-1300
Page #
__________Designer __________Creative Dir.
__________Editorial __________Prepress
__________Other ____________OK to go
5 25 50 75 95 100 5 25 50 75 95 100 5 25 50 75 95 100 5 25 50 75 95 100
BLACKYELLOW
MAGENTACYAN
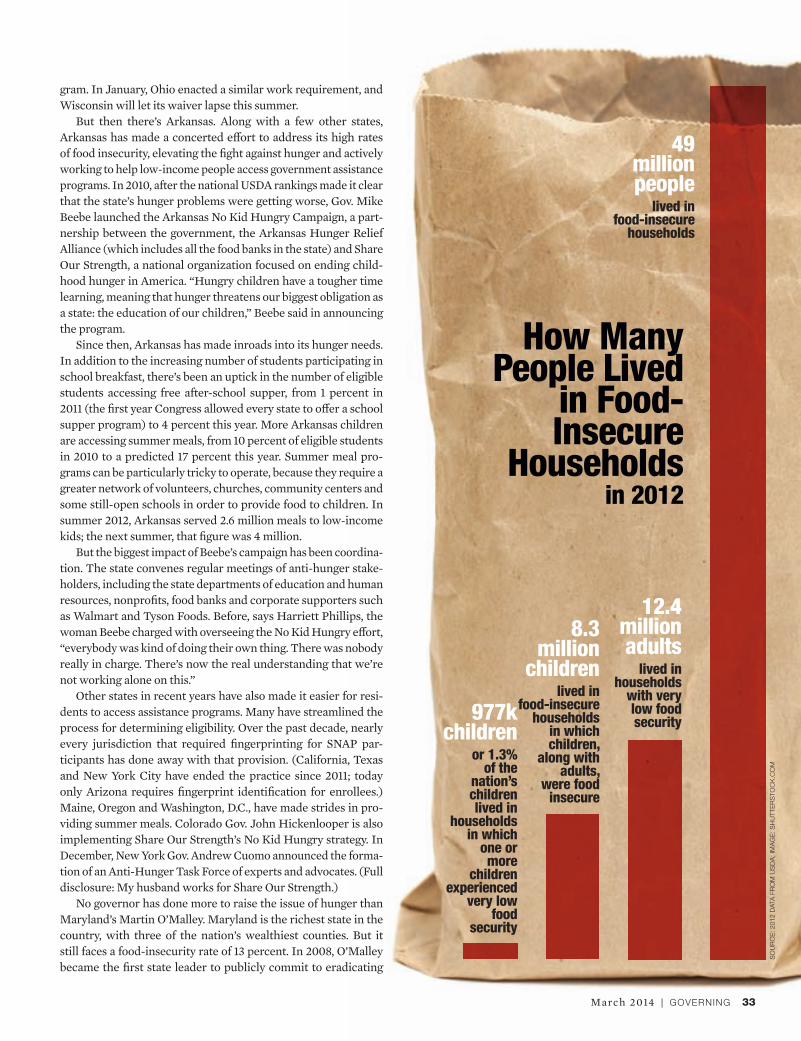
gram. In January, Ohio enacted a similar work requirement, and Wisconsin will let its waiver lapse this summer.
But then there’s Arkansas. Along with a few other states, Arkansas has made a concerted eff ort to address its high rates of food insecurity, elevating the fi ght against hunger and actively working to help low-income people access government assistance programs. In 2010, after the national USDA rankings made it clear that the state’s hunger problems were getting worse, Gov. Mike Beebe launched the Arkansas No Kid Hungry Campaign, a part-nership between the government, the Arkansas Hunger Relief Alliance (which includes all the food banks in the state) and Share Our Strength, a national organization focused on ending child-hood hunger in America. “Hungry children have a tougher time learning, meaning that hunger threatens our biggest obligation as a state: the education of our children,” Beebe said in announcing the program.
Since then, Arkansas has made inroads into its hunger needs. In addition to the increasing number of students participating in school breakfast, there’s been an uptick in the number of eligible students accessing free after-school supper, from 1 percent in 2011 (the fi rst year Congress allowed every state to off er a school supper program) to 4 percent this year. More Arkansas children are accessing summer meals, from 10 percent of eligible students in 2010 to a predicted 17 percent this year. Summer meal pro-grams can be particularly tricky to operate, because they require a greater network of volunteers, churches, community centers and some still-open schools in order to provide food to children. In summer 2012, Arkansas served 2.6 million meals to low-income kids; the next summer, that fi gure was 4 million.
But the biggest impact of Beebe’s campaign has been coordina-tion. The state convenes regular meetings of anti-hunger stake-holders, including the state departments of education and human resources , nonprofi ts, food banks and corporate supporters such as Walmart and Tyson Foods. Before, says Harriett Phillips, the woman Beebe charged with overseeing the No Kid Hungry eff ort, “everybody was kind of doing their own thing. There was nobody really in charge. There’s now the real understanding that we’re not working alone on this.”
Other states in recent years have also made it easier for resi-dents to access assistance programs. Many have streamlined the process for determining eligibility. Over the past decade, nearly every jurisdiction that required fi ngerprinting for SNAP par-ticipants has done away with that provision. (California, Texas and New York City have ended the practice since 2011; today only Arizona requires fi ngerprint identifi cation for enrollees.) Maine, Oregon and Washington, D.C., have made strides in pro-viding summer meals. Colorado Gov. John Hickenlooper is also implementing Share Our Strength’s No Kid Hungry strategy. In December, New York Gov. Andrew Cuomo announced the forma-tion of an Anti-Hunger Task Force of experts and advocates. (Full disclosure: My husband works for Share Our Strength.)
No governor has done more to raise the issue of hunger than Maryland’s Martin O’Malley. Maryland is the richest state in the country, with three of the nation’s wealthiest counties. But it still faces a food-insecurity rate of 13 percent. In 2008, O’Malley became the fi rst state leader to publicly commit to eradicating
33March 2014 | GOVERNING
How Many People Lived
in Food-Insecure
Householdsin 2012
49 million people
lived in food-insecure
households
12.4 million adults
lived in households
with very low food security
8.3 million
children lived in
food-insecure households
in which children,
along with adults,
were food insecure
977k children
or 1.3% of the
nation’s children lived in
households in which
one or more
children experienced
very low food
security
SO
UR
CE
: 2012 D
ATA
FR
OM
US
DA
; IM
AG
E:
SH
UTTE
RS
TO
CK
.CO
M
GOV03_28.indd 33 2/14/14 3:27 PM
100 Blue Ravine RoadFolsom, CA 95630916-932-1300
Page #
__________Designer __________Creative Dir.
__________Editorial __________Prepress
__________Other ____________OK to go
5 25 50 75 95 100 5 25 50 75 95 100 5 25 50 75 95 100 5 25 50 75 95 100
BLACKYELLOW
MAGENTACYAN

GOVERNING | March 201434
1969
1970
1971
1972
1973
1974
1975
1976
1977
1978
1979
1980
1981
1982
1983
1984
1985
1986
1987
1988
1989
1990
1991
1992
1993
1994
1995
1996
1997
1998
1999
2000
2001
2002
2003
2004
2005
2006
2007
2008
2009
2010
2011
2012
2013
50
40
30
20
10
0
SNAP Participation 1969-2013
Average participation, in millions
NOTE: PUERTO RICO INITIATED FOOD STAMP OPERATIONS DURING FY 1975 AND PARTICIPATED THROUGH JUNE OF FY 1982. A SEPARATE NUTRITION ASSISTANCE GRANT BEGAN IN JULY 1982.
SOURCE: USDA; IMAGE: SHUTTERSTOCK.COM
H U N G R Y A G A I N
childhood hunger, and he has made it one of the 16 formally estab-lished goals of his StateStat program, meaning performance data are constantly tracked and updated on the state’s website. In the fi ve-plus years since O’Malley launched the eff ort, Maryland’s school breakfast participation rate has increased by 37 percent; its school lunch rate has risen by 56 percent. The governor fre-quently talks about hunger in his speeches, including his recent State of the State address.
What’s really attractive to the program managers in Arkan-sas and Maryland is that the benefi ts themselves are funded by the federal government. For that reason, however, state eff orts to boost participation can be a bit of a double-edged sword. The more successful they are at getting eligible individuals connected to federal assistance, the bigger and more expensive those federal programs grow. The Congressional Budget Offi ce has estimated that two-thirds of the recent national increase in the number of people receiving SNAP benefi ts is attributable to the tough economy. The other third is from states working to enroll more people. If states become more adept at identifying and processing eligible individuals—if the programs in Arkansas and Maryland and elsewhere do become more widespread—there will almost certainly be bigger fi ghts in Congress over the future of funding the fi ght against hunger.
The simplest thing about the anti-hunger eff ort is that there’s a very straightforward way to address it: Feed people who are hungry. Whether through school meals, emergency food banks or vouchers like SNAP, it’s a problem with a very identifi able solution—not an easy solution to bring about, but a simple one to grasp.
What those eff orts fail to do is address the root causes of pov-erty and hunger. And that’s a whole lot harder. “You can mitigate hunger without addressing poverty,” says Stacy Dean, vice presi-dent for food assistance policy at the Center on Budget and Policy Priorities. “But there can be more comprehensive solutions that don’t just involve the federal nutritional programs.” She applauds state eff orts to increase participation. But she says there’s a nec-essary next step: a commitment to tackling the issues of inequal-ity that cause hunger in the fi rst place. “We certainly don’t want governors thinking, ‘If I just pull lever X and lever Y, I’ll solve childhood hunger.’” It’s more complicated than that.
“States really can be laboratories of food democracy,” says New York City’s Berg. “I think it’s great what some of the governors are doing.” But right now, he adds, “they’re just going to continue to be outgunned by the size of the federal cuts.” G
Email [email protected]
GOV03_28.indd 34 2/14/14 3:28 PM
100 Blue Ravine RoadFolsom, CA 95630916-932-1300
Page #
__________Designer __________Creative Dir.
__________Editorial __________Prepress
__________Other ____________OK to go
5 25 50 75 95 100 5 25 50 75 95 100 5 25 50 75 95 100 5 25 50 75 95 100
BLACKYELLOW
MAGENTACYAN
Help state and local governments better understand the fundamentals of finance and good fiscal stewardship.
2014FINANCIAL LITERACY PROGRAM
FOR MORE INFORMATION, CONTACT:
Erin Waters, Publisher, [email protected]
202.862.1453
Look for the Finance Literacy Handbook coming in the fall
GOV14 AD Financial Literacy.indd 2 1/29/14 3:03 PM
100 Blue Ravine RoadFolsom, CA 95630916-932-1300
Page #
__________Designer __________Creative Dir.
__________Editorial __________Prepress
__________Other ____________OK to go
5 25 50 75 95 100 5 25 50 75 95 100 5 25 50 75 95 100 5 25 50 75 95 100
BLACKYELLOW
MAGENTACYAN

GOVERNING | March 201436
Chicago Gra
DA
VID
KID
D
GOV03_36.indd 36 2/14/14 3:29 PM
100 Blue Ravine RoadFolsom, CA 95630916-932-1300
Page #
__________Designer __________Creative Dir.
__________Editorial __________Prepress
__________Other ____________OK to go
5 25 50 75 95 100 5 25 50 75 95 100 5 25 50 75 95 100 5 25 50 75 95 100
BLACKYELLOW
MAGENTACYAN

37March 2014 | GOVERNING
The city is retooling its community colleges to graduate more residents. Some worry the changes aren’t focused on the best kind of jobs. By Chris Kardish
radsGOV03_36.indd 37 2/14/14 3:30 PM
100 Blue Ravine RoadFolsom, CA 95630916-932-1300
Page #
__________Designer __________Creative Dir.
__________Editorial __________Prepress
__________Other ____________OK to go
5 25 50 75 95 100 5 25 50 75 95 100 5 25 50 75 95 100 5 25 50 75 95 100
BLACKYELLOW
MAGENTACYAN

GOVERNING | March 201438
Gabriel Barrington is positioning a small piece of metal onto an engine lathe in the shop room at Richard J. Daley College on Chicago’s South Side. The room is the size of an airplane hangar, but with the raw industrial trappings of a place
devoted to fashioning metal into useful things. After demonstrat-ing how the engine lathe allows him to narrow the diameter of the metal bit, Barrington explains he’s back in school to rack up manufacturing certifi cations and credit hours for an eventual transfer to the Illinois Institute of Technology, where he’d like to earn a bachelor’s degree in manufacturing technology.
A 27-year-old resident of the city’s mostly black Bronzeville neighborhood, Barrington had been working as an uncertifi ed welder—not illegal, but not lucrative—when he read a newspa-per story about major changes at Chicago’s seven city colleges (the local version of community colleges). The changes at City Colleges of Chicago are meant to tailor programs to the skills that employers demand. The story got Barrington’s attention because he wanted to learn complex machining in ways that his existing job didn’t permit. “As a welder,” he says, “you see the stuff that comes off the machines and think, ‘Wow, I’d rather be a part of that.’ There’s just such a wealth of materials and possibility.”
Barrington is a City Colleges dream student. The certifi ca-tions he’d like to get under his belt—welding, blueprinting and the science of measurement—could off er him a better full-time job
than he had when he entered, and if he completes that bachelor’s degree, he’s all but guaranteed higher lifetime earnings.
After taking a hard look over the past several years at why its City Colleges students weren’t graduating in suffi cient num-bers or attracting the attention of employers, Chicago decided to make big changes. Today it’s in the midst of an overhaul that aims to get more certifi cations and diplomas in the hands of stu-dents like Barrington. The initiative seeks to make the two-year city college curriculum more economically relevant and ease the path to completion through direct business input on curriculum, maps for students that show the most effi cient way to reach their
destination and new scheduling that allows students to enter the workforce while they are still studying. The ideas aren’t necessarily new; a small number of institutions across the country have tried them. But Chicago is a seven-col-lege system of 115,000 students, and it’s experimenting with a broad range of strategies in an ambitious eff ort to plug gaps in the region’s workforce needs for years to come.
What city and college offi cials have called “reinvention” is focused in large part on increasing the rate of transfers to bachelor’s degree programs and the number of those earning other post-secondary credentials in fi elds where jobs are plentiful and wages are good. It’s that latter goal that some faculty members have challenged, arguing that City Colleges has become too focused on churning out certifi cations for jobs of limited opportunity. But col-lege offi cials are equally adamant that nothing in the reforms stymies student choices—if anything, they say, those choices are now more informed and better guided.
So far, there is reason for opti-mism: The graduation rate has nearly doubled at the seven campuses since
the overhaul began in 2010, the number of degrees awarded has climbed signifi cantly and City Colleges has attracted the atten-tion of the World Bank, which thinks its new model can be repli-cated elsewhere around the world. But the ultimate impact of the changes won’t be known for years—until it’s possible to see how many students reach the goals envisioned.
City Colleges’ makeover got its start in 2010, when then-Mayor Richard M. Daley signaled a serious overhaul by installing new leaders from the pri-vate sector and giving them two years to develop a plan that would “reinvent the system from top to
bottom.” He recommended Martin Cabrera, a 39-year-old fi nan-cier and founder of an investment bank, as the new chairman of
Gabriel Barrington’s goal is a bachelor’s degree in manufacturing technology.
C H I C A G O G R A D S
AN
A V
AR
GA
S
GOV03_36.indd 38 2/14/14 3:31 PM
100 Blue Ravine RoadFolsom, CA 95630916-932-1300
Page #
__________Designer __________Creative Dir.
__________Editorial __________Prepress
__________Other ____________OK to go
5 25 50 75 95 100 5 25 50 75 95 100 5 25 50 75 95 100 5 25 50 75 95 100
BLACKYELLOW
MAGENTACYAN

39March 2014 | GOVERNING
the board of trustees. To run the sprawling system as chancellor, Daley brought on Cheryl Hyman, an executive at the electric util-ity ComEd. A native of Chicago’s West Side, Hyman is the per-fect choice in many ways. She is a high school dropout who later graduated from City Colleges’ own Olive-Harvey College in 1993. She turned her associate degree into a bachelor’s in computer sci-ence at the Illinois Institute of Technology and climbed the ranks
at ComEd while picking up two master’s degrees, including an MBA from Northwestern University.
She convened groups of faculty, staff , community leaders and outside experts to diagnose the City Colleges’ problems and off er solutions from within the state and around the country. She found that her system’s problems weren’t unique, but they ran deep: Just 7 percent of fi rst-time students attending full time were complet-ing a certifi cate or degree within two or three years, about three times below the national rate for similar institutions. About 80 percent of programs were graduating fewer than 45 people per entering class, and those programs weren’t tied to actual need in the regional economy. Some 54 percent of degree-seeking stu-dents were quitting in their fi rst six months.
To Hyman, it was clear that the City Colleges honored the hal-lowed community college principle of providing access to all, but they weren’t using the vast information at their disposal to track and improve outcomes for all. “My goal became bigger than just City Colleges of Chicago: My goal became how can I shift the paradigm of community colleges nationally? How can I take City Colleges as an example and create an initiative that shows us how we can couple access with success?”
In 2012, newly elected Mayor Rahm Emanuel put his own stamp on the overhaul with the announcement of plans that would eff ectively double down on the goal of boosting completed student certifi cations of “economic value.” He announced a “Col-lege to Careers” program to further revamp the occupational cur-riculum with direct input from employers, fi rmer relationships on the career services side and labor-market analysis of job needs.
Under College to Careers, six of the seven campuses have taken on specializations within City Colleges’ occupational program-ming, each in an area where there is the potential for high job growth in the next decade. More than half of City Colleges’ $520 million capital plan is going to a new campus at Malcolm X Col-lege, the system’s center for training health professionals, and a new transportation, distribution and logistics center at Olive-Harvey College, which specializes in the transportation fi eld.
City Colleges has set several goals it plans to achieve by 2018, including seeing degrees go up 37 percent a year and certifi cations jump 25 percent. The system is also gunning for 55 percent of its students to transfer to four-year schools (up from 42 percent) and 71 percent of those completing occupational certifi cations to have jobs in their areas of study (up from 60 percent).
Borrowing from Valencia College in Orlando, Fla., an award-winning school that graduates about half of full-time students in three years, City Colleges has developed model maps for all of its programs, laying out exact sequences of courses by semester.
Even before students get a map, they are asked by an adviser to choose from among 10 focus areas, such as business and profes-sional services, health care, and information technology. Advisers also determine whether the student intends to transfer to a four-year school. Each focus area comes with lists of the certifi cations that can be earned on the way to an associate or bachelor’s degree, and examples of jobs at each level. A sample for health profes-sions starts with a nurse assistant earning $9 to $12 an hour, builds to basic certifi cations such as medical billing that can earn up to $17 an hour, then goes into advanced certifi cates and associate degrees off ering up to $33 an hour, and fi nally bachelor’s pro-grams at a four-year school. The document even gives the number of jobs expected to be available at each level annually.
It’s the clarity of those maps and the clear connection to phased, achievable outcomes that sets Chicago apart, says Davis Jenkins, a senior researcher at Columbia University’s Community College Research Center. “That is a completely diff erent mindset, and you don’t see that much anywhere except in a few colleges across the country.”
City Colleges is rolling out those road maps for students this semester; in the months that follow, the schools will reinforce them with new scheduling and grouping initiatives. Instead of logging in online at the end of the semester to choose whichever classes are available the next time around, students will automati-cally be enrolled in the course that appears next on their maps. Whole program enrollment will remain the default option, but students will be able to select individual options manually. City Colleges will also start advancing students in the same program together as one group to generate mutual support.
The whole system is built on an increasingly popular idea called “stackable credentials,” in which students are presented with new thresholds of attainment throughout their college experience (each independently qualifying the candidate for increasingly higher-paying jobs). Previously, a certifi cate didn’t necessarily earn credit toward an associate degree. Daley College has never in its history off ered a welding certifi cate for college credit. Now it will not only
C H I C A G O G R A D S
Companies helping to mold the workforce that comes out of community collegesis common enough around the country. But the scope of what is happening in Chicago is different.
GOV03_36.indd 39 2/14/14 3:33 PM
100 Blue Ravine RoadFolsom, CA 95630916-932-1300
Page #
__________Designer __________Creative Dir.
__________Editorial __________Prepress
__________Other ____________OK to go
5 25 50 75 95 100 5 25 50 75 95 100 5 25 50 75 95 100 5 25 50 75 95 100
BLACKYELLOW
MAGENTACYAN
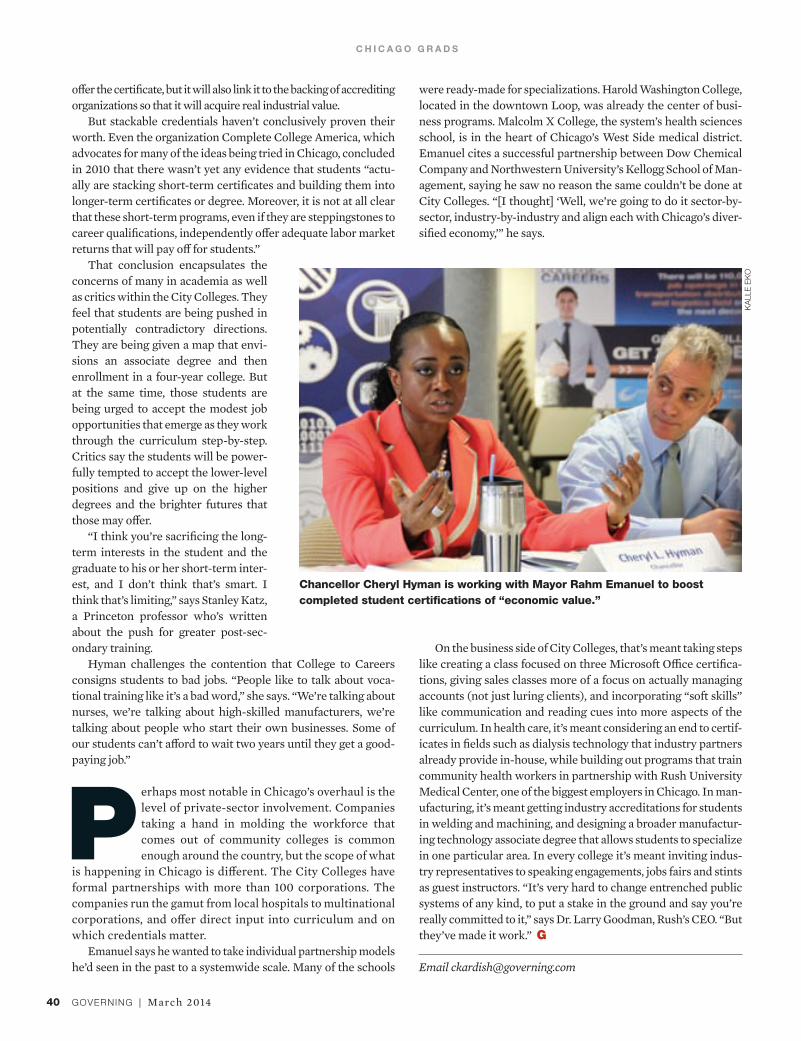
GOVERNING | March 201440
off er the certifi cate, but it will also link it to the backing of accrediting organizations so that it will acquire real industrial value.
But stackable credentials haven’t conclusively proven their worth. Even the organization Complete College America, which advocates for many of the ideas being tried in Chicago, concluded in 2010 that there wasn’t yet any evidence that students “actu-ally are stacking short-term certifi cates and building them into longer-term certifi cates or degree. Moreover, it is not at all clear that these short-term programs, even if they are steppingstones to career qualifi cations, independently off er adequate labor market returns that will pay off for students.”
That conclusion encapsulates the concerns of many in academia as well as critics within the City Colleges. They feel that students are being pushed in potentially contradictory directions. They are being given a map that envi-sions an associate degree and then enrollment in a four-year college. But at the same time, those students are being urged to accept the modest job opportunities that emerge as they work through the curriculum step-by-step. Critics say the students will be power-fully tempted to accept the lower-level positions and give up on the higher degrees and the brighter futures that those may off er.
“I think you’re sacrifi cing the long-term interests in the student and the graduate to his or her short-term inter-est, and I don’t think that’s smart. I think that’s limiting,” says Stanley Katz, a Princeton professor who’s written about the push for greater post-sec-ondary training.
Hyman challenges the contention that College to Careers consigns students to bad jobs. “People like to talk about voca-tional training like it’s a bad word,” she says. “We’re talking about nurses, we’re talking about high-skilled manufacturers, we’re talking about people who start their own businesses. Some of our students can’t aff ord to wait two years until they get a good-paying job.”
Perhaps most notable in Chicago’s overhaul is the level of private-sector involvement. Companies taking a hand in molding the workforce that comes out of community colleges is common enough around the country, but the scope of what
is happening in Chicago is diff erent. The City Colleges have formal partnerships with more than 100 corporations. The companies run the gamut from local hospitals to multinational corporations, and off er direct input into curriculum and on which credentials matter.
Emanuel says he wanted to take individual partnership models he’d seen in the past to a systemwide scale. Many of the schools
were ready-made for specializations. Harold Washington College, located in the downtown Loop, was already the center of busi-ness programs. Malcolm X College, the system’s health sciences school, is in the heart of Chicago’s West Side medical district. Emanuel cites a successful partnership between Dow Chemical Company and Northwestern University’s Kellogg School of Man-agement, saying he saw no reason the same couldn’t be done at City Colleges. “[I thought] ‘Well, we’re going to do it sector-by-sector, industry-by-industry and align each with Chicago’s diver-sifi ed economy,’” he says.
On the business side of City Colleges, that’s meant taking steps like creating a class focused on three Microsoft Offi ce certifi ca-tions, giving sales classes more of a focus on actually managing accounts (not just luring clients), and incorporating “soft skills” like communication and reading cues into more aspects of the curriculum. In health care, it’s meant considering an end to certif-icates in fi elds such as dialysis technology that industry partners already provide in-house, while building out programs that train community health workers in partnership with Rush University Medical Center, one of the biggest employers in Chicago. In man-ufacturing, it’s meant getting industry accreditations for students in welding and machining, and designing a broader manufactur-ing technology associate degree that allows students to specialize in one particular area. In every college it’s meant inviting indus-try representatives to speaking engagements, jobs fairs and stints as guest instructors. “It’s very hard to change entrenched public systems of any kind, to put a stake in the ground and say you’re really committed to it,” says Dr. Larry Goodman, Rush’s CEO. “But they’ve made it work.” G
Email [email protected]
Chancellor Cheryl Hyman is working with Mayor Rahm Emanuel to boost
completed student certifi cations of “economic value.”
C H I C A G O G R A D S
KA
LLE
EK
O
GOV03_36.indd 40 2/14/14 3:33 PM
100 Blue Ravine RoadFolsom, CA 95630916-932-1300
Page #
__________Designer __________Creative Dir.
__________Editorial __________Prepress
__________Other ____________OK to go
5 25 50 75 95 100 5 25 50 75 95 100 5 25 50 75 95 100 5 25 50 75 95 100
BLACKYELLOW
MAGENTACYAN
If You Purchased Municipal Derivative Transactions from January 1, 1992 to August 18, 2011
You Could Get a Payment for a Class Action Settlement.
A proposed Settlement has been reached with GE Funding Capital Market Services, Inc., Trinity Funding Co., LLC and Trinity Plus Funding Co., LLC (collectively, “GE”), in a class action lawsuit that alleges price-fixing in the sale of municipal derivatives transactions by GE and other companies. The case, In re Municipal Derivatives Antitrust Litigation, MDL No. 1950, No. 08-02516, is pending in the United States District Court for the Southern District of New York.
Who Is Included in the Settlement?This Settlement includes all state, local and municipal government entities, independent government agencies, quasi-government, non-profit and private entities that purchased:
(1) Municipal derivative transactions through negotiation, competitive bidding or auction, from any Alleged Provider Defendant or brokered by any Alleged Broker Defendant,
(2) Any time from January 1, 1992 through August 18, 2011 in the United States and its territories or for delivery in the United States and its territories.
The Defendants and Co-Conspirators are listed in the detailed notice available on the Settlement website.
What Does the Settlement Provide?GE agreed to a settlement amount of $18.25 million. This Settlement is only a partial settlement of the lawsuit because it only affects the claims against GE. The lawsuit is continuing against other Defendants. Morgan Stanley, Wachovia/Wells Fargo, and JPMorgan have already settled. GE will provide reasonable cooperation, including discovery cooperation, to Class Plaintiffs’ Counsel in the litigation that will continue against the other Defendants.
What Do I Do Now?• Remain in the Settlement. To remain in the Settlement
Class and participate in the Settlement, you do not have to do anything now. If the Court approves the Settlement, you give up the right to sue GE for the claims and issues in this case. The Settlement Agreement, specifically Paragraph 1(bb), which is available at www.MunicipalDerivativesSettlement.com, describes in more detail the legal claims that you give up if you stay in the Class. If you remain in the Settlement Class, you still have the right to exclude yourself from any other settlements with other defendants reached in this lawsuit. Claim forms are not available now. Register on the Settlement website to receive a claim form when it becomes available.
For more information: 1-877-310-0512 www.MunicipalDerivativesSettlement.com
• Exclude yourself from the Settlement. If you do not want to remain in the Settlement Class, you must exclude yourself. You must send a written request for exclusion by first-class mail, postmarked no later than May 6, 2014 to the Settlement Administrator. The detailed notice available on the Settlement website describes the information you are required to include in your request for exclusion. If you exclude yourself, you cannot participate in the Settlement, but you retain your right to sue GE on your own for the claims in this lawsuit.
NOTE: You may receive similar notices regarding proposed settlements with other Defendants (i.e., Bank of America). However, if you wish to exclude yourself from the GE settlement, you must send a separate and specific notice with regard to the GE settlement.
• Object or Comment on the Settlement. If you remain in the Settlement Class and want to object to or comment on the GE Settlement or any part of it, you must file an objection with the Court and deliver a copy to Class Counsel and GE no later than May 6, 2014.
When Will the Court Decide Whether to Approve the Settlement?
The Court has scheduled a hearing on June 6, 2014, at 10 a.m. at the United States District Court for the Southern District of New York, United States Courthouse, 500 Pearl Street, New York, NY 10007, to consider whether to finally approve the GE Settlement as fair, reasonable and adequate, whether to approve Class Counsel’s request for reimbursement of litigation expenses, and to consider any objections.
The Court has appointed the law firms of Hausfeld LLP; Boies, Schiller & Flexner LLP; and Susman Godfrey L.L.P. to serve as Class Counsel and represent all Class Members. If you want to be represented by your own lawyer, you may hire one at your own expense. You or your lawyer may ask to appear and speak at the hearing but are not required to. If you want to be heard by the Court, you must file a written notice of your intention to appear with the Court and deliver a copy to the Class Counsel and GE no later than May 6, 2014. The Court may change the time and date of the hearing. Any change will be posted on the Settlement website.
Get More InformationFor more information on this lawsuit, your rights, or to obtain a list of defendants, call or visit the Settlement website listed below or write to Municipal Derivatives Settlement, c/o Rust Consulting, Inc., P.O. Box 2500, Faribault, MN 55021-9500.
Legal Notice
100 Blue Ravine RoadFolsom, CA 95630916-932-1300
Page #
__________Designer __________Creative Dir.
__________Editorial __________Prepress
__________Other ____________OK to go
5 25 50 75 95 100 5 25 50 75 95 100 5 25 50 75 95 100 5 25 50 75 95 100
BLACKYELLOW
MAGENTACYAN

GOVERNING | March 201442
Distress GOV03_42.indd 42 2/14/14 3:40 PM
100 Blue Ravine RoadFolsom, CA 95630916-932-1300
Page #
__________Designer __________Creative Dir.
__________Editorial __________Prepress
__________Other ____________OK to go
5 25 50 75 95 100 5 25 50 75 95 100 5 25 50 75 95 100 5 25 50 75 95 100
BLACKYELLOW
MAGENTACYAN

43March 2014 | GOVERNING
The Scranton Lace
Company, once one of
the Pennsylvania city’s
biggest employers,
closed its doors in 2002.
BBBByyyy LLLLiiiizzzz FFFaaarrrrmmeeerrrr P h oP h oP h o t o gt o go g r a pr a pr a p h sh sh ss b yb yb yb y D a vD a vD a vD a v i di di di K i dK i dK i dK i d ddd
Signals
101FINANCE
GOV03_42.indd 43 2/14/14 3:40 PM
100 Blue Ravine RoadFolsom, CA 95630916-932-1300
Page #
__________Designer __________Creative Dir.
__________Editorial __________Prepress
__________Other ____________OK to go
5 25 50 75 95 100 5 25 50 75 95 100 5 25 50 75 95 100 5 25 50 75 95 100
BLACKYELLOW
MAGENTACYAN

GOVERNING | March 201444
Hanging on the door of his city hall offi ce in Scranton, Pa., David Bulzoni has a framed print of a train. It’s there for two reasons: First, it’s a reminder of Scran-ton’s proud history as a railroad and cultural hub. Sec-ond, it’s a nod to the movie Unstoppable, the story of a
runaway freight train and the two men who attempt to stop it. As the business administrator for a distressed city, Bulzoni sees ties between his job and the characters in the movie. “You’re just on an unstoppable train,” he says.
Scranton, a city of about 76,000, has been sliding into fi scal trouble ever since coal mining collapsed here in the 1950s. Like other cities that have lost their main industry, it has been suff ering through an eroding tax base, aging population, and rising retiree and personnel costs. In recent years, political animosity among its leaders has exacerbated the city’s fi nancial situation and led Scranton to default on a parking authority bond, earning it scorn from lenders and banks.
Offi cials have long been aware of the city’s fi scal failings. In 1992, the city council voted to enter into the state’s Act 47 program, which provides loan and grant money to fi nancially distressed governments and helps them develop fi nancial recovery plans. Few cities that have volunteered for the program have actually emerged from it. Twenty-one have entered and six have exited. Scranton is one city that has failed to fl ourish since it entered the program, and divided leadership has worsened its outlook.
Scranton’s woes and vulnerable fi scal footing are by no means unique. While municipal bankruptcies have gotten a lot of
national headlines, it’s not the bankrupt cities that are the wide-spread problem. It’s the ones on the edge—the “distressed” cities. These are places that likely will never declare bankruptcy but are nonetheless struggling to become economically viable again.
Complicating the problem is the tense relationship between the stressed cities and their states. Cities don’t want to be treated like children. Duly elected city offi cials don’t like being told what to do by state overseers; they want a partnership, not a dictatorship.
Like their cities, states also want a partnership, but the dif-ference often lies in what that should look like. From the state’s point of view, struggling cities are a poor refl ection on the fi nan-cial health of the state, and a danger to its economy. Yet the states don’t have the money for a bailout—never mind the political will to provide one, as many believe that wouldn’t put cities on sound footing in the future anyway. States want cities to settle down and take their advice, even if it’s tough medicine.
The question for both parties—the stressed city and the paternalistic state—is simple: How can we work toward a com-mon goal of fi scal health? Finding a com-mon solution, however, is more diffi cult.
Many states have put some legislative thought into how they will deal with troubled cities. All told, 19 states have intervention programs for
distressed municipalities, but the potential level of involvement varies. The most asser-tive state is North Carolina. In a program that dates back to the Great Depression when more than 400 local governments and public authorities in the state defaulted on debt, the state’s Local Government Com-mission (LGC) was created to sign off on all local debt issuance. Today it still monitors local property tax intake and will not allow localities to issue debt if fund balances drop below a certain point. Offi cials in North Carolina claim LGC oversight is the key reason the state’s municipalities have strong credit ratings. Recently, Tennessee replicated North Carolina’s approach—albeit with a lighter hand. After the Great Recession, a number of local governments
were drowning in debt thanks to investments in risky variable rate debt. That prompted Tennessee to mandate that local gov-ernments borrowing money draft debt management policies fol-lowing very specifi c guidelines.
Similarly on the aggressive front, New York Comptroller Thomas DiNapoli and Gov. Andrew Cuomo launched a fi scal monitoring system a year ago designed to fl ag struggling munici-palities. A new fi scal restructuring board will advise local gov-ernments seeking help and could off er a loan or grant of up to $5 million to those following their advice. Pennsylvania also has an
Business Administrator David Bulzoni says his job is to regain Scranton’s
fi nancial credibility after the city allowed a default in 2012.
D I S T R E S S S I G N A L S
GOV03_42.indd 44 2/14/14 3:42 PM
100 Blue Ravine RoadFolsom, CA 95630916-932-1300
Page #
__________Designer __________Creative Dir.
__________Editorial __________Prepress
__________Other ____________OK to go
5 25 50 75 95 100 5 25 50 75 95 100 5 25 50 75 95 100 5 25 50 75 95 100
BLACKYELLOW
MAGENTACYAN

45March 2014 | GOVERNING
early warning system for its cities. It was developed in the mid-2000s, two decades after the Act 47 program.
Many observers wish more states would consider monitoring their local governments’ fi nances. “It’s a really proactive way to reveal budget distress,” says Steve Fehr, co-author of a Pew Chari-table Trusts report on state intervention programs. States with more conventional intervention protocols, he suggests, “don’t react until it’s too late.”
Part of the dilemma for cities, of course, isn’t monitoring, but the way local fi nances have been reconstituted in recent history.
Over the last century, city revenue streams have gone from being based almost entirely in property taxes to being more weighted in charges and fees, notes Michael Pagano, dean of the College of Urban Planning and Public Aff airs at the University of Illinois at Chicago. That has played heavily in the state-city tension as cities try to rebalance their fi scal footing. “States continue to restrict the authority of municipals to create a lasting revenue structure,” Pagano says. That said, he adds that the idea that more taxing power would be a fi x is still largely theoretical. “We can point our fi ngers at the state because they do have enormous amounts of discretionary control over what cities do.” And it is unclear whether expanded taxing authority would actually solve cities’ fi scal problems, he says. “Whether it would actually be better is the question.”
Many of these issues over state intervention are on view in Scranton. Act 47 and Scranton’s fi nancial turmoil have played out in city council meetings, on balance sheets and on Wall Street—even though on the surface, Scranton doesn’t look like a city
that can’t pay its bills. White tablecloth restaurants dot downtown and smiling residents shout conversations at one another across the street. “This isn’t a run-down, hopeless, we’re-never-going-to-get-better community,” says Mike Washo, a former county com-missioner and now the appointed receiver for the city’s troubled parking authority.
Over the past 20 years, this center of northeastern Pennsylva-nia has developed into a tourist destination, spawned a medical school and seen demand for downtown living soar. Former Mayor Chris Doherty was able to round up tens of millions of dollars in economic development eff orts: Downtown’s silent, century-old
Despite the “very challenging, complicated fi nancial problems of the city government,” says Greater Scranton Chamber
of Commerce President Robert Durkin, much of the city looks as though things are going well.
Former Mayor Chris Doherty was the driving force behind
revitalizing many of the city’s downtown buildings.
101FINANCE
GOV03_42.indd 45 2/14/14 3:42 PM
100 Blue Ravine RoadFolsom, CA 95630916-932-1300
Page #
__________Designer __________Creative Dir.
__________Editorial __________Prepress
__________Other ____________OK to go
5 25 50 75 95 100 5 25 50 75 95 100 5 25 50 75 95 100 5 25 50 75 95 100
BLACKYELLOW
MAGENTACYAN

GOVERNING | March 201446
relics have been restored and turned into restaurants, apartments and retail. The city even gained a bit of fame as the setting for the Dunder Miffl in Paper Company, the fi ctional paper sales company featured in the television series “The Offi ce.”
“Scranton is not on fi re,” says Chamber of Commerce Presi-dent Robert Durkin, despite the “very challenging, complicated fi nancial problems of the city government.”
Exacerbating Scranton’s problems has been political infi ght-ing, triggered by the prospect of state intervention. Even Scran-ton’s decision to seek Act 47 status was divisive—the city council unanimously approved the decision despite the vehement oppo-sition of then-Mayor Jim Connors. Connors, who viewed the act as abdication to an unelected entity, immediately butted heads with the nonprofi t assigned by the Pennsylvania Department of Community and Economic Development (DCED) to coordi-nate Scranton’s recovery. It’s that sort of knee-jerk resistance by local offi cials that really frustrates a state, says Clyde “Champ” Holman, DCED’s deputy secretary of community aff airs and
development. “It really comes down to personalities,” he says. “Some have the attitude as if we’re taking over. And that’s the wrong attitude.”
But in Scranton, even a subsequent—and more cooperative—administration under Doherty resulted in little progress. Doherty and the state hinged Scranton’s recovery plan on its ability to change costly union contract provisions using Act 47 as legal jus-tifi cation for doing so. Fire and police unions fought the recovery plan and the state Supreme Court agreed, ruling in 2011 that the city must pony up what is now a roughly $30 million award in back pay. It ultimately weakened Act 47’s protection by granting the award despite Scranton’s distressed status and without con-sideration of the city’s ability to aff ord the payment.
The adverse court ruling aggravated already negative fi scal pressures. Political wrangling after the Supreme Court decision resulted in the city council forcing the city parking authority into default on its bonds. The move cut off the city from credit markets for months. Cash fl ow problems forced Doherty to temporarily cut workers’ salaries to minimum wage.
Even today the fi scal picture continues to look shaky. The 2014 budget includes a 57 percent property tax hike and a 69 percent garbage fee hike to help close what was a $20 million projected defi cit. The city still struggles with credit: After one bank backed out of a fi nancing deal, Scranton scrambled to fi nd a lender that would let it borrow enough money for paydays until tax receipts come in. It was a tough sell. “Once you default on a bond issue, you have hell to pay for years,” Bulzoni says.
From the state’s perspective, Scranton’s political divisiveness is the main reason it has struggled to shed the distressed cities label. “Doherty was really willing to work with us,” says Holman. “The council president [Janet Evans] never, ever stepped foot in
our department and resisted us every step of the way.” Evans, who retired from the council after 2013, has long maintained that the DCED has not done enough to assist Scranton’s recovery. In a tense council meet-ing in 2012, she blamed the state for the Supreme Court outcome, saying that “the state and DCED had turned their backs on Scranton taxpayers” and that the department had ignored her request to appoint a diff erent recovery coordinator for the city.
At its core, Scranton is like many other dis-tressed cities. As the employment center for the region, it bears the brunt of the daily infl ux of workers without the ben-efi ts of a matching tax base. From Paga-
no’s perspective, this means that a distressed city’s problems should really be viewed as a regional issue. Where states can help is in facilitating that conversa-tion. “It’s a great opportunity to start rethinking all of these relationships between cities and states and what controls states ought to have,” says Pagano. “We don’t seem to be having that conversation.”
In New York, Syracuse Mayor Stephanie Miner couldn’t agree more. The 20th-century framework for cities that relies on property taxes doesn’t work when
the main industry skips town, she says. Even though Syracuse quali-fi es for consulting and a loan from the state restructuring board, it isn’t taking the help. The city has already hired consultants, pored over its books and made the suggested changes. A small state loan, Miner says, won’t put a dent in the city’s multimillion dollar problem.
Instead, Miner suggests the state can get in the game by facili-tating talks between mayors and their neighboring county execu-tives. It could loosen business regulations in some circumstances or give up control of restrictive labor practices. “You can’t tax your way out of the dynamic,” Miner says. “And in order to change that dynamic, you have to have the state change it.”
About 30 miles north of Syracuse, Fulton Mayor Ron Wood-ward is eager to open his books to the state. Fulton is one of the
Syracuse Mayor Stephanie Miner wants her state to help cities and
counties work together for a regional solution for urban distress.
D I S T R E S S S I G N A L S
GOV03_42.indd 46 2/14/14 3:43 PM
100 Blue Ravine RoadFolsom, CA 95630916-932-1300
Page #
__________Designer __________Creative Dir.
__________Editorial __________Prepress
__________Other ____________OK to go
5 25 50 75 95 100 5 25 50 75 95 100 5 25 50 75 95 100 5 25 50 75 95 100
BLACKYELLOW
MAGENTACYAN

47March 2014 | GOVERNING
fi rst cities to take New York up on its off er to work with the fi nancial restructuring board, which is interviewing city lead-ers to develop an action plan for Fulton. Woodward speculates it may include consolidation of services and debt reform. The city of about 12,000 has been crippled by the loss of food manufac-turers and rising pension costs, but Woodward says New York’s
expensive business policies have been the nail in the coffi n for not just Fulton but much of upstate New York. Fulton lost two manufacturers to Wis-consin, where energy costs and workers’ compen-sation insurance are far cheaper. “I don’t think anybody at the state level is intentionally at fault,” he says. “The state deals with much bigger issues and I don’t think they really understand what’s happening [with the local economic structure].”
Woodward’s point is that cities feel as if they’re not being heard. Sometimes it is because there is too much political commotion at the local level. But this isn’t true for every case. And in spite of that, cities still see themselves as the doers when compared with their states—cities deliver services. If city issues are not approached early on and with this sensitivity, state inter-vention can aggravate the local attitude. “Most people now think that cities are the only level of
government that works,” Miner boasts. “The irony in all this is people’s perception that cities solve all the problems—and we’re the ones in crisis.” G
Email [email protected]
Fulton Mayor Ron Woodward is eager to show state offi cials how his
city has been affected by restrictive state labor practices.
More public fi nance coverage at governing.com/fi nance101
When you’re ready forsuccess in a changing world.You are ready for American Public University.
With more than 180 degrees and certificates to choose from, there’s almost no end to what you can learn. From Cybersecurity to Public Administration and Organizational Management, you’ll find respected programs at APU relevant to many government occupations and series— at a cost that’s 20% less than the published average in-state rates at public universities.*
Visit StudyatAPU.com/governing
*College Board: Trends in College Pricing, 2013
We want you to make an informed decision about the university that’s right for you. For more about our graduation rates, the median debt of students who completed each program, and other important information, visit www.apus.edu/disclosure.2014
ONLINE PROGRAMSBEST
BACHELOR’S
101FINANCE
GOV03_42.indd 47 2/14/14 3:43 PM
100 Blue Ravine RoadFolsom, CA 95630916-932-1300
Page #
__________Designer __________Creative Dir.
__________Editorial __________Prepress
__________Other ____________OK to go
5 25 50 75 95 100 5 25 50 75 95 100 5 25 50 75 95 100 5 25 50 75 95 100
BLACKYELLOW
MAGENTACYAN

#4096841/17/148:22 A.M.LOOSE DOG RUNNING DOWN MIDDLE OF 2ND STREET.
#4097351/17/14
9:15 A.M.BROKEN ASPHALT
BLOCKING LANE.
#5163491/29/147:15 P.M.TRASH CANS OVERFLOWING, BLOCKING PARKING.
#4264821/22/146:06 A.M.GRAFFITI ON PUBLIC LIBRARY STEPS.
GOVERNING | March 201448
GOV03_48.indd 48 2/14/14 3:46 PM
100 Blue Ravine RoadFolsom, CA 95630916-932-1300
Page #
__________Designer __________Creative Dir.
__________Editorial __________Prepress
__________Other ____________OK to go
5 25 50 75 95 100 5 25 50 75 95 100 5 25 50 75 95 100 5 25 50 75 95 100
BLACKYELLOW
MAGENTACYAN

AS THE GREAT RECESSION took its toll on Buff alo, N.Y., the city government decided to staunch decay and neglect by targeting its limited resources on the neighborhoods with the greatest need. City departments began weekly sweeps through the most hard-hit wards, providing information to resi-dents about employment and health-care services, while also sealing vacant houses, trimming overgrown trees, mowing empty lots, and removing debris and graffi ti.
The city knew exactly where to go and what to do based on data from Buff alo’s 311 hotline service. The city culled data from complaints and requests for service during the year. The targeted sweeps that resulted represented a complete turnaround from the random eff orts in the past to fi x blighted neighborhoods.
The outreach conducted by Mayor Byron Brown captures in a nutshell how 311 has grown from what was once just a hotline for citizens into something much more. Instead of simply responding to complaints, cities are using 311 proactively to tackle urban prob-lems before they get too big. In Chicago, the city is using analytical software to sift through 311 calls to see if it can spot rat infestations before they become a problem. Like Buff alo, the city is trying to be more eff ective in how it handles common complaints.
Other cities are using 311 as a way to push out information to citizens. Sometimes it has to do with alerting neighborhoods about shutoff s to repair water lines, or it can be used to alert car owners to keep their vehicles off the streets as a winter storm approaches. In Louisville, Ky., the city used its 311 to let residents know that they could shred personal documents using city paper shredders on select weekends.
City residents aren’t just calling 311 operators. They are increasingly using smartphones with mobile apps to send in requests for service 24 hours a day, seven days a week. The cit-ies with the most sophisticated 311 systems can capture all this data and use it to track work, measure performance, and make strategic decisions that aff ect services, policies and budgets. “311 is now used for performance measurement, economic develop-ment and community engagement,” says Cory Fleming, 311 pro-gram director at the International City/County Management Association. The technology has “gone way beyond its original purpose, which was simply to offl oad nonemergency calls com-ing into 911 systems.”
In fact many experts see 311 as a transformative technology for cities, capable of helping mayors and city managers make smart
49March 2014 | GOVERNING
311 SYSTEMS HAVE REVOLUTIONIZED THE WAY CITIES GATHER INFORMATION. BUT RUNNING THEM CAN BE EXTREMELY COSTLY.
B Y T O D N E W C O M B E
T H E
O F PRICE
KNOWING
GOV03_48.indd 49 2/14/14 3:47 PM
100 Blue Ravine RoadFolsom, CA 95630916-932-1300
Page #
__________Designer __________Creative Dir.
__________Editorial __________Prepress
__________Other ____________OK to go
5 25 50 75 95 100 5 25 50 75 95 100 5 25 50 75 95 100 5 25 50 75 95 100
BLACKYELLOW
MAGENTACYAN
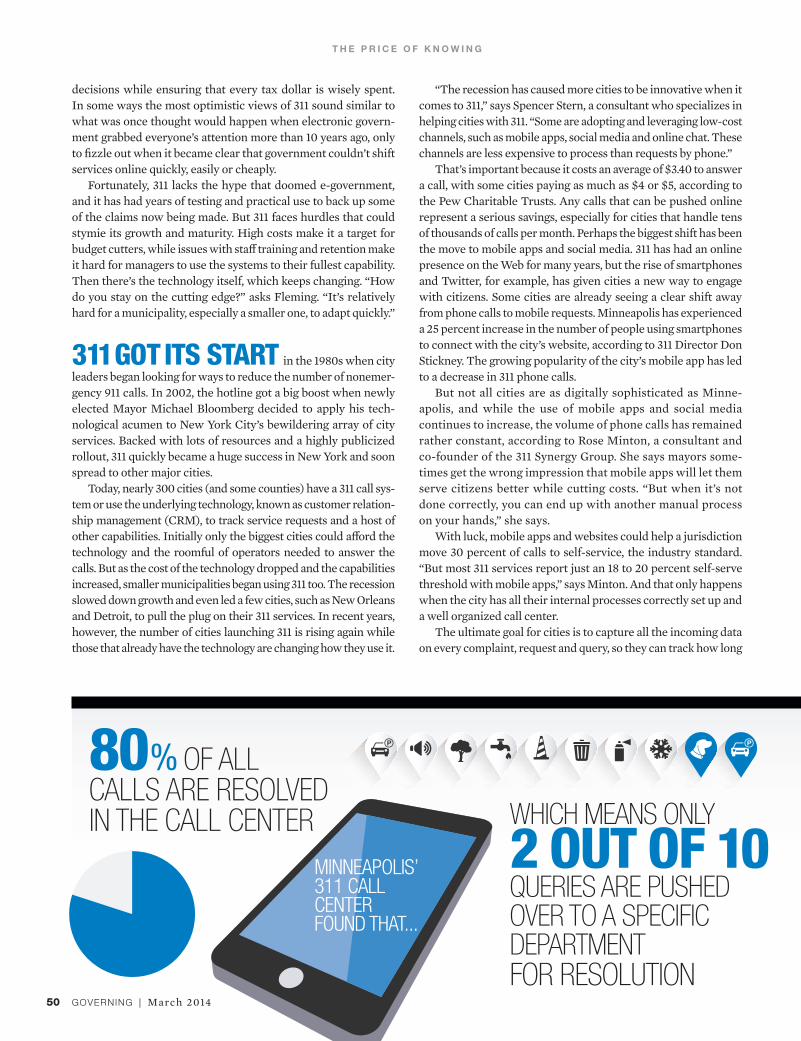
“The recession has caused more cities to be innovative when it comes to 311,” says Spencer Stern, a consultant who specializes in helping cities with 311. “Some are adopting and leveraging low-cost channels, such as mobile apps, social media and online chat. These channels are less expensive to process than requests by phone.”
That’s important because it costs an average of $3.40 to answer a call, with some cities paying as much as $4 or $5, according to the Pew Charitable Trusts. Any calls that can be pushed online represent a serious savings, especially for cities that handle tens of thousands of calls per month. Perhaps the biggest shift has been the move to mobile apps and social media. 311 has had an online presence on the Web for many years, but the rise of smartphones and Twitter, for example, has given cities a new way to engage with citizens. Some cities are already seeing a clear shift away from phone calls to mobile requests. Minneapolis has experienced a 25 percent increase in the number of people using smartphones to connect with the city’s website, according to 311 Director Don Stickney. The growing popularity of the city’s mobile app has led to a decrease in 311 phone calls.
But not all cities are as digitally sophisticated as Minne-apolis, and while the use of mobile apps and social media continues to increase, the volume of phone calls has remained rather constant, according to Rose Minton, a consultant and co-founder of the 311 Synergy Group. She says mayors some-times get the wrong impression that mobile apps will let them serve citizens better while cutting costs. “But when it’s not done correctly, you can end up with another manual process on your hands,” she says.
With luck, mobile apps and websites could help a jurisdiction move 30 percent of calls to self-service, the industry standard. “But most 311 services report just an 18 to 20 percent self-serve threshold with mobile apps,” says Minton. And that only happens when the city has all their internal processes correctly set up and a well organized call center.
The ultimate goal for cities is to capture all the incoming data on every complaint, request and query, so they can track how long
T H E P R I C E O F K N O W I N G
GOVERNING | March 201450
decisions while ensuring that every tax dollar is wisely spent. In some ways the most optimistic views of 311 sound similar to what was once thought would happen when electronic govern-ment grabbed everyone’s attention more than 10 years ago, only to fi zzle out when it became clear that government couldn’t shift services online quickly, easily or cheaply.
Fortunately, 311 lacks the hype that doomed e-government, and it has had years of testing and practical use to back up some of the claims now being made. But 311 faces hurdles that could stymie its growth and maturity. High costs make it a target for budget cutters, while issues with staff training and retention make it hard for managers to use the systems to their fullest capability. Then there’s the technology itself, which keeps changing. “How do you stay on the cutting edge?” asks Fleming. “It’s relatively hard for a municipality, especially a smaller one, to adapt quickly.”
311 GOT ITS START in the 1980s when city leaders began looking for ways to reduce the number of nonemer-gency 911 calls. In 2002, the hotline got a big boost when newly elected Mayor Michael Bloomberg decided to apply his tech-nological acumen to New York City’s bewildering array of city services. Backed with lots of resources and a highly publicized rollout, 311 quickly became a huge success in New York and soon spread to other major cities.
Today, nearly 300 cities (and some counties) have a 311 call sys-tem or use the underlying technology, known as customer relation-ship management (CRM), to track service requests and a host of other capabilities. Initially only the biggest cities could aff ord the technology and the roomful of operators needed to answer the calls. But as the cost of the technology dropped and the capabilities increased, smaller municipalities began using 311 too. The recession slowed down growth and even led a few cities, such as New Orleans and Detroit, to pull the plug on their 311 services. In recent years, however, the number of cities launching 311 is rising again while those that already have the technology are changing how they use it.
80% OF ALL CALLS ARE RESOLVED IN THE CALL CENTER WHICH MEANS ONLY
2 OUT OF 10 QUERIES ARE PUSHED OVER TO A SPECIFIC DEPARTMENT FOR RESOLUTION
MINNEAPOLIS’ 311 CALL CENTER FOUND THAT...
GOV03_48.indd 50 2/14/14 3:47 PM
100 Blue Ravine RoadFolsom, CA 95630916-932-1300
Page #
__________Designer __________Creative Dir.
__________Editorial __________Prepress
__________Other ____________OK to go
5 25 50 75 95 100 5 25 50 75 95 100 5 25 50 75 95 100 5 25 50 75 95 100
BLACKYELLOW
MAGENTACYAN
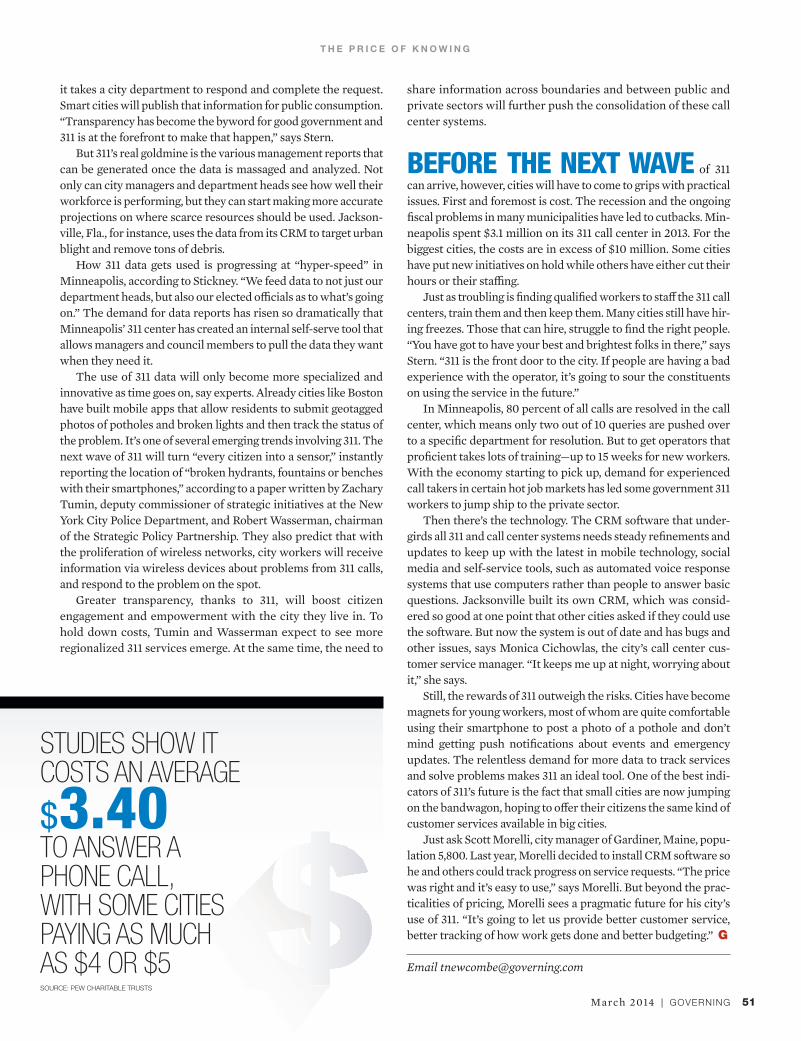
it takes a city department to respond and complete the request. Smart cities will publish that information for public consumption. “Transparency has become the byword for good government and 311 is at the forefront to make that happen,” says Stern.
But 311’s real goldmine is the various management reports that can be generated once the data is massaged and analyzed. Not only can city managers and department heads see how well their workforce is performing, but they can start making more accurate projections on where scarce resources should be used. Jackson-ville, Fla., for instance, uses the data from its CRM to target urban blight and remove tons of debris.
How 311 data gets used is progressing at “hyper-speed” in Minneapolis, according to Stickney. “We feed data to not just our department heads, but also our elected offi cials as to what’s going on.” The demand for data reports has risen so dramatically that Minneapolis’ 311 center has created an internal self-serve tool that allows managers and council members to pull the data they want when they need it.
The use of 311 data will only become more specialized and innovative as time goes on, say experts. Already cities like Boston have built mobile apps that allow residents to submit geotagged photos of potholes and broken lights and then track the status of the problem. It’s one of several emerging trends involving 311. The next wave of 311 will turn “every citizen into a sensor,” instantly reporting the location of “broken hydrants, fountains or benches with their smartphones,” according to a paper written by Zachary Tumin, deputy commissioner of strategic initiatives at the New York City Police Department, and Robert Wasserman, chairman of the Strategic Policy Partnership. They also predict that with the proliferation of wireless networks, city workers will receive information via wireless devices about problems from 311 calls, and respond to the problem on the spot.
Greater transparency, thanks to 311, will boost citizen engagement and empowerment with the city they live in. To hold down costs, Tumin and Wasserman expect to see more regionalized 311 services emerge. At the same time, the need to
share information across boundaries and between public and private sectors will further push the consolidation of these call center systems.
BEFORE THE NEXT WAVE of 311 can arrive, however, cities will have to come to grips with practical issues. First and foremost is cost. The recession and the ongoing fi scal problems in many municipalities have led to cutbacks. Min-neapolis spent $3.1 million on its 311 call center in 2013. For the biggest cities, the costs are in excess of $10 million. Some cities have put new initiatives on hold while others have either cut their hours or their staffi ng.
Just as troubling is fi nding qualifi ed workers to staff the 311 call centers, train them and then keep them. Many cities still have hir-ing freezes. Those that can hire, struggle to fi nd the right people. “You have got to have your best and brightest folks in there,” says Stern. “311 is the front door to the city. If people are having a bad experience with the operator, it’s going to sour the constituents on using the service in the future.”
In Minneapolis, 80 percent of all calls are resolved in the call center, which means only two out of 10 queries are pushed over to a specifi c department for resolution. But to get operators that profi cient takes lots of training—up to 15 weeks for new workers. With the economy starting to pick up, demand for experienced call takers in certain hot job markets has led some government 311 workers to jump ship to the private sector.
Then there’s the technology. The CRM software that under-girds all 311 and call center systems needs steady refi nements and updates to keep up with the latest in mobile technology, social media and self-service tools, such as automated voice response systems that use computers rather than people to answer basic questions. Jacksonville built its own CRM, which was consid-ered so good at one point that other cities asked if they could use the software. But now the system is out of date and has bugs and other issues, says Monica Cichowlas, the city’s call center cus-tomer service manager. “It keeps me up at night, worrying about it,” she says.
Still, the rewards of 311 outweigh the risks. Cities have become magnets for young workers, most of whom are quite comfortable using their smartphone to post a photo of a pothole and don’t mind getting push notifi cations about events and emergency updates. The relentless demand for more data to track services and solve problems makes 311 an ideal tool. One of the best indi-cators of 311’s future is the fact that small cities are now jumping on the bandwagon, hoping to off er their citizens the same kind of customer services available in big cities.
Just ask Scott Morelli, city manager of Gardiner, Maine, popu-lation 5,800. Last year, Morelli decided to install CRM software so he and others could track progress on service requests. “The price was right and it’s easy to use,” says Morelli. But beyond the prac-ticalities of pricing, Morelli sees a pragmatic future for his city’s use of 311. “It’s going to let us provide better customer service, better tracking of how work gets done and better budgeting.” G
Email [email protected]
T H E P R I C E O F K N O W I N G
51March 2014 | GOVERNING
STUDIES SHOW IT COSTS AN AVERAGE
$3.40 TO ANSWER A PHONE CALL, WITH SOME CITIES PAYING AS MUCH AS $4 OR $5
S H
SOURCE: PEW CHARITABLE TRUSTS
GOV03_48.indd 51 2/14/14 3:47 PM
100 Blue Ravine RoadFolsom, CA 95630916-932-1300
Page #
__________Designer __________Creative Dir.
__________Editorial __________Prepress
__________Other ____________OK to go
5 25 50 75 95 100 5 25 50 75 95 100 5 25 50 75 95 100 5 25 50 75 95 100
BLACKYELLOW
MAGENTACYAN

GOVERNING | March 201452
GOV03_52.indd 52 2/14/14 3:48 PM
100 Blue Ravine RoadFolsom, CA 95630916-932-1300
Page #
__________Designer __________Creative Dir.
__________Editorial __________Prepress
__________Other ____________OK to go
5 25 50 75 95 100 5 25 50 75 95 100 5 25 50 75 95 100 5 25 50 75 95 100
BLACKYELLOW
MAGENTACYAN

53March 2014 | GOVERNING
PenitenceA hulking prison in Philadelphia was built for introspection.
Photographs and story by David Kidd
Nearly 185 years ago, several Philadelphia men took up residence in an imposing stone struc-ture in Cherry Hill, a pastoral setting just two miles from the city center. There, they would spend an average of two or three years alone, in complete meditative silence. With only a bed
and a Bible, each was expected to devote every waking hour to self-contemplation and his relationship with God.
But this was no monastery and these were not monks. They were the fi rst prisoners admitted to the Eastern State Peniten-tiary, which began construction in 1821 and opened eight years later. Architect John Haviland was instructed to “convey to the mind a cheerless blank indicative of the misery which awaits the unhappy being who enters within its walls.” With its 80-foot bell tower, 30-foot walls and 27-foot-tall iron-studded oak doors, the building resembled a massive fortress. The only larger building in the country at the time was the U.S. Capitol.
As foreboding as it was, Eastern State was designed from the beginning to implement new, more humane theories about
A cell stands
empty at
Pennsylvania’s
Eastern State
Penitentiary.
GOV03_52.indd 53 2/14/14 3:49 PM
100 Blue Ravine RoadFolsom, CA 95630916-932-1300
Page #
__________Designer __________Creative Dir.
__________Editorial __________Prepress
__________Other ____________OK to go
5 25 50 75 95 100 5 25 50 75 95 100 5 25 50 75 95 100 5 25 50 75 95 100
BLACKYELLOW
MAGENTACYAN

GOVERNING | March 201454
crime and punishment. Presaging many of today’s arguments on corrections reform, the emphasis was much less on punish-ment and more on rehabilitation. Phila-delphians, drawing on their Quaker roots, had long argued for better treatment of prisoners. They believed that if prison-ers were left alone in complete silence, with nothing to occupy their minds but thoughts of their misdeeds, they would become genuinely penitent. (Hence, the building was known as a “penitentiary.”)
The place was utterly silent. Guards walked the halls with socks over their shoes. The wheels on the wagons that brought food down the long corridors were covered in leather. For 23 hours of every day, inmates were confi ned to a 7.5- by-12-foot cell with a church-like vaulted ceiling and small skylight. For the remain-ing hour they were allowed outside within their own small exercise area. Inmates in adjoining cells were never allowed outside at the same time, and any communication between prisoners was strictly forbidden.
In order to implement these new ideas in prison reform, Eastern State boasted a number of design innovations. Because each prisoner would never leave his cell, water for washing had to be brought to him and a fl ush toilet provided. (By com-parison, running water didn’t make it into the White House until 1833.) A rudimen-tary system provided heat to each cell—something many Philadelphia residents couldn’t aff ord themselves.
But the design feature that got the most attention was the cellblocks. Seven wings radiated out from a central open rotunda, allowing one guard to oversee the entire prison from a single spot. Today more than 300 prisons worldwide have a similar design, directly attributable to Eastern State’s infl uence.
So famous was Philadelphia’s new penitentiary that it became a tourist attraction. Admission tickets were sold for regular tours of the facility. Along with sightseers, schoolchildren and occasional presidents, a young Charles Dickens spent a day at Cherry Hill in 1842. He was not persuaded that the prison was living up to its rehabilitative purpose, later writing, “In its intention, I am well convinced that it is kind, humane, and meant for reforma-tion; but I am persuaded that those who
Eastern State
was once the
most famous and
expensive prison
in the world.
Water pipes were
routed outside
the cells, through
cellblock hallways,
in an effort to
prevent prisoner
communication.
GOV03_52.indd 54 2/14/14 3:50 PM
100 Blue Ravine RoadFolsom, CA 95630916-932-1300
Page #
__________Designer __________Creative Dir.
__________Editorial __________Prepress
__________Other ____________OK to go
5 25 50 75 95 100 5 25 50 75 95 100 5 25 50 75 95 100 5 25 50 75 95 100
BLACKYELLOW
MAGENTACYAN

55March 2014 | GOVERNING
The vaulted
ceilings in the
original cellblocks
were meant to
evoke church-like
spirituality.
A pantry in one of
the cellblocks is
slowly falling apart.
GOV03_52.indd 55 2/14/14 3:50 PM
100 Blue Ravine RoadFolsom, CA 95630916-932-1300
Page #
__________Designer __________Creative Dir.
__________Editorial __________Prepress
__________Other ____________OK to go
5 25 50 75 95 100 5 25 50 75 95 100 5 25 50 75 95 100 5 25 50 75 95 100
BLACKYELLOW
MAGENTACYAN
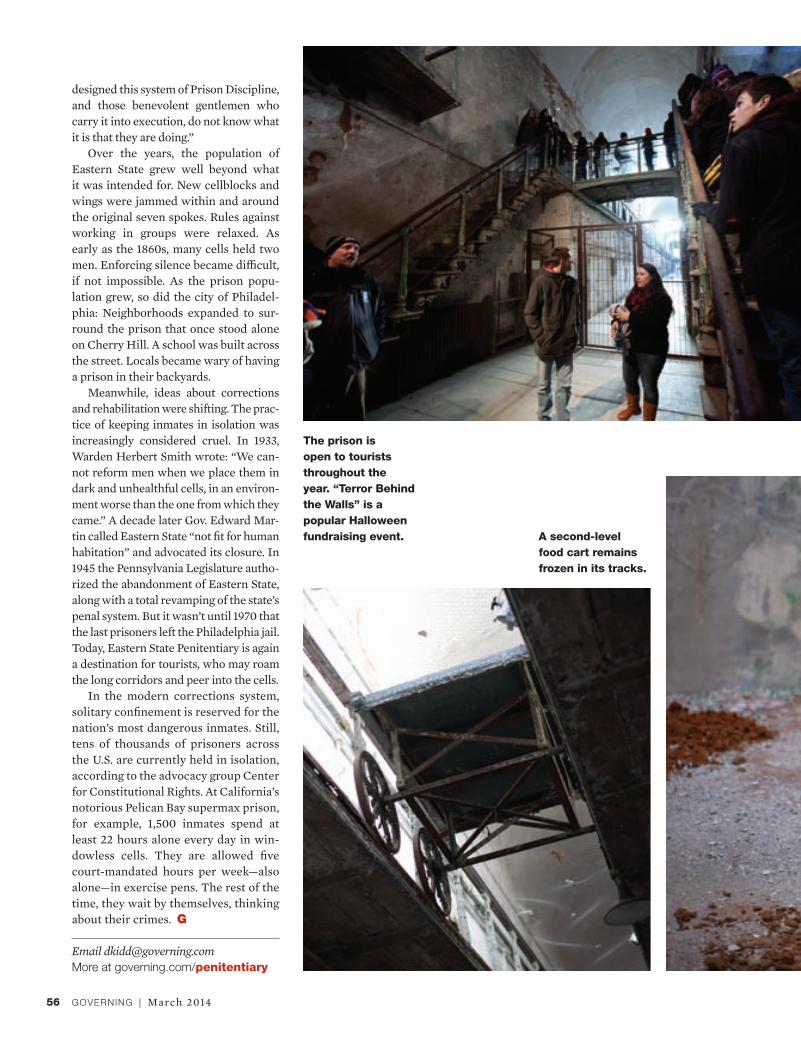
GOVERNING | March 201456
designed this system of Prison Discipline, and those benevolent gentlemen who carry it into execution, do not know what it is that they are doing.”
Over the years, the population of Eastern State grew well beyond what it was intended for. New cellblocks and wings were jammed within and around the original seven spokes. Rules against working in groups were relaxed. As early as the 1860s, many cells held two men. Enforcing silence became diffi cult, if not impossible. As the prison popu-lation grew, so did the city of Philadel-phia: Neighborhoods expanded to sur-round the prison that once stood alone on Cherry Hill. A school was built across the street. Locals became wary of having a prison in their backyards.
Meanwhile, ideas about corrections and rehabilitation were shifting. The prac-tice of keeping inmates in isolation was increasingly considered cruel. In 1933, Warden Herbert Smith wrote: “We can-not reform men when we place them in dark and unhealthful cells, in an environ-ment worse than the one from which they came.” A decade later Gov. Edward Mar-tin called Eastern State “not fi t for human habitation” and advocated its closure. In 1945 the Pennsylvania Legislature autho-rized the abandonment of Eastern State, along with a total revamping of the state’s penal system. But it wasn’t until 1970 that the last prisoners left the Philadelphia jail. Today, Eastern State Penitentiary is again a destination for tourists, who may roam the long corridors and peer into the cells.
In the modern corrections system, solitary confi nement is reserved for the nation’s most dangerous inmates. Still, tens of thousands of prisoners across the U.S. are currently held in isolation, according to the advocacy group Center for Constitutional Rights. At California’s notorious Pelican Bay supermax prison, for example, 1,500 inmates spend at least 22 hours alone every day in win-dowless cells. They are allowed fi ve court-mandated hours per week—also alone—in exercise pens. The rest of the time, they wait by themselves, thinking about their crimes. G
Email [email protected]
The prison is
open to tourists
throughout the
year. “Terror Behind
the Walls” is a
popular Halloween
fundraising event. A second-level
food cart remains
frozen in its tracks.
More at governing.com/penitentiary
GOV03_52.indd 56 2/14/14 3:51 PM
100 Blue Ravine RoadFolsom, CA 95630916-932-1300
Page #
__________Designer __________Creative Dir.
__________Editorial __________Prepress
__________Other ____________OK to go
5 25 50 75 95 100 5 25 50 75 95 100 5 25 50 75 95 100 5 25 50 75 95 100
BLACKYELLOW
MAGENTACYAN

57March 2014 | GOVERNING
By the time this
cellblock was
added, all pretense
to inspirational
architecture was
abandoned. The
iron bars above
prevented falls
from the second
level.
Cell doors and
gates on death row
were controlled
here. No prisoner
was ever executed
at Eastern State.
The penitentiary
remains a
preserved ruin.
Efforts have
been made at
stabilization but
not full-scale
restoration.
GOV03_52.indd 57 2/14/14 3:51 PM
100 Blue Ravine RoadFolsom, CA 95630916-932-1300
Page #
__________Designer __________Creative Dir.
__________Editorial __________Prepress
__________Other ____________OK to go
5 25 50 75 95 100 5 25 50 75 95 100 5 25 50 75 95 100 5 25 50 75 95 100
BLACKYELLOW
MAGENTACYAN

Problem Solver
A third of New Orleans residents who commute via public transpor-tation live in poverty, compared to 9 percent of those who drive cars.
San Diego residents taking public transporta-tion to work report median earnings less than half as much as other city workers. A similarly large disparity exists between those who ride public transit to get to work versus cars in Louisville, Ky.; Tucson, Ariz.; and scores of other urban centers.
Step onto a bus in any American city and you’ll fi nd riders who are poorer and more likely to be minorities than those commuters traveling by car. It’s a socioeconomic gap that’s persisted across most of the nation’s cities for decades. An analysis of Census Bureau survey estimates shows that public transportation commuters are notably poorer in just about every city with a sig-nifi cant number of riders, outside of a few large mid-Atlantic transit systems.
income levels of the markets served by various modes of public transportation. People served by commuter rail are wealthier than in years past. Bus riders are becoming poorer. Light-rail riders, who reside in larger areas spanning both inner cities and suburbs, haven’t changed much.
How transportation networks are confi gured and where populations are distributed further shape a transit system’s demographics. In only a few rare exceptions do all of a city’s public trans-portation riders earn roughly as much as other commuters. Riders in New York City—home to the most public transportation users of any U.S. city—reported median incomes of $35,350, just below $36,803 for all commuters. Chicago’s pub-lic transportation riders similarly mirror the city’s demographics, both in terms of income and race. The same is also true of a few smaller cities, such as Oakland, Calif., and Jersey City, N.J. In gen-eral, larger systems serving more transit-oriented areas have the least disparity.
Historically, public transportation systems functioned largely as a key strand in the social safety net for those with no other means of get-ting around. That’s slowly beginning to change as agencies seek to broaden their ridership base to include city dwellers wanting to go carless. “Transit systems across the country are mak-ing themselves a more mainstream option for the community as a whole,” says Art Guzzetti, the American Public Transportation Association’s (APTA) vice president of policy.
Today, many of the nation’s core transit riders have no other choice but to hop on a bus, train or trolley. An APTA survey reported less than one-half (45 percent) of those using public transportation also had a vehicle available. This percentage tends to be higher for those commuting via rail and lower for bus commuters. So, to a certain extent, rider demographics are tied to what the system offers.
Brian Taylor, a UCLA urban planning profes-sor, conducted research showing differences in
RIDERS’ EARNINGS TRAIL OTHER COMMUTERS
GOVERNING | March 201458
This illustration shows median earnings for those commuting via public transportation as a percentage of median earnings for all commuters. Figures refl ect earnings for only employed commuters residing within select U.S. cities.
See public transportation demographic data for 100 cities at governing.com/transitdemographics
Public Transportation’s Demographic Divide
$30,831 $25,717$27,952
$31,565
Median EarningsAll Commuters
Public Transportation Commuters
$13,423LOUISVILLE
$15,281LOS ANGELES
$26,348PHILADELPHIA
$12,044TUCSON
GOV03_58.indd 58 2/14/14 4:00 PM
100 Blue Ravine RoadFolsom, CA 95630916-932-1300
Page #
__________Designer __________Creative Dir.
__________Editorial __________Prepress
__________Other ____________OK to go
5 25 50 75 95 100 5 25 50 75 95 100 5 25 50 75 95 100 5 25 50 75 95 100
BLACKYELLOW
MAGENTACYAN

By Mike Maciag
| BEHIND THE NUMBERS
In Dallas, approximately 22 percent of public transportation commuters live in poverty—more than double the rate for all the city’s workers, according to Census estimates. Dallas Area Rapid Transit (DART) offi cials emphasize that the system plays a vital role in serving these indi-viduals who might otherwise need to make large investments in car ownership but don’t have the means to do so. In fact, a DART ridership sur-vey identifi ed saving money as the top reason people used public transportation, regardless of their income.
One key demographic that DART underserves are Hispanics, who tend to work in agriculture and construction jobs outside of areas covered by transit. “We see [Hispanics] as a great oppor-tunity to grow,” says Todd Plesko, DART’s vice president of planning and development. In most other cities, Census estimates indicate that His-panics use public transportation at rates equal to or greater than the rest of the population.
Later this year, DART is slated to open a direct light-rail connection to Dallas/Fort Worth Interna-tional Airport, an attractive option for business professionals and occasional travelers.
Attracting more riders presents policymak-ers with a dilemma, however, as it pits equity values of assisting transit-dependent riders against those who view public transit more in terms of sustainability and reducing traffi c con-gestion. The broader public tends to show more support for the latter, which focuses on getting cars off the road during commuting hours. But commuter-focused systems experience large drop-offs after peak travel periods, making them expensive to operate.
UCLA’s Taylor points out that it’s generally more cost-effective to improve existing bus service than establish transit lines to potentially reach a new cohort of commuters. “We need to focus more on how to get bang-for-the-buck investments and not necessarily the next ribbon cutting,” he says.
Perhaps the most signifi cant challenge for systems is winning over the largely underserved segment of potential riders who have other means of getting around—known as “choice riders.” Michael Terry, president and CEO of Indianapolis Public Transportation Corp., says attracting more such riders will mean extending service to revi-
talized neighborhoods along with offering greater frequency of service and longer operating hours. “We’re trying to develop a system that supports economic development focusing on the areas of density,” he says. Indianapolis workers who travel by car reported median earnings about double that of city public transportation commuters.
There are also signifi cant demographic shifts that are naturally working in favor of tran-sit expansion. Transportation offi cials are eyeing millennials as they move into downtown con-dos in Indianapolis and other cities. Aging baby boomers, likewise, represent another opportunity.
The bottom line, though, is that when it comes down to how people travel, they’ll choose the most convenient, affordable option available. To that end, transit offi cials are working to fi ll the vital needs of transit-dependent commuters while at the same time also trying to appeal to new cohorts of travelers. “As our services are more attractive to the community,” Terry says, “you’ll see we’ll probably have the whole socio-economic spectrum riding transit.” G
Email [email protected]
SO
UR
CE
: U
.S. C
EN
SU
S B
UR
EA
U’S
AM
ER
ICA
N C
OM
MU
NIT
Y S
UR
VE
Y, 2010-2
013 E
STIM
ATE
S;
IMA
GE
S: S
HU
TTE
RS
TO
CK
.CO
M, D
AV
ID K
IDD
$31,017 $35,858 $33,726 $29,179 $36,765$36,803
$15,711NEW ORLEANS
$19,131ATL ANTA
$31,299CHICAGO
$19,499DALLAS
$18,143SAN DIEGO
$35,350NEW YORK CITY
59March 2014 | GOVERNING
GOV03_58.indd 59 2/18/14 11:57 AM
100 Blue Ravine RoadFolsom, CA 95630916-932-1300
Page #
__________Designer __________Creative Dir.
__________Editorial __________Prepress
__________Other ____________OK to go
5 25 50 75 95 100 5 25 50 75 95 100 5 25 50 75 95 100 5 25 50 75 95 100
BLACKYELLOW
MAGENTACYAN

a wide range of citizen/government inter-actions which can be entirely completed without leaving a laptop or tablet.
“The transformation of service delivery is remarkable,” says Don Kettl, dean of the School of Public Policy at the University of Maryland and a Governing columnist. The list starts with abandoned vehicle notifi ca-tions; procurement of birth, marriage and death certifi cates; and professional license renewals. It goes on and on to hunting and fi shing licenses, online fi ling of taxes, automobile registration renewals, driver’s license renewals, payment of court fi nes and fees, dog licenses, park passes, back-ground checks, traffi c ticket payments, unemployment claim fi lings, and absentee ballot fi lings. You name it, Web access has changed it.
There is a downside to the transforma-tion. People have become so conditioned to the smooth functioning of online ser-vice that “they expect the experience to be clean and fl awless, and they expect quick and eff ective results,” Kettl says. Exhibit
By Katherine Barrett and Richard Greene
Problem Solver | SMART MANAGEMENT
• “By collecting and sharing informa-tion, the Internet helps citizens to obtain information and knowledge about public issues much faster and more comprehensively than before.”And that’s just the beginning. Internet
access to an offi ce’s computers has made it far easier for employees to telecom-mute, notes Helen Purcell, the Maricopa County, Ariz., recorder. This is a particular benefi t in states or cities in which there’s a potentially long travel time to the state-house or city hall.
For many citizens, some of the most obvious management benefi ts of the Web are the wide variety of services that can now be provided online. It wasn’t so long ago that people were pretty darn impressed when they could look up the address and phone number of the appro-priate state or city offi ce to get a docu-ment. The next step was the seemingly magical ability to print out a form, fi ll it out by hand and then send it back by regu-lar mail. That’s all history. Now there are
Happy Birthday, World Wide WebIn its 25 years, the Web has drastically changed how government manages.
Just 25 years ago this month, a British computer scientist wrote a proposal spelling out an innova-tive notion that eventually evolved
into the World Wide Web. At the time, the proposal was intended to help CERN, a European research organization, make internal communications more effi cient. Even though the underpinnings of the idea for the World Wide Web were right there, “nobody at the time thought it was very important,” recalled Internet pioneer Paul Mockapetris.
What does this little history lesson have to do with government manage-ment? Everything. We fi rst started cover-ing state and local government around the same time as that Web memo was writ-ten. A few years later, we visited what was then called an online “forum” about government. A little more than a decade after that, the Web had become the most essential tool in our work—and increas-ingly that of state and local governments.
In a thoughtful email, Marc Holzer, dean of the School of Public Aff airs and Administration at Rutgers-Newark, pro-vided us with a few elements of this dra-matic evolution:• “Information now fl ows much more
rapidly inside municipal and state gov-ernments and at lower costs,” he wrote. “Viewing information as an important resource or source of ‘power,’ rapid collection and sharing of data implic-itly changes the structure of govern-ment from ‘top-down and hierarchal,’ to ‘bidirectional and fl at.’”
• “Municipal and state governments have become more sensitive to their external environments. Government’s relationship to stakeholders is rapidly moving from ‘governing’ to ‘servicing’; from ‘government-centric’ to ‘citizen-centric’; from ‘accepting changes inac-tively’ to ‘actively seeking changes.’”
GOVERNING | March 201460
FLIC
KR
/NIK
LA
S M
OR
BE
RG
GOV02_60.indd 60 2/14/14 4:03 PM
100 Blue Ravine RoadFolsom, CA 95630916-932-1300
Page #
__________Designer __________Creative Dir.
__________Editorial __________Prepress
__________Other ____________OK to go
5 25 50 75 95 100 5 25 50 75 95 100 5 25 50 75 95 100 5 25 50 75 95 100
BLACKYELLOW
MAGENTACYAN
A: Consider how shocked—shocked!—the American public was that Aff ordable Care Act sites were initially full of glitches and database potholes.
Great expectations are only one issue. Despite all the advances that the World Wide Web has brought to states and localities over the past 25 years, one of the anniversary gifts has an unmistakable resemblance to Pandora’s Box. A few of the demons that are emerging: • Access to libraries full of information
may seem appealing, but there’s a real risk that stakeholders can suff er from data overload, making it even more diffi cult to winnow down the material they really need. “While one chocolate chip cookie is great,” says Drummond Kahn, director of audit services in Portland, Ore., “40,000 all at once may not be as appetizing.”
• Though the phrase “digital divide” seems a little old fashioned, the nation still lacks “viable strategies to connect with the 19 percent of Americans who for various reasons are not digitally included,” Holzer says. What happens to the one out of fi ve Americans who can’t eff ectively interact with an Inter-net-based government?
• Mounting concern about cybersecu-rity makes it one of the very top issues in many cities and states. While most of the successful attacks on comput-ers, via the Web, have been privacy based—and that’s bad enough—there’s the potential for mayhem if public-sector computer systems shut down. Consider losing all the stop lights in New York City. “The attacks on per-sonal information and proprietary information will drive government and the technology providers to invest more [for] innovative security solu-tions,” says Teri Takai, the former CIO of Michigan and California, and cur-rently CIO for the U.S. Department of Defense. Then Takai asks an alarming rhetori-
cal question: “Will governments be able to keep up?” G
Email [email protected]
| BETTER GOVERNMENT
Measuring Results in the Real WorldA better way to link policy analysis and performance management.
Operation Breakthrough, a Kansas City social service agency founded in 1971 by two nuns, sits in one of the poorest parts of the city. It serves about 400 kids every day, 98 percent of whom come from families who live below the poverty line. About a quarter of the kids are homeless and another quarter are living in foster care.
Operation Breakthrough is one of dozens of nonprofi ts and government agencies trying to improve the lives of children and families in the city’s urban core. It’s clear that some of these agencies are doing vital work well. Yet Sister Berta Sailer says that conditions in the neighborhoods served have steadily worsened over the decades.
“How is it possible,” asks Mark Friedman, “to have all these successful programs while conditions get worse?” This paradox forms the starting point for his 2005 book, Trying Hard is Not Good Enough. Friedman, who has more than 30 years of experience in public administration and public policy, has devel-oped “results-based accountability,” a system of performance improvement that is radically diff erent from “logic models” and other more widely known approaches to policy analysis.
For most of my government career, I used logic models. When I came across Friedman’s work, I was struck by the power and utility of results-based accountability. Logic models assume a linear relationship between actions and results that simply doesn’t exist in the real world. And the strategies that policy analysts produce are often top-down. Friedman’s approach is cleaner, simpler, more practical and less elitist. It’s designed to answer three questions: How much are you doing? How well are you doing it? Is anyone better off ? Think of it as policy analysis and performance management for populists.
The point of social service programs is to improve community conditions. But what about the fact that an individual program cannot do this? Friedman shows how to do “population accountability” at the city, county or state level and “performance accountability” at the program or agency level. Then he shows how to put the two together to demonstrate the linkage between population and customer results.
One strong convert to Friedman’s system is Connecticut state Rep. Diana Urban. When Governing named her a Public Offi cial of the Year in 2010, it called results-based accountability “the defi ning aspect” of her career. She says it lets legislators become a “functional part” of eff ective policymaking and cites a results-accountability review of the state’s school-based health-care centers. The review documented that the highest use of the centers was for mental health issues and that the centers also were helping to reduce absenteeism by providing onsite health services. It showed that per-student cost was very low, resulting in funding for additional school health centers.
“The highest form of analysis is using intellect to aid interaction between people,” the late public policy pioneer Aaron Wildavsky wrote more than three decades ago. Friedman’s work shows in practical terms how language and common sense can be used to allow people to fi nd common ground and improve their communities. G
Email [email protected]
By Mark Funkhouser
61March 2014 | GOVERNING
The approach
is cleaner, simpler,
more practical and
less elitist. Think of
it as policy analysis
and performance
management
for populists.”
“
GOV02_60.indd 61 2/14/14 4:03 PM
100 Blue Ravine RoadFolsom, CA 95630916-932-1300
Page #
__________Designer __________Creative Dir.
__________Editorial __________Prepress
__________Other ____________OK to go
5 25 50 75 95 100 5 25 50 75 95 100 5 25 50 75 95 100 5 25 50 75 95 100
BLACKYELLOW
MAGENTACYAN

By Steve Towns
Keeping Down with the JonesesCan a little neighborly competition help reduce water usage?
Problem Solver | TECH TALK
cets and fi xtures. So when my local water agency recently asked me to cut con-sumption, my fi rst reactions was, “How?”
But the East Bay Municipal Utility District (MUD)—a public water agency that serves customers in Alameda and Contra Costa counties on the eastern side of San Francisco Bay—just wrapped up a test of new software that may entice drought-hardened Californians to close the spigot a little tighter by letting them compare their own water consumption with that of their neighbors. The utility gave 10,000 customers access to a Web portal during a one-year trial. The pilot let participants track their own water use and compare it to the average con-sumption by similar households in their area. It also showed customers how they stacked up against the most water-effi -cient families of comparable size. That data was coupled with conservation tips and links to rebates for water-saving equipment and appliances.
The trial resulted in a 5 percent reduction in water use by the test cus-tomers compared with a control group. An independent analysis of the experi-ment found that test households were more than twice as likely to participate in water audits or equipment rebate programs off ered by the utility. It also showed that households with the high-
As a longtime California resi-dent, I consider myself fairly water conscious, thanks to a series of droughts stretching
back nearly 40 years. As a high school freshman living in the San Francisco Bay Area during the historic 1976-77 drought, I remember folks in my neighborhood using buckets to catch what little rain fell during those years to water outside plants. We learned to take short showers, and we tried not to drink water from the tap because it tasted like saltwater, which was pushing inland toward the municipal water intake located in the Sacramento-San Joaquin River Delta.
Another six-year dry spell from 1987 to 1992 triggered constant reminders to con-serve. And now the lack of precipitation is hitting home again. 2013 is the driest year on record, according to state water offi cials. Gov. Jerry Brown declared a statewide drought emergency in January. Folsom Lake, a huge reservoir a few miles from my house, is less than 20 percent full and looks like a mud puddle. Outdoor watering is restricted to two days a week, and it may be eliminated altogether this summer if conditions don’t improve.
Like many Californians, I don’t leave the faucet running while shaving or brushing my teeth. My house, built in 1996, includes an array of “low-fl ow” fau-
est consumption tended to have the big-gest water savings.
These types of social norms-based effi ciency programs may not be new to energy customers, but they’re new to the water industry, says Andrea Pook, a spokeswoman for East Bay MUD. And they may prompt customers like me to take another look at their conservation habits. “People have heard the same con-servation messages a lot,” she says. “But this is a fresher approach—and knowledge is power. When you give people the infor-mation and you give them the tools to take action, it’s a good thing.”
The experiment ended in June, and the utility’s board of directors is slated to decide within the next month or so whether to continue and expand the pro-gram. “We’ll need to do some fi ne-tuning,” Pook says, “but our hope is that, pending approval from the board, we can roll this out to more and more customers over the next three years.”
With California sliding toward what’s likely to be a bone-dry summer, the new service could be a welcome addition to East Bay MUD’s water conservation eff orts. “We think it’s pretty promising,” Pook says, “and the timing couldn’t be more perfect.” G
Email [email protected]
GOVERNING | March 201462
California’s Folsom
Lake is less than
20 percent full.
FLIC
KR
/SJR
AN
KIN
GOV03_62.indd 62 2/14/14 4:05 PM
100 Blue Ravine RoadFolsom, CA 95630916-932-1300
Page #
__________Designer __________Creative Dir.
__________Editorial __________Prepress
__________Other ____________OK to go
5 25 50 75 95 100 5 25 50 75 95 100 5 25 50 75 95 100 5 25 50 75 95 100
BLACKYELLOW
MAGENTACYAN

Problem Solver | PUBLIC MONEY
63March 2014 | GOVERNING
By Frank Shafroth
New York City Mayor Bill de Bla-sio described social inequality in his inaugural address as a “quiet crisis” on par with fi s-
cal collapses, crime waves and terrorist attacks. He said income disparity was a struggle no less urgent to confront.
Unfortunately, it’s not being con-fronted, especially in cities where the “quiet crisis” is leading to bankruptcy. These cities have disproportionate levels of poverty, minorities, crime and dete-riorating tax bases. With each attempt
to balance their budgets, they are forced to reduce essential public services. That, in turn, leads those who can aff ord it, to leave—further exacerbating an erod-ing tax base and forcing even more cuts in essential public safety services. Each round of departures results in a smaller and poorer population and tax base.
That bleak spiral is playing out in Detroit, where the city is destitute, over-whelmed by legacy debts and far less able to compete in our 21st-century economy. In his fi rst address to his city, Detroit’s newly elected Mayor Mike Duggan urged citizens considering moving out of the city to hold off for six months to give him, his adminis-
tration and the new city council a chance to demonstrate measurable improvements in quality of life. “Give us six months and let us prove to you what we can do,” he said.
But it’s not clear that Duggan will even be given a fair chance to help make things right. As the new mayor was taking offi ce, the state of Michigan and representatives of Detroit’s thousands of creditors were meeting behind closed doors to negotiate the future of Detroit. No party responsible for a sustainable future for the city—and that includes Duggan—was invited. More-
over, the current federal municipal bank-ruptcy law provides that the path to exit municipal bankruptcy is through approval by a federal court of a plan of adjustment that fairly apportions the “haircuts” among all of a city’s creditors. The federal law similarly excludes a city’s future eco-nomic viability or sustainability as a factor.
Nearly a half century ago, President Lyndon B. Johnson created the Kerner Commission while race rioting was under-way in Detroit and other cities to investi-gate the causes. Upon signing the order establishing the commission, Johnson asked for answers to three basic questions about the riots: “What happened? Why
did it happen? What can be done to pre-vent it from happening again and again?”
The issues those questions raised about links between despair and unrest are relevant today, since there is a sharp diminution in both federal and state pro-grams to address disparities—like general revenue sharing and state revenue sharing programs. While the federal government and the states have broad economic and tax bases, cities and counties increasingly do not. Chapter 9, the federal municipal bankruptcy law, used to be a key tool for municipal utilities, special districts, vil-lages and school districts. Abruptly, in this decade, it has become a vital lifeline for major cities and counties from Jeff erson County, Ala., to Stockton, Calif., to Detroit.
It is not clear that the “lifeline” is up to the job. There is a profound risk with the unprecedented number of larger cit-ies that are in or have just emerged from municipal bankruptcy of going right back into a depressing economic cycle. That’s because the current laws (including state enabling statutes) do not take into account that large urban municipalities are very, very diff erent from agricultural or conser-vation districts.
Nor do they off er the city much room for growth. Bill Nowling, the spokesper-son for Detroit’s emergency manager, described the city’s secret negotiations with its creditors in New York as “three-dimensional chess,” with each of the city’s creditors intent on fi ghting to oppose any outcome under which they might take less. Key players include not just the city’s unions and retirees, but also its bond insurers, water and sewer bondholders, and other governments in the greater Detroit metropolitan region. Not at the table, of course, were Detroit’s citizens, taxpayers or its sustainable future. G
Email [email protected]
Double WhammyConfronting social inequality is harder when a city is struggling.
AP
IMA
GE
S.C
OM
Detroit’s bankruptcy makes
it nearly impossible for
Mayor Mike Duggan to
tackle social disparities.
GOV03_63.indd 63 2/14/14 4:07 PM
100 Blue Ravine RoadFolsom, CA 95630916-932-1300
Page #
__________Designer __________Creative Dir.
__________Editorial __________Prepress
__________Other ____________OK to go
5 25 50 75 95 100 5 25 50 75 95 100 5 25 50 75 95 100 5 25 50 75 95 100
BLACKYELLOW
MAGENTACYAN
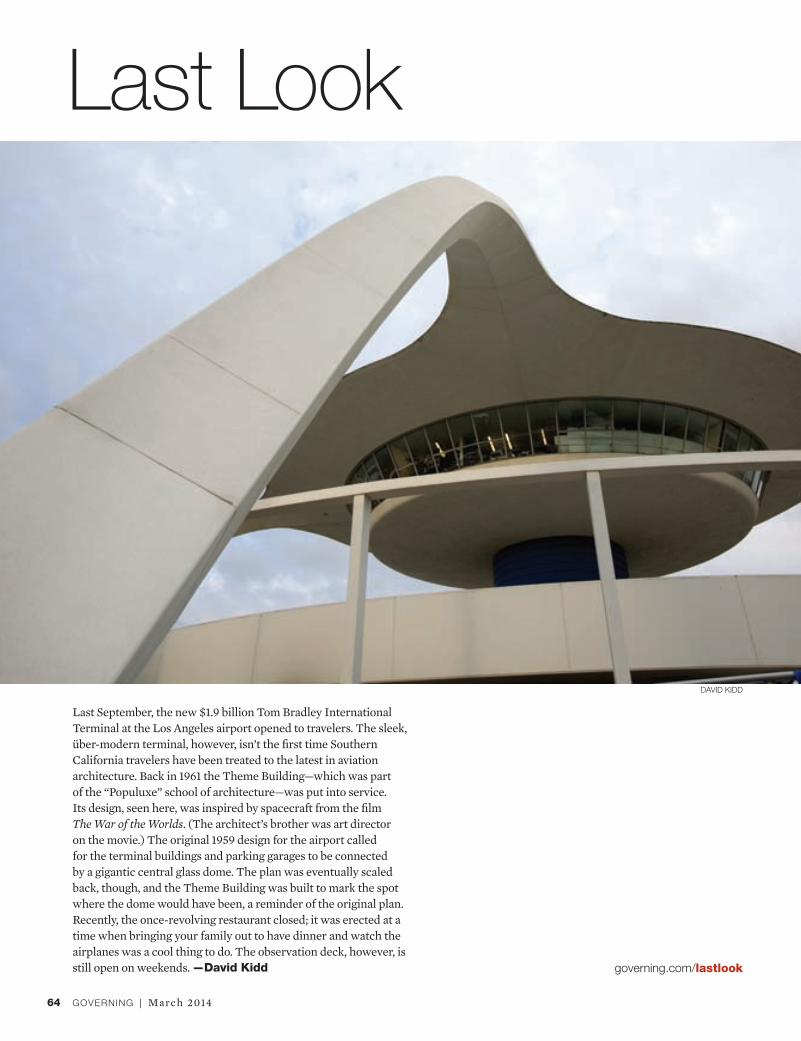
GOVERNING | March 201464
Last Look
Last September, the new $1.9 billion Tom Bradley International Terminal at the Los Angeles airport opened to travelers. The sleek, über-modern terminal, however, isn’t the fi rst time Southern California travelers have been treated to the latest in aviation architecture. Back in 1961 the Theme Building—which was part of the “Populuxe” school of architecture—was put into service. Its design, seen here, was inspired by spacecraft from the fi lm The War of the Worlds. (The architect’s brother was art director on the movie.) The original 1959 design for the airport called for the terminal buildings and parking garages to be connected by a gigantic central glass dome. The plan was eventually scaled back, though, and the Theme Building was built to mark the spot where the dome would have been, a reminder of the original plan. Recently, the once-revolving restaurant closed; it was erected at a time when bringing your family out to have dinner and watch the airplanes was a cool thing to do. The observation deck, however, is still open on weekends. —David Kidd
DAVID KIDD
governing.com/lastlook
GOV03_64.indd 64 2/14/14 4:08 PM
100 Blue Ravine RoadFolsom, CA 95630916-932-1300
Page #
__________Designer __________Creative Dir.
__________Editorial __________Prepress
__________Other ____________OK to go
5 25 50 75 95 100 5 25 50 75 95 100 5 25 50 75 95 100 5 25 50 75 95 100
BLACKYELLOW
MAGENTACYAN

ASSURED GUARANTY MUNICIPAL | MUNICIPAL ASSURANCE CORP. | ASSURED GUARANTY CORP.
EMBRACE POSSIBILITIES, INVEST IN CERTAINTIES.
Ass
ure
d G
uar
anty
Munic
ipal
Cor
p. a
nd a
ffi lia
ted in
sure
rs, N
ew Y
ork,
NY.
| M
AC
is n
ot li
cens
ed in
all
jurisd
ictio
ns, i
nclu
din
g C
alifo
rnia
; see
MAC
mun
ibon
ds.
com
/lic
ense
s |
Ass
ure
d G
uar
anty
Ltd
. (N
YSE:
AG
O)
Bond insurer for over 10,000 issuers. $400 million of daily trading liquidity. Trusted by holders of
$350 billion of our insured municipal bonds. For a quarter century, our strong guaranty and responsive
service have helped issuers launch cost-saving insured bonds with speed and certainty. Choose
Assured Guaranty, the proven leader in municipal bond insurance. More at AssuredGuaranty.com
TEAMWORK GUARANTEED
100 Blue Ravine RoadFolsom, CA 95630916-932-1300
Page #
__________Designer __________Creative Dir.
__________Editorial __________Prepress
__________Other ____________OK to go
5 25 50 75 95 100 5 25 50 75 95 100 5 25 50 75 95 100 5 25 50 75 95 100
BLACKYELLOW
MAGENTACYAN

INNOVATION FORSAFETY & EFFICIENCY
HELP, Inc. commercial vehicle enforcement technologies have played a key role in improving highway safety over the past two decades. Services such as PrePass, 360SmartView and other technologies:
Call (888) 459-5394 to learn more about technology solutions from HELP, Inc.Visit or schedule a technology demonstration at www.HELPinc.us
100 Blue Ravine RoadFolsom, CA 95630916-932-1300
Page #
__________Designer __________Creative Dir.
__________Editorial __________Prepress
__________Other ____________OK to go
5 25 50 75 95 100 5 25 50 75 95 100 5 25 50 75 95 100 5 25 50 75 95 100
BLACKYELLOW
MAGENTACYAN


![[flora kidd] horas íntimas](https://img.pdfslide.us/doc/110x75/568cad7c1a28ab186dabe421/flora-kidd-horas-intimas.jpg)