Embed Size (px)
Citation preview

13Environment & Urbanization Copyright © 2011 International Institute for Environment and Development (IIED).Vol 23(1): 13–28. DOI: 10.1177/0956247811398589 www.sagepublications.com
The state of urban health in India; comparing the poorest quartile to the rest of the urban population in selected states and cities
SIDDHARTH AGARWAL
ABSTRACT India has the world’s second largest urban population (after China). This paper shows the large disparities within this urban population in health-related indicators. It shows the disparities for child and maternal health, provision for health care and housing conditions between the poorest quartile and the rest of the urban population for India and for several of its most populous states. In the poorest quartile of India’s urban population, only 40 per cent of 12 to 23 month-old children were completely immunized in 2004–2005, 54 per cent of under-five year-olds were stunted, 82 per cent did not have access to piped water at home and 53 per cent were not using a sanitary flush or pit toilet. The paper also shows the large disparities in eight cities between the poorest population (the population in the city that is within the poorest quartile for India’s urban areas), the population living in settlements classified as “slums” and the non-slum population. It also highlights the poor performance in some health-related indicators for the population that is not part of the poorest quartile in several states – for instance in under-five mortality rates, in the proportion of stunted children and in the proportion of households with no piped water supply to their home.
KEYWORDS health care / housing / inequality / poverty / sanitation / urban health / water
I. IDENTIFYING THE SCALE AND NATURE OF URBAN DEPRIVATION
It is obvious that effective policies for poverty reduction depend on the availability of good data on who is poor and the nature of their deprivation. The data are needed not only for national populations but also for states, rural and urban populations and cities. Many comparisons of health-related deprivation are made between rural and urban areas, but far less attention has been given to identifying the range of health-related deprivation within urban populations.
Estimates as to the proportion of the urban population in India that faces deprivation can be drawn from three different data sets. The first is based on expenditure on consumption goods, from which a poverty line is derived. Official statistics suggest that around 24 per cent of India’s urban population was poor in 2001, with an expenditure on consumption goods below the poverty line of Rs 454 per month.(1) Estimates for 2004–2005, with some revisions in the methodology for setting the poverty line, suggested
Siddharth Agarwal is a physician by training and has worked in the fields of medicine, research and programming in urban health and nutrition, and policy support to the government of India. He is Director of the Urban Health Resource Centre (UHRC), a non-profit organization, which aims to address the health and nutritional issues of the urban poor. He is Adjunct Faculty at Johns Hopkins Bloomberg School of Public Health and in Department of Global Health at George Washington University School of Public Health and Health Services. He has published widely on different aspects of urban health and is a member of several country- level and international committees and expert groups on urban health. He is President of the International Society of Urban Health, New York.
The author is grateful to Dr S Kaushik and Dr Paromita Bannerjee for carrying out the analysis as part of the UHRC team. The author is also grateful to Dr Fred Arnold and Dr Sunita Kishor, senior researchers from ORC Macro, Dr Kamla Gupta from International Institute of Population Studies, Mumbai, and Dr Massee Bateman for their input

E N V I R O N M E N T & U R B A N I Z AT I O N Vol 23 No 1 April 2011
14
25.7 per cent.(2) But there are worries that the poverty line is set too low in relation to the costs of non-food needs in many urban areas, especially in successful cities where the costs of non-food needs are particularly high.(3)
The second is based on housing conditions (e.g. the proportion living or not living in slums). But this depends on accurate and complete surveys. Official statistics on the proportion of the population living in slums are known to be inaccurate for many cities in India because they do not include unaccounted for and unrecognized informal settlements and people residing in poor quality housing in inner-city areas, on construction sites, in urban fringe areas and on pavements.(4) For instance, a study in Indore showed that there were 438 officially recognized slums but a process of mapping found an additional 101 slums. Official statistics suggest that of Indore’s 1.5 million inhabitants in 2001, 261,000 lived in slums (17.7 per cent of Indore’s population). If a more realistic estimate of the slum population of the city is considered, including the population in the additional 101 slums, more than 40 per cent of Indore’s population lives in slums/urban poor settlements.(5) In Delhi, the 2001 census estimated an urban slum population of 1.85 million, which was 18.7 per cent of Delhi’s urban population.(6) But if full account is taken of unauthorized settlements, including jhuggi jhodpi clusters (squatter settlements), slum-designated areas (slums recognized by the government, many of which are in the walled city), unauthorized colonies and jhuggi jhodpi resettlement colonies (squatter resettlement colonies), these are estimated to have a population of 9.84 million in 2011 and thus represent more than half of Delhi’s total population, which is estimated to be 19 million in 2011.(7) A further 100,000 people are homeless and reside on pavements, under bridges and by the roadside; many are rickshaw pullers and casual workers.(8) In Agra, a survey identified 393 slums but only 215 of them were recorded on the official list; if a more realistic population estimate of the city’s slums is taken including that of these additional slums, the number of slum dwellers in Agra would rise from 300,000 to 841,000.(9) Thus, any statistic on slum population for a city or state has to be viewed with caution, as it may only include settlements that have been officially classified as “slums” or “notified slums”. As a large proportion of low-income urban clusters are informal or “illegal”, they are not part of official slum lists and hence are often not part of the public authorities’ mandate to provide basic services such as drainage, water, sanitation and health care. According to National Sample Survey 58th Round (2002), 49.4 per cent of slums were non-notified.(10)
Another reason for the undercount of India’s slum population was that in the 2001 census, data on slums were only collected for urban centres with 50,000+ inhabitants; the total slum population in India would be higher if the census had covered all urban centres. Data from the 2001 census showed that many urban centres in India had more than one-quarter of their population in slums, including some with more than 40 per cent and a few with more than one-half (see Table 1 for some examples).
The third set of estimates on urban deprivation in India is based on a wealth index constructed from data in the National Family Health Survey 2005–2006. This allows the urban population to be classified according to their wealth, based on an index that includes consideration of 33 assets and housing characteristics.(11) This allows comparisons between the poorest quartile of the population calculated using this wealth index and the rest of the population – as is presented in the rest of this paper.(12) For almost all indicators relating to health,
during finalization of the re-analysis methodology. The author acknowledges Dr David Satterthwaite’s guidance in the early stages of the manuscript.
The original data analysis carried out by UHRC, on which this paper is based, was funded by the United States Agency for International Development, India (USAID–India) (Grant to World Learning USAID GSM009). The views expressed in this paper do not necessarily reflect those of USAID–India.
Address: 89/4 Krishna Nagar, Safdarjang Enclave, New Delhi 110 029, India; e-mail: [email protected]; [email protected]
1. Government of India (2001), “Poverty estimates for 1999–2000”, Planning Commission, New Delhi, accessed 31 December 2010 at http://www.planningcommission.gov.in/hindi/reports/articles/ncsxna/index.php?repts=ar_pvrty.htm.
2. See Government of India (2009), “Report of the expert group to review the methodology for estimation of poverty”, Planning Commission, New Delhi, 32 pages.
3. See, for instance, Bapat, Meera (2009), Poverty Lines and Lives of the Poor; Underestimation of Urban Poverty, The Case of India, Poverty Reduction in Urban Areas Series, Working Paper 20, IIED, London, 53 pages.
4. Agarwal, S and K Sangar (2005), “Need for dedicated focus on urban health within national rural health mission”, Indian Journal of Public Health Vol 49, No 3, pages 141–151.
5. Taneja, S and S Agarwal (2004), Situational Analysis for Guiding USAID/EHP India’s Technical Assistance Efforts in Indore, Madhya Pradesh, India, Environmental Health Project Activity Report 133, Washington DC.
6. Press Information Bureau (2007), “Poverty estimates for 2004–2005”, accessed 31 December 2010 at http://

T H E S TAT E O F U R B A N H E A LT H I N I N D I A
15
health care or key social or housing-related determinants of health, these show large and sometimes dramatic differences between the poorest quartile and the rest of the urban population, as illustrated in Figures 1–7. This does not show the proportion of the urban population facing deprivation but shows how high a proportion of the poorest quartile (and the proportion of the rest of the urban population) faces deprivation with regard to health outcomes, poor housing conditions or the availability of health services.
This paper presents data for child (under-five) mortality and health, maternal health, health care and environmental health for the poorest urban quartile and for the rest of the urban population for all India and for eight states in India. It also includes some data for particular cities. The analyses were prepared by the Urban Health Resource Centre in New Delhi,(13) drawing on data from the National Family Health Survey 2005–2006. The data tables and a range of city and state reports from which this draws are available on-line at no charge;(14) they also cover many more indicators than are presented here.
II. CONTEXT
By 2001, India’s urban population had reached 286 million (the second largest national urban population in the world) and projections suggest it will have reached 358 million by 2011. Between 1981 and 2001, the number of cities with more than one million inhabitants grew from 12 to 35, and by 2015 the number is expected to reach 50.(15)
pib.nic.in/release/release.asp?relid=26316.
7. Government of National Capital Territory of Delhi (2006), Economic Survey of Delhi 2005–2006, Planning Department, page 364; also Bhan, Gautam (2009), “This is no longer the city I once knew; evictions, the urban poor and the right to the city in Millennial Delhi”, Environment and Urbanization Vol 21, No 1, April, pages 127–142.
8. Agarwal, S, A Srivastava, B Choudhary and S Kaushik (2007), State of Urban Health in Delhi, Ministry of Health and Family Welfare, Government of India and Urban Health Resource Centre, Delhi, page 14.
9. Agarwal, S, S Kaushik and A Srivasatava (2006), State of Urban Health in Uttar Pradesh, Ministry of Health and Family Welfare, Government of India and Urban Health Resource Centre, Delhi, 79 pages; also Karishma, Rajesh Dubey, Anju Dadhwal, Srinivas
TABLE 1Cities in Uttar Pradesh, Rajasthan, Jharkhand, Madhya Pradesh and Maharashtra with more
than one-quarter of their populations in slums in 2001
City Total population Slum population % population in slums
Greater Mumbai 11,978,000 6,475,000 54.1Aligarh 667,732 350,025 52.4Moradabad 641,240 328,379 51.2Ghaziabad 968,521 464,212 47.9Meerut 1,074,229 471,000 43.8Jhansi 383,248 163,072 42.5Dewas 231,672 98,250 42.4Nagpur 2,052,000 737,000 35.9Jharia 82,000 28,000 34.1Gorakpur 624,570 208,981 33.5Saharanpur 452,925 144,030 31.8Ujjain 431,162 120,330 27.9Thane 1,263,000 351,000 27.8Ratlam 234,419 64,054 27.3Jabalpur 1,098,000 275,662 25.1
NOTE: Many of the statistics above that relate to the “slum” population and the percentage in “slums” may be considerable underestimates. See, for instance, the discussion on the undercount in Agra and Indore in the text; both these cities would be included in this table if the undercount were rectified.
SOURCE: Drawn from Government of India 2001 census data, New Delhi.

E N V I R O N M E N T & U R B A N I Z AT I O N Vol 23 No 1 April 2011
16
India also has among the world’s largest urban population with below poverty line incomes and the world’s largest population living in slums. In 2004–2005, 80.8 million urban dwellers (25.6 per cent) were below the poverty line and the largest concentrations of urban poor populations were in Maharashtra (14.6 million), Uttar Pradesh (11.7 million) and Madhya Pradesh (7.4 million), and Tamil Nadu, Karnataka and Andhra Pradesh (each with between 6–6.9 million).(16) This is also likely to be an underestimate, for reasons discussed later. The 2001 census recorded 42.6 million people living in slums but, as discussed above, this too is likely to be an underestimate.
III. CHILDREN’S HEALTH
Figure 1 shows under-five mortality rates for India’s urban population, for Delhi and for six states for 2005–2006, for the poorest quartile of the urban population and the rest of the urban population. The under-five mortality rate for all India was 73 per 1,000 live births in the poorest quartile and 42 per 1,000 live births in the rest of the urban population. Among the six states the highest under-five mortality rate in the poorest quartile was in Uttar Pradesh, India’s most populous state, which had 34 million urban dwellers in the 2001 census.(17)
Figure 1 is also a reminder of how large the differentials are within India’s urban population – the under-five mortality rate for the poorest quartile in Uttar Pradesh was four times that of the rest of the urban populations in Maharashtra and Madhya Pradesh. In Madhya Pradesh, the under-five mortality rate among its poorest quartile was more than three times that of the rest of its urban population.
Figure 2 shows the percentage of children completely immunized in 2005–2006. For India’s urban population, only 40 per cent of children were completely immunized in the poorest quartile, compared to 65 per
FIGURE 1Under-five mortality rates: urban populations of India,
Delhi and six states
0
20
40
60
80
100
120
Uttar Pradesh Rajasthan MadhyaPradesh
Jharkhand Bihar Delhi All India Maharashtra
Mor
talit
y/1,
000
live
birt
hs
Poorest quartile
Rest of urban population
Varadan, Mani Gupta and Siddharth Agarwal (2004), Situational Analysis Report of Agra City for Guiding Urban Health Programme, USAID–EPH, New Delhi, 50 pages.
10. Government of India (2002), National Sample Survey 58th Round (2002), Ministry of Statistics and Programme Implementation, Government of India, New Delhi, page 12.
11. These include a range of housing characteristics (including electrification, type of windows, drinking water source, type of toilet facility, flooring, roofing and exterior walls materials, cooking fuel, house ownership) and a range of assets (including ownership of a mattress, chair, cot/bed, table, electric fan, radio, television, sewing machine, mobile or other phone, computer, fridge, watch or clock, bicycle or motorcycle).
12. The National Family Health Survey (NFHS–3) used the wealth index (which combines data on a household’s ownership of assets into an index using the factor analysis procedure) based on 33 assets described in 11 above, for assigning economic status scores to the households. In this paper, to arrive at health indicators for the urban poor, the cut-offs based on the wealth index were calculated specifically for the urban sample population in order to adequately capture the intra-urban differences. The sample was divided into quartiles and the lowest quartile taken as representative of the urban poverty in India in view of the Planning Commission estimates that put the number of urban poor in India at about 80.8 million (or 25.7 per cent of the total urban population). Using this method, 22.6 per cent of the NFHS’s sample urban population was categorized as poor (lowest quartile).
13. See http://www.uhrc.in/ for more details.
14. These can be downloaded from http://www.uhrc.in/.
15. Gupta, K, F Arnold and H Lhungdim (2009), Health and Living Conditions in Eight Indian Cities; National Family Health

T H E S TAT E O F U R B A N H E A LT H I N I N D I A
17
cent for the rest of the urban population. The percentage of children completely immunized was particularly low among the poorest quartile of the urban populations in Uttar Pradesh, Bihar, Rajasthan and Jharkhand; it was also only 40 per cent in Delhi. Even among the rest of the urban population, fewer than half the children were completely immunized in Rajasthan and Uttar Pradesh.
For India’s urban population in 2005–2006, 54 per cent of children were stunted and 47 per cent underweight in the poorest urban quartile,
FIGURE 2Percentage of children completely immunized: urban populations
of India, Delhi and seven states
0
10
20
30
40
50
60
70
80
90
100
Uttar Pradesh Bihar Rajasthan Jharkhand Delhi All India Maharashtra MadhyaPradesh
West Bengal
Per
cent
age
Poorest quartile
Rest of urban population
FIGURE 3Percentage of children under five who are stunted: urban
populations of India, Delhi and seven states
0
10
20
30
40
50
60
70
80
90
100
Uttar Pradesh Maharashtra Bihar Delhi MadhyaPradesh
All India Rajasthan West Bengal Jharkhand
Per
cent
age
Poorest quartile
Rest of urban population
Survey (NFHS-3), India, 2005–2006, International Institute for Population Sciences, Calverton, Maryland, 113 pages.
16. Urban Health Resource Centre (2007), “Health of the urban poor in India; key results from the National Family Health Survey, 2005–2006”, Urban Health Resource Centre, 6 pages. This is likely to be an underestimate as poverty lines in India are not adjusted sufficiently for the higher cost of non-food necessities evident in many cities.
17. See reference 9, Agarwal, Kaushik and Srivasatava (2006).

E N V I R O N M E N T & U R B A N I Z AT I O N Vol 23 No 1 April 2011
18
compared to 33 per cent and 26 per cent, respectively, for the rest of the urban population. Figure 3 highlights two other issues – the fact that even in the best performing states close to half the children under five were stunted among the poorest quartile, and the fact that in all but West Bengal more than one-quarter of the children under five within the rest of the urban population were stunted. High levels of stunted growth and being under-weight for age among the urban poor in India in addition to pointing high proneness to infections owing to sub-optimal physical environment, is also indicative of high levels of food insecurity among this segment of the population. A study carried out in the slums of Delhi showed that 51% of slum families were food insecure.(18) It is worth noting that a large majority of these children will, in the next 15 years, form the bulk of the urban informal sector workforce of the world’s second fastest growing economy. The urban contribution to India’s GDP is estimated at 60 to 70 per cent and is increasing steadily. If we were able to take better care of the nutrition and food security of this segment of the population, they would be more able, and would make a more robust contribution to the country’s economy.
IV. MATERNAL HEALTH
Among India’s urban population, one should note the much lower proportion of mothers receiving maternity care among the poorest quartile; only 54 per cent of pregnant women had at least three ante-natal care visits compared to 83 per cent for the rest of the urban population. Figure 4 also highlights how low a proportion of mothers within the poorest quartile are adequately served in most states – less than a quarter in Bihar and Uttar Pradesh and less than half in Madhya Pradesh, Delhi, Rajasthan and Jharkhand.
With regard to health personnel attendance at births, among the poorest quartile of India’s urban population only half of births were assisted by health personnel in 2005–2006; among the rest of the urban population, 84
FIGURE 4Percentage of mothers with at least three ante-natal care visits:
urban populations of India, Delhi and seven states
0
10
20
30
40
50
60
70
80
90
100
Bihar UttarPradesh
MadhyaPradesh
Delhi Rajasthan Jharkhand All India West Bengal Maharashtra
Per
cent
age
Poorest quartile
Rest of urban population
18. Agarwal S, Sethi V, Gupta P, Jha M, Agnihotri A, Nord M (2009), “Experiential household food insecurity in an urban underserved slum of North India”, Food Security, Vol 1, Number 3, pages 239-250

T H E S TAT E O F U R B A N H E A LT H I N I N D I A
19
per cent were assisted by health personnel. The percentage of births assisted by health personnel was particularly low among the poorest quartile of the urban populations in Uttar Pradesh, Delhi, Bihar and Rajasthan (Figure 5).
V. HOUSING, PHYSICAL ENVIRONMENT AND LIVING CONDITIONS
Figures 6 and 7 show the percentage of households with access to piped water at home and that use a flush or pit toilet for disposing of excreta, for the poorest quartile and the rest of the urban population.
Among the poorest quartile of India’s urban population in 2005–2006, 81.5 per cent did not have access to piped water at home and 52.8 per cent did not use a sanitary flush or pit toilet; among the rest of the urban population, 62 per cent had access to piped water at home and 96 per cent used a sanitary toilet.
Even in the best performing states, only half the population in the poorest quartile had piped water in their homes; for all India the figure was less than 20 per cent and in Delhi, the capital and one of the wealthiest cities, it was only 30 per cent. In Bihar, just 2 per cent of the poorest quartile had access to a piped water supply at home; in Uttar Pradesh, the state with the largest urban population, it was just 12 per cent. What is also noticeable is that more than one-third of urban households in the rest of the urban population did not have a piped water supply to their home.
Figure 6 also highlights the scale of the differentials within India’s urban population – just 2 per cent of the poorest urban quartile in Bihar had access to a piped water supply at home, while in the rest of Maharashtra’s urban population, more than 90 per cent were served.
With regard to sanitation, for all India less than half the poorest urban quartile had a flush toilet or pit latrine for disposing of excreta in 2005–2006, whereas more than 95 per cent of the rest of the urban population had this facility. This is quite a low standard, as the percentage
FIGURE 5 Percentage of births assisted by health personnel: urban
populations of India, Delhi and seven states
0
10
20
30
40
50
60
70
80
90
100
UttarPradesh
Delhi Bihar Rajasthan Jharkhand MadhyaPradesh
All India Maharashtra West Bengal
Per
cent
age
Poorest quartile
Rest of urban population

E N V I R O N M E N T & U R B A N I Z AT I O N Vol 23 No 1 April 2011
20
with flush toilets would be much lower since pit latrines are still so common in urban areas. In Bihar, Madhya Pradesh and Jharkhand, more than two-thirds of the poorest quartile did not use a flush or pit toilet for disposing of excreta. In Delhi, one-third of the poorest quartile did not have access to a sanitary toilet. A recent study(19) analyzed evidence on the adverse economic impacts of inadequate sanitation, including costs associated with death and disease, accessing and treating water, and losses in education, productivity, time and tourism. The findings are based on 2006 figures, although a similar magnitude of losses is likely in later years. The report indicates that premature mortality and other health-related impacts
FIGURE 6Percentage of households with access to a piped water supply at
home: urban populations of India, Delhi and six states
0
10
20
30
40
50
60
70
80
90
100
Bihar Jharkhand Uttar Pradesh All India MadhyaPradesh
Delhi Maharashtra Rajasthan
Per
cent
age
Poorest quartile
Rest of urban population
FIGURE 7Percentage of households using a flush or pit toilet for disposing
of excreta: urban populations of India, Delhi and seven states
0
10
20
30
40
50
60
70
80
90
100
Bihar MadhyaPradesh
Jharkhand Rajasthan All India Maharashtra Uttar Pradesh Delhi West Bengal
Per
cent
age
Poorest quartile
Rest of urban population
19. World Bank (2010), The Economic Impacts of Inadequate Sanitation in India, Report for the Water and Sanitation Programme’s (WSP) Global Economics of Sanitation Initiative (ESI), Water and Sanitation Programme, the World Bank, Washington DC.

T H E S TAT E O F U R B A N H E A LT H I N I N D I A
21
of inadequate sanitation were the most costly at US$ 38.5 billion (Rs 1.75 trillion, 71.6 per cent of total impacts), followed by productive time lost to access sanitation facilities or sites for defecation, at US$ 10.7 billion (Rs 487 billion, 20 per cent), and drinking water-related impacts at US$ 4.2 billion (Rs 191 billion, 7.8 per cent). Inadequate sanitation causes India considerable economic losses, equivalent to 6.4 per cent of India’s GDP in 2006 at US$ 53.8 billion (Rs 2.4 trillion).
Among the poorest quartile in Maharashtra, fewer than half the households had access to piped water at home in 2005–2006 and half did not use a sanitary toilet (among the rest of the urban households, 88 per cent had piped water supplies and 95 per cent had a flush or pit toilet for disposal of excreta). In Delhi, the national capital, among the poorest quartile, 70 per cent did not have access to piped water at home and 34 per cent did not use a flush toilet or pit latrine. A large proportion of slums are located adjacent to large open drains, dumping grounds, or railway lines and slum families have to live amidst heaps of garbage, faeces strewn in the lanes or around the slum, clogged drains with stagnant slushy water. Such adversities in the physical environment lead to contamination of water, proliferation of flies, rodents and mosquitoes – that carry various diseases. Consequently slum families are prone to risks of excreta such as diarrhoea, typhoid, jaundice and vector-related diseases such as dengue, chikungunya and leptospirosis.
VI. POVERTY, SLUMS AND HEALTH
With regard to the overlap between those living in slums and those with below poverty line incomes, for urban India the figures for the proportion of the population living in slums and the proportion living below the poverty line are both around 25 per cent. Yet there are large differences when viewing statistics for particular states or cities. For instance, for Delhi, a relatively low proportion of the population was considered poor (12.9 per cent of its urban population below the poverty line in 2004–2005) but, as noted above, the proportion living in poor quality housing in slums and informal settlements is much higher. In Mumbai, Delhi and many other cities, a high proportion of those living in slums have income levels above the poverty line, although this raises issues of whether the poverty line applied in such cities is appropriate to the costs of basic needs there. In addition, a considerable proportion of the population with below poverty line incomes does not live in slums, although this too may be because of the undercounting of slums or poverty clusters,(20) as illustrated by the examples of Indore, Delhi and Agra given above. It may be that far fewer urban poor, as defined by the poverty line, live outside slums, were there a comprehensive survey of the slums that the official figures missed.
With regard to the overlap between those in the poorest urban quartile and those living in slums, certainly a high proportion of the poorest urban quartile in India and in each state is likely to live in slums and unlisted poverty clusters, especially if attention is given to improving the accuracy and comprehensiveness of statistics on slum populations. Also, in most states or urban centres, a high proportion of the rest of the urban population will not live in slums. But in many Indian cities, more than a quarter of the population lives in slums so there must be a large population living in slums that are not part of the poorest quartile for
20. The use of the term “slum” in India is ambiguous in that it is often understood to include only settlements that are officially designated as “slums”, and leaves out squatters, pavement dwellers and other poverty clusters.

E N V I R O N M E N T & U R B A N I Z AT I O N Vol 23 No 1 April 2011
22
that city. For instance, in Mumbai and Delhi, in 2001, more than half the population lived in slums and unlisted poverty clusters.
However, slums including unlisted poverty clusters have the highest concentration of poor people and often the worst living conditions – especially if efforts are made to include a more accurate count of slum dwellers. It is therefore important that programmes aimed at addressing urban poverty and related issues facilitate periodic updating of official slum lists by city authorities. Such efforts, when they succeed, will enable more urban disadvantaged communities to become eligible for slum improvement programmes such as the Basic Services for the Urban Poor (BSUP) and Rajiv Awas Yojana components of the government of India’s flagship urban programme – the Jawaharlal Nehru National Urban Renewal Mission. Guidelines of Rajiv Awas Yojana mandate that slum lists of Urban Local Bodies (Municipal Bodies) be updated by inclusion of unlisted slums with help of satellite image and ‘ground truthing’ exercise with the help of NGO/CBO representatives. This is a promising policy mandate with the potential of acknowledging the hitherto unlisted poverty clusters in cities.
VII. DATA FROM THE EIGHT-CITY STUDY
Data are also available for eight cities that compare health and living conditions between the population in the city that is within the poorest quartile of India’s urban population (called “the poorest” in the text and figures below) and the rest of the city’s population. This is also drawn from the 2005–2006 National Family Health Survey. Care is needed in interpreting these statistics because the proportion of a city’s population that is within the poorest quartile of India’s total urban population varies – it can be well below 25 per cent (in Mumbai it is only 7.7 per cent, in Indore 12 per cent, in Delhi and Kolkata 14 per cent) or well above 25 per cent (although for the eight cities studied, it was always below 25 per cent). This shows some interesting results. For instance, as might be expected, for cities for which an under-five mortality rate could be calculated for the poorest, the rate was higher than that for slums – for instance, in Meerut, it was 118.7 per 1,000 live births for the poorest, 86.1 in census slums (settlements classified as slums in the 2001 census) and 69.4 in census non-slums.
In all eight cities, a considerable proportion of the poorest population did not live in census slums. In Indore, 84 per cent of the 12 per cent of its population that are the poorest did not live in slums. For Hyderabad the figure was 76 per cent of its poorest population not living in slums and in Chennai, 63 per cent. For the rest of the cities the figure varied between 47 per cent (Nagpur) and 21 per cent (Mumbai). Of course, part of this can be explained by the undercounting of slums or poverty clusters noted above. But it is also a reminder that programmes to reduce urban poverty by addressing the needs of the poorest groups (defined by the wealth index) need to identify and focus on disadvantaged urban populations beyond slums.
The study of these eight cities looked at a comparable range of health, maternal health and health care, and environmental health indicators to those for the states, as presented in Figures 1–7. Some are discussed here but, again, caution is needed when comparing these with the previous figures because the “poorest” population is not the poorest quartile in that city (according to the wealth index) but the population in that city that is within the poorest quartile of India’s urban population.

T H E S TAT E O F U R B A N H E A LT H I N I N D I A
23
With regard to child mortality, rates for infant and under-five mortality were higher among the urban poor children than they were for those living in slums or non-slums; the especially high under-five mortality rate for the poorest in Meerut was noted above.
Regarding child immunization, in five of the eight cities, more than one-third of children living in slums had not received all basic vaccinations. In Delhi, 13.5 per cent of children in slums had received no vaccinations and among the poorest in Delhi, 26 per cent had received no vaccinations.
FIGURE 8Percentage of children who are stunted: eight Indian cities
0
10
20
30
40
50
60
70
80
90
100
Kolkata Mumbai Nagpur Indore Hyderabad Chennai Delhi Meerut
Per
cent
age
Census slum
Census non-slum
Poorest
FIGURE 9Percentage of mothers with three or more ante-natal care visits:
eight Indian cities
0
10
20
30
40
50
60
70
80
90
100
Meerut Delhi Indore Kolkata Nagpur Hyderabad Mumbai Chennai
Per
cent
age
Census slum
Census non-slum
Poorest

E N V I R O N M E N T & U R B A N I Z AT I O N Vol 23 No 1 April 2011
24
With regard to children who were undernourished, a high proportion of children were stunted (height-for-age) in all the cities (as was the case in the urban populations of the states, as discussed earlier). When considering total city populations, Chennai had the lowest percentage of children who were stunted (25.4 per cent), while Mumbai had the highest (45.4 per cent). The proportion stunted was always highest among the poorest population and also always higher in slum populations compared to non-slum populations. Among the poorest, the percentage of children who were stunted was more than 50 per cent in Chennai, Hyderabad and Delhi and 65 per cent in Meerut. Figure 8 also highlights how a significant proportion of children in non-slums were stunted; only in Hyderabad and Kolkata is the figure below 20 per cent. A high level of stunting (which is a reflection of food insecurity among these families) points to the need to rapidly improve access by these urban poor families to the government’s food subsidy schemes.
With regard to ante-natal health care (Figure 9), the percentage of mothers who received at least three ante-natal care visits varied a lot by city (as it did for the urban populations in the states covered in Figure 4). Among the eight cities, for the poorest, the figure varied from only 32 per cent in Meerut and 41 per cent in Delhi to 99 per cent in Chennai. For the slum populations, it varied from 58 per cent in Delhi to 99 per cent in Chennai. However, the percentage of mothers who received all recommended types of ante-natal care was much lower for all cities(21) – for their total population, their slum population and their poorest population (in Delhi and Meerut, less than four per cent of mothers from the poorest households received any care; even in the best performing cities, less than one-third of the poorest mothers received any care). This points to the need for a more comprehensive focus on the concept of “ante-natal care” in the training of health care workers and community volunteers, as well as during behaviour change communication efforts.
FIGURE 10Percentage of households with improved toilet facility that is not
shared: eight Indian cities
0
10
20
30
40
50
60
70
80
90
100
Mumbai Delhi Kolkata Chennai Indore Meerut Hyderabad Nagpur
Per
cent
age
Census slum
Census non-slum
Poorest
21. This includes three or more ante-natal check-ups (with the first check-up within the first trimester of pregnancy), two or more tetanus toxoid injections, and iron and folic acid tablets or syrup for three or more months.

T H E S TAT E O F U R B A N H E A LT H I N I N D I A
25
With the exception of Chennai, where virtually all births were assisted by health personnel, the percentage of births assisted by health personnel was always lower among the poorest when compared to the census slum and non-slum populations, and often much lower. In the poorest households, fewer than one-third of births were assisted by health personnel in Delhi, Meerut and Indore.
For the eight cities, the data on drinking water were only for whether households had water piped into the dwelling/yard/plot and a public tap/
FIGURE 11Percentage of households with no toilet facility in 2005–2006:
eight Indian cities
0
10
20
30
40
50
60
70
80
90
100
Kolkata Chennai Mumbai Hyderabad Delhi Indore Nagpur Meerut
Per
cent
age
Census slum
Census non-slum
Poorest
FIGURE 12Percentage of households in houses built with poor quality
materials: eight Indian cities
0
10
20
30
40
50
60
70
80
90
100
Mumbai Hyderabad Kolkata Delhi Chennai Nagpur Indore Meerut
Per
cent
age
Census slum
Census non-slum
Poorest

E N V I R O N M E N T & U R B A N I Z AT I O N Vol 23 No 1 April 2011
26
standpipe; there was no disaggregation between the two. Yet in six of the eight cities, 15 per cent or more of the population lacked such provision (62.5 per cent in Meerut). Among the poorest, a higher proportion lacked such provision than in slums; in Meerut, 86 per cent lacked such provision, while in Indore, Kolkata and Nagpur the figure was between 30 and 36 per cent of their poorest population.
What is perhaps most notable about Figure 10 is that in 2005–2006, not only did much of the slum population not have an improved toilet facility that is not shared (more than 70 per cent in Delhi, Kolkata, Mumbai and Chennai) but also that this is the case for a significant proportion of the non-slum population – for instance more than 30 per cent of the non-slum population in Meerut, Kolkata, Indore and Hyderabad, and more than half the non-slum population in Mumbai and Chennai. Among the poorest, more than 90 per cent lacked an improved toilet facility that is not shared in Delhi, Kolkata, Mumbai and Chennai, and it was not much better in the other cities
Figure 11 shows the percentage of households with no toilet facility – for Delhi, Meerut and Nagpur this included 10–20 per cent of their slum population. For Delhi, Meerut, Indore and Nagpur it included more than 30 per cent of their poorest population. This low access to piped water and household toilets highlights the need to strengthen implementation of government schemes and programmes such as the Basic Services for the Urban Poor component of the Jawaharlal Nehru National Urban Renewal Mission, which has substantial financial allocation for investing in water, sanitation and improved drainage in urban poor habitations.
Figure 12 highlights the high proportion of the poorest households living in houses built with poor quality materials – more than half of all such households in some cities.
VIII. CONCLUSIONS
Figures 1–7 highlight the large disparities in health, provision for health care and housing conditions between the poorest quartile and the rest of the population in urban areas in India and in a selection of states. Figures 8–12 highlight the large disparities in eight cities between their poorest population (the population in the city that is within the poorest quartile for India’s urban areas) and the rest of their population. The poorest population in the cities is defined by a wealth index drawn from data in the National Family Health Survey 2005–20006, which is based on housing conditions and ownership of assets.
In general, the urban poor in each state and city are in the most disadvantaged position regarding all the indicators presented in this paper, and the scale of the differentials for many indicators is very high. Some of the greatest differentials are apparent when comparing the poorest quartile to the rest of the urban population in the states regarding access to piped water supply in the home (Figure 6) and to a flush or pit toilet for disposing of excreta (Figure 7). Almost all of the urban population that is not within the poorest quartile has access to a flush or pit toilet for disposing of excreta; but this is not the case for more than half the population in the poorest quartile for India and for Bihar, Madhya Pradesh, Jharkhand, Rajasthan and Maharashtra.
T H E S TAT E O F U R B A N H E A LT H I N I N D I A
27
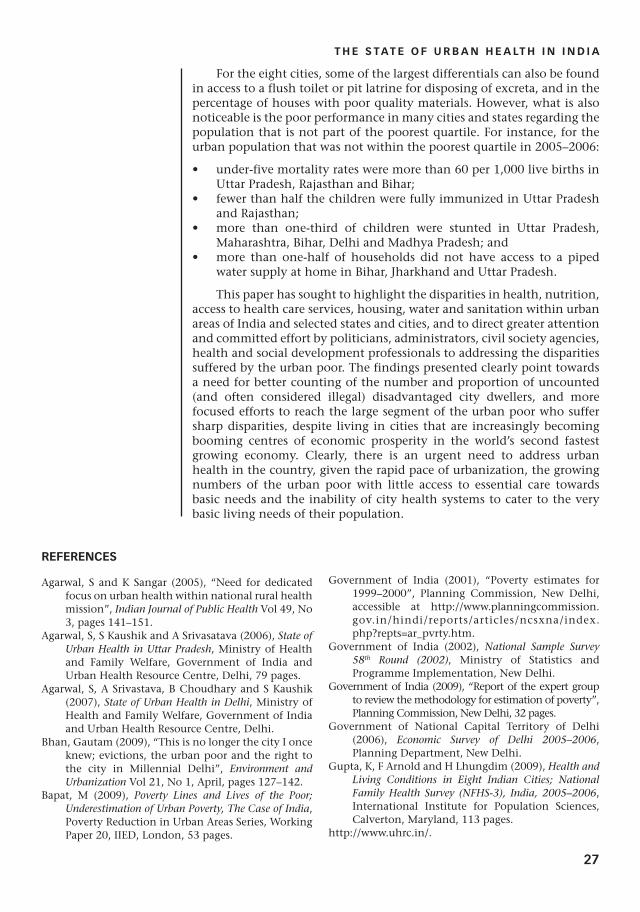
For the eight cities, some of the largest differentials can also be found in access to a flush toilet or pit latrine for disposing of excreta, and in the percentage of houses with poor quality materials. However, what is also noticeable is the poor performance in many cities and states regarding the population that is not part of the poorest quartile. For instance, for the urban population that was not within the poorest quartile in 2005–2006:
• under-five mortality rates were more than 60 per 1,000 live births in Uttar Pradesh, Rajasthan and Bihar;
• fewer than half the children were fully immunized in Uttar Pradesh and Rajasthan;
• more than one-third of children were stunted in Uttar Pradesh, Maharashtra, Bihar, Delhi and Madhya Pradesh; and
• more than one-half of households did not have access to a piped water supply at home in Bihar, Jharkhand and Uttar Pradesh.
This paper has sought to highlight the disparities in health, nutrition, access to health care services, housing, water and sanitation within urban areas of India and selected states and cities, and to direct greater attention and committed effort by politicians, administrators, civil society agencies, health and social development professionals to addressing the disparities suffered by the urban poor. The findings presented clearly point towards a need for better counting of the number and proportion of uncounted (and often considered illegal) disadvantaged city dwellers, and more focused efforts to reach the large segment of the urban poor who suffer sharp disparities, despite living in cities that are increasingly becoming booming centres of economic prosperity in the world’s second fastest growing economy. Clearly, there is an urgent need to address urban health in the country, given the rapid pace of urbanization, the growing numbers of the urban poor with little access to essential care towards basic needs and the inability of city health systems to cater to the very basic living needs of their population.
REFERENCES
Agarwal, S and K Sangar (2005), “Need for dedicated focus on urban health within national rural health mission”, Indian Journal of Public Health Vol 49, No 3, pages 141–151.
Agarwal, S, S Kaushik and A Srivasatava (2006), State of Urban Health in Uttar Pradesh, Ministry of Health and Family Welfare, Government of India and Urban Health Resource Centre, Delhi, 79 pages.
Agarwal, S, A Srivastava, B Choudhary and S Kaushik (2007), State of Urban Health in Delhi, Ministry of Health and Family Welfare, Government of India and Urban Health Resource Centre, Delhi.
Bhan, Gautam (2009), “This is no longer the city I once knew; evictions, the urban poor and the right to the city in Millennial Delhi”, Environment and Urbanization Vol 21, No 1, April, pages 127–142.
Bapat, M (2009), Poverty Lines and Lives of the Poor; Underestimation of Urban Poverty, The Case of India, Poverty Reduction in Urban Areas Series, Working Paper 20, IIED, London, 53 pages.
Government of India (2001), “Poverty estimates for 1999–2000”, Planning Commission, New Delhi, accessible at http://www.planningcommission.gov.in/hindi/reports/articles/ncsxna/index.php?repts=ar_pvrty.htm.
Government of India (2002), National Sample Survey 58th Round (2002), Ministry of Statistics and Programme Implementation, New Delhi.
Government of India (2009), “Report of the expert group to review the methodology for estimation of poverty”, Planning Commission, New Delhi, 32 pages.
Government of National Capital Territory of Delhi (2006), Economic Survey of Delhi 2005–2006, Planning Department, New Delhi.
Gupta, K, F Arnold and H Lhungdim (2009), Health and Living Conditions in Eight Indian Cities; National Family Health Survey (NFHS-3), India, 2005–2006, International Institute for Population Sciences, Calverton, Maryland, 113 pages.
http://www.uhrc.in/.

28
E N V I R O N M E N T & U R B A N I Z AT I O N Vol 23 No 1 April 2011
Karishma, R D, A Dadhwal, S Varadan, M Gupta and S Agarwal (2004), Situational Analysis Report of Agra City for Guiding Urban Health Programme, USAID–EPH, New Delhi, 50 pages.
Press Information Bureau (2007), “Poverty estimates for 2004–2005”, accessible at http://pib.nic.in/release/release.asp?relid=26316.
Taneja, S and S Agarwal (2004), Situational Analysis for Guiding USAID/EHP India’s Technical Assistance Efforts in Indore, Madhya Pradesh, India, Environmental Health Project Activity Report 133, Washington DC.
Urban Health Resource Centre (2007), “Health of the urban poor in India; key results from the National Family Health Survey, 2005–2006”, Urban Health Resource Centre, 6 pages.
World Bank (2010), The Economic Impacts of Inadequate Sanitation in India, Report for the Water and Sanitation Programme’s (WSP) Global Economics of Sanitation Initiative (ESI), Water and Sanitation Programme, the World Bank, Washington DC.