Embed Size (px)
Citation preview
2018 201820182018
FOREST PATHWAYS TO SUSTAINABLE DEVELOPMENT
THE WORLD’S FORESTS
THE STATE OF
I9535EN/1/07.18
ISBN 978-92-5-130561-4
9 7 8 9 2 5 1 3 0 5 6 1 4
ISSN 1020-5705
NEPAL: Two female farmers walk through a forest pathway.
COVER PHOTOGRAPH ©Suman Acharya/Alamy Stock Photo
This flagship publication is part of THE STATE OF THE WORLD series of the Food and Agriculture Organization of the United Nations.
Required citation:FAO. 2018. The State of the World’s Forests 2018 - Forest pathways to sustainable development. Rome. Licence: CC BY-NC-SA 3.0 IGO.
The designations employed and the presentation of material in this information product do not imply the expression of any opinion whatsoever on the part of the Food and Agriculture Organization of the United Nations (FAO) concerning the legal or development status of any country, territory, city or area or of its authorities, or concerning the delimitation of its frontiers or boundaries. The mention of specific companies or products of manufacturers, whether or not these have been patented, does not imply that these have been endorsed or recommended by FAO in preference to others of a similar nature that are not mentioned.
ISBN 978-92-5-130561-4 © FAO 2018
Some rights reserved. This work is made available under the Creative Commons Attribution-NonCommercial-ShareAlike 3.0 IGO licence (CC BY-NC-SA 3.0 IGO; https://creativecommons.org/licenses/by-nc-sa/3.0/igo).
Under the terms of this licence, this work may be copied, redistributed and adapted for non-commercial purposes, provided that the work is appropriately cited. In any use of this work, there should be no suggestion that FAO endorses any specific organization, products or services. The use of the FAO logo is not permitted. If the work is adapted, then it must be licensed under the same or equivalent Creative Commons license. If a translation of this work is created, it must include the following disclaimer along with the required citation: “This translation was not created by the Food and Agriculture Organization of the United Nations (FAO). FAO is not responsible for the content or accuracy of this translation. The original English edition shall be the authoritative edition.”
Any mediation relating to disputes arising under the licence shall be conducted in accordance with the Arbitration Rules of the United Nations Commission on International Trade Law (UNCITRAL) as at present in force.
Third-party materials. Users wishing to reuse material from this work that is attributed to a third party, such as tables, figures or images, are responsible for determining whether permission is needed for that reuse and for obtaining permission from the copyright holder. The risk of claims resulting from infringement of any third-party-owned component in the work rests solely with the user.
Sales, rights and licensing. FAO information products are available on the FAO website (www.fao.org/publications) and can be purchased through [email protected]. Requests for commercial use should be submitted via: www.fao.org/contact-us/licence-request. Queries regarding rights and licensing should be submitted to: [email protected].
Food and Agriculture Organization of the United NationsRome, 2018
2018
ISS
N 1
020-
5705
FOREST PATHWAYS TO SUSTAINABLE DEVELOPMENT
THE WORLD’S FORESTS
THE STATE OF
FOREWORD ivMETHODOLOGY viACKNOWLEDGEMENTS viiACRONYMS AND ABBREVIATIONS viiiEXECUTIVE SUMMARY xKEY MESSAGES xvi
CHAPTER 1 INTRODUCTION 1
CHAPTER 2QUANTIFYING THE CONTRIBUTIONS OF FORESTS TO THE SUSTAINABLE DEVELOPMENT GOALS 72.1 Approach taken 8
2.2 Quantification of contributions 9
2.3 Information and data gaps 65
CHAPTER 3WHAT DOES IT TAKE TO ACHIEVE THE SDGS? COUNTRY CASE STUDIES: SUCCESSES AND CONSTRAINTS 733.1 Introduction 74
3.2 Country case studies 74
3.3 Emerging common solutions and lessons learned 83
CHAPTER 4MOVING FORWARD 874.1 Introduction 88
4.2 Key findings 88
4.3 Strengthening forest pathways to sustainable
development 92
ANNEX METHODOLOGY FOR CHAPTER 2 98
REFERENCES 108
TABLES 1. Distribution of rural people living on less than USD 1.25 per day and residing in or around tropical forests and savannahs 11
2. Forest ownership 13
3. Visit rates in terrestrial protected areas (PAs) and direct expenditure by visitors 39
4. Percentage of urban World Heritage Sites (WHS) that include natural elements as a key component 42
FIGURES
1. Percentage of agricultural area with tree cover 14
2. Percentage of household income from non-wood forest products (NWFPs) 19
3. The water cycle 25
4. Changes in erosion and baseline water stress (BWS) 28
5. Percentage of forested area managed for soil and water protection, by region and country 30
6. Trends in management of forests for soil and water conservation, by forest type 31
7. Primary purpose of management for protection of soil and water 32
8. Percentage of households relying on woodfuel for cooking 33
9. Proportion of roundwood used as fuel in different regions and across countries 35
10. Biomass energy in global final energy consumption 36
11. Contribution of fuels derived from wood to global biomass energy resources 37
12. Forest and tree components of selected World Heritage Sites (WHS) 43
13. Changes in the extent of urban protected areas (PAs), km2 (2000–2017) 43
14. Access to green spaces in Germany 46
15. Global Production Index 47
CONTENTS
| ii |
The proportion of undernourished people in the total population is the indicator known as prevalence of undernourishment (PoU). See Annexes 2 and 3 of this report for further details. Ecullentem facerrum quam, quatet occus acepro modit quibus autat laut omnihitias sitat.
NOTES BORIA VOLOREIUM, SIT AUT QUIS DOLORITI CONECTUS, SEQUE
16. Average share of recovered wood in total consumption of raw wood by the European particleboard industry, 2005–2016 48
17. Global Per Capita Consumption Index 49
18. Global consumption per capita, m3/1000 inhabitants 49
19. Global paper and recovered paper, consumption and collection 51
20. Global paper recycling rate 51
21. Percentage of forest area affected by disasters 54
22. Forest area burned 55
23. Forest area affected by wind damage (Europe) 56
24. Forest area as a proportion of total land area in 1990, 2010 and 2015 59
25. Average worldwide coverage of terrestrial Key Biodiversity Areas (KBAs) 60
26. Progress towards sustainable forest management for each of the sub-indicators of Indicator 15.2.1, by SDG regional group 61
27. Average proportion of mountain Key Biodiversity Areas (KBAs) covered by protected areas (PAs), 2000, 2010 and 2017 (percentage) 63
28. Baseline data of the Mountain Green Cover Index, 2017 63
29. Red List Index of species survival, 1980–2016 64
30. Fluctuating three-year average of official development assistance (ODA) disbursement on forestry compared to total ODA from 2000 to 2015, and proportion of forestry-related disbursements of total ODA 66
31. Top ten resource partners and recipients for official development assistance (ODA) in forestry, 2000–2015 67
BOXES
1. Illustrations to show how forests and trees can contribute to the SDGs that are not analysed in The State of the World’s Forests 2018 5
2. SDG global indicators framework 8
3. The importance of forest products: the case of Uganda 9
4. Forest cover and poverty overlap in the tropics: spatial association from seven countries 10
5. Securing rights for improved incomes from forests in India, Guatemala and Mexico 13
6. Forests and trees as a safety net and source of food 16
7. Amount of NWFPs consumed at household level 16
8. NWFPs provide nutritional diversity 17
9. Community forestry enterprises in Guatemala 18
10. Caterpillar fungus as a source of income in the Nepalese Himalayas 20
11. Forging dialogue between community women and male foresters in Nepal 21
12. Number of women employed in NWFPs and agroforestry 22
13. Women’s increased employment, income and skills development from the shea industry in West Africa 22
14. Women’s secure tenure rights over forest land in Nepal 24
15. Water in the drylands – the role of forests for water security 26
16. Paving the way for ‘green’ infrastructure in Lima, Peru 29
17. Countries and territories where 100 percent of forests are managed for soil and water conservation 31
18. Contribution of informal chainsaw milling to timber production in Cameroon 38
19. Contributions from nature-based tourism to GDP and employment in Finland 40
20. Nature-based tourism expenditure in Costa Rica 40
21. Measuring the ecosystem services of urban forests and trees: i-Tree Eco 41
22. Case study: Tijuca National Park, Rio de Janeiro, Brazil 44
23. Innovative wood-based products in Norway 46
24. FairWild Standard 52
| iii |
FOREWORD
It is now almost three years since world leaders agreed to chart a course towards a better, more prosperous future for the planet and all its people. The 2030 Agenda for Sustainable Development, with its 17 Sustainable Development Goals (SDGs), has become the central framework for guiding development policies in countries throughout the world.
Given the ambition of the SDGs, transformation is needed if we are to end poverty and hunger, achieve inclusive growth, narrow inequalities, respond to climate change and sustainably manage our natural resources.
The 17 SDGs are comprised of 169 targets with 230 indicators identif ied to help measure progress. While this number may at f irst glance appear daunting, the Agenda is purposely fashioned in an integrated way, with goals ‘interlinked and indivisible’. The key to unlocking the door of progress will be understanding the golden threads that tie multiple goals and targets together.
The 2018 edition of The State of the World’s Forests aims to do just that, presenting new information to help recognize these interlinkages and enhance our understanding of how policies on forests and trees go beyond SDG15, Life on Land, to contribute to achieving many other goals and targets of the 2030 Agenda.
The State of the World’s Forests 2018 provides detailed analysis aimed at capturing the contribution of forests and trees to 28 targets relating to ten SDGs. Through thematic metrics bringing together available evidence from a wide range of sources, a clearer picture is emerging of the full impact that forests and trees have on many other crucial areas of development.
We have greater evidence of how forests are critical to livelihoods, with a better understanding of the trade-offs and more exact confirmation that healthy and productive forests are essential to sustainable agriculture. And we have proof of the significance of forests and trees for the quality of water, for contributing to the energy needs of the future, and for designing sustainable, healthy cities.
With this year’s High-Level Political Forum (HLPF) focusing on SDG15, as well as SDGs 6, 7, 11, 12 and 17, the timing of The State of the World’s Forests could not be more opportune in helping to inform experiences and ideas on the actions that must be taken and the partnerships and alliances that must be struck to realize the ambition of the 2030 Agenda.
Forest pathways to sustainable development will be fundamentally strengthened by legal frameworks that recognize and secure the rights of local communities and smallholders to access forests and trees, by fortify ing an enabling environment and helping to incentivize private sector engagement in pro-sustainability activ ities. There is also great potential in transforming the informal sector, both for those who rely on it for their livelihoods and because it will also bring wider economic, social and environmental benefits. Ultimately, ending hunger and poverty and transforming to a sustainable world can only be realized if sectoral ministries – forestry, agriculture, rural development and national development – coordinate policies across governments.
While more evidence on forests and trees exists today than ever before, there is still a need to dig deeper. Investing in effective monitoring at national and subnational levels
| iv |
will help plug data gaps so that policy-makers can calculate incentives, manage sector trade-offs, and better design forest and food-security initiatives.
Seventy years ago, FAO completed its f irst assessment of the world’s forest resources. At that time the major concern was whether there would continue to be sufficient timber to satisfy global demand.
Since then we have increasingly come to recognize the broader global relevance of our forests and trees, as ref lected in the most recent editions of FAO’s Global Forest Resources Assessment (FRA). Complementing the FRA, The State of the World’s Forests 2018 provides a comprehensive assessment of quantifying the contributions of forests to the SDGs. I hope you will f ind it valuable.
José Graziano da Silva FAO Director-General
| v |
METHODOLOGY
The State of the World’s Forests 2018 was prepared by the FAO Forestry Policy and Resources Division in collaboration with a number of international organizations involved in forestry programmes.
The development of the report was guided by a core team of four senior staff members in charge of each of the key chapters, and led by the Divisional Director who assumed overall coordination for the publication. For Chapter 2, responsibility for each of the 10 SDGs was assigned to a staff member with technical expertise. All chapters benefitted from the support of consultants for data collection and/or writing. The final document was assembled by a senior consultant.
During the process the core team met at regular intervals and produced a number of interim outputs, including a concept note, an annotated outline and a f irst draft of the key chapters. The core team also selected the SDGs, SDG targets and thematic metrics for the analysis based on previously agreed criteria. When the drafts of Chapters 2, 3 and 4 were ready, including the key findings, a meeting was held with the core team, all authors (staff and consultants) and the senior consultant to jointly identify the conclusions, recommendations and key messages.
The f inal report underwent a r igorous technical rev iew by senior management and technical experts from different div isions in FAO. In addit ion, it was peer-rev iewed by four external experts. Comments were incorporated into the f inal draft, which was submitted to the Director-General for clearance in March 2018.
| vi |
ACKNOWLEDGEMENTS
The State of the World’s Forests 2018 was prepared under the overall direction of Eva Muller, who led a core team comprising Andrey Kushlin, Thais Linhares-Juvenal, Douglas Muchoney and Sheila Wertz-Kanounnikoff. David Henderson-Howat assisted the core team in editing the publication.
Chapter 2 was coordinated by Sheila Wertz-Kanounnikoff, with assistance from Anne-Maud Courtois. The main contributors were Thais Linhares-Juvenal (Approach); Jeffrey Campbell, Erik Andervad and Safia Aggarwal (SDG1); Dominique Reeb, Basundhara Bhattarai and Sooyeon Laura Jin (SDG2); Dominique Reeb, Basundhara Bhattarai and Taylor Tondelli (SDG5); Elaine Springgay, Robert Nylander and Cara Pratt (SDG6); Xia Zuzhang (SDG7); Thais Linhares-Juvenal, Matleena Kniivilä and Eeva Alho (SDG8); Simone Borelli, Michela Conigliaro, Stefano Quaglia, Fabio Salbitano and Florencia Pineda (SDG11); Valeria Khristolyubova, Arvydas Lebedys and Mats Nordberg (SDG12); Simmone Rose, Simona Savini, Anna Tjarvar, Maria Ruiz-Villar, Serena Fortuna and Nina Lande (SDG13); Douglas Muchoney, Anssi Pekkarinen, Lars Gunnar Marklund and Valentina Garavaglia (SDG15); Ilaria Palumbo and Anne-Maud Courtois (data gaps); and Thais Linhares-Juvenal, Anne-Maud Courtois, Ilaria Palumbo, Lars Gunnar Marklund, Arvydas Lebedys and Nathalia Formenton Cardoso (Annex).
Chapter 3 was coordinated by Andrey Kushlin. The country case studies in this chapter were prepared by Jaime Terán (Bolivia, Plurinational State of ), Bassirou Belem (Burkina Faso), César Sandoval (Guatemala), Mauro Agnoletti (Italy), Don Koo Lee (Republic of Korea), Rabindra Roy (Nepal), Yuri Trubin (the Russian Federation) and Martin Kijazi (United Republic of Tanzania). Nora Berrahmouni, Moctar Sacande, Anni Vuohelainen and Jhony Zapata contributed to the cases studies. The lead author of the chapter was Marjory-Anne Bromhead.
The State of the World’s Forests 2018 also benefited from peer reviews by Peter Dewees, Pia Katila, Michael Martin and Isilda Nhantumbo, as well as comments from many colleagues in other technical divisions within FAO.
The FAO Meeting Programming and Documentation Service provided printing services and carried out the translations, in addition to the contributors mentioned above.
The Publishing Group (OCCP) in FAO’s Office for Corporate Communication provided editorial support, design and layout, as well as production coordination, for editions in all six off icial languages.
| vii |
ACRONYMS AND ABBREVIATIONS
BWSbaseline water stress
CAPCommon Agricultural Policy
CCEclimate change education
CFMcommunity forest management
CFUGCommunity Forest User Group
CIFORCenter for International Forestry Research
COFOCommittee on Forestry
DRRdisaster risk reduction
EUEuropean Union
EUROSTATEU Directorate-General for statistics
FAOFood and Agriculture Organization of the United Nations
FAOSTATFAO statistics database
FECOFUNFederation of Community Forest User Groups Nepal
FLEGTForest Law Enforcement, Governance and Trade
FLRforest and landscape restoration
FRAGlobal Forest Resources Assessment
FSCForest Stewardship Council
GACCGlobal Alliance for Clean Cookstoves
GDPgross domestic product
GHG greenhouse gas
GVAgross value added
HLPFHigh-Level Political Forum on Sustainable Development
IAEG-SDGsInteragency and Expert Group on SDG Indicators
ICRAFWorld Agroforestry Centre
IEAInternational Energy Agency
IFADInternational Fund for Agricultural Development
ILOInternational Labour Organization
ILOSTATInternational Labour Organization statistics database
INDCIntended Nationally Determined Contribution
IPCCIntergovernmental Panel on Climate Change
ISICInternational Classification of All Economic Activities
ISSC-MAPInternational Standard for Sustainable Wild Collection of Medicinal and Aromatic Plants
IUCNInternational Union for the Conservation of Nature
KBAKey Biodiversity Area
LDCLeast-developed countries
LUDland use dialogue
NAMANationally Appropriate Mitigation Actions
NAPNational Adaptation Plan
NAPANational Adaptation Programme of Action
| viii |
NDCNationally Determined Contribution
NGOnon-governmental organization
NWFPnon-wood forest products
ODAofficial development assistance
OECDOrganisation for Economic Cooperation and Development
PAprotected area
PEFCProgramme for the Endorsement of Forest Certification
PFMparticipatory forest management
PIPRTIGInter-Institutional Action Plan for the Prevention and Reduction of Illegal Logging in Guatemala
PPPulp and Paper products
PPPpublic-private partnership
REDD+Reducing Emissions from Deforestation and Forest Degradation
RLIRed List Index
RRIRights and Resources Initiative
SAGCOTSouthern Agricultural Corridor Project
SDGSustainable Development Goal
SEDAPALLima water and sewage services (Peru)
SOFO The State of the World’s Forests
SWPSolid Wood Panels
UNUnited Nations
UNCCDUnited Nations Convention to Combat Desertification
UNECEUnited Nations Economic Commission for Europe
UNEPUnited Nations Environment Programme
UNESCOUnited Nations Educational, Scientific and Cultural Organization
UNFCCCUnited Nations Framework Convention on Climate Change
UN-HABITATUnited Nations Human Settlements Programme
UNIDOUnited Nations Industrial Development Organization
UNWTOUnited Nations World Tourism Organization
UPFurban and peri-urban forest
USAIDUnited States Agency for International Development
USDUnited States dollar
USFSUnited States Forest Service
WDPAWorld Database on Protected Areas
WHOWorld Health Organization
WHSWorld Heritage Site
WRIWorld Resources Institute
WTTCWorld Travel and Tourism Council
| ix |
EXECUTIVE SUMMARY
| x |
The 2030 Agenda for Sustainable Development is a commitment made by countries to tackle the complex challenges we face, from ending poverty and hunger and responding to climate change to building resilient communities, achieving inclusive growth and sustainably managing the Earth’s natural resources. The 17 Sustainable Development Goals (SDGs), 169 targets and 230 indicators lay out specif ic objectives for countries to meet within a given timeframe, with achievements monitored periodically to measure progress. Universally relevant, they call for comprehensive and participatory approaches that bring everybody together to “leave no one behind”.
As governments determine how best to commit national efforts to achieve transformational change, The State of the World’s Forests 2018 (SOFO 2018) analyses the role that forests and trees – and the people who use and manage them – can play in helping countries achieve their objectives and bring about a brighter future. SOFO 2018 shines a light on the profound interlinkages that exist between forests and many other goals and targets of the 2030 Agenda, enabling policy-makers to strike the right balance in actions, investments and partnerships directed towards food security, poverty alleviation, ecological conservation and, ultimately, to find pathways to sustainable development.
Focusing on the contribution that forests and trees can make towards achieving 28 targets within ten SDGs of the 2030 Agenda, Chapter 2 presents analysis that demonstrates a clear link between integrated forest policy and its potential impacts across multiple SDGs. Bringing together available evidence from a wide range of scientif ic sources, thematic metrics were drafted to analyse evidence of the broader relationship between forests and trees and the 2030 Agenda, beyond SDG15 (“Protect, restore and promote sustainable use of terrestrial ecosystems, sustainably manage forests, combat desertif ication, and halt and reverse land degradation and halt biodiversity
loss”). The aim is to highlight interlinkages and opportunities to support more coherent policy-making across sectors and more effective implementation of the SDGs.
Forests and trees make vital contributions both to people and the planet, bolstering livelihoods, providing clean air and water, conserving biodiversity and responding to climate change. Forests act as a source of food, medicine and fuel for more than a billion people. In addition to helping to respond to climate change and protect soils and water, forests hold more than three-quarters of the world’s terrestrial biodiversity, provide many products and services that contribute to socio-economic development, and are particularly important for hundreds of millions of people in rural areas, including many of the world’s poorest.
However, the world’s population is projected to increase from around 7.6 billion today to close to 10 billion people by 2050. The corresponding global demand for food – estimated to grow by 50 percent during this period – is placing enormous pressure on the way we use productive land, particularly in developing countries where the overwhelming majority of the world’s 800 million and more poor and hungry people are concentrated. Deforestation, chief ly caused by the conversion of forest land to agriculture and livestock areas, threatens not only the livelihoods of foresters, forest communities and indigenous peoples, but also the variety of life on our planet. Land-use changes result in a loss of valuable habitats, land degradation, soil erosion, a decrease in clean water, and the release of carbon into the atmosphere. How to increase agricultural production and improve food security without reducing forest area is one of the great challenges of our times.
Evidence is key to opening up forest pathways to sustainable development. While the importance of forests and trees to a healthy, prosperous planet is universally recognized, the depth of those roots may be greater than imagined. Agreed by the UN
| xi |
management have grave implications on a nation’s water supply. While three-quarters of the globe’s accessible freshwater comes from forested watersheds, research shows that 40 percent of the world’s 230 major watersheds have lost more than half of their original tree cover. Despite this, the area of forests managed for soil and water conservation has increased globally over the past 25 years, and in 2015 a quarter of forests were managed with soil and/or water conservation as an objective.
Modernizing the traditional wood energy sector has the power to improve livelihoods, create sustainable value chains and unlock resources for investments in sustainable forest management. The potential of forests is perhaps no better il lustrated than by the fact that wood grows back. Around one-third of the world’s population, or about 2.4 billion people, make use of wood to provide basic energy services such as cooking, boiling water and heating. Overall, forests supply about 40 percent of global renewable energy in the form of woodfuel – as much as solar, hydroelectric and wind power combined. Emphasis must now be on producing woodfuel more sustainably to reduce forest degradation, as well as more cleanly and efficiently to improve the health of millions of people, particularly women and children.
The world’s response to climate change – in terms of adaptation, mitigation and resilience – must focus more on forests. As underscored at the Paris Climate Agreement in 2015, forests and trees play a crucial role in determining the accumulation of greenhouse gases (GHGs) in the atmosphere. Acting as carbon sinks, they absorb the equivalent of roughly 2 billion tonnes of carbon dioxide each year. However, according to the IPCC, the Agriculture, Forestry and Land Use (AFOLU) sector is responsible for just under a quarter of anthropogenic GHG emissions mainly from deforestation and agricultural emissions from livestock, soil and nutrient management. Effective forest management can strengthen resilience and adaptive capacities to climate-related natural
Statistical Commission in March 2016, the 2030 Agenda’s 230 indicators are designed to help countries measure the progress they are making towards achieving their objectives, learning from their experiences and understanding which areas to prioritize and allocate resources to. Several indicators under SDG15 focus on forests, specif ically monitoring forest land and the share of forests under sustainable management. The Global Forest Resources Assessment (FRA), coordinated by FAO, found that the world’s forest area decreased from 31.6 percent of global land area to 30.6 percent between 1990 and 2015, but that the pace of loss has slowed in recent years.
There is quantitative evidence to show that forests are being managed more sustainably and that forests and trees contribute to achieving SDGs relating to livelihoods and food security for many rural poor, access to affordable energy, sustainable economic growth and employment (in the formal sector), sustainable consumption and production, and climate change mitigation, as well as sustainable forest management.
The people lef t furthest behind are often located in areas in and around forests. The livelihoods and food security of many of the world’s rural poor depend on vibrant forests and trees. Evidence points to around 40 percent of the extreme rural poor – around 250 million people – liv ing in forest and savannah areas. Access to forest products, goods and services is v ital for the livelihoods and resilience of the poorest households, acting as safety nets in diff icult times. Some studies suggest that forests and trees may provide around 20 percent of income for rural households in developing countries, both through cash income and by meeting subsistence needs. Non-wood forest products (NWFPs) provide food, income, and nutritional diversity for an estimated one in f ive people around the world, notably women, children, landless farmers and others in vulnerable situations.
Water quality, essential to the health and life of both rural and urban populations, is directly related to forest management. Changes in land cover, use and
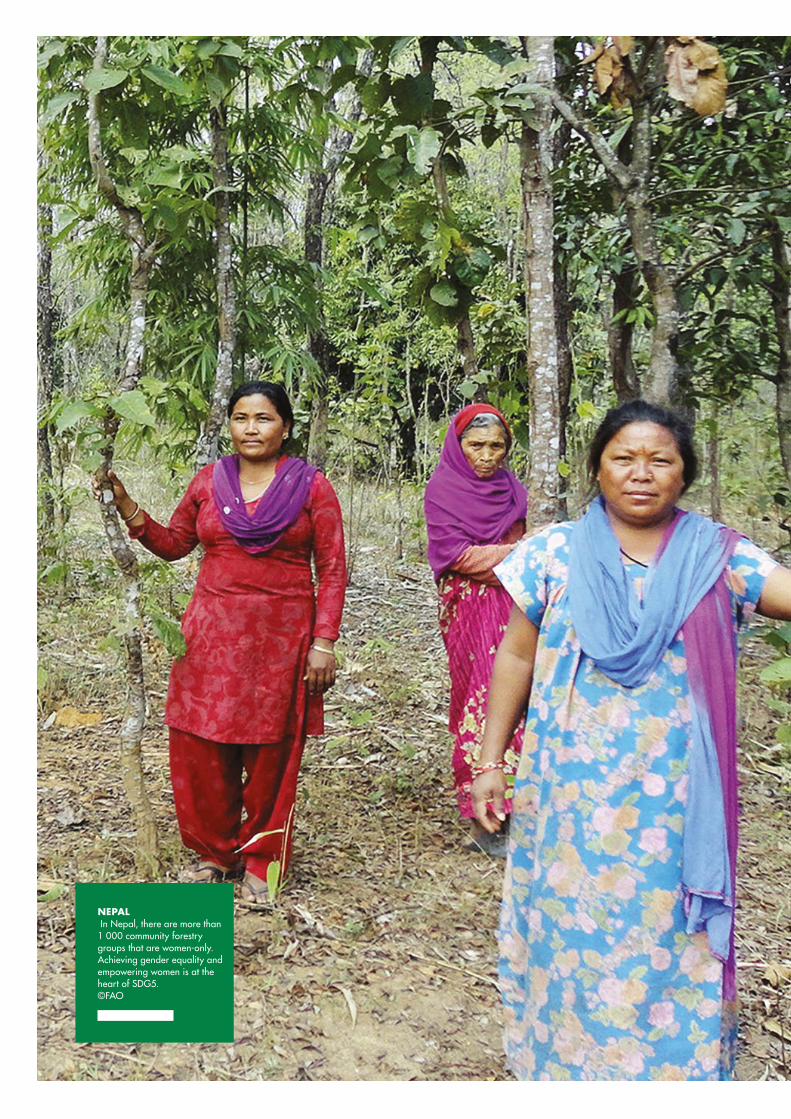
NEPAL In Nepal, there are more than 1 000 community forestry groups that are women-only. Achieving gender equality and empowering women is at the heart of SDG5.©FAO
| xiii |
disasters, underscoring the importance of integrating forest-based measures into national disaster risk reduction (DRR) strategies. Reducing emissions from deforestation and forest degradation and the roles of conservation, sustainable management of forests and enhancement of forest carbon stocks (known as REDD+) will be vital for global efforts to combat climate change. The 25 countries with the highest forest cover have all included forest-related mitigation measures (reduced deforestation and forest degradation, afforestation, enhancement of forest carbon stocks, forest conservation and agroforestry) in their Nationally Appropriate Mitigation Actions (NAMAs) and Nationally Determined Contributions (NDCs).
Qualitative evidence suggests that forests and trees also make significant contributions to SDGs through the informal sector, agroforestry, opportunities to empower women, sustainable water management, tourism, sustainable cities, climate change adaptation, and tackling land degradation and biodiversity loss. Nature-based tourism, for example, is growing three times faster than the tourism industry as a whole and now accounts for approximately 20 percent of the global market. The integration of green space and tree cover in urban planning is also on the rise, with studies showing links to a reduction in levels of both obesity and crime, although measuring and evaluating such benefits remains challenging. In view of growing urbanization and climate change, the design, planning and management of urban green spaces, including forests and trees, should be integrated into urban planning at an early stage. The role of forests and trees should be ref lected in climate mitigation and adaptation policies.
Many countries have already successfully integrated forests and landscape approaches that link multiple SDGs into wider sustainable development programmes. Eight case studies detailed in Chapter 3 show how forests’ potential is enhanced by a cross-sectoral approach in countries that vary in geography, climate, political systems, income levels and social and
cultural traditions. From Burkina Faso to Italy to the United Republic of Tanzania, landscape approaches help to integrate the management of forests and trees with agricultural land, the urban and rural environment and cultural heritage, ensuring for example that the economic value of forest-related tourism is recognized and the benefits that forests and trees provide for urban populations are understood. Landscape approaches protect v ital ecosystem services, sustain livelihoods and tackle food security challenges, while adapting to the impacts of climate change. The studies demonstrate the value of multi-stakeholder partnerships that bring governments, the private sector, civ il society and individuals together in seeking to f ind new ways to realize their common goals and aspirations.
Pathways to sustainable development. Chapter 4 summarizes key policy implications, highlighting the need to: raise awareness and market the benefits of forests and trees to policy-makers and beyond; engage the private sector; integrate forests with the broader sustainable development agenda; invest in transforming the informal sector to unlock missed development opportunities and improve employment conditions; undertake national and subnational analytical studies; and improve data availability.
Addressing agriculture and forests together in formulating national development policies is critical to achieving the SDGs. Sustainable agriculture needs healthy and productive forests. Forests and trees support sustainable agriculture by, for example, stabilizing soils and climate, regulating water f lows, providing shade, shelter, and a habitat for pollinators and the natural predators of agricultural pests. When integrated into agricultural landscapes, forests and trees can increase agricultural productivity. They also help provide food security for hundreds of millions of people, for whom they are important sources of food, energy and income during hard times. Recognizing and balancing these trade-offs,
| xiv |
including between short-term and long-term benefits, local and global public goods, and communities and sectors, will allow policy-makers to better direct resources that can accelerate achievements across the 2030 Agenda.
The world’s primary objectives of ending poverty and achieving sustainability will be greatly enhanced by strengthening legal frameworks that recognize and secure the rights of local communities and smallholders to access forests and trees. Globally, 1.5 billion local and indigenous people have secured rights over forest resources through community-based tenure. There are significant benefits to be found in giving local people with traditional knowledge the ability to inf luence decision-making in ways that contribute to SDG targets. With clear and secure rights, people are more likely to take a longer-term approach to forest management, as they know that they or their successors will benefit from this. Chapter 3 highlights Nepal’s long history of community forest management, an approach adopted by many other countries, especially in Asia and Latin America. Where insecure tenure is a critical problem, frameworks such as the Voluntary Guidelines on the Responsible Governance of Tenure of Land, Fisheries and Forests can help to provide certainty. Looking ahead, there is a need to learn from successful experiences in community forest management, recognizing the importance of scientif ic and technical support, training, capacity-building and access to markets, market information and adequate f inancial resources, as well as the need for clarity in setting out the rights and responsibilities of different parties. All these measures will need to be in place if forest pathways to sustainable development are to be strengthened.
Access to land, resources and investments in and around forests can propel women, youth and other rural entrepreneurs to be agents of change in the transformation to a sustainable world. Strengthening tenure rights presents an opportunity to enhance gender equitable access to forests and trees, as well as encouraging a long-term, sustainable approach to forest
management. Studies highlight the entrepreneurial role that women play, especially in the informal sector, and their leadership role in community and participatory forest management. The enterprise and energy of youth is just as vital for the future of the sector. Investment in training, capacity-building and the development of producer organizations can help persuade young people to see the value of making a liv ing by the forest and resist uncertain migration. Investing in the informal sector by increasing economic activ ity, improving employment conditions and fostering a more sustainable approach to forest management can have a positive impact that stretches from forest to farm to town to city. Providing economic incentives to smallholders and communities to manage trees on forest lands is likely to prove rewarding.
A positive enabling environment is fundamental for attracting the private sector to pro-sustainability activities. Both the formal and informal forest sectors include large numbers of small or micro businesses, while at the other end of the scale there are some very large companies. On a small scale, priorities often include training to improve land management practices, the promotion of agroforestry, the development of producer organizations, better access to markets and the availability of suitable f inancing arrangements. On a larger scale, there may be a need to address potential barriers to investment, often financial or infrastructure-related. Policy interventions are likely to include a mix of regulatory approaches and incentives to engage in activ ities that are not necessarily covered by the market, such as ecosystem services and sustainable forest management. At the same time, it will be important to address potential barriers to investment and remove incentives to clear forests. Partnerships with the private sector will be crucial in developing private governance initiatives, such as voluntary certif ication schemes and commitments to ‘zero-deforestation’ supply chains.
EXECUTIVE SUMMARY
| xv |
Stakeholder engagement and a commitment to good governance are fundamental to effective policy implementation. The right of stakeholders to be consulted during the development and implementation of forest-related policies, programmes and plans should be formalized to account for the needs of forest users and other stakeholders. Along with a sound policy and legal framework, effective institutions are key to good governance. The institutional framework should encompass local communities, civil society organizations and responsible private sector interests, as well as government departments and agencies. This may require building the capacity of organizations that support indigenous peoples, local communities and smallholders, as well as strengthening public sector organizations.
To accomplish the historic ambition of ending hunger and poverty and transforming to a sustainable world, the 2030 Agenda expects sectoral ministries to change the way they work and to coordinate policies across government. If sustainable development is to be realized, initiatives on forests, agriculture, food, land use, rural and national development must synchronize in the future. Although drivers vary significantly between countries and regions, policy-makers must recognize the need to manage trade-offs and set
out concrete measures for better aligning multiple objectives and incentive structures. This integrated approach is critical for progressing towards the SDG targets. Establishing SDG implementation platforms composed of key sectors in natural-resource use and management is one way of managing cross-sectoral coordination and overcoming diff iculties in governments that have sector-based ministries and agencies, with their own resource allocations and accountability arrangements. SDG implementation platforms would bring together different ministries and government agencies with other key stakeholders working in dialogue and coordinated action, with a focus on achieving the SDGs and benefitting from interlinkages, identifying and addressing barriers to change, and monitoring progress.
Investing in effective monitoring at national and subnational levels will offer countries vital information on which groups of people or areas of the country to focus on. This will allow policy-makers to calculate incentives, manage sector trade-offs, design and roll out forest and food-security initiatives, measure out social safety nets, and determine the level of support needed for different sectors of the economy. n
TO ACHIEVE OUR GLOBAL GOALS, URGENT ACTION IS NEEDED TO SUSTAIN THE PLANET’S FORESTS
THE BRANCHES OF FORESTS AND TREES REACH OUT ACROSS THE SDGs
TO REACH THOSE FURTHEST BEHIND FIRST, WE MUST GO DOWN THE FOREST PATH AND EMPOWER AGENTS OF CHANGE
KEY MESSAGES
IT IS TIME TO RECOGNIZE THAT FOOD SECURITY, AGRICULTURE AND FORESTRY CAN NO LONGER BE TREATED IN ISOLATION
| xvi |
Time is running out for the world’s forests, whose total area is shrinking by the day. By halting deforestation, managing forests sustainably, restoring degraded forests and increasing the global forest area, potentially damaging consequences for the planet and its people can be avoided. Governments need to foster an all-inclusive approach that promotes the benefits of forests and trees, engaging all stakeholders.
From tackling poverty and hunger to mitigating climate change and conserving biodiversity, the impacts of forests and trees go well beyond SDG15 to contribute to achieving multiple goals and targets across the 2030 Agenda. Managing forests sustainably benefits both urban and rural communities and is essential to the planet ’s healthy and productive future. Strategies to achieve the SDGs should consider interlinkages with forests and trees.
Sustainable agriculture needs healthy and productive forests. Forests and trees supply hundreds of millions of people with food, energy, and income, and act as a safety net during hard times. To accomplish the historic ambition of ending hunger and poverty, sectoral ministries must ensure policy coherence across governments, integrating strategies and balancing trade-offs. Actions on forests, agriculture, food, land use, rural and national development must be integrated in the future if the 2030 Agenda is to be realized.
Around 40 percent of the extreme rural poor – or some 250 million people – live in forest and savannah areas. Policies that secure tenure rights for the poor and vulnerable, including indigenous people, landless farmers, rural women and youth, will go a long way to ending poverty and food insecurity. Investing in these agents of change will spur entrepreneurship and the sustainable management of forests.
LANDSCAPE APPROACHES BALANCE SUSTAINABILITY
COHERENT POLICY FRAMEWORKS ENCOURAGE PARTNERSHIPS AND STAKEHOLDER ENGAGEMENT IN FORESTS
HEALTHY CITIES NEED TREES
EVIDENCE IS KEY IN ACHIEVING RECOGNITION OF THE TRUE VALUE OF FORESTS IN THE 2030 AGENDA
| xvii |
Nourishing a growing world population while nurturing our planet requires landscape approaches that protect and sustainably use vital ecosystem services, sustain livelihoods and tackle food security challenges, while adapting to the impacts of climate change. Integrating landscape approaches into national strategies and development priorities is part of building the forests of the future.
In view of increasing urbanization, trees, parks and forests are a must for planners designing the sustainable cities and peri-urban landscapes of the future. Removing pollution, offering shade and contributing numerous health benefits, greenery is crucial for the well-being of city people, who globally outnumber those living in rural locations. Trees and green spaces in urban areas are also associated with reductions in both childhood obesity and crime, underscoring the links between forests and trees to multiple targets across the 2030 Agenda.
Integrating forests into sustainable development strategies requires effective partnerships and private sector engagement. Clear legal frameworks, community engagement and coherent policy measures that balance stakeholder interests are part of the enabling environment needed. Policies must be geared towards incentivizing companies and small producers to engage in sustainable forest management, addressing potential barriers to investment and removing motives for clearing forests. Corporate responsibility for zero deforestation is key.
By investing in monitoring at national and subnational levels, governments will gain a clearer picture of the social, economic and environmental impacts of forests and trees across the SDGs. This information will be critical in calculating incentives and managing sector trade-offs, fashioning forest and food security initiatives, measuring out social safety nets, investing in technology and innovation, and determining the level of support needed for different sectors of the economy.
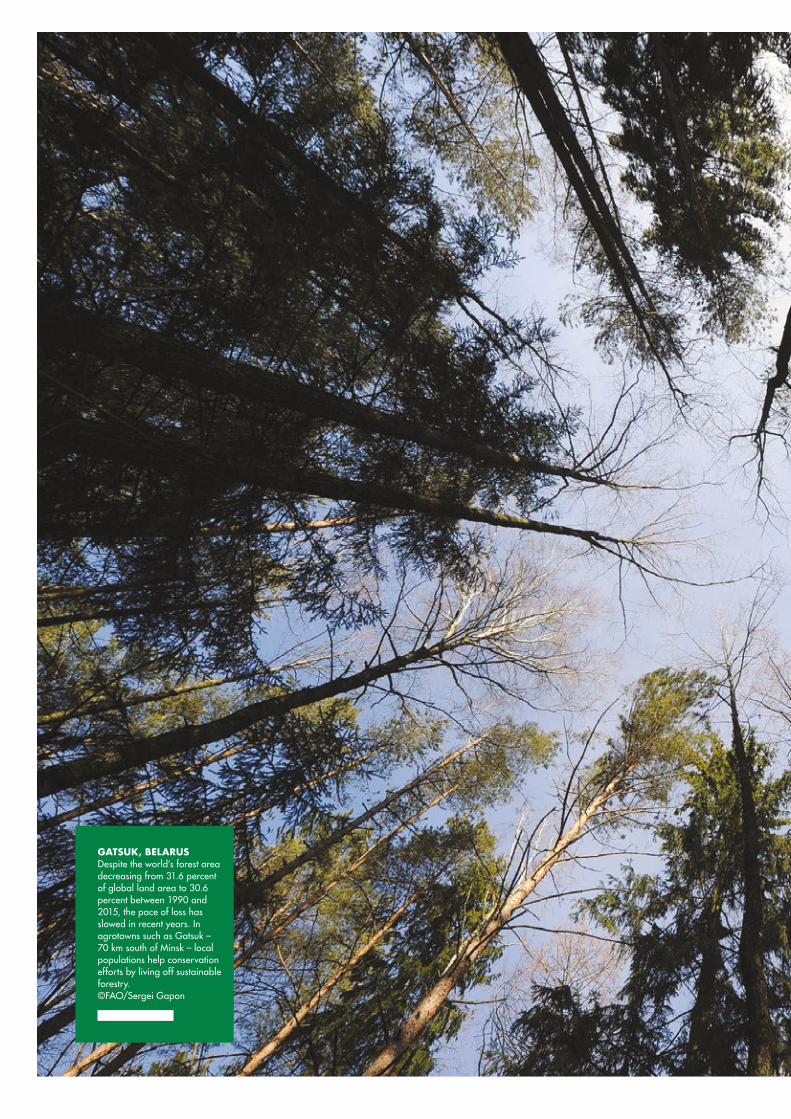
GATSUK, BELARUSDespite the world’s forest area decreasing from 31.6 percent of global land area to 30.6 percent between 1990 and 2015, the pace of loss has slowed in recent years. In agrotowns such as Gatsuk – 70 km south of Minsk – local populations help conservation efforts by living off sustainable forestry.©FAO/Sergei Gapon
CHAPTER 1INTRODUCTION
In 2015, governments around the world took bold and decisive action by adopting the 2030 Agenda for Sustainable Development (UN, 2015), or the 2030 Agenda as it is often called. Since then, the 2030 Agenda and its 17 Sustainable Development Goals (SDGs) have become the overarching framework for sustainable development. The universal and inclusive nature of the 2030 Agenda commits the international community to act together to overcome the multiple and complex challenges facing the world in the twenty-first century. It will guide development policies worldwide during the next decade and beyond.
The 2030 Agenda is centred on four main objectives: eradicate poverty; heal the planet; secure prosperity for all; and foster peace and justice. It reaffirms the need to make progress in all three dimensions of sustainable development – economic, social and environmental – and for a comprehensive, far-reaching and people-centred approach that can yield transformational change towards sustainability. In order to achieve this ambition, the 2030 Agenda calls for a Partnership for Sustainable Development, through which stakeholders from all sectors should work together. The 2030 Agenda was further reinforced through the Paris Agreement, adopted in 2015 under the United Nations Framework Convention on Climate Change (UNFCCC), which calls for a holistic approach mobilizing all actors to mitigate and adapt to climate change.
In order to trigger concerted action, the 17 SDGs are problem-orientated and not sector specif ic, and the 2030 Agenda stresses that they and their 169 associated targets are “integrated and indivisible”. The 2017 UN High-Level Political Forum on Sustainable Development (HLPF) emphasized that the 2030 Agenda is particularly integrated at the target level, and that
“leveraging interlinkages requires true political leadership, with better policy coherence and coordination as a means to achieve overall objectives focused on outcomes rather than processes” (HLPF, 2017). Therefore, effective and efficient implementation of the SDG framework calls for identif ication of these interlinkages between the SDGs and concerted action at country level to activate positive interactions between all sectors.
The State of the World’s Forests 2018 seeks to examine evidence about the contribution that forests and trees1 – and the people who use and manage them – can make to sustainable development. It also identif ies information and data gaps and areas where more work is needed to improve understanding of these interlinkages. The objective is to strengthen forest pathways to sustainable development as part of the transformational change needed to implement the 2030 Agenda.
CHAPTER 2 focuses on ten SDGs and 28 selected targets. It explains the reasons for selecting these SDGs and targets, and the approach taken in attempting to quantify the contribution of forests and trees to the targets. The ten SDGs considered in Chapter 2 are as follows:
} SDG1. End poverty in all its forms everywhere } SDG2. End hunger, achieve food security and
improved nutrition and promote sustainable agriculture
1 This publication frequently uses the phrase “forests and trees”. A “forest” is defined as land spanning more than 0.5 hectares with trees higher than 5 metres and a canopy cover of more than 10 percent, or trees able to reach these thresholds in situ; it does not include land that is predominantly under agricultural or urban use (FAO, 2015a). Although trees outside forests are not technically considered as “forests”, according to this standard definition they provide multiple economic, social and environmental benefits (UN, 2008) and so have been included within the scope of SOFO 2018.
INTRODUCTION
CHAPTER 1
| 2 |
THE STATE OF THE WORLD’S FORESTS 2018
} SDG5. Achieve gender equality and empower all women and girls
} SDG6. Ensure availability and sustainable management of water and sanitation for all
} SDG7. Ensure access to affordable, reliable, sustainable and modern energy for all
} SDG8. Promote sustained, inclusive and sustainable economic growth, full and productive employment and decent work for all
} SDG11. Make cities and human settlements inclusive, safe, resilient and sustainable
} SDG12. Ensure sustainable consumption and production patterns
} SDG13. Take urgent action to combat climate change and its impacts
} SDG15. Protect, restore and promote sustainable use of terrestrial ecosystems, sustainably manage forests, combat desertif ication, and halt and reverse land degradation and halt biodiversity loss
However, it is important to emphasize that forests and trees contribute to all 17 SDGs, as well as to the Aichi Biodiversity Targets of the
Convention on Biological Diversity, and the Paris Agreement on Climate Change. Box 1 l ists the SDGs that are not considered in Chapter 2 and provides brief examples illustrating the contribution of forests and trees to these goals.
CHAPTER 3 examines case studies from Bolivia (Plurinational State of ), Burkina Faso, Guatemala, Italy (region of Tuscany), Nepal, the Republic of Korea, the Russian Federation (Arkangelsk region) and the United Republic of Tanzania. The purpose of these case studies is to highlight experiences and lessons learned from some countries that have developed policies, strategies or programmes aimed at better mainstreaming forestry and to explore challenges that can arise in taking a comprehensive, cross-sectoral and integrated approach to sustainable development.
CHAPTER 4 presents conclusions from the previous sections and proposes practical ways forward to strengthen forest pathways towards sustainable development.
| 3 |
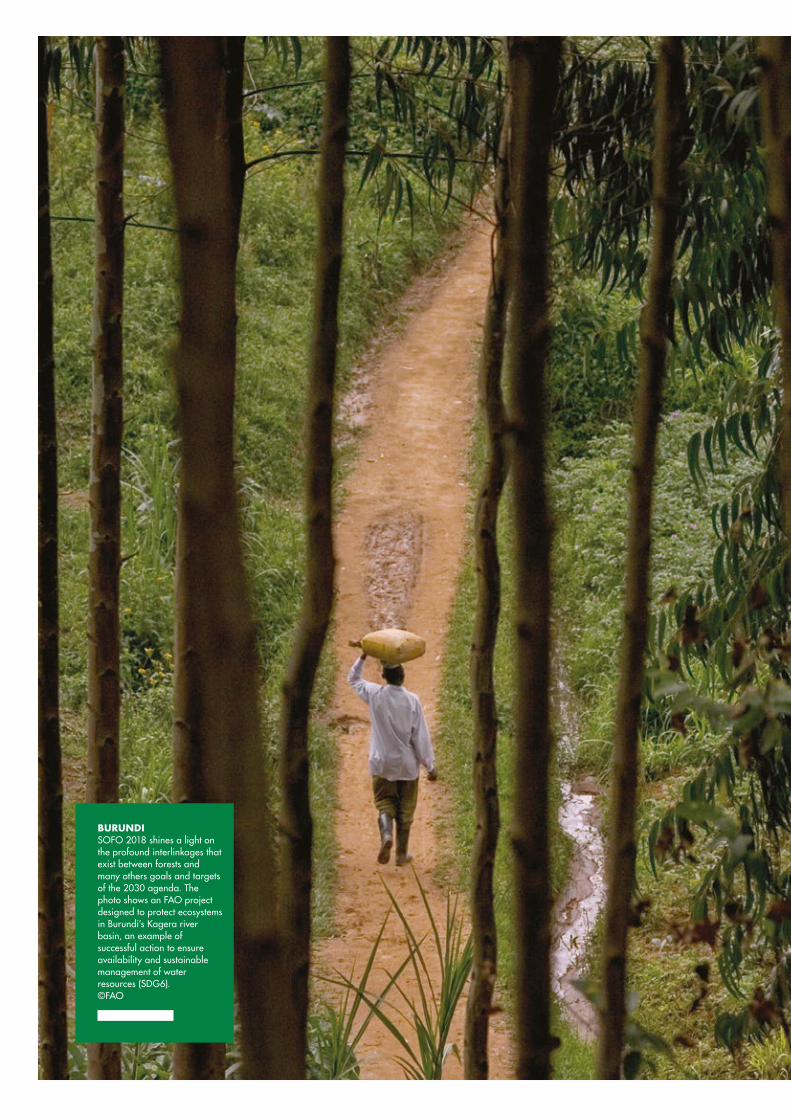
BURUNDISOFO 2018 shines a light on the profound interlinkages that exist between forests and many others goals and targets of the 2030 agenda. The photo shows an FAO project designed to protect ecosystems in Burundi’s Kagera river basin, an example of successful action to ensure availability and sustainable management of water resources (SDG6).©FAO
THE STATE OF THE WORLD’S FORESTS 2018
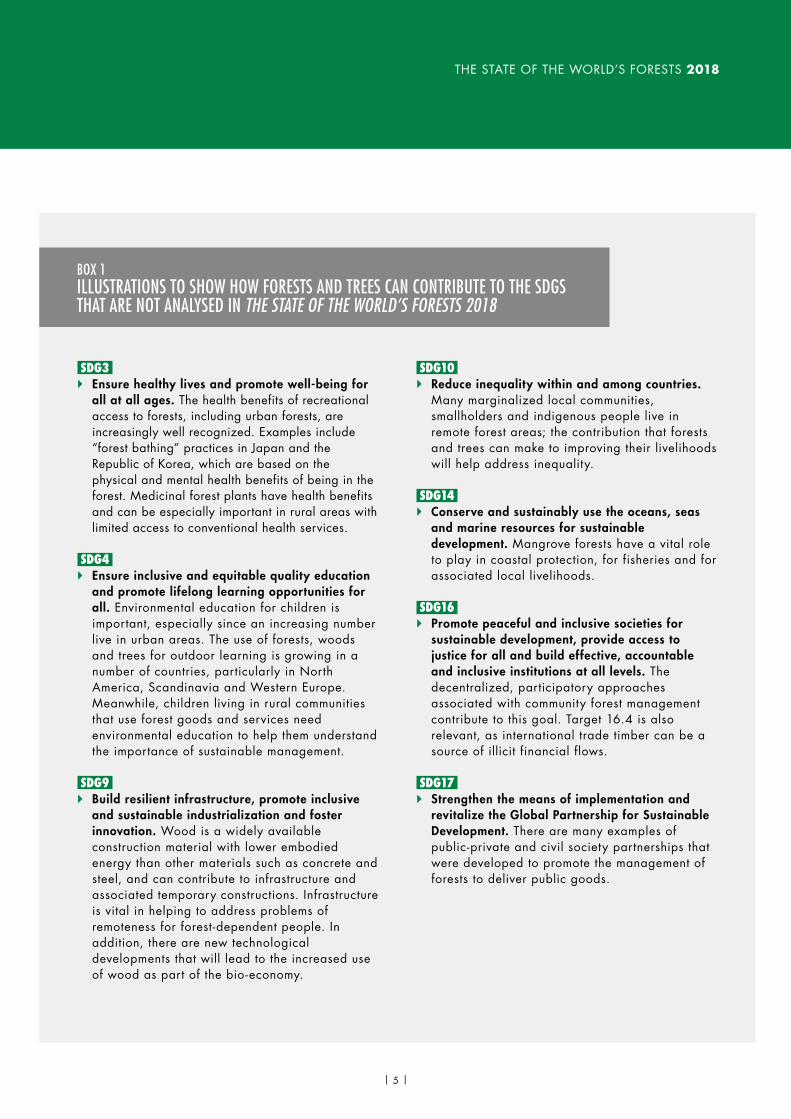
BOX 1ILLUSTRATIONS TO SHOW HOW FORESTS AND TREES CAN CONTRIBUTE TO THE SDGS THAT ARE NOT ANALYSED IN THE STATE OF THE WORLD’S FORESTS 2018
SDG3 } Ensure healthy lives and promote well-being for
all at all ages. The health benefits of recreational access to forests, including urban forests, are increasingly well recognized. Examples include “forest bathing” practices in Japan and the Republic of Korea, which are based on the physical and mental health benefits of being in the forest. Medicinal forest plants have health benefits and can be especially important in rural areas with limited access to conventional health services.
SDG4 } Ensure inclusive and equitable quality education
and promote lifelong learning opportunities for all. Environmental education for children is important, especially since an increasing number live in urban areas. The use of forests, woods and trees for outdoor learning is growing in a number of countries, particularly in North America, Scandinavia and Western Europe. Meanwhile, children living in rural communities that use forest goods and services need environmental education to help them understand the importance of sustainable management.
SDG9 } Build resilient infrastructure, promote inclusive
and sustainable industrialization and foster innovation. Wood is a widely available construction material with lower embodied energy than other materials such as concrete and steel, and can contribute to infrastructure and associated temporary constructions. Infrastructure is vital in helping to address problems of remoteness for forest-dependent people. In addition, there are new technological developments that will lead to the increased use of wood as part of the bio-economy.
SDG10 } Reduce inequality within and among countries.
Many marginalized local communities, smallholders and indigenous people live in remote forest areas; the contribution that forests and trees can make to improving their livelihoods will help address inequality.
SDG14 } Conserve and sustainably use the oceans, seas
and marine resources for sustainable development. Mangrove forests have a vital role to play in coastal protection, for fisheries and for associated local livelihoods.
SDG16 } Promote peaceful and inclusive societies for
sustainable development, provide access to justice for all and build effective, accountable and inclusive institutions at all levels. The decentralized, participatory approaches associated with community forest management contribute to this goal. Target 16.4 is also relevant, as international trade timber can be a source of illicit financial flows.
SDG17 } Strengthen the means of implementation and
revitalize the Global Partnership for Sustainable Development. There are many examples of public-private and civil society partnerships that were developed to promote the management of forests to deliver public goods.
| 5 |
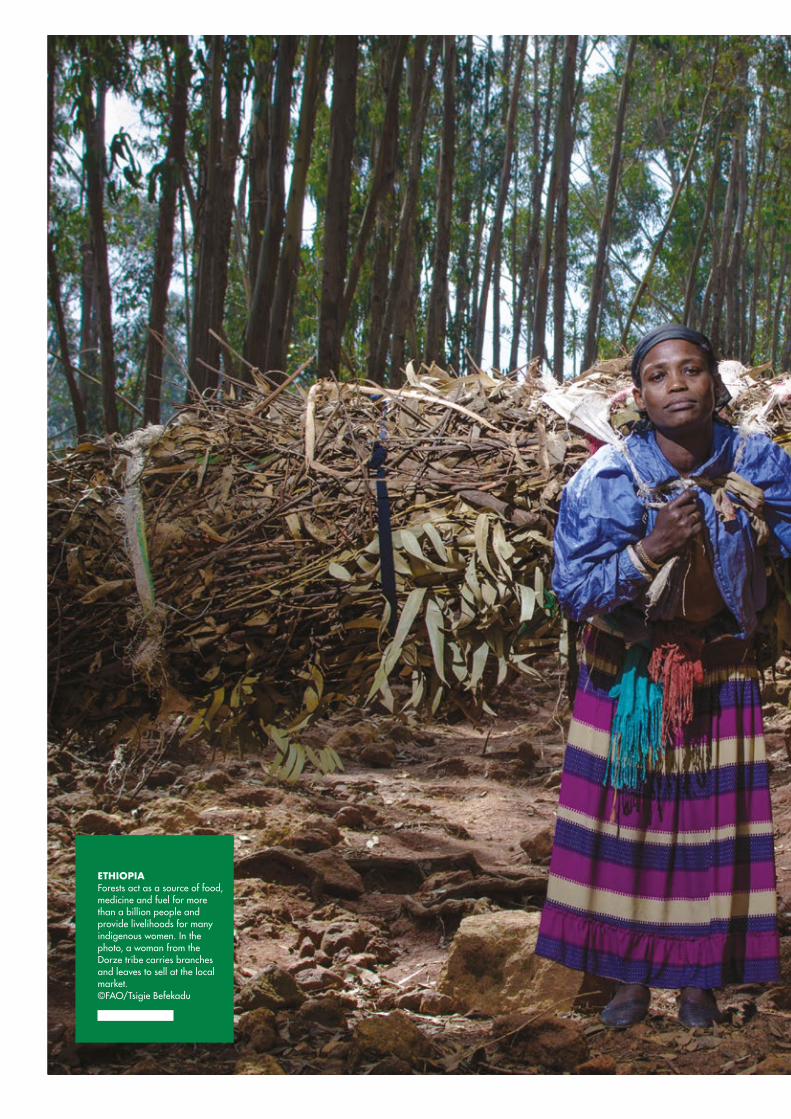
ETHIOPIAForests act as a source of food, medicine and fuel for more than a billion people and provide livelihoods for many indigenous women. In the photo, a woman from the Dorze tribe carries branches and leaves to sell at the local market. ©FAO/Tsigie Befekadu
CHAPTER 2QUANTIFYING
THE CONTRIBUTIONS OF FORESTS TO
THE SUSTAINABLE DEVELOPMENT
GOALS
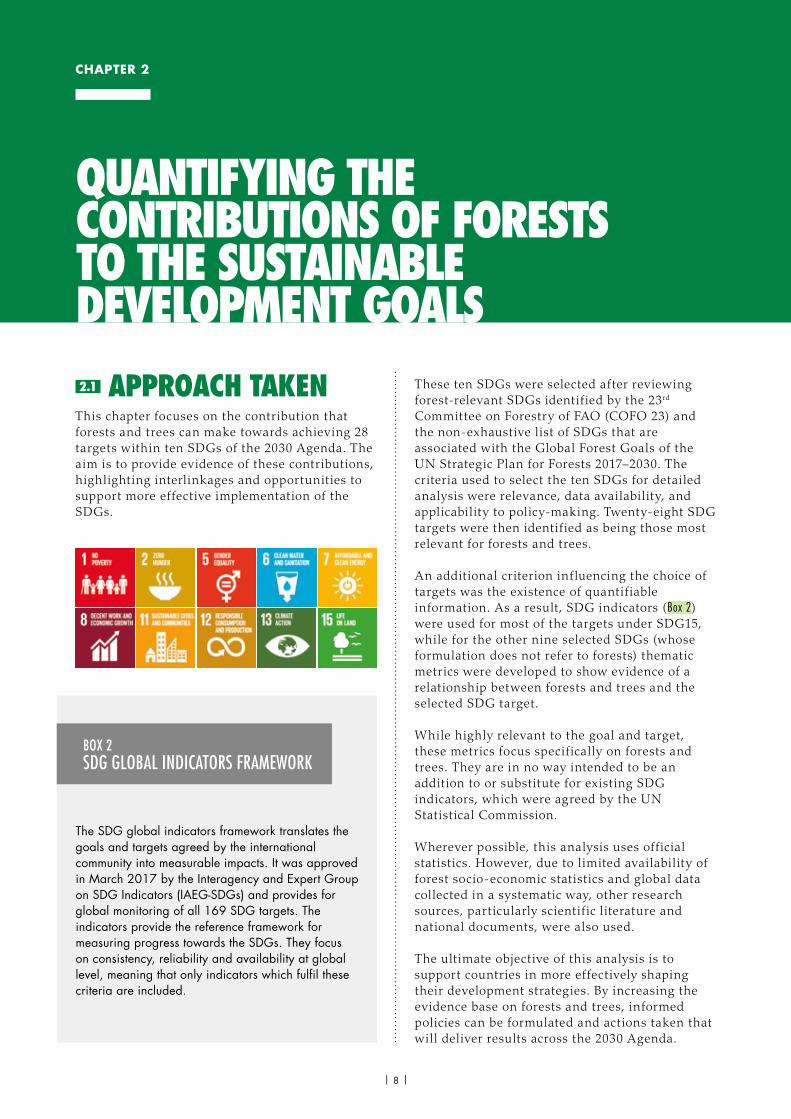
2.1 APPROACH TAKENThis chapter focuses on the contribution that forests and trees can make towards achieving 28 targets within ten SDGs of the 2030 Agenda. The aim is to provide evidence of these contributions, highlighting interlinkages and opportunities to support more effective implementation of the SDGs.
These ten SDGs were selected after reviewing forest-relevant SDGs identif ied by the 23rd Committee on Forestry of FAO (COFO 23) and the non-exhaustive list of SDGs that are associated with the Global Forest Goals of the UN Strategic Plan for Forests 2017–2030. The criteria used to select the ten SDGs for detailed analysis were relevance, data availability, and applicability to policy-making. Twenty-eight SDG targets were then identif ied as being those most relevant for forests and trees.
An additional criterion inf luencing the choice of targets was the existence of quantif iable information. As a result, SDG indicators (Box 2)were used for most of the targets under SDG15, while for the other nine selected SDGs (whose formulation does not refer to forests) thematic metrics were developed to show evidence of a relationship between forests and trees and the selected SDG target.
While highly relevant to the goal and target, these metrics focus specifically on forests and trees. They are in no way intended to be an addition to or substitute for existing SDG indicators, which were agreed by the UN Statistical Commission.
Wherever possible, this analysis uses official statistics. However, due to limited availability of forest socio-economic statistics and global data collected in a systematic way, other research sources, particularly scientif ic literature and national documents, were also used.
The ultimate objective of this analysis is to support countries in more effectively shaping their development strategies. By increasing the evidence base on forests and trees, informed policies can be formulated and actions taken that will deliver results across the 2030 Agenda.
CHAPTER 2
QUANTIFYING THE CONTRIBUTIONS OF FORESTS TO THE SUSTAINABLE DEVELOPMENT GOALS
The SDG global indicators framework translates the goals and targets agreed by the international community into measurable impacts. It was approved in March 2017 by the Interagency and Expert Group on SDG Indicators (IAEG-SDGs) and provides for global monitoring of all 169 SDG targets. The indicators provide the reference framework for measuring progress towards the SDGs. They focus on consistency, reliability and availability at global level, meaning that only indicators which fulfil these criteria are included.
BOX 2SDG GLOBAL INDICATORS FRAMEWORK
| 8 |
THE STATE OF THE WORLD’S FORESTS 2018
Detailed information on the 28 SDG targets, thematic metrics and data sources is provided in the Annex. n
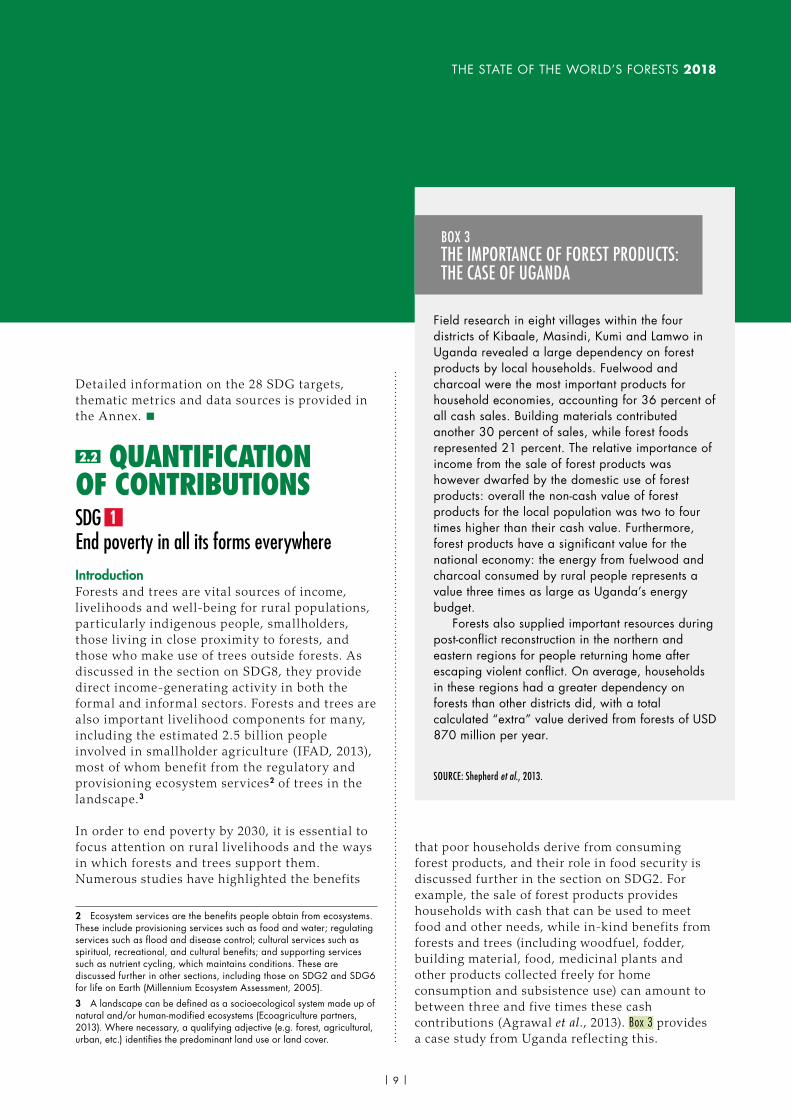
2.2 QUANTIFICATION OF CONTRIBUTIONSSDG End poverty in all its forms everywhereIntroductionForests and trees are vital sources of income, livelihoods and well-being for rural populations, particularly indigenous people, smallholders, those liv ing in close proximity to forests, and those who make use of trees outside forests. As discussed in the section on SDG8, they provide direct income-generating activ ity in both the formal and informal sectors. Forests and trees are also important livelihood components for many, including the estimated 2.5 billion people involved in smallholder agriculture (IFAD, 2013), most of whom benefit from the regulatory and provisioning ecosystem services2 of trees in the landscape.3
In order to end poverty by 2030, it is essential to focus attention on rural livelihoods and the ways in which forests and trees support them. Numerous studies have highlighted the benefits
2 Ecosystem services are the benefits people obtain from ecosystems. These include provisioning services such as food and water; regulating services such as flood and disease control; cultural services such as spiritual, recreational, and cultural benefits; and supporting services such as nutrient cycling, which maintains conditions. These are discussed further in other sections, including those on SDG2 and SDG6 for life on Earth (Millennium Ecosystem Assessment, 2005).
3 A landscape can be defined as a socioecological system made up of natural and/or human-modified ecosystems (Ecoagriculture partners, 2013). Where necessary, a qualifying adjective (e.g. forest, agricultural, urban, etc.) identifies the predominant land use or land cover.
that poor households derive from consuming forest products, and their role in food security is discussed further in the section on SDG2. For example, the sale of forest products provides households with cash that can be used to meet food and other needs, while in-kind benefits from forests and trees (including woodfuel, fodder, building material, food, medicinal plants and other products collected freely for home consumption and subsistence use) can amount to between three and five times these cash contributions (Agrawal et al., 2013). Box 3 provides a case study from Uganda reflecting this.
Field research in eight villages within the four districts of Kibaale, Masindi, Kumi and Lamwo in Uganda revealed a large dependency on forest products by local households. Fuelwood and charcoal were the most important products for household economies, accounting for 36 percent of all cash sales. Building materials contributed another 30 percent of sales, while forest foods represented 21 percent. The relative importance of income from the sale of forest products was however dwarfed by the domestic use of forest products: overall the non-cash value of forest products for the local population was two to four times higher than their cash value. Furthermore, forest products have a significant value for the national economy: the energy from fuelwood and charcoal consumed by rural people represents a value three times as large as Uganda’s energy budget.
Forests also supplied important resources during post-conflict reconstruction in the northern and eastern regions for people returning home after escaping violent conflict. On average, households in these regions had a greater dependency on forests than other districts did, with a total calculated “extra” value derived from forests of USD 870 million per year.
SOURCE: Shepherd et al., 2013.
BOX 3THE IMPORTANCE OF FOREST PRODUCTS: THE CASE OF UGANDA
| 9 |
CHAPTER 2 QUANTIFYING THE CONTRIBUTIONS OF FORESTS
Quantifying how forests and trees contribute to SDG1
SDG TARGET 1.1 è By 2030, eradicate extreme poverty for all people everywhere, currently measured as those living on less than USD 1.25 a day
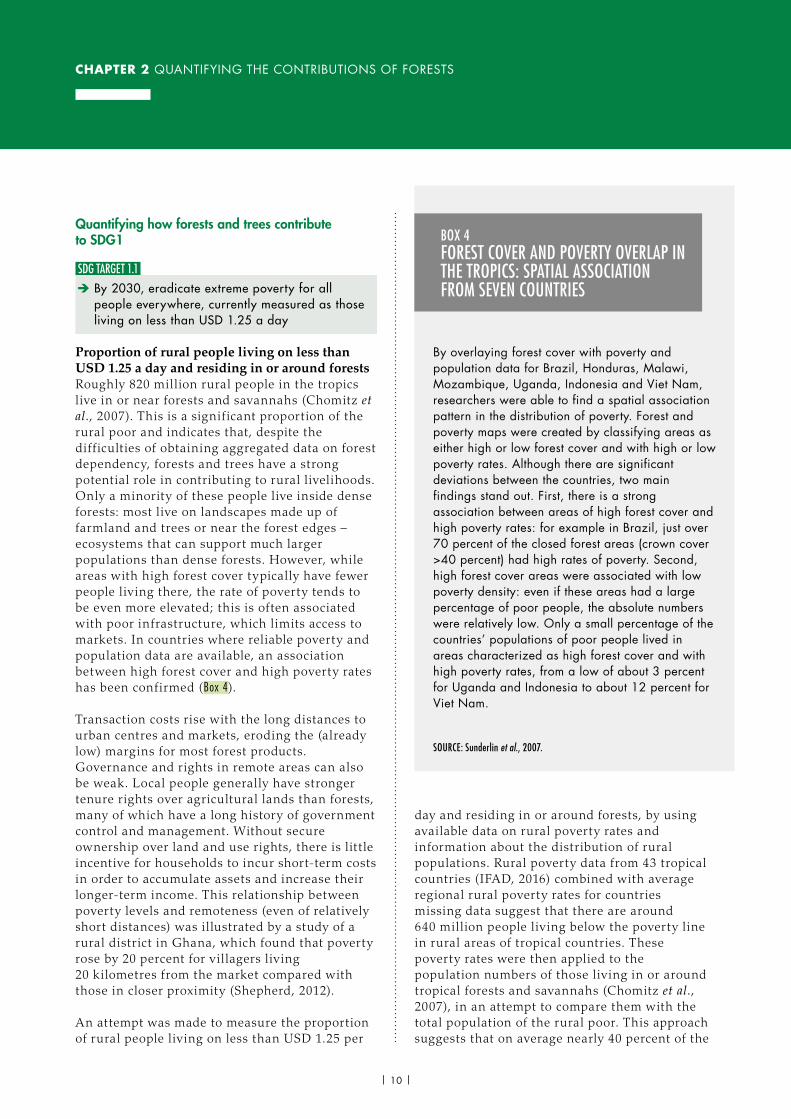
Proportion of rural people living on less than USD 1.25 a day and residing in or around forestsRoughly 820 million rural people in the tropics live in or near forests and savannahs (Chomitz et al., 2007). This is a significant proportion of the rural poor and indicates that, despite the diff iculties of obtaining aggregated data on forest dependency, forests and trees have a strong potential role in contributing to rural livelihoods. Only a minority of these people live inside dense forests: most live on landscapes made up of farmland and trees or near the forest edges – ecosystems that can support much larger populations than dense forests. However, while areas with high forest cover typically have fewer people liv ing there, the rate of poverty tends to be even more elevated; this is often associated with poor infrastructure, which limits access to markets. In countries where reliable poverty and population data are available, an association between high forest cover and high poverty rates has been confirmed (Box 4).
Transaction costs rise with the long distances to urban centres and markets, eroding the (already low) margins for most forest products. Governance and rights in remote areas can also be weak. Local people generally have stronger tenure rights over agricultural lands than forests, many of which have a long history of government control and management. Without secure ownership over land and use rights, there is little incentive for households to incur short-term costs in order to accumulate assets and increase their longer-term income. This relationship between poverty levels and remoteness (even of relatively short distances) was illustrated by a study of a rural district in Ghana, which found that poverty rose by 20 percent for villagers liv ing 20 kilometres from the market compared with those in closer proximity (Shepherd, 2012).
An attempt was made to measure the proportion of rural people liv ing on less than USD 1.25 per
day and residing in or around forests, by using available data on rural poverty rates and information about the distribution of rural populations. Rural poverty data from 43 tropical countries (IFAD, 2016) combined with average regional rural poverty rates for countries missing data suggest that there are around 640 million people liv ing below the poverty line in rural areas of tropical countries. These poverty rates were then applied to the population numbers of those liv ing in or around tropical forests and savannahs (Chomitz et al., 2007), in an attempt to compare them with the total population of the rural poor. This approach suggests that on average nearly 40 percent of the
By overlaying forest cover with poverty and population data for Brazil, Honduras, Malawi, Mozambique, Uganda, Indonesia and Viet Nam, researchers were able to find a spatial association pattern in the distribution of poverty. Forest and poverty maps were created by classifying areas as either high or low forest cover and with high or low poverty rates. Although there are significant deviations between the countries, two main findings stand out. First, there is a strong association between areas of high forest cover and high poverty rates: for example in Brazil, just over 70 percent of the closed forest areas (crown cover >40 percent) had high rates of poverty. Second, high forest cover areas were associated with low poverty density: even if these areas had a large percentage of poor people, the absolute numbers were relatively low. Only a small percentage of the countries’ populations of poor people lived in areas characterized as high forest cover and with high poverty rates, from a low of about 3 percent for Uganda and Indonesia to about 12 percent for Viet Nam.
SOURCE: Sunderlin et al., 2007.
BOX 4FOREST COVER AND POVERTY OVERLAP IN THE TROPICS: SPATIAL ASSOCIATION FROM SEVEN COUNTRIES
| 10 |
THE STATE OF THE WORLD’S FORESTS 2018
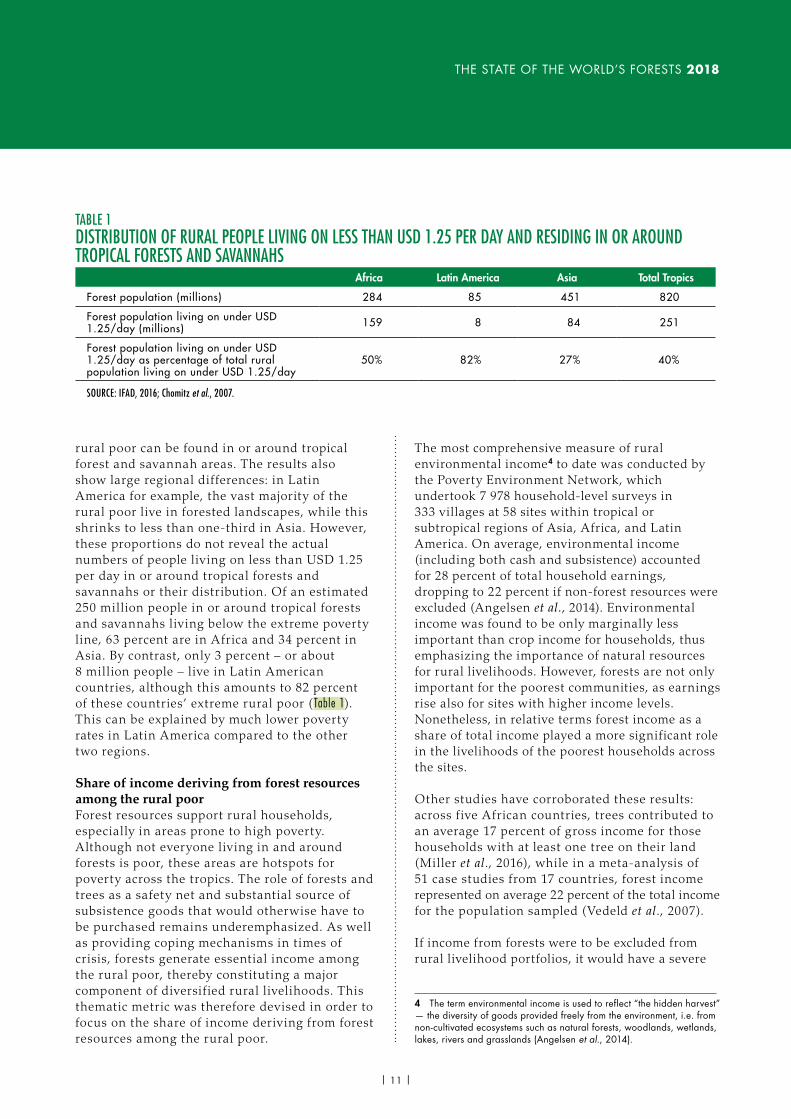
rural poor can be found in or around tropical forest and savannah areas. The results also show large regional differences: in Latin America for example, the vast majority of the rural poor live in forested landscapes, while this shrinks to less than one-third in Asia. However, these proportions do not reveal the actual numbers of people liv ing on less than USD 1.25 per day in or around tropical forests and savannahs or their distribution. Of an estimated 250 million people in or around tropical forests and savannahs liv ing below the extreme poverty line, 63 percent are in Africa and 34 percent in Asia. By contrast, only 3 percent – or about 8 million people – live in Latin American countries, although this amounts to 82 percent of these countries’ extreme rural poor ( Table 1). This can be explained by much lower poverty rates in Latin America compared to the other two regions.
Share of income deriving from forest resources among the rural poorForest resources support rural households, especially in areas prone to high poverty. Although not everyone liv ing in and around forests is poor, these areas are hotspots for poverty across the tropics. The role of forests and trees as a safety net and substantial source of subsistence goods that would otherwise have to be purchased remains underemphasized. As well as providing coping mechanisms in times of crisis, forests generate essential income among the rural poor, thereby constituting a major component of diversif ied rural livelihoods. This thematic metric was therefore devised in order to focus on the share of income deriving from forest resources among the rural poor.
The most comprehensive measure of rural environmental income4 to date was conducted by the Poverty Environment Network, which undertook 7 978 household-level surveys in 333 villages at 58 sites within tropical or subtropical regions of Asia, Africa, and Latin America. On average, environmental income (including both cash and subsistence) accounted for 28 percent of total household earnings, dropping to 22 percent if non-forest resources were excluded (Angelsen et al., 2014). Environmental income was found to be only marginally less important than crop income for households, thus emphasizing the importance of natural resources for rural livelihoods. However, forests are not only important for the poorest communities, as earnings rise also for sites with higher income levels. Nonetheless, in relative terms forest income as a share of total income played a more significant role in the livelihoods of the poorest households across the sites.
Other studies have corroborated these results: across f ive African countries, trees contributed to an average 17 percent of gross income for those households with at least one tree on their land (Miller et al., 2016), while in a meta-analysis of 51 case studies from 17 countries, forest income represented on average 22 percent of the total income for the population sampled (Vedeld et al., 2007).
If income from forests were to be excluded from rural livelihood portfolios, it would have a severe
4 The term environmental income is used to reflect “the hidden harvest” — the diversity of goods provided freely from the environment, i.e. from non-cultivated ecosystems such as natural forests, woodlands, wetlands, lakes, rivers and grasslands (Angelsen et al., 2014).
TABLE 1DISTRIBUTION OF RURAL PEOPLE LIVING ON LESS THAN USD 1.25 PER DAY AND RESIDING IN OR AROUND TROPICAL FORESTS AND SAVANNAHS
Africa Latin America Asia Total Tropics
Forest population (millions) 284 85 451 820
Forest population living on under USD 1.25/day (millions) 159 8 84 251
Forest population living on under USD 1.25/day as percentage of total rural population living on under USD 1.25/day
50% 82% 27% 40%
SOURCE: IFAD, 2016; Chomitz et al., 2007.
| 11 |
CHAPTER 2 QUANTIFYING THE CONTRIBUTIONS OF FORESTS
effect on poverty rates. For example for the Poverty Environment Network sites, doing so would push 9 percent of the sampled households below the extreme poverty line (Noack et al., 2015). The role of forests in reducing long-term poverty has however been found to be much more complex. It is multidimensional and affected by a wide range of factors, such as insecure tenure and inadequate rights to make use of forest products. These products include high-value goods such as timber, which could contribute to income, as well as wood for household use and NWFPs.
The potential for income generation from timber, NWFPs, and payments for environmental services is high, but in addition to tenure security and rights of access to resources, groups need support to build capacity in organizing, managing, adding value, marketing, and advocacy to influence decision-makers. It is important that the forest-dependent poor not be excluded from wider anti-poverty programmes or opportunities in their countries due to the remoteness of their settlements or because of low political priority.
SDG TARGET 1.4 è By 2030, ensure that all men and women, in particular the poor and the vulnerable, have equal rights to economic resources, as well as access to basic services, ownership and control over land and other forms of property, inheritance, natural resources, appropriate new technology and financial services, including microfinance
Proportion of forests with secure tenure rights for local communities and other forest-dependent peopleClear and secure tenure rights are recognized as an important prerequisite for the sustainable management of natural resources. Tenure covers multiple rights, including at a minimum the right to access, the right to make management decisions and the right to withdraw resources from a particular area. In countries across Latin America, Africa and Asia where such rights are effectively enforced, they have been associated with lower deforestation rates and as pre-conditions for cost-effective, community-led climate change mitigation options (Stevens et al., 2014; Ding et al., 2016). Tenure rights for local
communities have also brought substantial l ivelihood benefits, especially when combined with other measures to target the poorest, as il lustrated in Box 5. Secure tenure also reduces the risk of forest conversion and diversion of both cash and subsistence benefits on which the poorest depend.
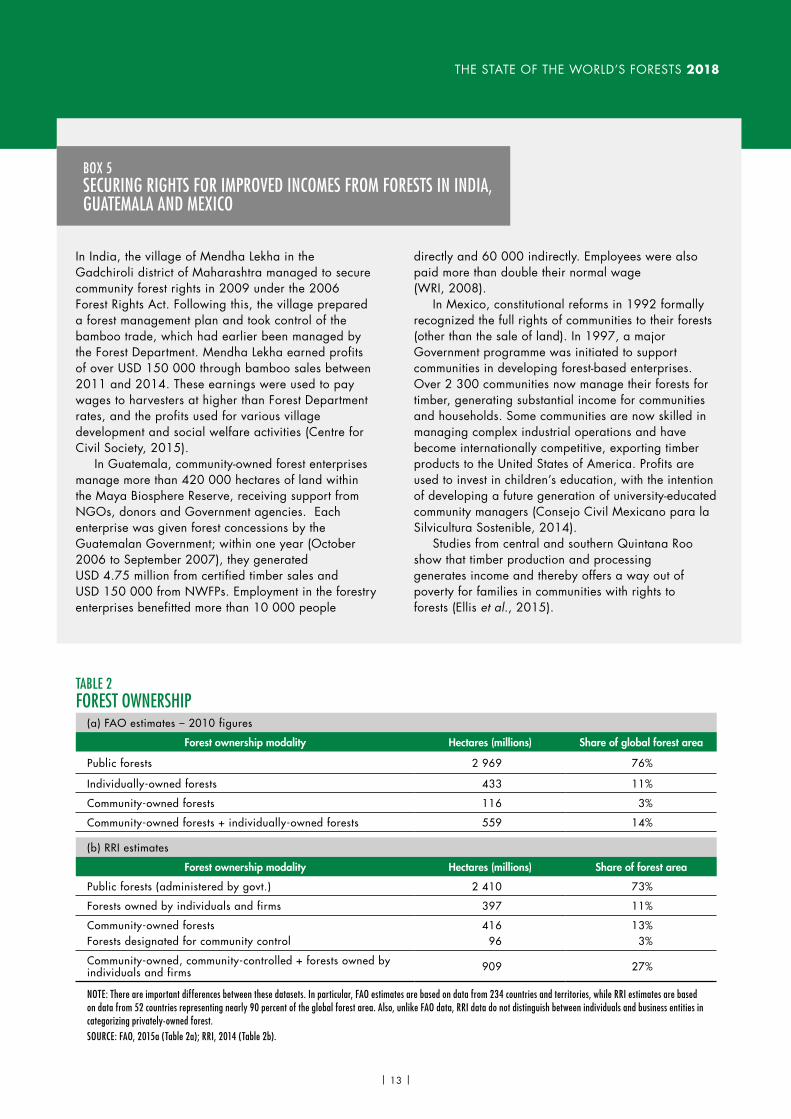
The proportion of forests with secure tenure rights for local communities and other forest-dependent people is used here as a thematic metric to measure forests’ role in ensuring equal rights to economic resources for all. The global trend over the last two decades is one of devolution of forest tenure from national governments to local communities and individuals. Nevertheless, in 2010 public ownership still accounted for 76 percent of all forest area, or 2 969 million hectares (FAO, 2015a). Recognition of community tenure rights has mainly occurred in low- and middle-income countries. The spread of devolution of tenure rights is however extremely uneven across countries and regions, for example with much greater community ownership in Latin America than in Africa (RRI, 2014). Comparing tenure data is challenging due to differences in methodology and in the definitions used between various sources. FAO reports from official country statistics showed that in 2010, 3 percent of global forest area was under community ownership (FAO, 2015a). A significantly higher estimate was made by the Rights and Resources Initiative (RRI), which found that in 2013 in 52 countries (representing nearly 90 percent of the global forest area) over 15 percent of forests – or 512 million hectares – were either under community ownership or designated for community “control” ( Table 2).
Both sets of numbers relate to legally-recognized rights in land, but in addition substantial areas of forest are de facto managed without legal recognition by local communities and indigenous peoples, especially in Africa and elsewhere where customary land rights prevail. Furthermore, it is estimated that around 100 million hectares of forest are partially under community control. Taking these factors into account, the proportion of forests under community and smallholder management may be as high as 28 percent of the world’s forest area (Gilmour, 2016).
| 12 |
THE STATE OF THE WORLD’S FORESTS 2018
In India, the village of Mendha Lekha in the Gadchiroli district of Maharashtra managed to secure community forest rights in 2009 under the 2006 Forest Rights Act. Following this, the village prepared a forest management plan and took control of the bamboo trade, which had earlier been managed by the Forest Department. Mendha Lekha earned profits of over USD 150 000 through bamboo sales between 2011 and 2014. These earnings were used to pay wages to harvesters at higher than Forest Department rates, and the profits used for various village development and social welfare activities (Centre for Civil Society, 2015).
In Guatemala, community-owned forest enterprises manage more than 420 000 hectares of land within the Maya Biosphere Reserve, receiving support from NGOs, donors and Government agencies. Each enterprise was given forest concessions by the Guatemalan Government; within one year (October 2006 to September 2007), they generated USD 4.75 million from certified timber sales and USD 150 000 from NWFPs. Employment in the forestry enterprises benefitted more than 10 000 people
directly and 60 000 indirectly. Employees were also paid more than double their normal wage (WRI, 2008).
In Mexico, constitutional reforms in 1992 formally recognized the full rights of communities to their forests (other than the sale of land). In 1997, a major Government programme was initiated to support communities in developing forest-based enterprises. Over 2 300 communities now manage their forests for timber, generating substantial income for communities and households. Some communities are now skilled in managing complex industrial operations and have become internationally competitive, exporting timber products to the United States of America. Profits are used to invest in children’s education, with the intention of developing a future generation of university-educated community managers (Consejo Civil Mexicano para la Silvicultura Sostenible, 2014).
Studies from central and southern Quintana Roo show that timber production and processing generates income and thereby offers a way out of poverty for families in communities with rights to forests (Ellis et al., 2015).
BOX 5SECURING RIGHTS FOR IMPROVED INCOMES FROM FORESTS IN INDIA, GUATEMALA AND MEXICO
TABLE 2FOREST OWNERSHIP
(a) FAO estimates – 2010 figures
Forest ownership modality Hectares (millions) Share of global forest area
Public forests 2 969 76%
Individually-owned forests 433 11%
Community-owned forests 116 3%
Community-owned forests + individually-owned forests 559 14%
(b) RRI estimates
Forest ownership modality Hectares (millions) Share of forest area
Public forests (administered by govt.) 2 410 73%
Forests owned by individuals and firms 397 11%
Community-owned forestsForests designated for community control
416 96
13%3%
Community-owned, community-controlled + forests owned by individuals and firms 909 27%
NOTE: There are important differences between these datasets. In particular, FAO estimates are based on data from 234 countries and territories, while RRI estimates are based on data from 52 countries representing nearly 90 percent of the global forest area. Also, unlike FAO data, RRI data do not distinguish between individuals and business entities in categorizing privately-owned forest. SOURCE: FAO, 2015a (Table 2a); RRI, 2014 (Table 2b).
| 13 |
CHAPTER 2 QUANTIFYING THE CONTRIBUTIONS OF FORESTS
SDG TARGET 1.5 è By 2030, build the resilience of the poor and those in vulnerable situations and reduce their exposure and vulnerability to climate-related extreme events and other economic, social and environmental shocks and disasters
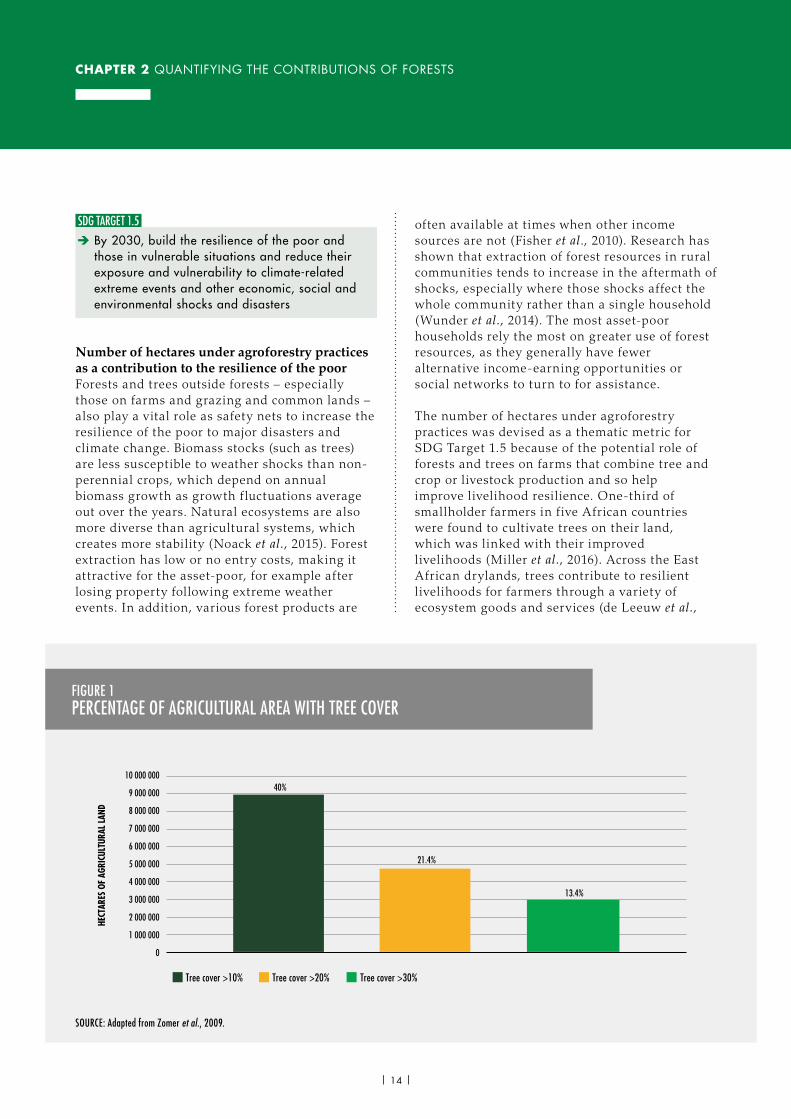
Number of hectares under agroforestry practices as a contribution to the resilience of the poorForests and trees outside forests – especially those on farms and grazing and common lands – also play a vital role as safety nets to increase the resilience of the poor to major disasters and climate change. Biomass stocks (such as trees) are less susceptible to weather shocks than non-perennial crops, which depend on annual biomass growth as growth f luctuations average out over the years. Natural ecosystems are also more diverse than agricultural systems, which creates more stability (Noack et al., 2015). Forest extraction has low or no entry costs, making it attractive for the asset-poor, for example after losing property following extreme weather events. In addition, various forest products are
often available at times when other income sources are not (Fisher et al., 2010). Research has shown that extraction of forest resources in rural communities tends to increase in the aftermath of shocks, especially where those shocks affect the whole community rather than a single household (Wunder et al., 2014). The most asset-poor households rely the most on greater use of forest resources, as they generally have fewer alternative income-earning opportunities or social networks to turn to for assistance.
The number of hectares under agroforestry practices was devised as a thematic metric for SDG Target 1.5 because of the potential role of forests and trees on farms that combine tree and crop or livestock production and so help improve livelihood resilience. One-third of smallholder farmers in f ive African countries were found to cultivate trees on their land, which was linked with their improved livelihoods (Miller et al., 2016). Across the East African drylands, trees contribute to resilient livelihoods for farmers through a variety of ecosystem goods and services (de Leeuw et al.,
FIGURE 1PERCENTAGE OF AGRICULTURAL AREA WITH TREE COVER
40%
21.4%
13.4%
0
1 000 000
2 000 000
3 000 000
4 000 000
5 000 000
6 000 000
7 000 000
8 000 000
9 000 000
10 000 000
HECT
ARES
OF
AGRI
CULT
URAL
LAND
Tree cover >10% Tree cover >20% Tree cover >30%
SOURCE: Adapted from Zomer et al., 2009.
| 14 |
THE STATE OF THE WORLD’S FORESTS 2018
2014): by creating diversif ied livelihoods, providing natural capital and regulating ecosystem services, trees in agroforestry systems increase the overall resilience of the landscape. However, despite their importance for rural livelihoods, forests and trees are not the only or primary strategy for resilience: others that may be more important include reduced consumption, f inding alternative work, seeking external assistance and selling assets. For example, research from rural Malawi showed that only 3 percent of households reported using forest diversif ication to prepare for climate variability – well below other measures such as agricultural modification or crop diversif ication (Fisher et al., 2010).
Trees are widely spread over agricultural land, with the highest cover found in the humid regions of Southeast Asia, Central America, eastern South America and coastal West Africa. Figure 1 presents the percentage of global agricultural area with different levels of tree cover, as reported by ICRAF (Zomer et al., 2009). These numbers do not define agroforestry landscapes or ref lect the wide variation in agroforestry practices, but they do give an indication of the extent of tree cover in predominantly agricultural areas.
SDG End hunger, achieve food security and improved nutrition and promote sustainable agricultureIntroductionAs the challenge of food insecurity has increased (FSIN, 2017), more attention has been focused on the role that forests and trees can play in addressing this. Approximately 70 percent more food will be needed for the world’s growing population, which is forecast to reach 9.1 billion by 2030 (FAO, 2009). Nearly one in seven people today do not have access to sufficient protein and energy and even more suffer from malnourishment (Godfray et al., 2010). Forests contribute directly to food security by providing food and dietary diversity, supplying wood energy for cooking food, and enhancing the resilience of the ecological and
social systems surrounding agriculture (Wheeler and von Braun, 2013).
Food security is defined as a situation that exists when all people, at all t imes, have physical, social and economic access to sufficient, safe and nutritious food that meets their dietary needs and food preferences for an active and healthy life. It has four dimensions: availability, access, utilization, and stability.
Increased food availability: Forests and trees provide many food items of both plant and animal origin – important as the majority of the 1.6 billion forest-dependent people are poor (Agrawal et al., 2013). Forests also diversify dietary supplies for human populations (FAO, 2014). Since trees are often more resilient to adverse weather conditions than agricultural crops, forest-based food items contribute to household resilience by serving as an important safety net in times of crisis and emergencies, such as crop failure due to drought, hailstorms, or sociocultural crises that lead to families losing their productive resources (HLPE, 2017; Keller et al., 2006; Blackie et al., 2014; Foli et al., 2014). Income generated from NWFPs has been estimated at USD 88 billion (FAO, 2014), although this is thought to be a substantial underestimate. Meanwhile, reducing food waste at global, regional, and national levels would have a significantly positive effect on natural resources, including forests (FAO, 2013a).
Enhanced access to food through income and employment: The scale of employment generated by the forest sector is highlighted in the section on SDG8. However, as also noted there, f igures relating to the informal sector in particular are underestimates (Ferraro et al., 2012; HLPE, 2017).
Enhanced utilization: As explained later in this section and in the section on SDG7, about 2.4 billion people rely on woodfuel for cooking and water sterilization (FAO, 2017a).
Food stability: Forest ecosystem services have the potential to enhance agricultural and fishery production (Foli et al., 2014), including through water regulation, soil formation, protection, nutrient circulation, biodiversity conservation,
| 15 |
CHAPTER 2 QUANTIFYING THE CONTRIBUTIONS OF FORESTS
agroecosystem stability, pest control and pollination. These are all directly linked to agricultural production and so ultimately contribute to the goal of food security (HLPE, 2017). The role of forests in the hydrological cycle (Ellison et al., 2017) includes providing organic matter (Kimble et al., 2007), green manure, and compost for farming (Sinu et al., 2012). Trees in agroforestry systems significantly increase the productivity of agricultural crops (FAO, 2010), while forests, trees and wild fauna are crucial for the pollination of food crops (Roubik, 1995). Pollinator diversity can significantly increase pollination intensity (Garibaldi et al., 2016).
Quantifying how forests and trees contribute to SDG2
SDG TARGET 2.1 è By 2030, end hunger and ensure access by all people, in particular the poor and people in vulnerable situations, including infants, to safe, nutritious and sufficient food all year round
Amount of edible NWFPs, including wild meat harvested or consumedForests and trees contribute directly to food and nutritional security by providing edible NWFPs. Globally, 76 million tonnes of food from forests are consumed, 95 percent of which is plant-based (FAO, 2014). The case study in Box 6 illustrates how NWFPs can also help people to stay food-secure during times of the year when less food is available.
An estimated 50 percent of the fruit consumed by humans comes from trees (Powell et al., 2013), many of which originate in natural forests (Dawson et al., 2014). Likewise, trees in agroforestry systems (Mbow et al., 2014) and urban green spaces (Clark and Nicholas, 2013) also offer important NWFPs for human consumption. On average, edible plant-based NWFPs provide 16.5 kcal per person per day (FAO, 2014), although the case studies summarized in Box 7 suggest that this underestimates their importance in some countries. Furthermore, the caloric measure of NWFPs does not capture their benefits in terms of protein and micronutrients (Powell, 2013). It would be valuable to have further information about the nutritional values of NWFPs, as well as their overall contribution to livelihoods and food security.
In Burkina Faso, a study showed that restored forest land provided a significant contribution to household food supply (Kumar et al., 2015), with 66 percent of those interviewed considering forest food highly important. Out of six types of harvested products from reforested land, food items ranked equally with legumes and cereals. Overall, the continuous availability of NWFPs for food made up for the supply deficit during the agricultural lean season.
In India, it has been estimated that up to 50 million households supplement their diets with fruits gathered from wild forests and surrounding bushland (FAO, 2011a). In Nepal, as much as 160 kilograms of wild mushrooms are collected for food by a single household in a year (Christensen et al., 2008). In Africa, edible leaves of wild trees such as baobab and tamarind are important sources of protein, iron and calcium (Kehlenbeck et al., 2015). In Europe, a survey conducted among over 17 000 households in 28 countries in 2015 revealed that 91.5 percent had consumed wild forest products (82 percent purchased at least some from a shop, while 25 percent were involved in direct gathering) (Lovric
,, 2016). In northern and
central Siberia, some 40 percent of indigenous families collect mushrooms; up to 100 kilograms per hectare can be found in the most productive areas, although on average households collect no more than 5 kilograms per day (Vladyshevskiy et al., 2000).
BOX 6FORESTS AND TREES AS A SAFETY NET AND SOURCE OF FOOD
BOX 7AMOUNT OF NWFPS CONSUMED AT HOUSEHOLD LEVEL
| 16 |
THE STATE OF THE WORLD’S FORESTS 2018
Box 8 demonstrates that NWFPs provide nutritional diversity. Wild meat is also an important source of food: data from surveys in 24 countries in Latin America, Asia and Africa revealed that 39 percent of sampled households harvested wild meat (Neilsen et al., 2018). About 4.6 million and 1.3 million tonnes of wild meat are extracted annually from the Congo Basin and Amazonia respectively (Nasi et al., 2011). Households close to forests consume more wild meat than others and cooking helps make it palatable and safe (Powell et al., 2013). In Madagascar, losing access to wild meat resulted in a 29 percent increase in children with anaemia, which can triple in the case of children from the poorest households (Golden et al., 2011).
Prevalence of people depending on fuelwood and charcoal for cooking and water sterilizationWoodfuel – defined as including both fuelwood and charcoal (FAO, 2017a) – is used by approximately 2.4 billion people worldwide for cooking meals, sterilizing drinking water and heating homes, with around 765 million people
using it to boil and sterilize water (FAO, 2017a). Many studies have demonstrated the contribution of woodfuel (Foley, 1985; Dewees, 1989) and charcoal (Wood and Baldwin, 1985) to livelihoods and food security (Zulu and Richardson, 2013).
Reliance on woodfuel is highest in Africa (63 percent), followed by Asia and Oceania (38 percent), and Latin America and the Caribbean (15 percent) (FAO, 2017a). In the Democratic Republic of the Congo, 90 percent of the capital city of Kinshasa's population rely mainly on charcoal for cooking (Gond et al., 2016). Rural people in 13 countries in Africa as well as in Bhutan and the Lao People’s Democratic Republic use wood energy to provide for as much as 90 percent of their energy requirements (FAO, 2014). In Cameroon, 2.2 million metric tonnes of firewood and 356 530 metric tonnes of charcoal are used in urban areas of the country (Eba'a Atyi et al., 2016). In Nepal, 70 percent of households use woodfuel (Kandel et al., 2016). Woodfuel dependency continues even when a country moves through the process of industrialization, as in the case of China (Démurger and Fournier, 2011).
An investigation into the dietary contributions of wild forest foods in 37 sites in 24 tropical countries indicated that more than half of the sampled households collected forest foods for their own consumption. In 13 sites, the proportion of fish and meat sourced from forests was greater than that from domestic livestock and aquaculture. In 11 sites, a greater proportion of fruits and vegetables was procured by households from forests than from agriculture. The contribution to dietary adequacy is substantial where large quantities of forest foods are consumed (Rowland et al., 2017).
In Cameroon, forest fruits provide important macro- and micronutrients otherwise lacking from the family diets of rural people. For example, 200 grams of moabi fruit (Baillonella toxisperma) or nuts from the bean tree (Pentaclethra macrophylla) could supply 100 percent of
daily iron and zinc requirements for children aged one to three years old (Fungo et al., 2015); there is a statistically significant positive association between tree cover and the dietary diversity of children in the communities of 21 countries across Africa (Ickowitz et al., 2014).
Forest caterpillars contribute to local diets as they are commonly found in many parts of the world. They have higher protein and fat content than meat or fish and provide more energy per unit. Research findings from Bangui in the Central African Republic showed that 100 grams of cooked insects provide more than 100 percent of people’s daily requirements of vitamins and minerals (Durst et al., 2010). Similarly, a study conducted in four villages in Gabon showed that forest food contributes 82 percent of protein, 36 percent of total vitamin A and 20 percent of iron (Blaney et al., 2009).
BOX 8NWFPS PROVIDE NUTRITIONAL DIVERSITY
| 17 |
CHAPTER 2 QUANTIFYING THE CONTRIBUTIONS OF FORESTS
As one of the most affordable and reliable energy sources and a safety net for basic energy services, woodfuel plays a particularly important role for people affected by natural disasters and humanitarian crises, especially in refugee situations (see also thematic metrics: Proportion of population using woodfuel as a source of energy).
Clear and secure forest tenure rights are key for sustainable woodfuel production, as they foster management practices that ensure regrowth or regeneration at least equal to the level of extraction (FAO, 2017a). In regions where community-based forest management systems are not adequately supported through national legislation, woodfuel extraction is often associated with the degradation of biomass reserves, as in the case of the South African savannahs (Wessels et al., 2013). In Malawi, woodfuel constitutes 90 percent of the energy supply, although deforestation is posing a threat to this (Malakini et al., 2014).
The link between woodfuel use and food, nutritional security, and health, is multifaceted. Vulnerable groups in developing countries usually depend on woodfuel for cooking and hence for food utilization. With adequate policy and legal frameworks in place – such as secure forest and tree tenure, integrated landscape management and access to markets – woodfuel production and harvesting can lead to sustainable green energy. The widespread availability of woodfuel and its ubiquitous market are opportunities for employment and sustainable development (FAO, 2017a). The loss of forests means woodfuel is becoming costly in many regions. The average time needed to collect one cubic metre of woodfuel varies from about 106 hours in Latin America and the Caribbean to 139 hours in Asia and Oceania (FAO, 2014). Even in countries with only moderate woodfuel scarcity, women have still been reported to walk up to ten kilometres to gather wood for cooking (Wan et al., 2011). Thus, the availability or scarcity of woodfuel can make a significant difference in cooking and dietary decisions. The implications of woodfuel use for household air pollution and health are considered in the section on SDG7.
SDG TARGET 2.3 è By 2030, double the agricultural productivity and incomes of small-scale food producers, in particular women, indigenous peoples, family farmers, pastoralists and fishers, including through secure and equal access to land, other productive resources and inputs, knowledge, financial services, markets and opportunities for value addition and non-farm employment
Number of people involved in the forestry sector and amount of income generatedIncome from the forest sector helps people buy food. When the formal sector’s indirect and induced effects are also accounted for, it amounts to an estimated total of 45.15 million jobs globally and labour income in excess of USD 580 billion per year. Although a lack of systematic data makes it nearly impossible to provide precise f igures, it is cautiously estimated that the number of people involved informally in the forest sector is around 40 million to 60 million (Agrawal et al., 2013; FAO, 2014). Small- and medium-sized forest enterprises (discussed further in the section on SDG8) provide important potential contributions for reducing poverty and improving food security and nutrition (FAO, 2017b).
In Guatemala, community-owned forest enterprises now manage more than 420 000 hectares of land within the Maya Biosphere Reserve. Each of these enterprises is given a lease of Government land. The sale of forest products from the enterprises has created new employment and income opportunities: from October 2006 to September 2007, USD 4.75 million was generated from certified timber sales and USD 150 000 from NWFPs, benefitting more than 10 000 people directly and 60 000 indirectly. The employees were paid more than double their normal wage.
SOURCE: WRI, 2008.
BOX 9COMMUNITY FORESTRY ENTERPRISES IN GUATEMALA
| 18 |
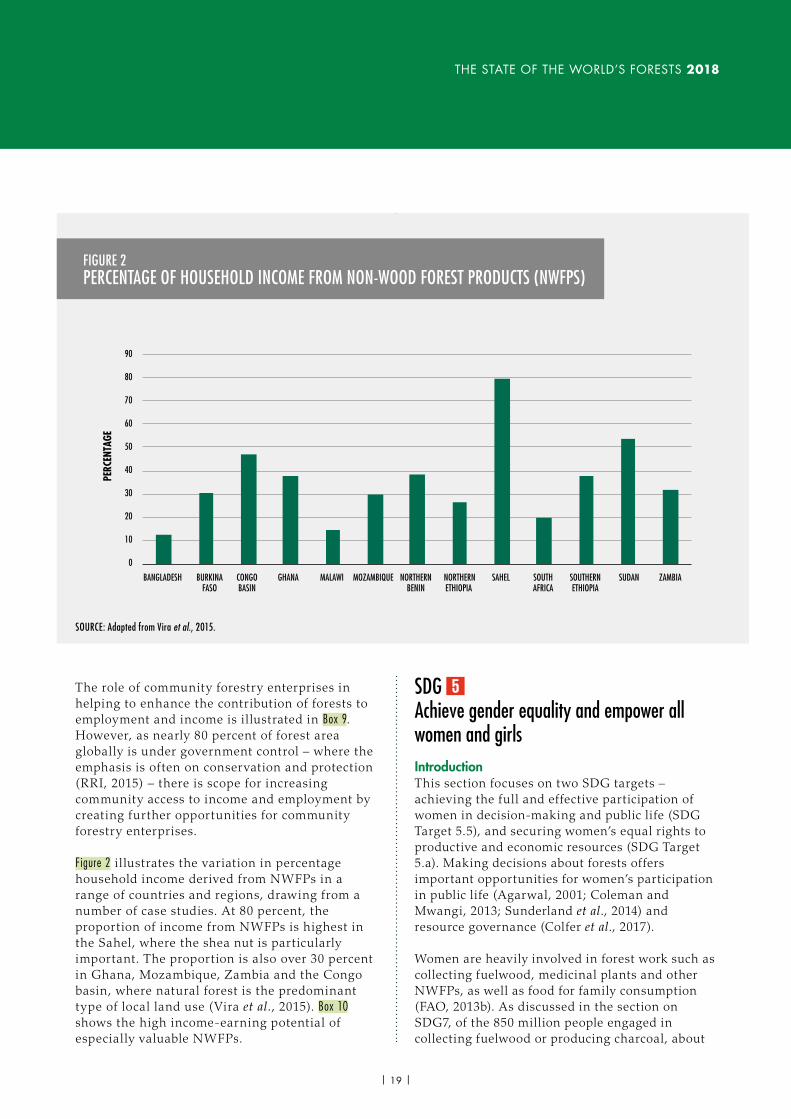
THE STATE OF THE WORLD’S FORESTS 2018
The role of community forestry enterprises in helping to enhance the contribution of forests to employment and income is il lustrated in Box 9. However, as nearly 80 percent of forest area globally is under government control – where the emphasis is often on conservation and protection (RRI, 2015) – there is scope for increasing community access to income and employment by creating further opportunities for community forestry enterprises.
Figure 2 i l lustrates the variation in percentage household income derived from NWFPs in a range of countries and regions, drawing from a number of case studies. At 80 percent, the proportion of income from NWFPs is highest in the Sahel, where the shea nut is particularly important. The proportion is also over 30 percent in Ghana, Mozambique, Zambia and the Congo basin, where natural forest is the predominant type of local land use (Vira et al., 2015). Box 10 shows the high income-earning potential of especially valuable NWFPs.
FIGURE 2PERCENTAGE OF HOUSEHOLD INCOME FROM NON-WOOD FOREST PRODUCTS (NWFPS)
PERC
ENTA
GE
0
10
20
30
40
50
60
70
80
90
BANGLADESH BURKINAFASO
CONGOBASIN
GHANA MALAWI MOZAMBIQUE NORTHERNBENIN
NORTHERNETHIOPIA
SAHEL SOUTHAFRICA
SOUTHERNETHIOPIA
SUDAN ZAMBIA
SOURCE: Adapted from Vira et al., 2015.
SDG Achieve gender equality and empower all women and girls IntroductionThis section focuses on two SDG targets – achieving the full and effective participation of women in decision-making and public life (SDG Target 5.5), and securing women’s equal rights to productive and economic resources (SDG Target 5.a). Making decisions about forests offers important opportunities for women’s participation in public life (Agarwal, 2001; Coleman and Mwangi, 2013; Sunderland et al., 2014) and resource governance (Colfer et al., 2017).
Women are heavily involved in forest work such as collecting fuelwood, medicinal plants and other NWFPs, as well as food for family consumption (FAO, 2013b). As discussed in the section on SDG7, of the 850 million people engaged in collecting fuelwood or producing charcoal, about
| 19 |
CHAPTER 2 QUANTIFYING THE CONTRIBUTIONS OF FORESTS
83 percent are women (FAO, 2014). Women’s increased involvement in forest-based enterprises (discussed in the section on SDG8) allows them to work collectively to advance their interests in securing access to natural resources (Shackleton et al., 2011). Moreover, women have developed rich local knowledge about forest biodiversity which can offer them a unique opportunity to participate meaningfully in public policy processes. According to a statistical analysis carried out in 135 different societies on five subsistence food sources – agriculture, animal husbandry, hunting, fishing, and gathering – women collected 79 percent of total plant-based food items (Barry and Schlegel, 1982, cited in Howard, 2001).
Given that women are more involved than men in many forest-related activities, there are considerable opportunities for improving gender equality in the forest sector, turning women’s informal and subsistence-level involvement into economic and political empowerment. As forests provide many hundreds of marketable products and services, women’s enhanced access to these has strong potential to improve gender equality across the developing world.
Different types of forest tenure offer varying levels of employment opportunities to women. Community-based forest management generally brings better opportunities than state-based management. Over the past two decades, decentralization reforms have opened up new spaces for women, yet research and data are not adequately gender-disaggregated, nor do they show the economic impacts of decentralization on women. Research and discussions on women’s tenure over forests focus mainly on forests where communities have been afforded some rights.
Despite women’s heavy involvement, data on the overall contribution of forests to gender equality are inadequate. There is currently a major focus of research on social participation, but limited attention is given to economic empowerment, including access to business capacity-building or f inancing opportunities. It should also be noted that most gender inequitable practices and traditions originate in non-forest sectors, then extend to the forest sector as well as the rest of the economy. Examples of this include the prevalence of gender pay gaps. To demonstrate the value of forests for gender equality, more gender-disaggregated data are needed at local, subnational, national, regional and global scales.
Quantifying how forests contribute to SDG5
SDG TARGET 5.5 è Ensure women’s full and effective participation and equal opportunities for leadership at all levels of decision-making in political, economic and public life
Proportion of female employees in national forestry administrationsIn many countries, decision-making in the forestry sector is a male domain. The evolution of
Chinese caterpillar fungus is found in the northwest Himalayan region of Nepal. It is extremely valuable: one kilogram can be worth more than its weight in gold, and the fungus contributed 40.5 percent of total NWFP revenue in Nepal in 2011 (Shrestha and Bawa, 2014). Because of its high price, all villagers (except the elderly) from the surrounding area gather the fungus during collection time. There are 24 alpine pastures that are noted for the caterpillar fungus in the district of Dolpa. In 2011, total revenue generated from the sale of Chinese caterpillar fungus was USD 6 million to USD 8.5 million and the amount of fungus collected was 473.8 kilograms. On average, just over 53 percent of total household cash income (USD 1843.66 per year) in this area comes from the sale of this fungus, representing the second largest contribution after farming. For 23 out of 201 households the fungus provides the only source of cash income for their family. However, high price and demand have led to unsustainable harvesting levels: sustainable management of the caterpillar fungus through partnership among local institutions and the state is critical for conserving the species and the sustained flow of benefits to local communities.
SOURCE: Shrestha and Bawa, 2014.
BOX 10CATERPILLAR FUNGUS AS A SOURCE OF INCOME IN THE NEPALESE HIMALAYAS
| 20 |
THE STATE OF THE WORLD’S FORESTS 2018
state forest departments is characterized by a male-dominated workforce of foresters (Gurung et al., 2012). While women dominate NWFP collection at the local level, men dominate the workforce in state agencies that govern forests. When women recently began joining forestry administrations, they often seemed to incorporate a hegemonic masculinity5 (Gurung, 2002). However, cases of gender equitable changes have begun to appear, and the pathways through which such changes occur are of utmost importance for monitoring and learning (Box 11).
Women are gradually entering the forestry workforce, challenging the masculine mindset. In the United Republic of Tanzania, 20 percent of formal forest sector employees are women (FAO, 2007), while in Indonesia female employees comprise more than 20 percent of the total forestry workforce (Setyowati, 2012).
After the Fourth World Conference on Women in Beijing (1995), many countries started to appoint gender focal points in sectoral development ministries, including forestry. An analysis by the International Union for the Conservation of Nature (IUCN) showed that out of 65 countries6 surveyed, 17 (26 percent) had appointed gender focal points in their forest ministry. The figure from ministries of agriculture is more encouraging, with 57 percent having employed gender focal points (Environment and Gender Index, 2015).
Number of women employed in the forest sectorThe section on SDG8 presents data on employment in the formal and informal forest sectors, but gender-disaggregated data are not available (FAO, 2014). The formal forest sector, which was estimated to directly employ 18.21 million people in 2011, is traditionally viewed as male-dominated in many cultures and societies (Gurung, 2002; Watson, 2005). However, the harvest of and trade in NWFPs is dominated by women (Shackleton et al., 2007).
5 Hegemonic masculinity refers to the widespread views of men’s roles that reinforce male dominance. Accordingly, such masculine ideals mandate a male role as protector, provider, and rightful dominator within families (Moore, 2009).
6 The number of countries surveyed includes seven OECD countries, four in non-OECD Europe, six in Latin America and the Caribbean, 15 in Asia and the Pacific, 15 in sub-Saharan Africa, and 15 in the Near East and North Africa.
Examples highlighting the numbers of women working with NWFPs or in agroforestry are outlined in Box 12.
Box 13 highlights the importance of the shea industry in West Africa. Here the NWFP sector offers various forms of employment to women, through collecting and selling products both informally as well as through formal contracts in forest industries. As another example of NWFP activity, women in Ethiopia are heavily involved
Gender gaps are common in Nepal’s forest sector, including: few female staff members, a lack of activities of interest to women, low budgets for activities related to women, and unbalanced decision-making both within the Department of Forests and among the communities where activities are undertaken (Gurung, 2002). Christie and Giri (2011) show that despite an increasing number of female graduates in forestry, out of the country’s 74 districts where a district forest officer is assigned, only one was a woman. Gurung (2002) describes a forestry project in Nepal to illustrate one strategy that developed the skills of change agents within communities and agencies. This triggered some gender-equitable changes by challenging stereotyped attitudes of forestry professionals, a process that helped to create enabling conditions for including women in community-based forestry decisions and benefit-sharing.
The Federation of Community Forest User Groups Nepal (FECOFUN) has an encouraging story about women’s representation in a forestry organization (Ojha, 2012): FECOFUN requires 50 percent of those elected to its national executive committee and district chapters to be women, and one female has become chairperson, challenging the stereotype of male leadership.
SOURCE: Giri, 2012.
BOX 11FORGING DIALOGUE BETWEEN COMMUNITY WOMEN AND MALE FORESTERS IN NEPAL
| 21 |
CHAPTER 2 QUANTIFYING THE CONTRIBUTIONS OF FORESTS
in sorting and cleaning gum and resin – the primary source of income for 96 percent of the women involved (Stloukal et al., 2013).
One of the barriers to gender equality is the lack of women’s rights to land, including forests (Agarwal, 2010). Furthermore, in many situations women deal primarily with lower-value products and engage in less-lucrative activ ities compared to men (FAO, 2013a), as they do not have the same access to technology, credit, training or decision-making as men do (World Bank et al., 2009). In forestry value chains, women are generally less supported by policy-makers or service providers, especially where the focus is on high-tech operations and less attention is given to local markets (FAO, 2013b). As noted above, most work undertaken by women is in the informal sector, and women often get paid less than men. In the countries of sub-Saharan Africa, women are on average paid 32.1 percent less than men. This is ref lected in Burkina Faso, for example, where a study showed that women
would have earned 32 percent more income from the same amount of time spent cleaning gum and resin if there had been no pay gap (World Economic Forum, 2016). Concerns are also emerging about women losing access to forests when new forestry and logging activ ities in the formal sector take place without adequate safeguards (Veuthey and Gerber, 2010). Nationally-led programmes on Reducing Emissions from Deforestation and Forest Degradation (REDD+) are also likely to offer women additional opportunities for employment and income, and given their close engagement with forests, women have knowledge, skills and experience that can benefit the implementation of REDD+ policies (Setyowati, 2012).
A series of studies from Brazil, Cameroon, and South Africa show that 40 to 50 percent of people involved in NWFP trade were women, who were also head of their respective households (Shackleton et al., 2007). Similarly in Cameroon, the majority of NWFP harvesters were found to be women, as were 94 percent of the 1 100 traders (Ndoye, Ruiz-Perez, and Eyebe, 1997, cited in Shackelton et al., 2007).
Another study showed that out of a total of 1 927 farmers trained in Cameroon between 2010 and 2011, 41 percent were women. It was found that 5 331 farm households were involved in small-scale nurseries producing improved germplasm for 83 agroforestry species in Cameroon, the Democratic Republic of the Congo and Nigeria – and that 38 percent of the participants were women (ICRAF-WCA/HT, 2013, cited in FAO, 2013b).
In the eight countries of West Africa, 350 000 tonnes of shea butter were exported in 2008 with an export value equivalent to USD 87.5 million (at 2008 prices). About 4 million to 5 million women are reported to be involved in the collection, processing and marketing of shea nuts and butter. Through this, women generate about 80 percent of their income (Ferris et al., 2001, cited in FAO, 2011a).
In addition to providing increased income and employment for women, the industry enhanced women’s capacity and knowledge about adding value to shea products. Since 2013, with the support of USAID and the Netherlands’ International Cocoa Organization, the Global Shea Alliance has trained over 51 000 female shea collectors on best practices in the quality processing and storage of shea kernels. In the same time period, over 28 000 women belonging to 880 women’s groups have also been linked with buyers and signed contracts for approximately 1 945 million tonnes of shea kernels.
SOURCE: http://www.globalshea.com/news/past/140/Success-Story-Empowering-the-West-African-Shea-Industry.
BOX 12NUMBER OF WOMEN EMPLOYED IN NWFPS AND AGROFORESTRY
BOX 13WOMEN’S INCREASED EMPLOYMENT, INCOME AND SKILLS DEVELOPMENT FROM THE SHEA INDUSTRY IN WEST AFRICA
| 22 |
THE STATE OF THE WORLD’S FORESTS 2018
Number of women in forestry education programmesImproving forestry education can have a major impact on gender equality in the forest sector and in society more widely. Since forestry education is conventionally male-dominated, the opportunity for gender transformative change is huge. Gender equity in forestry education can directly contribute to SDG Target 5.5, which emphasizes women’s full and effective participation in public life.
Globally, forests have significant potential to empower women by enhancing their rights, increasing their income and employment, and strengthening their capacities through skills-development training programmes offered by development organizations. However, women’s enrolment in forestry education programmes remains limited: for example, only 87 female students (compared to 499 male students) graduated from the Department of Forestry at Moi University in Kenya during the period 1985–2001 (Temu et al., 2008).
The content of forestry curricula and the overall working environment after graduating are crucial in attracting female students to forestry education. As female foresters are becoming increasingly assertive in wanting to challenge prevalent gender stereotypes, there is a need to train more of them (Christie and Giri, 2011). In addition, universities and colleges should include gender issues in their education curricula and prioritize gender-sensitive programmes in the accreditation of academic degrees (FAO, 2006).
SDG TARGET 5.A è Undertake reforms to give women equal rights to economic resources, as well as access to ownership and control over land and other forms of property, financial services, inheritance and natural resources, in accordance with national laws
Proportion of total agricultural population with ownership or secure rights over forest land, by sex; and share of women among owners or rights-bearers of forest land, by type of tenure In rural areas, many people’s livelihoods depend on forests, trees and agriculture. While most agricultural land is privately owned in many
countries, forests are often under state or communal ownership. The issue of access to forests is often highly contested because of the interests of diverse stakeholders. Men and women who rely on agriculture, forests and trees for their livelihoods need to have reasonably secure access rights to land and/or products. This thematic metric assesses the proportion by gender of the total agricultural population with ownership or secure rights over forest land, as well as the share of women among owners or rights-bearers of forest land, by type of tenure. In recent times, there have been tenure reforms aimed at decentralizing state forest rights to local communities, especially in Asia and the Pacific, Africa, and Latin America. Globally, 1.5 billion local and indigenous people have secured rights over forest resources through community-based tenure, and these local groups manage about 18 percent of the world’s forest area (RRI, 2015). This presents an important opportunity to enhance gender-equitable access to forests and related lands across developing regions.
In many situations women have become rights bearers of forest land through community-based tenure, and as a consequence community forestry is often viewed as a platform for improving women’s rights. A literature review suggests that such decentralized forest policy reforms have provided institutional space for women to engage in forestry decision-making processes that were previously considered the domain of men (Colfer and Capistrano, 2005). Much of the research into women’s rights over forest land has focused on Asia (Mai et al., 2011). For example, one study on forestry reform in China shows that about 35 percent of sampled households considered women to have more access to forestry technologies then they did before the reform (World Bank, 2016a). Box 14 presents more specific information from Nepal, where significant progress has been made on women accessing forest rights through community-based tenure systems.
Proportion of countries where the legal framework (including customary law) guarantees women’s equal rights to land and forest ownership and/or controlLegally formalizing women’s rights to land and forests is an important basis for advancing the goal of gender equality, and hence the
| 23 |
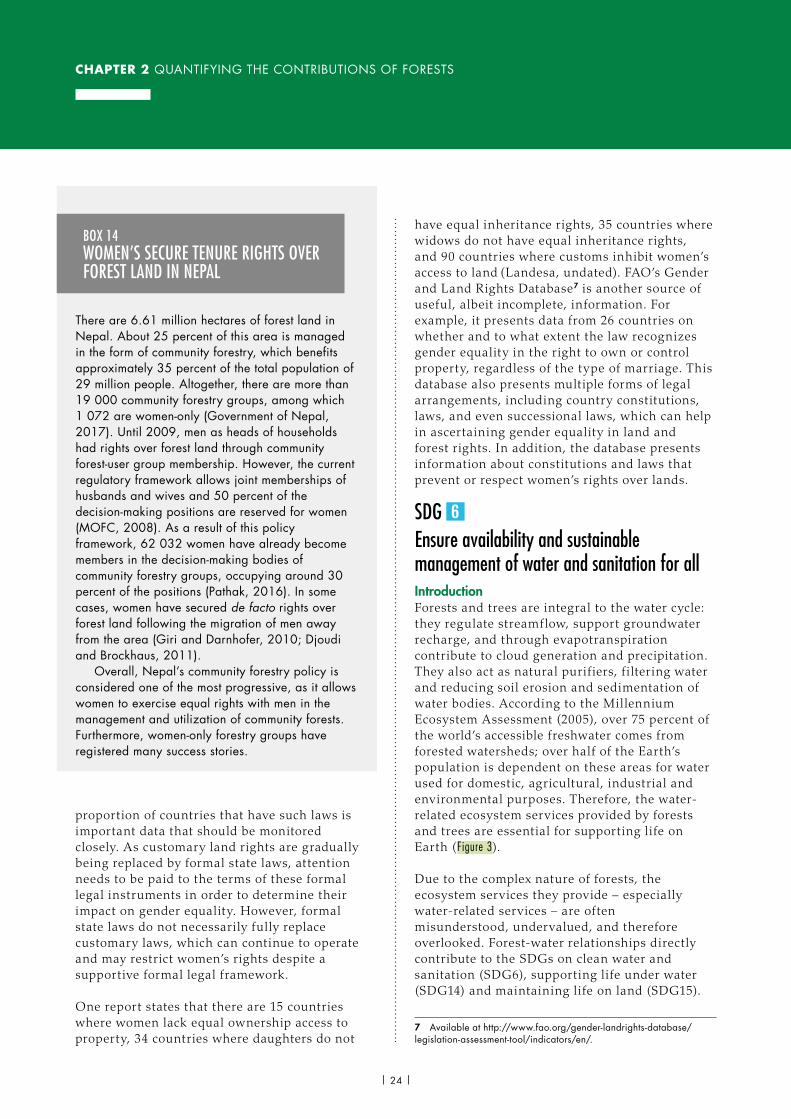
CHAPTER 2 QUANTIFYING THE CONTRIBUTIONS OF FORESTS
proportion of countries that have such laws is important data that should be monitored closely. As customary land rights are gradually being replaced by formal state laws, attention needs to be paid to the terms of these formal legal instruments in order to determine their impact on gender equality. However, formal state laws do not necessarily fully replace customary laws, which can continue to operate and may restrict women’s rights despite a supportive formal legal framework.
One report states that there are 15 countries where women lack equal ownership access to property, 34 countries where daughters do not
have equal inheritance rights, 35 countries where widows do not have equal inheritance rights, and 90 countries where customs inhibit women’s access to land (Landesa, undated). FAO’s Gender and Land Rights Database7 is another source of useful, albeit incomplete, information. For example, it presents data from 26 countries on whether and to what extent the law recognizes gender equality in the right to own or control property, regardless of the type of marriage. This database also presents multiple forms of legal arrangements, including country constitutions, laws, and even successional laws, which can help in ascertaining gender equality in land and forest rights. In addition, the database presents information about constitutions and laws that prevent or respect women’s rights over lands.
SDG Ensure availability and sustainable management of water and sanitation for allIntroductionForests and trees are integral to the water cycle: they regulate streamflow, support groundwater recharge, and through evapotranspiration contribute to cloud generation and precipitation. They also act as natural purif iers, f i ltering water and reducing soil erosion and sedimentation of water bodies. According to the Millennium Ecosystem Assessment (2005), over 75 percent of the world’s accessible freshwater comes from forested watersheds; over half of the Earth’s population is dependent on these areas for water used for domestic, agricultural, industrial and environmental purposes. Therefore, the water-related ecosystem services provided by forests and trees are essential for supporting life on Earth (Figure 3).
Due to the complex nature of forests, the ecosystem services they provide – especially water-related services – are often misunderstood, undervalued, and therefore overlooked. Forest-water relationships directly contribute to the SDGs on clean water and sanitation (SDG6), supporting life under water (SDG14) and maintaining life on land (SDG15).
7 Available at http://www.fao.org/gender-landrights-database/legislation-assessment-tool/indicators/en/.
There are 6.61 million hectares of forest land in Nepal. About 25 percent of this area is managed in the form of community forestry, which benefits approximately 35 percent of the total population of 29 million people. Altogether, there are more than 19 000 community forestry groups, among which 1 072 are women-only (Government of Nepal, 2017). Until 2009, men as heads of households had rights over forest land through community forest-user group membership. However, the current regulatory framework allows joint memberships of husbands and wives and 50 percent of the decision-making positions are reserved for women (MOFC, 2008). As a result of this policy framework, 62 032 women have already become members in the decision-making bodies of community forestry groups, occupying around 30 percent of the positions (Pathak, 2016). In some cases, women have secured de facto rights over forest land following the migration of men away from the area (Giri and Darnhofer, 2010; Djoudi and Brockhaus, 2011).
Overall, Nepal’s community forestry policy is considered one of the most progressive, as it allows women to exercise equal rights with men in the management and utilization of community forests. Furthermore, women-only forestry groups have registered many success stories.
BOX 14WOMEN’S SECURE TENURE RIGHTS OVER FOREST LAND IN NEPAL
| 24 |
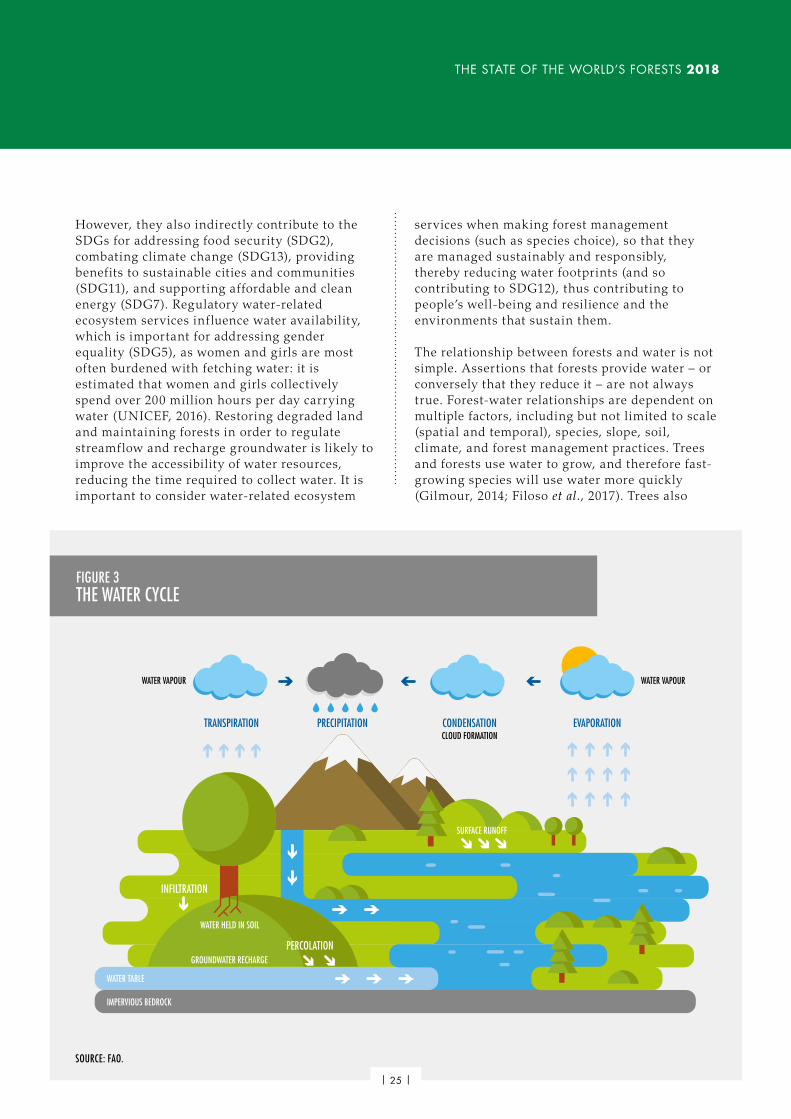
THE STATE OF THE WORLD’S FORESTS 2018
However, they also indirectly contribute to the SDGs for addressing food security (SDG2), combating climate change (SDG13), providing benefits to sustainable cities and communities (SDG11), and supporting affordable and clean energy (SDG7). Regulatory water-related ecosystem services inf luence water availability, which is important for addressing gender equality (SDG5), as women and girls are most often burdened with fetching water: it is estimated that women and girls collectively spend over 200 million hours per day carrying water (UNICEF, 2016). Restoring degraded land and maintaining forests in order to regulate streamflow and recharge groundwater is likely to improve the accessibility of water resources, reducing the time required to collect water. It is important to consider water-related ecosystem
services when making forest management decisions (such as species choice), so that they are managed sustainably and responsibly, thereby reducing water footprints (and so contributing to SDG12), thus contributing to people’s well-being and resilience and the environments that sustain them.
The relationship between forests and water is not simple. Assertions that forests provide water – or conversely that they reduce it – are not always true. Forest-water relationships are dependent on multiple factors, including but not limited to scale (spatial and temporal), species, slope, soil, climate, and forest management practices. Trees and forests use water to grow, and therefore fast-growing species will use water more quickly (Gilmour, 2014; Filoso et al., 2017). Trees also
FIGURE 3THE WATER CYCLE
TRANSPIRATION
INFILTRATION
PRECIPITATION CONDENSATION EVAPORATIONCLOUD FORMATION
SURFACE RUNOFF
WATER VAPOUR WATER VAPOUR
WATER HELD IN SOIL
GROUNDWATER RECHARGE
WATER TABLE
IMPERVIOUS BEDROCK
PERCOLATION
SOURCE: FAO.
| 25 |
CHAPTER 2 QUANTIFYING THE CONTRIBUTIONS OF FORESTS
release water into the atmosphere through evapotranspiration, which can return as precipitation locally, or more likely regionally (Ellison et al., 2012). Forest management can therefore have negative as well as positive impacts on water quantity and quality: species, location, distribution, tree density and other aspects of management all have different effects. It is also important to note that what is true for one context is not necessarily so for others. For example, research from temperate and subtropical regions has sometimes been erroneously applied to arid-tropical regions, inf luencing practices and policies on the assumption that trees in drylands would have a drying effect (Tobella, 2014); however, recent research has found that dryland trees and tree-based ecosystems can improve soil water storage capacity and groundwater recharge (Box 15).
What can be said is that with changes to land use or management there are likely to be associated changes to hydrology, in terms of both water quantity and quality. Understanding the impacts of forest and landscape management on water – including reforestation, afforestation and restoration – as well as how to maximize the benefits or minimize the negative impacts to water supply, is fundamental for achieving SDG6 and indirectly contributes to other SDGs.
Quantifying how forests and trees contribute to SDG6The explicit recognition in the SDGs of the linkages between forests and water for achieving clean water and sanitation (SDG6) and maintaining life on land (SDG15) provides an impetus for improving our policies on and understanding and management of forests and water. However, there are currently no indicators
More than one-third of the world’s population live in drylands, which account for 35 percent of global land area. These populations are dependent on dryland forests and trees outside forests for their food security, livelihoods, and water security. Proper management – including reforestation and restoration – of drylands that also takes into account the effects of tree cover on hydrology can therefore bring great benefits for billions of people.
Native trees that dot the 350 million hectares of dryland terrains in Africa serve as “water harvesters” in the landscape, contributing to improved soil water storage capacity and groundwater recharge. As noted in the case study presented in Chapter 3, Burkina Faso is vulnerable to drought and a recent study in the country’s agroforestry parklands found that soil infiltration under the dominant shea tree (Vitellaria paradoxa) was five times higher than in open areas. In other words, more rainwater infiltrated the soil than ran off as surface water.
As rainfall in the semi-arid tropics is intense but short in duration, it is estimated that without trees overland
flows would occur in at least 71 percent of the area, resulting in soil erosion and degradation.
These dryland tree systems are well adapted to arid conditions and maximize the little precipitation available. In addition, they have expansive root systems that improve groundwater recharge through preferential flow, a process whereby water flows through large pores in the soil created by roots and soil fauna. The trees also reduce water loss from evaporation from the soil, and maintain its health by reducing erosion and adding nutrients through leaf litter and organic matter.
Tree density, canopy cover and the spatial distribution of trees in dryland areas are key variables that affect hydrology. The balance between the positive effects of the trees (higher infiltration and preferential flow) and their negative effects (higher evapotranspiration) needs to be taken into account in their management, using appropriate techniques such as thinning and pruning. In this case, 5–10 percent tree cover was found to improve water availability.
SOURCE: Tobella, 2014; Ilstedt et al., 2016.
BOX 15WATER IN THE DRYLANDS – THE ROLE OF FORESTS FOR WATER SECURITY
| 26 |
THE STATE OF THE WORLD’S FORESTS 2018
that monitor the relationship between forests or landscape management and water.
SDG Indicator 6.6.1, which measures “Change in the extent of water-related ecosystems over time” considers the spatial extent of vegetated wetlands and so includes two types of forests – swamp forests and mangroves – as they are both inundated with water either permanently or seasonally. The limited scope of ecosystems in 6.6.1 is partly due to the expectation that “other” water-related ecosystems will be covered by other SDGs and indicators (UN-Water, 2017).
To assess the contribution of forests to achieving this target, it is necessary to consider how forests provide water-related ecosystem services. At a minimum, other forest types should be considered, including cloud, riparian, peat and dryland forests, which are known to be of particular importance for these services.
SDG TARGET 6.6 è By 2020, protect and restore water-related ecosystems, including mountains, forests, wetlands, rivers, aquifers and lakes
Change in proportion of tree cover within major global watersheds over timeThis thematic metric was proposed as forests and water resources are not confined to political borders, and thus it is important to consider natural boundaries – namely watersheds and their status.
FAO divides the world into 230 major watersheds or hydrosheds (FAO, 2011b), which were on average 28.8 percent tree-covered in 2015, according to the World Resources Institute’s (WRI) Global Forest Watch – Water data (WRI, 2017a). Historically,8 it is estimated that these watersheds averaged 67.8 percent tree cover, but by 2000 they averaged only 30.7 percent. Approximately 38 percent of watersheds experienced more than half of their tree cover loss prior to 2000, and over 40 percent of them by 2014. Of the watersheds that had more than
8 Historical tree cover refers to an estimation of tree cover for the decades prior to 2000 and is calculated by WRI’s Global Forest Watch (2017a), based on potential forest coverage, tree cover and climate zones (Qin et al., 2016).
50 percent tree cover loss by 2015, 88 percent have a medium to very high risk of erosion, 68 percent have medium to very high risk of forest f ire, and 48 percent have a medium to very high risk of baseline water stress (BWS).9 Figure 4 i l lustrates changes in erosion and BWS associated with tree cover loss.
As tree cover and forest conditions deteriorate, so does water quality due to increased soil erosion and degradation. In addition, the risk of impacts associated with natural hazards such as f loods, forest f ires, landslides and storm surges, increases (Qin et al., 2016). In some cases, loss of tree cover also impacts water availability, especially when natural forest is converted to other land use that degrades and/or compacts soils, thus reducing soil infiltration, water storage capacity and groundwater recharge (Bruijnzeel, 2014; Ellison et al., 2017).
Over one-third of the world’s largest cities – including New York, Vienna, Bogotà, Tokyo and Johannesburg, with their 366 million inhabitants (UN, 2016) and increasing populations – obtain a large share of their drinking water from protected forests (Dudley and Stolton, 2003). One study estimated that the water conservation value of Beijing’s forests is approximately USD 632 million (Biao et al., 2010). The number of urban people relying on water from forest catchments significantly increases if account is also taken of urban areas that depend on forests that are not officially protected or recognized as providing water. As noted in the section on SDG11, which discusses other benefits of forests and trees for cities, urban populations are expected to make up 60 percent of the world’s population by 2050 (UNDESA, 2014). As urban centres grow, it is therefore important to take into consideration the pressure that will be placed on surrounding environments, especially forested watersheds, and to recognize forests as natural infrastructure that supports urban water supply, energy and disaster risk management objectives (Box 16).
9 Baseline water stress is the ratio of total water withdrawals relative to the annual available renewable surface water supplies. It should be noted that data were not universally available (WRI, 2017a).
| 27 |
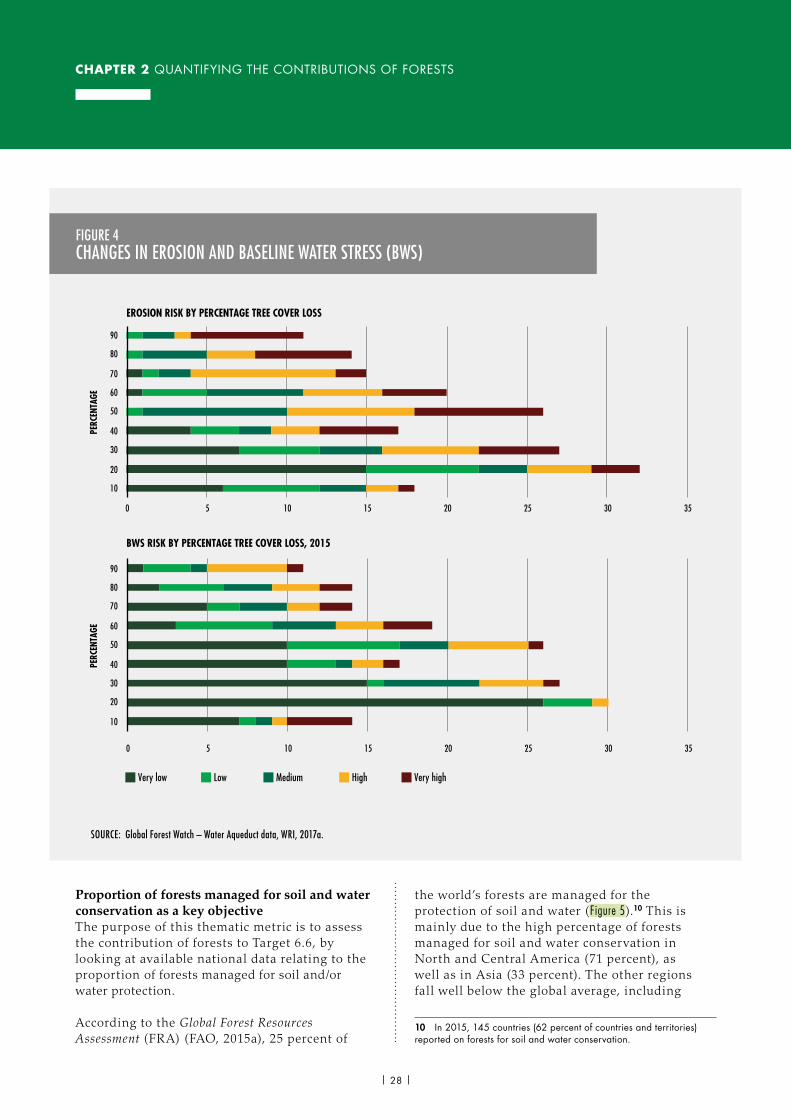
CHAPTER 2 QUANTIFYING THE CONTRIBUTIONS OF FORESTS
Proportion of forests managed for soil and water conservation as a key objectiveThe purpose of this thematic metric is to assess the contribution of forests to Target 6.6, by looking at available national data relating to the proportion of forests managed for soil and/or water protection.
According to the Global Forest Resources Assessment (FRA) (FAO, 2015a), 25 percent of
the world’s forests are managed for the protection of soil and water (Figure 5).10 This is mainly due to the high percentage of forests managed for soil and water conservation in North and Central America (71 percent), as well as in Asia (33 percent). The other regions fall well below the global average, including
10 In 2015, 145 countries (62 percent of countries and territories) reported on forests for soil and water conservation.
FIGURE 4CHANGES IN EROSION AND BASELINE WATER STRESS (BWS)
MediumLow Very highHighVery low
10
20
30
40
50
60
70
80
90
EROSION RISK BY PERCENTAGE TREE COVER LOSS
10
20
30
40
50
60
70
80
90
BWS RISK BY PERCENTAGE TREE COVER LOSS, 2015
PERC
ENTA
GEPE
RCEN
TAGE
0 5 10 15 20 25 30 35
0 5 10 15 20 25 30 35
SOURCE: Global Forest Watch – Water Aqueduct data, WRI, 2017a.
| 28 |
THE STATE OF THE WORLD’S FORESTS 2018
Europe where the majority of forests are privately owned and management priorities are not necessarily known or reported. The high percentage in North America can be attributed to the two largest forested nations in the region, namely Canada (91 percent) and the United States of America (68 percent). The United States Forestry Service (USFS) reports that it manages the largest single source of water in the country, and that over 180 million people in the United States of America rely on forests for their drinking water (USFS, 2017).
Forests managed for soil and water conservation have increased globally in the last 25 years, with most regions reporting a positive trend in protecting them, with the exception of Africa and South America. This correlates with data by forest type (Figure 6), where boreal and temperate forests show a steady upward trend whereas subtropical – and in particular tropical – forests have decreased.
All forests and trees outside forests inf luence hydrology, but the loss of tropical and subtropical forests may be disproportionately significant.
Lima is the second largest desert city in the world. With 10 million inhabitants, it is situated in the Pacific Basin, which hosts over two-thirds of Peru’s population. It is estimated that this watershed has lost approximately 75 percent of its historical (pre-2000) tree cover (WRI, 2017a), which has been attributed to lower system resilience to the region’s natural dry and wet seasons. This has resulted in increased incidences of droughts, flooding and landslides (Barrett, 2017).
In 2015, the water demands of Lima’s population exceeded its renewable supplies during the dry season. Fortunately, however, action was already underway to address the problem and in 2014 the Peruvian Government adopted a Mechanism for Ecosystem Service Compensation1 to guide and oversee the process of introducing green infrastructure. This was based on research showing that integrating existing grey infrastructure2 with green infrastructure would have the potential to reduce the dry season deficit by 90 percent, and at a lower cost than that of constructing additional grey infrastructure (Gammie and De Bievre, 2015). Local and national water authorities have partnered with organizations such as Forest Trends, the Consortium for Sustainable
Development of the Andean Ecoregion (CONDESAN), EcoDecisión, The Nature Conservancy, the United States Agency for International Development (USAID) and the Swiss Agency for Development and Cooperation to implement green infrastructure solutions such as reforestation, wetland restoration, reintroduction of pre-Incan infiltration canals (Amunas), and improved pastoralism. In addition, the city’s water utility authority, Servicio de Agua Potable y Alcantarillado de Lima (SEDEPAL), is developing a novel Green Infrastructure Master Plan3 to guide the implementation of Peru’s natural infrastructure policies; it has also earmarked approximately five percent of its water tariff, an estimated USD 110 million between 2015 and 2020, for addressing water management. Of this, 3.8 percent will be invested in climate change adaptation and disaster risk reduction, and 1 percent in green infrastructure projects to close the gap between the city’s water demand and supply. By 2017, over USD 5 million was made available for green infrastructure through this tariff scheme, a number that is projected to reach USD 30 million by 2020. As a result, various joint green infrastructure pilot projects have been funded, including reforestation initiatives (SEDEPAL, 2016).
BOX 16PAVING THE WAY FOR ‘GREEN’ INFRASTRUCTURE IN LIMA, PERU
1 Law N° 30215, Ley de Mecanismos de Retribución por Servicios Ecosistémicos. Available at http://www.sunass.gob.pe/MRSE/ley30215.pdf.2 Grey infrastructure are engineered solutions for water management, such as pipes, ditches, levees and man-made dams.3 Plan Maestro Infraestructura Verde SEDAPAL. Available at http://www.sunass.gob.pe/Evento7_8feb2017/17feb_fmomiy.pdf.
| 29 |
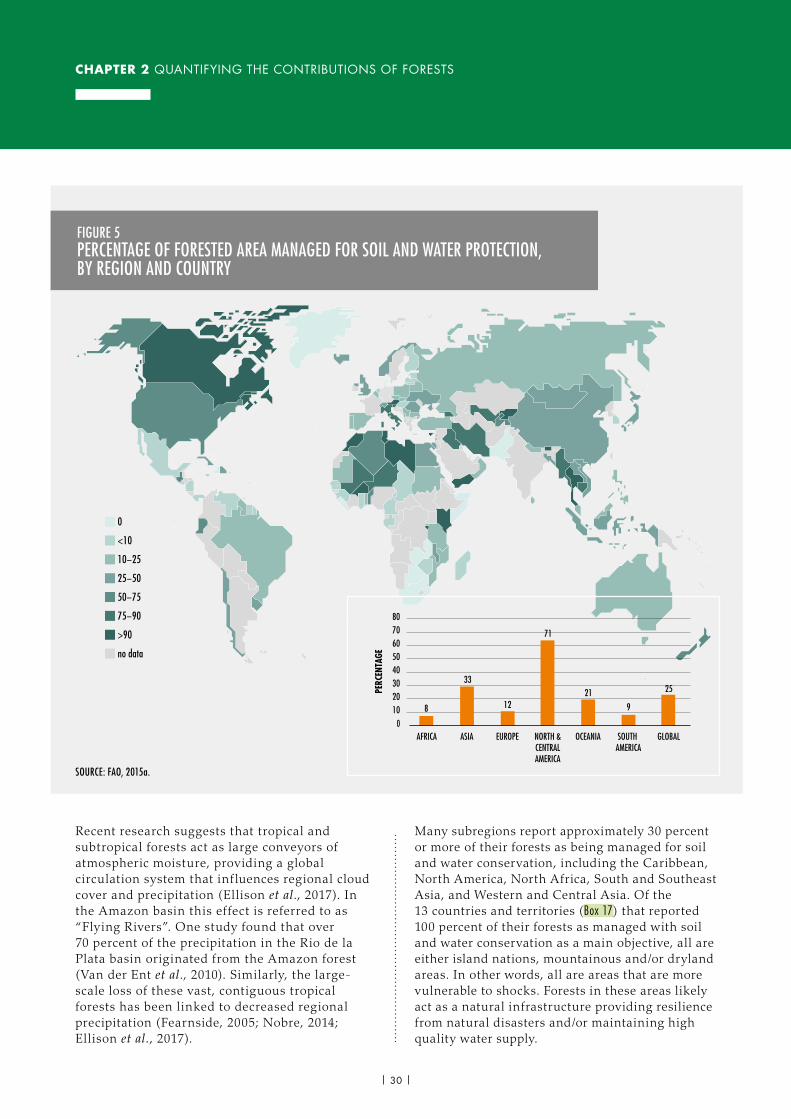
CHAPTER 2 QUANTIFYING THE CONTRIBUTIONS OF FORESTS
Recent research suggests that tropical and subtropical forests act as large conveyors of atmospheric moisture, providing a global circulation system that inf luences regional cloud cover and precipitation (Ellison et al., 2017). In the Amazon basin this effect is referred to as “Flying Rivers”. One study found that over 70 percent of the precipitation in the Rio de la Plata basin originated from the Amazon forest (Van der Ent et al., 2010). Similarly, the large-scale loss of these vast, contiguous tropical forests has been linked to decreased regional precipitation (Fearnside, 2005; Nobre, 2014; Ellison et al., 2017).
Many subregions report approximately 30 percent or more of their forests as being managed for soil and water conservation, including the Caribbean, North America, North Africa, South and Southeast Asia, and Western and Central Asia. Of the 13 countries and territories (Box 17) that reported 100 percent of their forests as managed with soil and water conservation as a main objective, all are either island nations, mountainous and/or dryland areas. In other words, all are areas that are more vulnerable to shocks. Forests in these areas likely act as a natural infrastructure providing resilience from natural disasters and/or maintaining high quality water supply.
FIGURE 5PERCENTAGE OF FORESTED AREA MANAGED FOR SOIL AND WATER PROTECTION, BY REGION AND COUNTRY
0
<10
10−25
25−50
50−75
75−90
>90
no data
8
AFRICA
33
ASIA
12
EUROPE
71
NORTH &CENTRALAMERICA
21
OCEANIA
9
SOUTH AMERICA
25
GLOBAL
PERC
ENTA
GE
01020304050607080
SOURCE: FAO, 2015a.
| 30 |
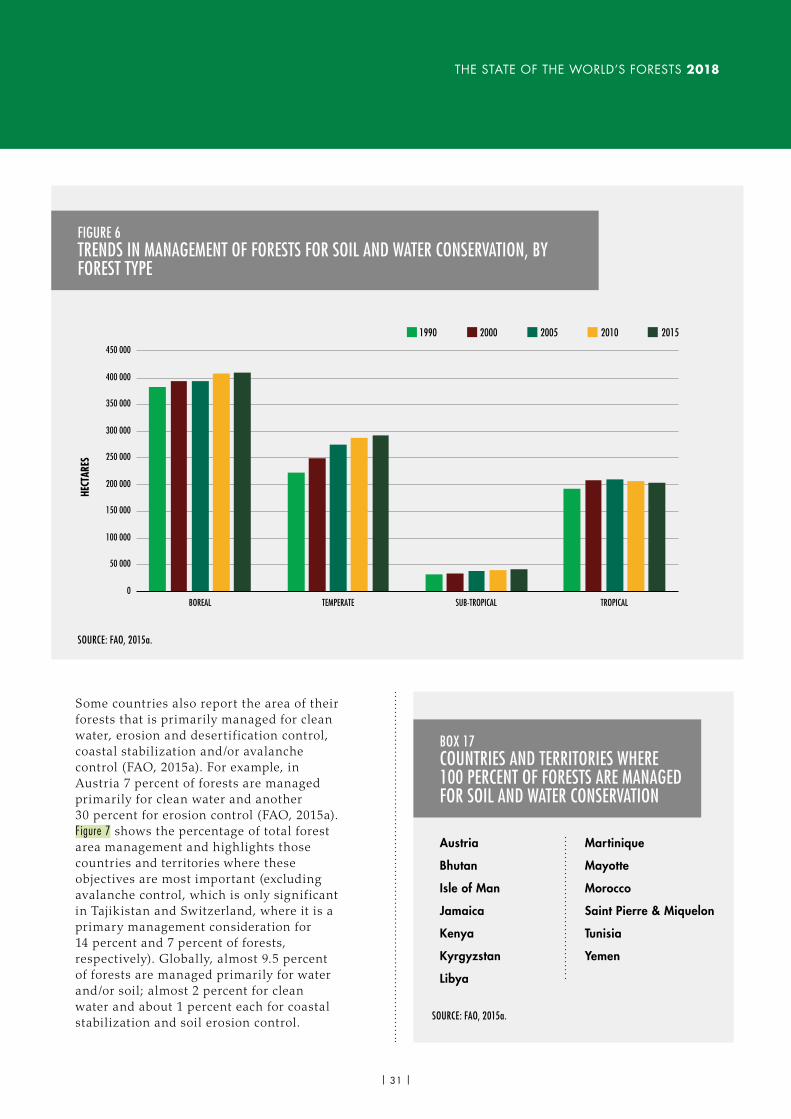
THE STATE OF THE WORLD’S FORESTS 2018
Some countries also report the area of their forests that is primarily managed for clean water, erosion and desertif ication control, coastal stabilization and/or avalanche control (FAO, 2015a). For example, in Austria 7 percent of forests are managed primarily for clean water and another 30 percent for erosion control (FAO, 2015a). Figure 7 shows the percentage of total forest area management and highlights those countries and territories where these objectives are most important (excluding avalanche control, which is only significant in Tajikistan and Switzerland, where it is a primary management consideration for 14 percent and 7 percent of forests, respectively). Globally, almost 9.5 percent of forests are managed primarily for water and/or soil; almost 2 percent for clean water and about 1 percent each for coastal stabilization and soil erosion control.
FIGURE 6TRENDS IN MANAGEMENT OF FORESTS FOR SOIL AND WATER CONSERVATION, BY FOREST TYPE
SOURCE: FAO, 2015a.
HECT
ARES
0
50 000
100 000
150 000
200 000
250 000
300 000
350 000
400 000
450 000
BOREAL TEMPERATE SUB-TROPICAL TROPICAL
1990 2000 2005 2010 2015
Austria
Bhutan
Isle of Man
Jamaica
Kenya
Kyrgyzstan
Libya
Martinique
Mayotte
Morocco
Saint Pierre & Miquelon
Tunisia
Yemen
BOX 17COUNTRIES AND TERRITORIES WHERE 100 PERCENT OF FORESTS ARE MANAGED FOR SOIL AND WATER CONSERVATION
SOURCE: FAO, 2015a.
| 31 |
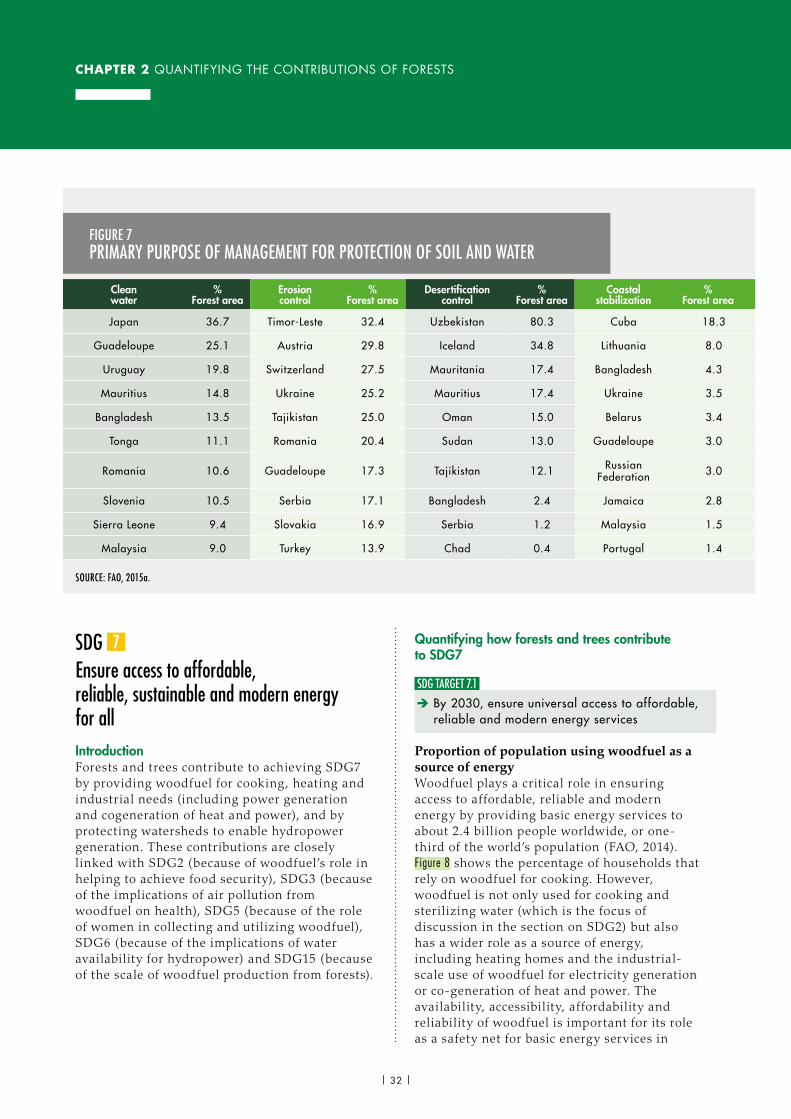
CHAPTER 2 QUANTIFYING THE CONTRIBUTIONS OF FORESTS
SDG Ensure access to affordable, reliable, sustainable and modern energy for allIntroductionForests and trees contribute to achieving SDG7 by providing woodfuel for cooking, heating and industrial needs (including power generation and cogeneration of heat and power), and by protecting watersheds to enable hydropower generation. These contributions are closely linked with SDG2 (because of woodfuel’s role in helping to achieve food security), SDG3 (because of the implications of air pollution from woodfuel on health), SDG5 (because of the role of women in collecting and utilizing woodfuel), SDG6 (because of the implications of water availability for hydropower) and SDG15 (because of the scale of woodfuel production from forests).
Quantifying how forests and trees contribute to SDG7
SDG TARGET 7.1 è By 2030, ensure universal access to affordable, reliable and modern energy services
Proportion of population using woodfuel as a source of energyWoodfuel plays a critical role in ensuring access to affordable, reliable and modern energy by providing basic energy services to about 2.4 billion people worldwide, or one-third of the world’s population (FAO, 2014). Figure 8 shows the percentage of households that rely on woodfuel for cooking. However, woodfuel is not only used for cooking and sterilizing water (which is the focus of discussion in the section on SDG2) but also has a wider role as a source of energy, including heating homes and the industrial-scale use of woodfuel for electricity generation or co-generation of heat and power. The availability, accessibility, affordability and reliability of woodfuel is important for its role as a safety net for basic energy services in
FIGURE 7PRIMARY PURPOSE OF MANAGEMENT FOR PROTECTION OF SOIL AND WATER
Clean water
% Forest area
Erosion control
% Forest area
Desertification control
% Forest area
Coastal stabilization
% Forest area
Japan 36.7 Timor-Leste 32.4 Uzbekistan 80.3 Cuba 18.3
Guadeloupe 25.1 Austria 29.8 Iceland 34.8 Lithuania 8.0
Uruguay 19.8 Switzerland 27.5 Mauritania 17.4 Bangladesh 4.3
Mauritius 14.8 Ukraine 25.2 Mauritius 17.4 Ukraine 3.5
Bangladesh 13.5 Tajikistan 25.0 Oman 15.0 Belarus 3.4
Tonga 11.1 Romania 20.4 Sudan 13.0 Guadeloupe 3.0
Romania 10.6 Guadeloupe 17.3 Tajikistan 12.1 Russian Federation 3.0
Slovenia 10.5 Serbia 17.1 Bangladesh 2.4 Jamaica 2.8
Sierra Leone 9.4 Slovakia 16.9 Serbia 1.2 Malaysia 1.5
Malaysia 9.0 Turkey 13.9 Chad 0.4 Portugal 1.4
SOURCE: FAO, 2015a.
| 32 |
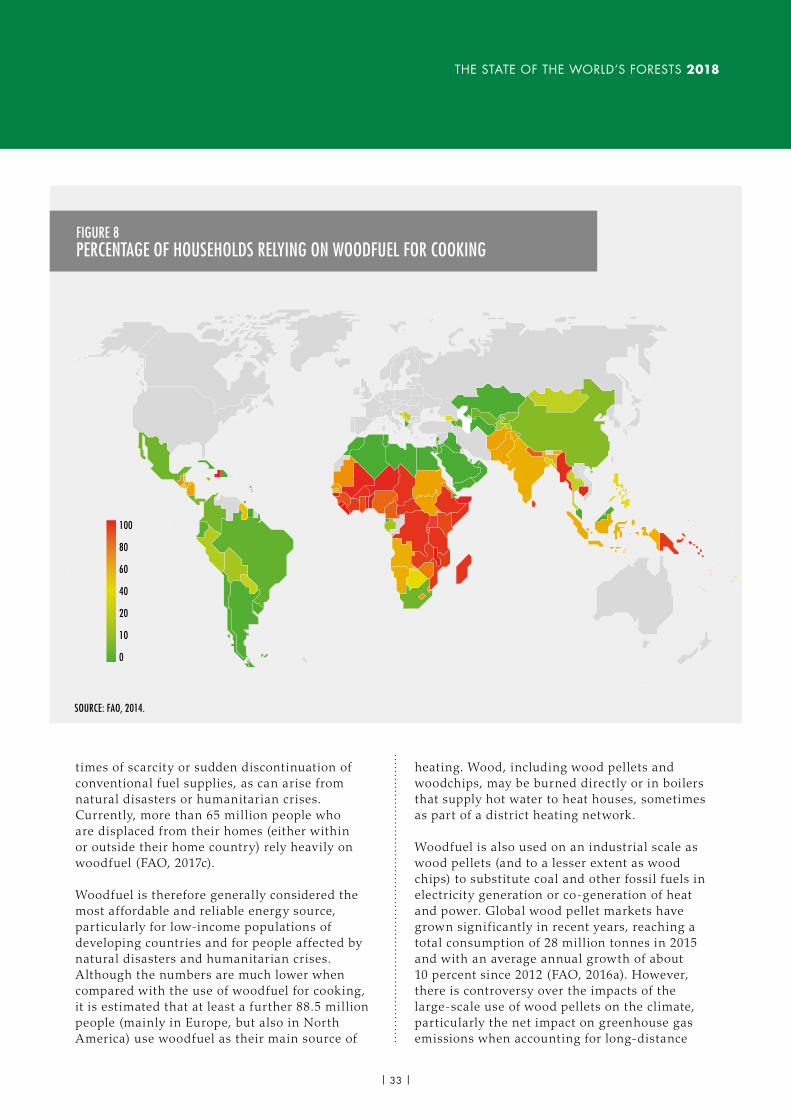
THE STATE OF THE WORLD’S FORESTS 2018
times of scarcity or sudden discontinuation of conventional fuel supplies, as can arise from natural disasters or humanitarian crises. Currently, more than 65 million people who are displaced from their homes (either within or outside their home country) rely heavily on woodfuel (FAO, 2017c).
Woodfuel is therefore generally considered the most affordable and reliable energy source, particularly for low-income populations of developing countries and for people affected by natural disasters and humanitarian crises. Although the numbers are much lower when compared with the use of woodfuel for cooking, it is estimated that at least a further 88.5 million people (mainly in Europe, but also in North America) use woodfuel as their main source of
heating. Wood, including wood pellets and woodchips, may be burned directly or in boilers that supply hot water to heat houses, sometimes as part of a district heating network.
Woodfuel is also used on an industrial scale as wood pellets (and to a lesser extent as wood chips) to substitute coal and other fossil fuels in electricity generation or co-generation of heat and power. Global wood pellet markets have grown significantly in recent years, reaching a total consumption of 28 million tonnes in 2015 and with an average annual growth of about 10 percent since 2012 (FAO, 2016a). However, there is controversy over the impacts of the large-scale use of wood pellets on the climate, particularly the net impact on greenhouse gas emissions when accounting for long-distance
FIGURE 8PERCENTAGE OF HOUSEHOLDS RELYING ON WOODFUEL FOR COOKING
100
80
60
40
20
10
0
SOURCE: FAO, 2014.
| 33 |
CHAPTER 2 QUANTIFYING THE CONTRIBUTIONS OF FORESTS
fuel transportation (Brack, 2017; IEA Bioenergy, 2017). Research is currently ongoing on the potential use of wood-derived liquid fuels, such as biodiesel or ethanol, for transportation.
A serious problem arising from the widespread use of woodfuel for cooking is indoor air pollution from rudimentary stoves that have low efficiency and high levels of smoke emission. This is considered a major health risk. The World Health Organization (WHO) attributes the premature deaths of over 4 million people a year to exposure to household air pollution from burning solid fuels (WHO, 2016), and reducing exposure to these risks should be a priority to ensure universal access to modern energy services. This can be achieved by promoting the use of advanced cooking stoves that burn biomass more cleanly and efficiently. Although gas and electricity are often considered more “modern” sources of energy, wood can provide clean energy if it is burned in appropriate appliances. However, in rural areas of many developing countries, where biomass is freely available and distribution channels for alternative fuels or appropriate smoke-free stoves are not in place, only an estimated one-fifth of the population have access to clean cooking facilities (IEA and World Bank, 2017).
These concerns over the health and environmental impacts of traditional stoves have led to some major efforts and initiatives at national, regional and global levels. These include the Global Alliance for Clean Cookstoves (GACC), a public-private partnership hosted by the United Nations Foundation, which estimated that 13 million clean, eff icient stoves11 were distributed in 2015 (GACC, 2016). In view of the 2.4 billion people (or roughly 500 million households) who use woodfuel, dissemination of clean stoves needs to be significantly increased to ensure universal access to safe cooking practices.
11 The definitions of clean and efficient are aligned with the interim performance guidelines in the ISO International Workshop Agreement. Stoves (and fuel combinations) that meet Tier 2 for efficiency (≥25%) are considered efficient and those that meet Tier 3 for indoor emissions (≤ 9g CO and ≤ 168 mg PM2.5 per MJ delivered to the pot) are considered clean. Cleanness and efficiency are affected by the combined performance of fuel and stove. Woodfuel can be burned cleanly and efficiently if matched with well-designed, fuel-saving stoves or combustion appliances.
One widespread practice for improving the fuel properties of wood is to convert it into charcoal (which has a greater energy content by weight than fuelwood) so that it burns more slowly and releases less smoke during combustion. The global production of wood charcoal was estimated at 52 million tonnes in 2015, corresponding to about 17 percent of woodfuel extracted from forests. Most charcoal is produced in Africa (62 percent), followed by the Americas (19.6 percent) and Asia (17 percent). Global charcoal consumption is rising as a result of population growth, urbanization in developing countries (with associated changes in housing and habits) and the difference in its relative affordability compared with alternative energy sources. Consumption has increased by roughly 20 percent in the past ten years and almost doubled in the last 20 years (FAO, 2017d). International demand and cross-continental trade of charcoal are also having an increasing inf luence on global charcoal production and its geographical distribution. For example, according to estimates by the Chatham House Resource Trade Database, global charcoal trade in 2015 amounted to 2.6 million tonnes and the top charcoal-exporting countries were Indonesia, Nigeria, Myanmar, Namibia, and Poland (Chatham House, 2017).
Where the demand for charcoal is high, mainly in sub-Saharan Africa, Southeast Asia and South America, charcoal production puts pressure on forest resources and contributes to degradation and deforestation, especially when forest access is unregulated. Furthermore, most charcoal production in developing countries uses simple technologies with a conversion efficiency of only 10–22 percent, compared to over 30 percent using more advanced technologies (FAO, 2017e).
Thus, woodfuel makes an important contribution to energy provision and is critical for many of the world’s poor and people in vulnerable situations. However, there is a need to take steps so that it does not compromise delivery of other SDGs, including for example SDG3 (through the impact of smoke on human health) or SDG15 (through the impact of increasing woodfuel demand on forest resources).
| 34 |
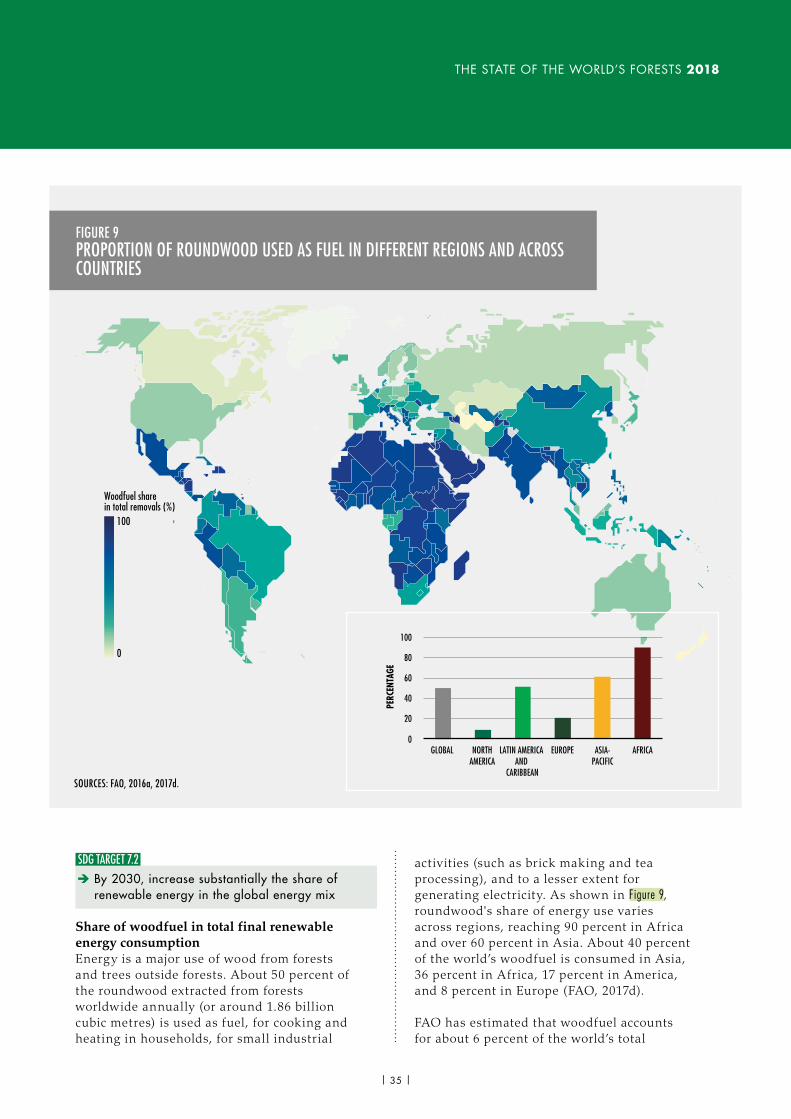
THE STATE OF THE WORLD’S FORESTS 2018
SDG TARGET 7.2 è By 2030, increase substantially the share of renewable energy in the global energy mix
Share of woodfuel in total final renewable energy consumptionEnergy is a major use of wood from forests and trees outside forests. About 50 percent of the roundwood extracted from forests worldwide annually (or around 1.86 billion cubic metres) is used as fuel, for cooking and heating in households, for small industrial
activ ities (such as brick making and tea processing), and to a lesser extent for generating electricity. As shown in Figure 9, roundwood's share of energy use varies across regions, reaching 90 percent in Africa and over 60 percent in Asia. About 40 percent of the world’s woodfuel is consumed in Asia, 36 percent in Africa, 17 percent in America, and 8 percent in Europe (FAO, 2017d).
FAO has estimated that woodfuel accounts for about 6 percent of the world’s total
FIGURE 9PROPORTION OF ROUNDWOOD USED AS FUEL IN DIFFERENT REGIONS AND ACROSS COUNTRIES
100
0
Woodfuel share in total removals (%)
0
20
40
60
100
GLOBAL NORTHAMERICA
LATIN AMERICA AND
CARIBBEAN
EUROPE ASIA-PACIFIC
AFRICA
PERC
ENTA
GE
80
SOURCES: FAO, 2016a, 2017d.
| 35 |
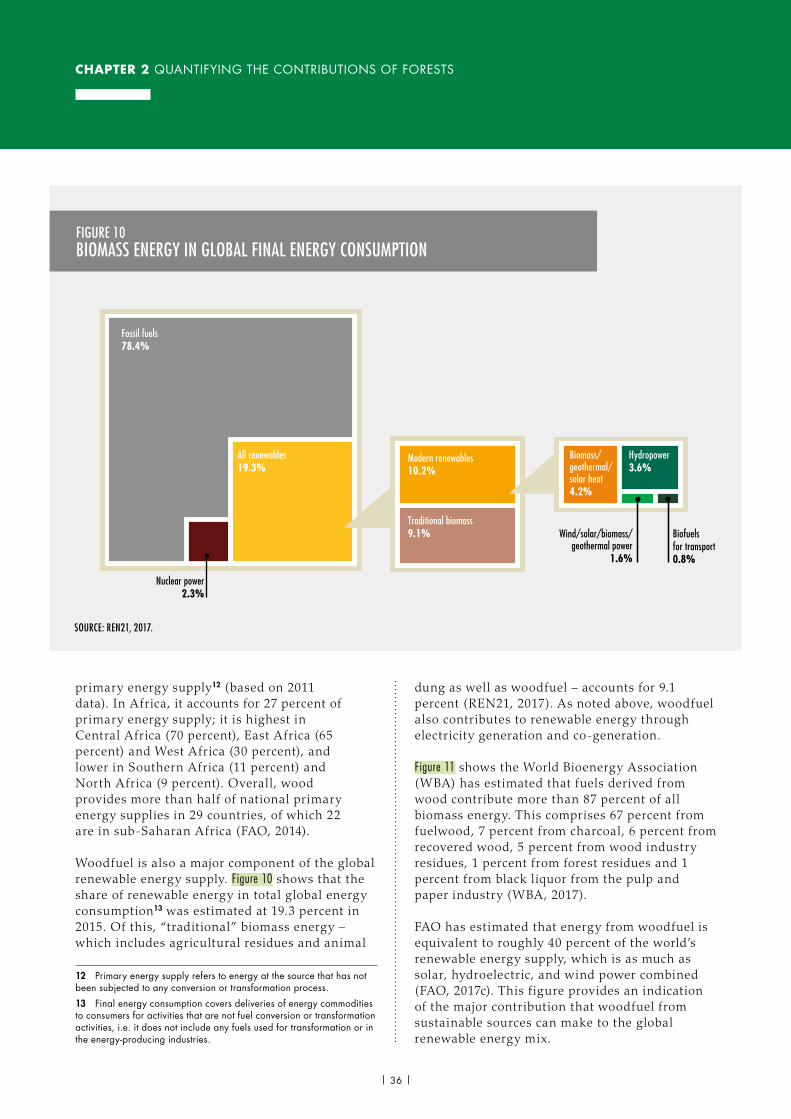
CHAPTER 2 QUANTIFYING THE CONTRIBUTIONS OF FORESTS
primary energy supply12 (based on 2011 data). In Africa, it accounts for 27 percent of primary energy supply; it is highest in Central Africa (70 percent), East Africa (65 percent) and West Africa (30 percent), and lower in Southern Africa (11 percent) and North Africa (9 percent). Overall, wood provides more than half of national primary energy supplies in 29 countries, of which 22 are in sub-Saharan Africa (FAO, 2014).
Woodfuel is also a major component of the global renewable energy supply. Figure 10 shows that the share of renewable energy in total global energy consumption13 was estimated at 19.3 percent in 2015. Of this, “traditional” biomass energy – which includes agricultural residues and animal
12 Primary energy supply refers to energy at the source that has not been subjected to any conversion or transformation process.
13 Final energy consumption covers deliveries of energy commodities to consumers for activities that are not fuel conversion or transformation activities, i.e. it does not include any fuels used for transformation or in the energy-producing industries.
dung as well as woodfuel – accounts for 9.1 percent (REN21, 2017). As noted above, woodfuel also contributes to renewable energy through electricity generation and co-generation.
Figure 11 shows the World Bioenergy Association (WBA) has estimated that fuels derived from wood contribute more than 87 percent of all biomass energy. This comprises 67 percent from fuelwood, 7 percent from charcoal, 6 percent from recovered wood, 5 percent from wood industry residues, 1 percent from forest residues and 1 percent from black liquor from the pulp and paper industry (WBA, 2017).
FAO has estimated that energy from woodfuel is equivalent to roughly 40 percent of the world’s renewable energy supply, which is as much as solar, hydroelectric, and wind power combined (FAO, 2017c). This f igure provides an indication of the major contribution that woodfuel from sustainable sources can make to the global renewable energy mix.
FIGURE 10BIOMASS ENERGY IN GLOBAL FINAL ENERGY CONSUMPTION
Fossil fuels78.4%
All renewables19.3%
Nuclear power2.3%
Modern renewables10.2%
Traditional biomass9.1%
Biomass/geothermal/solar heat4.2%
Hydropower3.6%
Wind/solar/biomass/geothermal power
1.6%
Biofuels for transport0.8%
SOURCE: REN21, 2017.
| 36 |
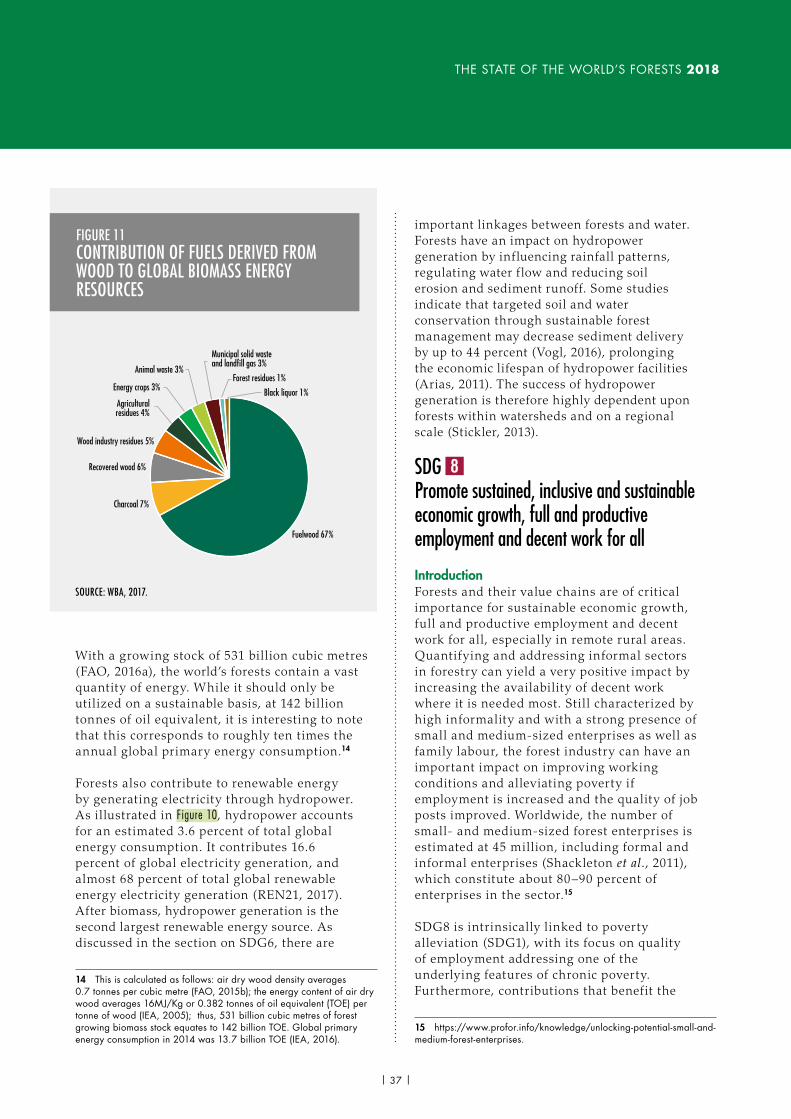
THE STATE OF THE WORLD’S FORESTS 2018
With a growing stock of 531 billion cubic metres (FAO, 2016a), the world’s forests contain a vast quantity of energy. While it should only be utilized on a sustainable basis, at 142 billion tonnes of oil equivalent, it is interesting to note that this corresponds to roughly ten times the annual global primary energy consumption.14
Forests also contribute to renewable energy by generating electricity through hydropower. As illustrated in Figure 10, hydropower accounts for an estimated 3.6 percent of total global energy consumption. It contributes 16.6 percent of global electricity generation, and almost 68 percent of total global renewable energy electricity generation (REN21, 2017). After biomass, hydropower generation is the second largest renewable energy source. As discussed in the section on SDG6, there are
14 This is calculated as follows: air dry wood density averages 0.7 tonnes per cubic metre (FAO, 2015b); the energy content of air dry wood averages 16MJ/Kg or 0.382 tonnes of oil equivalent (TOE) per tonne of wood (IEA, 2005); thus, 531 billion cubic metres of forest growing biomass stock equates to 142 billion TOE. Global primary energy consumption in 2014 was 13.7 billion TOE (IEA, 2016).
important linkages between forests and water. Forests have an impact on hydropower generation by influencing rainfall patterns, regulating water f low and reducing soil erosion and sediment runoff. Some studies indicate that targeted soil and water conservation through sustainable forest management may decrease sediment delivery by up to 44 percent (Vogl, 2016), prolonging the economic lifespan of hydropower facilities (Arias, 2011). The success of hydropower generation is therefore highly dependent upon forests within watersheds and on a regional scale (Stickler, 2013).
SDG Promote sustained, inclusive and sustainable economic growth, full and productive employment and decent work for all
IntroductionForests and their value chains are of critical importance for sustainable economic growth, full and productive employment and decent work for all, especially in remote rural areas. Quantifying and addressing informal sectors in forestry can yield a very positive impact by increasing the availability of decent work where it is needed most. Still characterized by high informality and with a strong presence of small and medium-sized enterprises as well as family labour, the forest industry can have an important impact on improving working conditions and alleviating poverty if employment is increased and the quality of job posts improved. Worldwide, the number of small- and medium-sized forest enterprises is estimated at 45 million, including formal and informal enterprises (Shackleton et al., 2011), which constitute about 80–90 percent of enterprises in the sector.15
SDG8 is intrinsically linked to poverty alleviation (SDG1), with its focus on quality of employment addressing one of the underlying features of chronic poverty. Furthermore, contributions that benefit the
15 https://www.profor.info/knowledge/unlocking-potential-small-and-medium-forest-enterprises.
FIGURE 11CONTRIBUTION OF FUELS DERIVED FROM WOOD TO GLOBAL BIOMASS ENERGY RESOURCES
Fuelwood 67%
Charcoal 7%
Recovered wood 6%
Wood industry residues 5%
Agriculturalresidues 4%
Energy crops 3% Black liquor 1%
Forest residues 1%
Municipal solid wasteand landfill gas 3%
Animal waste 3%
SOURCE: WBA, 2017.
| 37 |
CHAPTER 2 QUANTIFYING THE CONTRIBUTIONS OF FORESTS
l ivelihoods of forest-dependent communities reduce pressure on the natural environment and so help progress towards SDG15 (Life on Land).
Targets 8.3 and 8.9 were chosen to demonstrate the potential for the forest sector to help achieve SDG8. Through Indicator 8.3.1 (“proportion of informal employment in non-agriculture employment, by sex”), Target 8.3 refers to one of the key issues to be addressed in the forest industry. Target 8.9 is important, as sustainable forest-based tourism offers opportunities for improved livelihoods and the sustainable management of forests.
Quantifying how forests contribute to SDG8
SDG TARGET 8.3 è Promote development-oriented policies that support productive activities, decent job creation, entrepreneurship, creativity and innovation, and encourage the formalization and growth of micro-, small- and medium-sized enterprises, including through access to financial services
Proportion of formal and informal employment in the forestry sectorIt is essential to include the informal economy and associated employment into measurements of SDG8, as more than half of the workforce in developing countries is employed informally. Informal employment is in many ways linked to dependency on natural resources (Benson et al., 2014) and therefore to the state of the environment. The proportion of the population earning income informally varies by region: for example, informal non-agricultural employment represents 66 percent of total employment in sub-Saharan Africa and 52 percent in North Africa.16 There is limited availability of global forestry data, and although ILO statistics record the share of informal employment for 62 countries by sex, there are no global records as such. Estimates suggest that women are more frequently represented in the informal sector than men, although men’s contributions to gross value added (GVA) are higher, in line with their typically higher earnings (Agrawal et al., 2013). One approach to estimate
16 See ILO news at http://www.ilo.org/addisababa/whats-new/WCMS_377286/lang--en/index.htm (accessed 15 December 2017).
informal forest employment is to use production statistics that relate to “own account” workers. In low-income countries, comparisons of data suggest there is a positive relationship between the prevalence of own-account employment and the prevalence of activity in the informal sector. In Indonesia for example, 43 percent of the workforce are own-account workers and informal employment represents 73 percent of total employment. Applying estimation factors derived from these relationships to 44 countries suggests that the number of people working in the informal sector is at least 1.63 times the number in the formal sector. However, this is likely to be an underestimate as it only takes account of the forestry and logging subsectors and excludes charcoal.
BOX 18CONTRIBUTION OF INFORMAL CHAINSAW MILLING TO TIMBER PRODUCTION IN CAMEROON
In Cameroon, small-scale timber felled by chainsaw is mostly sold on the domestic market, but is also exported regionally (Wit and van Dam, 2010). The number of informal jobs in chainsaw milling for timber production in Cameroon was estimated at 45 000 in 2008 (Wit and van Dam, 2010; Cerutti, 2016; CIFOR infobrief, 2017). For each chainsaw miller in the formal sector, it is thought that there are more than three in the informal sector (although this estimate makes use of data that is not directly comparable).
According to FAO statistics, there was a total of 23 000 people employed in all activities in the formal forest sector in Cameroon in 2008, of whom 13 000 were employed in forestry and logging, 8 000 in wood processing and 2 000 in the pulp and paper industry (FAO, 2014).
Overall, the formal forestry sector’s share of total employment is 0.3 percent, but when the informal jobs of chainsaw millers are also taken into account this triples to 0.9 percent (Wit and van Dam, 2010). The contribution of forests to employment is yet higher if NWFPs are also considered.
| 38 |
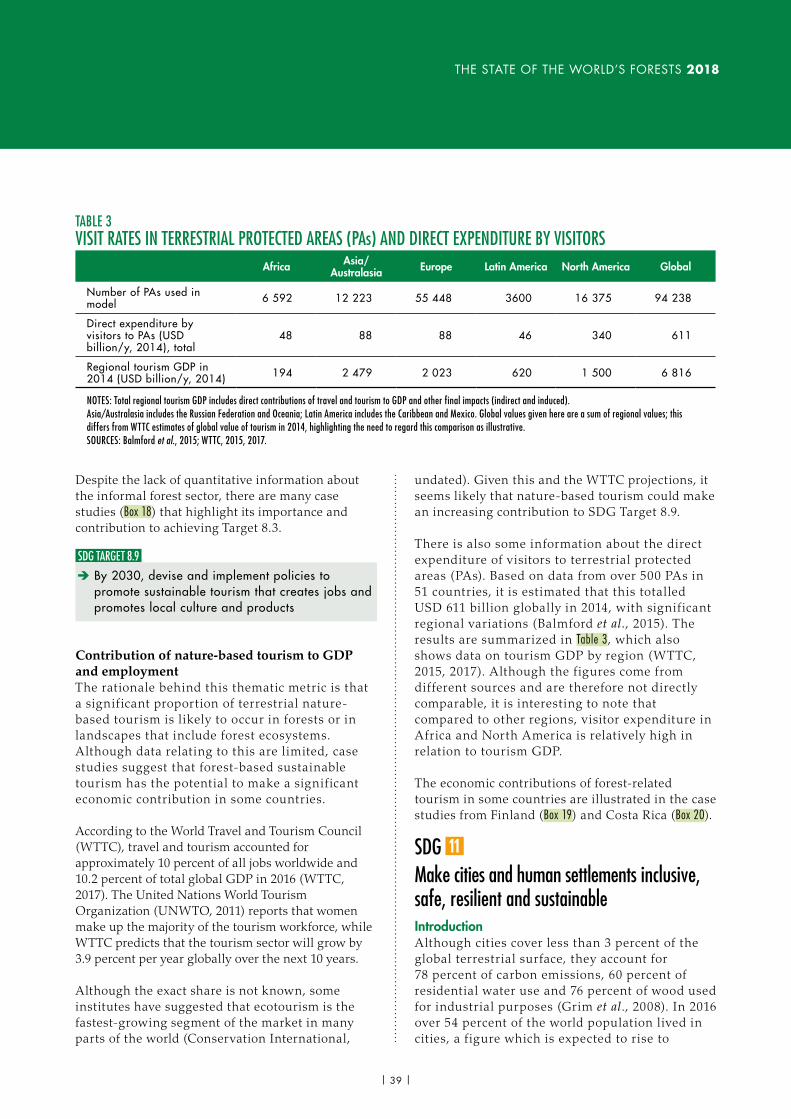
THE STATE OF THE WORLD’S FORESTS 2018
Despite the lack of quantitative information about the informal forest sector, there are many case studies (Box 18) that highlight its importance and contribution to achieving Target 8.3.
SDG TARGET 8.9 è By 2030, devise and implement policies to promote sustainable tourism that creates jobs and promotes local culture and products
Contribution of nature-based tourism to GDP and employmentThe rationale behind this thematic metric is that a significant proportion of terrestrial nature-based tourism is likely to occur in forests or in landscapes that include forest ecosystems. Although data relating to this are limited, case studies suggest that forest-based sustainable tourism has the potential to make a significant economic contribution in some countries.
According to the World Travel and Tourism Council (WTTC), travel and tourism accounted for approximately 10 percent of all jobs worldwide and 10.2 percent of total global GDP in 2016 (WTTC, 2017). The United Nations World Tourism Organization (UNWTO, 2011) reports that women make up the majority of the tourism workforce, while WTTC predicts that the tourism sector will grow by 3.9 percent per year globally over the next 10 years.
Although the exact share is not known, some institutes have suggested that ecotourism is the fastest-growing segment of the market in many parts of the world (Conservation International,
undated). Given this and the WTTC projections, it seems likely that nature-based tourism could make an increasing contribution to SDG Target 8.9.
There is also some information about the direct expenditure of v isitors to terrestrial protected areas (PAs). Based on data from over 500 PAs in 51 countries, it is estimated that this totalled USD 611 billion globally in 2014, with significant regional variations (Balmford et al., 2015). The results are summarized in Table 3, which also shows data on tourism GDP by region (WTTC, 2015, 2017). Although the figures come from different sources and are therefore not directly comparable, it is interesting to note that compared to other regions, v isitor expenditure in Africa and North America is relatively high in relation to tourism GDP.
The economic contributions of forest-related tourism in some countries are illustrated in the case studies from Finland (Box 19) and Costa Rica (Box 20).
SDG Make cities and human settlements inclusive, safe, resilient and sustainableIntroductionAlthough cities cover less than 3 percent of the global terrestrial surface, they account for 78 percent of carbon emissions, 60 percent of residential water use and 76 percent of wood used for industrial purposes (Grim et al., 2008). In 2016 over 54 percent of the world population lived in cities, a f igure which is expected to rise to
TABLE 3VISIT RATES IN TERRESTRIAL PROTECTED AREAS (PAs) AND DIRECT EXPENDITURE BY VISITORS
Africa Asia/Australasia Europe Latin America North America Global
Number of PAs used in model 6 592 12 223 55 448 3600 16 375 94 238
Direct expenditure by visitors to PAs (USD billion/y, 2014), total
48 88 88 46 340 611
Regional tourism GDP in 2014 (USD billion/y, 2014) 194 2 479 2 023 620 1 500 6 816
NOTES: Total regional tourism GDP includes direct contributions of travel and tourism to GDP and other final impacts (indirect and induced).Asia/Australasia includes the Russian Federation and Oceania; Latin America includes the Caribbean and Mexico. Global values given here are a sum of regional values; this differs from WTTC estimates of global value of tourism in 2014, highlighting the need to regard this comparison as illustrative.SOURCES: Balmford et al., 2015; WTTC, 2015, 2017.
| 39 |
CHAPTER 2 QUANTIFYING THE CONTRIBUTIONS OF FORESTS
60 percent by 2030, with one in every three liv ing in cities of at least 500 000 inhabitants (UN, 2016). Coupled with climate change, accelerated urbanization is increasingly threatening cities’ abilities to respond to the needs of urban dwellers. In response to this, SDG11 calls for countries to “Make cities and human settlements inclusive, safe, resilient and sustainable”. If properly planned and managed, urban and peri-urban forests (UPFs) – defined as “networks or systems comprising all woodlands, groups of trees, and individual trees located in and around urban areas” (FAO, 2016b) – can make a valuable contribution to SDG11 due to their positive impact on urban dwellers’ l ivelihoods and well-being. In order to fulf il their potential value for cities and other human settlements, the design, planning and management of UPFs should be fully integrated into urban planning at an early stage, and adequate f inancial resources made available for implementation and monitoring.
A number of tools have been developed to quantify the benefits of UPFs. One of the most promising is i-Tree Eco, created by the US Forest Service. As explained in Box 21, this can be used to assess the composition of urban forests and trees and evaluate some of their many benefits in monetary terms (Nowak et al., 2007).
Quantifying how forests and trees contribute to SDG11
SDG TARGET 11.4 è Strengthen efforts to protect and safeguard the world’s cultural and natural heritage
BOX 19CONTRIBUTIONS FROM NATURE-BASED TOURISM TO GDP AND EMPLOYMENT IN FINLAND
BOX 20NATURE-BASED TOURISM EXPENDITURE IN COSTA RICA
Nature-based tourism is estimated to generate approximately 1 percent of Finland’s employment and GDP (Finnish Bioeconomy Strategy, 2014).
National parks and outdoor recreation areas (owned and managed by the state) consist mainly of boreal forests and water. Spending by visitors in these areas brought a total of USD 230 million to the local economy in 2016 and sustained 1 916 jobs (full time employees, calculation based on visitor numbers, visitor spending and multipliers that were used to estimate indirect impacts of visitor spending).
Visitor numbers for national parks grew by 7 percent in 2016 to reach 2.8 million, and visitor spending grew by 21 percent – similar increases have been occurring over the past few years.
SOURCE: Metsähallitus website: www.metsa.fi/web/en/economicbenefitsofna-tionalparks.
Costa Rica is considered a world leader in ecotourism. In 2016 the country hosted 2.9 million non-resident tourists, with an average expenditure of USD 1 309 per person. According to the Tourism Board of Costa Rica, 66 percent of visitors stated ecotourism as one of their main reasons for visiting the country. Expenditure in 2016 at least partly related to nature-based tourism is therefore estimated to be USD 2.5 billion (based on 2.9 million visitors x USD 1 309/visitor x 0.66), which is 4.4 percent of Costa Rican GDP.
In 2015 there were approximately 1 million non-resident visitors to forest conservation areas. Assuming average visitor spending, this gives a total expenditure of USD 1.31 billion (or 2.5 percent of Costa Rica’s GDP) spent on visiting forest conservation areas, although this is a maximum estimate as people may have visited other places as well. In addition, residents made 0.9 million visits to forest conservation areas.
SOURCE: ICT. Macroproceso de Planeamiento y Desarrollo. Encuestas de No Residentes aéreas y terrestres: http://www.ict.go.cr/en/statistics/tourism-figures.html.
| 40 |
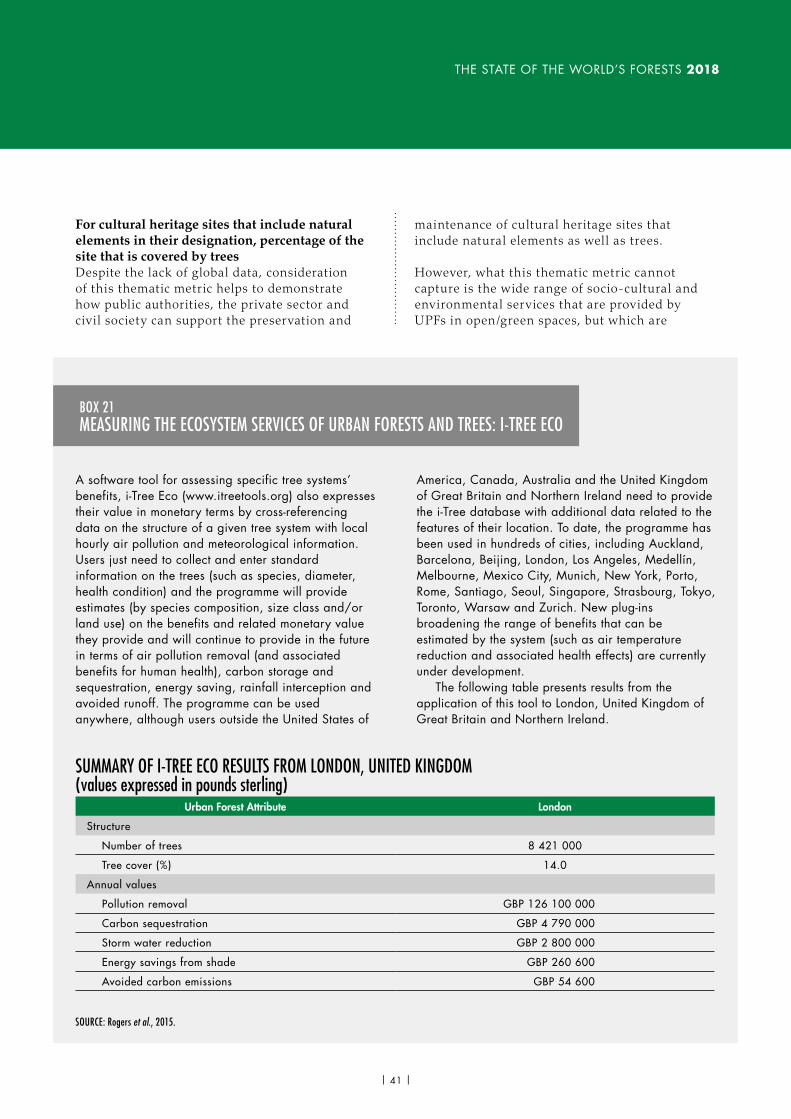
THE STATE OF THE WORLD’S FORESTS 2018
For cultural heritage sites that include natural elements in their designation, percentage of the site that is covered by treesDespite the lack of global data, consideration of this thematic metric helps to demonstrate how public authorities, the private sector and civil society can support the preservation and
maintenance of cultural heritage sites that include natural elements as well as trees.
However, what this thematic metric cannot capture is the wide range of socio-cultural and environmental services that are provided by UPFs in open/green spaces, but which are
A software tool for assessing specific tree systems’ benefits, i-Tree Eco (www.itreetools.org) also expresses their value in monetary terms by cross-referencing data on the structure of a given tree system with local hourly air pollution and meteorological information. Users just need to collect and enter standard information on the trees (such as species, diameter, health condition) and the programme will provide estimates (by species composition, size class and/or land use) on the benefits and related monetary value they provide and will continue to provide in the future in terms of air pollution removal (and associated benefits for human health), carbon storage and sequestration, energy saving, rainfall interception and avoided runoff. The programme can be used anywhere, although users outside the United States of
America, Canada, Australia and the United Kingdom of Great Britain and Northern Ireland need to provide the i-Tree database with additional data related to the features of their location. To date, the programme has been used in hundreds of cities, including Auckland, Barcelona, Beijing, London, Los Angeles, Medellín, Melbourne, Mexico City, Munich, New York, Porto, Rome, Santiago, Seoul, Singapore, Strasbourg, Tokyo, Toronto, Warsaw and Zurich. New plug-ins broadening the range of benefits that can be estimated by the system (such as air temperature reduction and associated health effects) are currently under development.
The following table presents results from the application of this tool to London, United Kingdom of Great Britain and Northern Ireland.
BOX 21MEASURING THE ECOSYSTEM SERVICES OF URBAN FORESTS AND TREES: I-TREE ECO
SUMMARY OF I-TREE ECO RESULTS FROM LONDON, UNITED KINGDOM (values expressed in pounds sterling)
Urban Forest Attribute London
Structure
Number of trees 8 421 000
Tree cover (%) 14.0
Annual values
Pollution removal GBP 126 100 000
Carbon sequestration GBP 4 790 000
Storm water reduction GBP 2 800 000
Energy savings from shade GBP 260 600
Avoided carbon emissions GBP 54 600
SOURCE: Rogers et al., 2015.
| 41 |
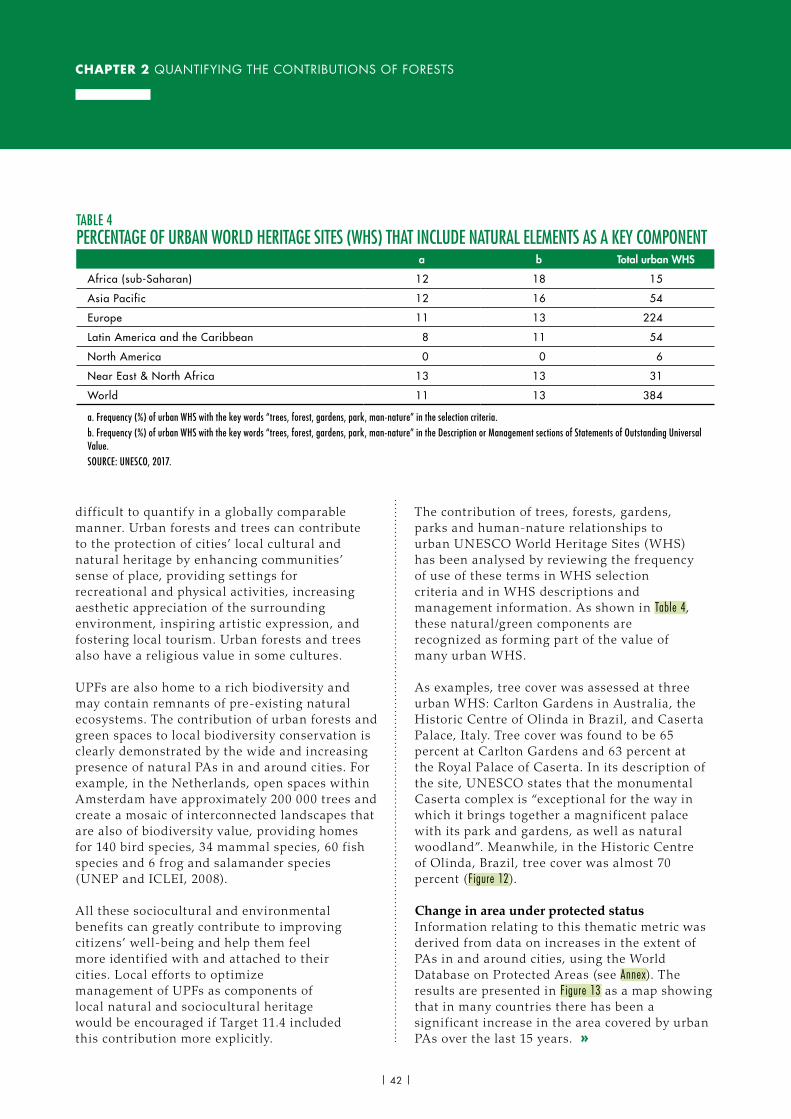
CHAPTER 2 QUANTIFYING THE CONTRIBUTIONS OF FORESTS
diff icult to quantify in a globally comparable manner. Urban forests and trees can contribute to the protection of cities’ local cultural and natural heritage by enhancing communities’ sense of place, providing settings for recreational and physical activ ities, increasing aesthetic appreciation of the surrounding environment, inspiring artistic expression, and fostering local tourism. Urban forests and trees also have a religious value in some cultures.
UPFs are also home to a rich biodiversity and may contain remnants of pre-existing natural ecosystems. The contribution of urban forests and green spaces to local biodiversity conservation is clearly demonstrated by the wide and increasing presence of natural PAs in and around cities. For example, in the Netherlands, open spaces within Amsterdam have approximately 200 000 trees and create a mosaic of interconnected landscapes that are also of biodiversity value, providing homes for 140 bird species, 34 mammal species, 60 f ish species and 6 frog and salamander species (UNEP and ICLEI, 2008).
All these sociocultural and environmental benefits can greatly contribute to improving citizens’ well-being and help them feel more identif ied with and attached to their cities. Local efforts to optimize management of UPFs as components of local natural and sociocultural heritage would be encouraged if Target 11.4 included this contribution more explicitly.
The contribution of trees, forests, gardens, parks and human-nature relationships to urban UNESCO World Heritage Sites (WHS) has been analysed by reviewing the frequency of use of these terms in WHS selection criteria and in WHS descriptions and management information. As shown in Table 4, these natural/green components are recognized as forming part of the value of many urban WHS.
As examples, tree cover was assessed at three urban WHS: Carlton Gardens in Australia, the Historic Centre of Olinda in Brazil, and Caserta Palace, Italy. Tree cover was found to be 65 percent at Carlton Gardens and 63 percent at the Royal Palace of Caserta. In its description of the site, UNESCO states that the monumental Caserta complex is “exceptional for the way in which it brings together a magnificent palace with its park and gardens, as well as natural woodland”. Meanwhile, in the Historic Centre of Olinda, Brazil, tree cover was almost 70 percent (Figure 12).
Change in area under protected statusInformation relating to this thematic metric was derived from data on increases in the extent of PAs in and around cities, using the World Database on Protected Areas (see Annex). The results are presented in Figure 13 as a map showing that in many countries there has been a significant increase in the area covered by urban PAs over the last 15 years. »
TABLE 4PERCENTAGE OF URBAN WORLD HERITAGE SITES (WHS) THAT INCLUDE NATURAL ELEMENTS AS A KEY COMPONENT
a b Total urban WHS
Africa (sub-Saharan) 12 18 15
Asia Pacific 12 16 54
Europe 11 13 224
Latin America and the Caribbean 8 11 54
North America 0 0 6
Near East & North Africa 13 13 31
World 11 13 384
a. Frequency (%) of urban WHS with the key words “trees, forest, gardens, park, man-nature” in the selection criteria.b. Frequency (%) of urban WHS with the key words “trees, forest, gardens, park, man-nature” in the Description or Management sections of Statements of Outstanding Universal Value.SOURCE: UNESCO, 2017.
| 42 |
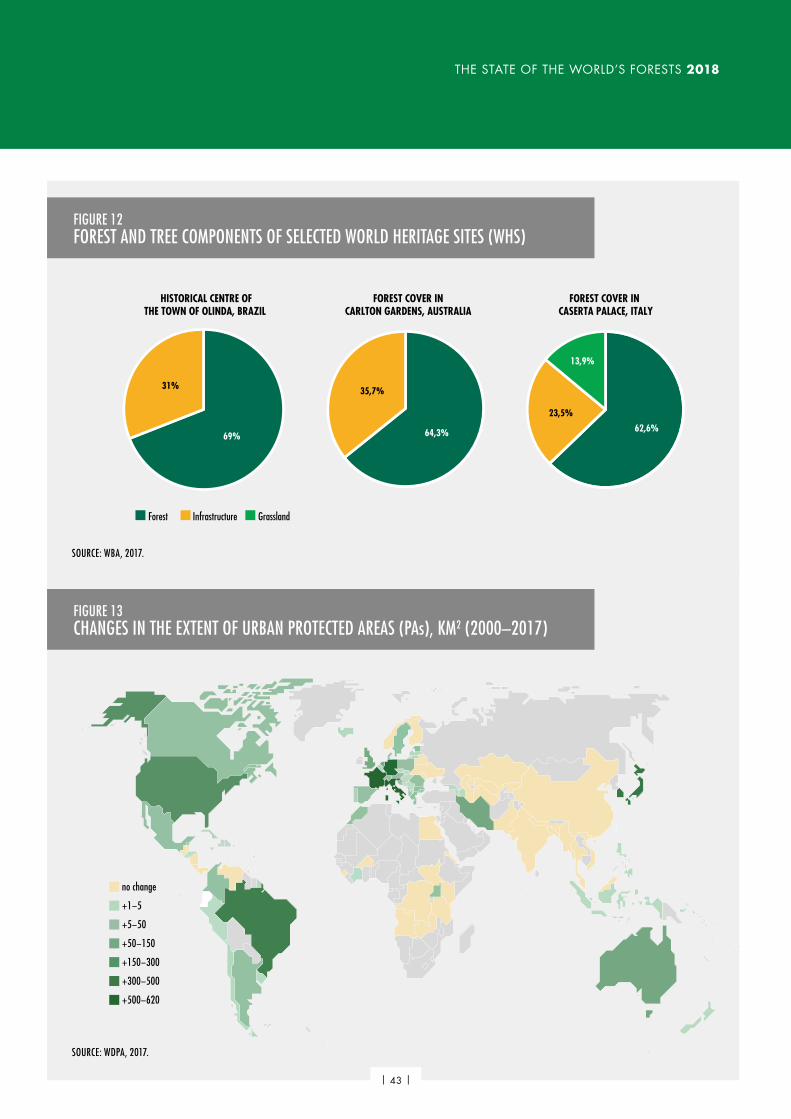
THE STATE OF THE WORLD’S FORESTS 2018
FIGURE 12FOREST AND TREE COMPONENTS OF SELECTED WORLD HERITAGE SITES (WHS)
SOURCE: WBA, 2017.
69%
31%
HISTORICAL CENTRE OFTHE TOWN OF OLINDA, BRAZIL
64,3%
35,7%
FOREST COVER INCARLTON GARDENS, AUSTRALIA
62,6%
23,5%
13,9%
FOREST COVER IN CASERTA PALACE, ITALY
Forest Infrastructure Grassland
no change
+1−5
+5−50
+50−150
+150−300
+300−500
+500−620
FIGURE 13CHANGES IN THE EXTENT OF URBAN PROTECTED AREAS (PAs), KM2 (2000–2017)
SOURCE: WDPA, 2017.
| 43 |
CHAPTER 2 QUANTIFYING THE CONTRIBUTIONS OF FORESTS
The value of urban PAs in supplying cities with key ecosystem services and providing city residents with opportunities to experience nature is il lustrated in Box 22, which presents a case study from Rio de Janeiro, Brazil.
SDG TARGET 11.7 è By 2030, provide universal access to safe, inclusive and accessible green and public spaces, in particular for women, children, older persons and persons with disabilities
Percentage of population that has access to a publicly accessible green area of at least 1 hectare within 15 minutes' or 500 metres' walking distance from their residence.By highlighting the importance of accessible green space, the thematic metric for Target 11.7 could help to catalyse public efforts to provide quality green space for citizens’ increased well-being. Green space standards are needed for urban planning, especially where there is rapid urbanization and loss of green space.
Green spaces include areas with natural vegetation such as grass and trees, as well as less managed areas such as woodland and nature reserves and some human-made features (Lachowycz and Jones, 2013). Wooded green space often has higher socio-economic and environmental value than grey open space or non-wooded green space. By helping to define the character of a place, trees and forests in urban areas can increase the diversity of the environment and the sense of ownership and belonging of local communities, who see their identity ref lected in the surroundings. The presence of trees on public streets has also been proved to decrease the occurrence of crime, thus increasing the safety of open and green spaces. A study conducted in Baltimore in the United States of America showed that a 10 percent increase in canopy cover was linked to a 12 percent decrease in crime (Troy, Grove and O’Neil-Dunne, 2012). The extent of urban tree canopy cover in a city – defined by the Intergovernmental Panel on Climate Change (IPCC) as “the percentage of the ground covered by a vertical projection of the outermost perimeter of the natural spread of the foliage of plants” (IPCC, 2003) – should be considered a key parameter for measuring the quality of open space and inform choices related to planning, design and management. In addition to the i-Tree Eco tool outlined in Box 21, Collect Earth can also be used to estimate tree cover in and around cities17.
Accessibility is also important: increased accessibility to urban green spaces is associated with an increase in their use, and consequently in the optimization of the benefits they can
17 This tool was developed by FAO and is available at http://www.openforis.org/tools/collect-earth.html.
BOX 22CASE STUDY: TIJUCA NATIONAL PARK, RIO DE JANEIRO, BRAZIL
The importance of conserving urban PAs is demonstrated by Tijuca National Park. The park covers 4 000 hectares and is located within the UNESCO World Heritage Site of Carioca Landscapes between the Mountain and the Sea. Since the early nineteenth century the park and its forest have been subject to different waves of environmental degradation, resulting from deforestation, a proliferation of non-native species, and urban pressure. Reforestation was part of the restoration efforts, mainly using trees native to the region. Recreational infrastructure was also established in the park, which helped to raise local public awareness on the importance of safeguarding urban forests. A fauna restoration project was launched in the 1960s, which significantly contributed to Tijuca Park becoming a more mature forest ecosystem. Since 1999 the park has been jointly managed by the city of Rio de Janeiro and the Ministry of the Environment. It now offers an outstanding natural setting for its 2.5 million annual visitors, and the restored Atlantic Forest is a sanctuary of high species diversity and endemism. These valuable services contributed to the designation of Tijuca National Park as a World Heritage cultural landscape in 2012.
SOURCE: Trzyna, 2014.
»
| 44 |
THE STATE OF THE WORLD’S FORESTS 2018
provide to inhabitants (Cohen et al., 2007; Roemmich et al., 2006). Access to urban forests and trees provides opportunities for a range of possible activ ities and many different types of user can benefit. For example, children liv ing in areas with good access to green spaces have been shown to have 11–19 percent lower prevalence of obesity compared to those with limited or no access (Dadvand et al., 2014). Factors such as distance, distribution, typology and quality all affect the accessibility of an area: simply measuring the amount of urban open space available per capita is insufficient. Access to open and green spaces across cities is not always equitable, with more and better quality green spaces usually being located in richer districts. There are various definitions of accessibility. The European Environment Agency (EEA) defines a green space as accessible to a person if it is within 15 minutes’ walking distance (approximately 900–1 000 metres) from where they live (Ambiente Italia Research Institute, 2003). In the United States of America, a quarter of a mile (or 400 metres) has been defined as the average distance that people are willing to walk to reach a green space (Boone et al., 2009). In the United Kingdom of Great Britain and Northern Ireland, the accessible natural green space standard recommends that “no person should live more than 300 metres from their nearest area of accessible natural green space of at least 2 hectares in size” (Natural England, 2008). In 2017, the Leibniz Institute of Ecological Urban and Regional Development created a methodology to calculate how German cities perform in providing accessible urban green/forest spaces to city residents (Grunewald et al., 2017). The results of the analysis, shown in Figure 14, indicate that approximately 75 percent of Germans currently have adequate access to green space.
SDG Ensure sustainable production and consumption patternsIntroductionRenewability, resource efficiency and responsible sourcing of forest products are at the heart of the concept of sustainable production and consumption. Higher resource efficiency,
durability of wood products and responsible gathering of NWFPs can alleviate the environmental burden of production to meet a growing world population. Responsible production and consumption of forest products already exist. Paper and wood, for instance, can be reused if recovered and separated from other waste. Recycling wood and paper reduces the volume of virgin wood fibre needed to produce wood-based products.
The forest industry also produces second-generation biofuels and bio-based materials that can substitute fossil-based fuels and products. It supplies sustainable packaging made of wood waste and residues, including packaging for food products. Technical innovations in wood products are improving resource productivity. Wood residues are being widely used to make wood-based panels, including particle board and other modern composite materials. Mills can transform by-stream products into energy, new feedstock, biofuels or a source of minerals, recycled from sludge ash (CEPI, 2014). As discussed in the section on SDG7, clean energy is therefore being generated from wood residues.
However, sustainable production can only succeed if accompanied by positive changes in the consumption patterns and lifestyles of households and governments (for example through more responsible procurement policies in the public sector). Across the world, the forest sector has provided numerous examples of sustainable wood production and consumption. These include developing policies that encourage the use of wood products for construction, which has been found to have lower embodied energy than comparable building systems using concrete, steel, or bricks (Upton et al., 2008). Wood could be used much more in the construction not only of houses but also other structures (such as bridges), although this could be hampered by regulations that do not specif ically cover wood, as well as by certain insurance conditions. Although there are positive signs in some countries, the use of wood in construction is still not increasing on a global scale. In 2013, the Member States of the United Nations Economic Commission for Europe (UNECE) adopted an action plan based on undertaking lifecycle analyses for all materials in order to contribute to »
| 45 |
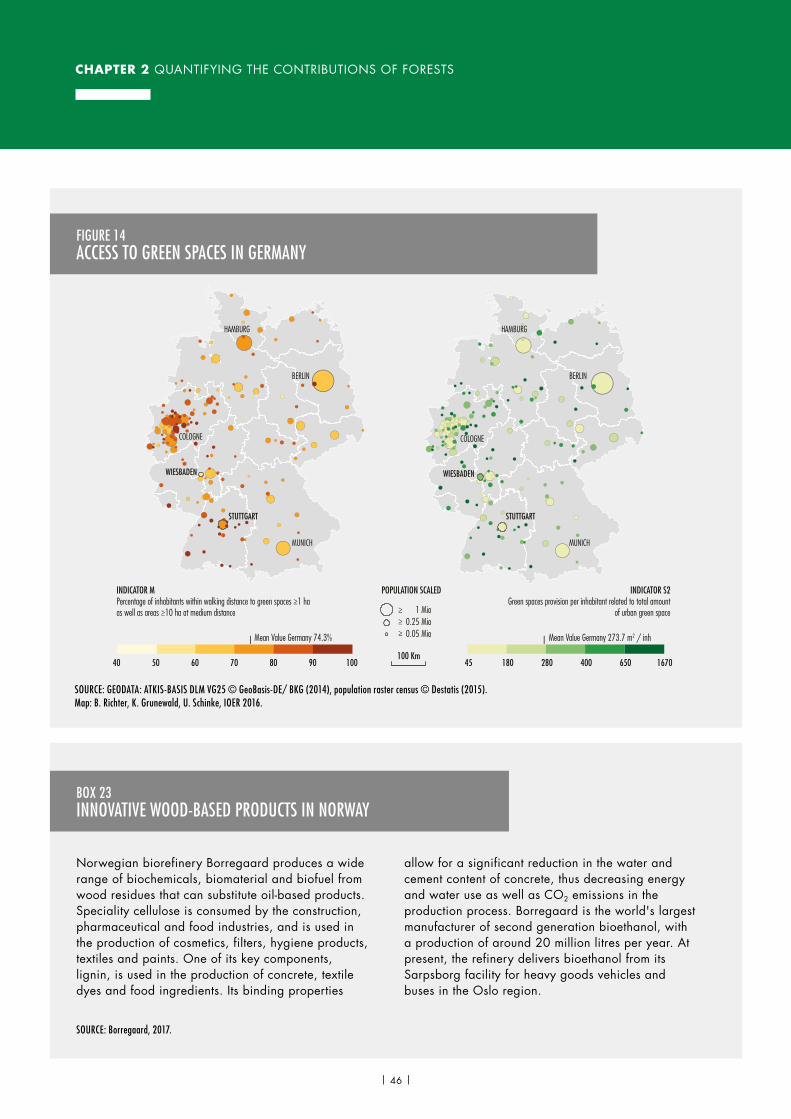
CHAPTER 2 QUANTIFYING THE CONTRIBUTIONS OF FORESTS
BOX 23INNOVATIVE WOOD-BASED PRODUCTS IN NORWAY
Norwegian biorefinery Borregaard produces a wide range of biochemicals, biomaterial and biofuel from wood residues that can substitute oil-based products. Speciality cellulose is consumed by the construction, pharmaceutical and food industries, and is used in the production of cosmetics, filters, hygiene products, textiles and paints. One of its key components, lignin, is used in the production of concrete, textile dyes and food ingredients. Its binding properties
allow for a significant reduction in the water and cement content of concrete, thus decreasing energy and water use as well as CO2 emissions in the production process. Borregaard is the world's largest manufacturer of second generation bioethanol, with a production of around 20 million litres per year. At present, the refinery delivers bioethanol from its Sarpsborg facility for heavy goods vehicles and buses in the Oslo region.
FIGURE 14ACCESS TO GREEN SPACES IN GERMANY
SOURCE: GEODATA: ATKIS-BASIS DLM VG25 © GeoBasis-DE/ BKG (2014), population raster census © Destatis (2015).Map: B. Richter, K. Grunewald, U. Schinke, IOER 2016.
INDICATOR MPercentage of inhabitants within walking distance to green spaces ≥1 ha as well as areas ≥10 ha at medium distance
Mean Value Germany 74.3% Mean Value Germany 273.7 m2 / inh
INDICATOR S2Green spaces provision per inhabitant related to total amount
of urban green space
POPULATION SCALED
HAMBURG
BERLIN
MUNICH
COLOGNE
WIESBADEN
STUTTGART
HAMBURG
BERLIN
MUNICH
COLOGNE
WIESBADEN
STUTTGART
45 180 280 400 650 1670
≥≥≥
1 Mio0.25 Mio0.05 Mio
100 Km40 50 60 70 80 90 100
SOURCE: Borregaard, 2017.
| 46 |
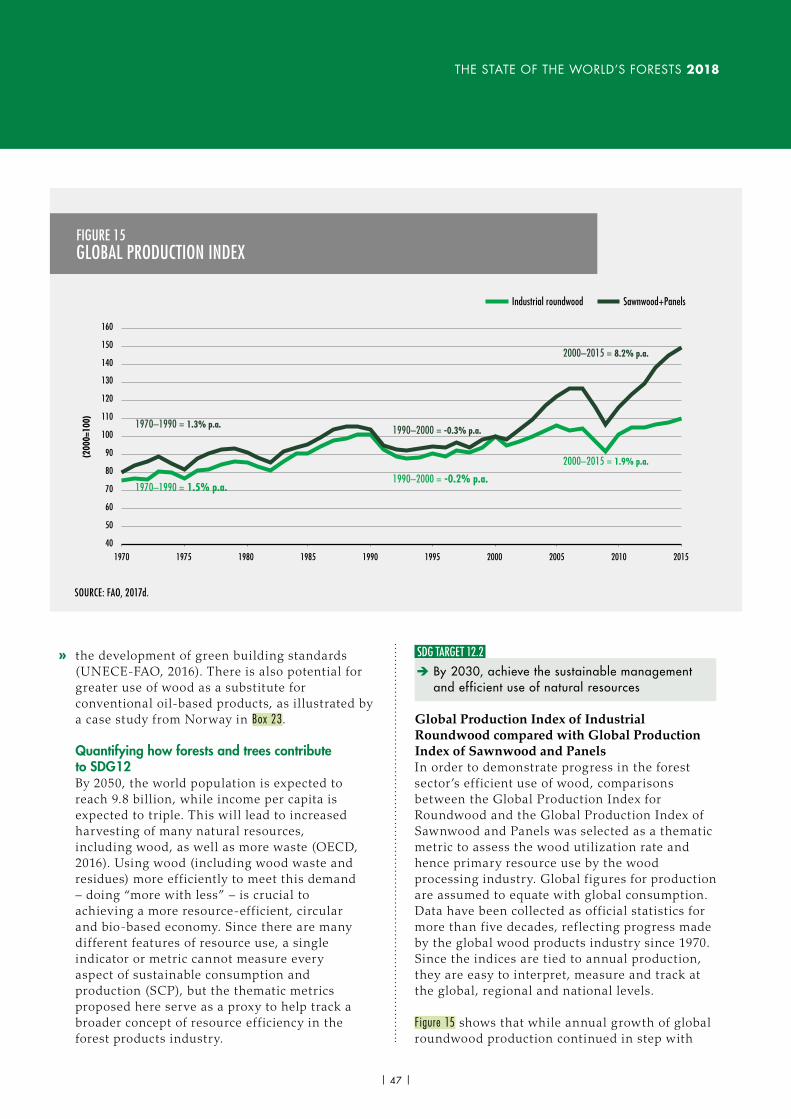
THE STATE OF THE WORLD’S FORESTS 2018
the development of green building standards (UNECE-FAO, 2016). There is also potential for greater use of wood as a substitute for conventional oil-based products, as il lustrated by a case study from Norway in Box 23.
Quantifying how forests and trees contribute to SDG12 By 2050, the world population is expected to reach 9.8 billion, while income per capita is expected to triple. This will lead to increased harvesting of many natural resources, including wood, as well as more waste (OECD, 2016). Using wood (including wood waste and residues) more efficiently to meet this demand – doing “more with less” – is crucial to achieving a more resource-efficient, circular and bio-based economy. Since there are many different features of resource use, a single indicator or metric cannot measure every aspect of sustainable consumption and production (SCP), but the thematic metrics proposed here serve as a proxy to help track a broader concept of resource efficiency in the forest products industry.
SDG TARGET 12.2 è By 2030, achieve the sustainable management and efficient use of natural resources
Global Production Index of Industrial Roundwood compared with Global Production Index of Sawnwood and PanelsIn order to demonstrate progress in the forest sector’s eff icient use of wood, comparisons between the Global Production Index for Roundwood and the Global Production Index of Sawnwood and Panels was selected as a thematic metric to assess the wood utilization rate and hence primary resource use by the wood processing industry. Global f igures for production are assumed to equate with global consumption. Data have been collected as official statistics for more than five decades, ref lecting progress made by the global wood products industry since 1970. Since the indices are tied to annual production, they are easy to interpret, measure and track at the global, regional and national levels.
Figure 15 shows that while annual growth of global roundwood production continued in step with
FIGURE 15GLOBAL PRODUCTION INDEX
SOURCE: FAO, 2017d.
40
50
60
70
80
90
100
110
120
130
140
150
160
1970 1975 1980 1985 1990 1995 2000 2005 2010 2015
Industrial roundwood Sawnwood+Panels
2000–2015 = 8.2% p.a.
1970–1990 = 1.3% p.a. 1990–2000 = -0.3% p.a.
2000–2015 = 1.9% p.a.
1970–1990 = 1.5% p.a.1990–2000 = -0.2% p.a.
(200
0=10
0)
»
| 47 |
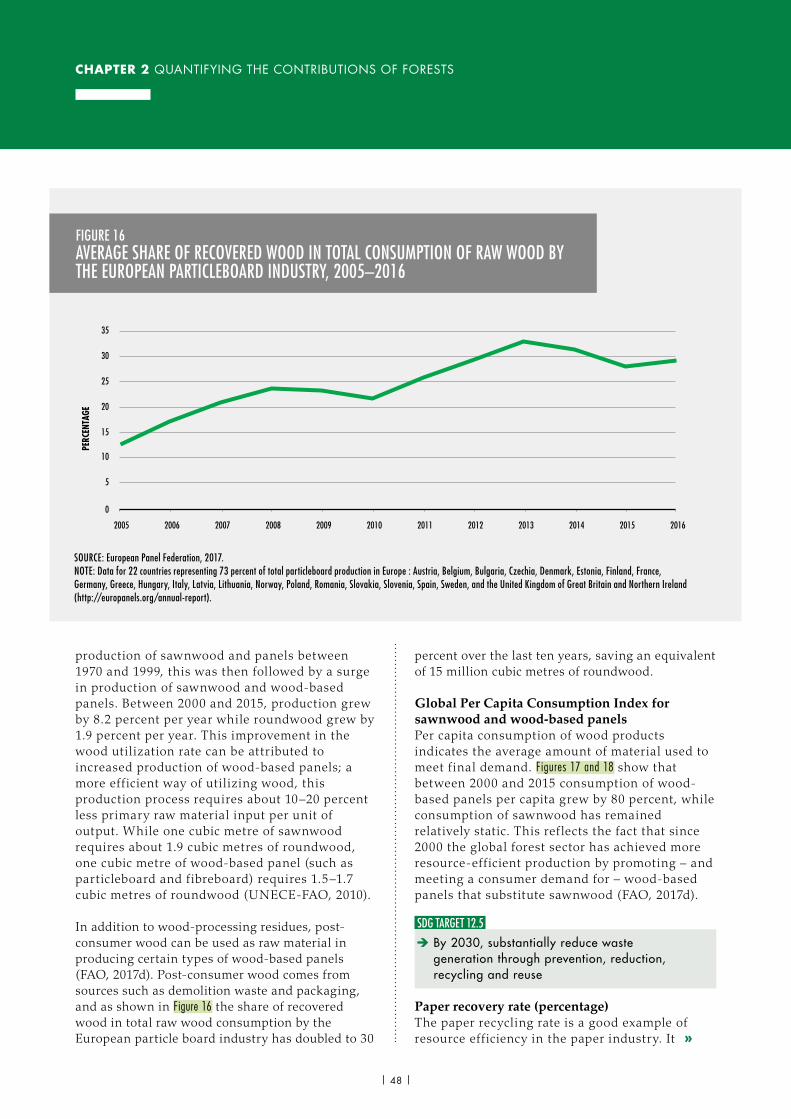
CHAPTER 2 QUANTIFYING THE CONTRIBUTIONS OF FORESTS
production of sawnwood and panels between 1970 and 1999, this was then followed by a surge in production of sawnwood and wood-based panels. Between 2000 and 2015, production grew by 8.2 percent per year while roundwood grew by 1.9 percent per year. This improvement in the wood utilization rate can be attributed to increased production of wood-based panels; a more efficient way of utilizing wood, this production process requires about 10–20 percent less primary raw material input per unit of output. While one cubic metre of sawnwood requires about 1.9 cubic metres of roundwood, one cubic metre of wood-based panel (such as particleboard and fibreboard) requires 1.5–1.7 cubic metres of roundwood (UNECE-FAO, 2010).
In addition to wood-processing residues, post-consumer wood can be used as raw material in producing certain types of wood-based panels (FAO, 2017d). Post-consumer wood comes from sources such as demolition waste and packaging, and as shown in Figure 16 the share of recovered wood in total raw wood consumption by the European particle board industry has doubled to 30
percent over the last ten years, saving an equivalent of 15 million cubic metres of roundwood.
Global Per Capita Consumption Index for sawnwood and wood-based panelsPer capita consumption of wood products indicates the average amount of material used to meet f inal demand. Figures 17 and 18 show that between 2000 and 2015 consumption of wood-based panels per capita grew by 80 percent, while consumption of sawnwood has remained relatively static. This ref lects the fact that since 2000 the global forest sector has achieved more resource-efficient production by promoting – and meeting a consumer demand for – wood-based panels that substitute sawnwood (FAO, 2017d).
SDG TARGET 12.5 è By 2030, substantially reduce waste generation through prevention, reduction, recycling and reuse
Paper recovery rate (percentage)The paper recycling rate is a good example of resource efficiency in the paper industry. It
FIGURE 16AVERAGE SHARE OF RECOVERED WOOD IN TOTAL CONSUMPTION OF RAW WOOD BY THE EUROPEAN PARTICLEBOARD INDUSTRY, 2005–2016
SOURCE: European Panel Federation, 2017.NOTE: Data for 22 countries representing 73 percent of total particleboard production in Europe : Austria, Belgium, Bulgaria, Czechia, Denmark, Estonia, Finland, France, Germany, Greece, Hungary, Italy, Latvia, Lithuania, Norway, Poland, Romania, Slovakia, Slovenia, Spain, Sweden, and the United Kingdom of Great Britain and Northern Ireland(http://europanels.org/annual-report).
0
5
10
15
20
25
30
35
2005 2006 2007 2008 2009 2010 2011 2012 2013 2014 2015 2016
PERC
ENTA
GE
»
| 48 |
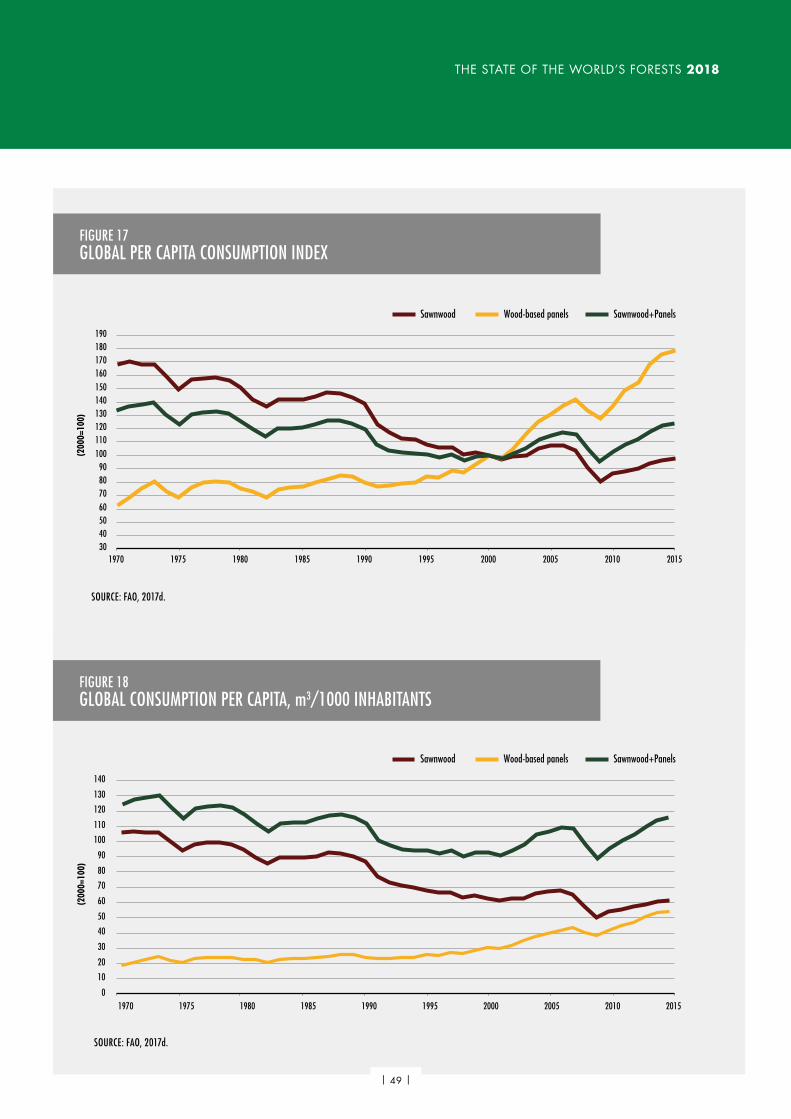
THE STATE OF THE WORLD’S FORESTS 2018
FIGURE 17GLOBAL PER CAPITA CONSUMPTION INDEX
SOURCE: FAO, 2017d.
30405060708090
100110120130140150160170180190
1970 1975 1980 1985 1990 1995 2000 2005 2010 2015
Sawnwood Wood-based panels Sawnwood+Panels
(200
0=10
0)
FIGURE 18GLOBAL CONSUMPTION PER CAPITA, m3/1000 INHABITANTS
SOURCE: FAO, 2017d.
Sawnwood Wood-based panels Sawnwood+Panels
0
10
20
30
40
50
60
70
80
90
100
110
120
130
140
1970 1975 1980 1985 1990 1995 2000 2005 2010 2015
(200
0=10
0)
| 49 |
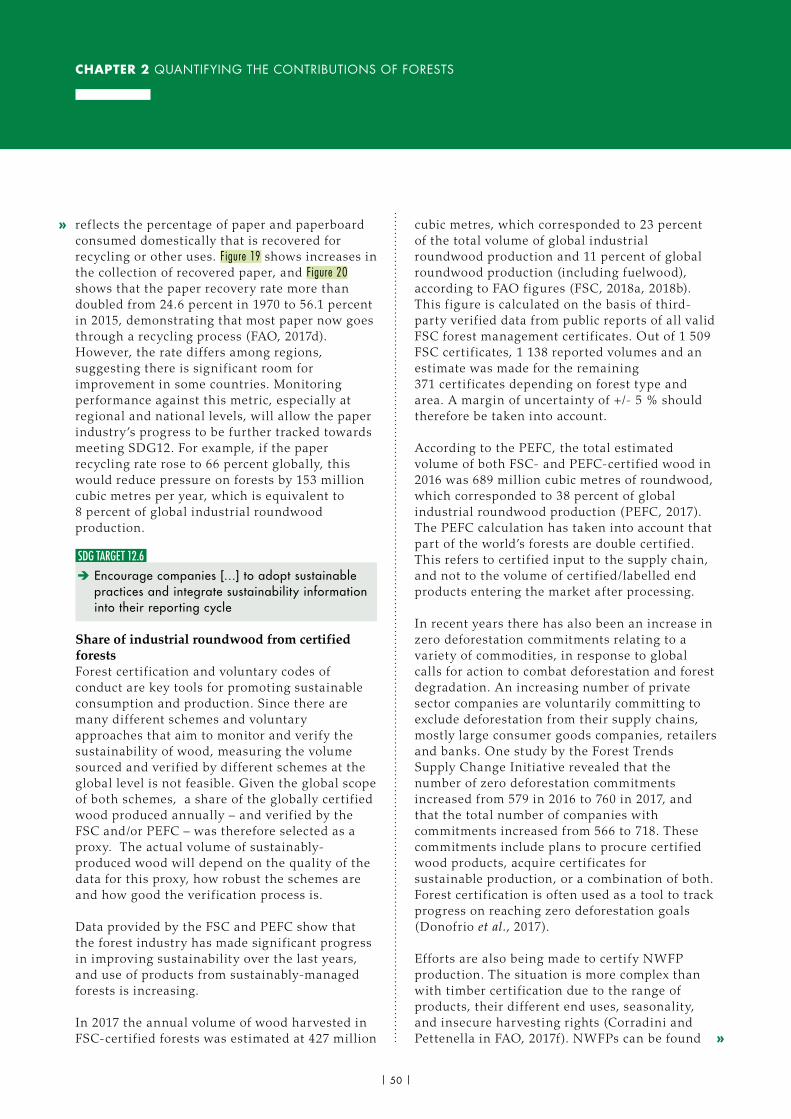
CHAPTER 2 QUANTIFYING THE CONTRIBUTIONS OF FORESTS
ref lects the percentage of paper and paperboard consumed domestically that is recovered for recycling or other uses. Figure 19 shows increases in the collection of recovered paper, and Figure 20 shows that the paper recovery rate more than doubled from 24.6 percent in 1970 to 56.1 percent in 2015, demonstrating that most paper now goes through a recycling process (FAO, 2017d). However, the rate differs among regions, suggesting there is significant room for improvement in some countries. Monitoring performance against this metric, especially at regional and national levels, will allow the paper industry’s progress to be further tracked towards meeting SDG12. For example, if the paper recycling rate rose to 66 percent globally, this would reduce pressure on forests by 153 million cubic metres per year, which is equivalent to 8 percent of global industrial roundwood production.
SDG TARGET 12.6 è Encourage companies […] to adopt sustainable practices and integrate sustainability information into their reporting cycle
Share of industrial roundwood from certified forestsForest certif ication and voluntary codes of conduct are key tools for promoting sustainable consumption and production. Since there are many different schemes and voluntary approaches that aim to monitor and verify the sustainability of wood, measuring the volume sourced and verif ied by different schemes at the global level is not feasible. Given the global scope of both schemes, a share of the globally certif ied wood produced annually – and verif ied by the FSC and/or PEFC – was therefore selected as a proxy. The actual volume of sustainably-produced wood will depend on the quality of the data for this proxy, how robust the schemes are and how good the verif ication process is.
Data provided by the FSC and PEFC show that the forest industry has made significant progress in improving sustainability over the last years, and use of products from sustainably-managed forests is increasing.
In 2017 the annual volume of wood harvested in FSC-certif ied forests was estimated at 427 million
cubic metres, which corresponded to 23 percent of the total volume of global industrial roundwood production and 11 percent of global roundwood production (including fuelwood), according to FAO figures (FSC, 2018a, 2018b). This f igure is calculated on the basis of third-party verif ied data from public reports of all valid FSC forest management certif icates. Out of 1 509 FSC certif icates, 1 138 reported volumes and an estimate was made for the remaining 371 certif icates depending on forest type and area. A margin of uncertainty of +/- 5 % should therefore be taken into account.
According to the PEFC, the total estimated volume of both FSC- and PEFC-certif ied wood in 2016 was 689 million cubic metres of roundwood, which corresponded to 38 percent of global industrial roundwood production (PEFC, 2017). The PEFC calculation has taken into account that part of the world’s forests are double certif ied. This refers to certif ied input to the supply chain, and not to the volume of certif ied/labelled end products entering the market after processing.
In recent years there has also been an increase in zero deforestation commitments relating to a variety of commodities, in response to global calls for action to combat deforestation and forest degradation. An increasing number of private sector companies are voluntarily committing to exclude deforestation from their supply chains, mostly large consumer goods companies, retailers and banks. One study by the Forest Trends Supply Change Initiative revealed that the number of zero deforestation commitments increased from 579 in 2016 to 760 in 2017, and that the total number of companies with commitments increased from 566 to 718. These commitments include plans to procure certif ied wood products, acquire certif icates for sustainable production, or a combination of both. Forest certif ication is often used as a tool to track progress on reaching zero deforestation goals (Donofrio et al., 2017).
Efforts are also being made to certify NWFP production. The situation is more complex than with timber certif ication due to the range of products, their different end uses, seasonality, and insecure harvesting rights (Corradini and Pettenella in FAO, 2017f). NWFPs can be found
»
»
| 50 |
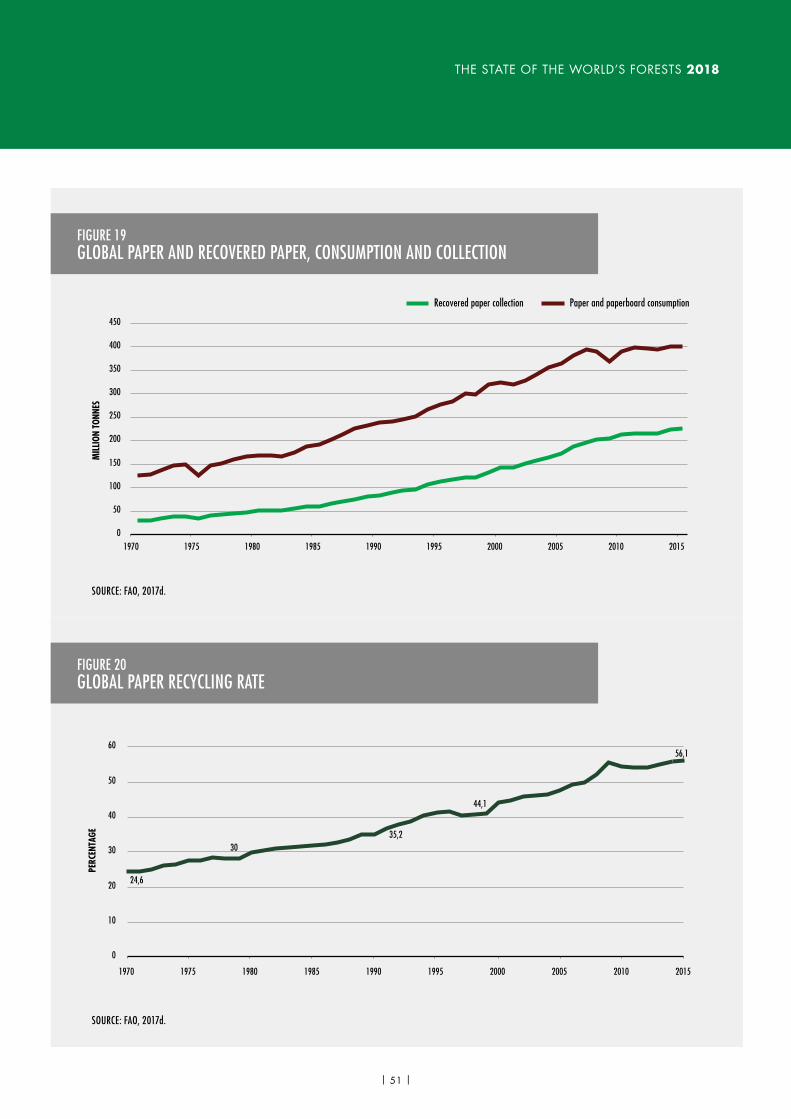
THE STATE OF THE WORLD’S FORESTS 2018
FIGURE 19GLOBAL PAPER AND RECOVERED PAPER, CONSUMPTION AND COLLECTION
FIGURE 20GLOBAL PAPER RECYCLING RATE
SOURCE: FAO, 2017d.
SOURCE: FAO, 2017d.
0
50
100
150
200
250
300
350
400
450
1970 1975 1980 1985 1990 1995 2000 2005 2010 2015
MIL
LION
TON
NES
Recovered paper collection Paper and paperboard consumption
24,6
3035,2
44,1
56,1
0
10
20
30
40
50
60
1970 1975 1980 1985 1990 1995 2000 2005 2010 2015
PERC
ENTA
GE
| 51 |
CHAPTER 2 QUANTIFYING THE CONTRIBUTIONS OF FORESTS
under a suite of certif ication schemes, including the FairWild Standard (Box 24), PEFC, FSC, Organic and Fair Trade, Rainforest Alliance, International Standard for Sustainable Wild Collection of Medicinal and Aromatic Plants (ISSC-MAP) and Certif icate of Origin, among others, making it diff icult to generate global statistics. Furthermore, as with timber, certif ication is only one indicator of sustainability. Studies over the past few decades confirm that one-size-fits-all measures often do not work: although some NWFPs may face overharvesting risks and require strict standards on their extraction, other products can be harvested without compromising the resource base and thus require a “lighter hand.” (Laird et al., 2011; Norvell, 1995; Pilz et al., 2003; Egli et al., 2006).
SDG TARGET 12.7 è Promote public procurement practices that are sustainable, in accordance with national policies and priorities
Number of countries implementing sustainable timber public procurement policiesInternational action to combat deforestation, forest degradation and illegal and unsustainable wood production led to the development of public timber procurement policies. By 2014, public wood procurement policies – including criteria on legality and/or sustainability – had been adopted in 21 countries in Europe and six outside Europe. Although these policies differ in their design and level of implementation, they all boost demand for verif ied legal and sustainable timber and help to meet international commitments and conventions by positively affecting forest management (Brack, 2014).
An initiative promoting the use of legally-sourced timber is Forest Law Enforcement, Governance and Trade (FLEGT), which aims to reduce illegal logging by strengthening sustainable and legal forest management, improving governance and promoting trade in legally-produced timber. The EU Timber Regulation was created as part of the EU’s FLEGT Action Plan to combat illegal logging by ensuring that only legal timber and legal timber products are sold in the EU. In 2008 the US Lacey Act – which has banned trafficking in illegal wildlife since 1900 – was amended to include timber and paper and thus ban trade in illegally-sourced wood products. Other countries, such as Australia, have also enacted similar bans prohibiting both the import and processing of illegally-logged timber and timber products (WRI, 2017b).
SDG Take urgent action to combat climate change and its impacts18
IntroductionForests play a crucial role in determining the accumulation of greenhouse gases in the atmosphere, as they absorb roughly 2 billion
18 Acknowledging that the UNFCCC is the primary international, intergovernmental forum for negotiating the global response to climate change.
BOX 24FAIRWILD STANDARD
The FairWild Standard has 11 principles and 29 criteria to address the ecological, social and economic requirements for sustainable wild plant collection. Its purpose is to ensure the continued use and long-term survival of wild species and populations in their habitats, while respecting traditions and cultures and supporting the livelihoods of all stakeholders. The Standard supports efforts to ensure that wild plant resources are managed, harvested and traded sustainably, providing benefits to rural producers. Products such as medicinal and aromatic plants, gums and resins, wild fruits, nuts, seeds, processed ingredients for finished products such as essential and fatty oils, and finished products containing FairWild ingredients, can be certified under the Standard. The scheme trades 400 tonnes of FairWild-certified herbal material annually, which currently covers 17 species from ten countries and 20 companies.
SOURCE: FairWild Foundation, 2017.
»
| 52 |
THE STATE OF THE WORLD’S FORESTS 2018
tonnes of carbon dioxide equivalent each year. As such, deforestation is a leading cause of climate change as forests’ ability to sequester carbon decreases as they are lost. The IPCC’s Fifth Assessment Report states that the most cost-effective mitigation options for forestry are afforestation, sustainable forest management and reducing deforestation, with significant differences in their relative importance across regions (IPCC, 2014).
As highlighted in the sections dealing with other SDGs, forests and trees provide a wide range of goods and ecosystem services that are threatened by climate change. Although uncertainty exists about the magnitude and timing of the environmental, social and economic impacts of climate change, there is sufficient scientif ic information available to begin taking action now. Forests are integral to both mitigating and adapting to climate change. Ignoring the contribution they can make could severely undermine the effectiveness of climate action.
Quantifying how forests and trees contribute to SDG13
SDG TARGET 13.1 è Strengthen resilience and adaptive capacity to climate-related hazards and natural disasters in all countries
Forest area (hectares) destroyed/affected by climate-related natural disasters over the last 20 years (1996–2016)This thematic metric was developed to shed light on the extent of forest area affected by disasters.19 Although there are continuing uncertainties about the precise impact of climate change on the nature, scale and location of natural disasters, they are nonetheless expected to intensify with climate change. This will have environmental, social and economic implications, particularly for communities that depend on forests for their livelihoods and food security. Disasters have the potential to destroy critical forest assets and infrastructure and cause serious losses in production. They can invert
19 Data used in this analysis were derived from FRA (FAO, 2015a), associated country reports (FAO, 2015d), and the European Forest Institute and European Forest Fire Information System database.
trade f lows and slow economic growth in countries where the sector is important for the economy and makes a significant contribution to GDP (da Silva and Cernat, 2012). When disaster damage to forests is severe, the negative impacts can be long-lasting due to the lengthy time frames generally involved in forest recovery. Forest-dependent communities may need long-term assistance in preparing for and recovering from disasters. Thus, information on the affected forest area is crucial to understanding the breadth and scope of disaster impact on the sector, on livelihoods and on the socio-economic development of many rural areas. Meanwhile, forests and trees have an important role in providing protection from, preventing, and/or lessening the impacts of natural disasters such as avalanches and landslides in mountain areas and tsunamis and cyclones in coastal areas.
More than 800 million hectares of forested area were destroyed or affected by disasters between 1996 and 2015 (FAO, 2015a). During the period 2003–2013, 26 major events caused damage and loss to forestry worth USD 737 million (FAO, 2015c), with hurricanes, typhoons and similar storms having the greatest impact (Figure 21).
A study from 155 country reports relating to disturbances from fire (Van Lierop et al., 2015) revealed that most countries with significant areas of forest reported at least some burned area (Figure 22), and that over the period from 2003 to 2012 an average of about 67 million hectares (or 1.7 percent of forest land) was burned each year. During this period, the largest average area burned was in South America (35 million hectares per year), followed by Africa (17 million hectares per year) and Oceania (7 million hectares per year). There was a decreasing trend in the forest area burned in South America and a slight decreasing trend in Africa, but no clear trends elsewhere.
As for disturbances from pests, disease and severe weather, only 75 countries (representing 70 percent of the total global forest area) provided data on the area affected, in total reporting almost 100 million hectares of forest affected by pests and disease. North and Central America reported the largest forest area affected (58 million hectares), most of which was attributed to bark beetles.
| 53 |
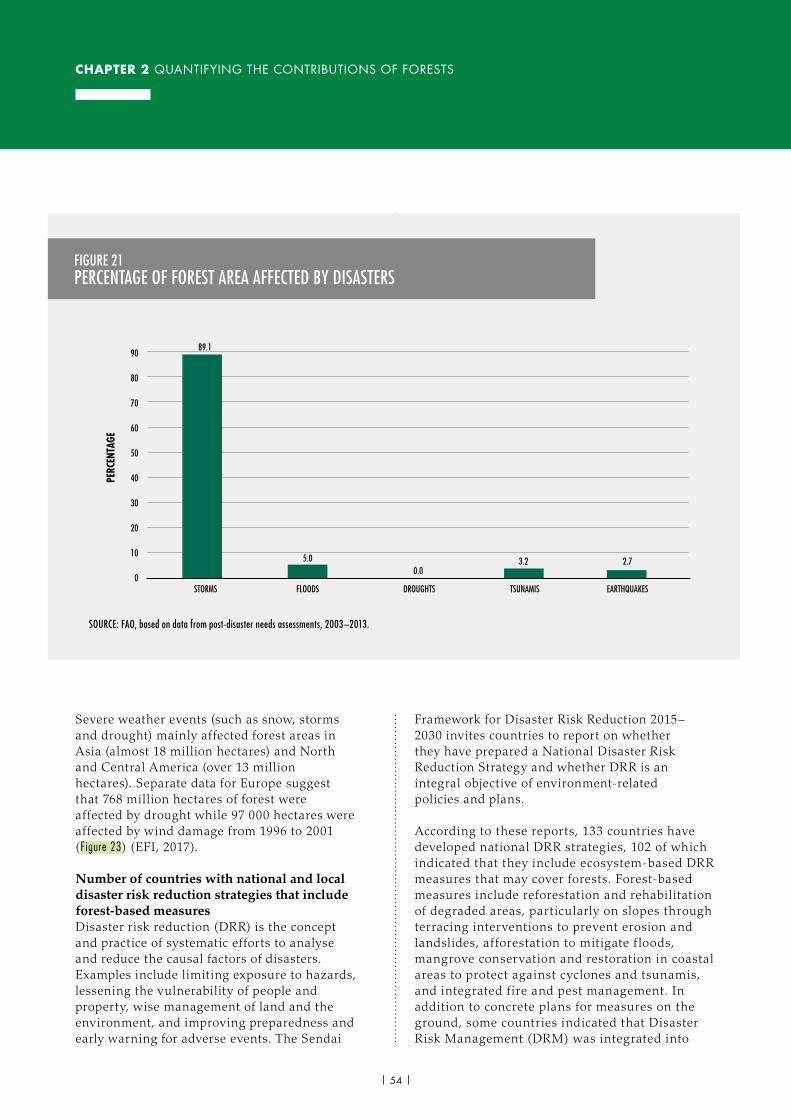
CHAPTER 2 QUANTIFYING THE CONTRIBUTIONS OF FORESTS
Severe weather events (such as snow, storms and drought) mainly affected forest areas in Asia (almost 18 million hectares) and North and Central America (over 13 million hectares). Separate data for Europe suggest that 768 million hectares of forest were affected by drought while 97 000 hectares were affected by wind damage from 1996 to 2001 (Figure 23) (EFI, 2017).
Number of countries with national and local disaster risk reduction strategies that include forest-based measuresDisaster risk reduction (DRR) is the concept and practice of systematic efforts to analyse and reduce the causal factors of disasters. Examples include limiting exposure to hazards, lessening the vulnerability of people and property, wise management of land and the environment, and improving preparedness and early warning for adverse events. The Sendai
FIGURE 21PERCENTAGE OF FOREST AREA AFFECTED BY DISASTERS
SOURCE: FAO, based on data from post-disaster needs assessments, 2003–2013.
TSUNAMIS
3.2
0
10
20
30
40
50
60
70
80
90
FLOODS
5.0
EARTHQUAKES
2.7
DROUGHTS
0.0
PERC
ENTA
GE
STORMS
89.1
Framework for Disaster Risk Reduction 2015–2030 invites countries to report on whether they have prepared a National Disaster Risk Reduction Strategy and whether DRR is an integral objective of environment-related policies and plans.
According to these reports, 133 countries have developed national DRR strategies, 102 of which indicated that they include ecosystem-based DRR measures that may cover forests. Forest-based measures include reforestation and rehabilitation of degraded areas, particularly on slopes through terracing interventions to prevent erosion and landslides, afforestation to mitigate f loods, mangrove conservation and restoration in coastal areas to protect against cyclones and tsunamis, and integrated fire and pest management. In addition to concrete plans for measures on the ground, some countries indicated that Disaster Risk Management (DRM) was integrated into
| 54 |
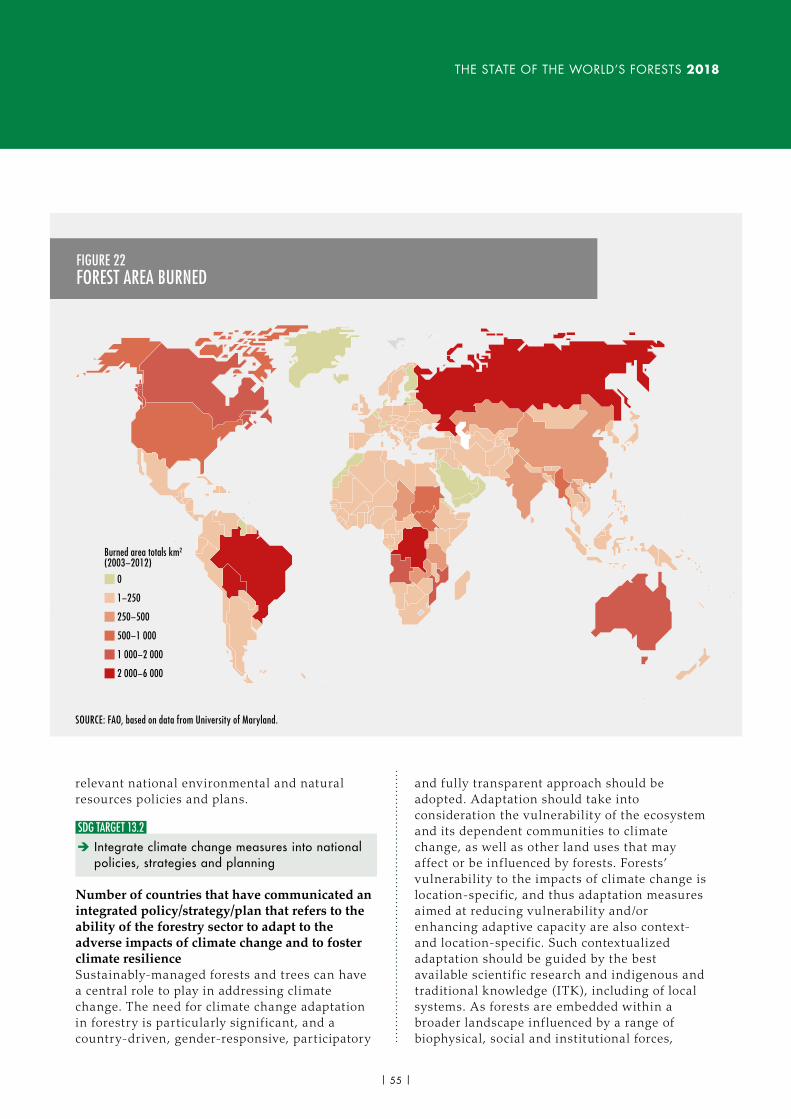
THE STATE OF THE WORLD’S FORESTS 2018
relevant national environmental and natural resources policies and plans.
SDG TARGET 13.2 è Integrate climate change measures into national policies, strategies and planning
Number of countries that have communicated an integrated policy/strategy/plan that refers to the ability of the forestry sector to adapt to the adverse impacts of climate change and to foster climate resilienceSustainably-managed forests and trees can have a central role to play in addressing climate change. The need for climate change adaptation in forestry is particularly significant, and a country-driven, gender-responsive, participatory
and fully transparent approach should be adopted. Adaptation should take into consideration the vulnerability of the ecosystem and its dependent communities to climate change, as well as other land uses that may affect or be inf luenced by forests. Forests’ vulnerability to the impacts of climate change is location-specific, and thus adaptation measures aimed at reducing vulnerability and/or enhancing adaptive capacity are also context- and location-specific. Such contextualized adaptation should be guided by the best available scientif ic research and indigenous and traditional knowledge (ITK), including of local systems. As forests are embedded within a broader landscape inf luenced by a range of biophysical, social and institutional forces,
FIGURE 22FOREST AREA BURNED
0
1−250
250−500
500−1 000
1 000−2 000
2 000−6 000
Burned area totals km2 (2003−2012)
SOURCE: FAO, based on data from University of Maryland.
| 55 |
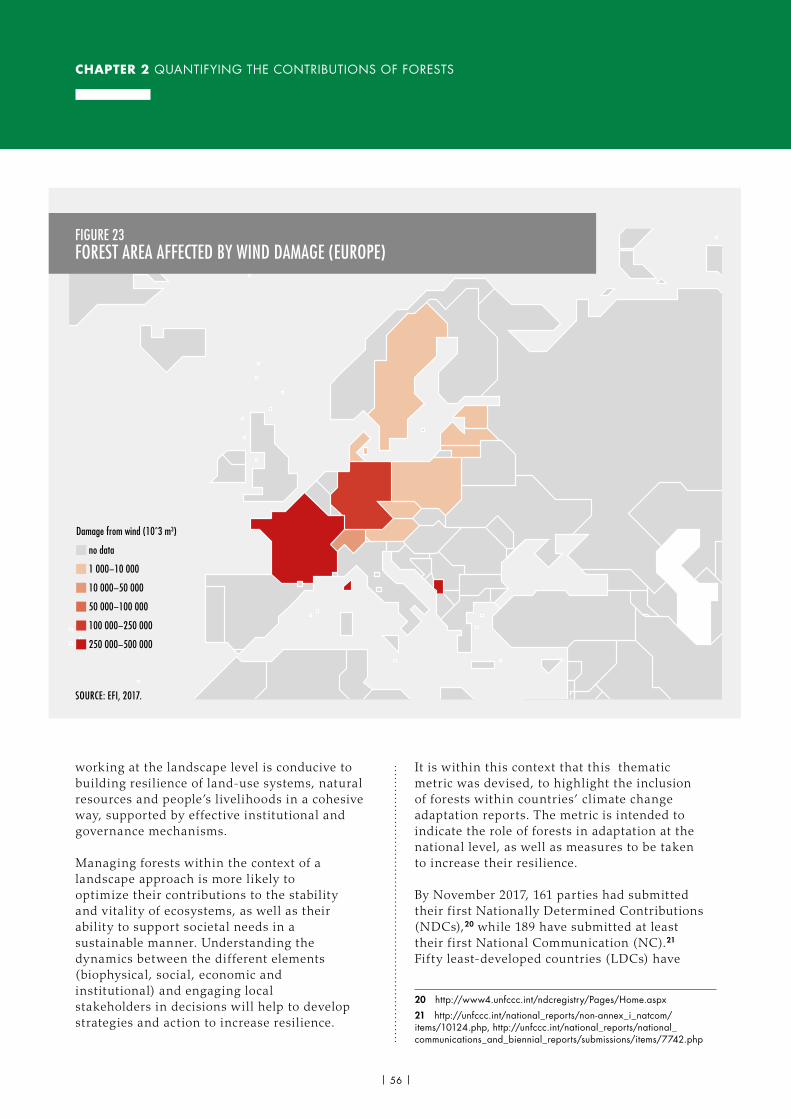
CHAPTER 2 QUANTIFYING THE CONTRIBUTIONS OF FORESTS
working at the landscape level is conducive to building resilience of land-use systems, natural resources and people’s livelihoods in a cohesive way, supported by effective institutional and governance mechanisms.
Managing forests within the context of a landscape approach is more likely to optimize their contributions to the stability and vitality of ecosystems, as well as their ability to support societal needs in a sustainable manner. Understanding the dynamics between the different elements (biophysical, social, economic and institutional) and engaging local stakeholders in decisions will help to develop strategies and action to increase resilience.
It is within this context that this thematic metric was devised, to highlight the inclusion of forests within countries’ climate change adaptation reports. The metric is intended to indicate the role of forests in adaptation at the national level, as well as measures to be taken to increase their resilience.
By November 2017, 161 parties had submitted their f irst Nationally Determined Contributions (NDCs),20 while 189 have submitted at least their f irst National Communication (NC).21 Fifty least-developed countries (LDCs) have
20 http://www4.unfccc.int/ndcregistry/Pages/Home.aspx
21 http://unfccc.int/national_reports/non-annex_i_natcom/items/10124.php, http://unfccc.int/national_reports/national_communications_and_biennial_reports/submissions/items/7742.php
SOURCE: EFI, 2017.
FIGURE 23FOREST AREA AFFECTED BY WIND DAMAGE (EUROPE)
Damage from wind (10ˆ3 m3)
no data
1 000−10 000
10 000−50 000
50 000−100 000
100 000−250 000
250 000−500 000
| 56 |
THE STATE OF THE WORLD’S FORESTS 2018
submitted National Adaptation Programmes of Action (NAPAs) and seven developing countries have submitted their National Adaptation Plans (NAPs).
A review of the documents indicated that at least 120 countries mentioned forestry in their submissions, with many of these committing to enhancing the resilience of forests. Although detailed information on specific measures is lacking, they included forest protection, reforestation, and agroforestry. Countries with coastal zones all indicated that mangrove restoration and protection was a top priority to protect those areas from storm surges. Capacity development on appropriate forest management measures for climate change adaptation was reported as a key need, particularly in developing countries. However, the importance of forests for climate change adaptation is not clearly ref lected in all country reporting. For example, there are cases where countries with substantial forest area do not indicate the role of forests in adaptation, such as Colombia and the United States of America.
SDG TARGET 13.3 è Improve education, awareness-raising and human and institutional capacity on climate change mitigation, adaptation, impact reduction and early warning
Number of countries that have integrated forest-related mitigation, adaptation, impact reduction and early warning into primary, secondary and tertiary curriculaClimate change education (CCE) is an essential component of climate action, helping young people understand and address the impacts of and adapt to climate change-related trends. More specifically, CCE is focused on learning about the causes and effects of climate change, as well as possible responses from a cross-curricular and multidisciplinary perspective. It includes mitigation and adaptation, with the aim of promoting climate-resilient development. The importance of CCE has been recognized at the international level, and Article 6 of the UNFCCC encourages Parties to promote, develop and implement educational programmes on climate change and its effects as an integrated component of school curricula at all levels.
Through NDCs and NCs, the UNFCCC requires countries to report on the status of CCE and is the main source of information for this assessment. Other sources include the United Nations Educational, Scientif ic and Cultural Organization (UNESCO) (where countries report on Education for Sustainable Development, including climate change), the Global Forest Information Service and the Global Alliance for Disaster Risk Reduction and Resilience in the Education Sector.
Only 21 countries reported the existence of education programmes that cover climate change impacts, mitigation and adaptation, or that there was a mid-term target to integrate forestry into climate change education programmes.22
However, there was more information regarding climate change public awareness campaigns that include forests, with almost all countries reporting that the role of forests in climate change adaptation and mitigation was included their campaigns.
SDG Protect, restore and promote sustainable use of terrestrial ecosystems, sustainably manage forests, combat desertification, and halt and reverse land degradation and halt biodiversity loss
IntroductionThe role of forests in maintaining ecosystem functions and environmental services is recognized in SDG15, which makes explicit reference to forests and their sustainable management. Forests and trees constitute an integral part of the global mosaic of landscapes and ecosystems, from tree-dotted savannahs and open woodlands to dense tropical forests and vast boreal forests. They interact with other living organisms, with soil, water and the atmosphere, and provide a wide range of goods and services that are important for society.
22 The data were extracted from National Communications submitted to the UNFCCC. Available at https://unfccc.int/process-and-meetings/transparency-and-reporting/reporting-and-review-under-the-convention/national-communications-and-biennial-update-reports-non-annex-i-parties/national-communication-submissions-from-non-annex-i-parties.
| 57 |
CHAPTER 2 QUANTIFYING THE CONTRIBUTIONS OF FORESTS
The world had almost 4 billion hectares of forests in 2015. Despite a decrease in forest area over the last 25 years, the rate of forest area net loss was reduced by 50 percent between 1990–2000 and 2010–2015. Natural forests account for 93 percent (or 3.7 billion hectares) of the total forest area. The amount of planted forests has increased by over 105 million hectares since 1990, but the rate of increase has slowed since 2010 due to decreased planting in Eastern Asia, Europe, North America, and South and Southeast Asia (FAO, 2015a).
Interest in the world’s forests has grown with increased awareness of their role in the global carbon cycle. As discussed in the section on SDG13, forests are seen as a natural weapon against global warming due to their ability to mitigate and adapt to climate change by reducing the carbon emissions caused by deforestation and forest degradation, and by increased carbon uptake (SDG13) through afforestation and sustainable forest management. The world’s forests store an estimated 296 gigatonnes of carbon in both above- and below-ground biomass (FAO, 2015a), but they are much more than that: tropical forests alone host at least two-thirds of terrestrial species (Gardner et al., 2009) and other types of forest are species-rich ecosystems in their own contexts (Millennium Ecosystem Assessment Board, 2005). Forests are among the most important repositories of biodiversity and their sustainable management is essential not only for conservation, but also for sustaining ecosystem functioning and thereby the continued and healthy provision of ecosystem services such as food production. The critical role that forests and trees play in the hydrological cycle is highlighted in the section on SDG6. Forests also have protective functions as they reduce erosion and the risk of landslides, f loods and droughts, and prevent desertif ication and salinization. The socio-economic importance of forests is assessed in the sections on SDG1, SDG2, SDG7 and SDG8.
Quantifying how forests and trees contribute to SDG15
SDG TARGET 15.1 è By 2020, ensure the conservation, restoration and sustainable use of terrestrial and inland freshwater ecosystems and their services, in particular forests, wetlands, mountains and drylands, in line with obligations under international agreements
SDG Indicator 15.1.1: Forest area as a proportion of total land areaMeasuring forest area as a proportion of total land area tracks forest losses and gains and helps to guide policy measures for conservation and restoration. Data for this indicator are collected by FAO’s Global Forest Resources Assessment (FRA) (FAO, 2015a). The latest assessment, FRA 2015, indicates that the world is still losing forests. Between 1990 and 2015, the world’s forest area decreased from 31.6 percent of the global land area to 30.6 percent, but the pace of loss has slowed down in recent years.
The loss of forests occurs mainly in developing countries, particularly in sub-Saharan Africa, Latin America and Southeast Asia. As populations increase and forest land is converted for agriculture and other uses, forest area is declining in every climatic domain except temperate ones.
In some parts of Asia, North America and Europe, forest area has increased since 1990 (Figure 24) due to large-scale afforestation programmes in several countries, as well as the natural reversion of low-productive agricultural land back to forest.
The restoration of forests and landscapes is part of global efforts to reverse forest cover loss. One of the Global Forest Goals of the UN Strategic Plan for Forests aims to reverse the loss of forest cover and increase forest area by 3 percent worldwide by 2030. The New York Declaration on Forests endorsed calls to cut natural forest loss in half by 2020, and to end it by 2030. Forest and landscape restoration (FLR) contributes to the restoration of degraded forest, and more generally to combatting land degradation (SDG
| 58 |
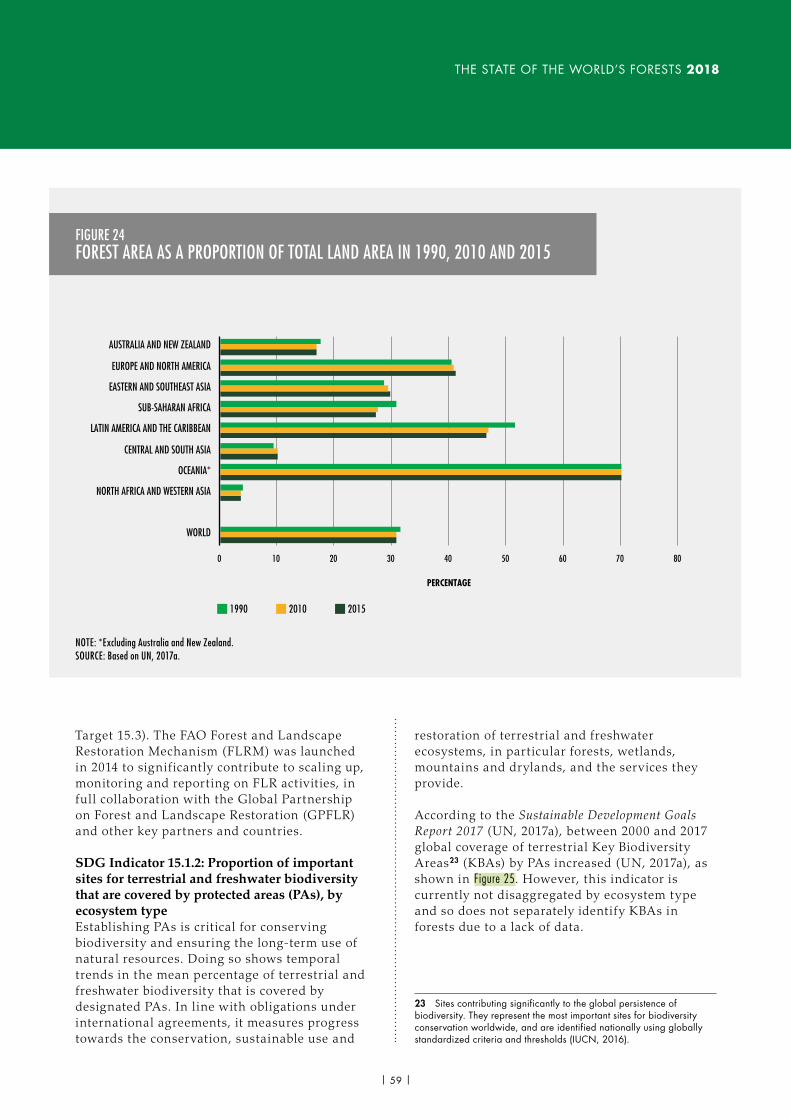
THE STATE OF THE WORLD’S FORESTS 2018
Target 15.3). The FAO Forest and Landscape Restoration Mechanism (FLRM) was launched in 2014 to significantly contribute to scaling up, monitoring and reporting on FLR activities, in full collaboration with the Global Partnership on Forest and Landscape Restoration (GPFLR) and other key partners and countries.
SDG Indicator 15.1.2: Proportion of important sites for terrestrial and freshwater biodiversity that are covered by protected areas (PAs), by ecosystem typeEstablishing PAs is critical for conserving biodiversity and ensuring the long-term use of natural resources. Doing so shows temporal trends in the mean percentage of terrestrial and freshwater biodiversity that is covered by designated PAs. In line with obligations under international agreements, it measures progress towards the conservation, sustainable use and
restoration of terrestrial and freshwater ecosystems, in particular forests, wetlands, mountains and drylands, and the services they provide.
According to the Sustainable Development Goals Report 2017 (UN, 2017a), between 2000 and 2017 global coverage of terrestrial Key Biodiversity Areas23 (KBAs) by PAs increased (UN, 2017a), as shown in Figure 25. However, this indicator is currently not disaggregated by ecosystem type and so does not separately identify KBAs in forests due to a lack of data.
23 Sites contributing significantly to the global persistence of biodiversity. They represent the most important sites for biodiversity conservation worldwide, and are identified nationally using globally standardized criteria and thresholds (IUCN, 2016).
FIGURE 24FOREST AREA AS A PROPORTION OF TOTAL LAND AREA IN 1990, 2010 AND 2015
1990 2010 2015
0 10 20 30 40 50 60 70 80
WORLD
NORTH AFRICA AND WESTERN ASIA
OCEANIA*
CENTRAL AND SOUTH ASIA
LATIN AMERICA AND THE CARIBBEAN
SUB-SAHARAN AFRICA
EASTERN AND SOUTHEAST ASIA
EUROPE AND NORTH AMERICA
AUSTRALIA AND NEW ZEALAND
PERCENTAGE
NOTE: *Excluding Australia and New Zealand.SOURCE: Based on UN, 2017a.
| 59 |
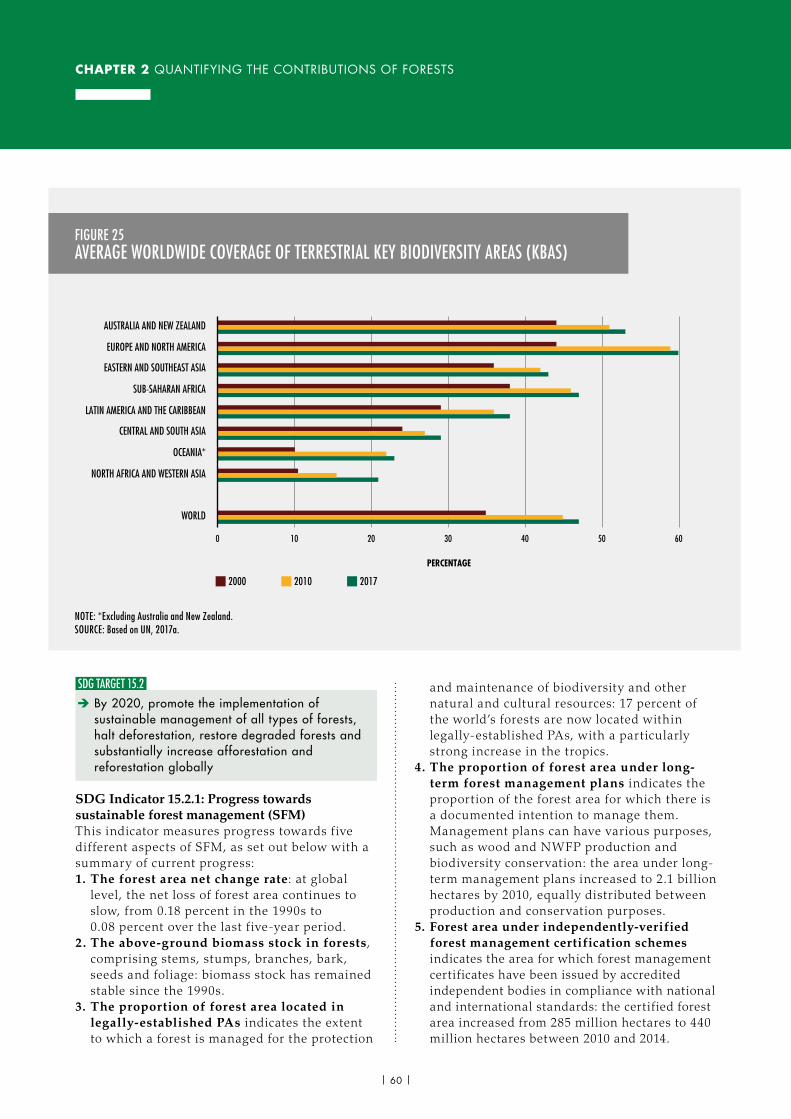
CHAPTER 2 QUANTIFYING THE CONTRIBUTIONS OF FORESTS
SDG TARGET 15.2 è By 2020, promote the implementation of sustainable management of all types of forests, halt deforestation, restore degraded forests and substantially increase afforestation and reforestation globally
SDG Indicator 15.2.1: Progress towards sustainable forest management (SFM)This indicator measures progress towards f ive different aspects of SFM, as set out below with a summary of current progress:1. The forest area net change rate: at global
level, the net loss of forest area continues to slow, from 0.18 percent in the 1990s to 0.08 percent over the last f ive-year period.
2. The above-ground biomass stock in forests, comprising stems, stumps, branches, bark, seeds and foliage: biomass stock has remained stable since the 1990s.
3. The proportion of forest area located in legally-established PAs indicates the extent to which a forest is managed for the protection
and maintenance of biodiversity and other natural and cultural resources: 17 percent of the world’s forests are now located within legally-established PAs, with a particularly strong increase in the tropics.
4. The proportion of forest area under long-term forest management plans indicates the proportion of the forest area for which there is a documented intention to manage them. Management plans can have various purposes, such as wood and NWFP production and biodiversity conservation: the area under long-term management plans increased to 2.1 billion hectares by 2010, equally distributed between production and conservation purposes.
5. Forest area under independently-verified forest management certification schemes indicates the area for which forest management certificates have been issued by accredited independent bodies in compliance with national and international standards: the certified forest area increased from 285 million hectares to 440 million hectares between 2010 and 2014.
FIGURE 25AVERAGE WORLDWIDE COVERAGE OF TERRESTRIAL KEY BIODIVERSITY AREAS (KBAS)
NOTE: *Excluding Australia and New Zealand.SOURCE: Based on UN, 2017a.
2000 2010 2017
PERCENTAGE
0 10 20 30 40 50 60
WORLD
NORTH AFRICA AND WESTERN ASIA
OCEANIA*
CENTRAL AND SOUTH ASIA
LATIN AMERICA AND THE CARIBBEAN
SUB-SAHARAN AFRICA
EASTERN AND SOUTHEAST ASIA
EUROPE AND NORTH AMERICA
AUSTRALIA AND NEW ZEALAND
| 60 |
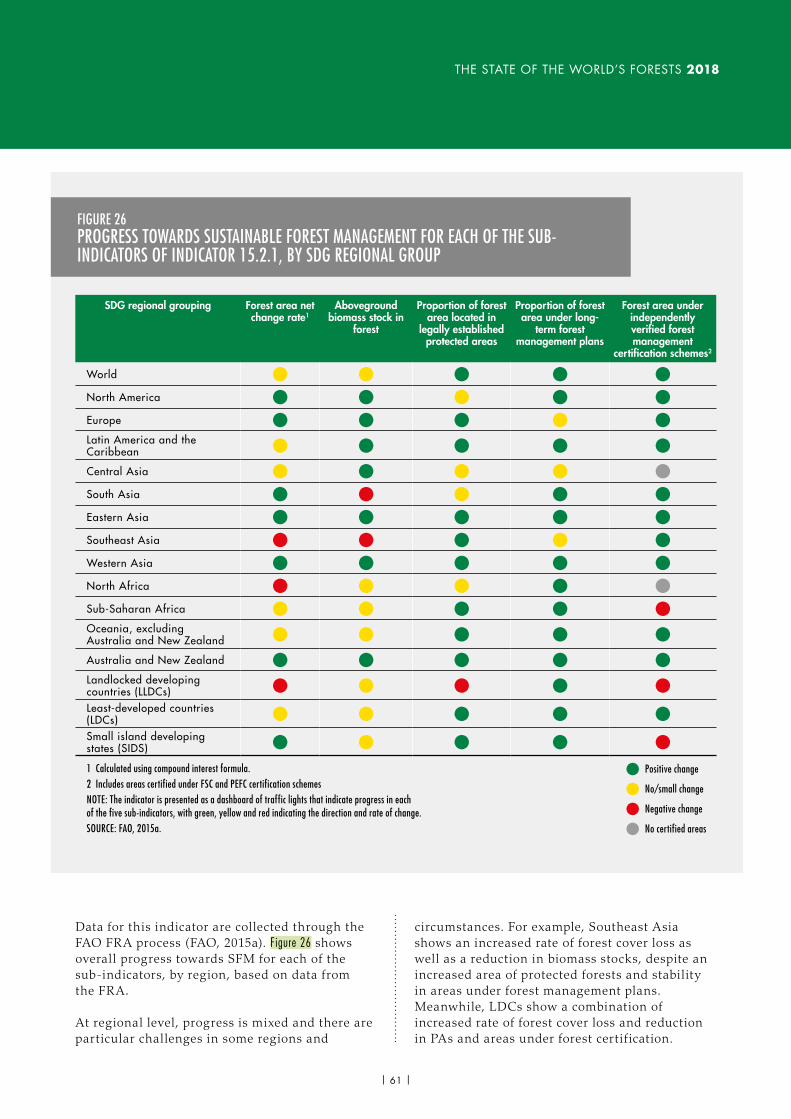
THE STATE OF THE WORLD’S FORESTS 2018
Data for this indicator are collected through the FAO FRA process (FAO, 2015a). Figure 26 shows overall progress towards SFM for each of the sub-indicators, by region, based on data from the FRA .
At regional level, progress is mixed and there are particular challenges in some regions and
circumstances. For example, Southeast Asia shows an increased rate of forest cover loss as well as a reduction in biomass stocks, despite an increased area of protected forests and stability in areas under forest management plans. Meanwhile, LDCs show a combination of increased rate of forest cover loss and reduction in PAs and areas under forest certif ication.
FIGURE 26PROGRESS TOWARDS SUSTAINABLE FOREST MANAGEMENT FOR EACH OF THE SUB-INDICATORS OF INDICATOR 15.2.1, BY SDG REGIONAL GROUP
SDG regional grouping Forest area net change rate1
Aboveground biomass stock in
forest
Proportion of forest area located in
legally established protected areas
Proportion of forest area under long-
term forest management plans
Forest area under independently verified forest management
certification schemes2
World � � � � �North America � � � � �Europe � � � � �Latin America and the Caribbean � � � � �Central Asia � � � � �South Asia � � � � �Eastern Asia � � � � �Southeast Asia � � � � �Western Asia � � � � �North Africa � � � � �Sub-Saharan Africa � � � � �Oceania, excluding Australia and New Zealand � � � � �Australia and New Zealand � � � � �Landlocked developing countries (LLDCs) � � � � �Least-developed countries (LDCs) � � � � �Small island developing states (SIDS) � � � � �1 Calculated using compound interest formula.2 Includes areas certified under FSC and PEFC certification schemesNOTE: The indicator is presented as a dashboard of traffic lights that indicate progress in each of the five sub-indicators, with green, yellow and red indicating the direction and rate of change.SOURCE: FAO, 2015a.
�Positive change
�No/small change
�Negative change
�No certified areas
| 61 |
CHAPTER 2 QUANTIFYING THE CONTRIBUTIONS OF FORESTS
SDG TARGET 15.3 è By 2030, combat desertification, restore degraded land and soil, including land affected by desertification, drought and floods, and strive to achieve a land degradation-neutral world
Proportion of forest that is degraded over total forest areaForest degradation is an important aspect of SDG15 and can be a precursor to further forest loss. However, assessing forest degradation is technically challenging as it is diff icult to detect consistently through remote sensing. Nonetheless, several initiatives are already ongoing at country level.
Land degradation neutrality (LDN), was introduced as a way to stimulate a more effective policy response to land degradation (Cowie et al., 2017). Restoration of degraded lands is the underlying concept of LDN to be achieved by 2030, and landscape restoration and reforestation emerged as top priorities in the NDCs of 140 countries. The Bonn Challenge aims to restore 150 million hectares of the world’s deforested and degraded land by 2020, and 350 million hectares by 2030, and Aichi Target 15 of the Convention on Biological Diversity calls for restoring 15 percent of world’s degraded ecosystems by 2020.
At regional level, initiatives such as the Agadir Commitment aim to improve forest and landscape restoration (FLR) efforts in the Mediterranean region by restoring at least 8 million hectares by 2030. The Initiative 20x20 wants to bring 20 million hectares of degraded land in Latin America and the Caribbean into restoration by 2020, and the Great Green Wall for the Sahara and the Sahel Initiative aims to support six African countries – Burkina Faso, Ethiopia, the Gambia, Niger, Nigeria and Senegal – with large-scale restoration of production landscapes affected by desertif ication and land degradation.
Through the REDD+ mechanism of the UNFCCC, developing countries are establishing policy measures and implementing action to measure and reduce forest degradation in order to quantify and reduce related CO2 emissions.
SDG TARGET 15.4 è By 2030, ensure the conservation of mountain ecosystems, including their biodiversity, in order to enhance their capacity to provide benefits that are essential for sustainable development
SDG Indicator 15.4.1: Coverage by protected areas of important sites for mountain biodiversityMuch of the biodiversity of mountain areas is in their forests, which cover a significant proportion of most mountain regions and represent 23 percent of the Earth’s forest cover (Price et al., 2011). Establishing PAs to safeguard important sites can stem the decline in biodiversity and ensure the sustainable use of mountains' natural resources, including forests.
Between 2000 and 2017, the average worldwide coverage of mountain KBAs covered by PAs increased from 39 percent to 49 percent, with the highest percentage in Australia and New Zealand (Figure 27). While this increase is encouraging, recent growth in KBAs covered by PAs has been modest, with an increase of only 1 to 2 percentage points since 2010 (UN, 2017a).
In the future, it is expected that the mountain biodiversity indicator will include separate information on different ecosystems (such as forests) but at present the necessary data are unavailable.
SDG Indicator 15.4.2: Mountain Green Cover IndexThe change in the proportion of green cover area to total mountain area can be measured by comparing these at two points in time using the Mountain Green Cover Index. Green coverage of mountain areas is the best proxy to measure the status of mountain ecosystems. In 2017, 76 percent of the world’s mountain areas were covered by some form of green vegetation, whether forests, shrubs, grassland or cropland (UN, 2017a). As shown in Figure 28, mountain green cover was lowest in Western Asia and North Africa (60 percent) and highest in Oceania (98 percent).24 At present only baseline data for the Mountain Green Cover Index are available, but there is a possibility that in future it will
24 http://www.fao.org/sustainable-development-goals/indicators/1542/en/
»
| 62 |
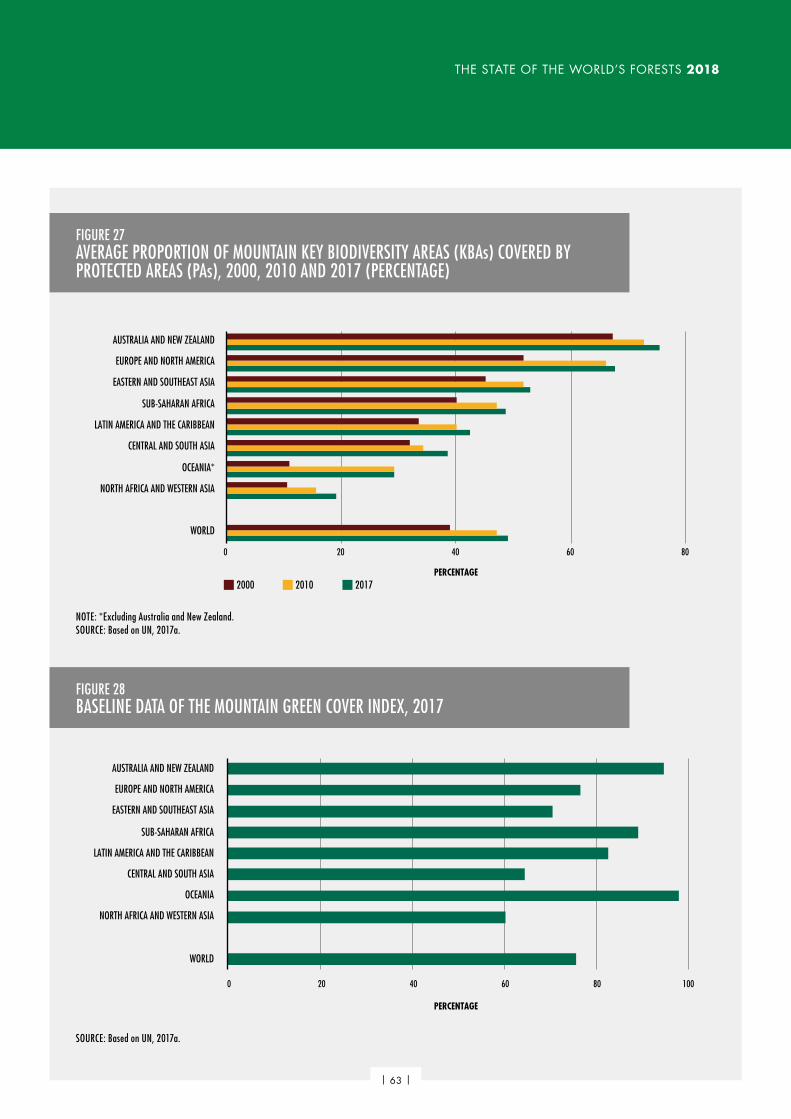
THE STATE OF THE WORLD’S FORESTS 2018
FIGURE 27AVERAGE PROPORTION OF MOUNTAIN KEY BIODIVERSITY AREAS (KBAs) COVERED BY PROTECTED AREAS (PAs), 2000, 2010 AND 2017 (PERCENTAGE)
NOTE: *Excluding Australia and New Zealand.SOURCE: Based on UN, 2017a.
2000 2010 2017PERCENTAGE
0 20 40 60 80
WORLD
NORTH AFRICA AND WESTERN ASIA
OCEANIA*
CENTRAL AND SOUTH ASIA
LATIN AMERICA AND THE CARIBBEAN
SUB-SAHARAN AFRICA
EASTERN AND SOUTHEAST ASIA
EUROPE AND NORTH AMERICA
AUSTRALIA AND NEW ZEALAND
FIGURE 28BASELINE DATA OF THE MOUNTAIN GREEN COVER INDEX, 2017
SOURCE: Based on UN, 2017a.
PERCENTAGE
0 20 40 60 80 100
WORLD
NORTH AFRICA AND WESTERN ASIA
OCEANIA
CENTRAL AND SOUTH ASIA
LATIN AMERICA AND THE CARIBBEAN
SUB-SAHARAN AFRICA
EASTERN AND SOUTHEAST ASIA
EUROPE AND NORTH AMERICA
AUSTRALIA AND NEW ZEALAND
| 63 |
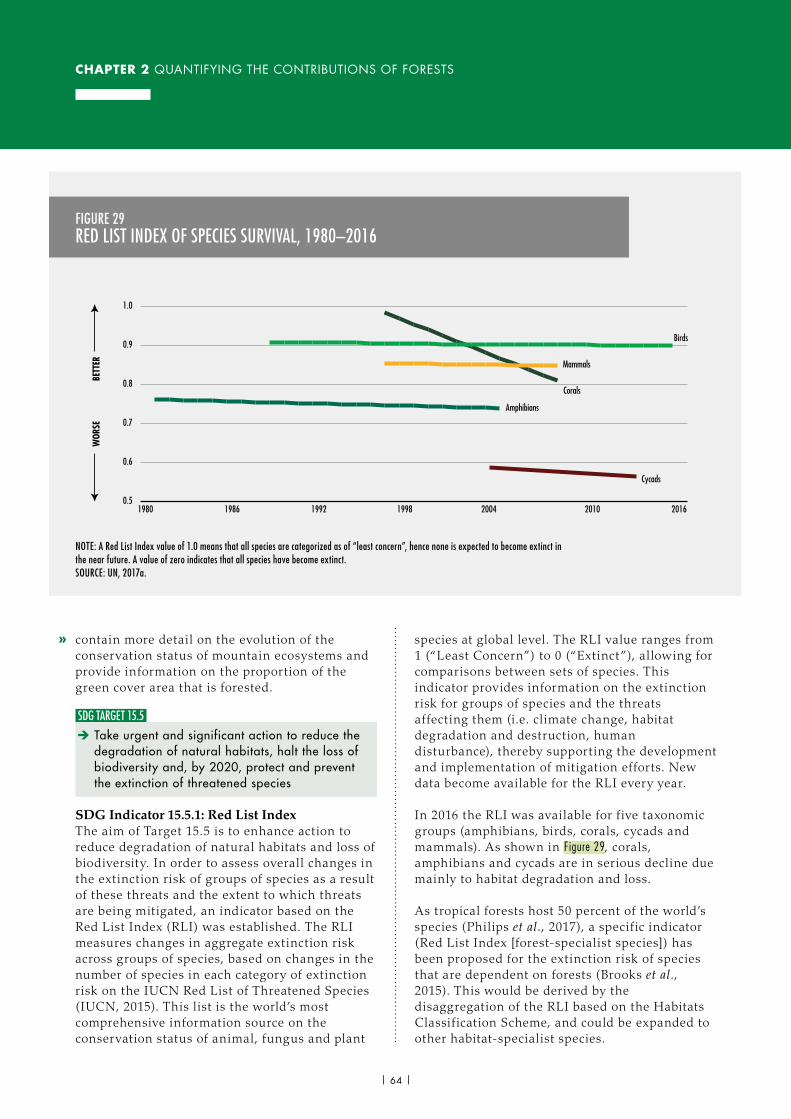
CHAPTER 2 QUANTIFYING THE CONTRIBUTIONS OF FORESTS
contain more detail on the evolution of the conservation status of mountain ecosystems and provide information on the proportion of the green cover area that is forested.
SDG TARGET 15.5 è Take urgent and significant action to reduce the degradation of natural habitats, halt the loss of biodiversity and, by 2020, protect and prevent the extinction of threatened species
SDG Indicator 15.5.1: Red List IndexThe aim of Target 15.5 is to enhance action to reduce degradation of natural habitats and loss of biodiversity. In order to assess overall changes in the extinction risk of groups of species as a result of these threats and the extent to which threats are being mitigated, an indicator based on the Red List Index (RLI) was established. The RLI measures changes in aggregate extinction risk across groups of species, based on changes in the number of species in each category of extinction risk on the IUCN Red List of Threatened Species (IUCN, 2015). This list is the world’s most comprehensive information source on the conservation status of animal, fungus and plant
species at global level. The RLI value ranges from 1 (“Least Concern”) to 0 (“Extinct”), allowing for comparisons between sets of species. This indicator provides information on the extinction risk for groups of species and the threats affecting them (i.e. climate change, habitat degradation and destruction, human disturbance), thereby supporting the development and implementation of mitigation efforts. New data become available for the RLI every year.
In 2016 the RLI was available for f ive taxonomic groups (amphibians, birds, corals, cycads and mammals). As shown in Figure 29, corals, amphibians and cycads are in serious decline due mainly to habitat degradation and loss.
As tropical forests host 50 percent of the world’s species (Philips et al., 2017), a specif ic indicator (Red List Index [forest-specialist species]) has been proposed for the extinction risk of species that are dependent on forests (Brooks et al., 2015). This would be derived by the disaggregation of the RLI based on the Habitats Classif ication Scheme, and could be expanded to other habitat-specialist species.
FIGURE 29RED LIST INDEX OF SPECIES SURVIVAL, 1980–2016
0.5
0.6
0.9
1.0
0.8
0.7
2016201020041998199219861980
Birds
Mammals
Corals
Amphibians
Cycads
WOR
SEBE
TTER
NOTE: A Red List Index value of 1.0 means that all species are categorized as of “least concern”, hence none is expected to become extinct in the near future. A value of zero indicates that all species have become extinct.SOURCE: UN, 2017a.
»
| 64 |
THE STATE OF THE WORLD’S FORESTS 2018
SDG TARGET 15.B è Mobilize significant resources from all sources and at all levels to finance sustainable forest management and provide adequate incentives to developing countries to advance such management, including for conservation and reforestation
Official development assistance (ODA) and public expenditure on conservation and sustainable use of forestsForests worldwide are exploited to generate revenue for the state, but compared to their contribution to GDP, public expenditure on forests is low, which contributes to deforestation and a loss of forest area (FAO, 2016a). The thematic metric proposed for SDG Target 15.b tracks public expenditure and ODA f lows to developing countries in order to quantify the effort that donors and governments invest in the conservation and sustainable use of forests.
In 2015, ODA disbursement on forestry was about USD 800 million, less than 1 percent of total ODA. Since 2000, the net ODA disbursement on forestry has increased, and is characterized by high annual variability. However, as shown in Figure 30, its proportion of total ODA has slightly decreased.
Figure 31 shows the main forest-related ODA donors and recipients. Between 2000 and 2015, Japan, European Union institutions and Germany provided over half of the total ODA amount. Globally, China and India are the two largest recipients, with almost 50 percent of ODA disbursement on forestry. n
2.3 INFORMATION AND DATA GAPS Section 2.2 assessed the contribution of forests and trees to achieving a selection of targets from ten SDGs. The analysis revealed a number of weaknesses and gaps related to (i) available knowledge, (ii) methodology and (iii) data availability and quality, which are highlighted here.
KnowledgeFurther research would help generate the knowledge necessary to improve understanding of the interlinkages between different SDGs and
forest contributions. This concerns in particular the following issues:
} geographic, gender and age distribution of the extreme poor; opportunities for forests to offer pathways out of poverty and measures needed to facilitate this (SDG1);
} the nutritional composition of NWFPs (SDG2);
} the impact on women’s participation in income-generating work of the transition of forest management from subsistence to the commercial domain; the exercise of formal rights by women; interventions that will increase women’s income from forests; women’s role in high-value chains and the net benefits they derive; economic empowerment, including women’s access to f inance and business knowledge to transform their engagement in harvesting forest products into viable businesses; and the effect of statutory tenure rights on customary practices regarding women (SDG5);
} quantif ication of the impacts of reforestation/restoration and of forest/tree cover loss/degradation on hydrology in different ecoregions, climate change scenarios and for various timescales. More consistent use of existing tools that are available would also help improve knowledge (SDG6);
} the economic importance of forest-based tourism (SDG8).
Methodology Quantif ication of forest contributions to the SDGs involves methodological challenges due to a lack of agreed definitions as well as disaggregated statistics and data sets. In several cases, the methodology for this analysis had to rely on literature, case studies, and assumptions, which can provide an overview of trends in contributions but not exact f igures. The following areas of concern and opportunities for improvement were highlighted:
} Assumptions that are made when the necessary information is not available can have strong effects on resulting estimates. For example, the use of average rural poverty rates where no country data exist, or the application of these averages to calculate the number of ‘forest poor’ where there is no information about poverty distribution, can lead to over- or underestimation of true poverty rates. (SDG1) »
| 65 |
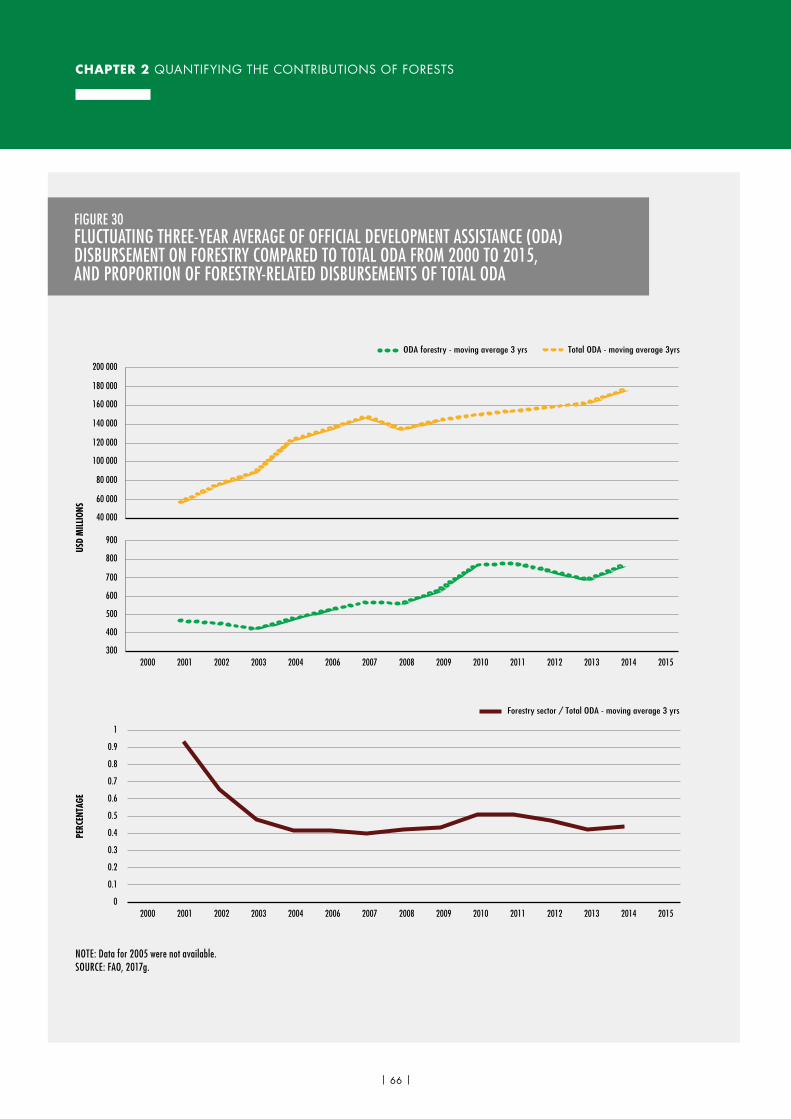
CHAPTER 2 QUANTIFYING THE CONTRIBUTIONS OF FORESTS
FIGURE 30FLUCTUATING THREE-YEAR AVERAGE OF OFFICIAL DEVELOPMENT ASSISTANCE (ODA) DISBURSEMENT ON FORESTRY COMPARED TO TOTAL ODA FROM 2000 TO 2015, AND PROPORTION OF FORESTRY-RELATED DISBURSEMENTS OF TOTAL ODA
NOTE: Data for 2005 were not available. SOURCE: FAO, 2017g.
Forestry sector / Total ODA - moving average 3 yrs
PERC
ENTA
GE
40 000
60 000
80 000
100 000
120 000
140 000
160 000
180 000
200 000
USD
MIL
LION
S
Total ODA - moving average 3yrs
300
400
500
600
700
800
900
ODA forestry - moving average 3 yrs
2014 20152013201220112010200920082007200620042003200220012000
0
0.1
0.2
0.3
0.4
0.5
0.6
0.7
0.8
0.9
1
2014 20152013201220112010200920082007200620042003200220012000
| 66 |
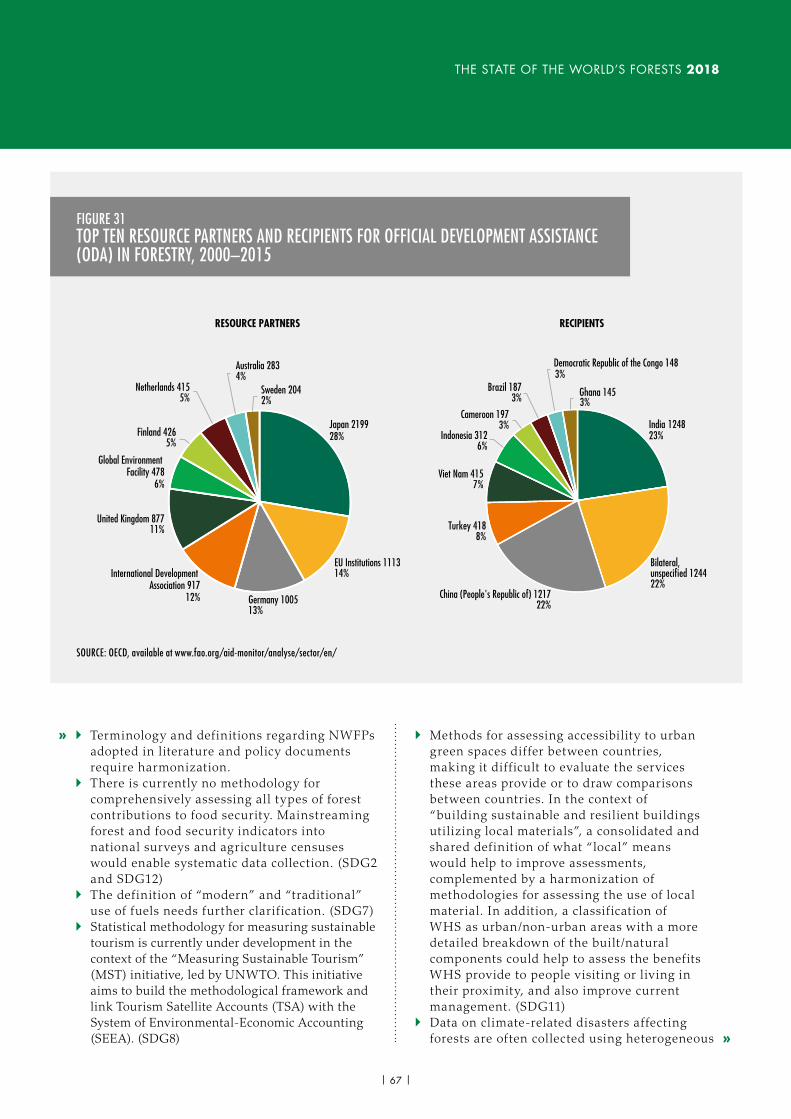
THE STATE OF THE WORLD’S FORESTS 2018
} Terminology and definitions regarding NWFPs adopted in literature and policy documents require harmonization.
} There is currently no methodology for comprehensively assessing all types of forest contributions to food security. Mainstreaming forest and food security indicators into national surveys and agriculture censuses would enable systematic data collection. (SDG2 and SDG12)
} The definition of “modern” and “traditional” use of fuels needs further clarif ication. (SDG7)
} Statistical methodology for measuring sustainable tourism is currently under development in the context of the “Measuring Sustainable Tourism” (MST) initiative, led by UNWTO. This initiative aims to build the methodological framework and link Tourism Satellite Accounts (TSA) with the System of Environmental-Economic Accounting (SEEA). (SDG8)
} Methods for assessing accessibility to urban green spaces differ between countries, making it diff icult to evaluate the services these areas provide or to draw comparisons between countries. In the context of “building sustainable and resilient buildings utilizing local materials”, a consolidated and shared definition of what “local” means would help to improve assessments, complemented by a harmonization of methodologies for assessing the use of local material. In addition, a classif ication of WHS as urban/non-urban areas with a more detailed breakdown of the built/natural components could help to assess the benefits WHS provide to people visiting or liv ing in their proximity, and also improve current management. (SDG11)
} Data on climate-related disasters affecting forests are often collected using heterogeneous
FIGURE 31TOP TEN RESOURCE PARTNERS AND RECIPIENTS FOR OFFICIAL DEVELOPMENT ASSISTANCE (ODA) IN FORESTRY, 2000–2015
SOURCE: OECD, available at www.fao.org/aid-monitor/analyse/sector/en/
India 124823%
Bilateral, unspecified 124422%
China (People's Republic of) 121722%
Turkey 4188%
Viet Nam 4157%
Indonesia 3126%
Cameroon 1973%
Brazil 1873%
Democratic Republic of the Congo 1483%
Ghana 1453%
Japan 219928%
EU Institutions 111314%
Germany 100513%
International Development Association 917
12%
United Kingdom 87711%
Global Environment Facility 478
6%
Finland 4265%
Netherlands 4155%
Australia 2834%
Sweden 2042%
RECIPIENTSRESOURCE PARTNERS
»
»
| 67 |
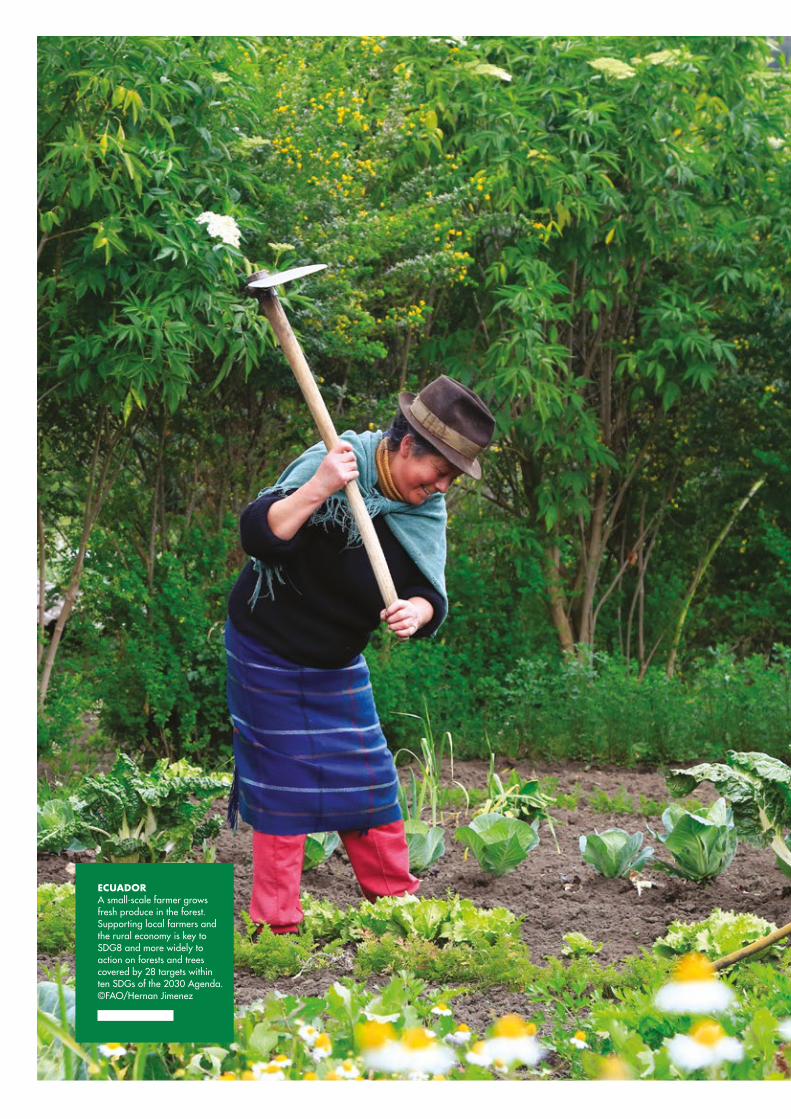
ECUADOR A small-scale farmer grows fresh produce in the forest. Supporting local farmers and the rural economy is key to SDG8 and more widely to action on forests and trees covered by 28 targets within ten SDGs of the 2030 Agenda.©FAO/Hernan Jimenez
THE STATE OF THE WORLD’S FORESTS 2018
approaches that may vary between countries. Including forests in national reporting on disasters and damage could facilitate comparisons and provide more complete datasets. (SDG13)
} The existence of multiple definitions of land and forest degradation is a challenge for producing the consistent and systematic assessments needed for SDG15. Harmonized definitions would facilitate developing methodologies for assessing forest and land degradation, taking into account different understandings of the concept (for example, in climate discussions degradation tends to refer to losses in carbon stocks, while for biodiversity it refers to loss of biodiversity). (SDG15)
Data availability and quality Data may be unavailable because they do not exist, are not accessible, or are not disaggregated in the required way. Other problems can include out-of-date data, inadequate time spans or frequency of observation, or insufficient spatial resolution. Where data are available, the quality may not be good enough for robust analysis due to inconsistencies, incompleteness or inaccuracies. Other common issues affecting the datasets used to assess the SDGs include: (i) lacking or inconsistent temporal and/or spatial information necessary for effective analysis and comparisons; (ii) heterogeneous definitions or methodologies, which can hinder systematic assessments; and (iii) a lack of regular data updates needed for long-term studies and to provide the most up-to-date information. Specific problems with data availability and quality encountered in the analysis include the following:
} Data about poverty, tenure and livelihoods are largely missing or unavailable at the required level of disaggregation (including gender and ethnicity). Geospatial poverty data at national or subnational level would allow for analysis of rural communities’ proximity to forests, their urbanization and migration patterns and the effects on rural areas. (SDG1)
} Disaggregation of NWFP data in terms of species, NWFP collector and user attributes
(infants, adults, women, the poor, indigenous groups, etc.), quantities, forest attributes (area, forest type, condition, distance from household), methods of collection, and nutritional composition would greatly improve the information base of the role and importance of NWFPs for local populations. Similarly, data on woodfuel dependence for cooking and sterilizing and on employment and income from forestry would be more useful if it were disaggregated by gender. National accounting systems (such as livelihood surveys and agriculture censuses) could incorporate more accurate reports of forest sector employment from different tenure types, such as national forests, community forests, private forests, agroforests, or farms. Little information is available at subnational, national or regional level on the use or share of income for food and fuel. More information about data quality related to forests’ contributions to SDG2 can be found in State of the World’s Forests 2014 (FAO, 2014). (SDG2)
} There is a general lack of data about: (i) the number of female employees in forestry, across various subsectors and industries, including the private and public sectors; (ii) the number of women participating in forestry education programmes, (ii i) the economic benefits of forests and trees for women. This makes it diff icult to assess women’s participation across all types and levels of forest governance or in the market value chain. In addition, data organized by gender would help to show the economic impact of decentralization on women. Country-level data and information could be strengthened in relation to gender and forestry by integrating relevant variables into the existing forestry, agriculture and natural resources databases maintained by ministries and national-level planning commissions – for example by including information on women in leadership positions, men and women employed in forestry, gender pay gaps in forestry, and the representation of women in forestry education. In order to demonstrate the value of forests for gender equality, more gender data would be needed at local, subnational, national and global scales. (SDG5)
»
| 69 |
CHAPTER 2 QUANTIFYING THE CONTRIBUTIONS OF FORESTS
} Limited data are available on forests managed for soil and water conservation, as these are often managed for other purposes as well. (SDG6)
} FAO statistics about forest products and trade are the main source of information for analysing forests’ contributions to SDG7. These datasets are based on Member States’ reports, but can have a heterogeneous quality and accuracy as surveys can be costly and are not conducted on a regular basis. Moreover, statistics on woodfuel production and consumption do not take into account the informal sector, where much of the production, marketing and sales take places. These conditions affect national assessments and are reflected in regional and global analyses. (SDG7)
} Official statistics from ILO provide information about informal employment but do not include explicit data on forest-related informal employment. Disaggregating data for forestry would provide for increased understanding of the role of forestry in poverty alleviation and economic growth. Also, data on nature-based tourism are not collected on a regular enough basis to allow for consistent datasets, and quantitative data on the share of protected-area tourism expenditure over total tourism GDP are of insufficient quality. (SDG8)
} While the value of green areas in urban contexts is widely acknowledged, the lack of information on their distribution and access makes it diff icult to estimate how the benefits are distributed. More consistent data on the accessibility of green spaces within urban areas would help achieve a more complete assessment of SDG11 thematic metrics. Limited availability of data linking city boundaries with public green areas, together with a lack of information about tree inventories in cities, strongly affects current assessments of the value of green spaces in urban areas. (SDG11)
} Data on NWFPs (production, consumption, trade, and resource availability) are incomplete for various reasons, and particularly because any activ ity is largely undertaken in the informal sector, so is not captured by official statistics. The most important types of data that would improve NWFP assessment are:
individual/household consumption of NWFPs; global material footprint of the forest sector; global data on the volume of certif ied wood coming from sustainably-managed forests; global data on certif ied wild, collected and marketed products. Other factors affecting data analysis relate to temporal and spatial features. For example, the datasets on adopting sustainable practices in the forest sector use different time frames. Similarly, information about the number of companies publishing sustainability reports is not consistently available, as data refer to different geographic areas: a common spatial reference would help to make these datasets comparable. (SDG12)
} Global, regional and national data about the impact of disasters on forests are very limited or incomplete. This includes global statistics on forest loss due to disasters, as well as the quantitative economic impacts of disasters on forestry and on the livelihoods and food security of forest-dependent communities. Another key feature largely missing from current datasets is the spatial component: this is essential for quantitative assessment of forest damage and effective implementation of mitigation policies. Remote sensing data could help improve current datasets and be used to complement national reports. (SDG13)
} There is an urgent need for regular updates of global data on forest area and other relevant parameters, as well as for generating longer time series of consistent data. Particular attention should be paid to analysis of afforestation, reforestation and the natural expansion of forests, as their reliable assessment may require long time periods. In addition, access to spatial data on KBAs by ecosystem type – in particular forests – would improve current understanding about the role of forests for that specif ic indicator. (SDG15)
Cross-cutting issues A number of the assessments prepared for section 2.2, including those for SDG1 and SDG13, highlighted the importance of building technical and managerial capacities in order to improve data availability and quality. At the same time, it is important that data collected by countries be made widely available to all those who need
| 70 |
THE STATE OF THE WORLD’S FORESTS 2018
access, rather than being contained in sectoral ministries or agencies.
While there are many datasets and studies for assessing biophysical variables, there are fewer that provide socio-economic data relating to forests and trees. Gaps in the availability of quality data restrict the capacity to develop and implement effective policies. These issues of data quality or availability are particularly significant where there are interlinkages between SDG targets, including woodfuel (e.g. SDGs 1, 2, 7 and 8), NWFPs (SDGs 1, 2, 8 and 12), forests’ role in gender equity (SDGs 1, 2, 5, 6, 7 and 8), the economic role of forests for people and their livelihoods (SDGs 1, 2, 5, 6, 7, 8 and 12), and for the informal sector (SDGs 1, 2, 5, 7, 8 and 12).
One of the most important challenges highlighted in the analysis of the SDGs is the provision of consistent data at global level to produce comparative studies and assessments.
Alignment of data collection with the SDGs should be ref lected in the design of censuses (for example agricultural censuses), in macroeconomic data collection and in resource valuation. As well as using standardized methods, regularity of data collection is important to allow comparability and assessment of progress. Organizations with global scope and capacity, such as FAO and the World Bank, can partner with international and regional research institutions to help develop comprehensive data collection frameworks and work closely with national governments to collect data. In addition to the technical issues discussed in this section, problems can arise from a lack of internationally agreed policies and definitions on some key forest-related environmental issues. In the absence of political agreement on definitions, methodologies are more likely to be unclear and heterogeneous, leading to inconsistencies in data quality. n
| 71 |
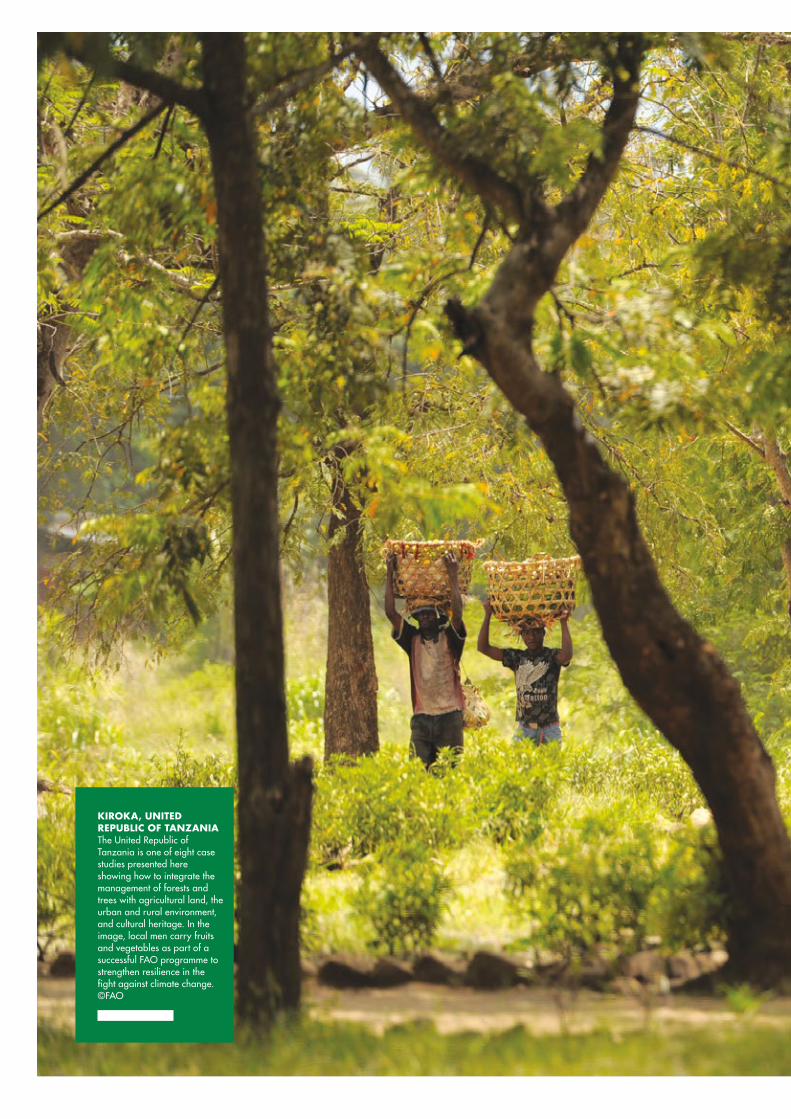
KIROKA, UNITED REPUBLIC OF TANZANIA The United Republic of Tanzania is one of eight case studies presented here showing how to integrate the management of forests and trees with agricultural land, the urban and rural environment, and cultural heritage. In the image, local men carry fruits and vegetables as part of a successful FAO programme to strengthen resilience in the fight against climate change.©FAO
CHAPTER 3WHAT DOES IT
TAKE TO ACHIEVE THE SDGS?
COUNTRY CASE STUDIES:
SUCCESSES AND CONSTRAINTS
3.1 INTRODUCTIONThe purpose of Chapter 3 is to draw on case studies from eight countries to examine the steps they have taken towards integrating their forest policies into broader sustainable development programmes or strategies.
It is important to emphasize that the case studies do not offer an account of how these countries have developed or implemented policies relating to the 2030 Agenda and its SDGs, as most of the activ ity reported took place before they were agreed in 2015. Care should therefore be taken in explicitly linking these policies with the SDGs. However, the case studies are valuable in suggesting the types of approaches that could be useful for countries as they face the challenge of developing and implementing policies, programmes and strategies aimed at achieving the SDGs. For example, the lessons learned can help to demonstrate the value of multistakeholder partnerships, which bring governments, the private sector, civ il society and individuals together in seeking to f ind new ways to realize their common goals and aspirations. They also illustrate the benefits of landscape-based approaches and the multiple services that forests and trees provide.
Furthermore, the case studies show that forests and trees have contributed to sustainable development under very different circumstances. The eight countries (including two regions within countries) vary widely in geography, climate, political systems, and social and cultural traditions, as well as income level. Thus the emphasis for each country depends on its specif ic challenges and priorities. The selected cases are not meant to be representative of all countries, nor are they
intended to paint a full picture either of forest management or of forests’ potential contribution to the SDGs in these countries. They do however provide illustrations of the progress that countries in a variety of situations have made towards sustainable development, and the challenges they have faced in practical implementation of their forest and woodland management programmes. The studies also demonstrate that priorities can change over time, and that trade-offs are needed across time and space, between different communities, sectors, types of benefits, and private and public goods. n
3.2 COUNTRY CASE STUDIESThe countries selected as case studies are Bolivia (Plurinational State of ) and Guatemala in Latin America; Burkina Faso and the United Republic of Tanzania in Africa; Nepal and the Republic of Korea in Asia; and Italy (Tuscany region) and the Russian Federation (Arkhangelsk region) in Europe. The case studies were prepared by national experts and summarized in a common format.
Three countries – Italy, the Russian Federation, and the Republic of Korea – now have largely urban populations, and although all the other countries are urbanizing, Burkina Faso, the United Republic of Tanzania and Nepal are still largely rural. Population growth rates are stabilizing or declining in all except Burkina Faso, Guatemala and the United Republic of Tanzania, where growth rates are still high. Forest area has stabilized or increased in Italy, the Republic of Korea, and the Russian Federation, but deforestation rates are still rapid in a number of countries, especially
CHAPTER 3
WHAT DOES IT TAKE TO ACHIEVE THE SDGS? COUNTRY CASE STUDIES: SUCCESSES AND CONSTRAINTS
| 74 |
THE STATE OF THE WORLD’S FORESTS 2018
Burkina Faso, Guatemala, and the United Republic of Tanzania.25
Bolivia (Plurinational State of)Bolivia (Plurinational State of ) is a sparsely populated, lower-middle-income country with an estimated population in 2017 of 10.9 million, 30 percent of whom live in rural areas. Its population growth is 1.5 percent per year. Forests cover 50.6 percent of the land area and largely comprise equatorial rainforest, concentrated in the Amazon basin. Deforestation rates are estimated at 0.34 percent per year. Agriculture, livestock, f ishing and forestry together contribute an estimated 13.7 percent of GDP (although this share is declining) and the contribution of tourism is estimated at 7 percent. The contribution of forests to GDP is estimated at between 2.2 to 3 percent. Wood is the main energy source for about 30 percent of the population. Poverty rates fell from 59 percent in 2000 to 39 percent in 2016 as the country has pursued equitable growth policies, which until recently had been facilitated by high commodity prices.
Sustainability is part of current development philosophy in the country, through an initiative entitled “The Rights of Mother Earth and the Paradigm of Living Well”. This philosophy highlights integration between forests, agriculture, and environmental sustainability, and its principles are incorporated into the most recent 2016–2020 Social and Economic Development Plan, in which forests are recognized as a resource for food production, biodiversity,
25 Data sources used in the case studies include the World Development Indicators (World Bank, 2017), the World Travel and Tourism Council (WTTC, 2017) and the 2015 Global Forest Resources Assessment (FAO, 2015a) as well as country-specific information cited in the online case study summaries.
economic development and climate resilience. Bolivia (Plurinational State of) is committed to expanding its food production and exports, to allocating productive land to smallholder indigenous people and to managing forests sustainably and equitably for food, non-food and timber production, as well as for regulatory and cultural services. As part of its development strategy, the Government’s policy is to expand agricultural area – mostly to smallholders – while managing forests sustainably for multipurpose use and stabilizing forest area at no less than 50 percent of total land area. A number of incentive programmes support these objectives: cross-sectoral platforms exist to bring different stakeholders and funding mechanisms together and strengthen local municipal capacity in natural resource management. In addition, programmes are underway to support the role of forests in watershed management. In relation to climate change, Bolivia has developed a Joint Mitigation and Adaptation Mechanism for the Integrated and Sustainable Management of Forests (in Spanish: Mecanismo conjunto de mitigación y adaptación para el manejo integral y sustentable de los bosques).
Boliv ia (Plurinational State of ) has emphasized indigenous people’s rights to land over the last ten years and favoured redistributive policies. These have been largely successful, but there are technical and capacity constraints which in some cases have contributed to resource degradation. Small-scale land owners are in the process of successfully partnering with larger-scale private enterprises to increase productivity and value-chain development. While in the past productive forest land was allocated mostly through large-scale concessions, Bolivia (Plurinational State of ) is now implementing a strategy to hand over forest-use rights to smallholders. Large numbers of smallholders without land titles have moved into the
| 75 |
CHAPTER 3 WHAT DOES IT TAKE TO ACHIEVE THE SDGS? COUNTRY CASE STUDIES
lowlands over the last ten years, and the Government has provided amnesties for il legal deforestation, on the condition that households implement integrated agroforestry or food production and forest restoration programmes. The Government is also supporting the development of integrated forest and land management plans for rural communities.
Successes in realizing the potential contribution of forests for sustainable development are due to the formal commitment of Bolivia (Plurinational State of ) to integrating agriculture, forestry and environmentally sustainable management into its key development goals. Challenges include managing the trade-off between short-term revenue needs and the longer-term productivity of agricultural and forest land. Solutions include forest management practices that incorporate short-cycle production of crops, such as Brazil nuts, native palm fruits and oil, nut products and honey with longer-cycle timber production. Small-scale land users would benefit from more technical and communications support adapted to their needs. There is also scope for linking together the country’s rich cultural and natural heritage to expand the role of tourism and recreation, both as a source of employment and growth and as an incentive for sustainable natural resource management.
Burkina FasoBurkina Faso is a low-income country with a population in 2017 of 19.3 million, 70 percent of whom live in rural areas. Its population growth is 3.1 percent per year. GDP growth rates average 5 percent per year and the poverty rate fell from 46 percent in 2009 to 40.1 percent in 2015. Forests cover 19.6 percent of the land area. Rainfall is increasingly variable and periods of extreme heat are becoming more frequent, making the country vulnerable to both droughts and f loods. Nearly 80 percent of the population is involved in agriculture, including livestock and forestry. Forestry accounts for 5.9 percent of GDP, of which 90 percent relates to woodfuel. Deforestation is estimated at 0.9 percent per year, attributed mainly to the expansion of subsistence-based agricultural land, including post-harvest and pre-clearance burning and
overgrazing. Large parts of Burkina Faso are wooded savannah land, with scattered trees that provide multiple benefits such as shade, livestock fodder, water retention, soil stabilization, and production of woodfuel, timber and NWFPs (including gum arabic, Balanite oil, honey, Bombax f lowers, Baobab leaves, wild fruits and medicinal plants).
Community-managed forests and woodland regeneration have played an important role in Burkina Faso since the droughts and famines of the early 1980s, when the concept of “the three struggles” (against bush fires, uncontrolled grazing and uncontrolled cutting of wood) was first articulated during the revolutionary period. Adopted in 1992, the Constitution emphasizes the importance of sustainable natural resource management, which has been a priority in national programmes since then. Most recently, the 2016–2020 National Economic and Social Development Strategy highlighted the key role that forests and woodlands play in poverty reduction and local well-being. In 2012 Burkina Faso developed a national strategy and action plan for the implementation of Africa’s Great Green Wall, a regional initiative that aims to halt desertification and land degradation across the Sahel.
Burkina Faso’s planning processes integrate forests, woodlands, pastures and agricultural land management through agroforestry systems within decentralized governance. Land management, forestry and environmental laws all acknowledge the importance of integrated management of agricultural, woodland and pastoral landscapes, and there is a permanent inter-ministerial coordination committee on this. As a result of decentralization processes, communities have a major role in landscape restoration. Village nurseries provide good quality planting material for fuelwood and multi-purpose land restoration, and the National Centre for Forest Seed Production supports nearly 1 300 village nurseries. Meanwhile, a national land management programme covers almost all 8 000 villages in the country. Its activ ities include financing microprojects for community development, capacity-building and support for sustainable land management through measures such as soil stabilization, water conservation and woodland enrichment.
| 76 |
THE STATE OF THE WORLD’S FORESTS 2018
Despite capacity and resource constraints, Burkina Faso has succeeded in integrating sustainable forest and land-use management into its development processes. Success factors include a long-term commitment to natural resource management, legislation that conforms to local traditions, improved land rights for local communities, land restoration programmes that recognize those rights, inter-ministerial coordination, and synergy with international conventions. Constraints include high – albeit declining – overall poverty levels and a lack of economic opportunities, increasing weather and climate challenges, and inadequate forest management information systems. Burkina Faso is working with UNCCD on developing measurement indices for SDG15 Target 3 on land degradation neutrality. Further work is needed on quantitative tools for measuring progress, adapting programmes to particular ecological subregions, and assessing the benefits of land restoration, including the long-term benefits provided by forests and trees for climate protection, carbon sequestration, and soil health.
GuatemalaGuatemala is a lower-middle-income country with a population of 16.9 million in 2017, nearly half of whom live in rural areas. Its population growth is 2.5 percent per year. Forests cover 33 percent of land area; it has mixed landscapes in the uplands with interspersed trees, crops and arable land, and dense tropical forest with larger-scale agriculture in the lowlands. Guatemala is exceptionally rich in biodiversity and 70 percent of forest land comes under some form of protection. Although Guatemala is experiencing solid economic growth, poverty rates remain high and are not falling: they were estimated at 56 percent in 2000 and had risen to 59 percent in 2015. Travel and tourism account for 8 percent of GDP, and agriculture (including forestry) for 10.7 percent. Forestry accounts for 2.5 percent of GDP, but this f igure excludes NWFPs, woodfuel and the public goods values of regulating services such as watershed protection. Deforestation rates averaged 1.43 percent per year from 1990–2000 and 1 percent per year from 2000–2010. The main causes were extensive livestock-rearing, expansion of palm oil and sugar cane, and illegal timber and firewood
harvesting (70 percent of Guatemalans use woodfuel for cooking). It is estimated that about 35 percent of tree cutting is il legal, used mostly in small sawmills and by households.
Guatemala’s national strategy (the 2032 K’atun Plan) supports sustainable development. Within this framework, forest and woodland resources are recognized as key to sustainable urban and rural development and to economic and environmental stability. The plan states that forests have three purposes: (i) climate change mitigation and adaptation; (ii) conservation and sustainable use of forests and biodiversity, maintaining forest cover at 32 percent (of which 29 percent under natural forest and 3 percent under plantation); and (iii) water resource protection. There are programmes aimed at managing PAs, transferring forest management capacities to municipalities, and increasing forest cover. There is also a Smallholder Forestry and Agroforestry Programme targeted at poor forest users without legal tenure, and a Forest-Industry-Market Linking Strategy to promote the financial and business development of small and medium enterprises. In addition, there is support for sustainable management of natural forests, reforestation and agroforestry, energy plantation management and payments for environmental services. The REDD+ programme aims to improve public policy and forest governance as well as enhance forests’ contribution to addressing climate change challenges.
The Inter-institutional Action Plan for the Prevention and Reduction of Illegal Logging in Guatemala (PIPRTIG) is a long-term strategy launched in 2010. Following a comprehensive participatory process, it has elements relating to regulatory and legal frameworks, stakeholder participation, training stakeholders, promoting legal activ ities, strengthening information systems, preventing and controlling illegal activ ities, and implementing a forestry information programme. The programme included amendments to regulations in a number of areas (following stakeholder discussions with smallholders) including improved management of fuelwood and timber transport and protected area management.
| 77 |
CHAPTER 3 WHAT DOES IT TAKE TO ACHIEVE THE SDGS? COUNTRY CASE STUDIES
Combined with these incentive programmes, the multistakeholder, multisector approach of PIPRTIG has helped reduce conf lict and improve landscape sustainability. Other successes include better informed decision-making and incorporating sustainable management of forests and trees into development plans. Budget allocations have facilitated the strengthening of forest-related institutions and governance. There are however further opportunities to enhance the regulatory and cultural services of forests and trees, especially in watershed protection and for tourism and recreation. Guatemalan landscapes have a very rich cultural, architectural and natural heritage, so there is potential to have integrated landscape approaches that combine human-made and natural environments. However, high levels of poverty and unequal access to land continue to limit improvements in welfare, including in the forest and woodlands sector.
Italy – Tuscany regionItaly is a high-income country with a population of 61 million, of whom 3.75 million live in Tuscany. Population growth in Italy was 0.23 percent in 2016, and 39 percent of the population live in rural areas. Forests cover 31.6 percent of Italy’s land area and 51 percent of Tuscany, and both shares are increasing. Within Italy, tourism accounts for 13 percent of GDP and agriculture and forestry (combined) for 2.2 percent. Although forest production does not make a significant contribution to the economy, forests and trees are important for broader landscape and watershed management. Following earlier deforestation, the forest area has doubled since 1920 as agriculture has become more intensive and the population more urbanized. Poverty has increased with the economic stagnation of recent years, with 7.6 percent of the population liv ing below the national poverty line.
Italy’s policies are developed within the framework of EU policy and law, including the Common Agricultural Policy (CAP) and the Natura 2000 Directive. The EU has pursued the principle of “multifunctionality” in agriculture and rural development since the early 1990s, providing incentives for environmentally
sustainable agriculture and forestry under the CAP. There is also a European Landscape Convention (2000) and Italy has incorporated its provisions in the National Code for Cultural Heritage, which requires all regions to prepare landscape plans.
Tuscany has been a leader in integrated landscape management and was the first region to prepare a Regional Landscape Plan, which is integrated into its Territorial Development Plan. There is also a regional forest management plan, developed within the framework of the landscape plan, which supports the productive, landscape and environmental values of forests. Tuscany’s forests and trees are valued for their cultural and ecological value as well as for their role in traditional rural landscapes, which are important for tourism. The trees are mostly broadleaved, were traditionally coppiced and can serve as important links within ecological networks. They also provide food such as sweet chestnuts, walnuts, hazelnuts and olives. Other benefits include shade for grazing animals and protection for agricultural f ields. Although timber production contributes only 0.25 percent of regional GDP, the broader services of forests, including production of NWFPs and regulatory and cultural services, are estimated at 6 percent of regional GDP.
Landscape planning integrates economic, social and environmental objectives – including rural development, food production, watershed protection, biodiversity and the cultural values of forests and trees – within a broad framework of territorial planning. A focus on traditional agriculture and rural landscapes has benefited the economy through tourism and quality food production. Tuscany’s approach could have a broader application in countries where landscapes resemble complex mosaics, with tourism, environmental protection and cultural as well as production values. Despite these successes, challenges remain: there are tensions between public policies that focus on regulatory or restrictive approaches and those that support development. There can also be tension between collective and private rights, with different stakeholders having different priorities, and diff iculties in balancing tradition and innovation. Furthermore, interdisciplinary approaches to
| 78 |
THE STATE OF THE WORLD’S FORESTS 2018
research and science and innovation and conservation can be hard to put into practice. It should also be recognized that landscape recovery has been facilitated by wider economic growth and diversif ication; there is no longer a dependence on extensive agriculture for subsistence or on fuelwood to meet basic energy or industry needs.
The Republic of KoreaThe Republic of Korea is a high-income, densely populated and mountainous country with a population of 51 million, only 17 percent of whom live in rural areas. Its population growth is 0.36 percent per year. GDP growth averaged 10 percent per year between the mid-1960s and the mid-1990s, transforming the Korean economy: only 3.2 percent of the population now live below the national poverty line. Forest cover was less than 40 percent in 1960, but this has now grown to 63.4 percent. Although the Republic of Korea has a timber industry, it relies very heavily on imported wood. Korean forests are now mainly valued for public goods rather than timber production.
In the 1950s, Korean forests were largely devastated by decades of war and poverty and there was widespread erosion and f looding. As part of a broad plan to address environmental degradation and reverse poverty, a reforestation programme was introduced in the early 1960s with the aim of offering watershed protection and fuelwood production. Reforestation was given greater priority from the early 1970s, when it was integrated with the high-profile rural development Saemul Udong movement, which was part of a broader economic development programme supporting agricultural intensification, industrialization and infrastructure development. National reforestation targets were established and budget allocations expanded. There were campaigns led by governors and mayors to mobilize people in replanting programmes, and communications programmes explained the crucial role of reforestation for livelihood restoration. Rising incomes also allowed woodfuel to be replaced with other sources of energy. The reforestation programmes were
accompanied by other rural development initiatives, including a programme to reduce slash-and-burn agricultural practices. Key to this was a substantial budget allocation to settlement and job creation in farming areas –thereby reducing dependence on forests – as well as policies supporting broader economic growth and urbanization. Nevertheless, there were some challenges in the early years, such as the wishes of private forest owners being ignored at times and low initial survival rates of seedlings.
Over the last 20 years policies have highlighted the role of forests in climate change management, their recreational value for a more prosperous and urban population and their cultural role, as well as their contribution to clean air, watershed conservation, erosion control and biodiversity. Forests are now valued largely for their contribution to local and global public goods: a systematic assessment estimated their public good value in 2015 at USD 126 billion. By contrast, the direct economic benefits from forest products (including timber, nuts, fruits and wild vegetables) are USD 8.3 billion per year. Meanwhile, public investment in forests totals USD 2 billion per year. The Republic of Korea plays a leading role in key regional and global initiatives and hosts the Green Climate Fund.
Providing significant political and financial support to reforestation has resulted in substantial benefits and proved important for transformational change. Success factors include consistently giving national priority to forest restoration as part of broader development strategies over a 20-year period. Moreover, strategic goals were based on careful diagnosis of underlying problems and their causes, including the need for household energy and food and the impact of deforestation on erosion and f looding. The approach to reforestation was adapted over time, taking account of lessons learned and adopting a more scientif ic approach to seedling selection and maintenance. The reforestation programme also coincided with a period of very rapid economic growth and societal transformation. Lower birth rates, rapidly increasing incomes and urbanization have all helped to reduce pressure on forests.
| 79 |
CHAPTER 3 WHAT DOES IT TAKE TO ACHIEVE THE SDGS? COUNTRY CASE STUDIES
NepalNepal is a low-income country with a population of 29 million, over 80 percent of whom live in rural areas. Its population is growing at 1.2 percent per year. Forest cover was estimated at 33 percent in 1990 and is now 25.4 percent, although it has stabilized over the last ten years. Forest landscapes vary widely, from mountain to semi-tropical lowland forests and woodlands. Travel and tourism account for 8 percent of GDP and agriculture and forestry for over 30 percent. Poverty rates fell from 38 percent in 2000 to 21.6 percent in 2015, and GDP growth averaged 4.5 percent over the last decade, helped by changing economic structures and remittances. In 2015 Nepal was hit by a devastating earthquake and in 2017 by severe f loods. Estimates on the contribution of forestry to GDP range from 3.5 percent to over 9 percent when NWFPs are included. Fuelwood accounts for 85 percent of household energy and for the vast majority of harvested wood. Forests and trees also play a key role in watershed protection and climate resilience and are important for biodiversity and agricultural landscape management. Nepal remains vulnerable to devastating f loods and landslides that are caused in part by long-term landscape degradation.
Community forest management (CFM) was first introduced in the late 1970s and has since evolved and adapted to different political systems. CFM has been more effective in hilly areas than in the intensively cultivated lowlands, and has increasingly been integrated with other development programmes. CFM has contributed to landscape restoration and livelihood security as well as increased availability of f irewood. The focus for Community Forest User Groups (CFUGs) has gradually shifted from group formation to equitable access, with an emphasis on marginalized groups and poverty reduction and obtaining multiple benefits involving a broader range of stakeholders. The groups have benefited women by increasing the local availability of fuelwood, fodder and water. Income from the sale of forest products can be used for community infrastructure as well as for local pro-poor programmes. There are now 20 000 CFUGs, involving 11 million people and
2.5 million households, and 38 percent of forest area has been handed over to CFUGs. Established in 1995, the Federation of Community Forestry Users Nepal (FECOFUN) aims to strengthen the role of CFUGs and build social capital.
Nepal has also begun to incorporate the SDGs into its planning and budgeting processes, and work is ongoing to capture SDG indicators more systematically in these. Agricultural, nature conservation and forest sector strategies have all been developed within this framework. There is a need for more substantial f inancial incentive regimes and clear, simple monitoring and accounting systems to enable CFM to be scaled up towards broader landscape approaches and to enhance forests’ contributions to the SDGs. There is also more scope for managing and valuing Nepal’s forests for their broader local and global public goods role in climate resilience, watershed management and clean energy, as well as for their cultural and recreational value.
CFUGs have brought multiple benefits. Revenues from forest products – such as f irewood, bio-briquettes, timber, grass, edible wild foods, medicinal plants and other NWFPs – have supported community development activ ities, including construction of schools, irrigation facilities, health posts and drinking water schemes. Policies have benefited indigenous people and marginalized groups, even if extending benefits in practice to the poorest of the poor and the lower caste and class groups continues to pose a challenge for many CFUGs. CFUGs have also helped establish democratic decision-making processes. However, CFM does have some limitations; for example Nepal’s vulnerability to f loods highlights the need for larger-scale approaches to landscape management. Furthermore, Nepal has yet to make use of its substantial potential to generate clean energy from hydro-electricity, which will require sound watershed management. Looking ahead, there is scope for broadening the benefits of CFM by operationalizing financial incentives under REDD+ mechanisms, green funds or payments for environmental services mechanisms, as well as potentially drawing in private sector investors.
| 80 |
THE STATE OF THE WORLD’S FORESTS 2018
The Russian Federation – Arkhangelsk regionThe Arkhangelsk region in the northwest of the Russian Federation has a population of 1.12 million people, 22 percent of whom live in rural areas. It is very sparsely populated and population numbers have declined by over 20 percent in the last 20 years due to migration. Boreal forest landscapes predominate and forests cover almost 50 percent of land area. The regional economy deteriorated dramatically in the early post-Soviet years, with rapid privatization and disruption of institutions and state f inancing systems. There has since been a recovery and poverty rates in the region, which had increased in the 1990s, are currently at 14.5 percent. There are important mineral resources as well as shipbuilding and aerospace industries. Forest industries account for almost 17 percent of regional GDP, with significant exports of pulp, paper products and timber. In addition to their production value, the Arkhangelsk forests play a key role in the ecological balance of Northern Europe: they are a major source of carbon sequestration and host a range of f lora and fauna specific to boreal forest ecosystems.
The key to recovery of the forest industry from the disruptions of the 1990s was establishing vertically-integrated industrial structures, industry consolidation into clusters, technical innovation, and cooperation between private sector operators and regional governments in policy development. Large-scale enterprises could overcome diseconomies of distance and invest in productivity improvements and modern technology. Forests are publicly owned and the introduction of 49-year leases in 2007 provided an additional incentive for long-term resource management and investment. Meanwhile, smaller-scale enterprises have been established in areas with more intensive forest use. Although productivity increases led to a fall in direct employment in timber production and processing, the industry’s recovery had a “multiplier effect” on related sectors such as transport and logistics, as well as on the broader development of other sectors. The industry has also expanded into production of bio-energy. Federal and regional policies, as articulated in the Social and Economic Development Strategy and the Forest-Industry Complex Development
Strategy for the Arkhangelsk Region 2030, support integrated forest sector development.
The sector now manages environmental impacts increasingly well, with better use of chemicals for pulp and paper production, improved recycling, energy efficiency and reduced air and water pollution. Although only half of annual allowable cut wood is used, there has been excessive felling near the main transport routes and over-reliance on natural regeneration. The 2030 Strategy addresses this by supporting assisted regeneration, more intensive silv iculture management and long-term planning, forest maintenance and infrastructure development. There have also been tensions about whether to extend PAs or increase the area allocated for timber harvesting; efforts are being made to balance industry and conservation interests through multistakeholder platforms.
The revitalization of forest industries and the associated multiplier effects have played a major role in the economic recovery of the region. The large-scale “industrial cluster” approach – which emphasizes vertical integration, links with infrastructure, markets, regional research and educational institutions, and cooperation between large and small industries – has favoured innovation and enhanced productivity. Nevertheless, there are challenges in developing the potential of the forest sector. For example, industrial concentration may to some extent have crowded out small-scale entrepreneurship, which would benefit from a more supportive enabling environment. The potential of NWFPs has not been fully explored. There is also scope for taking advantage of the region’s forests and cultural traditions to develop tourism, and there is much to learn from neighbouring Nordic countries in this regard. Furthermore, given their scale and significance, the contributions of the Arkhangelsk boreal forests in delivering regulating services – including climate resilience and ecosystem management – could be more systematically valued.
The United Republic of Tanzania The United Republic of Tanzania is a low-income country with an estimated population of 56 million in 2017, of whom 70 percent live in rural
| 81 |
CHAPTER 3 WHAT DOES IT TAKE TO ACHIEVE THE SDGS? COUNTRY CASE STUDIES
utilization, participatory fire management, forest governance and protection of forest resources, and sustainable forest management.
The National Development Vision 2025 includes policies for developing productive agriculture, agro-industries and support services, while reversing losses of natural capital such as land, forest, water and biodiversity. The United Republic of Tanzania is committed to increasing investment in agriculture through the Comprehensive African Agriculture Development Programme, the agricultural planning process of the New Partnership for Agricultural Development (NEPAD) within the African Union. Launched in 2010, the Southern Agricultural Corridor project (SAGCOT) contributes to the 2025 vision by fostering agribusiness for agriculture and forest industries, using risk-sharing models of public-private partnerships (PPP). A land-use dialogue (LUD) accompanies the operationalization of SAGCOT. The LUD recognizes that PFM is necessary but not sufficient in an area which also has a history of small- and larger-scale commercial forest management; a broader landscape approach is needed, as village land-use plans are quite limited geographically and often lack technical and financial support.
Experience in the United Republic of Tanzania illustrates that individual and community benefits provide legitimate incentives for participatory and sustainable land-use approaches that seek to increase agricultural productivity and profitability while improving forest and woodland management. The capacities of government officials and relevant agencies need to be strengthened and communication is key, as is taking account of long-term effects on land tenure security. Hybrid approaches involving state and non-state actors can work, and participatory land-use planning approaches need to recognize competing interests. PFM has engaged communities in improved woodland management. The LUD experience suggests that to scale up benefits it will be necessary to go beyond local communities to link to the broader, larger-scale landscape and develop genuine PPPs and supply chains. This process takes time, and PPPs need further focus as well as the right incentive frameworks in place. Tanzanian forests
areas. Its population growth is 3 percent per year. Agriculture including forestry represents 24.3 percent of GDP, while tourism accounts for 8 percent. The United Republic of Tanzania has experienced rapid economic growth rates of 6 to 7 percent per year over the last decade, and poverty incidence declined from 60 percent in 2007 to 47 percent in 2016, although population growth has prevented the absolute number of poor from falling. Mineral reserves are starting to be exploited, including natural gas. Forests cover 52 percent of the land area. Forestry accounts for 3.7 percent of GDP in the official figures, excluding fuelwood and charcoal, NWFPs and public goods values. Wood-based energy comprises over 90 percent of wood removals and 90 percent of household energy consumption. Deforestation rates are about 1 percent per year, related mostly to the expansion of subsistence agriculture.
Forest legislation emphasizes the linkages between forests/woodlands and agricultural production. The National Forest Programme promotes forest management within the context of the overall development vision and provides for cross-sectoral linkages with the environment, agriculture, energy, health, lands, minerals, water, wildlife and gender. Participatory forest management (PFM) by local communities is integrated with local administration planning processes, local government and land tenure legislation, and 7.7 million hectares are managed through PFM arrangements. Local representatives of the Tanzanian Forest Services Agency manage forests together with local governments and communities, via jointly–prepared management plans and with by-laws that define permitted and banned forest activities. These arrangements have contributed to a recovery of f lora and fauna in some areas and an increase in local incomes from trees and forest-related products. Meanwhile, commercial forestry has developed rapidly and now contributes about half of the official GDP from forestry. Commercial owners have worked with smallholders to transfer knowledge, facilitate value added and lower the costs of transport and marketing. The United Republic of Tanzania is committed to the REDD+ agenda and has established inter-ministerial REDD+ administrative processes, although these have proved quite complex to put into practice. Priority measures include enhanced efficiency in woodfuel
| 82 |
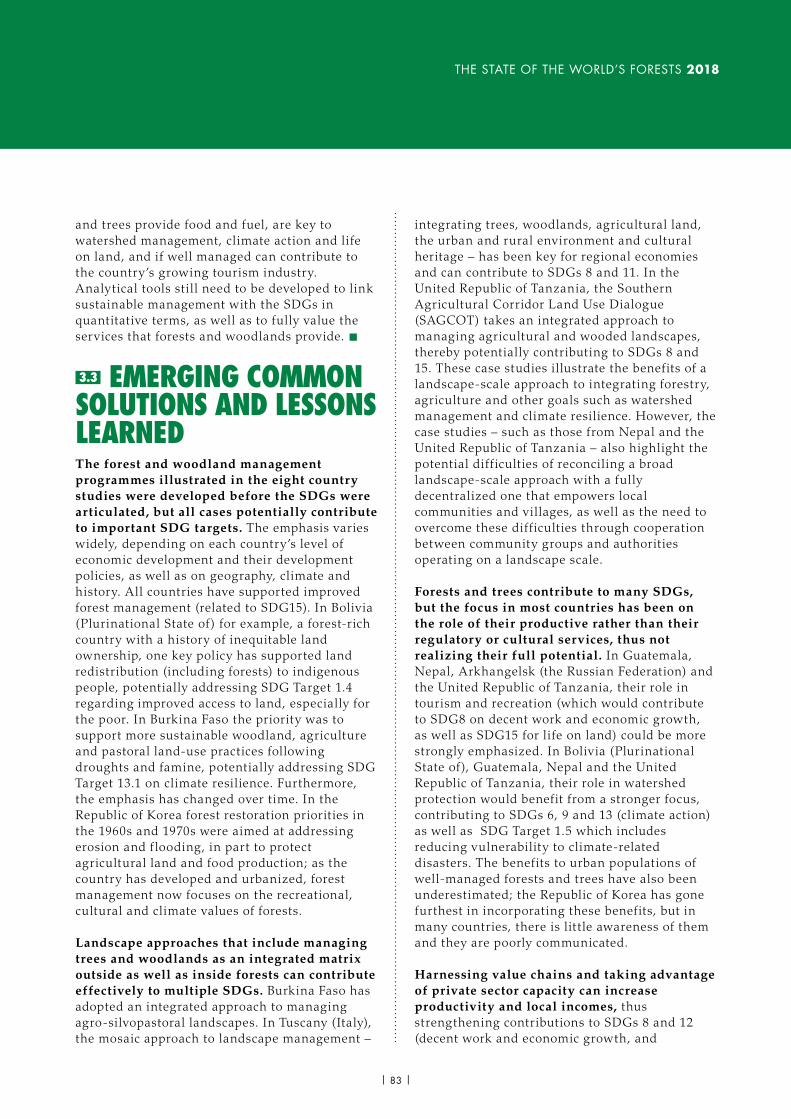
THE STATE OF THE WORLD’S FORESTS 2018
and trees provide food and fuel, are key to watershed management, climate action and life on land, and if well managed can contribute to the country’s growing tourism industry. Analytical tools still need to be developed to link sustainable management with the SDGs in quantitative terms, as well as to fully value the services that forests and woodlands provide. n
3.3 EMERGING COMMON SOLUTIONS AND LESSONS LEARNEDThe forest and woodland management programmes illustrated in the eight country studies were developed before the SDGs were articulated, but all cases potentially contribute to important SDG targets. The emphasis varies widely, depending on each country’s level of economic development and their development policies, as well as on geography, climate and history. All countries have supported improved forest management (related to SDG15). In Bolivia (Plurinational State of ) for example, a forest-rich country with a history of inequitable land ownership, one key policy has supported land redistribution (including forests) to indigenous people, potentially addressing SDG Target 1.4 regarding improved access to land, especially for the poor. In Burkina Faso the priority was to support more sustainable woodland, agriculture and pastoral land-use practices following droughts and famine, potentially addressing SDG Target 13.1 on climate resilience. Furthermore, the emphasis has changed over time. In the Republic of Korea forest restoration priorities in the 1960s and 1970s were aimed at addressing erosion and f looding, in part to protect agricultural land and food production; as the country has developed and urbanized, forest management now focuses on the recreational, cultural and climate values of forests.
Landscape approaches that include managing trees and woodlands as an integrated matrix outside as well as inside forests can contribute effectively to multiple SDGs. Burkina Faso has adopted an integrated approach to managing agro-silvopastoral landscapes. In Tuscany (Italy), the mosaic approach to landscape management –
integrating trees, woodlands, agricultural land, the urban and rural environment and cultural heritage – has been key for regional economies and can contribute to SDGs 8 and 11. In the United Republic of Tanzania, the Southern Agricultural Corridor Land Use Dialogue (SAGCOT) takes an integrated approach to managing agricultural and wooded landscapes, thereby potentially contributing to SDGs 8 and 15. These case studies illustrate the benefits of a landscape-scale approach to integrating forestry, agriculture and other goals such as watershed management and climate resilience. However, the case studies – such as those from Nepal and the United Republic of Tanzania – also highlight the potential diff iculties of reconciling a broad landscape-scale approach with a fully decentralized one that empowers local communities and villages, as well as the need to overcome these diff iculties through cooperation between community groups and authorities operating on a landscape scale.
Forests and trees contribute to many SDGs, but the focus in most countries has been on the role of their productive rather than their regulatory or cultural services, thus not realizing their full potential. In Guatemala, Nepal, Arkhangelsk (the Russian Federation) and the United Republic of Tanzania, their role in tourism and recreation (which would contribute to SDG8 on decent work and economic growth, as well as SDG15 for life on land) could be more strongly emphasized. In Bolivia (Plurinational State of ), Guatemala, Nepal and the United Republic of Tanzania, their role in watershed protection would benefit from a stronger focus, contributing to SDGs 6, 9 and 13 (climate action) as well as SDG Target 1.5 which includes reducing vulnerability to climate-related disasters. The benefits to urban populations of well-managed forests and trees have also been underestimated; the Republic of Korea has gone furthest in incorporating these benefits, but in many countries, there is little awareness of them and they are poorly communicated.
Harnessing value chains and taking advantage of private sector capacity can increase productivity and local incomes, thus strengthening contributions to SDGs 8 and 12 (decent work and economic growth, and
| 83 |
CHAPTER 3 WHAT DOES IT TAKE TO ACHIEVE THE SDGS? COUNTRY CASE STUDIES
responsible production and consumption). In Arkhangelsk (the Russian Federation), value added has more than doubled although the volume of timber harvested has barely risen as a result of innovation, vertical integration and cluster approaches to forest industries; while there are fewer jobs in timber harvesting, opportunities have increased up the value chain. In the United Republic of Tanzania, private forest enterprise plantations can work with smallholders to transfer knowledge, facilitate value addition and lower the costs of transport and marketing. In Bolivia (Plurinational State of ), larger enterprises have transferred knowledge to smallholders and facilitated processing and marketing. In Bolivia (Plurinational State of ), Burkina Faso, Guatemala and Italy, high-value niche products (hazelnuts, specialized coffee, Brazil nuts, shea nuts, and many more) have also helped boost local incomes. Certif ication and labelling can further increase their value.
Scientific and technical support are key to sustained success. In Burkina Faso, careful forest seed selection and breeding as well as support for village nurseries have helped ensure that planted trees are adapted to local ecosystems, and that survival rates are high. The Republic of Korea initially experienced low seed survival rates because of poorly-adapted species and insufficient technical oversight of nurseries, so the approach was adapted in the light of lessons learned. In Nepal, community forest management has been supplemented by larger-scale “block management” approaches, where there is more scope for technical support in land-use planning. In Arkhangelsk (the Russian Federation) there is now a greater focus on managed natural regeneration. There has however not been enough investment in sustaining and building capacity for adaptive research, including in countries as different as the Russian Federation and the United Republic of Tanzania.
The importance and potential of biomass energy from trees in contributing to SDGs 7 (clean and affordable energy) and 13 (climate action) is insufficiently recognized in many countries. The wood energy sector is largely informal and often insufficiently ref lected in economic statistics. In Burkina Faso, Guatemala,
Nepal and the United Republic of Tanzania, fuelwood and charcoal meet 80 percent of household energy needs. Strategies in Burkina Faso and the United Republic of Tanzania have supported fuelwood plantations and many countries have programmes for improved stoves, yet biomass is generally regarded as an affordable but unclean source of energy. Demand for fuelwood has also contributed to forest degradation. However, if well managed, woody biomass can be affordable, clean and renewable. Arkhangelsk (the Russian Federation) is increasing wood energy production both for local heating needs and for export (wood pellets), and lower-income countries have great potential to use the resource more efficiently as part of broader sustainable energy strategies.
In many countries, a lack of solid data collection or management systems impede valuation of forest and woodlands’ contribution to the SDGs. This is an important issue and a barrier to change. The higher-income countries have gone furthest in establishing sound data collection and monitoring systems, and there is potential for knowledge transfer. Italy’s “landscape observatory”, for example, has been applied in other countries and the Republic of Korea’s approach to estimating the regulatory and cultural value of forests could be more broadly applied, but both rely on good data collection systems. Overall, building and maintaining capacity in collecting, managing and disseminating information in an easily understood way would benefit from a stronger focus.
Trade-offs need to be acknowledged when setting priorities. These include time trade-offs (whereby short-term benefits can reduce longer-term ones) more sustainable returns and trade-offs between local and global public goods; spatial trade-offs between communities or between upstream and downstream users; and sectoral trade-offs between land or water use for agriculture or for watershed conservation. In Arkhangelsk (the Russian Federation), excessive harvesting near transport routes without sufficient attention to longer-term regeneration has contributed to forest degradation. In Nepal, in addition to CFM more focus is needed on larger-scale watershed management for f lood
| 84 |
THE STATE OF THE WORLD’S FORESTS 2018
protection and climate resilience, benefiting communities especially on lower-lying land. In Bolivia (Plurinational State of ), policies of land allocation to previously disadvantaged groups that lacked capacity to manage lands productively have contributed in some cases to less sustainable land management. In the United Republic of Tanzania there is tension concerning land management between sedentary and non-sedentary populations, and in Italy between land management for conservation or for rural development. Multistakeholder groups and inter-institutional coordination can reduce but not eliminate these trade-offs. Furthermore, local representation becomes more diff icult to manage at larger scales. Incentives such as payment for ecosystem services can help meet the interests of different sectors or of upstream and downstream users in some instances, but require strong institutions and social trust to be effective. Financing mechanisms must also overcome the issue of “impatient capital” in order to support long-term benefits.
A strong enabling environment is needed to strengthen the contributions of forests and woodlands to multiple SDGs. A mix of regulatory approaches, economic incentives and social marketing programmes (aimed at behaviour change) works best: each factor is necessary but not sufficient. Enabling legislation has been adopted in most countries and adapted to different circumstances. Two such examples are the modifications to regulations in Guatemala on timber transport – through the Inter-institutional Action Plan for the Prevention and Reduction of Illegal Logging – and introducing
long-term 49-year leases of forest land in the Russian Federation. Integrated landscape approaches are embedded in the Italian Constitution, as well as in enabling regulations and in data and information management. In Burkina Faso, Nepal and the Republic of Korea, sustained financial and political support for broad-based approaches to forest and woodland restoration have helped enhance quality of life and improve (in the case of the Republic of Korea) or reduce (in Burkina Faso and Nepal) degradation of forest and tree landscapes. Broader development and governance environments can limit these impacts, however. In Guatemala for example, income distribution and access to assets are highly unequal, while in the United Republic of Tanzania there are serious constraints on resources and human capacities. At the same time, multistakeholder, decentralized approaches to woodland regeneration and landscape management have themselves improved governance: Burkina Faso, Guatemala, Nepal and the United Republic of Tanzania are all examples, while in Arkhangelsk (the Russian Federation) a multistakeholder approach to governance also enabled the revival of and added value to the timber industry.
These country case studies illustrate the variety of ways in which integrated programmes for the management of forests, woodlands and trees can contribute to the SDGs. The countries selected do not necessarily constitute best practices, nor can they be regarded as representative. But they do provide examples of the importance of forests and trees in broader country development. n
| 85 |
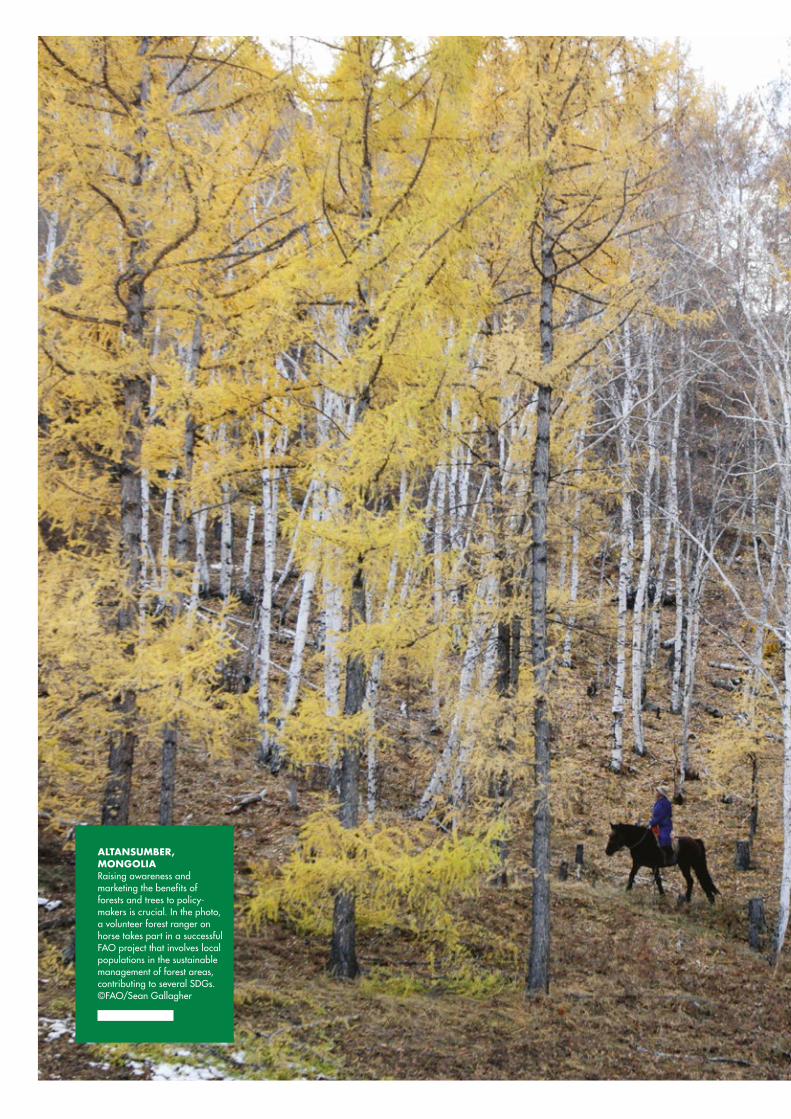
ALTANSUMBER, MONGOLIARaising awareness and marketing the benefits of forests and trees to policy-makers is crucial. In the photo, a volunteer forest ranger on horse takes part in a successful FAO project that involves local populations in the sustainable management of forest areas, contributing to several SDGs.©FAO/Sean Gallagher
CHAPTER 4MOVING
FORWARD
4.1 INTRODUCTIONThe objective of SOFO 2018 is to identify how forests' and trees' contribution to sustainable development can be strengthened to help achieve the 2030 Agenda with its ambitious, integrated goals. This will demand a fundamental shift in the way policies are developed and implemented.
The previous chapters reviewed the available evidence about the contribution of forests and trees to achieving ten of the SDGs. Chapter 2 considers relevant targets under each of these SDGs and, where possible, quantif ies these contributions using agreed SDG indicators or other suitable metrics. It also identif ies data gaps and areas where further work is needed to improve understanding of physical, biological and socio-economic relationships or interlinkages. Chapter 3 summarizes eight country case studies to illustrate ways in which national forest policies and programmes can potentially contribute to the SDGs. This chapter also outlines key findings and suggests a number of policies for what needs to be done to move forward. n
4.2 KEY FINDINGSThere is quantitative evidence to show that forests are being managed more sustainably, and that forests and trees contribute to achieving SDGs related to: livelihoods and food security for many rural poor; access to affordable energy; sustainable consumption and production; climate change mitigation; sustainable forest management.
Livelihoods and food security (SDGs 1 and 2). Forests and trees are critical in providing livelihoods and food security for many of the world’s rural poor. It is estimated that about 40 percent of rural people in extreme poverty live
in forest and savannah areas. Nearly 160 million of these are in Africa, around 85 million in Asia and about 8 million in Latin America. Some studies suggest that forests and trees can provide around 20 percent of income for rural households in developing countries, and that income from forests is proportionately more important for the livelihoods of the poorest households. NWFPs provide food, income, and nutritional diversity for an estimated 20 percent of the global population, especially women, children and others in vulnerable situations.
Access to affordable energy (SDG7). Around 33 percent of the world’s population – or about 2.4 billion people – make use of wood to provide basic energy services such as cooking, boiling water and heating their homes. The proportion of people relying on woodfuel varies, from 63 percent in Africa to 38 percent in Asia and 16 percent in Latin America. Globally, 840 million people collect woodfuel and charcoal for their own use. Wood provides more than half of national primary energy supplies in 29 countries, of which 22 are in sub-Saharan Africa. Overall, forests supply about 40 percent of global renewable energy in the form of woodfuel – as much as solar, hydroelectric and wind power combined.
Sustainable consumption and production (SDG12). The wood processing sector has made good progress in increasing the efficiency of wood utilization. Although sawnwood and wood panel production grew by 8.2 percent per year between 2000 and 2015, this required only a 1.9 percent growth in input from industrial roundwood. Meanwhile, per capita consumption of wood-based panels (which are more efficient in terms of wood utilization) grew by 80 percent, while sawnwood consumption remained static. There has also been reduced waste in the paper sector, with a doubling in the paper recovery rate
CHAPTER 4
MOVING FORWARD
| 88 |
THE STATE OF THE WORLD’S FORESTS 2018
from 24.6 percent in 1970 to 56.1 percent in 2015. Meanwhile, the share of wood products that FSC and PEFC certify as coming from sustainably-managed forests has also increased, now representing 40 percent of global industrial roundwood production.
Climate change mitigation (SDG13). The role of forests in climate change mitigation is well recognized. According to the IPCC, “the Agriculture, Forestry and Land Use (AFOLU) sector is responsible for just under a quarter (~10–12 GtCO2eq/yr) of anthropogenic GHG emissions mainly from deforestation and agricultural emissions from livestock, soil and nutrient management (Smith, P. et al., 2014). The 25 countries with the highest forest cover have all included forest-related mitigation measures in their NAMAs and NDCs. Such measures include afforestation, reduced deforestation and degradation, enhancement of forest carbon stocks, forest conservation and agroforestry (especially where this can help reduce forest encroachment).
Sustainable forest management (SDG Targets 15.1, 15.2 and 15.b). Between 1990 and 2015, the world’s forest area decreased from 31.6 percent of global land area to 30.6 percent, but the pace of loss has slowed in recent years. This loss occurs mainly in developing countries, particularly in sub-Saharan Africa, Latin America and Southeast Asia. In some parts of Asia, North America and Europe the forest area has increased since 1990, due to large-scale afforestation programmes and the natural reversion of low-productive agricultural land back to forest. The SDG indicator on progress towards sustainable forest management is composed of f ive sub-indicators, ref lecting net loss of forest (reduced from 0.18 percent in the 1990s to 0.08 percent in the last f ive-year period), biomass stock (which
has remained stable), forests in legally-established PAs (now 17 percent of the forest area, with a strong increase in the tropics), the area under long-term management plans (increased to 2.1 bil l ion hectares in 2010) and certif ied forest area (increased from 285 mill ion to 440 mill ion hectares between 2010 and 2014). The SDG indicator on mobilizing resources to f inance sustainable forest management has two proposed sub-indicators, relating to (i) ODA and (ii) public expenditure on forest conservation and sustainable forest management. In 2015, ODA disbursement on forestry was about USD 800 mill ion, or just under 1 percent of total ODA. While net ODA disbursement on forestry has increased since 2000, there is annual variability and it has decreased as a proportion of total ODA.
Qualitative evidence suggests that forests and trees also make significant contributions to SDGs through the informal sector, agroforestry, opportunities to empower women, sustainable water management, tourism, sustainable cities, climate change adaptation, and tackling land degradation and biodiversity loss.
Informal sector (SDGs 1, 2 and 8). There is a lack of reliable information from official statistics about the informal forest sector, although it has been estimated to provide between 40 million and 60 million jobs. This sector includes small-scale logging and wood processing, charcoal production and processing, and the collection and processing of NWFPs. Although the importance of edible NWFPs for food security has been demonstrated by many studies, there is a lack of comparable data about their overall contribution, including in terms of nutritional value and their role as safety nets to increase resilience when other food is scarce.
Agroforestry (SDGs 1 and 2). Agroforestry is important, as trees outside forests – including
| 89 |
CHAPTER 4 MOVING FORWARD
those on farms – can serve as crucial safety nets and complement agricultural activ ity by diversify ing production and providing ecosystem services. One of the case studies in Chapter 3 highlighted the work being undertaken to promote agroforestry in Guatemala. An indication of the scale of agroforestry is that on average 46 percent of the global area classif ied as agricultural has tree canopy cover of at least 10 percent. There is however wide variation in agroforestry practices, with the highest tree cover on agricultural land found in the humid regions of Southeast Asia, Central America, eastern South America and coastal West Africa.
Gender (SDG5). While there are some signs of change (and a lack of gender-disaggregated data) it is clear that men still dominate the formal forest sector as well as decision-making at all levels. On the other hand, many rural women spend much of their lives collecting fuelwood, food for family consumption, medicinal plants, resin and other NWFPs. Studies have highlighted the entrepreneurial role that women play in value-added activities, especially in the informal sector, as well as their leadership role in community and participatory forest management. However, more work is needed to investigate issues such as women’s access to forest rights and the impact on gender equity, as well as their empowerment in transitioning from the informal to the formal sector.
Sustainable water management (SDG6). Forests are integral to the water cycle. They also f ilter water, reduce soil erosion and sedimentation, pump water into the atmosphere and provide much of the drinking water for over one-third of the world’s largest cities. However, the water-related ecosystem services provided by forests are often undervalued, partly due to their complexity. More information is needed on forest-water relationships for different ecosystems and at different scales (spatial and temporal) in the face of climate change. Understanding the impacts of forest management, including loss, restoration and afforestation, on water is necessary for developing forest-related measures that can contribute effectively to SDG6.
Sustainable tourism (SDG8). There is potential for forest-based tourism to make an increasing
contribution to SDG Target 8.9 (promoting sustainable tourism) and there are good examples of countries (such as Costa Rica) that have used their forests to enhance their appeal for tourists. Experts suggest that nature-based tourism accounts for approximately 20 percent of the global market, and that this sector is growing three times faster than the tourism industry as a whole.
Sustainable cities (SDG11). The benefits of accessible green space and trees in urban areas are increasingly well-recognized. For example, children liv ing in areas with good access to green spaces have been shown to have a lower prevalence of obesity compared to those with less access, and the presence of street trees has been associated with lower levels of crime. Urban forests and trees can also provide important aesthetic and biodiversity benefits. However, measuring and valuing such benefits remains challenging. Given the rapid rate of urbanization in many countries of the world, it is v ital that the value of forests and trees as a key component of urban green spaces be fully integrated in urban planning at an early stage.
Climate change adaptation (SDG13). Forests and trees can strengthen resilience and adaptive capacities to climate-related hazards and natural disasters. Forest-related measures identif ied in national climate change adaptation submissions (i.e. NAPAs, NAPs or NDCs) and national strategies for DRR include: reforestation and rehabilitation of degraded forest areas to prevent erosion and landslides; afforestation to mitigate f loods; agroforestry; conservation and restoration of mangrove forests in coastal zone areas to protect against storm surges, cyclones and tsunamis; and integrated fire and pest management. Such adaptive measures must be context-specific and there is a need for better understanding of the relationships between climate change and detrimental factors such as storms, f ires, and pests and diseases.
Halting and reversing land degradation (SDG Target 15.3). Tackling forest degradation can be important for addressing problems of land degradation, but it is difficult to measure forest degradation or detect it in a consistent manner through remote sensing. Despite these difficulties,
| 90 |
THE STATE OF THE WORLD’S FORESTS 2018
the contribution to this SDG target of reducing forest degradation is ref lected in the Bonn Challenge, which aims to restore 150 million hectares of the world’s deforested and degraded land by 2020, and 350 million hectares by 2030.
Halting biodiversity loss (SDG Targets 15.1, 15.4, 15.5, 15.9 and 15.a). Although forests are among the most important habitats for terrestrial biological diversity, there are diff iculties in quantifying this contribution. SDG Indicator 15.1.2 measures the proportion of important sites for terrestrial biodiversity that are covered by PAs, but the contribution of forests cannot be stated, as this indicator is not yet disaggregated by ecosystem type. Similarly, much of the biodiversity of mountain areas is found in their forests, but SDG Indicator 15.4.1 (on PAs for mountain biodiversity) does not yet have information by ecosystem type. As at least 50 percent of the world’s species are thought to be hosted by tropical forests, it has been proposed that SDG Indicator 15.5.1 (the Red List index) should separately identify the extinction risk for forest-dependent species.
There are many interlinkages between the SDGs. Chapter 2 demonstrated that sustainable forest management and the prevention of forest loss can assist progress towards multiple SDGs. The case studies in Chapter 3 showed that the most effective way to deliver on multiple SDGs is through landscape approaches, which manage trees and woodlands as an integrated matrix both inside and outside forests. For example, Burkina Faso has an integrated approach to managing agro-silvopastoral landscapes; the Tuscany region of Italy has adopted a mosaic approach to landscape management, integrating trees, woodlands, agricultural land and the planted environment; and the United Republic of Tanzania also takes an integrated approach to managing agricultural and wooded landscapes.
The contributions of forests and trees to SDGs can be complex and context-specific, and more work is needed to understand some of the relationships that underlie these contributions.
The previous chapters identif ied a number of areas where the underlying relationships are not yet fully understood. These include the role of forests and trees in reducing long-term poverty
and providing ecosystem services, and the need to account for the impact of external factors, other than forests and trees, on achieving the SDGs.
The role of forests and trees in reducing long-term poverty. The literature on the role of forests and trees in reducing long-term poverty is relatively fragmented. For example there is still uncertainty about the extent to which forests can offer coping strategies or pathways out of poverty, as well as how likely payments for environmental services are to bring widespread benefits. Addressing such questions can be challenging due to the multidimensional nature of poverty, the problems of dealing with different regional and national contexts, the varying perceptions of different stakeholders about potential solutions, the complexity of tenure and user rights issues, and a lack of understanding on the informal sector. However, these efforts will be facilitated by better socio-economic data and geospatial mapping of people and resources at national and subnational levels. Improved understanding will be important in the design of forest-related measures aimed at alleviating poverty.
The role of ecosystem services provided by forests and trees. Ecosystem services include water regulation, soil formation, protection against erosion and landslides, nutrient circulation, biodiversity conservation, agroecosystem stability, pest control, and pollination. Despite their fundamental importance, these services are often misunderstood and undervalued, partly because of their complexity. For example, the impact of forest management practices on water catchments can vary with location – such as situations where afforestation has negative impacts on water quantity and quality, while on the other hand in many places forested watersheds are crucial for protecting water sources. A better understanding of the role of ecosystem services will help in developing forest practices than can lead to improved resilience, particularly for forest-dependent people. There is also a need to raise awareness of the role of forests and trees in supporting sustainable agriculture. The case study from the Republic of Korea summarized in Chapter 3 showed how a better understanding of their ecosystem benefits led to a more integrated
| 91 |
CHAPTER 4 MOVING FORWARD
approach. It explained that while in the 1950s forests were largely viewed only as a source of fuelwood and timber, subsequent reforestation programmes emphasized their value for watershed management, erosion control and f lood protection, and policies now also recognize the importance of forests and trees as recreational resources for a largely urban population, as well as for biodiversity and climate regulation.
Effect of external factors on achieving SDGs. While SOFO 2018 focuses on the contribution of forests and trees to achieving the SDGs, a wide range of other factors will have a strong inf luence on progress. These include the macroeconomic context, trade relationships, demographic pressure, migration patterns, social support policies, availability of other natural resources, education, good governance, and institutional capacities. Many drivers of deforestation, such as urban development and land-use policies that favour large-scale development of palm oil or soya, also lie outside the forest sector. While it can be diff icult to analyse the impact of forest-related measures separately from broader economic, social and environmental measures and trends, it is important that these potential interactions not be overlooked, and that the development of forest policies be integrated with wider economic, social and environmental ones. The value of this approach was highlighted in the case study from the Republic of Korea, where reforestation measures were integrated with a national self-help campaign for villages to work together and formed part of a broader economic development programme that also supported agricultural intensification, industrialization and infrastructure development.
4.3 STRENGTHENING FOREST PATHWAYS TO SUSTAINABLE DEVELOPMENTIt is clear from Chapters 2 and 3 that forests and trees contribute in multiple ways to many of the SDGs, but as these contributions are often under-recognized and undervalued their full potential is not fully captured. This section identif ies ways to
do so by strengthening forest pathways for sustainable development to help achieve the transformational change necessary to implement the 2030 Agenda. These pathways include the need to:
} market the benefits of forests to policy-makers, and more widely;
} work with the private sector, within and beyond the forest sector;
} invest in transforming the informal sector; } integrate forest policies into the broader
sustainable development agenda; } undertake national or subnational analytical
studies of the potential contribution of forests and trees for achieving the SDGs;
} improve availability of data and meet other information needs.
Market the benefits of forests to policy-makers, and more widely There is a need to raise awareness about the important benefits of the world’s forests and trees and their potential role in contributing to achieving the SDGs. For example, forests do not normally come to mind when considering food security policies, and their value in supporting sustainable agriculture and providing ecosystem services is often overlooked. A review of documents related to climate change revealed that some countries with substantial areas of forest did not address the role of forests in adapting or strengthening resilience. Forests are seldom seen as engines for economic development. While this can be attributed in part to the greater size and importance of other sectors, the analyses presented in previous chapters suggest that the contribution of forests and trees to sustainable development is often undervalued or simply not known.
In raising awareness of the contributions of forests and trees to multiple SDGs, it is necessary to use language that can be understood by different audiences. For policy-makers, this can be achieved by further developing the analyses presented in this publication and undertaking similar ones at regional and national level. At the same time, there is a need for the forest sector to become less forest-centric and to focus more on using the 2030 Agenda as an opportunity for a fresh look at what sustainable forest management means in practice, and how it is implemented.
| 92 |
THE STATE OF THE WORLD’S FORESTS 2018
Strengthening forest pathways for sustainable development also means promoting the benefits of forests to audiences beyond the policy-making community. While the types of analyses presented in this publication are necessary, they seldom capture the attention of the media or the public imagination – which is unfortunate not least because public opinion can significantly sway politicians and their policies.
Therefore, clearer messages are needed about the contribution of forests and trees to sustainable development, tailored to a variety of audiences. These must include non-forest audiences such as city dwellers (who comprise over half the global population and are bound to increase in number), potential philanthropists (who may be willing to contribute to the costs of sustainable forest management), and young people of all ages (who need to be engaged with directly). One approach could be to use cross-cutting themes to develop a series of compelling narratives about clusters of SDGs. Such themes might include:
} Forests and trees – safety nets for the rural poor (SDG1, SDG2, SDG5, SDG7, SDG8, SDG15)
} Forests and trees – our green infrastructure (SDG6, SDG11, SDG13, SDG15)
} Forests and trees – pillars for a green economy (SDG7, SDG8, SDG12, SDG15)
} Forests and trees – the planet ’s future (SDG6, SDG13, SDG15)
} Forests and trees – their contribution to happiness (SDG1, SDG2, SDG3, SDG11, SDG15)
These narratives could then be developed in ways that would interest different audiences, making use of case studies to add colour. There could for example be material aimed at young children, along with a very different presentation of the same narrative aimed at potential philanthropic donors to forestry projects. For global messages, this could be initiated by the Collaborative Partnership on Forests Communicators Group and linked with the UN Strategic Plan on Forests’ communications and outreach strategy. However, action must go much further than this, with narratives developed and distributed widely to expand engagement and interest.
Work with the private sector, within and beyond the forest sectorWith its expertise, access to resources, and capacity for innovation, the private sector is critical for achieving the SDG targets. The case studies presented in previous chapters show that harnessing value chains and taking advantage of private sector capacities can increase productivity and local incomes. An example of this would be vertical integration that adds value through wood processing and improved cooperation between businesses of all sizes. This is v ital to improve the livelihoods of those liv ing in and near forests, as well as for many people in urban areas whose jobs benefit in some way from the presence of a thriving forest sector.
There is an overarching need for a positive enabling environment for private sector activity. Progress towards SDG16 (promote peaceful and inclusive societies for sustainable development) and SDG17 (on means of implementation) will be necessary to help create this. Of particular importance are SDG Targets 16.6 (develop effective, accountable and transparent institutions), 16.7 (ensure responsive, inclusive, participatory and representative decision-making), and SDG17 targets on finance, science, technology transfer and capacity-building. The legal framework should provide certainty of land tenure and of rights to use land and forest resources.
Policy interventions should focus on the action needed to produce results that contribute towards the SDGs, but that would not necessarily be delivered by the market. These interventions are likely to include a mix of regulatory approaches and incentives. However, the private sector operates at many different levels and different approaches may be required in different circumstances. Both the formal and informal forest sector include many small or micro-businesses, while at the other end of the scale there are some very large companies. There are also many enterprises outside the forest sector that can have a major impact on forests. These range from small-scale farmers using forest land to meet subsistence needs, to big corporations investing in large-scale commercial agriculture and other industrial activities such as mining and hydropower, which may cause deforestation.
| 93 |
CHAPTER 4 MOVING FORWARD
On the smaller-scale, priorities often include training to improve land-management practices, the promotion of agroforestry, the development of producer organizations, better access to markets, and the availability of suitable f inancing arrangements. On the larger-scale, there may be a need to address potential barriers to investment; these could for example be financial or relate to the availability of infrastructure and suitable sites for wood processing.
Where large-scale commodity production is contributing to deforestation, appropriate measures would include the effective regulation of land-use changes. There is also scope for increased partnership with the private sector to develop private governance initiatives, such as voluntary certif ication schemes and commitments to ‘zero-deforestation’ supply chains. In response to the global call to combat deforestation and forest degradation, an increasing number of retailers and banks are making voluntary commitments to exclude deforestation from their supply chains or f inancing.
Another innovative approach to working with the private sector is to develop multi-stakeholder partnerships. For example, the private sector is unlikely to invest in sustainable forest management unless there is a market for the goods or services it produces. On the other hand, by working with the public sector and the voluntary philanthropic sector, it is possible to mobilize alternative sources of f inance to cover the costs of providing public goods such as ecosystem services.
Invest in transforming the informal sectorEspecially in developing countries, the informal forest sector is often much larger than the formal one and is crucial to unlocking development opportunities. However, operating in the informal sector can lead to missed opportunities for value-added activities and increase the vulnerability of livelihoods. The informal sector also represents a loss of tax revenue and can put increased pressure on environmental resources. Investing in the informal sector has great potential to strengthen forest pathways for achieving the SDGs by increasing economic activ ity, improving employment conditions and
fostering a more sustainable approach to forest management. This is likely to require investment in training, capacity-building and developing producer organizations.
There is growing evidence that empowering rural people in this way will be vital for promoting change and achieving many of the SDG targets. Engaging young people is also important: it is more diff icult for the forest sector to attract young people if it is seen to have an ageing workforce, but their enterprise and energy are vital for the sector’s future. Many women act as rural entrepreneurs in the informal sector and play an important role in value-added activities; where not already in place, an approach is needed that mainstreams gender equality, giving women equal access to land ownership and tenure and other forest resources. Strengthening tenure presents an opportunity to enhance gender-equitable access to forests and trees, as well as encouraging a long-term, sustainable approach to forest management.
The informal sector can also predominate where there is inadequate security of long-term access to land and forest resources. This has a profound effect on attitudes towards sustainable forest management, but with clear and secure rights people are more likely to take a longer-term approach, as they know that they or their successors will benefit from it. Where insecure tenure is a critical problem, there will be a need for a legal framework that provides certainty, using the Voluntary guidelines on the responsible governance of tenure of land, fisheries and forests as a reference framework.
Devolving rights to manage state-owned forests to local communities and smallholders also provides opportunities for enhancing the contribution of the informal sector to the SDGs. Globally, 1.5 billion local and indigenous people have secured rights over forest resources through community-based tenure, although the geographical spread is uneven and there is a range of approaches to community or participatory forest management. Benefits can come from giving local people with traditional knowledge the ability to inf luence decision-making in ways that contribute to SDG targets. The relatively long history of community forest
| 94 |
THE STATE OF THE WORLD’S FORESTS 2018
management in Nepal is highlighted in Chapter 3. Many other countries, especially in Asia and Latin America, have adopted similar approaches. For example, Bolivia (Plurinational State of ) has emphasized indigenous peoples’ rights to land over the last ten years and favoured redistributive policies; while these have been largely successful, there are technical and capacity constraints which in some cases have contributed to resource degradation. Looking ahead, there is a need to learn from successful experiences in community forest management, recognizing the importance of scientif ic and technical support, training, capacity-building and access to markets, market information and adequate f inancial resources, as well as the need for clarity in setting out the rights and responsibilities of different parties. All these measures will need to be in place if forest pathways to sustainable development are to be strengthened.
Integrate forest policies with the broader sustainable development agendaAn integrated approach to policy-making is critical for making progress towards the SDG targets. Nevertheless, cross-sectoral coordination can be diff icult where governments have sector-based ministries and agencies with their own resource allocations and accountability arrangements. Tensions can arise when those tasked with crafting national sustainable development strategies fail to acknowledge the potential contribution of forests and trees, while those responsible for forest policy regard forestry outcomes as an end in themselves rather than as a contribution to wider goals. Effective cross-sector coordination requires dialogue and coordinated action, with a focus on achieving the SDGs and benefitting from interlinkages rather than promoting individual sectors.
The 2030 Agenda and the SDGs are challenging sectoral ministries to change the way they work. They must coordinate their policies and development strategies across government. To achieve this, countries may consider establishing SDG implementation platforms composed of key sectors that are related to natural resource use and management. SDG implementation platforms would bring together different ministries and
government agencies with other key stakeholders. In addition to developing sustainable development policies, they would also focus on implementation – identifying and addressing barriers to change and monitoring progress.
Undertake national or subnational analytical studies of the potential contribution of forests and trees to achieving the SDGs There is strong evidence of the significant contribution that forests and trees can make towards achieving the SDGs. However, the nature of this contribution and the type of policy measures needed to realize its potential will differ according to national and subnational contexts. Furthermore, as stated in the 2030 Agenda, it is for each government to decide how the aspirational and global SDG targets should be incorporated into national planning processes, policies and strategies, stressing the importance of cohesive, nationally-owned sustainable development strategies supported by integrated national f inancing frameworks.26
National or subnational analytical studies would help in developing policy measures that seek to maximize the potential contribution of forests and trees. These studies could draw on the frameworks for analysis presented in SOFO 2018. Undertaking such national or subnational analytical studies could also help to address institutional barriers by providing a sound evidence base for mainstreaming forest-related polices into national sustainable development policies and strategies, and by building stronger relationships as these strategies are developed. Sound analysis can also help demonstrate that proposed public investment in SFM represents good value. Such an approach is also important in the design of effective policy instruments, ensuring that they are well integrated and avoiding the contrary effects that can arise when sector-specific support measures are developed in isolation from each other. Input from other relevant ministries, departments and agencies will also help ensure that the studies take full account of factors that are external from the forest sector.
26 Paragraphs 55 and 63 of the UN 2030 Agenda on Sustainable Development
| 95 |
CHAPTER 4 MOVING FORWARD
this is to highlight interlinkages and opportunities to support more coherent policy-making across sectors and more effective implementation of the SDGs. Chapter 2 gives details of these thematic metrics and outlines associated data gaps, some of which relate to data that have already been collected but are not yet published in an accessible form. These data gaps can be met by improving globally comparative data on:
} income and employment in the formal SME sector and in the informal sector, disaggregating employment statistics by gender and type of work;
} gender, including gender-disaggregated data on forest management, utilization, management and the decision-making role of women, including their involvement in cooperatives, small enterprises and other business models; gender pay gaps; female students in forestry schools and the support they receive; numbers of female lecturers and incorporation of gender studies in forestry curricula; women in leadership positions;
} the proportions of people employed in the forest sector (in the formal and informal sectors) by ownership type (e.g. state-owned forest, large-scale owner, community owner, smallholder owner) and by rights of tenure/access (e.g. secure rights, customary rights, no rights);
} the collection and use of different NWFPs, and the trade in, collection, use and trade of woodfuel;
} forest-related ecotourism, including visitor numbers and expenditure;
} the contribution of forest ecosystems to biodiversity;
} the availability in cities of accessible green space with tree cover.
Potential sources of information for socio-economic data include livelihood and human well-being surveys, agricultural censuses, and case studies. Countries should also consider including more questions about the use of forests and trees in their agricultural censuses and household surveys. As appropriate, such data should also be incorporated in national accounting systems, and it would be desirable to periodically monitor changes, for example once every f ive years.
As illustrated by the case studies presented in Chapter 3, the focus for incorporating SDGs into development strategies varies according to countries’ level of economic development, their development challenges, geography and climate. Therefore, these analytical studies could start by identifying the SDGs that are most relevant to their circumstances. The studies may also need to examine possible trade-offs, including in time (for example, between short-term costs and longer-term benefits), space (for example, between rural and urban areas), and sectors (for example, where afforestation could lead to loss of agricultural land). They could also identify opportunities for forest-related measures to contribute to a number of SDG targets.
As far as possible, these analytical studies should: quantify the current contribution of forests and trees to the SDGs; identify relevant indicators or metrics for measuring progress; provide further qualitative evidence of their potential contribution; identify data gaps and research needs; highlight SDG-related policies where forests and trees can make the greatest impact; and recommend policy measures for achieving this. Such studies would also benefit from stakeholder participation at all stages, from developing the proposed approach to testing the preliminary f indings. There should also be a commitment to periodically review such studies, in order to monitor progress and take account of new information.
Improve availability and accessibility of data and other information needed to assess and monitor the contribution of forests and trees to SDG targetsThe purpose of the 230 global SDG indicators is to help measure progress towards SDG targets and provide information for evidence-based policy-making. The analysis conducted for Chapter 2 shows that many of the existing SDG indicators are relevant to forests, or could be easily adapted to refer specif ically to them. Bringing together available evidence from a wide range of scientif ic sources, thematic metrics offer the potential of analysing evidence of the broader relationship between forests and trees and the 2030 Agenda beyond SDG15. The aim of
| 96 |
THE STATE OF THE WORLD’S FORESTS 2018
While there is likely to be an associated need for capacity-building in some countries, it will be important that these new data requirements make as much use as possible of existing data, recognizing also the general wish of countries to harmonize reporting and reduce the reporting burden. Data availability can be improved through internal sharing of statistics between sectors within countries so that, for example, those in the forest sector have ready access to socio-economic data to help enhance the socio-economic contributions of forests.
As noted in the conclusions, there are also some areas where more detailed work is required to investigate underlying relationships. These include:
} The role of forests and trees in reducing long-term poverty, including understanding of the informal sector and the role of women. This would benefit from the improved socio-economic data sets identif ied here.
} Forest-water relationships. (A Global Forest Expert Panel is currently undertaking a comprehensive, worldwide assessment of scientif ic knowledge about the interactions and linkages between forests and water, under the auspices of the Collaborative Partnership on Forests.)
} Forest degradation, which is diff icult to define and measure but remains a serious problem, with its adverse impacts on forest ecosystems and the goods and services they provide. It is important to be able to monitor changes and improve understanding of the causes and impacts of forest degradation.
} The impact of natural forest damage on forest-dependent people, the role of forests and trees in mitigating natural disasters and their impacts, and links with climate change. This is needed to help strengthen resilience and adaptive capacity. n
| 97 |
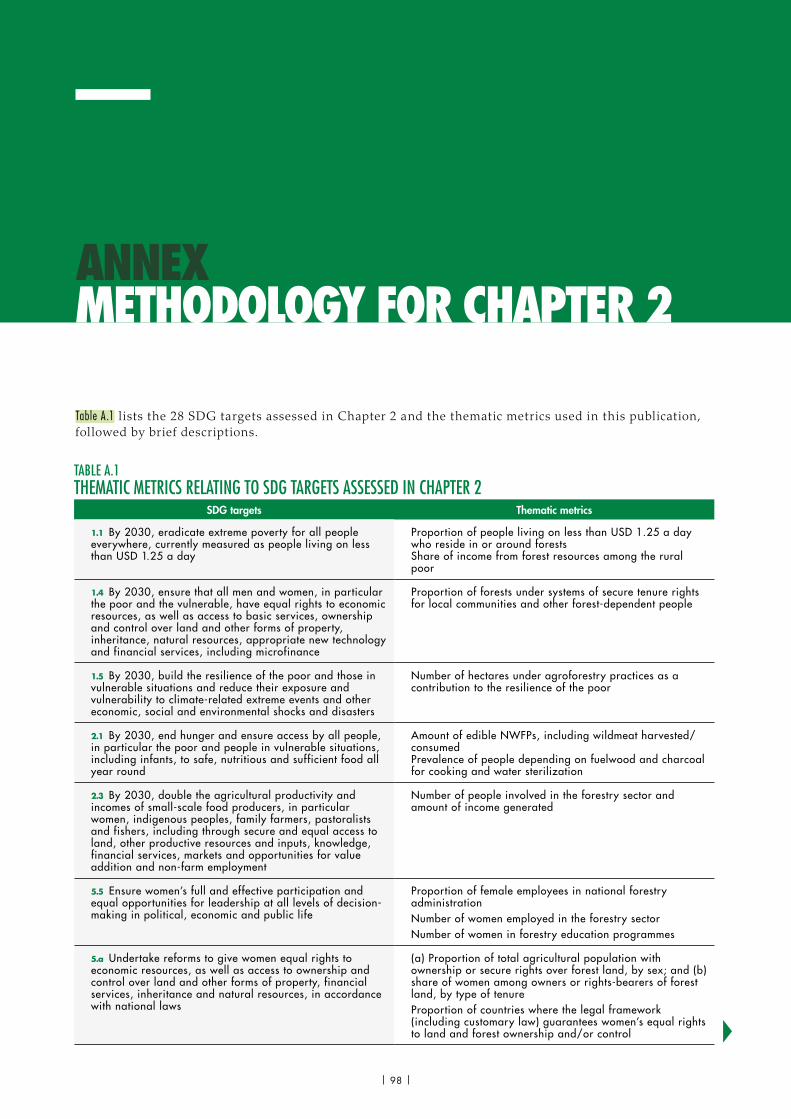
Table A.1 l ists the 28 SDG targets assessed in Chapter 2 and the thematic metrics used in this publication, followed by brief descriptions.
ANNEX METHODOLOGY FOR CHAPTER 2
TABLE A.1THEMATIC METRICS RELATING TO SDG TARGETS ASSESSED IN CHAPTER 2
SDG targets Thematic metrics
1.1 By 2030, eradicate extreme poverty for all people everywhere, currently measured as people living on less than USD 1.25 a day
Proportion of people living on less than USD 1.25 a day who reside in or around forests Share of income from forest resources among the rural poor
1.4 By 2030, ensure that all men and women, in particular the poor and the vulnerable, have equal rights to economic resources, as well as access to basic services, ownership and control over land and other forms of property, inheritance, natural resources, appropriate new technology and financial services, including microfinance
Proportion of forests under systems of secure tenure rights for local communities and other forest-dependent people
1.5 By 2030, build the resilience of the poor and those in vulnerable situations and reduce their exposure and vulnerability to climate-related extreme events and other economic, social and environmental shocks and disasters
Number of hectares under agroforestry practices as a contribution to the resilience of the poor
2.1 By 2030, end hunger and ensure access by all people, in particular the poor and people in vulnerable situations, including infants, to safe, nutritious and sufficient food all year round
Amount of edible NWFPs, including wildmeat harvested/consumed Prevalence of people depending on fuelwood and charcoal for cooking and water sterilization
2.3 By 2030, double the agricultural productivity and incomes of small-scale food producers, in particular women, indigenous peoples, family farmers, pastoralists and fishers, including through secure and equal access to land, other productive resources and inputs, knowledge, financial services, markets and opportunities for value addition and non-farm employment
Number of people involved in the forestry sector and amount of income generated
5.5 Ensure women’s full and effective participation and equal opportunities for leadership at all levels of decision-making in political, economic and public life
Proportion of female employees in national forestry administrationNumber of women employed in the forestry sectorNumber of women in forestry education programmes
5.a Undertake reforms to give women equal rights to economic resources, as well as access to ownership and control over land and other forms of property, financial services, inheritance and natural resources, in accordance with national laws
(a) Proportion of total agricultural population with ownership or secure rights over forest land, by sex; and (b) share of women among owners or rights-bearers of forest land, by type of tenureProportion of countries where the legal framework (including customary law) guarantees women’s equal rights to land and forest ownership and/or control
| 98 |
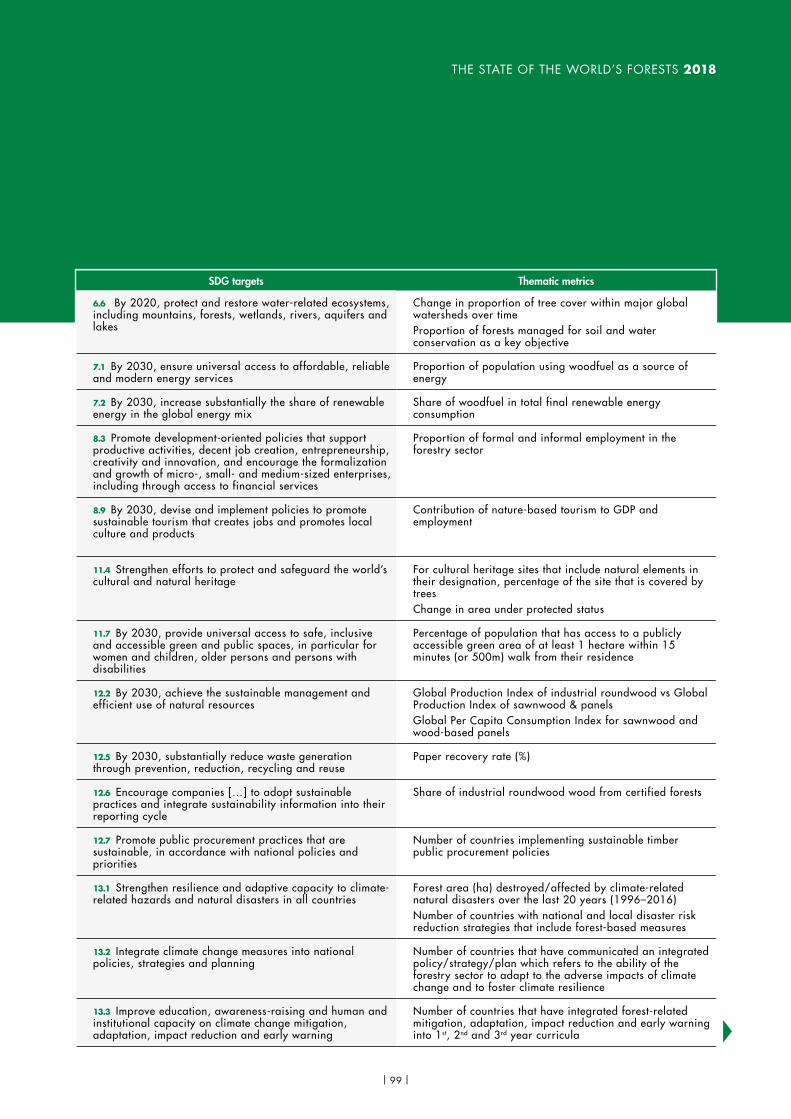
THE STATE OF THE WORLD’S FORESTS 2018
SDG targets Thematic metrics
6.6 By 2020, protect and restore water-related ecosystems, including mountains, forests, wetlands, rivers, aquifers and lakes
Change in proportion of tree cover within major global watersheds over timeProportion of forests managed for soil and water conservation as a key objective
7.1 By 2030, ensure universal access to affordable, reliable and modern energy services
Proportion of population using woodfuel as a source of energy
7.2 By 2030, increase substantially the share of renewable energy in the global energy mix
Share of woodfuel in total final renewable energy consumption
8.3 Promote development-oriented policies that support productive activities, decent job creation, entrepreneurship, creativity and innovation, and encourage the formalization and growth of micro-, small- and medium-sized enterprises, including through access to financial services
Proportion of formal and informal employment in the forestry sector
8.9 By 2030, devise and implement policies to promote sustainable tourism that creates jobs and promotes local culture and products
Contribution of nature-based tourism to GDP and employment
11.4 Strengthen efforts to protect and safeguard the world’s cultural and natural heritage
For cultural heritage sites that include natural elements in their designation, percentage of the site that is covered by trees Change in area under protected status
11.7 By 2030, provide universal access to safe, inclusive and accessible green and public spaces, in particular for women and children, older persons and persons with disabilities
Percentage of population that has access to a publicly accessible green area of at least 1 hectare within 15 minutes (or 500m) walk from their residence
12.2 By 2030, achieve the sustainable management and efficient use of natural resources
Global Production Index of industrial roundwood vs Global Production Index of sawnwood & panelsGlobal Per Capita Consumption Index for sawnwood and wood-based panels
12.5 By 2030, substantially reduce waste generation through prevention, reduction, recycling and reuse
Paper recovery rate (%)
12.6 Encourage companies […] to adopt sustainable practices and integrate sustainability information into their reporting cycle
Share of industrial roundwood wood from certified forests
12.7 Promote public procurement practices that are sustainable, in accordance with national policies and priorities
Number of countries implementing sustainable timber public procurement policies
13.1 Strengthen resilience and adaptive capacity to climate-related hazards and natural disasters in all countries
Forest area (ha) destroyed/affected by climate-related natural disasters over the last 20 years (1996–2016)Number of countries with national and local disaster risk reduction strategies that include forest-based measures
13.2 Integrate climate change measures into national policies, strategies and planning
Number of countries that have communicated an integrated policy/strategy/plan which refers to the ability of the forestry sector to adapt to the adverse impacts of climate change and to foster climate resilience
13.3 Improve education, awareness-raising and human and institutional capacity on climate change mitigation, adaptation, impact reduction and early warning
Number of countries that have integrated forest-related mitigation, adaptation, impact reduction and early warning into 1st, 2nd and 3rd year curricula
| 99 |
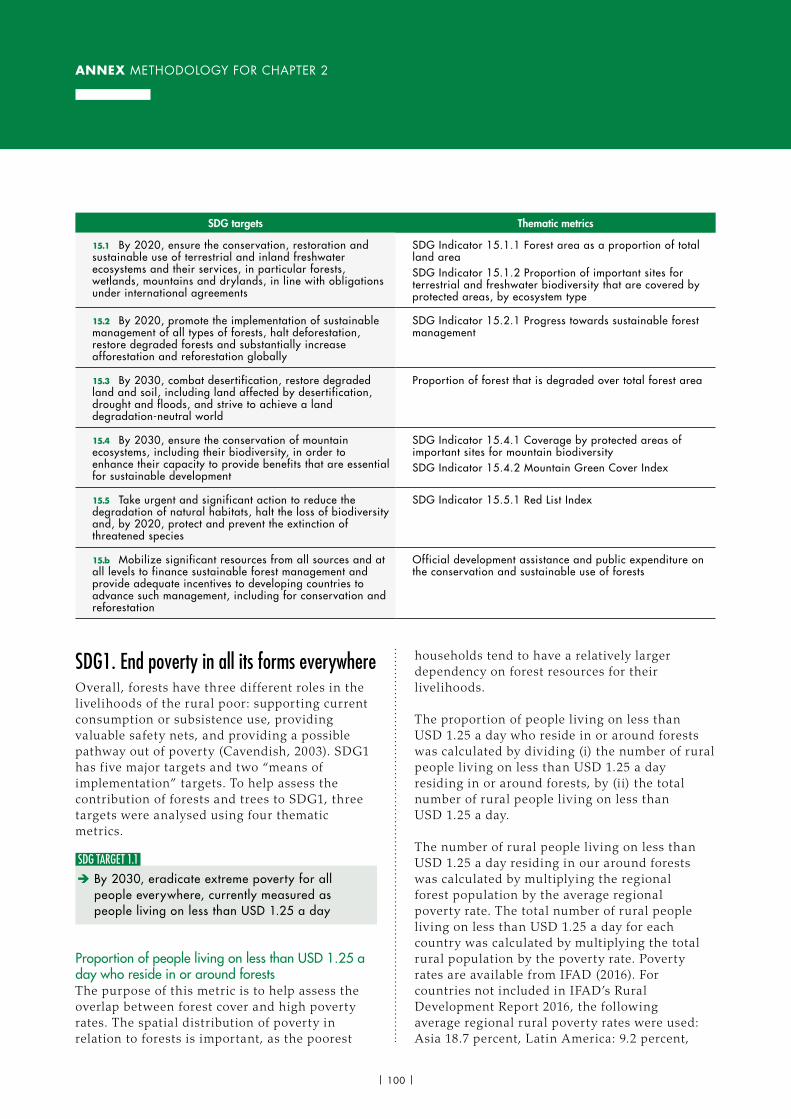
ANNEX METHODOLOGY FOR CHAPTER 2
SDG1. End poverty in all its forms everywhereOverall, forests have three different roles in the livelihoods of the rural poor: supporting current consumption or subsistence use, providing valuable safety nets, and providing a possible pathway out of poverty (Cavendish, 2003). SDG1 has f ive major targets and two “means of implementation” targets. To help assess the contribution of forests and trees to SDG1, three targets were analysed using four thematic metrics.
SDG TARGET 1.1 è By 2030, eradicate extreme poverty for all people everywhere, currently measured as people living on less than USD 1.25 a day
Proportion of people living on less than USD 1.25 a day who reside in or around forests The purpose of this metric is to help assess the overlap between forest cover and high poverty rates. The spatial distribution of poverty in relation to forests is important, as the poorest
households tend to have a relatively larger dependency on forest resources for their livelihoods.
The proportion of people liv ing on less than USD 1.25 a day who reside in or around forests was calculated by dividing (i) the number of rural people liv ing on less than USD 1.25 a day residing in or around forests, by (ii) the total number of rural people liv ing on less than USD 1.25 a day.
The number of rural people liv ing on less than USD 1.25 a day residing in our around forests was calculated by multiplying the regional forest population by the average regional poverty rate. The total number of rural people liv ing on less than USD 1.25 a day for each country was calculated by multiplying the total rural population by the poverty rate. Poverty rates are available from IFAD (2016). For countries not included in IFAD’s Rural Development Report 2016, the following average regional rural poverty rates were used: Asia 18.7 percent, Latin America: 9.2 percent,
SDG targets Thematic metrics
15.1 By 2020, ensure the conservation, restoration and sustainable use of terrestrial and inland freshwater ecosystems and their services, in particular forests, wetlands, mountains and drylands, in line with obligations under international agreements
SDG Indicator 15.1.1 Forest area as a proportion of total land area SDG Indicator 15.1.2 Proportion of important sites for terrestrial and freshwater biodiversity that are covered by protected areas, by ecosystem type
15.2 By 2020, promote the implementation of sustainable management of all types of forests, halt deforestation, restore degraded forests and substantially increase afforestation and reforestation globally
SDG Indicator 15.2.1 Progress towards sustainable forest management
15.3 By 2030, combat desertification, restore degraded land and soil, including land affected by desertification, drought and floods, and strive to achieve a land degradation-neutral world
Proportion of forest that is degraded over total forest area
15.4 By 2030, ensure the conservation of mountain ecosystems, including their biodiversity, in order to enhance their capacity to provide benefits that are essential for sustainable development
SDG Indicator 15.4.1 Coverage by protected areas of important sites for mountain biodiversity SDG Indicator 15.4.2 Mountain Green Cover Index
15.5 Take urgent and significant action to reduce the degradation of natural habitats, halt the loss of biodiversity and, by 2020, protect and prevent the extinction of threatened species
SDG Indicator 15.5.1 Red List Index
15.b Mobilize significant resources from all sources and at all levels to finance sustainable forest management and provide adequate incentives to developing countries to advance such management, including for conservation and reforestation
Official development assistance and public expenditure on the conservation and sustainable use of forests
| 100 |
THE STATE OF THE WORLD’S FORESTS 2018
Africa: 56.1 percent. The forest population (the number of people liv ing in or around forests) was calculated using regional averages for each country as reported by Chomitz et al. (2007); the rural population for each country is available from World Bank datasets.
It is noted that the international poverty line was updated in 2015 to USD 1.90 a day at 2011 prices, and that the SDG indicator will also be updated accordingly, following the decision of the Inter-Agency and Expert Group on SDG Indicators (IAEG-SDGs) in October 2015 to measure extreme poverty by the prevailing “international poverty line”, and the subsequent ratif ication of this decision by the UN Statistical Commission.
Share of income from forest resources among the rural poor The purpose of this metric is to help assess the contribution of forests to supporting poor households’ consumption. The data are based on previous studies (including Angelsen et al., 2014) that have quantif ied the environmental income of rural households as a major livelihood source.
SDG TARGET 1.4 è By 2030, ensure that all men and women, in particular the poor and the vulnerable, have equal rights to economic resources, as well as access to basic services, ownership and control over land and other forms of property, inheritance, natural resources, appropriate new technology and financial services, including microfinance
Proportion of forests under systems of secure tenure rights for local communities and other forest-dependent people The purpose of this metric is to help assess progress towards secure tenure rights for local communities and other forest-dependent people. Data sources are the Global Forest Resources Assessment (FAO, 2015a) and RRI (2014).
SDG TARGET 1.5 è By 2030, build the resilience of the poor and those in vulnerable situations and reduce their exposure and vulnerability to climate-related extreme events and other economic, social and environmental shocks and disasters
Number of hectares under agroforestry practices as a contribution to the resilience of the poor The purpose of this metric is to help assess the contribution of forests and trees to supporting livelihood resilience through agroforestry by giving an indication of tree cover in agricultural landscapes. Data were adapted from Zomer et al., (2009).
SDG2. End hunger, achieve food security and improved nutrition and promote sustainable agricultureTo help assess the contribution of forests and trees to SDG2, two targets were analysed using three thematic metrics.
SDG TARGET 2.1 è By 2030, end hunger and ensure access by all people, in particular the poor and people in vulnerable situations, including infants, to safe, nutritious and sufficient food all year round
Amount of edible NWFPs, including wildmeat harvested/consumed The purpose of this metric is to highlight the role of forests and trees in providing food items of plant and animal origin that are used by forest-dependent people to meet their food requirements, diversify their diets, or generate income. Data sources include published literature and case studies.
Prevalence of people depending on fuelwood and charcoal for cooking and water sterilization The purpose of this metric is to highlight the importance of woodfuel for food security and nutrition. Data sources include published literature and case studies.
SDG TARGET 2.3 è By 2030, double the agricultural productivity and incomes of small-scale food producers, in particular women, indigenous peoples, family farmers, pastoralists and fishers, including through secure and equal access to land, other productive resources and inputs, knowledge, financial services, markets and opportunities for value addition and non-farm employment
| 101 |
ANNEX METHODOLOGY FOR CHAPTER 2
Number of people involved in the forestry sector and amount of income generatedThe purpose of this metric is to demonstrate the role of forests and trees in providing income that people can use to buy food. Data sources include published literature and case studies.
SDG5. Achieve gender equality and empower all women and girls To help assess the contribution of forests and trees to SDG5, two targets were analysed using five thematic metrics. These targets focus on women’s participation in decision-making through their presence in high-level and managerial positions. It should however be noted that much gender inequality is rooted in wider society beyond the forest sector, which means that one particular sector has limits to its ability to tackle overarching societal challenges. Nonetheless, given the scale and the nature of opportunities that the forest sector presents, it has the potential to help overcome gender inequality within and beyond the sector.
SDG TARGET 5.5 è Ensure women’s full and effective participation and equal opportunities for leadership at all levels of decision-making in political, economic and public life
Proportion of female employees in national forestry administration; Number of women employed in the forestry sector; and Number of women in forestry education programmesThe purpose of these metrics was to help assess progress towards increasing the role of women in the formal forest sector, and to acknowledge the importance of education for gender equality in the forestry sector. Data sources include published literature and case studies.
SDG TARGET 5.A è Undertake reforms to give women equal rights to economic resources, as well as access to ownership and control over land and other forms of property, financial services, inheritance and natural resources, in accordance with national laws
(a) Proportion of total agricultural population with ownership or secure rights over forest land, by sex; and (b) share of women among owners or rights-bearers of forest land, by type of tenure; and(c) Proportion of countries where the legal framework (including customary law) guarantees women’s equal rights to land and forest ownership and/or controlThe purpose of these metrics is to help assess women’s rights of access to the economic resources associated with forests and trees, as this is important for livelihood resilience. In addition, women's legally formalized rights to land and forests are an important step towards advancing the goal of gender equality. Data sources include published literature and case studies.
SDG6. Ensure availability and sustainable management of water and sanitation for allTo help assess the contribution of forests and trees to SDG6, one target was analysed using two thematic metrics.
SDG TARGET 6.6 è By 2020, protect and restore water-related ecosystems, including mountains, forests, wetlands, rivers, aquifers and lakes
Change in proportion of tree cover within major global watersheds over timeThe purpose of this metric was to highlight the fact that all forests and tree-based ecosystems inf luence water and to recognize that forest-water relationships extend beyond political boundaries. Sources include the WRI Global Forest Watch – Water/Aqueduct data, which include geospatial tree cover data from Hansen et al. (2013) by major global watershed, or by hydroshed as defined by FAO (2011b). The proportion of tree cover area by major global watershed was calculated as a ratio of tree cover within the watershed, and total watershed area; this ratio was calculated for both 2000 and 2015. Changes in tree cover were calculated as the difference between historic tree cover (as proposed by Hansen et al. [2013]) and tree cover in 2000 and 2015.
Regarding risk of erosion, f ire and base water stress (BWS), scores 1–5 (1 being the lowest risk and 5 being the highest) were designated for each
| 102 |
THE STATE OF THE WORLD’S FORESTS 2018
watershed. In the case of erosion and fire, these were already included in the WRI data; for BWS, a similar 1–5 score was applied to the colour system of the maps provided by Global Forest Watch – Water, with scores based on visual analysis. The major global watersheds were then counted based on the proportion of tree cover lost and the risk score, and then divided by the total number of watersheds to get the percentage of watersheds that have the associated proportion of tree cover loss and risk.
Proportion of forests managed for soil and water conservation as a key objective The purpose of this metric was to help assess the contribution of forest management for soil and water conservation to the achievement of SDG6. Data sources include the Global Forest Resources Assessment (FAO, 2015a). For each country, the proportion of forest with protection of soil and water as a main management objective was calculated in relation to the total forested area in the country. A similar analysis was also conducted for the main regions of the world. In addition, analysis was carried out to report on the percentage of national forests that are managed for the following specific objectives: coastal stabilization, clean water and erosion, avalanche and desertif ication control.
SDG7. Ensure access to affordable, reliable, sustainable and modern energy for allTo help assess the contribution of forests and trees to SDG7, two targets were analysed using two thematic metrics.
SDG TARGET 7.1 è By 2030, ensure universal access to affordable, reliable and modern energy services
Proportion of population using woodfuel as a source of energyAs the SDG Indicator 7.1.2 covers any clean fuels and technologies that support access to affordable, reliable and modern energy services, including clean and efficient use of woodfuel, the purpose of this metric is to help to measure the contribution of forests and trees to universal energy access. It adopts the proportion of the population relying on woodfuel for basic energy services (cooking and heating).
SDG TARGET 7.2 è By 2030, increase substantially the share of renewable energy in the global energy mix
Share of woodfuel in total final renewable energy consumption The purpose of this metric is to help to assess the contribution of forests and trees to increasing the share of renewable energy in the global energy mix. Woodfuel and hydropower are currently the two major forms of renewable energy sources most relevant to forests. A limitation of this metric is that woodfuel is only renewable if it comes from sustainable sources.
SDG8. Promote sustained, inclusive and sustainable economic growth, full and productive employment and decent work for allTo help assess the contribution of forests and trees to SDG8, two targets were analysed using two thematic metrics.
SDG TARGET 8.3 è Promote development-oriented policies that support productive activities, decent job creation, entrepreneurship, creativity and innovation, and encourage the formalization and growth of micro-, small- and medium-sized enterprises, including through access to financial services
Proportion of formal and informal employment in the forestry sectorIt is important to have the most reliable available data on formal and informal employment in the forest sector. Information relating to formal employment is available from existing statistics, but estimating informal employment is more diff icult: ILOSTAT contains statistics on the share of informal employment in non-agriculture activ ities for 62 countries, but it is not possible to extract f igures on forest-related informal employment. In order to estimate the share of informal employment from total employment in forestry, an extensive literature review was performed.
Estimates of informal employment were also made, building on the relationship between own-account workers and informal
| 103 |
ANNEX METHODOLOGY FOR CHAPTER 2
employment. ILO releases employment status as one of the key indicators for all countries and regions measured yearly. The indicator is composed of the categories of employees, employers, own-account workers, and contributing family workers (total of all sectors). ILO uses the term ‘vulnerable employment form’ for own-account workers and ‘unpaid family workers’ when describing employment conditions in developing regions.27 The proportion of own-account and contributing family workers in total employment is one of the indicators that were followed in the Millennium Development Goals Database, showing that informal employment and the prevalence of different forms of employment may be conceptually related in developing country contexts. To understand how well the frequency of own-account employment in a country could inform views about the prevalence of informal workers, a correlation analysis was performed of the cross-section of the share (percentage) of own-account workers and the share of non-agricultural informal employment in a sample of countries for which informal employment was available. The analysis was conducted based on the ILO statistics database from 2016 for the employee status of own-account worker, as well as on the latest observations available for informal employment. It shows that the indicators are correlated with the Pearson correlation coefficient at 0.6. This implies that when there is a share of formal sector own-account workers in low-income countries, there also tends to be a share of informal workers in that country. A corresponding analysis was conducted for the gender breakdown of the two data series. The conclusion remained the same, although the correlation coefficient is slightly higher for female than for male workers. This method has some limitations: estimates rest on the statistical relationship between informal non-agricultural employment and the share of own-account workers. The data on informal employment was limited, with only 44 countries included; it was assumed
27 http://www.ilo.org/addisababa/whats-new/WCMS_377286/lang--en/index.htm
that share of forest employment as a percentage of total employment is the same in the informal and formal sectors.
SDG TARGET 8.9 è By 2030, devise and implement policies to promote sustainable tourism that creates jobs and promotes local culture and products
Contribution of nature-based tourism to GDP and employment This metric assesses nature-based tourism, as forest-based tourism has the potential to improve livelihoods and the sustainable management of forests. As forests cover approximately 30 percent of global land area, it seems plausible to consider that a significant part of terrestrial nature-based tourism occurs in forests, or at least in landscapes that also include forest ecosystems. This thematic metric therefore adopted contributions from nature-based tourism to GDP and employment as a proxy. There is no data on forest-based ecotourism available for now, as there are no comprehensive data sets available on the economic importance of tourism and the statistical methodology for measuring sustainable tourism is still currently under development. More detailed data would be needed in order to calculate the direct GDP from forest-based ecotourism as a proportion of total GDP and the associated growth rates. Data sources include published literature, country case studies and information from industry publications.
SDG11. Make cities and human settlements inclusive, safe, resilient and sustainableTo help assess the contribution of forests and trees to SDG11, two targets were analysed using three thematic metrics.
SDG TARGET 11.4 è Strengthen efforts to protect and safeguard the world’s cultural and natural heritage
For cultural heritage sites that include natural elements in their designation, percentage of the site that is covered by trees; andChange in area under protected status
| 104 |
THE STATE OF THE WORLD’S FORESTS 2018
The purpose of these metrics is to highlight the role of forests and trees in contributing to cultural and natural heritage. Thematic metric 11.4.1a uses UNESCO data to assess the frequency with which urban WHS include natural elements as a key component for their designation or in their management. Thematic metric 11.4.1b uses the World Database on Protected Areas (WDPA, July 2017 version) to assess the increase in PAs in and around cities, using IUCN categories II, III, IV, V, VI.28
Protected area boundaries were crossed with the perimeters of urban areas in each country to assess the extent of change in protected area over time. This was computed over the 2000–2017 period, using as a reference the designation date reported in the WDPA database. Any increase in protected area surface for categories II to VI was considered.
SDG TARGET 11.7 è By 2030, provide universal access to safe, inclusive and accessible, green and public spaces, in particular for women, children, older persons and persons with disabilities
Percentage of population that has access to a publicly accessible green area of at least 1 hectare within 15 minutes (or 500 m) walk from their residence The purpose of this metric is to help assess the accessibility of green space in urban areas. A number of factors (such as distance, distribution, typology and quality of space) contribute to accessibility: simply measuring the amount of urban open space per capita is insufficient. Different countries have adopted slightly different criteria to measure accessibility. For example, one for Germany sets the following standards: a dweller can be considered to have adequate access to green spaces if he/she lives at walking distance (300 metres straight-line distance, or 500 metres on paths), or around 10–15 min on foot, from a medium-sized (1-10 hectare) green area, and at medium walking distance (700 metres' straight-line distance, or 1000 metres by path), or around 20 min on foot from a large (>10 hectare) green area. Data sources are published literature and information produced by official bodies.
28 https://www.protectedplanet.net/c/wdpa-lookup-tables
SDG12. Ensure sustainable consumption and production patternsTo help assess the contribution of forests and trees to SDG12, four targets were analysed using five thematic metrics.
SDG TARGET 12.2 è By 2030, achieve the sustainable management and efficient use of natural resources
Global Production Index of industrial roundwood vs Global Production Index of sawnwood and panelsThe purpose of this metric is to demonstrate progress towards improved efficiency of wood use. Production of industrial roundwood reflects the extraction of wood (the primary resource) that is then processed to produce value-added products (sawnwood and panels). This metric also reflects technological improvements in conversion, although available data on conversion factors are fragmented, and comparisons between countries and over time can be problematic. A limitation of this metric is that it only addresses sustainable management in relation to the production of industrial roundwood, but not other forest products. Data are available from the FAOSTAT database (FAO, 2017d). As FAO statistics lack data on post-consumer (recycled) wood supply and use, an example is presented for European countries based on data from the European Panel Federation.
Global Per Capita Consumption Index for sawnwood and wood-based panels The purpose of this metric is to ref lect trends in the average level of wood products used to meet f inal demand in the economy. Data are available from the FAOSTAT–Forestry database (FAO, 2017d) and 2000 was used as a base year for the index.
SDG TARGET 12.5 è By 2030, substantially reduce waste generation through prevention, reduction, recycling and reuse
Paper recovery rate (percentage)The purpose of this metric is to show progress towards reduction of waste through recycling, using the paper recovery rate (percentage). The recycling rate is calculated by dividing the quantity of collected recovered paper by total consumption
| 105 |
ANNEX METHODOLOGY FOR CHAPTER 2
Number of countries implementing sustainable timber public procurement policiesThe purpose of this metric is to measure progress towards the promotion of public procurement practices for forest products. Data are available from published sources.
SDG13. Take urgent action to combat climate change and its impacts To help assess the contribution of forests and trees to SDG13, three targets were analysed using five thematic metrics.
SDG TARGET 13.1 è Strengthen resilience and adaptive capacity to climate-related hazards and natural disasters in all countries
Forest area (hectares) destroyed/affected by climate-related natural disasters over the last 20 years (1996–2016)The purpose of this metric is to help assess the impact of climate-related natural disasters on forest area. Although some uncertainty remains, the literature increasingly indicates that the global increase in intense f loods, storms, droughts, and heatwaves likely has a link to climate change (Thomas and Lopez, 2015). Drawing attention to the impact of these climate-related disasters on forest resources can help mobilize broader climate action and may influence a shift towards a low-carbon, green growth path. Data sources include published literature and the Global Forest Resources Assessments (FAO, 2005, 2015a).
SDG TARGET 13.2 è Integrate climate change measures into national policies, strategies and planning
Number of countries with national and local disaster risk reduction (DRR) strategies that include forest-based measures; andNumber of countries that have communicated an integrated policy/strategy/plan which refers to the ability of the forestry sector to adapt to the adverse impacts of climate change and to foster climate resilienceThese metrics make use of analysis of country reports to assess the importance that countries place on forests and trees in their DRR strategies and climate change adaptation policies. The main
of paper and paperboard. Data are available from the FAOSTAT–Forestry database (FAO, 2017d).
SDG TARGET 12.6 è Encourage companies […] to adopt sustainable practices and integrate sustainability information into their reporting cycle
Share of industrial roundwood wood from certified forests The purpose of this metric is to assess progress towards the adoption of sustainable practices by the whole forest sector value chain at the global level, using information about the share of certif ied wood products coming from sustainably-managed forests, as verif ied by FSC and PEFC. As a market-based mechanism, forest certif ication encourages companies to adopt sustainable practices in order to demonstrate their commitment to sustainability. Labelling also provides information for customers who want to buy sustainable forest products. In aggregating certif ication data from FSC and PEFC, account is taken of the double counting that can arise when certif icates are required from both schemes due to different customer requirements. FSC and PEFC recognize this problem. In May 2017 FSC and PEFC jointly stated that at the end of 2016, FSC had reported a total certif ied area of 196 million hectares and PEFC of 301 million hectares, giving a combined area of 497 million hectares. However, based on their joint research they had concluded that at the end of 2016 almost 69 million hectares (or 16 percent) of the global forest area was double certif ied.29 Since companies also use zero deforestation commitments as an indication of their progress towards sustainable production and consumption, data published by Forest Trends (Donofrio, 2017) was included in Chapter 2.
SDG TARGET 12.7 è Promote public procurement practices that are sustainable, in accordance with national policies and priorities
29 www.pefc.org/news-a-media/general-sfm-news/2370-double-certification-on-the-rise-joint-pefc-fsc-data-shows/
| 106 |
THE STATE OF THE WORLD’S FORESTS 2018
data sources are the relevant country reports to the United Nations International Strategy for Disaster Reduction (UNISDR), Nationally Determined Contributions (NDC), National Communications (NC), National Adaptation Programmes of Action (NAPAs) and National Adaptation Plans (NAPs).
SDG TARGET 13.3 è Improve education, awareness-raising and human and institutional capacity on climate change mitigation, adaptation, impact reduction and early warning
Number of countries that have integrated forest-related mitigation, adaptation, impact reduction and early warning into 1st, 2nd, and 3rd year curricula The purpose of this metric is to track progress towards integrating information about the role of forests into educational curricula. Data sources include country reports on the status of climate change education contained within the documents listed above, as well as country reports to UNESCO on Education for Sustainable Development, including the websites of the Global Forest Information Service and the Global Alliance for Disaster Risk Reduction and Resilience in the Education Sector.
SDG15. Protect, restore and promote sustainable use of terrestrial ecosystems, sustainably manage forests, combat desertification, and halt and reverse land degradation and halt biodiversity lossChapter 2 uses six SDG indicators to assess progress towards four of the SDG15 targets. In addition, to help further assess the contribution of forests and trees to SDG15, two other targets were analysed using two thematic metrics.
The six SDG indicators are: } 15.1.1 Forest area as a proportion of total land
area } 15.1.2 Proportion of important sites for
terrestrial and freshwater biodiversity that are covered by protected areas, by ecosystem type
} 15.2.1 Progress towards sustainable forest management
} 15.4.1 Coverage by protected areas of important sites for mountain biodiversity
} 15.4.2 Mountain Green Cover Index } 15.5.1 Red List Index (Tier 1 SDG indicator)
The two thematic metrics are:
SDG TARGET 15.3 è By 2030, combat desertification, restore degraded land and soil, including land affected by desertification, drought and floods, and strive to achieve a land degradation-neutral world
Proportion of forest that is degraded over total forest area The purpose of this metric is to improve understanding of forest degradation, but as noted in Chapter 2 data sources are currently weak.
SDG TARGET 15.B è Mobilize significant resources from all sources and at all levels to finance sustainable forest management and provide adequate incentives to developing countries to advance such management, including for conservation and reforestation
Official development assistance (ODA) and public expenditure on conservation and sustainable use of forests The purpose of this metric is to highlight the level of ODA and public expenditure on the conservation and sustainable use of forests. Data are available for forest-related ODA on the OECD website. n
| 107 |
REFERENCESAbidoye, B., Mungatana, E., Mahlalela, L., Sacolo, T. & Babalola, F. 2015. Forest Ecosystems in the transition to a green economy and the role of REDD+ in the United Republic of Tanzania. United Nations Environment Programme, Nairobi.
Agarwal, B. 2001. Participatory exclusions, community forestry, and gender: An analysis for South Asia and a conceptual framework. World Development, 29(10): 1623–1648.
Agarwal, B. 2009. Rule making in community forestry institutions: The difference women make. Ecological Economics, 68(8–9): 2296–2308.
Agarwal, B. 2010. Does Women’s Proportional Strength Affect their Participation? Governing Local Forests in South Asia. World Development, 38(1): 98–112.
Agrawal, A., Cashore, B., Hardin, R., Shepherd, G., Benson, C. & Miller, D. 2013. Economic Contributions of Forests. Background paper prepared for the tenth session of the United Nations Forum on Forests held in Istanbul, 8-19 April 2013. (available at www.un.org/esa/forests/pdf/session_documents/unff10/EcoContrForests.pdf).
Allen, C.D., Breshears, D.D. & McDowell, N.G. 2015. On underestimation of global vulnerability to tree mortality and forest die-off from hotter drought in the Anthropocene. Ecosphere, 6(8):129.
Ambiente Italia Research Institute. 2003. European Common Indicators: Towards a Local Sustainability Profile. Final Report. Milano, Italy. (available at https://www.gdrc.org/uem/footprints/eci_final_report.pdf).
Anderson, H.M., & Olson, J.T. 1991. Federal forests and the economic base of the Pacific Northwest: A study of regional transitions. The Wilderness Society, Washington, DC.
Angelsen, A., Jagger, P., Babigumira, R., Belcher, B., Hogarth, N.J., Bauch, S., Borner, J., Smith-Hall, C. & Wunder, S. 2014. Environmental income and rural livelihoods: A global-comparative analysis. World Development, 64(1): S12–S28.
Arias, M., Cochrane, T.A., Lawrence, K.S., Kileen, T.J. & Farrell, T.A. 2011. Paying the forest for electricity: a modelling framework to market forest conservation as payment for ecosystem services benefiting hydropower generation. Environmental Conservation, Vol. 38, Issue 4, 473–484.
Aruna, P.B., Cubbage, F., Abt, K. & Redmond, C. 1997. Regional economic contributions of the forest-based industries in the south. Forest Products Journal, July/August 47:35–45.
Balmford, A., Beresford, J., Green, J., Naidoo, R., Walpole, M. & Manica, A. 2009. A Global Perspective on Trends in Nature-Based Tourism. PLOS Biology, 7(6): e1000144. (available at http://journals.plos.org/plosbiology/article?id=10.1371/journal.pbio.1000144)
Balmford A., Green J.M.H., Anderson M., Beresford J., Huang C., Naidoo, R., Walpole, M. & Manica, A. 2015. Walk on the Wild Side: Estimating the Global Magnitude of Visits to Protected Areas. PLOS Biology,
13(2): e1002074. (available at http://journals.plos.org/plosbiology/article?id=10.1371/journal.pbio.1002074).
Barrett, K. 2017. Lima Kicks Off Development of 30-Year Green Infrastructure Plan. Ecosystem Martketplace. 3 March 2017. (available at: http://www.ecosystemmarketplace.com/articles/lima-kicks-off-development-30-year-green-infrastructure-plan. Accessed: 12 September 2017.)
Benson, E., Best, S., del Pozo-Vergnes, E., Garside, B., Mohammed, E.Y., Panhuysen, S., Piras, G., Vorley, B., Walnycki, A. & Wilson, E. 2014. Informal and Green? The forgotten voice in the transition to a green economy. IIED Discussion Paper. International Institute of Environment and Development, London.
Beyene, A., Bluffstone, R., Gebreegzhiaber, Z., Martinsson, P., Mekonnen A. & Vieider, F. 2015. Do improved biomass cookstoves reduce fuelwood consumption and carbon emissions? Evidence from rural Ethiopia using a randomized treatment trial with electronic monitoring. Policy Research Working Paper WPS 7324, World Bank Group.
Biao, Z., Wenhua, L., Gaodi, X. & Yu, X. 2010. Water conservation of forest ecosystem in Beijing and its value. Ecological Economics, 69:1416–1426.
Binkley, C.S., Percy, M., W.A. Thompson, W.A. & Vertinsky, I.B. 1994. A general equilibrium analysis of the economic impact of a reduction in harvest levels in British Columbia. The Forestry Chronicle, 70(4):449–454.
Blackie, R., Baldauf, C., Gautier, D., Gumbo, D., Kassa, H., Parthasarathy, N., Paumgarten, F., Sola, P., Pulla, S., Waeber P. & Sunderland, T.C.H. 2014. Tropical dry forests: the state of global knowledge and recommendation for future research. Center for International Forestry Research, Bogor, Indonesia.
Blaney, S., Beaudry, M. & Latham, M. 2009. Contribution of natural resources to nutritional status in a protected area of Gabon. Food & Nutrition Bulletin, 30(1): 49–62.
Boone, C.G., Buckley, G.L., Grove, J.M., & Sister, C. 2009. Parks and people: An environmental justice inquiry in Baltimore, Maryland. Annals of the Association of American Geographers, 99(4), 767–787.
Borregaard. 2017. (accessed 1 March 2018) Retrieved from http://www.borregaard.com/About-us.
Bösch, M., Weimar, H. & Dieter, M. 2015. Input–output evaluation of Germany’s national cluster of forest-based industries. European Journal of Forest Research, 134(5): 899–910.
Brack, D. 2014. Promoting Legal and Sustainable Timber: Using Public Procurement Policy. Research Paper, Energy Environment and Resources, the Royal Institute of International Affairs, Chatham House, London. (available at https://www.chathamhouse.org/publication/promoting-legal-and-sustainable-timber-using-public-procurement-policy).
| 108 |
Brack, D. 2017. Woody biomass for power and heat: Impacts on the global climate. Chatham House, London. (avalaible at: https://www.chathamhouse.org/publication/woody-biomass-power-and-heat-impacts-global-climate).
Brandeis, C. & Hodges, D.G. 2015. Forest sector and primary forest products industry contributions to the economies of the southern states: 2011 update. Journal of Forestry, 113(2):205–209. (avalaible at: https://www.chathamhouse.org/publication/woody-biomass-power-and-heat-impacts-global-climate).
Brooks T.M., Butchart S.H.M., Cox N.A., Heath M., Hilton-Taylor C., Hoffmann M., Kingston N., Rodríguez J.P., Stuart S.N. & Smart J. 2015. Harnessing biodiversity and conservation knowledge products to track the Aichi Targets and Sustainable Development Goals. Biodiversity, 16 (2-3): 157–174. (available at https://doi.org/10.1080/14888386.2015.1075903).
Bruijnzeel, L.A. 2014. Hydrological functions of tropical forests: not seeing the soil for the trees? Agriculture, Ecosystems and Environment, 104:185–228.
Buchy, M. & Rai, B. 2008. Do women-only approaches to natural resource management help women? The case of community forestry in Nepal. Resurreccion, B.P. & Elmhirst, R. (eds.) In: Gender and natural resource management: livelihoods, mobility and interventions, pp. 127–150. Earthscan Publications, London.
Cavendish, W. 1999. Poverty, inequality and environmental resources: quantitative analysis of rural households. Centre for the Study of African Economies working paper series 1999-09. University of Oxford, UK.
Cavendish, W. 2003. How do forests support, insure and improve the livelihoods of the rural poor? A Research Note. Center for International Forestry Research, Bogor, Indonesia.
CEPI, 2014. Resource efficiency in the pulp and paper industry: Making more from our natural resources. Confederation of European Paper Industries, Brussels. (available at http://www.cepi.org/node/17878).
Centre for Civil Society. 2015. Forest-based bamboo trade in Mendha Lekha and Jamguda. Working Paper.
Cerutti, P. 2016. Domestic tropical timber markets: informal, illegal and unsustainable? Presentation at The biggest ‘private sector’: what place for the informal economy in green and inclusive growth?, held in London, 25 February 2016. (available at https://www.slideshare.net/IIEDslides/domestic-tropical-timber-markets-informal-illegal-and-unsustainable).
Chao, S. 2012. Forest peoples: numbers across the world. Forest Peoples Programme, Moreton-in-Marsh, UK.
Chatham House. 2017. Chatham House Resource Trade Database. Retrieved from https://resourcetrade.earth/data?year=2015&category=1001&units=weight (last accessed on 30 July 2017).
Chomitz, K.M., Buys, P., de Luca, G., Thomas, T.S., & Wertz-Kanounnikoff, S. 2007. Overview: At loggerheads? Agricultural expansion, poverty reduction, and environment in the tropical forests. The International Bank for Reconstruction and Development/ The World Bank: Washington, DC. Available at http://siteresources.worldbank.org/INTTROPICALFOREST/
Christensen, M., Bhattarai, Devkota, S. & Larson, H.O. 2008. Collection and use of wild edible fungi in Nepal. Economic Botany, 61(1): 12–23.
Christie, M.E. & Giri, K. 2011. Challenges and experiences of women in the forestry sector in Nepal. International Journal of Sociology and Anthropology, 3(5): 139.
CIFOR info brief. 2017. Decoding Cameroon’s domestic timber trade. Forest News 26 Jan 2017, Center for International Forestry Research, Bogor, Indonesia. (available at: https://forestsnews.cifor.org/47684/decoding-cameroons-domestic-timber-trade?fnl=en. Accessed 15 December 2017).
Clark, K.H. & Nicholas, K.A. 2013. Introducing urban food forestry: a multifunctional approach to increase food security and provide ecosystem services. Landscape Ecology, 28(9): 1649–1669.
Cleveland C.J. & Morris C. 2009. Dictionary of Energy (1st Edition). Elsevier Science, Oxford, UK.
Cohen, D.A., McKenzie T.L., Sehgal A., Williamson, S., Golinelli, D. & Lurie, N. 2007. Contribution of public parks to physical activity. American Journal of Preventive Medicine, 97:509–514.
Coleman, E.A. & Mwangi, E. 2013. Women’s participation in forest management: A cross-country analysis. Global Environmental Change, 23(1): 193–205.
Colfer, C.J. P. & Capistrano, D. (eds.) 2005. The Politics of Decentralization: Forest, People and Power. Earthscan Publications, London.
Colfer, C.J. P., Elias, M., Sijapati Basnett, B. & Stevens Hummel, S. 2017. The Earthscan reader on gender and forests, Routledge, Abingdon, UK.
Consejo Civil Mexicano para la Silvicultura Sostenible. 2014. New evidence that Mexico's community forests protect the environment, reduce poverty, and promote social peace. CCMSS, Mexico City.
Conservation International. undated. A Practical Guide to Good Practice for Tropical Forest-Based Tours, developed in partnership with Rainforest Alliance and the United Nations Environment Programme. 62 p. (available at https://www.rainforest-alliance.org/business/tourism/documents/good_practice.pdf)
Corradini, G. & Pettenella, D. forthcoming. Promoting NWFPs: branding, standards and certification. To be published in COST Action FP1203 book on European NWFPs.
| 109 |
REFERENCES
Cowie, A.L., Orr, B.J., Castillo Sanchez, V.M., Chasek, P., Crossman, N.D., Erlewein, A., Louwagie, G., et al. 2017. Land in balance: The scientific conceptual framework for Land Degradation Neutrality. Environmental Science and Policy, 79 (2018): 25–35.
Crowley, T., Ni Dhubháin, Á. & Moloney, R. 2001. The economic impact of forestry in the Ballyvourney area of County Cork, Ireland. Forest Policy and Economics, 3(1–2):31-43.
Cuevas, S., Mina, C., Barcenas, M. & Rosario, A. 2009. Informal employment in Indonesia. Asian Development Bank Working Paper Series, No. 156. Asian Development Bank, Metro Manila, Philippines.
Dadvand, P., Villanueva, C. M., Font-Ribera, L., Martinez, D., Basagaña, X., Belmonte, J., Vrijheid, M., et al. 2014. Risks and benefits of green spaces for children: a cross-sectional study of associations with sedentary behavior, obesity, asthma, and allergy. Environmental health perspectives, 122(12), 1329.
da Silva, J.A. & Cernat, L. 2012. Coping with loss: The impact of natural disasters on developing countries’ trade flows. VOX CEPR’s Policy Portal. (available at http://voxeu.org/article/trade-effects-natural-disasters-new-evidence-developing-countries).
Dawson, I. K., Leakey, R., Clement, C.R., Weber, J.C., Cornelius, J.P., Roshetko, J.M., Vinceti, B., et al. 2014. The management of tree genetic resources and the livelihoods of rural communities in the tropics: Non-timber forest products, smallholder agroforestry practices and tree commodity crops. Forest Ecology and Management, 333: 9–21.
de Leeuw, J., Njenga, M., Wagner, B. & Iiyama, M. (eds.) 2014. Treesilience: An assessment of the resilience provided by trees in the drylands of Eastern Africa. World Agroforestry Centre, Nairobi, Kenya.
Démurger, S. & Fournier, M. 2011. Poverty and firewood consumption: A case study of rural households in northern China. China Economic Review, Elsevier, 22(4): 512–523.
Dewees, P. A. 1989. The woodfuel crisis reconsidered: Observations on the dynamics of abundance and scarcity. World Development, 17(8): 1159–1172.
Ding, H., Veit, P. G., Blackman, A., Gray, E., Reytar, K., Altamirano, J. C. & Hodgdon, B. 2016. Climate Benefits, Tenure Costs: The economic case for securing indigenous land rights in the Amazon. World Resources Institute, Washington, DC.
Djoudi, H. & Brockhaus, M. 2011. Is adaptation to climate change gender neutral? Lessons from communities dependent on livestock and forests in Northern Mali. International Forestry Review, 13(2): 123–135.
Donofrio, S., Leonard, J. & Rothrock, P. 2017. Supply change: Tracking corporate commitments to deforestation-free supply chains. Forest Trends, Washington, DC. (available at http://forest-trends.org/releases/p/supply_change_2017).
Dudley, N. & Stolton, S. 2003. Running Pure: The importance of forest protected areas to drinking water. A research report for the World Bank
and WWF Alliance for Forest Conservation and Sustainable Use. World Bank, Washington, DC.
Durst, P. B., Johnson, D.V., Leslie, R.N. & Shono, K. 2010. Forest insects as food: humans bite back. Proceedings of a workshop on Asia-Pacific resources and their potential for development held in Chiang Mai, Thailand, 19-21 February 2008. FAO Regional Office for Asia and the Pacific, Bangkok, Thailand, 2010. (available at http://www.fao.org/docrep/012/i1380e/i1380e00.pdf).
Eba'a Atyi, R., Ngouhouo Poufoun, J., Mvondo Awono, J. P., Ngoungoure Manjeli, A. & Sufo-Kankeu, R.2016. Economic and social importance of Fuelwood in Cameroon. International Forestry Review, 18(S1): 52–65.
Ecoagriculture partners. 2013. Defining integrated landscape management for policy makers. Ecoagriculture Policy Focus, number 10, October 2013. (available at http://www.un.org/esa/ffd/wp-content/uploads/sites/2/2015/10/IntegratedLandscapeManagementforPolicymakers_Brief_Final_Oct24_2013_smallfile.pdf).
EFI, 2017. EFIATLANTIC databases. (available at http://www.efiatlantic.efi.int/portal/databases/storm_damages_and_tree_stability_references. Accessed December 14).
Egli S., Peter, M., Buser, C., Stahel, W. & Ayer, F. 2006. Mushroom picking does not impair future harvests – results of a long-term study in Switzerland. Biological Conservation, 129(2): 271–276.
Ellis, E.A., Kainer, K.A., Sierra-Huelsz, J.A., Negreros-Castillo, P., Rodriguez-Ward, D. & DiGiano, M. 2015. Endurance and adaptation of community forest management in Quintana Roo, Mexico. Forests, 6(11): 4295-4327.
Ellison, D., Futter, M.N. & Bishop, K. 2012. On the forest cover-water yield debate: from demand-to supply-side thinking. Global Change Biology, 18(3): 806-820.
Ellison, D., Morris, C.E., Locatelli, B., Sheil, D., Cohen, J., Murdiyarso, D., Gutierrez, V., et al. 2017. Trees, forests and water: cool insights for a hot world. Global Environmental Change, 43: 51–61.
Environment and Gender Index. 2015. Gender Focal Points and Policies in National Environmental Ministries. Environment and Gender Index Brief September 2015. IUCN Global Gender Office, Washington, DC. (available at http://www.wocan.org/sites/default/files/EGI_focal_point_brief_sept15_0.pdf).
European Panel Federation. 2017. Annual Report. European Panel Federation, Brussels. (available at http://europanels.org/annual-report).
FairWild Foundation. 2017. FairWild Standard. (available at: http://www.fairwild.org/standard).
FAO. 2001. The State of Food Insecurity in the World, 2001. Rome. (available at http://www.fao.org/3/a-y1500e.pdf).
| 110 |
THE STATE OF THE WORLD’S FORESTS 2018
FAO. 2005. Global Forest Resources Assessment 2005. FAO, Rome. (available at http://www.fao.org/docrep/008/a0400e/a0400e00.htm).
FAO. 2006. Time for action: Changing the gender situation in forestry. Report of the UNECE/FAO team of specialists on gender and forestry. FAO, Rome. (available at http://www.fao.org/tempref/docrep/fao/009/a0549e/a0549e00.pdf).
FAO. 2007. Gender mainstreaming in forestry in Africa: United Republic of Tanzania. FAO, Rome. (available at http://www.fao.org/tempref/docrep/fao/010/k0742e/k0742e00.pdf).
FAO. 2009. How to Feed the World in 2050. High-level Expert Forum held in Rome, Italy, 12-13 October 2009. (available at http://www.fao.org/wsfs/forum2050/wsfs-background-documents/wsfs-expert-papers/en/).
FAO. 2010. “Climate-smart” agriculture: Policies, practices and financing for food security, adaptation and mitigation. Rome. (available at http://www.fao.org/docrep/013/i1881e/i1881e00.htm).
FAO. 2011a. Forests for improved nutrition and food security. Rome. (available http://www.fao.org/docrep/014/i2011e/i2011e00.pdf).
FAO. 2011b. World Map of the Major Hydrological Basins. (derived from HydroSHEDS).
FAO. 2012. FRA 2015 Terms and definitions. Forest Resources Assessment Working Paper 180. Rome. (available at http://www.fao.org/docrep/014/i2011e/i2011e00.pdf).
FAO. 2013a. Food wastage footprint: Impacts on natural resources. FAO, Rome. (available at http://www.fao.org/docrep/018/i3347e/i3347e.pdf).
FAO. 2013b. Forests, food security and gender: linkages, disparities and priorities for action. Background paper for the International Conference on Forests for Food Security and Nutrition, held in Rome, 13–15 May, 2013. (available at http://www.fao.org/docrep/018/mg488e/mg488e.pdf).
FAO. 2014. State of the World’s Forests 2014: Enhancing the socioeconomic benefits from forests. Rome. (available at http://www.fao.org/3/a-i3710e.pdf).
FAO. 2015a. Global Forest Resources Assessment 2015: How are the world’s forests changing? Second Edition. Rome. (available at http://www.fao.org/3/a-i4793e.pdf).
FAO. 2015b. Wood fuels handbook. FAO. (available at http://www.fao.org/3/a-i4441e.pdf).
FAO. 2015c. Forests, Trees and Disasters, Unasylva, No. 243/244. Vol. 66 2015/1–2.
FAO. 2015d. The impact of natural hazards and disasters on agriculture and food security and nutrition: A call for action to build resilient livelihoods. Brochure prepared for the World Conference on Disaster Risk reduction held in Sendai, Japan, March 2015.
FAO. 2016a. 2015 Global forest products facts and figures. FAO, Rome. (available at http://www.fao.org/3/a-i6669e.pdf).
FAO. 2016b. Guidelines on urban and peri-urban forestry, by F. Salbitano, S. Borelli, M. Conigliaro and Y. Chen. FAO Forestry Paper No. 178. FAO, Rome. (available at: http://www.fao.org/3/a-i6210e.pdf).
FAO. 2016c. State of the World’s Forests 2016. Forests and agriculture: land-use challenges and opportunities. FAO, Rome (available at http://www.fao.org/3/a-i5588e.pdf).
FAO. 2017a. Sustainable woodfuel for food security. FAO Working Paper. Rome. (available at http://www.fao.org/3/a-i7917e.pdf).
FAO. 2017b. Strengthening sector policies for better food security and nutrition results. Policy Guidance Note. FAO. Rome. (available at http://www.fao.org/3/a-i7215e.pdf).
FAO. 2017c. Forests and energy. FAO. Rome. (available at http://www.fao.org/3/a-i6928e.pdf).
FAO. 2017d. FAOSTAT. FAO. Rome. (available at http://www.fao.org/faostat/en/#home).
FAO. 2017e. The charcoal transition: Greening the charcoal value chain to mitigate climate change and improve local livelihoods. FAO. Rome. (available at http://www.fao.org/3/a-i6935e.pdf).
FAO. 2017f. Certification schemes and standards for NWFPs. FAO. Rome. (available at http://www.fao.org/forestry/nwfp/93562/en/).
FAO. 2017g. AIDmonitor. (available at http://www.fao.org/aid-monitor/en/).
FAO. 2018. Potential implications of corporate zero-net deforestation commitments for the forest industry. Discussion paper prepared for the 58th session of the FAO Advisory Committee on Sustainable Forest-based Industries. Available at http://www.fao.org/forestry/46928-0203e234d855d4dc97a7e7aabfbd2f282.pdf.
Fearnside, P.M. 2005. Deforestation in Brazilian Amazonia: History, Rates and Consequences. Conservation Biology, 19 (3): 680–688.
Ferguson, I.S. 1972. Wood chips and regional development. Australian Forestry, 36(1):15–23.
Ferraro, P. J., Lawlor, K., Mullan, K.L. & Pattanayak, S.K. 2012. Forest Figures: Ecosystem Services Valuation and Policy Evaluation in Developing Countries. Review of Environmental Economics and Policy, 6(1): 20–44.
Filoso, S., Bezerra, M.O., Weiss, K.C.B. & Palmer, M.A. 2017. Impacts of forest restoration on water yield: A systematic review. PLOS ONE, 12(8): e0183210.
Finnish Bioeconomy Strategy. 2014. Sustainable growth from bioeconomy. 30 p. (available at http://biotalous.fi/wp-content/uploads/2014/08/The_Finnish_Bioeconomy_Strategy_110620141.pdf).
| 111 |
REFERENCES
Fisher, M., Chaudhury, M. & McCusker, B. 2010. Do forests help rural households adapt to climate variability? Evidence from Southern Malawi. World Development, 38(9): 1241–1250.
Flick, W.A., Trenchi, P. III. & Bowers, J.R. 1980. Regional analysis of forest industries: Input-output methods. Forest Science, 26(4):548–560.
Foley, G. 1985. Wood fuel and conventional fuel demands in the developing world. Ambio, 14(4/5): 253–258.
Foli, S., Reed, J. Clendenning, J., Petrokofsky, G., Padoch, C. & Sunderland, T. 2014. To what extent does the presence of forests and trees contribute to food production in humid and dry forest landscapes? A systematic review protocol. Environmental Evidence, 3(1): 15.
FSC. 2018a. FSC Facts and Figures. Available at https://ic.fsc.org/en/facts-and-figures.
FSC. 2018b. FSC Volumes – Feedback to FAO for SOFO 2018. Written note to FAO from FSC International Key Account Manager Luca Costa, 16 February 2018.
FSIN. 2017. Global Report on Food Crises 2017, Food Security Information Network. (available at http://www.fao.org/fileadmin/user_upload/newsroom/docs/20170328_Full%20Report_Global%20Report%20on%20Food%20Crises_v1.pdf).
Fungo, R., Muyonga, J., Kaaya, A., Okia, C., Tieguhong J. C. & Baidu-Forson, J.J. 2015. Nutrients and bioactive compounds content of Baillonella toxisperma, Trichoscypha abut and Pentaclethra macrophylla from Cameroon. Food Science & Nutrition, 3(4): 292–301.
GACC. 2016. Clean cooking: Key to achieving global development and climate goals. Global Alliance for Clean Cookstoves, Washington, DC.
Gammie, G. & De Bievre, B. 2015. Assessing Green Interventions for the Water Supply of Lima, Peru. A research report for Forest Trends and CONDESAN. Forest Trends, Washington, DC.
Gardner, T.A., Barlow, J., Chazdon, R., Ewers, R.M., Harvey, C.A., Peres, C.A. & Sodhi N.S. 2009. Prospects for tropical forest biodiversity in a human-modified world. Ecology Letters, 12: 561–582.
Garibaldi, L. A., Carvalheiro, L.G., Vaissiere, B.E., Gemmill-Herren, B., Hipolito, J., Freitas, B.M., Ngo, H.T., et al. 2016. Mutually beneficial pollinator diversity and crop yield outcomes in small and large farms. Science, 351: 6271.
Gilmour, D. 2014. Forests and water: A synthesis of the contemporary science and its relevance for community forestry in the Asia–Pacific region. RECOFTC Issue paper no. 3. Regional Community Forestry Training Center for Asia and the Pacific (RECOFTC), Bangkok, Thailand.
Gilmour, D. 2016. Forty years of community-based forestry. A review of its extent and effectiveness. FAO Forestry Paper 176. Rome. (available at http://www.fao.org/3/a-i5415e.pdf).
Giri, K. 2012. Gender in forest tenure: Prerequisite for sustainable forest management in Nepal. Rights and Resources Initiative, Washington, DC.
(available at: http://theredddesk.org/sites/default/files/resources/pdf/2012/gender_in_forest_tenure_-_forest_management_nepal.pdf).
Giri, K. & Darnhofer, I. 2010. Nepali women using community forestry as a platform for social change. Society and Natural Resources, 23 (12): 1216–1229.
Godfray, H. C. J., Beddington, J. R., Crute, I.R., Haddad, L., Lawrence, D., Muir, J.F., Pretty, J., Robinson, S., Thomas, S.M. & Toulmin, C. 2010. Food Security: The Challenge of Feeding 9 Billion People. Science, 327(5967): 812.
Golden, C. D., Fernald, L.C.H., Brashares, J.S., Rasolofoniaina, B.J.R. & Kremen, C. 2011. Benefits of wildlife consumption to child nutrition in a biodiversity hotspot. Proceedings of the National Academy of Science, 108 (49): 19653–19656.
Gond, V., Dubiez, E., Boulogne, M., Gigaud, M., Péroches, A., Pennec, A., Fauvet, N. & Peltier, R. 2016. Forest cover and carbon stock change dynamics in the Democratic Republic of Congo: case of the wood-fuel supply basin of Kinshasa. Bois et Forets des Tropiques, 327(1): 19–28.
Government of Nepal. 2017. Community Forestry. Department of Forests, Ministry of Forests and Environment. Available at http://dof.gov.np/dof_community_forest_division/community_forestry_dof.
Grimm, N. B., Faeth, S. H., Golubiewski, N. E., Redman, C. L., Wu, J., Bai, X. & Briggs, J. M. 2008. Global change and the ecology of cities. Science, 319(5864), 756–760.
Grunewald, K., Richter, B., Meinel, G., Herold, H. & Syrbe, R. 2017. Proposal of indicators regarding the provision and accessibility of green spaces for assessing the ecosystem service “recreation in the city” in Germany. International Journal of Biodiversity Science, Ecosystem Services & Management, Vol. 13, Issue 2, 2017.
Gurung, J. D. 2002. Getting at the heart of the issue: challenging male bias in Nepal’s Department of Forests. Mountain research and development, 22(3): 212–215.
Gurung, J., Hytönen, L. & Pathak, B. 2012. Scoping dialogue on the exclusion and inclusion of women in the forest sector, held in Kathmandu, Nepal on 22-24 September 2012. Co-chairs’ Summary Report. The Forests Dialogue, New Haven, CT, USA. (available at http://theforestsdialogue.org/sites/default/files/tfd_eiw_nepal_co-chairssummary_en.pdf).
Haltia, O. & Simula, M. 1988. Linkages of forestry and forest industry in the Finnish economy. Silva Fennica, 1988. 22(4): 257–272.
Hansen, M. C., Potapov, P.V., Moore, R., Hancher, M., Turubanova, S.A., Tyukavina, A., Thau, S. V. et al. 2013. High-resolution global maps of 21st-century forest cover change. Science, 342(6160): 850–53.
Henderson, J.E., Joshi, O., Tanger, S., Boby, L., Hubbard, W., Pelkki, M., Hughes, G.W., et al. 2017. Standard procedures and methods for economic impact and contribution analysis in the forest products sector. Journal of Forestry, 115(2):112–116.
| 112 |
THE STATE OF THE WORLD’S FORESTS 2018
Henderson, J.E. & Munn, I.A. 2012. Forestry in Illinois – The impact of the forest products industry on the Illinois economy: an input-output analysis. Illinois Forestry Development Council, USA. 22 p.
HLPE. 2017. Sustainable forestry for food security and nutrition. A report by the High Level Panel of Experts on Food Security and Nutrition of the Committee on World Food Security. Rome. (available at http://www.fao.org/3/a-i7395e.pdf)
HLPF. 2017. President’s Summary of 2017 High-level Political Forum on Sustainable Development. (available at https://sustainabledevelopment.un.org/content/documents/16673HLPF_2017_Presidents_summary.pdf)
Hobley, M. 2012. Persistence and change: review of 30 years of community forestry in Nepal. Multi-stakeholder forestry programme, Ekantakuna, Lalitpur, Nepal. (available at https://www.researchgate.net/publication/282287096_Persistence_and_change_review_of_30_years_of_community_forestry_in_Nepal).
Howard, P. 2001. Women in the plant world: the significance of women and gender bias for biodiversity conservation. A briefing produced for the IUCN. (available at: https://portals.iucn.org/library/sites/library/files/documents/Rep-2001-028.pdf).
Ickowitz, A., Powell, B., Salim, A. & Sunderland, T. 2014. Dietary Quality and Tree Cover in Africa. Global Environmental Change, 24: 287-294.
IEA. 2005. Energy statistics manual. International Energy Agency, Paris.
IEA. 2016. Key world energy statistics 2016. International Energy Agency, Paris.
IEA & World Bank. 2017. Sustainable Energy for All 2017: Global tracking framework - Progress toward sustainable energy. World Bank, Washington, DC.
IEA Bioenergy. 2017. IEA Bioenergy response to Chatham House report ‘Woody biomass for power and heat: Impacts on the global climate’. IEA Bioenergy. (available at http://www.ieabioenergy.com/wp-content/uploads/2017/03/Chatham_House_response_3pager.pdf).
IFAD. 2011. Rural poverty report 2011 – New realities, new challenges: new opportunities for tomorrow’s generation. International Fund for Agricultural Development, Rome.
IFAD. 2013. Smallholders, food security, and the environment. International Fund for Agricultural Development, Rome.
IFAD. 2016. Rural Development Report 2016: Fostering inclusive rural transformation. International Fund for Agricultural Development, Rome.
IIED. 2007. Small and medium forest enterprises and associations. (available at www.iied.org/small-medium-forest-enterprises-associations. Accessed August 2016.)
ILO. 2003. Guidelines concerning a statistical definition of informal employment. (available at http://www.ilo.org/global/statistics-and-databases/standards-and-guidelines/guidelines-adopted-by-international-conferences-of-labour-statisticians/WCMS_087622/lang--en/index.htm).
ILOSTAT. 2017. International Labour Organization database on labour statistics. Geneva. (available at http://www.ilo.org/ilostat).
Ilstedt, U., Tobella, A.B., Bazié, H.R., Bayala, J., Verbeeten, E., Nyberg, G., Sanou, J., et al. 2016. Intermediate tree cover can maximize groundwater recharge in the seasonally dry tropics. Scientific Reports, 6: 21930.
IPCC. 2003. Good practice guidance for land use, land-use change and forestry. Institute for Global Environmental Strategies (IGES), Kanagawa, Japan. (available at: http://www.ipcc-nggip.iges.or.jp/public/gpglulucf/gpglulucf_files/GPG_LULUCF_FULL.pdf).
IPCC. 2014: Climate Change 2014: Synthesis Report. Contribution of Working Groups I, II and III to the Fifth Assessment Report of the Intergovernmental Panel on Climate Change. [Core Writing Team, Pachauri, R.K. & Meyer, L.A. (eds.)]. IPCC, Geneva, Switzerland, 151 pp.
IUCN. 2015. IUCN Red List of Threatened Species. Version 2015.1. International Union for Conservation of Nature, Gland, Switzerland. (available at http://www.iucnredlist.org).
IUCN. 2016. A global standard for the identification of Key Biodiversity Areas. International Union for Conservation of Nature, Gland, Switzerland. (available at https://portals.iucn.org/library/node/46259).
Johansen, U., Werner, A. & Nørstebø, V. 2017. Optimizing the wood value chain in Northern Norway taking into account national and regional economic trade-offs. Forests, 8(5):172.
JRC. 2016. Measuring the accessibility of urban green areas. A comparison of the Green ESM with other datasets in four European cities, by Pafi, M., Siragusa, A., Ferri, S., Halkia, M. EUR 28069 EN, DOI: 10.2788/279663. European Commission Joint Research Centre, Ispra, Italy. (available at: https://ec.europa.eu/jrc/en/publication/measuring-accessibility-urban-green-areas-comparison-green-esm-other-datasets-four-european-cities).
Kandel, P., Chapagain, P.S., Sharma, L.N., & Vetaas, O.R. 2016. Consumption patterns of fuelwood in rural households of Dolakha district, Nepal: Reflections from Community Forest User Groups. Small-scale Forestry, 15(4): 481-495.
Kehlenbeck, K., Vinceti, B., van Vliet, N., Keding, G., Stadlmayr, B., Van Damme, P., Carsan, S., T. Sunderland, T., Njenga, M., Gyau, A., Cerruti, P., Schure, J., Kouame, C., Obiri-Darko, B., Ofori, D., Agarwal, B., Neufelt, H., Degrande, A. & A. Serban, A. 2015. Forests, trees and landscapes for food security and nutrition: a global assessment report, pp 25–50. IUFRO World Series, Volume 33. International Union of Forestry Research Organisations, Vienna. (Available at http://www.iufro.org/science/gfep/forests-and-food-security-panel/report/).
Keller, G. B., Mndiga, H. & Maass, B.L. 2006. Diversity and genetic erosion of traditional vegetables in Tanzania from the farmer’s point of view. Plant Genetic Resources, 3 (3): 400–413.
| 113 |
REFERENCES
Kimble, J. M., Rice, C.W., Reed, D., Mooney, S., Follett, R.F. & Lal, R. (eds.) 2007. Soil carbon management: Economic, environmental and societal benefits. CRC Press, Boca Raton, USA. 280 p.
Kortright, R. & Wakefield, S. 2011. Edible backyards: a qualitative study of household food growing and its contributions to food security. Agriculture and Human Values, 28(1): 39-53.
Kumar, C., Begeladze, S., Calmon, M. & Saint-Laurent, C. (eds.) 2015. Enhancing food security through forest landscape restoration: Lessons from Burkina Faso, Brazil, Guatemala, Viet Nam, Ghana, Ethiopia and Philippines. International Union for the Conservation of Nature, Gland, Switzerland.
Lachowycz, K. & Jones, A. P. 2013 Towards a better understanding of the relationship between greenspace and health: Development of a theoretical framework. Landscape and Urban Planning, 118, 62–69.
Laird, S.A., McLain, R.J. & Wynberg, R.P. 2011. Wild Product Governance: Finding policies that work for Non-timber forest products. Earthscan, London.
Landesa. undated. Retrieved from https://www.landesa.org/resources/property-not-poverty/ (accessed: 29/10/2017).
Lovric , M. 2016. European household survey on consumption and collection of NWFPs. Presentation at StarTree Final Conference held in Barcelona, Spain, 14 October 2016. (available at http://intra.tesaf.unipd.it/pettenella/papers/Barcelona_HH_Survey.pdf).
Mai, Y. H., Mwangi, E. & Wan, M. 2011. Gender analysis in forestry research: looking back and thinking ahead. International Forestry Review, 13(2): 245-258.
Malakini, M., Mwase, W., Maganga. A.M. & Khonje, T. 2014. Fuelwood use efficiency in cooking technologies for low income households in Malawi. Middle-East Journal of Scientific Research, 19(10): 1328–1333.
Marcouiller, D.W., Schreiner, D.F. & Lewis, D.K. 1995. Distributive Economic Impacts of Intensive Timber Production. Forest Science, 41(1):122-139.
Mbow, C., Van Noordwijk, M., Luedeling, E., Neufeldt, H., Minang, P.A. & Kowero, G. 2014. Agroforestry solutions to address food security and climate change challenges in Africa. Current Opinion in Environmental Sustainability, 6: 61–67.
Millennium Ecosystem Assessment. 2005. Ecosystems and human well-being. Island Press, Washington, DC. (available at https://www.millenniumassessment.org/documents/document.356.aspx.pdf .)
Miller, D.C., Muñoz-Mora, J.C & Christiaensen, L. 2016. Prevalence, economic contribution, and determinants of trees on farms across sub-Saharan Africa. Policy Research Working Paper WPS 7802. World Bank, Washington, DC.
MOFC. 2008. Community Forestry Guidelines. Ministry of Forest and Soil Conservation, Nepal.
Moore, L. J. 2009. Killer sperm: Masculinity and the essence of male hierarchies. In Inhorn, M.C., Tjornhoj-Thomsen, T., Goldberg, H. & Mosegaard, M.L.C. Reconceiving the second sex: Men, masculinity, and reproduction. Berghahn, New York.
Munn, I.A. 1998. Forestry in Mississippi: The impact of the forest products industry on the Mississippi economy: an input-output analysis. Forestry Department, Forest and Wildlife Research Center, Mississippi State University, USA. 12 p.
Nasi, R., Taber, A. & van Vliet, N. 2011. Empty forests, empty stomachs? Bushmeat and livelihoods in the Congo and Amazon Basins. International Forestry Review, 13(3): 355–368.
Natural England. 2008. Understanding the relevance and application of the Access to Natural Green Space Standard. Natural England, London. (available at: http://publications.naturalengland.org.uk/publication/5081534874779648).
Neeff, T. & Linhares-Juvenal, T. 2017. Zero deforestation initiatives and their impacts on commodity supply chains. Discussion paper prepared for the 57th Session of the FAO Advisory Committee on Sustainable Forest-based Industries, Rome, FAO. (available at http://www.fao.org/3/a-i6857e.pdf).
Ní Dhubháin, Á., Fléchard, M-C., Moloney, R. & O’Connor, D. 2009. Assessing the value of forestry to the Irish economy — An input–output approach. Forest Policy and Economics, 11(1):50–55.
Nielsen, M.R., Meilby, H., Smith-Hall, C., Pouliot, M. & Treue, T. 2018. The importance of wild meat in the global south. Ecological Economics, 146: 696–705
Nightingale, A. 2006. The nature of gender: Work, gender, and environment. Environment and Planning D: Society and Space, 24(2): 165–185.
Noack, F., Wunder, S., Angelsen, A. & Börner, J. 2015. Responses to weather and climate: a cross-section analysis of rural incomes. Policy Research Working Paper WPS 7478. World Bank, Washington, DC.
Nobre, A. 2014. The future climate of Amazonia, scientific assessment report. Sponsored by CCST-INPE, INPA and ARA. São José dos Campos, Brazil, 42p.
Norvell, L. 1995. Loving the chanterelle to death? The ten-year chanterelle project. McIlvanea, 12(1): 6–25.
Nowak, D.J., Hoehn, R. E.III., Crane, D.E., Stevens, J.C. & Walton, J.T. 2007. Assessing urban forest effects and values: New York City’s urban forest. USDA Forest Service, Northern Research Station Resource Bulletin NRS-9. Newtown Square, PA, USA. 24 p.
OECD, 2016. Policy guidance on resource efficiency. OECD Publishing, Paris. (available at http://dx.doi.org/10.1787/9789264257344-en).
Ojha, H. 2012. Civic engagement and democratic governance: the case of community forest user groups in Nepal. In Deniere, A, & Van Luong, H.
| 114 |
THE STATE OF THE WORLD’S FORESTS 2018
The dynamics of social capital and civic engagement in Asia. Routledge. London and New York
Pathak, B. 2016. Tenure rights and sustainable forest management for food security: Learning from Nepal. Presented in Asia Pacific Forest Week, held in Clark Freeport Zone, Philippines, February 23-26, 2016. (available at http://www.fao.org/fileadmin/user_upload/rap/Asia-Pacific_Forestry_Week/doc/Stream_4/ST4_24Feb_Bharati_tenure-landrights.pdf).
PEFC. 2017. Double certification on the rise, joint PEFC/FSC data shows. (available at www.pefc.org/news-a-media/general-sfm-news/2370-double-certification-on-the-rise-joint-pefc-fsc-data-shows).
Pilz, D., Norvell, L., Danell, E. & Molina, R. 2003. Ecology and management of commercially harvested chanterelle mushrooms. Gen. Tech. Rep. PNW-GTR-576, pp. 1–83. Department of Agriculture, Forest Service, Pacific Northwest Research Station, Portland OR, USA.
Powell, B., Ickowitz, A., McMullin, S., Jamnadass, R., Padoch, C., Pinedo-Vasquez, M. & Sunderland, T. 2013. The role of forests, trees and wild biodiversity for nutrition-sensitive food systems and landscapes. Expert background paper for the International Conference on Nutrition 2, presented at the Preparatory Technical Meeting held in Rome. Italy, 13–15 November 2013. (available at http://www.fao.org/3/a-as570e.pdf.)
Price, M.F., Gratzer, G., Duguma, L.A., Kohler, T., Maselli, D. & Romeo, R. (eds). 2011. Mountain forests in a changing world - Realizing values, addressing challenges. Published by FAO/MPS and SDC, Rome.
Qin, Y., Gartner, T., Minnemeyer, S., Reig, P. & Sargent, S. 2016. Global forest watch water metadata document. Technical Note. World Resources Institute, Washington, DC.
Ramesh, T., Prakash, R. & Shukla, K. K. 2010. Life cycle energy analysis of buildings: An overview. Energy and buildings, 42(10), 1592–1600.
REN21. 2017. Renewables 2017 global status report. REN21 Secretariat, Paris.
Ribot, J. C. 2009. Authority over forests: Empowerment and subordination in Senegal’s democratic decentralization. Development and Change, 40(1): 105–129.
RRI. 2014. What future for reform? Progress and slowdown in forest tenure reform since 2002. Rights and Resources Initiative, Washington, DC.
RRI. 2015. Who owns the world’s land? A global baseline of formally recognized indigenous and community land rights. Rights and Resources Initiative, Washington, DC.
Roemmich J.N., Epstein L.H., Raja S., Yin, L., Robinson, J. & Winiewicz, D. 2006. Association of access to parks and recreational facilities with the physical activity of young children. Preventive Medicine, 43:437–441.
Rogers, K., Sacre, K., Goodenough, J. & Doick, K. (2015). Valuing London’s Urban Forest: Results of the London i-Tree Eco Project. Treeconomics London. 84 p.
Roubik, D. W. (ed.) 1995. Pollination of cultivated plants in the tropics. FAO Agricultural Services Bulletin 118. FAO, Rome. (available at http://www.fao.org/3/a-v5040e.pdf)
Rowland, D., Ickowitz, A., Powell, B., Nasi, R., & Sunderland, T.C.H. 2017. Forest foods and healthy diets: Quantifying the contributions. Environmental Conservation, 44(2), 102–114.
Roy, D.P., Boschetti, L., Justice, C.O. & Ju, J. 2008. University of Maryland. The Collection 5 MODIS Burned Area Product - Global evaluation by comparison with the MODIS active fire product. Remote Sensing of Environment, 112, 3690-3707.
San Cristobal, J.R. 2007. Effects on the economy of a decrease in forest resources: An international comparison. Forest Policy and Economics, 9(6):647–652.
Sathre, R. & Gustavsson, L. 2009. Using wood products to mitigate climate change: External costs and structural change. Applied Energy, 86(2), 251–257.
Schaefer, A., Daniell, J. & Friedemann, W. 2016. Development of a global tsunami source database - initial results. European Geosciences Union General Assembly 2016, held in Vienna Austria, 17–22 April, 2016, p.7847
SEDEPAL. 2016. SEDAPAL and AQUAFONDO seek ecological recovery of rivers Rímac, Chillón and Lurín. SEDEPAL Press Release N ° 46 -2016: SEDAPAL y AQUAFONDO buscan recuperación ecológica de ríos Rímac, Chillón y Lurín. (available at http:// http://www.sedapal.com.pe/ca_ES/notas-de-prensa/-/asset_publisher/qCX7/content/sedapal-y-aquafondo-buscan-recuperacion-ecologica-de-rios-rimac-chillon-y-lurin. Accessed: 15 September 2017.)
Setyowati, A. 2012. Ensuring that women benefit from REDD+. Unasylva, 239, Vol. 63, 2012/1. (available at http://www.fao.org/docrep/017/i2890e/i2890e09.pdf)
Shackleton, S. E., Shanley, P. & Ndoye, O. 2007. Viable but invisible: Recognising local markets for non-timber forest products. International Forestry Review, 9(3): 697–712.
Shackleton, S., Paumgarten, F., Kassa, H., Husselman, M. & Zida, M. 2011. Opportunities for enhancing poor women’s socioeconomic empowerment in the value chains of three African non-timber forest products (NTFPs). International Forestry Review, 13(2): 136-151.
Shackleton, C., Shackleton S. & Shanley, P. (eds.) 2011. Non-Timber forest products in the global context. Springer-Verlag, Berlin.
Shepherd, G. 2012. Rethinking Forest Reliance: Findings about poverty, livelihood resilience and forests from IUCN’s ‘Livelihoods and Landscapes’ strategy. International Union for the Conservation of Nature, Gland, Switzerland.
Shepherd, G., Kazoora, C. & Mueller, D. 2013. Forests, livelihoods and poverty alleviation: the case of Uganda. Forestry Policy and Institutions Working Paper No. 32. FAO, Rome, Italy.
| 115 |
REFERENCES
Shrestha, U. B. & Bawa, K.S. 2014. Economic contribution of Chinese caterpillar fungus to the livelihoods of mountain communities in Nepal. Biological Conservation, 177: 194–202.
Sinu, P. A., Kent, S.M. & Chandrashekara, K. 2012. Forest resource use and perception of farmers on conservation of a usufruct forest (Soppinabetta) of Western Ghats, India. Land Use Policy, 29: 702– 709.
Smith, P., Bustamante, M., Ahammad, H., Clark, H., Dong, H., Elsiddig, E. A., Haberl, H., Harper, R., House, J., Jafari, M., Masera, O., Mbow, C., Ravindranath, N. H., Rice, C. W., Robledo Abad, C., Romanovskaya, A., Sperling, F. & Tubiello, F. 2014. Agriculture, Forestry and Other Land Use (AFOLU). In: Climate Change 2014: Mitigation of Climate Change. Contribution of Working Group III to the Fifth Assessment Report of the Intergovernmental Panel on Climate Change [Edenhofer, O., R. Pichs-Madruga, Y. Sokona, E. Farahani, S. Kadner, K. Seyboth, A. Adler, I. Baum, S. Brunner, P. Eickemeier, B. Kriemann, J. Savolainen, S. Schlömer, C. von Stechow, T. Zwickel and J.C. Minx (eds.)]. Cambridge University Press, Cambridge, United Kingdom and New York, NY, USA. (available at https://www.ipcc.ch/pdf/assessment-report/ar5/wg3/ipcc_wg3_ar5_chapter11.pdf).
Sorrenti, S. 2017. Non-wood forest products in international statistical systems. Non-wood Forest Products Series no. 22. FAO, Rome.
Stevens, C., Winterbottom, R., Springer, J. & Reytar, K. 2014. Securing rights, combating climate change: How strengthening community forest rights mitigates climate change. World Resources Institute, Washington, DC.
Stickler, C. 2013. Dependence of hydropower energy on forests in the Amazon Basin at local and regional scales. Proceedings of the National Academy of Sciences of the USA, Vol. 110, No. 23, 9601–9606.
Stloukal, L., Holding, C., Kaaria, S., Guarascio F. & Gunewardena, N. 2013. Forests for food security and nutrition. Unasylva, 241, Vol. 64, 2013/2.
Sunderland, T., Achdiawan, R., Angelsen, A., Babigumira, R., Ickowitz, A., Paumgarten, F., Reyes-García, V. & Shively, G. 2014. Challenging perceptions about men, women, and forest product use: a global comparative study. World Development, 64: S56-S66.
Sunderlin, W.D., Dewi, S. & Puntodewo, A. 2007. Poverty and Forests: multi-country analysis of spatial association and proposed policy solutions. CIFOR Occasional paper no 47. Center for International Forestry Research, Bogor, Indonesia.
Temu, A.B., Chamshama, S.A.O., Kung’u, J., Kaboggoza, J., Chikamai, B. & A.Kiwia, A. M. (eds.) 2008. New Perspectives in Forestry Education. Peer reviewed papers presented at the First Global Workshop on Forestry Education, held in September 2007. ICRAF, Nairobi, Kenya. (available at http://www.worldagroforestry.org/downloads/Publications/PDFS/B15713.pdf).
Thomas, V. & López, R. 2015. Global increase in climate-related disasters. ADB Economics Working Paper Series, No. 466. Asian Development Bank, Metro Manila, Philippines.
Tobella, A.B., Reese, H., Almaw, A., Bayala, J., Malmer, A., Laudon, H. & Ilstedt, U. 2014. The effect of trees on preferential flow and soil infiltrability in an agroforestry parkland in semiarid Burkina Faso. Water Resources Research, 50: 3342–3354.
Tourism Board of Costa Rica. Retrieved from http://www.ict.go.cr/en/statistics/tourism-figures.html
Troy, A., Grove, J.M. & O’Neil-Dunne, J. 2012. The relationship between tree canopy and crime rates across an urban-rural gradient in the greater Baltimore region. Landscape and Urban Planning, 106: 262–270. (available at http://www.sciencedirect.com/science/article/pii/S0169204612000977).
Trzyna, T. 2014. Urban protected areas: profiles and best practice guidelines. Best Practice Protected Area Guidelines Series No. 22, IUCN, Gland, Switzerland. xiv + 110pp. (available at https://www.iucn.org/content/urban-protected-areas-profiles-and-best-practice-guidelines-0).
UN. 2008. United Nations Forest Instrument. United Nations General Assembly resolution 62/98 of 17 December 2007. (available at http://www.un.org/en/ga/62/resolutions.shtml).
UN. 2015. Transforming our world: the 2030 Agenda for Sustainable Development. (available at https://sustainabledevelopment.un.org/post2015/transformingourworld/publication).
UN. 2016. The world’s cities in 2016. Data booklet. United Nations. (available at http://www.un.org/en/development/desa/population/publications/pdf/urbanization/the_worlds_cities_in_2016_data_booklet.pdf).
UN. 2017a. Sustainable Development Goals Report 2017. (available at https://unstats.un.org/sdgs/files/report/2017/TheSustainableDevelopmentGoalsReport2017.pdf). See also http://www.fao.org/sustainable-development-goals/indicators/1542/en/.)
UN. 2017b. National accounts official country data database. New York, USA. (available at www.data.un.org).
UNDESA. 2014. World Urbanization Prospects: The 2014 Revision, Highlights. United Nations, Department of Economic and Social Affairs, Population Division. (available at https://esa.un.org/unpd/wup/Publications/Files/WUP2014-Highlights.pdf).
UNECE-FAO, 2010. Forest product conversion factors for the UNECE region. Geneva Timber and forest discussion paper 49, UNECE Timber Section, Geneva, Switzerland. (available at https://www.unece.org/fileadmin/DAM/timber/publications/DP-49.pdf ).
UNECE-FAO, 2016. Promoting sustainable building materials and the implications on the use of wood in buildings. A review of leading public policies in Europe and North America. United Nations, Geneva. (available at http://www.unece.org/fileadmin/DAM/timber/publications/SP-38.pdf).
UNEP. 2017. Global review of sustainable public procurement. United Nations Environment Programme. (available at https://wedocs.unep.
| 116 |
THE STATE OF THE WORLD’S FORESTS 2018
org/bitstream/handle/20.500.11822/20919/GlobalReview_Sust_Procurement.pdf).
UNEP & ICLEI. 2008. Amsterdam, the Netherlands: conserving biodiversity through careful local and regional planning. United Nations Environment Programme (UNEP) and Local Governments for Sustainability (ICLEI).
UNESCO. 2017. World Heritage Centre – World Heritage list. (available at http://whc.unesco.org/en/list/).
UN Habitat. 2012. Going green: A handbook of sustainable housing practices. UN Habitat, Nairobi, Kenya. (available at: https://www.uncclearn.org/sites/default/files/inventory/going_green.pdf).
UNICEF. 2016. Collecting water is often a colossal waste of time for women and girls. UNICEF Press Release 29 August 2016. (available at: https://www.unicef.org/media/media_92690.html. Accessed: 25 August 2017.)
UNSD. 2016. Update of the regional groupings for the SDG report and database. p.3. (available at https://unstats.un.org/sdgs/files/Update-of-the-regional-groupings-for-the-SDG-report-and-database-2017.pdf).
UN-Water. 2017. Step-by-step methodology for monitoring ecosystems (6.6.1). (available at: http://www.unwater.org/publications/step-step-methodology-monitoring-ecosystems-6-6-1/ Accessed: 9 July 2017.)
UNWTO. 2011. Global report on women in tourism 2010. Published by the World Tourism Organization (UNWTO) and the United Nations Entity for Gender Equality and the Empowerment of Women (UN Women). Printed by the World Tourism Organization, Madrid, Spain. (available at http://www2.unwto.org/sites/all/files/pdf/folleto_globarl_report.pdf)
UNWTO. 2015. Towards measuring the economic value of wildlife watching tourism in Africa. World Tourism Organization Briefing paper, Madrid, Spain.
Upton, B., Miner, R., Spinney, M. & Heath, L. S. 2008. The greenhouse gas and energy impacts of using wood instead of alternatives in residential construction in the United States. Biomass and Bioenergy, 32(1), 1–10.
USFS. 2017. Water, air, and soil. United States Forest Service. (available at: https://www.fs.fed.us/science-technology/water-air-soil. Accessed 19 September 2017.)
van der Ent, R.J., Savenije, H.H.G., Schaefli, B. & Steele-Dunne, S.C. 2010. Origin and fate of atmospheric moisture over continents. Water Resources Research, 46: W09525.
van Lierop, P., Lindquist, E., Sathyapala, S. & Franceschini, G. 2015. Global forest area disturbance from fire, insect pests, diseases and severe weather events. Forest Ecology & Management, 352(7): 78–88.
Vedeld, P., Angelsen, A., Bojo, J., Sjaastad, E. & Berg, G. 2007. Forest environmental incomes and the rural poor. Forest Policy and Economics, 9(7): 869–879.
Veuthey, S. & Gerber, J.F. 2010. Logging conflicts in Southern Cameroon: A feminist ecological economics perspective. Ecological economics, 70(2): 170-177.
Vira, B., Wildburger, C. & Mansourian, S. (eds.) 2015. Forests, trees and landscapes for food security and nutrition: a global assessment report. IUFRO World Series, Volume 33. International Union of Forestry Research Organisations, Vienna. (available at https://www.iufro.org/science/gfep/forests-and-food-security-panel/report/).
Vladyshevskiy, D.V., Laletin, A. & Vladyshevskiy, A.D. 2000. Role of wildlife and other non-wood forest products in food security in central Siberia. Unasylva, (English ed.) 51(202): 46–52.
Vogl, A. 2016. Managing forest ecosystem services for hydropower production. Environmental Science & Policy, Volume 61, 221–229.
Wan, M., Colfer, C.J. & Powell, B. 2011. Forests, women and health: opportunities and challenges for conservation. International Forestry Review, 13(3): 369–387.
Watson, E. 2005. Gender-sensitive natural resource management (NRM) research-for-development. DFID NRSP Programme Development Report PD123, Department of Geography, University of Cambridge, UK. (available at https://www.geog.cam.ac.uk/research/projects/gendersensitivenrm/pd123.pdf).
Watson, P., Wilson, J., Thilmany, D. & Winter, S. 2007. Determining economic contributions and Impacts: what is the difference and why do we care? The Journal of Regional Analysis & Policy 37(2):7.
WBA. 2017. Global bioenergy statistics. World Bioenergy Association, Stockholm.
WBCSD Forest Solutions Group. 2011. The sustainable forest products industry, key messages for policy-makers (Third edition). World Business Council for Sustainable Development. (available at http://wbcsdpublications.org/project/the-sustainable-forest-products-industry-carbon-and-climate-change-key-messages-for-policy-makers-third-edition/).
WBCSD Forest Solutions Group. 2012. Facts & trends: Forests, forest products, carbon and energy. World Business Council for Sustainable Development, (available at http://www.wbcsd.org/Projects/Forest-Solutions-Group/Resources/Facts-Trends-Forests-forest-products-carbon-and-energy).
WDPA. 2017. World database on protected areas. (available at https://www.protectedplanet.net/c/wdpa-lookup-tables).
Wessels, K. J., Colgan, M.S., Erasmus, B.F.N., Asner, G.P., Twine, W.C., Mathieu, R., van Aardt, J.A.N., Fisher, J.T. & Smit, I.P.J. 2013. Unsustainable fuelwood extraction from South African savannas. Environmental Research Letters, 8(1).
Wheeler, T. & von Braun, J. 2013. Climate Change Impacts on Global Food Security. Science, 341(6145): 508–513.
Whiteman, A. 2002. The revision of woodfuel estimates in FAOSTAT. Unasylva, Vol. 53, No. 4, 41–45.
| 117 |
REFERENCES
WHO. 2016. Burning opportunity: clean household energy for health, sustainable development, and wellbeing of women and children. World Health Organization, Geneva.
Wit, M. & van Dam, J. (eds.) 2010. Chainsaw milling: supplier to local markets. Tropenbos International, Wageningen, the Netherlands.
Wood, T. S. & Baldwin, S. 1985. Fuelwood and charcoal use in developing countries. Annual Review of Energy, 10(1): 407-429.
World Bank. 2016a. Forests generate jobs and income. (available at http://www.worldbank.org/en/topic/forests/brief/forests-generate-jobs-and-incomes).
World Bank. 2016b. Gender and land reform: The gender dimensions of China’s forest tenure reform. A policy note from East Asia and the Pacific. Umbrella Facility for Gender Equality. The International Bank for Reconstruction and Development/The World Bank Group, Washington, DC. (available at http://pubdocs.worldbank.org/en/410961479157249740/ChinaForest-final-2-web.pdf).
World Bank. 2016c. World Development Indicators 2016. The World Bank Group, Washington, DC.
World Bank. 2017. World Development Indicators 2017. The World Bank Group, Washington, DC.
World Bank, FAO & International Fund for Agricultural Development. 2009. Gender in agriculture source book. Washington, DC.
World Economic Forum. 2016. The Global Gender Gap Report, 2016.
WRI. 2008. Roots of resilience: growing the wealth of the poor. World Resources Institute in collaboration with United Nations Development Programme, United Nations Environment Programme and World Bank. Washington, DC.
WRI. 2017a. Global forest water watch. (available at http://www.wri.org/our-work/topics/water. Accessed: 12 September 2017.)
WRI. 2017b. Forest legality initiative. (available at http://www.forestlegality.org/policy/us-lacey-act.)
WTTC. 2015. Travel & tourism economic impact 2015. World Travel and Tourism Council, London.
WTTC. 2017. Travel & tourism global economic impact & issues 2017. World Travel and Tourism Council, London.
Wunder, S., Börner, J., Shively, G. & Wyman, M. 2014. Safety nets, gap filling and forests: A global- comparative perspective. World Development, 64 (Supplement 1): S29–S42.
Xu, W. 2002. Economic impact of the Texas forest sector. Texas Forest Service, USA.
Zhang, M., Ning, L., Harper, R., Li, Q., Liu, K., Wei, X., Ning, D., Hou Y. & Liu, S. 2017. A global review on hydrological responses to forest change across multiple spatial scales: Importance of scale, climate, forest type and hydrological regime. Journal of Hydrology, 546. 44-59.
Zomer, R.A., Trabucco, A., Coe, R.D., Place, F. & Trabucco, A. 2009. Trees on farm: analysis of global extent and geographical patterns of agroforestry. ICRAF Working Paper no. 89. World Agroforestry Centre, Nairobi, Kenya.
Zulu, L. C. & Richardson, R.B. 2013. Charcoal, livelihoods, and poverty reduction: Evidence from sub-Saharan Africa. Energy for Sustainable Development, 17(2): 127-137.
| 118 |
2018
Nearly three years ago, world leaders agreed to the United Nations 2030 Agenda for Sustainable Development and its 17 Sustainable Development Goals (SDGs) – the central framework for guiding development policies throughout the world. This edition of The State of the World’s Forests is aimed at enhancing our understanding of how forests and their sustainable management contribute to achieving several of the SDGs. Time is running out for the world’s forests: we need to work across sectors, bring stakeholders together, and take urgent action.
The State of the World’s Forests 2018 identifies actions that can be taken to increase the contributions of forests and trees that are necessary to accelerate progress towards the SDGs. It is now critical that steps be taken to work more effectively with the private sector, and the informal forest sector must be transformed in order to bring broader economic, social and environmental benefits.
Seventy years ago, when FAO completed its first assessment of the world’s forest resources, the major concern was whether there would be enough timber to supply global demand; now we recognize the greater global relevance of our forests and trees. For the first time, The State of the World’s Forests 2018 provides an assessment of the contribution of forests and trees to our landscapes and livelihoods.
The purpose of this publication is to provide a much wider audience with an understanding of why forests and trees matter for people, the planet and posterity.
THE STATE OF THE WORLD’S
FORESTSFOREST PATHWAYS
TO SUSTAINABLE DEVELOPMENT
THE STATE OFTHE WORLD
I9535EN/1/07.18
ISBN 978-92-5-130561-4
9 7 8 9 2 5 1 3 0 5 6 1 4
ISSN 1020-5705